UNITED STATES
SECURITIES AND EXCHANGE COMMISSION
Washington, D.C. 20549
FORM N-CSR
CERTIFIED SHAREHOLDER REPORT OF REGISTERED
MANAGEMENT INVESTMENT COMPANIES
Investment Company Act file number 811-4008
Fidelity Investment Trust
(Exact name of registrant as specified in charter)
82 Devonshire St., Boston, Massachusetts 02109
(Address of principal executive offices) (Zip code)
Scott C. Goebel, Secretary
82 Devonshire St.
Boston, Massachusetts 02109
(Name and address of agent for service)
Registrant's telephone number, including area code: 617-563-7000
Date of fiscal year end: | October 31 |
| |
Date of reporting period: | October 31, 2012 |
This report on Form N-CSR relates solely to the Registrant's Fidelity Diversified International Fund, Fidelity Emerging Europe, Middle East, Africa (EMEA) Fund, Fidelity Emerging Markets Discovery Fund, Fidelity Global Commodity Stock Fund, Fidelity Global Equity Income Fund, Fidelity International Capital Appreciation Fund, Fidelity International Discovery Fund, Fidelity International Growth Fund, Fidelity International Small Cap Fund, Fidelity International Small Cap Opportunities Fund, Fidelity International Value Fund, Fidelity Overseas Fund, Fidelity Series Emerging Markets Fund, Fidelity Series International Growth Fund, Fidelity Series International Small Cap Fund, Fidelity Series International Value Fund, Fidelity Total Emerging Markets Fund, Fidelity Total International Equity Fund, and Fidelity Worldwide series (each, a "Fund" and collectively, the "Funds").
Item 1. Reports to Stockholders
Fidelity's
Broadly Diversified International Equity
Funds
Fidelity® Diversified International Fund
Fidelity International Capital Appreciation Fund
Fidelity Overseas Fund
Fidelity Worldwide Fund
Annual Report
October 31, 2012
(Fidelity Cover Art)
Contents
Annual Report
To view a fund's proxy voting guidelines and proxy voting record for the 12-month period ended June 30, visit http://www.fidelity.com/proxyvotingresults or visit the Securities and Exchange Commission's (SEC) web site at http://www.sec.gov. You may also call 1-800-544-8544 to request a free copy of the proxy voting guidelines.
Standard & Poor's, S&P and S&P 500 are registered service marks of The McGraw-Hill Companies, Inc. and have been licensed for use by Fidelity Distributors Corporation.
Other third party marks appearing herein are the property of their respective owners.
All other marks appearing herein are registered or unregistered trademarks or service marks of FMR LLC or an affiliated company. © 2012 FMR LLC. All rights reserved.
This report and the financial statements contained herein are submitted for the general information of the shareholders of the funds. This report is not authorized for distribution to prospective investors in the funds unless preceded or accompanied by an effective prospectus.
A fund files its complete schedule of portfolio holdings with the SEC for the first and third quarters of each fiscal year on Form N-Q. Forms N-Q are available on the SEC's web site at http://www.sec.gov. A fund's Forms N-Q may be reviewed and copied at the SEC's Public Reference Room in Washington, DC. Information regarding the operation of the SEC's Public Reference Room may be obtained by calling 1-800-SEC-0330. For a complete list of a fund's portfolio holdings, view the most recent holdings listing, semiannual report, or annual report on Fidelity's web site at http://www.fidelity.com, http://www.advisor.fidelity.com, or http://www.401k.com, as applicable.
NOT FDIC INSURED • MAY LOSE VALUE • NO BANK GUARANTEE
Neither the funds nor Fidelity Distributors Corporation is a bank.
Annual Report
Fidelity Diversified International Fund
As a shareholder of the Fund, you incur two types of costs: (1) transaction costs, including redemption fees and (2) ongoing costs, including management fees and other Fund expenses. This Example is intended to help you understand your ongoing costs (in dollars) of investing in the Fund and to compare these costs with the ongoing costs of investing in other mutual funds.
The Example is based on an investment of $1,000 invested at the beginning of the period and held for the entire period (May 1, 2012 to October 31, 2012).
Actual Expenses
The first line of the accompanying table for each class of the Fund provides information about actual account values and actual expenses. You may use the information in this line, together with the amount you invested, to estimate the expenses that you paid over the period. Simply divide your account value by $1,000.00 (for example, an $8,600 account value divided by $1,000.00 = 8.6), then multiply the result by the number in the first line for a class of the Fund under the heading entitled "Expenses Paid During Period" to estimate the expenses you paid on your account during this period. A small balance maintenance fee of $12.00 that is charged once a year may apply for certain accounts with a value of less than $2,000. This fee is not included in the table below. If it was, the estimate of expenses you paid during the period would be higher, and your ending account value lower, by this amount. In addition, the Fund, as a shareholder in the underlying Fidelity Central Funds, will indirectly bear its pro-rata share of the fees and expenses incurred by the underlying Fidelity Central Funds. These fees and expenses are not included in the Fund's annualized expense ratio used to calculate the expense estimate in the table below.
Hypothetical Example for Comparison Purposes
The second line of the accompanying table for each class of the Fund provides information about hypothetical account values and hypothetical expenses based on a Class' actual expense ratio and an assumed rate of return of 5% per year before expenses, which is not the Class' actual return. The hypothetical account values and expenses may not be used to estimate the actual ending account balance or expenses you paid for the period. You may use this information to compare the ongoing costs of investing in the Fund and other funds. To do so, compare this 5% hypothetical example with the 5% hypothetical examples that appear in the shareholder reports of the other funds. A small balance maintenance fee of $12.00 that is charged once a year may apply for certain accounts with a value of less than $2,000. This fee is not included in the table below. If it was, the estimate of expenses you paid during the period would be higher, and your ending account value lower, by this amount. In addition, the Fund, as a shareholder in the underlying Fidelity Central Funds, will indirectly bear its pro-rata share of the fees and expenses incurred by the underlying Fidelity Central Funds. These fees and expenses are not included in the Fund's annualized expense ratio used to calculate the expense estimate in the table below.
Please note that the expenses shown in the table are meant to highlight your ongoing costs only and do not reflect any transaction costs. Therefore, the second line of the table is useful in comparing ongoing costs only, and will not help you determine the relative total costs of owning different funds. In addition, if these transactional costs were included, your costs would have been higher.
| Annualized Expense Ratio | Beginning
Account Value
May 1, 2012 | Ending
Account Value
October 31, 2012 | Expenses Paid
During Period*
May 1, 2012 to October 31, 2012 |
Diversified International | 1.05% | | | |
Actual | | $ 1,000.00 | $ 1,022.90 | $ 5.34 |
HypotheticalA | | $ 1,000.00 | $ 1,019.86 | $ 5.33 |
Class K | .88% | | | |
Actual | | $ 1,000.00 | $ 1,024.00 | $ 4.48 |
HypotheticalA | | $ 1,000.00 | $ 1,020.71 | $ 4.47 |
A 5% return per year before expenses
* Expenses are equal to each Class' annualized expense ratio, multiplied by the average account value over the period, multiplied by 184/366 (to reflect the one-half year period).
Annual Report
Fidelity® Diversified International Fund
Performance: The Bottom Line
Average annual total return reflects the change in the value of an investment, assuming reinvestment of the class' distributions from dividend income and capital gains (the profits earned upon the sale of securities that have grown in value, if any) and assuming a constant rate of performance each year. The $10,000 table and the fund's returns do not reflect the deduction of taxes that a shareholder would pay on fund distributions or the redemption of fund shares. During periods of reimbursement by Fidelity, a fund's total return will be greater than it would be had the reimbursement not occurred. How a fund did yesterday is no guarantee of how it will do tomorrow.
Average Annual Total Returns
Periods ended October 31, 2012 | Past 1
year | Past 5
years | Past 10
years |
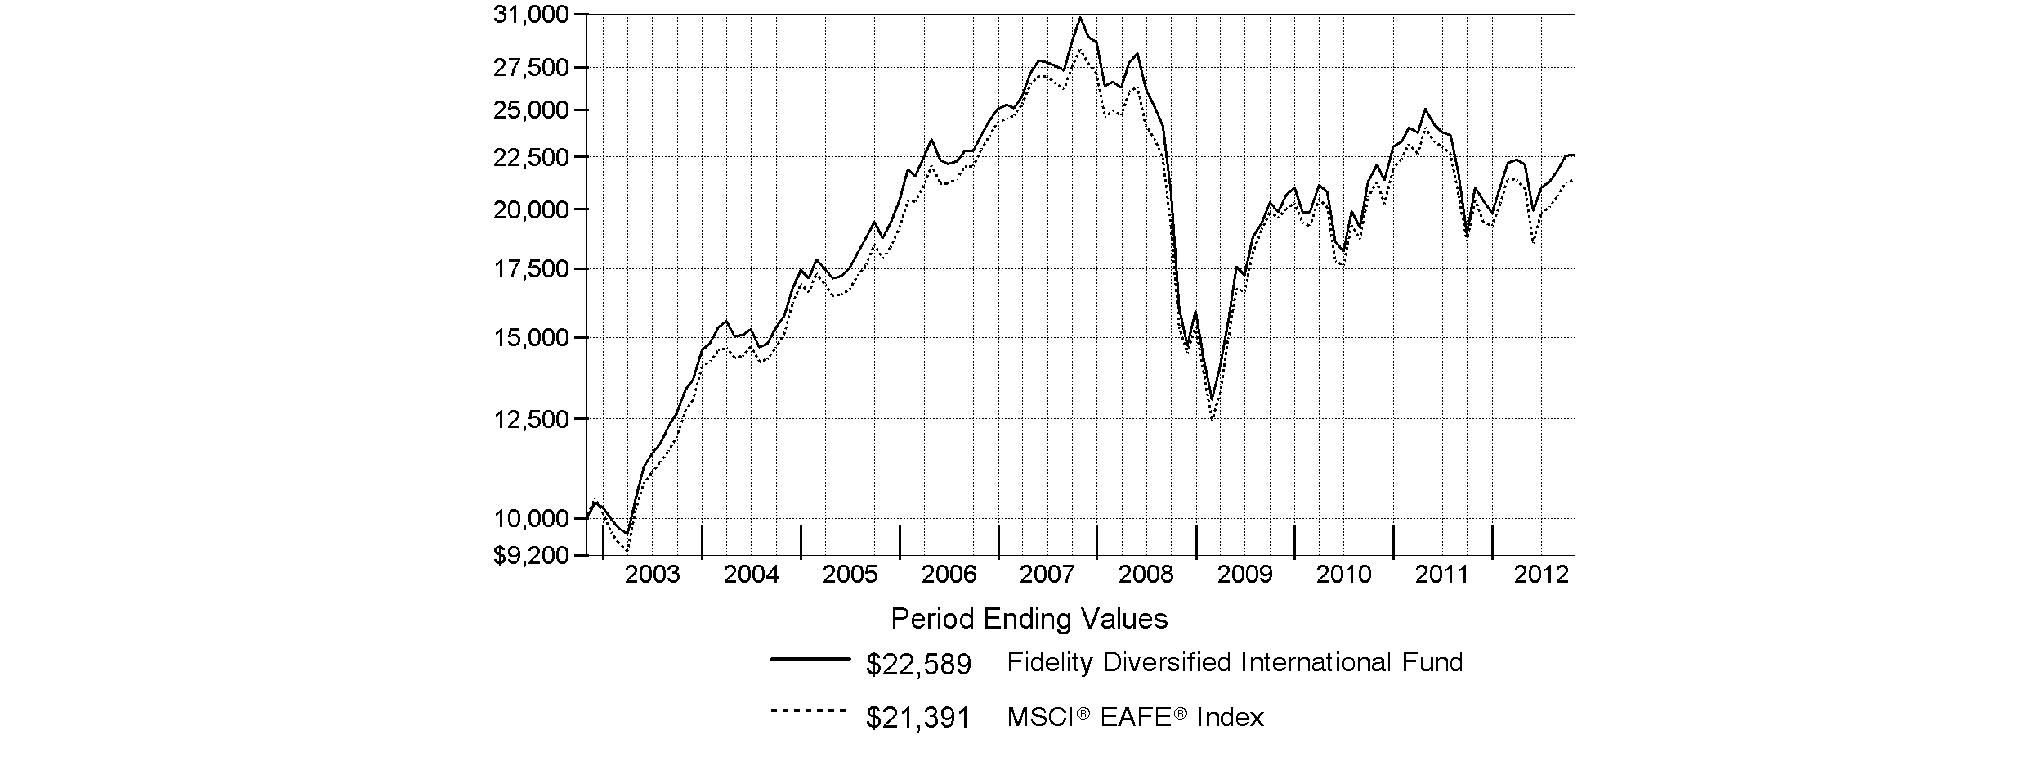
Fidelity Diversified International Fund | 7.72% | -5.99% | 8.49% |
$10,000 Over 10 Years
Let's say hypothetically that $10,000 was invested in Fidelity Diversified International Fund, a class of the fund, on October 31, 2002. The chart shows how the value of your investment would have changed, and also shows how the MSCI® EAFE ® Index performed over the same period.
Annual Report
Fidelity Diversified International Fund
Market Recap: Returns for most domestic and international equities fluctuated during the 12 months ending October 31, 2012, as investor sentiment towards risk vacillated amid a changing global economic landscape. U.S. stocks overcame bouts of volatility to post strong gains for the past year, extending an uptrend that began in March 2009. The broad-based S&P 500® Index advanced 15.21%, while the blue-chip-laden Dow Jones Industrial AverageSM and technology-heavy Nasdaq Composite® Index rose 12.56% and 12.21%, respectively. Performance outside of the U.S. was relatively weak, as the MSCI® ACWI® (All Country World Index) ex USA Index rose 4.11%, hampered in part by a stronger U.S. dollar. International developed-markets generally struggled during the period as macroeconomic concerns ebbed and flowed, finishing with only a modest gain. The MSCI® EAFE® Index rose 4.76% for the year, largely buttressed in the summertime by pledges of accommodative monetary action from eurozone officials, as well as signs that the U.S. housing market was on the mend. Within the index, Asia-Pacific ex Japan showed the most impressive gain, advancing roughly 10%. A number of core European components, including Germany (+11%) and Switzerland (+10%), and the U.K. (+9%), benefited from optimism about the eurozone's ability to resolve its debt woes, which helped the region outpace the index overall. Elsewhere, Japan was among the few benchmark constituents to finish in the red, returning about -3%. Emerging-markets stocks gained 2.98% for the year, as measured by the MSCI Emerging Markets Index. A general uptrend in the final five months of the period lifted the index into positive territory for the full 12 months.
Comments from William Bower, Portfolio Manager of Fidelity® Diversified International Fund: For the year, the fund's Retail Class shares returned 7.72%, solidly outperforming the 4.76% gain of the MSCI® EAFE® Index. Stock selection in information technology, consumer staples, health care and consumer discretionary helped relative performance. Geographically, the fund benefited from security selection in Europe - particularly Spain and France - and Japan. Top individual contributors included Danish pharmaceuticals firm Novo Nordisk, U.S. consumer electronics giant Apple, Belgian brewer Anheuser-Busch InBev, South Korean snack maker Orion, Spanish online retailer Inditex, South Korea's Samsung Electronics and not owning Spanish telecommunications company and index component Telefonica. Conversely, stock selection in energy and an underweighting in financials hurt. Among the main detractors were Canadian energy exploration and production companies Niko Resources and Petrominerales, Japanese Internet retailer Rakuten, Australian gold firm Newcrest Mining and Chinese search engine company Baidu, which is listed in the Cayman Islands. Some of the stocks mentioned in this review were not in the index, and Niko was not held at period end.
The views expressed above reflect those of the portfolio manager(s) only through the end of the period as stated on the cover of this report and do not necessarily represent the views of Fidelity or any other person in the Fidelity organization. Any such views are subject to change at any time based upon market or other conditions and Fidelity disclaims any responsibility to update such views. These views may not be relied on as investment advice and, because investment decisions for a Fidelity fund are based on numerous factors, may not be relied on as an indication of trading intent on behalf of any Fidelity fund.
Annual Report
Fidelity Diversified International Fund
Investment Changes (Unaudited)
Geographic Diversification (% of fund's net assets) |
As of October 31, 2012 |
 | United Kingdom | 16.5% | |
 | Japan | 14.0% | |
 | United States of America | 10.0% | |
 | Germany | 8.9% | |
 | France | 8.4% | |
 | Switzerland | 5.3% | |
 | Australia | 4.3% | |
 | Spain | 3.3% | |
 | Canada | 3.3% | |
 | Other | 26.0% | |

Percentages are based on country or territory of incorporation and are adjusted for the effect of futures contracts, if applicable. |
As of April 30, 2012 |
| United Kingdom | 17.7% | |
| Japan | 15.3% | |
| United States of America | 8.8% | |
| Germany | 8.6% | |
| France | 7.5% | |
| Switzerland | 4.7% | |
| Australia | 3.9% | |
| Canada | 3.6% | |
| Denmark | 3.2% | |
| Other | 26.7% | |

Percentages are based on country or territory of incorporation and are adjusted for the effect of futures contracts, if applicable. |
Asset Allocation |
| % of fund's
net assets | % of fund's net assets
6 months ago |
Stocks | 94.7 | 95.6 |
Short-Term Investments and Net Other Assets (Liabilities) | 5.3 | 4.4 |
Top Ten Stocks as of October 31, 2012 |
| % of fund's
net assets | % of fund's net assets
6 months ago |
Novo Nordisk A/S Series B (Denmark, Pharmaceuticals) | 2.6 | 2.7 |
Sanofi SA (France, Pharmaceuticals) | 2.6 | 2.0 |
Royal Dutch Shell PLC Class B sponsored ADR (United Kingdom, Oil, Gas & Consumable Fuels) | 2.3 | 2.6 |
Anheuser-Busch InBev SA NV (Belgium, Beverages) | 2.2 | 1.7 |
BHP Billiton Ltd. sponsored ADR (Australia, Metals & Mining) | 2.1 | 2.1 |
Vodafone Group PLC sponsored ADR (United Kingdom, Wireless Telecommunication Services) | 2.0 | 1.8 |
HSBC Holdings PLC sponsored ADR (United Kingdom, Commercial Banks) | 1.9 | 1.4 |
Nestle SA (Switzerland, Food Products) | 1.8 | 1.6 |
Inditex SA (Spain, Specialty Retail) | 1.7 | 1.2 |
ORIX Corp. (Japan, Diversified Financial Services) | 1.5 | 1.4 |
| 20.7 | |
Market Sectors as of October 31, 2012 |
| % of fund's
net assets | % of fund's net assets
6 months ago |
Consumer Discretionary | 15.2 | 16.0 |
Financials | 14.9 | 15.0 |
Consumer Staples | 13.8 | 12.1 |
Health Care | 12.5 | 10.8 |
Information Technology | 10.6 | 11.0 |
Materials | 8.2 | 8.7 |
Industrials | 7.5 | 7.8 |
Energy | 6.8 | 9.2 |
Telecommunication Services | 4.7 | 4.7 |
Utilities | 0.5 | 0.3 |
Annual Report
Fidelity Diversified International Fund
Investments October 31, 2012
Showing Percentage of Net Assets
Common Stocks - 93.3% |
| Shares | | Value |
Australia - 4.3% |
Australia & New Zealand Banking Group Ltd. | 6,023,852 | | $ 159,140,367 |
BHP Billiton Ltd. sponsored ADR (d) | 6,546,864 | | 463,125,159 |
CSL Ltd. | 1,727,496 | | 85,178,293 |
Iluka Resources Ltd. | 2,498,732 | | 25,730,583 |
Newcrest Mining Ltd. | 3,231,215 | | 88,650,521 |
Origin Energy Ltd. | 3,253,432 | | 38,365,277 |
Spark Infrastructure Group unit | 15,030,146 | | 26,367,453 |
Telstra Corp. Ltd. | 13,908,276 | | 59,771,192 |
TOTAL AUSTRALIA | | 946,328,845 |
Bailiwick of Guernsey - 0.6% |
Resolution Ltd. | 40,590,837 | | 142,994,060 |
Bailiwick of Jersey - 1.4% |
Experian PLC | 9,017,072 | | 155,698,910 |
Randgold Resources Ltd. sponsored ADR | 484,800 | | 57,977,232 |
Shire PLC | 1,558,700 | | 43,829,970 |
WPP PLC | 3,752,709 | | 48,504,824 |
TOTAL BAILIWICK OF JERSEY | | 306,010,936 |
Belgium - 2.3% |
Anheuser-Busch InBev SA NV | 5,709,430 | | 477,486,248 |
Anheuser-Busch InBev SA NV (strip VVPR) | 5,250,900 | | 6,806 |
UCB SA | 410,500 | | 23,943,131 |
TOTAL BELGIUM | | 501,436,185 |
Bermuda - 0.2% |
Assured Guaranty Ltd. | 2,994,300 | | 41,590,827 |
Brazil - 1.1% |
Anhanguera Educacional Participacoes SA | 2,501,300 | | 43,842,485 |
BR Malls Participacoes SA | 724,200 | | 9,520,268 |
Estacio Participacoes SA | 2,338,265 | | 44,553,731 |
Kroton Educacional SA unit (a) | 1,279,200 | | 25,570,774 |
Qualicorp SA (a) | 4,596,000 | | 47,158,189 |
Souza Cruz SA | 3,313,300 | | 43,230,078 |
Tractebel Energia SA | 1,894,800 | | 32,652,076 |
TOTAL BRAZIL | | 246,527,601 |
British Virgin Islands - 0.2% |
Camelot Information Systems, Inc. ADR (a) | 1,810,103 | | 2,371,235 |
Mail.ru Group Ltd. GDR (Reg. S) | 1,047,500 | | 34,934,125 |
TOTAL BRITISH VIRGIN ISLANDS | | 37,305,360 |
Canada - 3.3% |
Alimentation Couche-Tard, Inc. Class B (sub. vtg.) | 769,500 | | 37,798,919 |
ARC Resources Ltd. (d) | 867,500 | | 21,063,204 |
Canadian Natural Resources Ltd. | 2,709,500 | | 81,658,022 |
Catamaran Corp. (a) | 500,600 | | 23,507,524 |
CGI Group, Inc. Class A (sub. vtg.) (a) | 1,238,000 | | 32,389,427 |
Fairfax Financial Holdings Ltd. (sub. vtg.) | 161,600 | | 59,949,353 |
|
| Shares | | Value |
Franco-Nevada Corp. | 853,100 | | $ 49,123,185 |
Goldcorp, Inc. | 1,829,000 | | 82,682,703 |
Painted Pony Petroleum Ltd. (a)(e)(f) | 2,485,600 | | 26,878,078 |
Painted Pony Petroleum Ltd.
Class A (a)(e) | 3,983,070 | | 43,070,995 |
Penn West Petroleum Ltd. | 1,779,000 | | 23,102,508 |
Petrobank Energy & Resources Ltd. (a) | 2,895,100 | | 39,770,485 |
Petrominerales Ltd. | 1,377,875 | | 11,050,592 |
Suncor Energy, Inc. | 3,662,400 | | 122,917,295 |
Tourmaline Oil Corp. (a) | 1,416,200 | | 46,793,091 |
TransForce, Inc. | 265,900 | | 4,853,424 |
Turquoise Hill Resources Ltd. (a) | 2,681,541 | | 20,969,047 |
TOTAL CANADA | | 727,577,852 |
Cayman Islands - 1.5% |
Baidu.com, Inc. sponsored ADR (a) | 1,158,900 | | 123,561,918 |
Haitian International Holdings Ltd. | 6,743,000 | | 8,326,464 |
Hengan International Group Co. Ltd. | 9,291,500 | | 84,642,022 |
HiSoft Technology International Ltd. ADR (a)(e) | 1,697,800 | | 17,640,142 |
Sands China Ltd. | 23,448,800 | | 88,197,176 |
TOTAL CAYMAN ISLANDS | | 322,367,722 |
Curacao - 0.4% |
Schlumberger Ltd. | 1,136,200 | | 78,999,986 |
Denmark - 3.0% |
Novo Nordisk A/S Series B | 3,675,339 | | 589,213,858 |
William Demant Holding A/S (a) | 957,003 | | 82,308,893 |
TOTAL DENMARK | | 671,522,751 |
France - 8.4% |
Alstom SA | 575,549 | | 19,657,043 |
Arkema SA | 862,900 | | 78,671,621 |
AXA SA | 4,419,200 | | 70,253,259 |
BNP Paribas SA | 5,146,376 | | 258,881,145 |
Bureau Veritas SA | 853,700 | | 90,657,451 |
Dassault Aviation SA (d) | 35,665 | | 32,151,011 |
Edenred SA | 1,660,790 | | 48,057,531 |
Essilor International SA | 1,576,620 | | 142,127,930 |
JCDecaux SA | 1,418,600 | | 30,026,271 |
LVMH Moet Hennessy - Louis Vuitton SA | 669,860 | | 108,877,176 |
PPR SA | 1,015,600 | | 178,565,583 |
Publicis Groupe SA | 1,516,800 | | 81,716,804 |
Sanofi SA | 6,424,876 | | 564,280,639 |
Schneider Electric SA | 784,600 | | 49,053,032 |
Vivendi SA | 5,276,023 | | 107,945,995 |
TOTAL FRANCE | | 1,860,922,491 |
Germany - 7.5% |
adidas AG | 1,561,780 | | 133,057,315 |
Allianz AG | 1,025,209 | | 127,115,366 |
BASF AG | 3,028,956 | | 250,987,987 |
Bayer AG | 3,101,862 | | 270,135,947 |
Brenntag AG | 181,900 | | 22,926,244 |
Common Stocks - continued |
| Shares | | Value |
Germany - continued |
CompuGROUP Holding AG | 1,457,200 | | $ 26,442,497 |
Deutsche Post AG | 2,678,237 | | 53,095,016 |
ElringKlinger AG | 1,020,828 | | 28,341,792 |
Fresenius Medical Care AG & Co. KGaA | 893,700 | | 62,795,180 |
Fresenius SE & Co. KGaA | 1,254,800 | | 143,123,994 |
GFK AG | 1,496,500 | | 68,141,256 |
Linde AG | 1,151,929 | | 193,726,193 |
SAP AG | 3,980,256 | | 290,252,414 |
TOTAL GERMANY | | 1,670,141,201 |
Hong Kong - 1.3% |
AIA Group Ltd. | 35,967,000 | | 142,474,810 |
Galaxy Entertainment Group Ltd. (a) | 24,081,000 | | 82,807,034 |
Henderson Land Development Co. Ltd. | 8,337,400 | | 57,769,741 |
TOTAL HONG KONG | | 283,051,585 |
India - 1.9% |
Apollo Hospitals Enterprise Ltd. | 150,707 | | 2,184,628 |
Bajaj Auto Ltd. | 1,103,493 | | 37,253,784 |
HDFC Bank Ltd. | 12,995,695 | | 152,595,202 |
Housing Development Finance Corp. Ltd. | 7,489,994 | | 106,123,907 |
ITC Ltd. | 11,354,613 | | 59,627,281 |
Mahindra & Mahindra Financial Services Ltd. | 2,167,276 | | 34,908,832 |
Shriram Transport Finance Co. Ltd. | 1,982,796 | | 23,037,727 |
TOTAL INDIA | | 415,731,361 |
Ireland - 0.6% |
Accenture PLC Class A | 1,065,300 | | 71,811,873 |
CRH PLC | 29,251 | | 544,470 |
Elan Corp. PLC sponsored ADR (a) | 2,930,000 | | 31,644,000 |
Ryanair Holdings PLC sponsored ADR | 687,400 | | 22,168,650 |
TOTAL IRELAND | | 126,168,993 |
Isle of Man - 0.0% |
3Legs Resources PLC (a)(e) | 6,268,300 | | 4,046,188 |
Italy - 1.6% |
ENI SpA | 4,415,600 | | 101,607,051 |
Fiat Industrial SpA | 6,028,692 | | 65,286,715 |
Prada SpA | 7,151,000 | | 58,314,876 |
Prysmian SpA | 343,100 | | 6,599,483 |
Saipem SpA | 2,745,899 | | 123,358,302 |
TOTAL ITALY | | 355,166,427 |
Japan - 14.0% |
ABC-Mart, Inc. | 1,076,900 | | 47,214,706 |
Aozora Bank Ltd. | 10,536,000 | | 29,695,603 |
Calbee, Inc. (d) | 1,087,800 | | 99,881,924 |
Credit Saison Co. Ltd. | 3,753,200 | | 82,417,131 |
Denso Corp. | 1,061,700 | | 33,235,479 |
Don Quijote Co. Ltd. | 3,234,900 | | 127,442,822 |
Fanuc Corp. | 701,400 | | 111,672,228 |
|
| Shares | | Value |
Fast Retailing Co. Ltd. | 294,300 | | $ 65,547,463 |
Hitachi Ltd. | 41,642,000 | | 220,650,957 |
Honda Motor Co. Ltd. | 6,828,800 | | 205,295,907 |
Hoya Corp. | 2,862,600 | | 57,947,658 |
Itochu Corp. | 6,655,500 | | 66,613,359 |
Japan Tobacco, Inc. | 10,242,400 | | 283,035,629 |
JS Group Corp. | 2,436,300 | | 53,865,332 |
JSR Corp. | 5,086,800 | | 87,169,515 |
Keyence Corp. | 714,210 | | 189,489,762 |
Mitsubishi UFJ Financial Group, Inc. | 16,874,900 | | 76,341,508 |
Nintendo Co. Ltd. | 200,200 | | 25,780,483 |
Nitto Denko Corp. | 950,300 | | 43,092,647 |
ORIX Corp. | 3,347,600 | | 343,859,700 |
Rakuten, Inc. | 26,046,300 | | 234,263,351 |
Seven & i Holdings Co., Ltd. | 5,480,100 | | 169,009,221 |
Seven Bank Ltd. | 12,099,900 | | 34,558,151 |
SHIMANO, Inc. | 1,070,100 | | 67,425,817 |
SMC Corp. | 714,100 | | 112,531,354 |
Softbank Corp. | 5,406,000 | | 171,125,666 |
Unicharm Corp. | 798,300 | | 43,200,000 |
Yahoo! Japan Corp. | 65,755 | | 22,626,705 |
TOTAL JAPAN | | 3,104,990,078 |
Korea (South) - 2.9% |
AMOREPACIFIC Corp. | 47,406 | | 53,913,937 |
Hyundai Motor Co. | 380,453 | | 78,336,364 |
LG Household & Health Care Ltd. | 59,599 | | 35,038,302 |
NHN Corp. | 472,201 | | 109,353,915 |
Orion Corp. | 136,504 | | 128,200,992 |
Samsung Electronics Co. Ltd. | 200,615 | | 241,035,356 |
TOTAL KOREA (SOUTH) | | 645,878,866 |
Mexico - 0.6% |
America Movil SAB de CV Series L sponsored ADR | 2,983,200 | | 75,445,128 |
Fomento Economico Mexicano SAB de CV sponsored ADR | 168,085 | | 15,230,182 |
Mexichem SAB de CV | 9,739,300 | | 48,265,097 |
TOTAL MEXICO | | 138,940,407 |
Netherlands - 2.7% |
AEGON NV | 25,624,900 | | 143,311,255 |
ASML Holding NV (Netherlands) | 1,802,100 | | 99,065,525 |
D.E. Master Blenders 1753 NV (a) | 7,368,227 | | 90,050,038 |
Gemalto NV | 600,000 | | 54,142,778 |
Heineken NV (Bearer) | 901,800 | | 55,597,210 |
NXP Semiconductors NV (a) | 2,449,083 | | 59,414,754 |
Randstad Holding NV | 364,500 | | 11,898,570 |
Unilever NV (Certificaten Van Aandelen) (Bearer) | 2,550,400 | | 93,739,027 |
TOTAL NETHERLANDS | | 607,219,157 |
Common Stocks - continued |
| Shares | | Value |
Norway - 1.0% |
DnB NOR ASA | 3,663,309 | | $ 45,748,794 |
Telenor ASA | 9,296,600 | | 182,791,444 |
TOTAL NORWAY | | 228,540,238 |
Russia - 0.1% |
Sberbank (Savings Bank of the Russian Federation) | 9,564,100 | | 27,998,140 |
Singapore - 0.2% |
Avago Technologies Ltd. | 613,700 | | 20,270,511 |
United Overseas Bank Ltd. | 2,086,000 | | 31,243,827 |
TOTAL SINGAPORE | | 51,514,338 |
South Africa - 0.7% |
Foschini Ltd. | 78,971 | | 1,146,588 |
Life Healthcare Group Holdings Ltd. | 6,906,900 | | 26,119,985 |
Nampak Ltd. | 6,576,500 | | 21,920,023 |
Naspers Ltd. Class N | 982,699 | | 63,798,111 |
Shoprite Holdings Ltd. | 605,000 | | 12,440,993 |
Tiger Brands Ltd. | 899,000 | | 28,575,066 |
TOTAL SOUTH AFRICA | | 154,000,766 |
Spain - 3.3% |
Amadeus IT Holding SA Class A | 2,634,200 | | 65,213,480 |
Banco Bilbao Vizcaya Argentaria SA | 7,668,545 | | 64,078,018 |
Grifols SA ADR | 2,728,831 | | 68,657,388 |
Inditex SA | 2,996,351 | | 382,313,432 |
Prosegur Compania de Seguridad SA (Reg.) | 17,924,093 | | 97,575,715 |
Repsol YPF SA | 2,810,006 | | 56,162,559 |
TOTAL SPAIN | | 734,000,592 |
Sweden - 1.2% |
ASSA ABLOY AB (B Shares) | 687,400 | | 22,913,679 |
Atlas Copco AB (A Shares) | 945,100 | | 23,239,580 |
H&M Hennes & Mauritz AB (B Shares) | 669,105 | | 22,646,817 |
Svenska Handelsbanken AB (A Shares) | 2,160,300 | | 73,997,823 |
Swedbank AB (A Shares) | 4,213,700 | | 78,138,537 |
Swedish Match Co. AB | 1,552,600 | | 52,901,084 |
TOTAL SWEDEN | | 273,837,520 |
Switzerland - 5.3% |
Kuehne & Nagel International AG | 378,820 | | 44,215,327 |
Nestle SA | 6,315,075 | | 400,752,639 |
Roche Holding AG (participation certificate) | 421,264 | | 81,014,047 |
Schindler Holding AG (Reg.) | 766,553 | | 99,183,546 |
SGS SA (Reg.) | 21,720 | | 45,991,453 |
Syngenta AG (Switzerland) | 570,230 | | 222,326,709 |
UBS AG | 12,221,701 | | 183,369,444 |
Zurich Financial Services AG | 403,865 | | 99,524,340 |
TOTAL SWITZERLAND | | 1,176,377,505 |
|
| Shares | | Value |
Taiwan - 0.5% |
HIWIN Technologies Corp. | 120,400 | | $ 774,913 |
Taiwan Semiconductor Manufacturing Co. Ltd. sponsored ADR | 6,221,700 | | 98,925,030 |
TOTAL TAIWAN | | 99,699,943 |
United Kingdom - 16.5% |
Aggreko PLC | 652,600 | | 22,642,365 |
Babcock International Group PLC | 1,375,600 | | 21,710,373 |
Barclays PLC | 41,612,242 | | 153,871,043 |
Barratt Developments PLC (a) | 4,833,700 | | 14,789,527 |
BG Group PLC | 4,475,579 | | 82,877,793 |
British American Tobacco PLC sponsored ADR | 1,809,400 | | 179,781,984 |
Capita Group PLC | 4,091,300 | | 47,734,885 |
Compass Group PLC | 2,313,400 | | 25,386,095 |
Diageo PLC | 1,817,649 | | 51,963,917 |
Domino's Pizza UK & IRL PLC | 3,501,400 | | 28,562,692 |
Filtrona PLC | 3,799,388 | | 35,132,134 |
GlaxoSmithKline PLC | 12,955,500 | | 290,299,915 |
Hikma Pharmaceuticals PLC | 2,465,284 | | 29,419,914 |
HSBC Holdings PLC sponsored ADR | 8,373,200 | | 413,301,152 |
IMI PLC | 770,400 | | 11,866,659 |
Imperial Tobacco Group PLC | 3,167,193 | | 119,598,750 |
Inchcape PLC | 8,759,127 | | 56,822,866 |
InterContinental Hotel Group PLC | 2,038,600 | | 50,438,619 |
Kingfisher PLC | 4,968,500 | | 23,211,869 |
London Stock Exchange Group PLC | 1,389,500 | | 21,873,691 |
Meggitt PLC | 8,046,700 | | 50,123,498 |
National Grid PLC | 3,094,757 | | 35,294,341 |
Next PLC | 3,481,200 | | 200,330,267 |
Persimmon PLC | 1,032,600 | | 13,247,548 |
PZ Cussons PLC Class L (d) | 2,710,800 | | 14,807,864 |
Reckitt Benckiser Group PLC | 4,305,687 | | 260,561,340 |
Rolls-Royce Group PLC | 14,222,900 | | 196,126,591 |
Rolls-Royce Group PLC Class C | 1,080,940,400 | | 1,744,368 |
Royal Dutch Shell PLC Class B sponsored ADR (d) | 7,285,137 | | 514,549,226 |
Serco Group PLC | 4,949,706 | | 45,249,686 |
Standard Chartered PLC (United Kingdom) | 2,001,219 | | 47,263,252 |
Taylor Wimpey PLC | 51,652,000 | | 50,928,937 |
Tesco PLC | 5,203,800 | | 26,859,827 |
Travis Perkins PLC | 1,369,800 | | 23,873,559 |
Vodafone Group PLC sponsored ADR | 16,222,400 | | 441,573,728 |
Whitbread PLC | 1,318,845 | | 50,014,724 |
TOTAL UNITED KINGDOM | | 3,653,834,999 |
United States of America - 4.7% |
Allergan, Inc. | 486,500 | | 43,746,080 |
Apple, Inc. | 207,800 | | 123,661,780 |
Beam, Inc. | 601,200 | | 33,402,672 |
Common Stocks - continued |
| Shares | | Value |
United States of America - continued |
Cognizant Technology Solutions Corp. Class A (a) | 560,400 | | $ 37,350,660 |
Cummins, Inc. | 369,900 | | 34,615,242 |
D.R. Horton, Inc. | 535,300 | | 11,219,888 |
Facebook, Inc. Class B (a)(g) | 1,288,142 | | 24,479,207 |
Freeport-McMoRan Copper & Gold, Inc. | 551,500 | | 21,442,320 |
Gilead Sciences, Inc. (a) | 933,600 | | 62,700,576 |
Las Vegas Sands Corp. | 966,900 | | 44,902,836 |
MasterCard, Inc. Class A | 225,360 | | 103,875,185 |
McGraw-Hill Companies, Inc. | 1,285,000 | | 71,034,800 |
Noble Energy, Inc. | 769,828 | | 73,141,358 |
Polycom, Inc. (a) | 2,852,000 | | 28,577,040 |
PriceSmart, Inc. | 298,900 | | 24,805,711 |
Virgin Media, Inc. (d) | 1,142,600 | | 37,408,724 |
ViroPharma, Inc. (a) | 1,170,500 | | 29,555,125 |
Visa, Inc. Class A | 886,800 | | 123,052,368 |
VMware, Inc. Class A (a) | 275,000 | | 23,311,750 |
Workday, Inc. | 239,850 | | 11,632,725 |
Yum! Brands, Inc. | 1,174,800 | | 82,365,228 |
TOTAL UNITED STATES OF AMERICA | | 1,046,281,275 |
TOTAL COMMON STOCKS (Cost $17,413,567,380) |
20,681,004,195
|
Nonconvertible Preferred Stocks - 1.4% |
| | | |
Germany - 1.4% |
Henkel AG & Co. KGaA | 757,300 | | 60,474,799 |
ProSiebenSat.1 Media AG | 2,050,900 | | 57,152,892 |
Volkswagen AG | 919,826 | | 190,280,303 |
TOTAL NONCONVERTIBLE PREFERRED STOCKS (Cost $185,494,906) |
307,907,994
|
Master Notes - 0.0% |
| Principal Amount | | |
Canada - 0.0% |
OZ Optics Ltd. 5% 11/5/14 (g)
(Cost $183,060) | | $ 180,662 | |
180,662
|
Money Market Funds - 6.7% |
| Shares | | Value |
Fidelity Cash Central Fund, 0.19% (b) | 1,164,258,182 | | $ 1,164,258,182 |
Fidelity Securities Lending Cash Central Fund, 0.19% (b)(c) | 315,781,287 | | 315,781,287 |
TOTAL MONEY MARKET FUNDS (Cost $1,480,039,469) |
1,480,039,469
|
TOTAL INVESTMENT
PORTFOLIO - 101.4% (Cost $19,079,284,815) | 22,469,132,320 |
NET OTHER ASSETS (LIABILITIES) - (1.4)% | (314,058,785) |
NET ASSETS - 100% | $ 22,155,073,535 |
Legend |
(a) Non-income producing |
(b) Affiliated fund that is available only to investment companies and other accounts managed by Fidelity Investments. The rate quoted is the annualized seven-day yield of the fund at period end. A complete unaudited listing of the fund's holdings as of its most recent quarter end is available upon request. In addition, each Fidelity Central Fund's financial statements, which are not covered by the Fund's Report of Independent Registered Public Accounting Firm, are available on the SEC's website or upon request. |
(c) Investment made with cash collateral received from securities on loan. |
(d) Security or a portion of the security is on loan at period end. |
(e) Affiliated company |
(f) Security exempt from registration under Rule 144A of the Securities Act of 1933. These securities may be resold in transactions exempt from registration, normally to qualified institutional buyers. At the end of the period, the value of these securities amounted to $26,878,078 or 0.1% of net assets. |
(g) Restricted securities - Investment in securities not registered under the Securities Act of 1933 (excluding 144A issues). At the end of the period, the value of restricted securities (excluding 144A issues) amounted to $24,659,869 or 0.1% of net assets. |
Additional information on each restricted holding is as follows: |
Security | Acquisition Date | Acquisition Cost |
Facebook, Inc. Class B | 3/31/11 | $ 32,203,550 |
OZ Optics Ltd. 5% 11/5/14 | 11/5/10 | $ 185,227 |
Affiliated Central Funds |
Information regarding fiscal year to date income earned by the Fund from investments in Fidelity Central Funds is as follows: |
Fund | Income earned |
Fidelity Cash Central Fund | $ 1,367,879 |
Fidelity Securities Lending Cash Central Fund | 15,556,493 |
Total | $ 16,924,372 |
Other Affiliated Issuers |
An affiliated company is a company in which the Fund has ownership of at least 5% of the voting securities. Fiscal year to date transactions with companies which are or were affiliates are as follows: |
Affiliate | Value,
beginning of
period | Purchases | Sales
Proceeds | Dividend
Income | Value,
end of
period |
3Legs Resources PLC | $ 13,837,749 | $ - | $ 109,582 | $ - | $ 4,046,188 |
HiSoft Technology International Ltd. ADR | 21,372,832 | - | 439,582 | - | 17,640,142 |
Painted Pony Petroleum Ltd. | 30,395,209 | - | - | - | 26,878,078 |
Painted Pony Petroleum Ltd. Class A | 44,553,022 | 3,256,743 | 498,801 | - | 43,070,995 |
Schweitzer-Mauduit International, Inc. | 113,092,492 | - | 110,115,959 | 598,416 | - |
Total | $ 223,251,304 | $ 3,256,743 | $ 111,163,924 | $ 598,416 | $ 91,635,403 |
Other Information |
Categorizations in the Schedule of Investments are based on country or territory of incorporation. |
The following is a summary of the inputs used, as of October 31, 2012, involving the Fund's assets and liabilities carried at fair value. The inputs or methodology used for valuing securities may not be an indication of the risk associated with investing in those securities. For more information on valuation inputs, and their aggregation into the levels used in the tables below, please refer to the Security Valuation section in the accompanying Notes to Financial Statements. |
Valuation Inputs at Reporting Date: |
Description | Total | Level 1 | Level 2 | Level 3 |
Investments in Securities: | | | | |
Equities: | | | | |
Consumer Discretionary | $ 3,394,535,553 | $ 3,090,296,203 | $ 304,239,350 | $ - |
Consumer Staples | 3,036,614,462 | 2,413,425,270 | 623,189,192 | - |
Energy | 1,489,412,010 | 1,387,804,959 | 101,607,051 | - |
Financials | 3,336,946,273 | 2,563,379,803 | 773,566,470 | - |
Health Care | 2,769,387,703 | 1,218,968,141 | 1,550,419,562 | - |
Industrials | 1,724,693,256 | 1,724,693,256 | - | - |
Information Technology | 2,312,818,763 | 1,899,021,617 | 413,797,146 | - |
Materials | 1,791,537,146 | 1,568,665,967 | 222,871,179 | - |
Telecommunication Services | 1,038,653,153 | 1,038,653,153 | - | - |
Utilities | 94,313,870 | 59,019,529 | 35,294,341 | - |
Master Notes | 180,662 | - | - | 180,662 |
Money Market Funds | 1,480,039,469 | 1,480,039,469 | - | - |
Total Investments in Securities: | $ 22,469,132,320 | $ 18,443,967,367 | $ 4,024,984,291 | $ 180,662 |
The following is a summary of transfers between Level 1 and Level 2 for the period ended October 31, 2012. Transfers are assumed to have occurred at the beginning of the period, and are primarily attributable to the valuation techniques used for foreign equity securities, as discussed in the accompanying Notes to Financial Statements. |
Transfers | Total |
Level 1 to Level 2 | $ 0 |
Level 2 to Level 1 | $ 3,771,433,057 |
See accompanying notes which are an integral part of the financial statements.
Annual Report
Fidelity Diversified International Fund
Statement of Assets and Liabilities
| October 31, 2012 |
| | |
Assets | | |
Investment in securities, at value (including securities loaned of $309,743,462) - See accompanying schedule: Unaffiliated issuers (cost $17,486,695,145) | $ 20,897,457,448 | |
Fidelity Central Funds (cost $1,480,039,469) | 1,480,039,469 | |
Other affiliated issuers (cost $112,550,201) | 91,635,403 | |
Total Investments (cost $19,079,284,815) | | $ 22,469,132,320 |
Foreign currency held at value (cost $2,562) | | 2,562 |
Receivable for investments sold
Regular delivery | | 18,145,561 |
Delayed delivery | | 3,659,139 |
Receivable for fund shares sold | | 20,336,178 |
Dividends receivable | | 57,001,656 |
Interest receivable | | 26,988 |
Distributions receivable from Fidelity Central Funds | | 349,490 |
Other receivables | | 2,236,967 |
Total assets | | 22,570,890,861 |
| | |
Liabilities | | |
Payable for investments purchased | $ 40,876,867 | |
Payable for fund shares redeemed | 38,788,247 | |
Accrued management fee | 15,853,686 | |
Other affiliated payables | 2,878,721 | |
Other payables and accrued expenses | 1,638,518 | |
Collateral on securities loaned, at value | 315,781,287 | |
Total liabilities | | 415,817,326 |
| | |
Net Assets | | $ 22,155,073,535 |
Net Assets consist of: | | |
Paid in capital | | $ 21,443,322,870 |
Undistributed net investment income | | 320,513,134 |
Accumulated undistributed net realized gain (loss) on investments and foreign currency transactions | | (2,999,563,657) |
Net unrealized appreciation (depreciation) on investments and assets and liabilities in foreign currencies | | 3,390,801,188 |
Net Assets | | $ 22,155,073,535 |
| | |
Diversified International:
Net Asset Value, offering price and redemption price per share ($13,269,769,305 ÷ 456,467,556 shares) | | $ 29.07 |
| | |
Class K:
Net Asset Value, offering price and redemption price per share ($8,885,304,230 ÷ 305,725,561 shares) | | $ 29.06 |
Statement of Operations
| Year ended October 31, 2012 |
| | |
Investment Income | | |
Dividends (including $598,416 earned from other affiliated issuers) | | $ 598,692,833 |
Interest | | 10,226 |
Income from Fidelity Central Funds | | 16,924,372 |
Income before foreign taxes withheld | | 615,627,431 |
Less foreign taxes withheld | | (41,147,575) |
Total income | | 574,479,856 |
| | |
Expenses | | |
Management fee
Basic fee | $ 161,089,886 | |
Performance adjustment | 12,019,269 | |
Transfer agent fees | 35,456,624 | |
Accounting and security lending fees | 2,401,416 | |
Custodian fees and expenses | 2,567,810 | |
Independent trustees' compensation | 152,451 | |
Appreciation in deferred trustee compensation account | 38 | |
Registration fees | 224,871 | |
Audit | 197,504 | |
Legal | 142,881 | |
Miscellaneous | 274,157 | |
Total expenses before reductions | 214,526,907 | |
Expense reductions | (2,425,924) | 212,100,983 |
Net investment income (loss) | | 362,378,873 |
Realized and Unrealized Gain (Loss) Net realized gain (loss) on: | | |
Investment securities: | | |
Unaffiliated issuers | 499,550,522 | |
Other affiliated issuers | 25,672,181 | |
Foreign currency transactions | (2,542,356) | |
Total net realized gain (loss) | | 522,680,347 |
Change in net unrealized appreciation (depreciation) on: Investment securities (net of increase in deferred foreign taxes of $8,309) | 779,239,745 | |
Assets and liabilities in foreign currencies | (1,792,174) | |
Total change in net unrealized appreciation (depreciation) | | 777,447,571 |
Net gain (loss) | | 1,300,127,918 |
Net increase (decrease) in net assets resulting from operations | | $ 1,662,506,791 |
See accompanying notes which are an integral part of the financial statements.
Annual Report
Fidelity Diversified International Fund
Financial Statements - continued
Statement of Changes in Net Assets
| Year ended
October 31,
2012 | Year ended
October 31,
2011 |
Increase (Decrease) in Net Assets | | |
Operations | | |
Net investment income (loss) | $ 362,378,873 | $ 581,959,099 |
Net realized gain (loss) | 522,680,347 | 1,881,502,446 |
Change in net unrealized appreciation (depreciation) | 777,447,571 | (3,646,283,921) |
Net increase (decrease) in net assets resulting from operations | 1,662,506,791 | (1,182,822,376) |
Distributions to shareholders from net investment income | (460,432,289) | (554,171,382) |
Distributions to shareholders from net realized gain | - | (93,780,346) |
Total distributions | (460,432,289) | (647,951,728) |
Share transactions - net increase (decrease) | (4,619,314,396) | (7,417,526,738) |
Redemption fees | 414,440 | 964,713 |
Total increase (decrease) in net assets | (3,416,825,454) | (9,247,336,129) |
| | |
Net Assets | | |
Beginning of period | 25,571,898,989 | 34,819,235,118 |
End of period (including undistributed net investment income of $320,513,134 and undistributed net investment income of $418,909,977, respectively) | $ 22,155,073,535 | $ 25,571,898,989 |
Financial Highlights - Diversified International
Years ended October 31, | 2012 | 2011 | 2010 | 2009 | 2008 |
Selected Per-Share Data | | | | | |
Net asset value, beginning of period | $ 27.49 | $ 29.49 | $ 26.86 | $ 21.96 | $ 45.41 |
Income from Investment Operations | | | | | |
Net investment income (loss) B | .42 | .53 E | .37 | .35 | .55 |
Net realized and unrealized gain (loss) | 1.65 | (1.99) | 2.61 | 4.86 | (20.96) |
Total from investment operations | 2.07 | (1.46) | 2.98 | 5.21 | (20.41) |
Distributions from net investment income | (.49) | (.46) | (.35) | (.31) | (.47) |
Distributions from net realized gain | - | (.08) | - | - | (2.57) |
Total distributions | (.49) | (.54) | (.35) | (.31) | (3.04) |
Redemption fees added to paid in capital B,G | - | - | - | - | - |
Net asset value, end of period | $ 29.07 | $ 27.49 | $ 29.49 | $ 26.86 | $ 21.96 |
Total Return A | 7.72% | (5.07)% | 11.15% | 24.32% | (48.04)% |
Ratios to Average Net Assets C,F | | | | | |
Expenses before reductions | 1.01% | .90% | .98% | 1.01% | 1.04% |
Expenses net of fee waivers, if any | 1.01% | .89% | .98% | 1.01% | 1.04% |
Expenses net of all reductions | .99% | .87% | .96% | .99% | 1.02% |
Net investment income (loss) | 1.53% | 1.78% E | 1.34% | 1.58% | 1.53% |
Supplemental Data | | | | | |
Net assets, end of period (000 omitted) | $ 13,269,769 | $ 17,285,369 | $ 26,527,229 | $ 30,998,270 | $ 28,274,961 |
Portfolio turnover rate D | 35% | 45% | 57% | 54% | 49% |
A Total returns would have been lower if certain expenses had not been reduced during the applicable periods shown.
B Calculated based on average shares outstanding during the period.
C Fees and expenses of any underlying Fidelity Central Funds are not included in the Fund's expense ratio. The Fund indirectly bears its proportionate share of the expenses of any underlying Fidelity Central Funds.
D Amount does not include the portfolio activity of any underlying Fidelity Central Funds.
E Investment income per share reflects a large, non-recurring dividend which amounted to $.10 per share. Excluding this non-recurring dividend, the ratio of net investment income (loss) to average net assets would have been 1.44%.
F Expense ratios reflect operating expenses of the class. Expenses before reductions do not reflect amounts reimbursed by the investment adviser or reductions from brokerage service arrangements or reductions from other expense offset arrangements and do not represent the amount paid by the class during periods when reimbursements or reductions occur. Expenses net of fee waivers reflect expenses after reimbursement by the investment adviser but prior to reductions from brokerage service arrangements or other expense offset arrangements. Expenses net of all reductions represent the net expenses paid by the class.
G Amount represents less than $.01 per share.
See accompanying notes which are an integral part of the financial statements.
Annual Report
Financial Highlights - Class K
Years ended October 31, | 2012 | 2011 | 2010 | 2009 | 2008 H |
Selected Per-Share Data | | | | | |
Net asset value, beginning of period | $ 27.51 | $ 29.51 | $ 26.89 | $ 21.98 | $ 38.39 |
Income from Investment Operations | | | | | |
Net investment income (loss) D | .47 | .58 G | .42 | .42 | .16 |
Net realized and unrealized gain (loss) | 1.63 | (1.97) | 2.61 | 4.85 | (16.57) |
Total from investment operations | 2.10 | (1.39) | 3.03 | 5.27 | (16.41) |
Distributions from net investment income | (.55) | (.53) | (.41) | (.36) | - |
Distributions from net realized gain | - | (.08) | - | - | - |
Total distributions | (.55) | (.61) | (.41) | (.36) | - |
Redemption fees added to paid in capital D,J | - | - | - | - | - |
Net asset value, end of period | $ 29.06 | $ 27.51 | $ 29.51 | $ 26.89 | $ 21.98 |
Total Return B,C | 7.86% | (4.87)% | 11.33% | 24.64% | (42.75)% |
Ratios to Average Net Assets E,I | | | | | |
Expenses before reductions | .84% | .73% | .79% | .77% | .88% A |
Expenses net of fee waivers, if any | .84% | .72% | .79% | .77% | .88% A |
Expenses net of all reductions | .83% | .70% | .77% | .76% | .87% A |
Net investment income (loss) | 1.70% | 1.95% G | 1.54% | 1.81% | 1.45% A |
Supplemental Data | | | | | |
Net assets, end of period (000 omitted) | $ 8,885,304 | $ 8,115,192 | $ 7,697,405 | $ 4,713,909 | $ 932,275 |
Portfolio turnover rate F | 35% | 45% | 57% | 54% | 49% |
A Annualized
B Total returns for periods of less than one year are not annualized.
C Total returns would have been lower if certain expenses had not been reduced during the applicable periods shown.
D Calculated based on average shares outstanding during the period.
E Fees and expenses of any underlying Fidelity Central Funds are not included in the Fund's expense ratio. The Fund indirectly bears its proportionate share of the expenses of any underlying Fidelity Central Funds.
F Amount does not include the portfolio activity of any underlying Fidelity Central Funds.
G Investment income per share reflects a large, non-recurring dividend which amounted to $.10 per share. Excluding this non-recurring dividend, the ratio of net investment income (loss) to average net assets would have been 1.61%.
H For the period May 9, 2008 (commencement of sale of shares) to October 31, 2008.
I Expense ratios reflect operating expenses of the class. Expenses before reductions do not reflect amounts reimbursed by the investment adviser or reductions from brokerage service arrangements or reductions from other expense offset arrangements and do not represent the amount paid by the class during periods when reimbursements or reductions occur. Expense ratios before reductions for start-up periods may not be representative of longer-term operating periods. Expenses net of fee waivers reflect expenses after reimbursement by the investment adviser but prior to reductions from brokerage service arrangements or other expense offset arrangements. Expenses net of all reductions represent the net expenses paid by the class.
J Amount represents less than $.01 per share.
See accompanying notes which are an integral part of the financial statements.
Annual Report
Fidelity Diversified International Fund
Notes to Financial Statements
For the period ended October 31, 2012
1. Organization.
Fidelity Diversified International Fund (the Fund) is a fund of Fidelity Investment Trust (the Trust) and is authorized to issue an unlimited number of shares. The Trust is registered under the Investment Company Act of 1940, as amended (the 1940 Act), as an open-end management investment company organized as a Massachusetts business trust. The Fund offers Diversified International and Class K shares, each of which has equal rights as to assets and voting privileges. The Fund offered Class F shares during the period June 26, 2009 through December 16, 2011 and all outstanding shares were redeemed by December 16, 2011. Each class has exclusive voting rights with respect to matters that affect that class. Investment income, realized and unrealized capital gains and losses, the common expenses of the Fund, and certain fund-level expense reductions, if any, are allocated on a pro-rata basis to each class based on the relative net assets of each class to the total net assets of the Fund. Each class differs with respect to transfer agent fees incurred. Certain expense reductions may also differ by class. The Fund's investments in emerging markets can be subject to social, economic, regulatory, and political uncertainties and can be extremely volatile.
2. Investments in Fidelity Central Funds.
The Fund invests in Fidelity Central Funds, which are open-end investment companies available only to other investment companies and accounts managed by Fidelity Management & Research Company (FMR) and its affiliates. The Fund's Schedule of Investments lists each of the Fidelity Central Funds held as of period end, as an investment of the Fund, but does not include the underlying holdings of each Fidelity Central Fund. As an Investing Fund, the Fund indirectly bears its proportionate share of the expenses of the underlying Fidelity Central Funds.
The Money Market Central Funds seek preservation of capital and current income and are managed by Fidelity Investments Money Management, Inc. (FIMM), an affiliate of FMR.
A complete unaudited list of holdings for each Fidelity Central Fund is available upon request or at the Securities and Exchange Commission (the SEC) web site at www.sec.gov. In addition, the financial statements of the Fidelity Central Funds, which are not covered by the Fund's Report of Independent Registered Public Accounting Firm, are available on the SEC web site or upon request.
3. Significant Accounting Policies.
The financial statements have been prepared in conformity with accounting principles generally accepted in the United States of America (GAAP), which require management to make certain estimates and assumptions at the date of the financial statements. Actual results could differ from those estimates. Subsequent events, if any, through the date that the financial statements were issued have been evaluated in the preparation of the financial statements. The following summarizes the significant accounting policies of the Fund:
Security Valuation. Investments are valued as of 4:00 p.m. Eastern time on the last calendar day of the period. In accordance with valuation policies and procedures approved by the Board of Trustees (the Board), the Fund attempts to obtain prices from one or more third party pricing vendors or brokers to value its investments. When current market prices, quotations or rates are not readily available or reliable, securities will be fair valued in good faith by the FMR Fair Value Committee (the Committee), in accordance with procedures adopted by the Fund's Board. Factors used in determining fair value vary by security type and may include market or security specific events, changes in interest rates and credit quality. The frequency with which these procedures are used cannot be predicted and they may be utilized to a significant extent. The Committee oversees the Fund's valuation policies and procedures and is responsible for approving and reporting to the Board all fair value determinations.
The Fund categorizes the inputs to valuation techniques used to value its investments into a disclosure hierarchy consisting of three levels as shown below:
Level 1 - quoted prices in active markets for identical investments
Level 2 - other significant observable inputs (including quoted prices for similar investments, interest rates, prepayment speeds, etc.)
Level 3 - unobservable inputs (including the Fund's own assumptions based on the best information available)
Valuation techniques used to value the Fund's investments by major category are as follows:
Equity securities, including restricted securities, for which market quotations are readily available, are valued at the last reported sale price or official closing price as reported by a third party pricing vendor on the primary market or exchange on which they are traded and are categorized as Level 1 in the hierarchy. In the event there were no sales during the day or closing prices are not available, securities are valued at the last quoted bid price or may be valued using the last available price and are generally categorized as Level 2 in the hierarchy. For foreign equity securities, when significant market or security specific events arise, comparisons to the valuation of American Depositary Receipts (ADRs), futures contracts, Exchange-Traded Funds (ETFs) and certain indexes as well as quoted prices for similar securities are used and are categorized as Level 2 in the hierarchy. Utilizing these techniques may result in transfers between Level 1 and Level 2. For restricted equity securities and private placements where observable inputs are limited, assumptions about market activity and risk are used and these securities are generally categorized as Level 3 in the hierarchy.
Annual Report
Fidelity Diversified International Fund
Notes to Financial Statements - continued
3. Significant Accounting Policies - continued
Security Valuation - continued
Debt securities, including restricted securities, are valued based on evaluated prices received from third party pricing vendors or from brokers who make markets in such securities. For master notes, pricing vendors utilize matrix pricing which considers yield or price of bonds of comparable quality, coupon, maturity and type as well as broker-supplied prices and are generally categorized as Level 2 in the hierarchy. When independent prices are unavailable or unreliable, debt securities may be valued utilizing pricing methodologies which consider similar factors that would be used by third party pricing vendors. These are generally categorized as Level 2 in the hierarchy but may be Level 3 depending on the circumstances.
Investments in open-end mutual funds, including the Fidelity Central Funds, are valued at their closing net asset value (NAV) each business day and are categorized as Level 1 in the hierarchy.
Changes in valuation techniques may result in transfers in or out of an assigned level within the disclosure hierarchy. The aggregate value of investments by input level, as of October 31, 2012, including information on transfers between Levels 1 and 2, is included at the end of the Fund's Schedule of Investments.
Foreign Currency Translation. The Fund may use foreign currency contracts to facilitate transactions in foreign-denominated securities. Gains and losses from these transactions may arise from changes in the value of the foreign currency or if the counterparties do not perform under the contracts' terms.
Foreign-denominated assets, including investment securities, and liabilities are translated into U.S. dollars at the exchange rates at period end. Purchases and sales of investment securities, income and dividends received and expenses denominated in foreign currencies are translated into U.S. dollars at the exchange rate in effect on the transaction date.
The effects of exchange rate fluctuations on investments are included with the net realized and unrealized gain (loss) on investment securities. Other foreign currency transactions resulting in realized and unrealized gain (loss) are disclosed separately.
Investment Transactions and Income. For financial reporting purposes, the Fund's investment holdings and NAV include trades executed through the end of the last business day of the period. The NAV per share for processing shareholder transactions is calculated as of the close of business of the New York Stock Exchange (NYSE), normally 4:00 p.m. Eastern time and includes trades executed through the end of the prior business day. Gains and losses on securities sold are determined on the basis of identified cost and may include proceeds received from litigation. Dividend income is recorded on the ex-dividend date, except for certain dividends from foreign securities where the ex-dividend date may have passed, which are recorded as soon as the Fund is informed of the ex-dividend date. Non-cash dividends included in dividend income, if any, are recorded at the fair market value of the securities received. Interest income and distributions from the Fidelity Central Funds are accrued as earned. Distributions received on securities that represent a return of capital or capital gain are recorded as a reduction of cost of investments and/or as a realized gain. The Fund estimates the components of distributions received that may be considered return of capital distributions or capital gain distributions. Interest income includes coupon interest and amortization of premium and accretion of discount on debt securities. Investment income is recorded net of foreign taxes withheld where recovery of such taxes is uncertain.
Expenses. Expenses directly attributable to a fund are charged to that fund. Expenses attributable to more than one fund are allocated among the respective funds on the basis of relative net assets or other appropriate methods. Expense estimates are accrued in the period to which they relate and adjustments are made when actual amounts are known.
Deferred Trustee Compensation. Under a Deferred Compensation Plan (the Plan), independent Trustees may elect to defer receipt of a portion of their annual compensation. Deferred amounts are invested in a cross-section of Fidelity funds, are marked-to-market and remain in the Fund until distributed in accordance with the Plan. The investment of deferred amounts and the offsetting payable to the Trustees are included in the accompanying Statement of Assets and Liabilities.
Income Tax Information and Distributions to Shareholders. Each year, the Fund intends to qualify as a regulated investment company under Subchapter M of the Internal Revenue Code, including distributing substantially all of its taxable income and realized gains. As a result, no provision for income taxes is required. As of October 31, 2012, the Fund did not have any unrecognized tax benefits in the financial statements; nor is the Fund aware of any tax positions for which it is reasonably possible that the total amounts of unrecognized tax benefits will significantly change in the next twelve months. The Fund files a U.S. federal tax return, in addition to state and local tax returns as required. A fund's federal income tax returns are subject to examination by the Internal Revenue Service (IRS) for a period of three fiscal years after they are filed. State and local tax returns may be subject to examination for an additional fiscal year depending on the jurisdiction. Foreign taxes are provided for based on the Fund's understanding of the tax rules and rates that exist in the foreign markets in which it invests.
Annual Report
3. Significant Accounting Policies - continued
Income Tax Information and Distributions to Shareholders - continued
Distributions are declared and recorded on the ex-dividend date. Income dividends and capital gain distributions are declared separately for each class. Income and capital gain distributions are determined in accordance with income tax regulations, which may differ from GAAP.
Capital accounts within the financial statements are adjusted for permanent book-tax differences. These adjustments have no impact on net assets or the results of operations. Temporary book-tax differences will reverse in a subsequent period.
Book-tax differences are primarily due to foreign currency transactions, certain foreign taxes, passive foreign investment companies (PFIC), redemptions in kind, deferred trustees compensation, capital loss carryforwards and losses deferred due to wash sales.
The federal tax cost of investment securities and unrealized appreciation (depreciation) as of period end were as follows:
Gross unrealized appreciation | $ 4,187,321,081 |
Gross unrealized depreciation | (944,082,744) |
Net unrealized appreciation (depreciation) on securities and other investments | $ 3,243,238,337 |
| |
Tax Cost | $ 19,225,893,983 |
The tax-based components of distributable earnings as of period end were as follows:
Undistributed ordinary income | $ 371,274,366 |
Capital loss carryforward | $ (2,902,796,078) |
Net unrealized appreciation (depreciation) | $ 3,244,192,020 |
Capital loss carryforwards are only available to offset future capital gains of the Fund to the extent provided by regulations and may be limited. Under the Regulated Investment Company Modernization Act of 2010 (the Act), the Fund is permitted to carry forward capital losses incurred in taxable years beginning after December 22, 2010 for an unlimited period and such capital losses are required to be used prior to any losses that expire. Capital loss carryforwards were as follows:
Fiscal year of expiration | |
2017 | $ (2,283,224,226) |
2018 | (619,571,852) |
Total capital loss carryforward | $ (2,902,796,078) |
The tax character of distributions paid was as follows:
| October 31, 2012 | October 31, 2011 |
Ordinary Income | $ 460,432,289 | $ 647,951,728 |
Short-Term Trading (Redemption) Fees. Shares held by investors in the Fund less than 30 days are subject to a redemption fee equal to 1.00% of the net asset value of shares redeemed. All redemption fees, which reduce the proceeds of the shareholder redemption, are retained by the Fund and accounted for as an addition to paid in capital.
Delayed Delivery Transactions and When-Issued Securities. During the period, the Fund transacted in securities on a delayed delivery or when-issued basis. Payment and delivery may take place after the customary settlement period for that security. The price of the underlying securities and the date when the securities will be delivered and paid for are fixed at the time the transaction is negotiated. The Fund may receive compensation for interest forgone in the purchase of a delayed delivery or when-issued security. With respect to purchase commitments, the Fund identifies securities as segregated in its records with a value at least equal to the amount of the commitment. Losses may arise due to changes in the value of the underlying securities or if the counterparty does not perform under the contract's terms, or if the issuer does not issue the securities due to political, economic, or other factors.
Restricted Securities. The Fund may invest in securities that are subject to legal or contractual restrictions on resale. These securities generally may be resold in transactions exempt from registration or to the public if the securities are registered. Disposal of these securities may involve time-consuming negotiations and expense, and prompt sale at an acceptable price may be difficult. Information regarding restricted securities is included at the end of the Fund's Schedule of Investments.
Annual Report
Fidelity Diversified International Fund
Notes to Financial Statements - continued
3. Significant Accounting Policies - continued
New Accounting Pronouncement. In December 2011, the Financial Accounting Standards Board issued Accounting Standard Update No. 2011-11, Disclosures about Offsetting Assets and Liabilities. The update creates new disclosure requirements requiring entities to disclose both gross and net information for derivatives and other financial instruments that are either offset in the Statement of Assets and Liabilities or subject to an enforceable master netting arrangement or similar agreement. The disclosure requirements are effective for annual reporting periods beginning on or after January 1, 2013, and interim periods within those annual periods. Management is currently evaluating the impact of the update's adoption on the Fund's financial statement disclosures.
4. Purchases and Sales of Investments.
Purchases and sales of securities, other than short-term securities, aggregated $7,594,576,057 and $12,604,465,054, respectively.
Securities delivered through in-kind redemptions totaled $323,156,811. Realized gain of $94,833,623 on securities delivered through in-kind redemptions is included in the accompanying Statement of Operations as realized gain or loss on investment securities and is not taxable to the fund.
5. Fees and Other Transactions with Affiliates.
Management Fee. FMR and its affiliates provide the Fund with investment management related services for which the Fund pays a monthly management fee. The management fee is the sum of an individual fund fee rate that is based on an annual rate of .45% of the Fund's average net assets and an annualized group fee rate that averaged .26% during the period. The group fee rate is based upon the average net assets of all the mutual funds advised by FMR. The group fee rate decreases as assets under management increase and increases as assets under management decrease. In addition, the management fee is subject to a performance adjustment (up to a maximum of ± .20% of the Fund's average net assets over a 36 month performance period). The upward or downward adjustment to the management fee is based on the relative investment performance of Diversified International as compared to an appropriate benchmark index. For the period, the total annual management fee rate, including the performance adjustment, was .76% of the Fund's average net assets.
Transfer Agent Fees. Fidelity Investments Institutional Operations Company, Inc. (FIIOC), an affiliate of FMR, is the transfer, dividend disbursing and shareholder servicing agent for each class of the Fund. FIIOC receives account fees and asset-based fees that vary according to the account size and type of account of the shareholders of Diversified International. FIIOC receives an asset-based fee of Class K's average net assets. FIIOC pays for typesetting, printing and mailing of shareholder reports, except proxy statements. For the period, transfer agent fees for each class were as follows:
| Amount | % of
Average
Net Assets |
Diversified International | $ 31,220,100 | .22 |
Class K | 4,236,524 | .05 |
| $ 35,456,624 | |
Accounting and Security Lending Fees. Fidelity Service Company, Inc. (FSC), an affiliate of FMR, maintains the Fund's accounting records. The accounting fee is based on the level of average net assets for each month. Under a separate contract, FSC administers the security lending program. The security lending fee is based on the number and duration of lending transactions.
Brokerage Commissions. The Fund placed a portion of its portfolio transactions with brokerage firms which are affiliates of the investment adviser. The commissions paid to these affiliated firms were $25,599 for the period.
6. Committed Line of Credit.
The Fund participates with other funds managed by FMR or an affiliate in a $4.25 billion credit facility (the "line of credit") to be utilized for temporary or emergency purposes to fund shareholder redemptions or for other short-term liquidity purposes. The Fund has agreed to pay commitment fees on its pro-rata portion of the line of credit, which amounted to $63,578 and is reflected in Miscellaneous expenses on the Statement of Operations. During the period, there were no borrowings on this line of credit.
7. Security Lending.
The Fund lends portfolio securities through a lending agent from time to time in order to earn additional income. For equity securities, a lending agent is used and may loan securities to certain qualified borrowers, including Fidelity Capital Markets (FCM), a broker-dealer affiliated with the Fund. On the settlement date of the loan, the Fund receives collateral (in the form of U.S. Treasury obligations, letters of credit and/or cash) against the loaned securities and maintains collateral in an amount not less than 100% of the market value of the loaned securities during the period of the loan. The
Annual Report
7. Security Lending - continued
market value of the loaned securities is determined at the close of business of the Fund and any additional required collateral is delivered to the Fund on the next business day. If the borrower defaults on its obligation to return the securities loaned because of insolvency or other reasons, a fund could experience delays and costs in recovering the securities loaned or in gaining access to the collateral. Any cash collateral received is invested in the Fidelity Securities Lending Cash Central Fund. The value of loaned securities and cash collateral at period end are disclosed on the Fund's Statement of Assets and Liabilities. At period end, there were no security loans outstanding with FCM. Security lending income represents the income earned on investing cash collateral, less rebates paid to borrowers and any lending agent fees associated with the loan, plus any premium payments received for lending certain types of securities. Security lending income is presented in the Statement of Operations as a component of income from Fidelity Central Funds. Total security lending income during the period amounted to $15,556,493, including $12,266 from securities loaned to FCM.
8. Expense Reductions.
Many of the brokers with whom FMR places trades on behalf of the Fund provided services to the Fund in addition to trade execution. These services included payments of certain expenses on behalf of the Fund totaling $2,425,551 for the period. In addition, through arrangements with the Fund's custodian, credits realized as a result of uninvested cash balances were used to reduce the Fund's expenses. During the period, these credits reduced the Fund's custody expenses by $373.
9. Distributions to Shareholders.
Distributions to shareholders of each class were as follows:
Years ended October 31, | 2012A | 2011 |
From net investment income | | |
Diversified International | $ 294,773,906 | $ 404,459,076 |
Class K | 163,061,175 | 139,574,930 |
Class F | 2,597,208 | 10,137,376 |
Total | $ 460,432,289 | $ 554,171,382 |
From net realized gain | | |
Diversified International | $ - | $ 71,011,904 |
Class K | - | 21,272,351 |
Class F | - | 1,496,091 |
Total | $ - | $ 93,780,346 |
A All Class F shares were redeemed on December 16, 2011.
10. Share Transactions.
Transactions for each class of shares were as follows:
| Shares | Dollars |
Years ended October 31, | 2012A | 2011 | 2012A | 2011 |
Diversified International | | | | |
Shares sold | 68,919,981 | 95,789,996 | $ 1,874,276,249 | $ 2,861,192,033 |
Reinvestment of distributions | 10,773,340 | 15,446,133 | 281,938,317 | 459,413,511 |
Shares redeemed | (251,932,423) | (382,099,741) | (6,875,660,945) | (11,334,070,882) |
Net increase (decrease) | (172,239,102) | (270,863,612) | $ (4,719,446,379) | $ (8,013,465,338) |
Class K | | | | |
Shares sold | 107,189,633 | 125,231,374 | $ 2,919,697,004 | $ 3,707,928,503 |
Reinvestment of distributions | 6,242,771 | 5,413,899 | 163,061,175 | 160,847,281 |
Shares redeemed | (102,745,898) | (96,416,162) | (2,820,922,083) | (2,871,502,023) |
Net increase (decrease) | 10,686,506 | 34,229,111 | $ 261,836,096 | $ 997,273,761 |
Class F | | | | |
Shares sold | 439,287 | 13,012,404 | $ 11,548,416 | $ 389,423,461 |
Reinvestment of distributions | 99,472 | 391,673 | 2,597,208 | 11,633,466 |
Shares redeemed | (6,767,017) | (27,320,491) | (175,849,737) | (802,392,088) |
Net increase (decrease) | (6,228,258) | (13,916,414) | $ (161,704,113) | $ (401,335,161) |
A All Class F shares were redeemed on December 16, 2011.
Annual Report
Fidelity Diversified International Fund
Notes to Financial Statements - continued
11. Other.
The Fund's organizational documents provide former and current trustees and officers with a limited indemnification against liabilities arising in connection with the performance of their duties to the Fund. In the normal course of business, the Fund may also enter into contracts that provide general indemnifications. The Fund's maximum exposure under these arrangements is unknown as this would be dependent on future claims that may be made against the Fund. The risk of material loss from such claims is considered remote.
Annual Report
Report of Independent Registered Public Accounting Firm
To the Trustees of Fidelity Investment Trust and Shareholders of Fidelity Diversified International Fund:
We have audited the accompanying statement of assets and liabilities of Fidelity Diversified International Fund (the Fund), a fund of Fidelity Investment Trust, including the schedule of investments, as of October 31, 2012, and the related statement of operations for the year then ended, the statement of changes in net assets for each of the two years in the period then ended, and the financial highlights for each of the five years in the period then ended. These financial statements and financial highlights are the responsibility of the Fund's management. Our responsibility is to express an opinion on these financial statements and financial highlights based on our audits.
We conducted our audits in accordance with the standards of the Public Company Accounting Oversight Board (United States). Those standards require that we plan and perform the audit to obtain reasonable assurance about whether the financial statements and financial highlights are free of material misstatement. The Fund is not required to have, nor were we engaged to perform, an audit of its internal control over financial reporting. Our audits included consideration of internal control over financial reporting as a basis for designing audit procedures that are appropriate in the circumstances, but not for the purpose of expressing an opinion on the effectiveness of the Fund's internal control over financial reporting. Accordingly, we express no such opinion. An audit also includes examining, on a test basis, evidence supporting the amounts and disclosures in the financial statements, assessing the accounting principles used and significant estimates made by management, as well as evaluating the overall financial statement presentation. Our procedures included confirmation of securities owned as of October 31, 2012, by correspondence with the custodians and brokers; where replies were not received from brokers, we performed other auditing procedures. We believe that our audits provide a reasonable basis for our opinion.
In our opinion, the financial statements and financial highlights referred to above present fairly, in all material respects, the financial position of Fidelity Diversified International Fund as of October 31, 2012, the results of its operations for the year then ended, the changes in its net assets for each of the two years in the period then ended, and the financial highlights for each of the five years in the period then ended, in conformity with accounting principles generally accepted in the United States of America.
DELOITTE & TOUCHE LLP
Boston, Massachusetts
December 14, 2012
Annual Report
Fidelity International Capital Appreciation Fund
As a shareholder of the Fund, you incur two types of costs: (1) transaction costs, including redemption fees and (2) ongoing costs, including management fees and other Fund expenses. This Example is intended to help you understand your ongoing costs (in dollars) of investing in the Fund and to compare these costs with the ongoing costs of investing in other mutual funds.
The Example is based on an investment of $1,000 invested at the beginning of the period and held for the entire period (May 1, 2012 to October 31, 2012).
Actual Expenses
The first line of the accompanying table provides information about actual account values and actual expenses. You may use the information in this line, together with the amount you invested, to estimate the expenses that you paid over the period. Simply divide your account value by $1,000.00 (for example, an $8,600 account value divided by $1,000.00 = 8.6), then multiply the result by the number in the first line under the heading entitled "Expenses Paid During Period" to estimate the expenses you paid on your account during this period. A small balance maintenance fee of $12.00 that is charged once a year may apply for certain accounts with a value of less than $2,000. This fee is not included in the table below. If it was, the estimate of expenses you paid during the period would be higher, and your ending account value lower, by this amount. In addition, the Fund, as a shareholder in the underlying Fidelity Central Funds, will indirectly bear its pro-rata share of the fees and expenses incurred by the underlying Fidelity Central Funds. These fees and expenses are not included in the Fund's annualized expense ratio used to calculate the expense estimate in the table below.
Hypothetical Example for Comparison Purposes
The second line of the accompanying table provides information about hypothetical account values and hypothetical expenses based on the Fund's actual expense ratio and an assumed rate of return of 5% per year before expenses, which is not the Fund's actual return. The hypothetical account values and expenses may not be used to estimate the actual ending account balance or expenses you paid for the period. You may use this information to compare the ongoing costs of investing in the Fund and other funds. To do so, compare this 5% hypothetical example with the 5% hypothetical examples that appear in the shareholder reports of the other funds. A small balance maintenance fee of $12.00 that is charged once a year may apply for certain accounts with a value of less than $2,000. This fee is not included in the table below. If it was, the estimate of expenses you paid during the period would be higher, and your ending account value lower, by this amount. In addition, the Fund, as a shareholder in the underlying Fidelity Central Funds, will indirectly bear its pro-rata share of the fees and expenses incurred by the underlying Fidelity Central Funds. These fees and expenses are not included in the Fund's annualized expense ratio used to calculate the expense estimate in the table below.
Please note that the expenses shown in the table are meant to highlight your ongoing costs only and do not reflect any transaction costs. Therefore, the second line of the table is useful in comparing ongoing costs only, and will not help you determine the relative total costs of owning different funds. In addition, if these transactional costs were included, your costs would have been higher.
| Annualized Expense Ratio | Beginning
Account Value
May 1, 2012 | Ending
Account Value
October 31, 2012 | Expenses Paid
During Period*
May 1, 2012 to October 31, 2012 |
Actual | 1.21% | $ 1,000.00 | $ 1,006.90 | $ 6.10 |
Hypothetical (5% return per year before expenses) | | $ 1,000.00 | $ 1,019.05 | $ 6.14 |
* Expenses are equal to the Fund's annualized expense ratio, multiplied by the average account value over the period, multiplied by 184/366 (to reflect the one-half year period).
Annual Report
Fidelity International Capital Appreciation Fund
Performance: The Bottom Line
Average annual total return reflects the change in the value of an investment, assuming reinvestment of the fund's distributions from dividend income and capital gains (the profits earned upon the sale of securities that have grown in value, if any) and assuming a constant rate of performance each year. The $10,000 table and the fund's returns do not reflect the deduction of taxes that a shareholder would pay on fund distributions or the redemption of fund shares. During periods of reimbursement by Fidelity, a fund's total return will be greater than it would be had the reimbursement not occurred. How a fund did yesterday is no guarantee of how it will do tomorrow.
Average Annual Total Returns
Periods ended October 31, 2012 | Past 1
year | Past 5
years | Past 10 years |
Fidelity International Capital Appreciation Fund | 11.57% | -3.61% | 7.07% |
$10,000 Over 10 Years
Let's say hypothetically that $10,000 was invested in Fidelity International Capital Appreciation Fund on October 31, 2002. The chart shows how the value of your investment would have changed, and also shows how the MSCI® ACWI® (All Country World Index) ex USA Index performed over the same period.
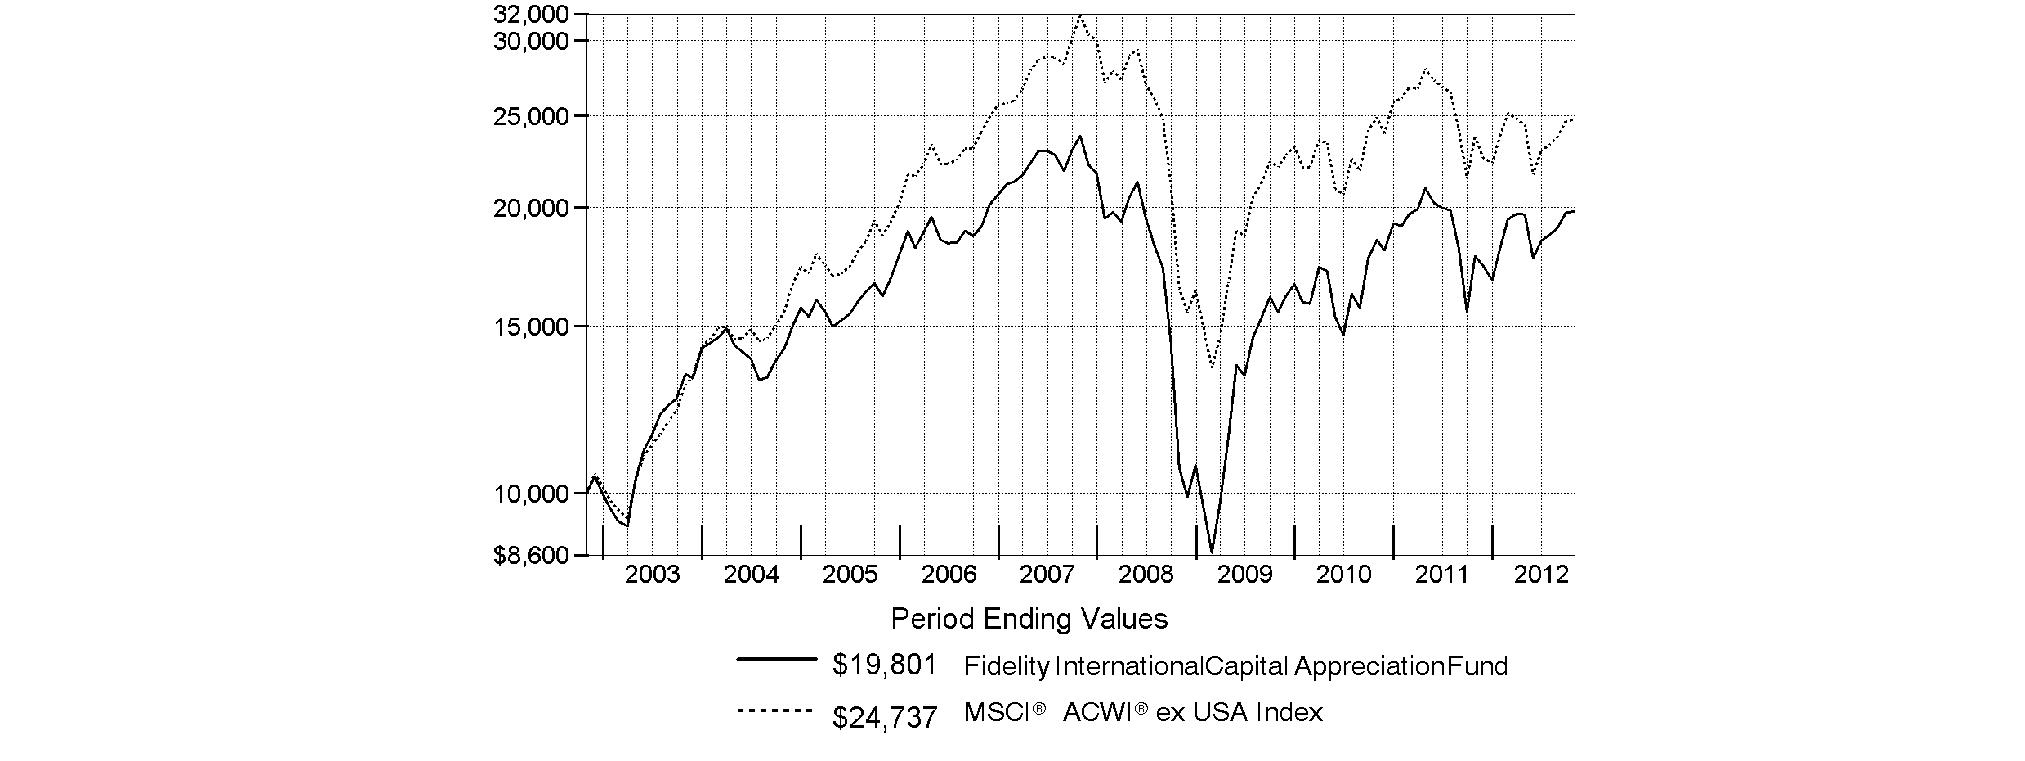
Annual Report
Fidelity International Capital Appreciation Fund
Market Recap: Returns for most domestic and international equities fluctuated during the 12 months ending October 31, 2012, as investor sentiment towards risk vacillated amid a changing global economic landscape. U.S. stocks overcame bouts of volatility to post strong gains for the past year, extending an uptrend that began in March 2009. The broad-based S&P 500® Index advanced 15.21%, while the blue-chip-laden Dow Jones Industrial AverageSM and technology-heavy Nasdaq Composite® Index rose 12.56% and 12.21%, respectively. Performance outside of the U.S. was relatively weak, as the MSCI® ACWI® (All Country World Index) ex USA Index rose 4.11%, hampered in part by a stronger U.S. dollar. International developed-markets generally struggled during the period as macroeconomic concerns ebbed and flowed, finishing with only a modest gain. The MSCI® EAFE® Index rose 4.76% for the year, largely buttressed in the summertime by pledges of accommodative monetary action from eurozone officials, as well as signs that the U.S. housing market was on the mend. Within the index, Asia-Pacific ex Japan showed the most impressive gain, advancing roughly 10%. A number of core European components, including Germany (+11%) and Switzerland (+10%), and the U.K. (+9%), benefited from optimism about the eurozone's ability to resolve its debt woes, which helped the region outpace the index overall. Elsewhere, Japan was among the few benchmark constituents to finish in the red, returning about -3%. Emerging-markets stocks gained 2.98% for the year, as measured by the MSCI Emerging Markets Index. A general uptrend in the final five months of the period lifted the index into positive territory for the full 12 months.
Comments from Sammy Simnegar, Portfolio Manager of Fidelity® International Capital Appreciation Fund: For the year, the fund returned 11.57%, handily outpacing the MSCI index. Stock selection in consumer staples, consumer discretionary and materials meaningfully lifted relative performance. Within staples, a large overweighting in food, beverage and tobacco also helped. Geographically, the fund was aided by a sizable out-of-benchmark stake in the United States and by stock picking in Brazil, Indonesia and Italy. Our U.S. holdings also benefited from an appreciating dollar. Three of the four biggest relative contributors were Indonesian stocks: Global Mediacom, Ace Hardware Indonesia, and Tower Bersama Infrastructure, a cellular tower operator. Thailand-based big-box discount retailer Siam Makro - which I sold - contributed as well. All of the contributors I've mentioned were non-benchmark holdings. Conversely, financials and health care detracted. Geographically, Australia hurt. Not owning strong-performing South Korean benchmark component Samsung Electronics during the period's first half hampered results, as did overweightings in Australia's Iluka Resources and Fortescue Metals Group, the latter of which I sold.
The views expressed above reflect those of the portfolio manager(s) only through the end of the period as stated on the cover of this report and do not necessarily represent the views of Fidelity or any other person in the Fidelity organization. Any such views are subject to change at any time based upon market or other conditions and Fidelity disclaims any responsibility to update such views. These views may not be relied on as investment advice and, because investment decisions for a Fidelity fund are based on numerous factors, may not be relied on as an indication of trading intent on behalf of any Fidelity fund.
Annual Report
Fidelity International Capital Appreciation Fund
Investment Changes (Unaudited)
Geographic Diversification (% of fund's net assets) |
As of October 31, 2012 |
| United States of America | 16.1% | |
| United Kingdom | 13.6% | |
| France | 8.6% | |
| Japan | 6.9% | |
| Germany | 5.5% | |
| Switzerland | 5.3% | |
| India | 4.4% | |
| Indonesia | 3.8% | |
| Brazil | 3.8% | |
| Other | 32.0% | |

Percentages are based on country or territory of incorporation and are adjusted for the effect of futures contracts, if applicable. |
As of April 30, 2012 |
| United States of America | 17.4% | |
| United Kingdom | 15.6% | |
| Japan | 9.2% | |
| France | 7.8% | |
| Switzerland | 4.9% | |
| Indonesia | 4.6% | |
| Germany | 3.8% | |
| Brazil | 3.7% | |
| India | 3.5% | |
| Other | 29.5% | |

Percentages are based on country or territory of incorporation and are adjusted for the effect of futures contracts, if applicable. |
Asset Allocation |
| % of fund's
net assets | % of fund's net assets
6 months ago |
Stocks | 99.9 | 98.7 |
Short-Term Investments and Net Other Assets (Liabilities) | 0.1 | 1.3 |
Top Ten Stocks as of October 31, 2012 |
| % of fund's
net assets | % of fund's net assets
6 months ago |
Nestle SA (Switzerland, Food Products) | 1.7 | 1.7 |
BHP Billiton PLC ADR (United Kingdom, Metals & Mining) | 1.5 | 1.6 |
Samsung Electronics Co. Ltd. (Korea (South), Semiconductors & Semiconductor Equipment) | 1.3 | 0.0 |
Unilever PLC (United Kingdom, Food Products) | 1.0 | 1.0 |
British American Tobacco PLC (United Kingdom) (United Kingdom, Tobacco) | 1.0 | 1.4 |
BASF AG (Germany, Chemicals) | 0.8 | 0.8 |
Taiwan Semiconductor Manufacturing Co. Ltd. sponsored ADR (Taiwan, Semiconductors & Semiconductor Equipment) | 0.8 | 0.8 |
Diageo PLC sponsored ADR (United Kingdom, Beverages) | 0.8 | 0.8 |
Anheuser-Busch InBev SA NV (Belgium, Beverages) | 0.8 | 0.8 |
SAP AG (Germany, Software) | 0.8 | 0.7 |
| 10.5 | |
Market Sectors as of October 31, 2012 |
| % of fund's
net assets | % of fund's net assets
6 months ago |
Consumer Discretionary | 19.4 | 19.6 |
Consumer Staples | 19.4 | 21.1 |
Industrials | 17.2 | 13.8 |
Financials | 12.1 | 12.7 |
Information Technology | 11.1 | 8.8 |
Materials | 10.3 | 11.2 |
Health Care | 5.4 | 2.8 |
Energy | 3.3 | 7.0 |
Telecommunication Services | 1.8 | 1.7 |
Annual Report
Fidelity International Capital Appreciation Fund
Investments October 31, 2012
Showing Percentage of Net Assets
Common Stocks - 99.3% |
| Shares | | Value |
Australia - 1.6% |
ALS Ltd. | 303,420 | | $ 2,919,727 |
Coca-Cola Amatil Ltd. | 192,730 | | 2,690,852 |
Iluka Resources Ltd. | 302,626 | | 3,116,278 |
Orica Ltd. | 111,050 | | 2,895,719 |
TOTAL AUSTRALIA | | 11,622,576 |
Austria - 0.4% |
Andritz AG | 49,300 | | 2,969,442 |
Bailiwick of Jersey - 0.5% |
Experian PLC | 215,400 | | 3,719,339 |
Belgium - 1.2% |
Anheuser-Busch InBev SA NV | 67,859 | | 5,675,127 |
Umicore SA | 61,248 | | 3,143,312 |
TOTAL BELGIUM | | 8,818,439 |
Bermuda - 0.8% |
Credicorp Ltd. (NY Shares) | 25,760 | | 3,331,798 |
Jardine Matheson Holdings Ltd. | 45,600 | | 2,808,960 |
TOTAL BERMUDA | | 6,140,758 |
Brazil - 3.8% |
BR Malls Participacoes SA | 219,400 | | 2,884,213 |
CCR SA | 318,800 | | 2,803,362 |
Cielo SA | 124,000 | | 3,067,871 |
Companhia de Bebidas das Americas (AmBev) (PN) sponsored ADR | 103,300 | | 4,213,607 |
Iguatemi Empresa de Shopping Centers SA | 204,800 | | 2,601,531 |
Itau Unibanco Holdings SA sponsored ADR | 275,800 | | 4,021,164 |
Multiplan Empreendimentos Imobiliarios SA | 96,400 | | 2,824,057 |
Qualicorp SA (a) | 247,000 | | 2,534,394 |
Souza Cruz SA | 202,800 | | 2,646,021 |
TOTAL BRAZIL | | 27,596,220 |
Canada - 0.6% |
Canadian National Railway Co. | 51,200 | | 4,421,014 |
Cayman Islands - 0.8% |
Baidu.com, Inc. sponsored ADR (a) | 25,600 | | 2,729,472 |
Sands China Ltd. | 846,000 | | 3,182,031 |
TOTAL CAYMAN ISLANDS | | 5,911,503 |
Chile - 0.8% |
Embotelladora Andina SA Class A | 561,722 | | 2,825,246 |
Parque Arauco SA | 1,185,960 | | 2,708,864 |
TOTAL CHILE | | 5,534,110 |
|
| Shares | | Value |
Denmark - 1.2% |
FLSmidth & Co. A/S | 49,000 | | $ 2,894,698 |
Novo Nordisk A/S Series B sponsored ADR | 34,540 | | 5,536,417 |
TOTAL DENMARK | | 8,431,115 |
Finland - 0.8% |
Kone Oyj (B Shares) | 45,500 | | 3,258,359 |
Nokian Tyres PLC | 68,300 | | 2,832,865 |
TOTAL FINLAND | | 6,091,224 |
France - 8.6% |
Air Liquide SA | 35,710 | | 4,211,982 |
Bollore | 8,210 | | 2,433,154 |
Bureau Veritas SA | 29,600 | | 3,143,330 |
Casino Guichard Perrachon SA | 31,960 | | 2,791,213 |
Christian Dior SA | 22,412 | | 3,217,212 |
Dassault Systemes SA | 26,100 | | 2,750,001 |
Edenred SA | 95,200 | | 2,754,759 |
Essilor International SA | 35,430 | | 3,193,916 |
Eurofins Scientific SA | 16,442 | | 2,542,438 |
Hermes International SCA | 8,777 | | 2,395,851 |
L'Oreal SA | 30,500 | | 3,884,866 |
LVMH Moet Hennessy - Louis Vuitton SA | 29,620 | | 4,814,352 |
Pernod Ricard SA | 35,400 | | 3,809,724 |
PPR SA | 20,100 | | 3,534,037 |
Publicis Groupe SA | 58,900 | | 3,173,207 |
Remy Cointreau SA | 29,041 | | 3,012,072 |
Schneider Electric SA | 66,694 | | 4,169,695 |
Technip SA | 29,000 | | 3,266,428 |
Vivendi SA | 197,605 | | 4,042,945 |
TOTAL FRANCE | | 63,141,182 |
Germany - 4.9% |
adidas AG | 39,100 | | 3,331,161 |
BASF AG | 75,291 | | 6,238,828 |
Bayerische Motoren Werke AG (BMW) | 53,361 | | 4,250,119 |
Brenntag AG | 21,200 | | 2,671,998 |
Fresenius Medical Care AG & Co. KGaA sponsored ADR | 46,700 | | 3,286,746 |
Henkel AG & Co. KGaA | 57,400 | | 3,713,999 |
Hugo Boss AG | 28,700 | | 2,872,918 |
Linde AG | 22,800 | | 3,834,401 |
SAP AG | 77,323 | | 5,638,629 |
TOTAL GERMANY | | 35,838,799 |
Hong Kong - 1.0% |
AIA Group Ltd. | 1,104,200 | | 4,374,029 |
Galaxy Entertainment Group Ltd. (a) | 884,000 | | 3,039,800 |
TOTAL HONG KONG | | 7,413,829 |
India - 4.4% |
Asian Paints India Ltd. | 37,322 | | 2,685,269 |
Bajaj Auto Ltd. | 82,827 | | 2,796,229 |
Bosch Ltd. (a) | 15,678 | | 2,592,792 |
Common Stocks - continued |
| Shares | | Value |
India - continued |
Colgate-Palmolive (India) | 107,544 | | $ 2,569,623 |
HDFC Bank Ltd. | 305,582 | | 3,588,138 |
Housing Development Finance Corp. Ltd. | 245,828 | | 3,483,077 |
ITC Ltd. | 638,373 | | 3,352,333 |
Page Industries Ltd. | 41,630 | | 2,594,012 |
Smithkline Beecham Consumer Healthcare Ltd. | 50,975 | | 2,877,262 |
Titan Industries Ltd. | 577,037 | | 2,780,888 |
TTK Prestige Ltd. (a) | 43,331 | | 2,581,700 |
TOTAL INDIA | | 31,901,323 |
Indonesia - 3.8% |
PT ACE Hardware Indonesia Tbk | 4,090,500 | | 2,981,091 |
PT Bank Central Asia Tbk | 3,326,500 | | 2,839,894 |
PT Bank Rakyat Indonesia Tbk | 3,754,000 | | 2,892,190 |
PT Global Mediacom Tbk | 11,762,500 | | 2,786,005 |
PT Jasa Marga Tbk | 4,464,000 | | 2,695,585 |
PT Mitra Adiperkasa Tbk | 3,540,500 | | 2,414,386 |
PT Modern Internasional Tbk (a) | 37,010,500 | | 2,851,396 |
PT Modern Internasional Tbk rights 11/8/12 (a) | 11,103,150 | | 219,635 |
PT Semen Gresik (Persero) Tbk | 1,856,500 | | 2,879,931 |
PT Surya Citra Media Tbk | 12,197,500 | | 2,476,317 |
PT Tower Bersama Infrastructure Tbk (a) | 5,786,500 | | 3,012,220 |
TOTAL INDONESIA | | 28,048,650 |
Ireland - 0.7% |
Accenture PLC Class A | 38,408 | | 2,589,083 |
Dragon Oil PLC | 287,200 | | 2,572,253 |
TOTAL IRELAND | | 5,161,336 |
Israel - 0.4% |
Check Point Software Technologies Ltd. (a) | 58,400 | | 2,600,552 |
Italy - 2.0% |
Fiat Industrial SpA | 265,218 | | 2,872,134 |
Pirelli & C SpA (d) | 248,860 | | 2,882,073 |
Prada SpA | 363,000 | | 2,960,187 |
Saipem SpA | 69,763 | | 3,134,072 |
Salvatore Ferragamo Italia SpA | 116,700 | | 2,370,255 |
TOTAL ITALY | | 14,218,721 |
Japan - 6.9% |
Daihatsu Motor Co. Ltd. | 168,000 | | 2,942,052 |
Daito Trust Construction Co. Ltd. | 26,100 | | 2,635,175 |
Fanuc Corp. | 26,300 | | 4,187,310 |
Fast Retailing Co. Ltd. | 14,800 | | 3,296,305 |
Hitachi Ltd. | 704,000 | | 3,730,327 |
Japan Tobacco, Inc. | 141,500 | | 3,910,172 |
Kansai Paint Co. Ltd. | 264,000 | | 2,840,737 |
Keyence Corp. | 12,170 | | 3,228,869 |
Komatsu Ltd. | 176,500 | | 3,696,705 |
|
| Shares | | Value |
Kubota Corp. | 299,000 | | $ 3,056,295 |
Nabtesco Corp. | 147,000 | | 2,736,340 |
Rakuten, Inc. | 312,000 | | 2,806,163 |
SMC Corp. | 20,400 | | 3,214,731 |
Sysmex Corp. | 58,300 | | 2,742,284 |
Unicharm Corp. | 52,900 | | 2,862,683 |
USS Co. Ltd. | 24,960 | | 2,623,254 |
TOTAL JAPAN | | 50,509,402 |
Korea (South) - 1.3% |
Samsung Electronics Co. Ltd. | 7,946 | | 9,546,978 |
Mexico - 1.3% |
Fomento Economico Mexicano SAB de CV sponsored ADR | 36,400 | | 3,298,204 |
Grupo Mexico SA de CV Series B | 1,079,700 | | 3,459,922 |
Grupo Televisa SA de CV (CPO) sponsored ADR | 127,000 | | 2,870,200 |
TOTAL MEXICO | | 9,628,326 |
Netherlands - 2.5% |
ASML Holding NV (Netherlands) | 68,500 | | 3,765,600 |
Core Laboratories NV (d) | 27,625 | | 2,863,608 |
Heineken Holding NV (A Shares) | 67,500 | | 3,425,238 |
Kweichow Moutai Co. Ltd. (BNP Paribas Warrant Program) warrants 8/20/13 (a)(e) | 72,500 | | 2,875,009 |
LyondellBasell Industries NV Class A | 49,000 | | 2,616,110 |
Yandex NV (a) | 104,400 | | 2,430,432 |
TOTAL NETHERLANDS | | 17,975,997 |
Nigeria - 0.7% |
Guaranty Trust Bank PLC | 21,879,249 | | 2,758,240 |
Nigerian Breweries PLC | 3,014,181 | | 2,325,982 |
TOTAL NIGERIA | | 5,084,222 |
Panama - 0.4% |
Intergroup Financial Services Corp. | 85,276 | | 2,728,832 |
Philippines - 2.3% |
Alliance Global Group, Inc. | 7,659,800 | | 2,773,183 |
International Container Terminal Services, Inc. | 1,575,610 | | 2,721,857 |
Metropolitan Bank & Trust Co. | 1,185,900 | | 2,741,131 |
Security Bank Corp. | 682,800 | | 2,689,667 |
SM Investments Corp. | 156,290 | | 3,053,549 |
SM Prime Holdings, Inc. | 8,540,925 | | 3,013,222 |
TOTAL PHILIPPINES | | 16,992,609 |
Portugal - 0.4% |
Jeronimo Martins SGPS SA | 155,405 | | 2,719,281 |
Russia - 1.4% |
Magnit OJSC GDR (Reg. S) | 87,305 | | 3,099,328 |
Common Stocks - continued |
| Shares | | Value |
Russia - continued |
NOVATEK OAO GDR (Reg. S) | 26,400 | | $ 3,009,600 |
Sberbank (Savings Bank of the Russian Federation) | 1,377,200 | | 4,031,643 |
TOTAL RUSSIA | | 10,140,571 |
Singapore - 0.4% |
Jardine Cycle & Carriage Ltd. | 70,000 | | 2,825,709 |
South Africa - 1.7% |
Mr Price Group Ltd. | 187,400 | | 2,895,081 |
Nampak Ltd. | 777,500 | | 2,591,472 |
Naspers Ltd. Class N | 60,600 | | 3,934,232 |
Shoprite Holdings Ltd. | 151,100 | | 3,107,164 |
TOTAL SOUTH AFRICA | | 12,527,949 |
Spain - 1.0% |
Amadeus IT Holding SA Class A | 123,200 | | 3,049,997 |
Inditex SA | 31,579 | | 4,029,260 |
TOTAL SPAIN | | 7,079,257 |
Sweden - 2.2% |
ASSA ABLOY AB (B Shares) | 97,194 | | 3,239,849 |
Atlas Copco AB (A Shares) | 164,300 | | 4,040,062 |
Elekta AB (B Shares) | 220,000 | | 3,134,376 |
Getinge AB (B Shares) | 88,200 | | 2,712,660 |
Swedish Match Co. AB | 86,800 | | 2,957,500 |
TOTAL SWEDEN | | 16,084,447 |
Switzerland - 5.3% |
Compagnie Financiere Richemont SA Series A | 69,162 | | 4,485,541 |
Dufry AG (a) | 22,290 | | 2,829,033 |
Nestle SA | 192,733 | | 12,230,769 |
Schindler Holding AG (Reg.) | 25,510 | | 3,300,714 |
SGS SA (Reg.) | 1,540 | | 3,260,904 |
Swatch Group AG (Bearer) | 8,770 | | 3,629,290 |
Syngenta AG (Switzerland) | 12,060 | | 4,702,068 |
UBS AG | 300,310 | | 4,505,729 |
TOTAL SWITZERLAND | | 38,944,048 |
Taiwan - 0.8% |
Taiwan Semiconductor Manufacturing Co. Ltd. sponsored ADR | 376,700 | | 5,989,530 |
Thailand - 1.6% |
C.P. ALL PCL (For. Reg.) | 2,383,200 | | 3,088,758 |
Home Product Center PCL (For. Reg.) | 6,930,240 | | 2,575,961 |
Kasikornbank PCL (For. Reg.) | 511,400 | | 3,001,369 |
Siam Commercial Bank PCL (For. Reg.) | 527,900 | | 2,771,174 |
TOTAL THAILAND | | 11,437,262 |
Turkey - 1.2% |
Coca-Cola Icecek A/S | 146,018 | | 2,834,826 |
|
| Shares | | Value |
TAV Havalimanlari Holding A/S | 589,475 | | $ 2,926,821 |
Turkiye Garanti Bankasi A/S | 694,909 | | 3,318,505 |
TOTAL TURKEY | | 9,080,152 |
United Kingdom - 13.6% |
Aggreko PLC | 85,700 | | 2,973,415 |
AMEC PLC | 153,510 | | 2,625,904 |
Antofagasta PLC | 158,800 | | 3,221,232 |
BHP Billiton PLC ADR (d) | 172,988 | | 11,067,772 |
British American Tobacco PLC (United Kingdom) | 143,500 | | 7,117,544 |
Burberry Group PLC | 179,600 | | 3,379,412 |
Diageo PLC sponsored ADR | 49,700 | | 5,677,728 |
Halma PLC | 377,600 | | 2,512,968 |
IMI PLC | 199,100 | | 3,066,786 |
Imperial Tobacco Group PLC | 122,514 | | 4,626,343 |
InterContinental Hotel Group PLC ADR | 101,640 | | 2,502,377 |
Intertek Group PLC | 69,400 | | 3,157,118 |
Johnson Matthey PLC | 81,851 | | 2,970,638 |
Meggitt PLC | 470,300 | | 2,929,534 |
Prudential PLC | 330,298 | | 4,536,182 |
Reckitt Benckiser Group PLC | 70,300 | | 4,254,248 |
Rexam PLC | 413,100 | | 2,977,881 |
Rolls-Royce Group PLC | 282,900 | | 3,901,048 |
Rolls-Royce Group PLC Class C | 22,131,200 | | 35,714 |
Rotork PLC | 75,600 | | 2,779,149 |
SABMiller PLC | 103,300 | | 4,425,061 |
Spectris PLC | 104,400 | | 2,911,257 |
Standard Chartered PLC (United Kingdom) | 225,581 | | 5,327,599 |
The Weir Group PLC | 101,400 | | 2,850,509 |
Unilever PLC | 202,700 | | 7,561,357 |
TOTAL UNITED KINGDOM | | 99,388,776 |
United States of America - 16.0% |
Allergan, Inc. | 28,931 | | 2,601,476 |
Altria Group, Inc. | 75,890 | | 2,413,302 |
American Tower Corp. | 36,242 | | 2,728,660 |
Apple, Inc. | 4,566 | | 2,717,227 |
Caterpillar, Inc. | 32,500 | | 2,756,325 |
Citrix Systems, Inc. (a) | 35,900 | | 2,218,979 |
Coach, Inc. | 42,400 | | 2,376,520 |
Colgate-Palmolive Co. | 24,750 | | 2,597,760 |
Crown Castle International Corp. (a) | 40,100 | | 2,676,675 |
Cummins, Inc. | 30,500 | | 2,854,190 |
Danaher Corp. | 45,731 | | 2,365,665 |
Deere & Co. | 29,400 | | 2,511,936 |
EMC Corp. (a) | 107,507 | | 2,625,321 |
Estee Lauder Companies, Inc. Class A | 43,216 | | 2,662,970 |
FMC Corp. | 46,500 | | 2,488,680 |
FMC Technologies, Inc. (a) | 59,600 | | 2,437,640 |
Freeport-McMoRan Copper & Gold, Inc. | 68,020 | | 2,644,618 |
Google, Inc. Class A (a) | 3,540 | | 2,406,386 |
Common Stocks - continued |
| Shares | | Value |
United States of America - continued |
Intuitive Surgical, Inc. (a) | 4,760 | | $ 2,580,967 |
Joy Global, Inc. | 46,030 | | 2,874,574 |
KLA-Tencor Corp. | 56,000 | | 2,605,120 |
Limited Brands, Inc. | 53,200 | | 2,547,748 |
Lorillard, Inc. | 23,903 | | 2,772,987 |
MasterCard, Inc. Class A | 5,700 | | 2,627,301 |
McGraw-Hill Companies, Inc. | 48,185 | | 2,663,667 |
Mead Johnson Nutrition Co. Class A | 40,758 | | 2,513,138 |
Mettler-Toledo International, Inc. (a) | 16,000 | | 2,709,920 |
Monsanto Co. | 26,138 | | 2,249,698 |
Moody's Corp. | 56,480 | | 2,720,077 |
National Oilwell Varco, Inc. | 35,050 | | 2,583,185 |
NIKE, Inc. Class B | 27,200 | | 2,485,536 |
Oceaneering International, Inc. | 45,700 | | 2,391,481 |
Oracle Corp. | 84,600 | | 2,626,830 |
Perrigo Co. | 22,779 | | 2,619,813 |
Philip Morris International, Inc. | 31,958 | | 2,830,200 |
QUALCOMM, Inc. | 41,900 | | 2,454,293 |
Rockwood Holdings, Inc. | 57,200 | | 2,625,480 |
SBA Communications Corp. Class A (a) | 42,100 | | 2,805,123 |
Starbucks Corp. | 53,500 | | 2,455,650 |
The Coca-Cola Co. | 65,600 | | 2,439,008 |
TJX Companies, Inc. | 57,015 | | 2,373,534 |
Union Pacific Corp. | 21,080 | | 2,593,472 |
Visa, Inc. Class A | 19,540 | | 2,711,370 |
Waters Corp. (a) | 32,600 | | 2,667,006 |
Yum! Brands, Inc. | 41,730 | | 2,925,690 |
TOTAL UNITED STATES OF AMERICA | | 116,537,198 |
TOTAL COMMON STOCKS (Cost $642,233,041) |
724,800,678
|
Nonconvertible Preferred Stocks - 0.6% |
| | | |
Germany - 0.6% |
Volkswagen AG
(Cost $3,298,287) | 21,800 | |
4,509,669
|
Money Market Funds - 0.6% |
| Shares | | Value |
Fidelity Securities Lending Cash Central Fund, 0.19% (b)(c)
(Cost $4,498,563) | 4,498,563 | | $ 4,498,563 |
TOTAL INVESTMENT PORTFOLIO - 100.5% (Cost $650,029,891) | 733,808,910 |
NET OTHER ASSETS (LIABILITIES) - (0.5)% | (3,293,955) |
NET ASSETS - 100% | $ 730,514,955 |
Legend |
(a) Non-income producing |
(b) Affiliated fund that is available only to investment companies and other accounts managed by Fidelity Investments. The rate quoted is the annualized seven-day yield of the fund at period end. A complete unaudited listing of the fund's holdings as of its most recent quarter end is available upon request. In addition, each Fidelity Central Fund's financial statements, which are not covered by the Fund's Report of Independent Registered Public Accounting Firm, are available on the SEC's website or upon request. |
(c) Investment made with cash collateral received from securities on loan. |
(d) Security or a portion of the security is on loan at period end. |
(e) Security exempt from registration under Rule 144A of the Securities Act of 1933. These securities may be resold in transactions exempt from registration, normally to qualified institutional buyers. At the end of the period, the value of these securities amounted to $2,875,009 or 0.4% of net assets. |
Affiliated Central Funds |
Information regarding fiscal year to date income earned by the Fund from investments in Fidelity Central Funds is as follows: |
Fund | Income earned |
Fidelity Cash Central Fund | $ 4,921 |
Fidelity Securities Lending Cash Central Fund | 239,091 |
Total | $ 244,012 |
Other Information |
Categorizations in the Schedule of Investments are based on country or territory of incorporation. |
The following is a summary of the inputs used, as of October 31, 2012, involving the Fund's assets and liabilities carried at fair value. The inputs or methodology used for valuing securities may not be an indication of the risk associated with investing in those securities. For more information on valuation inputs, and their aggregation into the levels used in the tables below, please refer to the Security Valuation section in the accompanying Notes to Financial Statements. |
Valuation Inputs at Reporting Date: |
Description | Total | Level 1 | Level 2 | Level 3 |
Investments in Securities: | | | | |
Equities: | | | | |
Consumer Discretionary | $ 141,892,403 | $ 141,672,768 | $ 219,635 | $ - |
Consumer Staples | 141,813,496 | 121,459,468 | 20,354,028 | - |
Energy | 24,884,171 | 24,884,171 | - | - |
Financials | 87,931,169 | 72,426,111 | 15,505,058 | - |
Health Care | 38,862,413 | 38,862,413 | - | - |
Industrials | 126,393,311 | 126,393,311 | - | - |
Information Technology | 79,534,393 | 70,130,164 | 9,404,229 | - |
Materials | 75,462,028 | 70,759,960 | 4,702,068 | - |
Telecommunication Services | 12,536,963 | 12,536,963 | - | - |
Money Market Funds | 4,498,563 | 4,498,563 | - | - |
Total Investments in Securities: | $ 733,808,910 | $ 683,623,892 | $ 50,185,018 | $ - |
The following is a summary of transfers between Level 1 and Level 2 for the period ended October 31, 2012. Transfers are assumed to have occurred at the beginning of the period, and are primarily attributable to the valuation techniques used for foreign equity securities, as discussed in the accompanying Notes to Financial Statements. |
Transfers | Total |
Level 1 to Level 2 | $ 0 |
Level 2 to Level 1 | $ 63,866,161 |
See accompanying notes which are an integral part of the financial statements.
Annual Report
Fidelity International Capital Appreciation Fund
Statement of Assets and Liabilities
| October 31, 2012 |
| | |
Assets | | |
Investment in securities, at value (including securities loaned of $4,348,416) - See accompanying schedule: Unaffiliated issuers (cost $645,531,328) | $ 729,310,347 | |
Fidelity Central Funds (cost $4,498,563) | 4,498,563 | |
Total Investments (cost $650,029,891) | | $ 733,808,910 |
Foreign currency held at value (cost $291,356) | | 292,579 |
Receivable for investments sold | | 9,953,063 |
Receivable for fund shares sold | | 905,757 |
Dividends receivable | | 1,659,020 |
Distributions receivable from Fidelity Central Funds | | 9,956 |
Other receivables | | 355,764 |
Total assets | | 746,985,049 |
| | |
Liabilities | | |
Payable to custodian bank | $ 203,203 | |
Payable for investments purchased | 9,597,204 | |
Payable for fund shares redeemed | 1,093,912 | |
Accrued management fee | 534,225 | |
Other affiliated payables | 168,242 | |
Other payables and accrued expenses | 374,745 | |
Collateral on securities loaned, at value | 4,498,563 | |
Total liabilities | | 16,470,094 |
| | |
Net Assets | | $ 730,514,955 |
Net Assets consist of: | | |
Paid in capital | | $ 782,772,613 |
Undistributed net investment income | | 6,291,641 |
Accumulated undistributed net realized gain (loss) on investments and foreign currency transactions | | (142,002,629) |
Net unrealized appreciation (depreciation) on investments and assets and liabilities in foreign currencies | | 83,453,330 |
Net Assets, for 55,694,391 shares outstanding | | $ 730,514,955 |
Net Asset Value, offering price and redemption price per share ($730,514,955 ÷ 55,694,391 shares) | | $ 13.12 |
Statement of Operations
| Year ended October 31, 2012 |
| | |
Investment Income | | |
Dividends | | $ 15,469,805 |
Interest | | 13,785 |
Income from Fidelity Central Funds | | 244,012 |
Income before foreign taxes withheld | | 15,727,602 |
Less foreign taxes withheld | | (1,170,699) |
Total income | | 14,556,903 |
| | |
Expenses | | |
Management fee
Basic fee | $ 4,681,875 | |
Performance adjustment | 1,100,288 | |
Transfer agent fees | 1,579,917 | |
Accounting and security lending fees | 329,261 | |
Custodian fees and expenses | 245,144 | |
Independent trustees' compensation | 4,313 | |
Registration fees | 40,862 | |
Audit | 81,524 | |
Legal | 3,265 | |
Interest | 605 | |
Miscellaneous | 6,273 | |
Total expenses before reductions | 8,073,327 | |
Expense reductions | (224,157) | 7,849,170 |
Net investment income (loss) | | 6,707,733 |
Realized and Unrealized Gain (Loss) Net realized gain (loss) on: | | |
Investment securities: | | |
Unaffiliated issuers | 2,762,262 | |
Foreign currency transactions | (605,090) | |
Total net realized gain (loss) | | 2,157,172 |
Change in net unrealized appreciation (depreciation) on: Investment securities (net of increase in deferred foreign taxes of $210,208) | 62,801,966 | |
Assets and liabilities in foreign currencies | 54,747 | |
Total change in net unrealized appreciation (depreciation) | | 62,856,713 |
Net gain (loss) | | 65,013,885 |
Net increase (decrease) in net assets resulting from operations | | $ 71,721,618 |
See accompanying notes which are an integral part of the financial statements.
Annual Report
Statement of Changes in Net Assets
| Year ended
October 31,
2012 | Year ended
October 31,
2011 |
Increase (Decrease) in Net Assets | | |
Operations | | |
Net investment income (loss) | $ 6,707,733 | $ 6,324,489 |
Net realized gain (loss) | 2,157,172 | 25,569,213 |
Change in net unrealized appreciation (depreciation) | 62,856,713 | (54,391,377) |
Net increase (decrease) in net assets resulting from operations | 71,721,618 | (22,497,675) |
Distributions to shareholders from net investment income | (5,617,060) | (7,380,589) |
Distributions to shareholders from net realized gain | (424,819) | (4,973,519) |
Total distributions | (6,041,879) | (12,354,108) |
Share transactions
Proceeds from sales of shares | 234,885,779 | 171,547,780 |
Reinvestment of distributions | 4,397,051 | 9,861,670 |
Cost of shares redeemed | (130,029,260) | (218,161,559) |
Net increase (decrease) in net assets resulting from share transactions | 109,253,570 | (36,752,109) |
Redemption fees | 13,254 | 43,769 |
Total increase (decrease) in net assets | 174,946,563 | (71,560,123) |
| | |
Net Assets | | |
Beginning of period | 555,568,392 | 627,128,515 |
End of period (including undistributed net investment income of $6,291,641 and undistributed net investment income of $5,512,022, respectively) | $ 730,514,955 | $ 555,568,392 |
Other Information Shares | | |
Sold | 19,239,728 | 13,689,530 |
Issued in reinvestment of distributions | 382,352 | 769,704 |
Redeemed | (10,649,285) | (17,394,486) |
Net increase (decrease) | 8,972,795 | (2,935,252) |
Financial Highlights
Years ended October 31, | 2012 | 2011 | 2010 | 2009 | 2008 |
Selected Per-Share Data | | | | | |
Net asset value, beginning of period | $ 11.89 | $ 12.63 | $ 10.78 | $ 7.42 | $ 19.30 |
Income from Investment Operations | | | | | |
Net investment income (loss)B | .12 | .13 E | .12 | .13 | .19 |
Net realized and unrealized gain (loss) | 1.24 | (.62) | 1.92 | 3.26 | (9.54) |
Total from investment operations | 1.36 | (.49) | 2.04 | 3.39 | (9.35) |
Distributions from net investment income | (.12) | (.15) | (.07) | (.03) | (.14) |
Distributions from net realized gain | (.01) | (.10) | (.12) | - | (2.39) |
Total distributions | (.13) | (.25) | (.19) | (.03) | (2.53) |
Redemption fees added to paid in capital B,G | - | - | - | - | - |
Net asset value, end of period | $ 13.12 | $ 11.89 | $ 12.63 | $ 10.78 | $ 7.42 |
Total ReturnA | 11.57% | (4.03)% | 19.12% | 45.95% | (55.30)% |
Ratios to Average Net AssetsC,F | | | | | |
Expenses before reductions | 1.22% | 1.16% | 1.04% | .84% | .89% |
Expenses net of fee waivers, if any | 1.22% | 1.16% | 1.04% | .84% | .89% |
Expenses net of all reductions | 1.19% | 1.09% | .87% | .72% | .72% |
Net investment income (loss) | 1.01% | 1.02%E | 1.07% | 1.49% | 1.39% |
Supplemental Data | | | | | |
Net assets, end of period (000 omitted) | $ 730,515 | $ 555,568 | $ 627,129 | $ 456,330 | $ 204,743 |
Portfolio turnover rateD | 127% | 254% | 480% | 387% | 387% |
A Total returns would have been lower if certain expenses had not been reduced during the applicable periods shown.
B Calculated based on average shares outstanding during the period.
C Fees and expenses of any underlying Fidelity Central Funds are not included in the Fund's expense ratio. The Fund indirectly bears its proportionate share of the expenses of any underlying Fidelity Central Funds.
D Amount does not include the portfolio activity of any underlying Fidelity Central Funds.
E Investment income per share reflects a large, non-recurring dividend which amounted to $.03 per share. Excluding this non-recurring dividend, the ratio of net investment income (loss) to average net assets would have been .78%.
F Expense ratios reflect operating expenses of the Fund. Expenses before reductions do not reflect amounts reimbursed by the investment adviser or reductions from brokerage service arrangements or reductions from other expense offset arrangements and do not represent the amount paid by the Fund during periods when reimbursements or reductions occur. Expenses net of fee waivers reflect expenses after reimbursement by the investment adviser but prior to reductions from brokerage service arrangements or other expense offset arrangements. Expenses net of all reductions represent the net expenses paid by the Fund.
G Amount represents less than $.01 per share.
See accompanying notes which are an integral part of the financial statements.
Annual Report
Fidelity International Capital Appreciation Fund
Notes to Financial Statements
For the period ended October 31, 2012
1. Organization.
Fidelity International Capital Appreciation Fund (the Fund) is a fund of Fidelity Investment Trust (the Trust) and is authorized to issue an unlimited number of shares. The Trust is registered under the Investment Company Act of 1940, as amended (the 1940 Act), as an open-end management investment company organized as a Massachusetts business trust. The Fund's investments in emerging markets can be subject to social, economic, regulatory, and political uncertainties and can be extremely volatile.
2. Investments in Fidelity Central Funds.
The Fund invests in Fidelity Central Funds, which are open-end investment companies available only to other investment companies and accounts managed by Fidelity Management & Research Company (FMR) and its affiliates. The Fund's Schedule of Investments lists each of the Fidelity Central Funds held as of period end, as an investment of the Fund, but does not include the underlying holdings of each Fidelity Central Fund. As an Investing Fund, the Fund indirectly bears its proportionate share of the expenses of the underlying Fidelity Central Funds.
The Money Market Central Funds seek preservation of capital and current income and are managed by Fidelity Investments Money Management, Inc. (FIMM), an affiliate of FMR.
A complete unaudited list of holdings for each Fidelity Central Fund is available upon request or at the Securities and Exchange Commission (the SEC) web site at www.sec.gov. In addition, the financial statements of the Fidelity Central Funds, which are not covered by the Fund's Report of Independent Registered Public Accounting Firm, are available on the SEC web site or upon request.
3. Significant Accounting Policies.
The financial statements have been prepared in conformity with accounting principles generally accepted in the United States of America (GAAP), which require management to make certain estimates and assumptions at the date of the financial statements. Actual results could differ from those estimates. Subsequent events, if any, through the date that the financial statements were issued have been evaluated in the preparation of the financial statements. The following summarizes the significant accounting policies of the Fund:
Security Valuation. Investments are valued as of 4:00 p.m. Eastern time on the last calendar day of the period. In accordance with valuation policies and procedures approved by the Board of Trustees (the Board), the Fund attempts to obtain prices from one or more third party pricing vendors or brokers to value its investments. When current market prices, quotations or rates are not readily available or reliable, securities will be fair valued in good faith by the FMR Fair Value Committee (the Committee), in accordance with procedures adopted by the Fund's Board. Factors used in determining fair value vary by security type and may include market or security specific events. The frequency with which these procedures are used cannot be predicted and they may be utilized to a significant extent. The Committee oversees the Fund's valuation policies and procedures and is responsible for approving and reporting to the Board all fair value determinations.
The Fund categorizes the inputs to valuation techniques used to value its investments into a disclosure hierarchy consisting of three levels as shown below:
Level 1 - quoted prices in active markets for identical investments
Level 2 - other significant observable inputs (including quoted prices for similar investments, interest rates, prepayment speeds, etc.)
Level 3 - unobservable inputs (including the Fund's own assumptions based on the best information available)
Valuation techniques used to value the Fund's investments by major category are as follows:
Equity securities, including restricted securities, for which market quotations are readily available, are valued at the last reported sale price or official closing price as reported by a third party pricing vendor on the primary market or exchange on which they are traded and are categorized as Level 1 in the hierarchy. In the event there were no sales during the day or closing prices are not available, securities are valued at the last quoted bid price or may be valued using the last available price and are generally categorized as Level 2 in the hierarchy. For foreign equity securities, when significant market or security specific events arise, comparisons to the valuation of American Depositary Receipts (ADRs), futures contracts, Exchange-Traded Funds (ETFs) and certain indexes as well as quoted prices for similar securities are used and are categorized as Level 2 in the hierarchy. Utilizing these techniques may result in transfers between Level 1 and Level 2. For restricted equity securities and private placements where observable inputs are limited, assumptions about market activity and risk are used and these securities are categorized as Level 3 in the hierarchy.
Investments in open-end mutual funds, including the Fidelity Central Funds, are valued at their closing net asset value (NAV) each business day and are categorized as Level 1 in the hierarchy.
Annual Report
3. Significant Accounting Policies - continued
Security Valuation - continued
Changes in valuation techniques may result in transfers in or out of an assigned level within the disclosure hierarchy. The aggregate value of investments by input level, as of October 31, 2012, including information on transfers between Levels 1 and 2, is included at the end of the Fund's Schedule of Investments.
Foreign Currency Translation. The Fund may use foreign currency contracts to facilitate transactions in foreign-denominated securities. Gains and losses from these transactions may arise from changes in the value of the foreign currency or if the counterparties do not perform under the contracts' terms.
Foreign-denominated assets, including investment securities, and liabilities are translated into U.S. dollars at the exchange rates at period end. Purchases and sales of investment securities, income and dividends received and expenses denominated in foreign currencies are translated into U.S. dollars at the exchange rate in effect on the transaction date.
The effects of exchange rate fluctuations on investments are included with the net realized and unrealized gain (loss) on investment securities. Other foreign currency transactions resulting in realized and unrealized gain (loss) are disclosed separately.
Investment Transactions and Income. For financial reporting purposes, the Fund's investment holdings and NAV include trades executed through the end of the last business day of the period. The NAV per share for processing shareholder transactions is calculated as of the close of business of the New York Stock Exchange (NYSE), normally 4:00 p.m. Eastern time and includes trades executed through the end of the prior business day. Gains and losses on securities sold are determined on the basis of identified cost and may include proceeds received from litigation. Dividend income is recorded on the ex-dividend date, except for certain dividends from foreign securities where the ex-dividend date may have passed, which are recorded as soon as the Fund is informed of the ex-dividend date. Non-cash dividends included in dividend income, if any, are recorded at the fair market value of the securities received. Distributions received on securities that represent a return of capital or capital gain are recorded as a reduction of cost of investments and/or as a realized gain. The Fund estimates the components of distributions received that may be considered return of capital distributions or capital gain distributions. Interest income and distributions from the Fidelity Central Funds are accrued as earned. Interest income includes coupon interest and amortization of premium and accretion of discount on debt securities. Investment income is recorded net of foreign taxes withheld where recovery of such taxes is uncertain.
Expenses. Expenses directly attributable to a fund are charged to that fund. Expenses attributable to more than one fund are allocated among the respective funds on the basis of relative net assets or other appropriate methods. Expense estimates are accrued in the period to which they relate and adjustments are made when actual amounts are known.
Income Tax Information and Distributions to Shareholders. Each year, the Fund intends to qualify as a regulated investment company under Subchapter M of the Internal Revenue Code, including distributing substantially all of its taxable income and realized gains. As a result, no provision for income taxes is required. As of October 31, 2012, the Fund did not have any unrecognized tax benefits in the financial statements; nor is the Fund aware of any tax positions for which it is reasonably possible that the total amounts of unrecognized tax benefits will significantly change in the next twelve months. The Fund files a U.S. federal tax return, in addition to state and local tax returns as required. A fund's federal income tax returns are subject to examination by the Internal Revenue Service (IRS) for a period of three fiscal years after they are filed. State and local tax returns may be subject to examination for an additional fiscal year depending on the jurisdiction. Foreign taxes are provided for based on the Fund's understanding of the tax rules and rates that exist in the foreign markets in which it invests. The Fund is subject to a tax imposed on capital gains by certain countries in which it invests. An estimated deferred tax liability for net unrealized appreciation on the applicable securities is included in Other payables and accrued expenses on the Statement of Assets & Liabilities.
Distributions are declared and recorded on the ex-dividend date. Income and capital gain distributions are determined in accordance with income tax regulations, which may differ from GAAP.
Capital accounts within the financial statements are adjusted for permanent book-tax differences. These adjustments have no impact on net assets or the results of operations. Temporary book-tax differences will reverse in a subsequent period.
Book-tax differences are primarily due to foreign currency transactions, passive foreign investment companies (PFIC), equity-debt classifications, deferred trustees compensation, capital loss carryforwards and losses deferred due to wash sales.
Annual Report
Fidelity International Capital Appreciation Fund
Notes to Financial Statements - continued
3. Significant Accounting Policies - continued
Income Tax Information and Distributions to Shareholders - continued
The federal tax cost of investment securities and unrealized appreciation (depreciation) as of period end were as follows:
Gross unrealized appreciation | $ 92,462,364 |
Gross unrealized depreciation | (14,222,349) |
Net unrealized appreciation (depreciation) on securities and other investments | $ 78,240,015 |
| |
Tax Cost | $ 655,568,895 |
The tax-based components of distributable earnings as of period end were as follows:
Undistributed ordinary income | $ 6,291,654 |
Capital loss carryforward | $ (136,463,626) |
Net unrealized appreciation (depreciation) | $ 78,178,856 |
Capital loss carryforwards are only available to offset future capital gains of the Fund to the extent provided by regulations and may be limited. Under the Regulated Investment Company Modernization Act of 2010 (the Act), the Fund is permitted to carry forward capital losses incurred in taxable years beginning after December 22, 2010 for an unlimited period and such capital losses are required to be used prior to any losses that expire. Capital loss carryforwards were as follows:
Fiscal year of expiration | |
| |
2016 | $ (107,720,846) |
2017 | (28,474,110) |
Total with expiration | (136,194,956) |
No expiration | |
Short-term | (268,670) |
Long-term | (-) |
Total no expiration | (268,670) |
Total capital loss carryforward | $ (136,463,626) |
The tax character of distributions paid was as follows:
| October 31, 2012 | October 31, 2011 |
Ordinary Income | $ 6,041,879 | $ 12,354,108 |
Short-Term Trading (Redemption) Fees. Shares held by investors in the Fund less than 30 days are subject to a redemption fee equal to 1.00% of the net asset value of shares redeemed. All redemption fees, which reduce the proceeds of the shareholder redemption, are retained by the Fund and accounted for as an addition to paid in capital.
Restricted Securities. The Fund may invest in securities that are subject to legal or contractual restrictions on resale. These securities generally may be resold in transactions exempt from registration or to the public if the securities are registered. Disposal of these securities may involve time-consuming negotiations and expense, and prompt sale at an acceptable price may be difficult. Information regarding restricted securities is included at the end of the Fund's Schedule of Investments.
New Accounting Pronouncement. In December 2011, the Financial Accounting Standards Board issued Accounting Standard Update No. 2011-11, Disclosures about Offsetting Assets and Liabilities. The update creates new disclosure requirements requiring entities to disclose both gross and net information for derivatives and other financial instruments that are either offset in the Statement of Assets and Liabilities or subject to an enforceable master netting arrangement or similar agreement. The disclosure requirements are effective for annual reporting periods beginning on or after January 1, 2013, and interim periods within those annual periods. Management is currently evaluating the impact of the update's adoption on the Fund's financial statement disclosures.
4. Purchases and Sales of Investments.
Purchases and sales of securities, other than short-term securities, aggregated $955,909,372 and $835,057,626, respectively.
Annual Report
5. Fees and Other Transactions with Affiliates.
Management Fee. FMR and its affiliates provide the Fund with investment management related services for which the Fund pays a monthly management fee. The management fee is the sum of an individual fund fee rate that is based on an annual rate of .45% of the Fund's average net assets and an annualized group fee rate that averaged .26% during the period. The group fee rate is based upon the average net assets of all the mutual funds advised by FMR. The group fee rate decreases as assets under management increase and increases as assets under management decrease. In addition, the management fee is subject to a performance adjustment (up to a maximum of ± .20% of the Fund's average net assets over a 36 month performance period). The upward or downward adjustment to the management fee is based on the Fund's relative investment performance as compared to an appropriate benchmark index. For the period, the total annual management fee rate, including the performance adjustment, was .87% of the Fund's average net assets.
Transfer Agent Fees. Fidelity Investments Institutional Operations Company, Inc. (FIIOC), an affiliate of FMR, is the Fund's transfer, dividend disbursing and shareholder servicing agent. FIIOC receives account fees and asset-based fees that vary according to account size and type of account. FIIOC pays for typesetting, printing and mailing of shareholder reports, except proxy statements. For the period, the transfer agent fees were equivalent to an annual rate of .24% of average net assets.
Accounting and Security Lending Fees. Fidelity Service Company, Inc. (FSC), an affiliate of FMR, maintains the Fund's accounting records. The accounting fee is based on the level of average net assets for each month. Under a separate contract, FSC administers the security lending program. The security lending fee is based on the number and duration of lending transactions.
Brokerage Commissions. The Fund placed a portion of its portfolio transactions with brokerage firms which are affiliates of the investment adviser. The commissions paid to these affiliated firms were $4,393 for the period.
Interfund Lending Program. Pursuant to an Exemptive Order issued by the SEC, the Fund, along with other registered investment companies having management contracts with FMR, may participate in an interfund lending program. This program provides an alternative credit facility allowing the funds to borrow from, or lend money to, other participating affiliated funds. At period end, there were no interfund loans outstanding. The Fund's activity in this program during the period for which loans were outstanding was as follows:
Borrower or Lender | Average Loan
Balance | Weighted Average Interest Rate | Interest
Expense |
Borrower | $ 4,667,636 | .42% | $ 605 |
6. Committed Line of Credit.
The Fund participates with other funds managed by FMR or an affiliate in a $4.25 billion credit facility (the "line of credit") to be utilized for temporary or emergency purposes to fund shareholder redemptions or for other short-term liquidity purposes. The Fund has agreed to pay commitment fees on its pro-rata portion of the line of credit, which amounted to $1,756 and is reflected in Miscellaneous expenses on the Statement of Operations. During the period, there were no borrowings on this line of credit.
7. Security Lending.
The Fund lends portfolio securities through a lending agent from time to time in order to earn additional income. For equity securities, a lending agent is used and may loan securities to certain qualified borrowers, including Fidelity Capital Markets (FCM), a broker-dealer affiliated with the Fund. On the settlement date of the loan, the Fund receives collateral (in the form of U.S. Treasury obligations, letters of credit and/or cash) against the loaned securities and maintains collateral in an amount not less than 100% of the market value of the loaned securities during the period of the loan. The market value of the loaned securities is determined at the close of business of the Fund and any additional required collateral is delivered to the Fund on the next business day. If the borrower defaults on its obligation to return the securities loaned because of insolvency or other reasons, a fund could experience delays and costs in recovering the securities loaned or in gaining access to the collateral. Any cash collateral received is invested in the Fidelity Securities Lending Cash Central Fund. The value of loaned securities and cash collateral at period end are disclosed on the Fund's Statement of Assets and Liabilities. Security lending income represents the income earned on investing cash collateral, less rebates paid to borrowers and any lending agent fees associated with the loan, plus any premium payments received for lending certain types of securities. Security lending income is presented in the Statement of Operations as a component of income from Fidelity Central Funds. Total security lending income during the period amounted to $239,091. During the period, there were no securities loaned to FCM.
8. Expense Reductions.
Many of the brokers with whom FMR places trades on behalf of the Fund provided services to the Fund in addition to trade execution. These services included payments of certain expenses on behalf of the Fund totaling $224,157 for the period.
Annual Report
Fidelity International Capital Appreciation Fund
Notes to Financial Statements - continued
9. Other.
The Fund's organizational documents provide former and current trustees and officers with a limited indemnification against liabilities arising in connection with the performance of their duties to the Fund. In the normal course of business, the Fund may also enter into contracts that provide general indemnifications. The Fund's maximum exposure under these arrangements is unknown as this would be dependent on future claims that may be made against the Fund. The risk of material loss from such claims is considered remote.
At the end of the period, VIP FundsManager 60% Portfolio was the owner of record of approximately 10% of the total outstanding shares of the Fund. Mutual Funds managed by FMR or its affiliates, were the owners of record, in aggregate, of approximately 31% of the total outstanding shares of the Fund.
Annual Report
Report of Independent Registered Public Accounting Firm
To the Trustees of Fidelity Investment Trust and Shareholders of Fidelity International Capital Appreciation Fund:
We have audited the accompanying statement of assets and liabilities of Fidelity International Capital Appreciation Fund (the Fund), a fund of Fidelity Investment Trust, including the schedule of investments, as of October 31, 2012, and the related statement of operations for the year then ended, the statement of changes in net assets for each of the two years in the period then ended, and the financial highlights for each of the five years in the period then ended. These financial statements and financial highlights are the responsibility of the Fund's management. Our responsibility is to express an opinion on these financial statements and financial highlights based on our audits.
We conducted our audits in accordance with the standards of the Public Company Accounting Oversight Board (United States). Those standards require that we plan and perform the audit to obtain reasonable assurance about whether the financial statements and financial highlights are free of material misstatement. The Fund is not required to have, nor were we engaged to perform, an audit of its internal control over financial reporting. Our audits included consideration of internal control over financial reporting as a basis for designing audit procedures that are appropriate in the circumstances, but not for the purpose of expressing an opinion on the effectiveness of the Fund's internal control over financial reporting. Accordingly, we express no such opinion. An audit also includes examining, on a test basis, evidence supporting the amounts and disclosures in the financial statements, assessing the accounting principles used and significant estimates made by management, as well as evaluating the overall financial statement presentation. Our procedures included confirmation of securities owned as of October 31, 2012, by correspondence with the custodians and brokers; where replies were not received from brokers, we performed other auditing procedures. We believe that our audits provide a reasonable basis for our opinion.
In our opinion, the financial statements and financial highlights referred to above present fairly, in all material respects, the financial position of Fidelity International Capital Appreciation Fund as of October 31, 2012, the results of its operations for the year then ended, the changes in its net assets for each of the two years in the period then ended, and the financial highlights for each of the five years in the period then ended, in conformity with accounting principles generally accepted in the United States of America.
DELOITTE & TOUCHE LLP
Boston, Massachusetts
December 14, 2012
Annual Report
Fidelity Overseas Fund
As a shareholder of the Fund, you incur two types of costs: (1) transaction costs, including redemption fees and (2) ongoing costs, including management fees and other Fund expenses. This Example is intended to help you understand your ongoing costs (in dollars) of investing in the Fund and to compare these costs with the ongoing costs of investing in other mutual funds.
The Example is based on an investment of $1,000 invested at the beginning of the period and held for the entire period (May 1, 2012 to October 31, 2012).
Actual Expenses
The first line of the accompanying table for each class of the Fund provides information about actual account values and actual expenses. You may use the information in this line, together with the amount you invested, to estimate the expenses that you paid over the period. Simply divide your account value by $1,000.00 (for example, an $8,600 account value divided by $1,000.00 = 8.6), then multiply the result by the number in the first line for a class of the Fund under the heading entitled "Expenses Paid During Period" to estimate the expenses you paid on your account during this period. A small balance maintenance fee of $12.00 that is charged once a year may apply for certain accounts with a value of less than $2,000. This fee is not included in the table below. If it was, the estimate of expenses you paid during the period would be higher, and your ending account value lower, by this amount. In addition, the Fund, as a shareholder in the underlying Fidelity Central Funds, will indirectly bear its pro-rata share of the fees and expenses incurred by the underlying Fidelity Central Funds. These fees and expenses are not included in the Fund's annualized expense ratio used to calculate the expense estimate in the table below.
Hypothetical Example for Comparison Purposes
The second line of the accompanying table for each class of the Fund provides information about hypothetical account values and hypothetical expenses based on a Class' actual expense ratio and an assumed rate of return of 5% per year before expenses, which is not the Class' actual return. The hypothetical account values and expenses may not be used to estimate the actual ending account balance or expenses you paid for the period. You may use this information to compare the ongoing costs of investing in the Fund and other funds. To do so, compare this 5% hypothetical example with the 5% hypothetical examples that appear in the shareholder reports of the other funds. A small balance maintenance fee of $12.00 that is charged once a year may apply for certain accounts with a value of less than $2,000. This fee is not included in the table below. If it was, the estimate of expenses you paid during the period would be higher, and your ending account value lower, by this amount. In addition, the Fund, as a shareholder in the underlying Fidelity Central Funds, will indirectly bear its pro-rata share of the fees and expenses incurred by the underlying Fidelity Central Funds. These fees and expenses are not included in the Fund's annualized expense ratio used to calculate the expense estimate in the table below.
Please note that the expenses shown in the table are meant to highlight your ongoing costs only and do not reflect any transaction costs. Therefore, the second line of the table is useful in comparing ongoing costs only, and will not help you determine the relative total costs of owning different funds. In addition, if these transactional costs were included, your costs would have been higher.
| Annualized Expense Ratio | Beginning
Account Value
May 1, 2012 | Ending
Account Value
October 31, 2012 | Expenses Paid
During Period*
May 1, 2012 to October 31, 2012 |
Overseas | .87% | | | |
Actual | | $ 1,000.00 | $ 1,034.30 | $ 4.45 |
HypotheticalA | | $ 1,000.00 | $ 1,020.76 | $ 4.42 |
Class K | .71% | | | |
Actual | | $ 1,000.00 | $ 1,035.40 | $ 3.63 |
HypotheticalA | | $ 1,000.00 | $ 1,021.57 | $ 3.61 |
A 5% return per year before expenses
* Expenses are equal to each Class' annualized expense ratio, multiplied by the average account value over the period, multiplied by 184/366 (to reflect the one-half year period).
Annual Report
Fidelity Overseas Fund
Performance: The Bottom Line
Average annual total return reflects the change in the value of an investment, assuming reinvestment of the class' distributions from dividend income and capital gains (the profits earned upon the sale of securities that have grown in value, if any) and assuming a constant rate of performance each year. The $10,000 table and the fund's returns do not reflect the deduction of taxes that a shareholder would pay on fund distributions or the redemption of fund shares. During periods of reimbursement by Fidelity, a fund's total return will be greater than it would be had the reimbursement not occurred. How a fund did yesterday is no guarantee of how it will do tomorrow.
Average Annual Total Returns
Periods ended October 31, 2012 | Past 1
year | Past 5
years | Past 10
years |
Fidelity Overseas Fund | 10.37% | -8.15% | 7.09% |
$10,000 Over 10 Years
Let's say hypothetically that $10,000 was invested in Fidelity Overseas Fund, a class of the fund, on October 31, 2002. The chart shows how the value of your investment would have changed, and also shows how the MSCI EAFE Index performed over the same period.
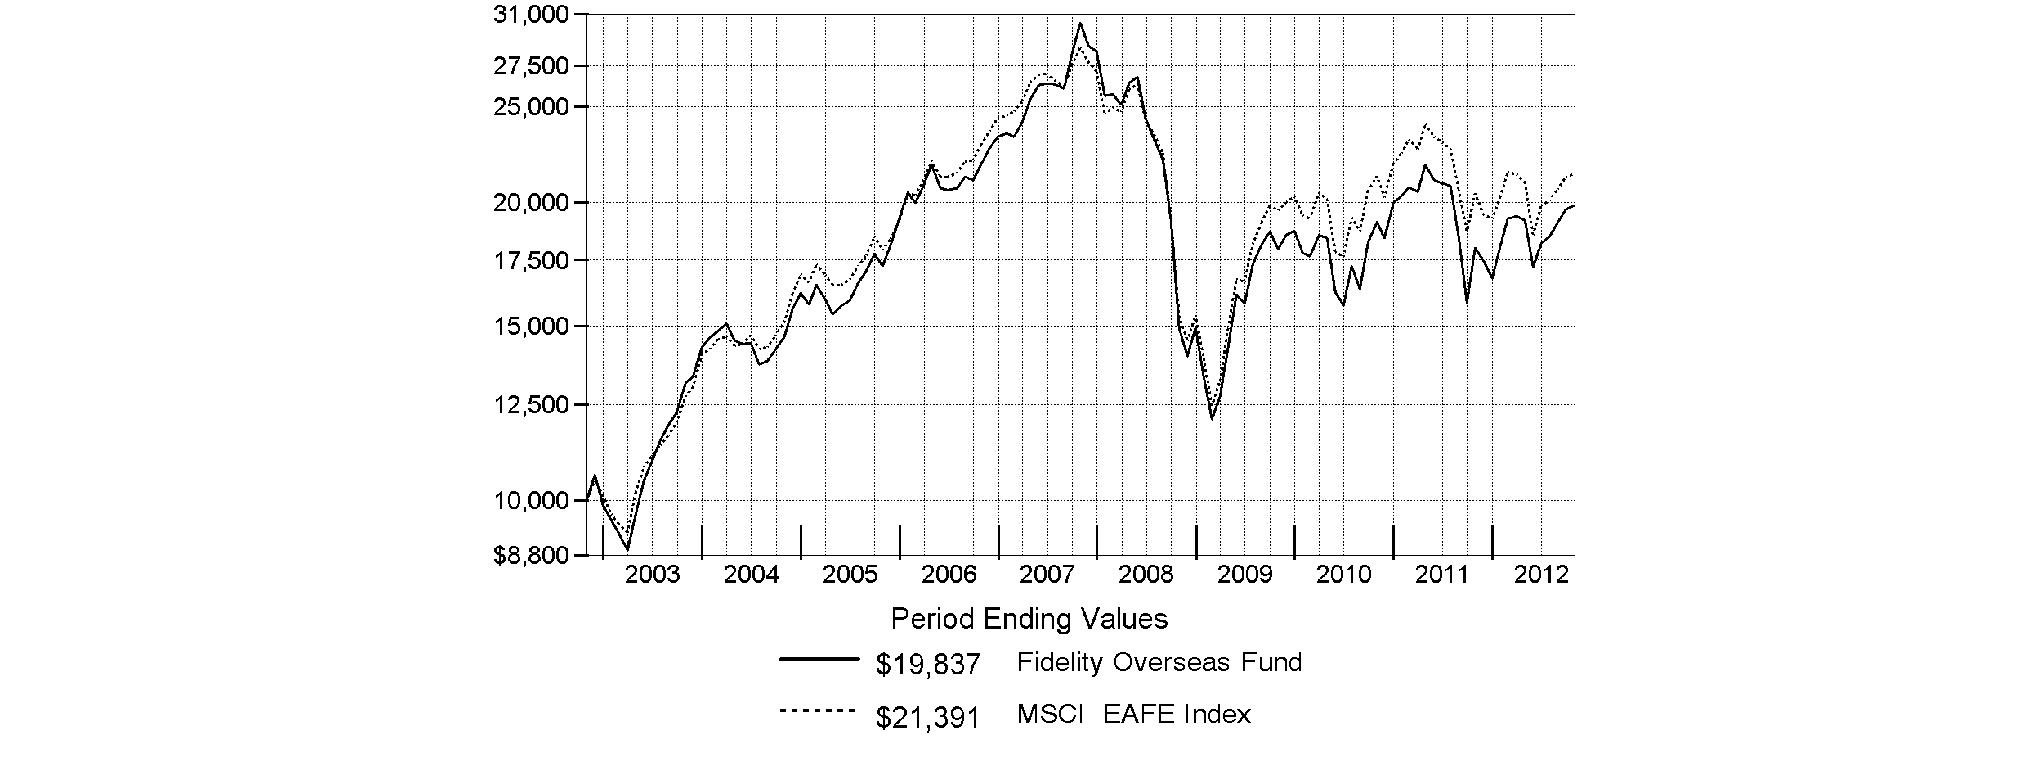
Annual Report
Fidelity Overseas Fund
Market Recap: Returns for most domestic and international equities fluctuated during the 12 months ending October 31, 2012, as investor sentiment towards risk vacillated amid a changing global economic landscape. U.S. stocks overcame bouts of volatility to post strong gains for the past year, extending an uptrend that began in March 2009. The broad-based S&P 500® Index advanced 15.21%, while the blue-chip-laden Dow Jones Industrial AverageSM and technology-heavy Nasdaq Composite® Index rose 12.56% and 12.21%, respectively. Performance outside of the U.S. was relatively weak, as the MSCI® ACWI® (All Country World Index) ex USA Index rose 4.11%, hampered in part by a stronger U.S. dollar. International developed-markets generally struggled during the period as macroeconomic concerns ebbed and flowed, finishing with only a modest gain. The MSCI® EAFE® Index rose 4.76% for the year, largely buttressed in the summertime by pledges of accommodative monetary action from eurozone officials, as well as signs that the U.S. housing market was on the mend. Within the index, Asia-Pacific ex Japan showed the most impressive gain, advancing roughly 10%. A number of core European components, including Germany (+11%) and Switzerland (+10%), and the U.K. (+9%), benefited from optimism about the eurozone's ability to resolve its debt woes, which helped the region outpace the index overall. Elsewhere, Japan was among the few benchmark constituents to finish in the red, returning about -3%. Emerging-markets stocks gained 2.98% for the year, as measured by the MSCI Emerging Markets Index. A general uptrend in the final five months of the period lifted the index into positive territory for the full 12 months.
Comments from Vincent Montemaggiore, who became Portfolio Manager of Fidelity® Overseas Fund on January 12, 2012: For the year, the fund's Retail Class shares returned 10.37%, well ahead of the 4.76% gain of the MSCI® EAFE® Index. Versus the index, the fund was particularly helped by stock selection in consumer staples, materials and industrials, and by a sizable overweighting in the strong-performing food, beverage and tobacco segment of consumer staples. Geographically, the fund was aided by solid picks in France, the United Kingdom and Mexico, as well as positioning in Japan and an overweighting in Germany. An out-of-benchmark stake in Mexican cement/building materials producer CEMEX was the fund's top contributor. CEMEX started to outperform soon after I began managing the fund, and I took this opportunity to exit the position. A large overweighting in French spirits maker Pernod Ricard also lifted performance, as did a non-index position in Calbee, a Japanese manufacturer of potato chips. Conversely, the largest relative detractor was Japanese automaker Mazda Motor, which I sold shortly after taking over the fund. An overweighted stake in French consumer goods producer Christian Dior also detracted.
The views expressed above reflect those of the portfolio manager(s) only through the end of the period as stated on the cover of this report and do not necessarily represent the views of Fidelity or any other person in the Fidelity organization. Any such views are subject to change at any time based upon market or other conditions and Fidelity disclaims any responsibility to update such views. These views may not be relied on as investment advice and, because investment decisions for a Fidelity fund are based on numerous factors, may not be relied on as an indication of trading intent on behalf of any Fidelity fund.
Annual Report
Fidelity Overseas Fund
Investment Changes (Unaudited)
Geographic Diversification (% of fund's net assets) |
As of October 31, 2012 |
| United Kingdom | 26.7% | |
| Japan | 14.6% | |
| Germany | 14.1% | |
| France | 8.9% | |
| Switzerland | 8.9% | |
| United States of America | 5.6% | |
| Sweden | 3.2% | |
| Australia | 3.0% | |
| Italy | 2.7% | |
| Other | 12.3% | |

Percentages are based on country or territory of incorporation and are adjusted for the effect of futures contracts, if applicable. |
As of April 30, 2012 |
| United Kingdom | 28.6% | |
| Japan | 14.6% | |
| Germany | 13.3% | |
| France | 11.1% | |
| Switzerland | 8.6% | |
| Italy | 3.5% | |
| Australia | 3.0% | |
| United States of America | 2.5% | |
| Sweden | 2.3% | |
| Other | 12.5% | |

Percentages are based on country or territory of incorporation and are adjusted for the effect of futures contracts, if applicable. |
Asset Allocation |
| % of fund's
net assets | % of fund's net assets
6 months ago |
Stocks | 97.7 | 98.5 |
Short-Term Investments and Net Other Assets (Liabilities) | 2.3 | 1.5 |
Top Ten Stocks as of October 31, 2012 |
| % of fund's
net assets | % of fund's net assets
6 months ago |
Nestle SA (Switzerland, Food Products) | 2.8 | 2.6 |
Royal Dutch Shell PLC Class A (United Kingdom) (United Kingdom, Oil, Gas & Consumable Fuels) | 2.5 | 2.8 |
Roche Holding AG (participation certificate) (Switzerland, Pharmaceuticals) | 2.0 | 1.8 |
Sanofi SA (France, Pharmaceuticals) | 1.9 | 1.6 |
Vodafone Group PLC (United Kingdom, Wireless Telecommunication Services) | 1.8 | 2.1 |
GlaxoSmithKline PLC (United Kingdom, Pharmaceuticals) | 1.8 | 1.9 |
Diageo PLC (United Kingdom, Beverages) | 1.6 | 1.3 |
British American Tobacco PLC (United Kingdom) (United Kingdom, Tobacco) | 1.5 | 1.7 |
Bayer AG (Germany, Pharmaceuticals) | 1.5 | 1.2 |
Anheuser-Busch InBev SA NV (Belgium, Beverages) | 1.5 | 1.2 |
| 18.9 | |
Market Sectors as of October 31, 2012 |
| % of fund's
net assets | % of fund's net assets
6 months ago |
Consumer Staples | 15.5 | 16.7 |
Financials | 14.9 | 14.2 |
Consumer Discretionary | 14.8 | 14.3 |
Industrials | 14.6 | 16.3 |
Health Care | 11.5 | 9.7 |
Materials | 10.0 | 10.5 |
Information Technology | 7.3 | 7.4 |
Energy | 6.1 | 6.5 |
Telecommunication Services | 3.0 | 2.9 |
Annual Report
Fidelity Overseas Fund
Investments October 31, 2012
Showing Percentage of Net Assets
Common Stocks - 95.2% |
| Shares | | Value |
Australia - 3.0% |
Australia & New Zealand Banking Group Ltd. | 1,001,167 | | $ 26,449,203 |
BHP Billiton Ltd. | 625,052 | | 22,130,245 |
Orica Ltd. | 327,401 | | 8,537,248 |
TOTAL AUSTRALIA | | 57,116,696 |
Bailiwick of Jersey - 1.7% |
Experian PLC | 957,900 | | 16,540,179 |
WPP PLC | 1,266,133 | | 16,365,127 |
TOTAL BAILIWICK OF JERSEY | | 32,905,306 |
Belgium - 1.5% |
Anheuser-Busch InBev SA NV | 338,012 | | 28,268,335 |
Brazil - 0.3% |
Qualicorp SA (a) | 513,000 | | 5,263,740 |
Canada - 0.3% |
Constellation Software, Inc. | 49,300 | | 5,654,877 |
Cayman Islands - 0.7% |
China Medical System Holdings Ltd. | 6,358,875 | | 3,667,611 |
Lifestyle International Holdings Ltd. | 1,306,500 | | 2,791,677 |
Shenzhou International Group Holdings Ltd. | 3,194,000 | | 6,223,108 |
TOTAL CAYMAN ISLANDS | | 12,682,396 |
Denmark - 1.1% |
Novo Nordisk A/S Series B | 137,200 | | 21,995,289 |
Finland - 0.5% |
Nokian Tyres PLC | 210,600 | | 8,735,014 |
France - 8.9% |
ALTEN | 155,300 | | 4,884,353 |
BNP Paribas SA | 294,071 | | 14,792,825 |
Bureau Veritas SA | 141,100 | | 14,983,913 |
Christian Dior SA | 106,197 | | 15,244,432 |
Eurofins Scientific SA | 73,500 | | 11,365,356 |
Ipsos SA | 272,657 | | 9,580,793 |
JCDecaux SA | 311,500 | | 6,593,249 |
Pernod Ricard SA | 149,524 | | 16,091,673 |
PPR SA | 95,400 | | 16,773,490 |
Sanofi SA | 417,284 | | 36,649,000 |
VINCI SA | 232,900 | | 10,307,465 |
Vivendi SA | 586,264 | | 11,994,802 |
TOTAL FRANCE | | 169,261,351 |
Germany - 11.6% |
adidas AG | 187,200 | | 15,948,680 |
Allianz AG | 135,843 | | 16,843,134 |
BASF AG | 278,346 | | 23,064,548 |
Bayer AG | 332,097 | | 28,921,769 |
Bayerische Motoren Werke AG (BMW) | 148,773 | | 11,849,534 |
Brenntag AG | 125,900 | | 15,868,137 |
Deutsche Boerse AG | 187,492 | | 10,148,422 |
Deutsche Post AG | 757,816 | | 15,023,410 |
|
| Shares | | Value |
Fresenius SE & Co. KGaA | 161,500 | | $ 18,420,884 |
GEA Group AG | 323,522 | | 10,101,733 |
Linde AG | 88,707 | | 14,918,341 |
Pfeiffer Vacuum Technology AG | 58,589 | | 5,976,488 |
SAP AG | 339,871 | | 24,784,430 |
Software AG (Bearer) | 226,100 | | 9,058,470 |
TOTAL GERMANY | | 220,927,980 |
Greece - 0.1% |
Metka SA | 219,083 | | 1,990,591 |
Hong Kong - 0.1% |
City Telecom (HK) Ltd. (CTI) | 7,267,000 | | 1,666,537 |
Ireland - 1.8% |
Accenture PLC Class A | 136,200 | | 9,181,242 |
DCC PLC (Ireland) | 389,100 | | 11,117,998 |
Kerry Group PLC Class A | 260,664 | | 13,639,394 |
TOTAL IRELAND | | 33,938,634 |
Italy - 2.7% |
ENI SpA | 999,600 | | 23,001,723 |
Pirelli & C SpA (d) | 714,300 | | 8,272,380 |
Prysmian SpA | 510,200 | | 9,813,629 |
Saipem SpA | 249,473 | | 11,207,465 |
TOTAL ITALY | | 52,295,197 |
Japan - 14.6% |
ABC-Mart, Inc. | 303,200 | | 13,293,248 |
Air Water, Inc. | 629,000 | | 7,879,243 |
Aozora Bank Ltd. | 2,574,000 | | 7,254,791 |
Asahi Group Holdings | 311,200 | | 7,090,978 |
Credit Saison Co. Ltd. | 324,000 | | 7,114,769 |
Daito Trust Construction Co. Ltd. | 92,300 | | 9,319,028 |
Don Quijote Co. Ltd. | 203,800 | | 8,028,949 |
Fanuc Corp. | 100,100 | | 15,937,254 |
Fast Retailing Co. Ltd. | 30,800 | | 6,859,877 |
GMO Internet, Inc. | 574,800 | | 4,017,768 |
Hitachi Ltd. | 2,750,000 | | 14,571,590 |
Honda Motor Co. Ltd. sponsored ADR | 571,700 | | 17,242,472 |
Hoya Corp. | 487,700 | | 9,872,519 |
Japan Tobacco, Inc. | 571,500 | | 15,792,672 |
JSR Corp. | 344,300 | | 5,900,068 |
Kansai Paint Co. Ltd. | 638,000 | | 6,865,113 |
Keyence Corp. | 51,890 | | 13,767,133 |
Misumi Group, Inc. | 233,500 | | 5,730,007 |
Mitsubishi Corp. | 137,200 | | 2,449,079 |
Nakanishi, Inc. | 34,300 | | 3,738,068 |
Nitori Holdings Co. Ltd. | 64,000 | | 5,227,108 |
NuFlare Technology, Inc. | 458 | | 3,482,475 |
Obic Co. Ltd. | 25,590 | | 5,266,738 |
ORIX Corp. | 142,310 | | 14,617,838 |
Rakuten, Inc. | 1,019,000 | | 9,165,001 |
Seven Bank Ltd. | 4,241,900 | | 12,115,160 |
Shinsei Bank Ltd. | 5,435,000 | | 7,965,614 |
Ship Healthcare Holdings, Inc. | 179,600 | | 5,991,166 |
Common Stocks - continued |
| Shares | | Value |
Japan - continued |
SMC Corp. | 62,400 | | $ 9,833,296 |
Unicharm Corp. | 171,400 | | 9,275,310 |
USS Co. Ltd. | 114,590 | | 12,043,218 |
TOTAL JAPAN | | 277,707,550 |
Netherlands - 1.0% |
AEGON NV | 1,186,993 | | 6,638,444 |
Akzo Nobel NV | 229,175 | | 12,466,986 |
TOTAL NETHERLANDS | | 19,105,430 |
Norway - 1.2% |
DnB NOR ASA | 1,114,600 | | 13,919,548 |
Telenor ASA | 448,400 | | 8,816,523 |
TOTAL NORWAY | | 22,736,071 |
South Africa - 0.3% |
Coronation Fund Managers Ltd. | 1,665,500 | | 6,425,236 |
Spain - 1.7% |
Amadeus IT Holding SA Class A | 614,400 | | 15,210,372 |
Banco Bilbao Vizcaya Argentaria SA | 653,621 | | 5,461,628 |
Inditex SA | 99,960 | | 12,754,197 |
TOTAL SPAIN | | 33,426,197 |
Sweden - 3.2% |
ASSA ABLOY AB (B Shares) | 374,200 | | 12,473,521 |
Atlas Copco AB (A Shares) | 538,600 | | 13,243,930 |
Nordea Bank AB | 1,256,000 | | 11,408,886 |
Svenska Handelsbanken AB (A Shares) | 418,500 | | 14,335,087 |
Swedbank AB (A Shares) | 536,100 | | 9,941,398 |
TOTAL SWEDEN | | 61,402,822 |
Switzerland - 8.9% |
Aryzta AG | 307,320 | | 15,344,551 |
Nestle SA | 823,845 | | 52,280,939 |
Roche Holding AG (participation certificate) | 197,550 | | 37,991,200 |
Schindler Holding AG (participation certificate) | 91,154 | | 12,009,659 |
Syngenta AG (Switzerland) | 44,730 | | 17,439,759 |
UBS AG | 1,268,663 | | 19,034,505 |
Zurich Financial Services AG | 60,037 | | 14,794,901 |
TOTAL SWITZERLAND | | 168,895,514 |
United Kingdom - 26.7% |
AMEC PLC | 655,450 | | 11,211,964 |
Anglo American PLC (United Kingdom) | 400,100 | | 12,286,936 |
Ashmore Group PLC | 1,712,800 | | 10,052,781 |
Babcock International Group PLC | 776,000 | | 12,247,201 |
Barclays PLC | 3,259,690 | | 12,053,470 |
BHP Billiton PLC | 736,867 | | 23,617,513 |
BP PLC | 944,300 | | 6,743,818 |
|
| Shares | | Value |
British American Tobacco PLC (United Kingdom) | 587,500 | | $ 29,139,771 |
Bunzl PLC | 615,207 | | 10,176,101 |
Diageo PLC | 1,045,980 | | 29,903,033 |
Domino Printing Sciences PLC | 852,314 | | 7,454,786 |
Elementis PLC | 2,208,000 | | 7,457,694 |
GlaxoSmithKline PLC | 1,547,000 | | 34,664,349 |
IMI PLC | 658,500 | | 10,143,036 |
Johnson Matthey PLC | 257,900 | | 9,360,026 |
Kingfisher PLC | 2,438,561 | | 11,392,485 |
London Stock Exchange Group PLC | 409,300 | | 6,443,254 |
Meggitt PLC | 2,255,900 | | 14,052,170 |
Next PLC | 296,500 | | 17,062,485 |
Reckitt Benckiser Group PLC | 396,600 | | 24,000,497 |
Reed Elsevier PLC | 1,207,000 | | 11,803,645 |
Rolls-Royce Group PLC | 1,011,606 | | 13,949,535 |
Rolls-Royce Group PLC Class C | 76,882,056 | | 124,068 |
Rotork PLC | 264,300 | | 9,715,992 |
Royal Dutch Shell PLC: | | | |
Class A (United Kingdom) | 1,372,203 | | 47,084,057 |
Class B (United Kingdom) | 235,419 | | 8,327,344 |
SABMiller PLC | 369,500 | | 15,828,269 |
Sage Group PLC | 1,739,400 | | 8,721,215 |
Serco Group PLC | 1,055,467 | | 9,648,967 |
Spirax-Sarco Engineering PLC | 244,900 | | 7,647,263 |
Standard Chartered PLC (United Kingdom) | 948,765 | | 22,407,202 |
SuperGroup PLC (a) | 257,000 | | 2,772,495 |
Tate & Lyle PLC | 954,369 | | 11,181,220 |
The Restaurant Group PLC | 787,200 | | 4,761,249 |
Vodafone Group PLC | 12,888,959 | | 35,001,716 |
TOTAL UNITED KINGDOM | | 508,437,607 |
United States of America - 3.3% |
Albemarle Corp. | 151,700 | | 8,360,187 |
Corrections Corp. of America | 310,112 | | 10,435,269 |
FMC Corp. | 163,900 | | 8,771,928 |
JPMorgan Chase & Co. | 85,300 | | 3,555,304 |
Lorillard, Inc. | 73,000 | | 8,468,730 |
McGraw-Hill Companies, Inc. | 151,400 | | 8,369,392 |
National Oilwell Varco, Inc. | 89,300 | | 6,581,410 |
Varian Medical Systems, Inc. (a)(d) | 125,000 | | 8,345,000 |
TOTAL UNITED STATES OF AMERICA | | 62,887,220 |
TOTAL COMMON STOCKS (Cost $1,707,811,265) |
1,813,725,590
|
Nonconvertible Preferred Stocks - 2.5% |
| | | |
Germany - 2.5% |
Henkel AG & Co. KGaA | 234,500 | | 18,726,186 |
ProSiebenSat.1 Media AG | 295,800 | | 8,243,125 |
Nonconvertible Preferred Stocks - continued |
| Shares | | Value |
Germany - continued |
Sartorius AG (non-vtg.) | 51,800 | | $ 4,330,567 |
Volkswagen AG | 74,368 | | 15,384,177 |
TOTAL NONCONVERTIBLE PREFERRED STOCKS (Cost $37,926,143) |
46,684,055
|
Money Market Funds - 2.3% |
| | | |
Fidelity Cash Central Fund, 0.19% (b) | 35,550,361 | | 35,550,361 |
Fidelity Securities Lending Cash Central Fund, 0.19% (b)(c) | 9,174,805 | | 9,174,805 |
TOTAL MONEY MARKET FUNDS (Cost $44,725,166) |
44,725,166
|
TOTAL INVESTMENT PORTFOLIO - 100.0% (Cost $1,790,462,574) | 1,905,134,811 |
NET OTHER ASSETS (LIABILITIES) - 0.0% | | 74,448 |
NET ASSETS - 100% | $ 1,905,209,259 |
Legend |
(a) Non-income producing |
(b) Affiliated fund that is available only to investment companies and other accounts managed by Fidelity Investments. The rate quoted is the annualized seven-day yield of the fund at period end. A complete unaudited listing of the fund's holdings as of its most recent quarter end is available upon request. In addition, each Fidelity Central Fund's financial statements, which are not covered by the Fund's Report of Independent Registered Public Accounting Firm, are available on the SEC's website or upon request. |
(c) Investment made with cash collateral received from securities on loan. |
(d) Security or a portion of the security is on loan at period end. |
Affiliated Central Funds |
Information regarding fiscal year to date income earned by the Fund from investments in Fidelity Central Funds is as follows: |
Fund | Income earned |
Fidelity Cash Central Fund | $ 84,150 |
Fidelity Securities Lending Cash Central Fund | 1,140,979 |
Total | $ 1,225,129 |
Other Information |
Categorizations in the Schedule of Investments are based on country or territory of incorporation. |
The following is a summary of the inputs used, as of October 31, 2012, involving the Fund's assets and liabilities carried at fair value. The inputs or methodology used for valuing securities may not be an indication of the risk associated with investing in those securities. For more information on valuation inputs, and their aggregation into the levels used in the tables below, please refer to the Security Valuation section in the accompanying Notes to Financial Statements. |
Valuation Inputs at Reporting Date: |
Description | Total | Level 1 | Level 2 | Level 3 |
Investments in Securities: | | | | |
Equities: | | | | |
Consumer Discretionary | $ 282,780,607 | $ 266,415,480 | $ 16,365,127 | $ - |
Consumer Staples | 295,031,558 | 207,720,419 | 87,311,139 | - |
Energy | 114,157,781 | 29,000,839 | 85,156,942 | - |
Financials | 283,092,428 | 239,904,381 | 43,188,047 | - |
Health Care | 221,343,999 | 128,035,361 | 93,308,638 | - |
Industrials | 281,539,891 | 281,539,891 | - | - |
Information Technology | 135,927,968 | 111,143,538 | 24,784,430 | - |
Materials | 189,055,835 | 125,868,318 | 63,187,517 | - |
Telecommunication Services | 57,479,578 | 20,811,325 | 36,668,253 | - |
Money Market Funds | 44,725,166 | 44,725,166 | - | - |
Total Investments in Securities: | $ 1,905,134,811 | $ 1,455,164,718 | $ 449,970,093 | $ - |
The following is a summary of transfers between Level 1 and Level 2 for the period ended October 31, 2012. Transfers are assumed to have occurred at the beginning of the period, and are primarily attributable to the valuation techniques used for foreign equity securities, as discussed in the accompanying Notes to Financial Statements. |
Transfers | Total |
Level 1 to Level 2 | $ 0 |
Level 2 to Level 1 | $ 147,897,797 |
See accompanying notes which are an integral part of the financial statements.
Annual Report
Fidelity Overseas Fund
Statement of Assets and Liabilities
| October 31, 2012 |
| | |
Assets | | |
Investment in securities, at value (including securities loaned of $8,755,176) - See accompanying schedule: Unaffiliated issuers (cost $1,745,737,408) | $ 1,860,409,645 | |
Fidelity Central Funds (cost $44,725,166) | 44,725,166 | |
Total Investments (cost $1,790,462,574) | | $ 1,905,134,811 |
Foreign currency held at value (cost $12,821) | | 12,825 |
Receivable for investments sold | | 23,918,482 |
Receivable for fund shares sold | | 1,259,145 |
Dividends receivable | | 3,757,549 |
Distributions receivable from Fidelity Central Funds | | 11,422 |
Other receivables | | 580,381 |
Total assets | | 1,934,674,615 |
| | |
Liabilities | | |
Payable for investments purchased | $ 12,796,237 | |
Payable for fund shares redeemed | 5,483,952 | |
Accrued management fee | 1,310,526 | |
Other affiliated payables | 392,932 | |
Other payables and accrued expenses | 306,904 | |
Collateral on securities loaned, at value | 9,174,805 | |
Total liabilities | | 29,465,356 |
| | |
Net Assets | | $ 1,905,209,259 |
Net Assets consist of: | | |
Paid in capital | | $ 3,335,743,843 |
Undistributed net investment income | | 43,880,081 |
Accumulated undistributed net realized gain (loss) on investments and foreign currency transactions | | (1,589,020,510) |
Net unrealized appreciation (depreciation) on investments and assets and liabilities in foreign currencies | | 114,605,845 |
Net Assets | | $ 1,905,209,259 |
| | |
Overseas:
Net Asset Value, offering price and redemption price per share ($1,639,724,856 ÷ 52,300,348 shares) | | $ 31.35 |
| | |
Class K:
Net Asset Value, offering price and redemption price per share ($265,484,403 ÷ 8,476,978 shares) | | $ 31.32 |
Statement of Operations
| Year ended October 31, 2012 |
| | |
Investment Income | | |
Dividends | | $ 66,575,637 |
Interest | | 49 |
Income from Fidelity Central Funds | | 1,225,129 |
Income before foreign taxes withheld | | 67,800,815 |
Less foreign taxes withheld | | (5,228,771) |
Total income | | 62,572,044 |
| | |
Expenses | | |
Management fee
Basic fee | $ 13,921,215 | |
Performance adjustment | (6,285,452) | |
Transfer agent fees | 4,050,766 | |
Accounting and security lending fees | 877,870 | |
Custodian fees and expenses | 200,601 | |
Independent trustees' compensation | 13,738 | |
Appreciation in deferred trustee compensation account | 321 | |
Registration fees | 61,330 | |
Audit | 87,788 | |
Legal | 102,645 | |
Interest | 559 | |
Miscellaneous | 30,452 | |
Total expenses before reductions | 13,061,833 | |
Expense reductions | (533,186) | 12,528,647 |
Net investment income (loss) | | 50,043,397 |
Realized and Unrealized Gain (Loss) Net realized gain (loss) on: | | |
Investment securities: | | |
Unaffiliated issuers | (145,800,189) | |
Foreign currency transactions | (567,202) | |
Futures contracts | 4,377,933 | |
Total net realized gain (loss) | | (141,989,458) |
Change in net unrealized appreciation (depreciation) on: Investment securities | 260,262,752 | |
Assets and liabilities in foreign currencies | (89,261) | |
Total change in net unrealized appreciation (depreciation) | | 260,173,491 |
Net gain (loss) | | 118,184,033 |
Net increase (decrease) in net assets resulting from operations | | $ 168,227,430 |
See accompanying notes which are an integral part of the financial statements.
Annual Report
Fidelity Overseas Fund
Financial Statements - continued
Statement of Changes in Net Assets
| Year ended
October 31,
2012 | Year ended
October 31,
2011 |
Increase (Decrease) in Net Assets | | |
Operations | | |
Net investment income (loss) | $ 50,043,397 | $ 70,820,055 |
Net realized gain (loss) | (141,989,458) | 282,595,294 |
Change in net unrealized appreciation (depreciation) | 260,173,491 | (436,401,912) |
Net increase (decrease) in net assets resulting from operations | 168,227,430 | (82,986,563) |
Distributions to shareholders from net investment income | (70,077,891) | (92,196,839) |
Distributions to shareholders from net realized gain | (1,661,965) | - |
Total distributions | (71,739,856) | (92,196,839) |
Share transactions - net increase (decrease) | (857,000,541) | (3,671,962,139) |
Redemption fees | 66,899 | 112,180 |
Total increase (decrease) in net assets | (760,446,068) | (3,847,033,361) |
| | |
Net Assets | | |
Beginning of period | 2,665,655,327 | 6,512,688,688 |
End of period (including undistributed net investment income of $43,880,081 and undistributed net investment income of $64,516,366, respectively) | $ 1,905,209,259 | $ 2,665,655,327 |
Financial Highlights - Overseas
Years ended October 31, | 2012 | 2011 | 2010 | 2009 | 2008 |
Selected Per-Share Data | | | | | |
Net asset value, beginning of period | $ 29.28 | $ 31.56 | $ 30.13 | $ 25.43 | $ 58.39 |
Income from Investment Operations | | | | | |
Net investment income (loss) B | .73 | .47 | .42 | .52 | .55 |
Net realized and unrealized gain (loss) | 2.19 | (2.27) | 1.49 | 4.55 | (27.19) |
Total from investment operations | 2.92 | (1.80) | 1.91 | 5.07 | (26.64) |
Distributions from net investment income | (.83) | (.48) | (.47) | (.37) | (.57) |
Distributions from net realized gain | (.02) | - | (.01) | - | (5.75) |
Total distributions | (.85) | (.48) | (.48) | (.37) | (6.32) |
Redemption fees added to paid in capital B,F | - | - | - | - | - |
Net asset value, end of period | $ 31.35 | $ 29.28 | $ 31.56 | $ 30.13 | $ 25.43 |
Total Return A | 10.37% | (5.83)% | 6.33% | 20.44% | (50.88)% |
Ratios to Average Net Assets C,E | | | | | |
Expenses before reductions | .69% | .73% | .89% | 1.02% | 1.13% |
Expenses net of fee waivers, if any | .69% | .73% | .89% | 1.02% | 1.13% |
Expenses net of all reductions | .67% | .67% | .85% | .98% | 1.10% |
Net investment income (loss) | 2.52% | 1.44% | 1.41% | 2.01% | 1.33% |
Supplemental Data | | | | | |
Net assets, end of period (000 omitted) | $ 1,639,725 | $ 2,215,717 | $ 5,548,689 | $ 6,602,017 | $ 5,464,901 |
Portfolio turnover rate D | 90% | 77% | 111% | 115% | 113% |
A Total returns would have been lower if certain expenses had not been reduced during the applicable periods shown.
B Calculated based on average shares outstanding during the period.
C Fees and expenses of any underlying Fidelity Central Funds are not included in the Fund's expense ratio. The Fund indirectly bears its proportionate share of the expenses of any underlying Fidelity Central Funds.
D Amount does not include the portfolio activity of any underlying Fidelity Central Funds.
E Expense ratios reflect operating expenses of the class. Expenses before reductions do not reflect amounts reimbursed by the investment adviser or reductions from brokerage service arrangements or reductions from other expense offset arrangements and do not represent the amount paid by the class during periods when reimbursements or reductions occur. Expenses net of fee waivers reflect expenses after reimbursement by the investment adviser but prior to reductions from brokerage service arrangements or other expense offset arrangements. Expenses net of all reductions represent the net expenses paid by the class.
F Amount represents less than $.01 per share.
See accompanying notes which are an integral part of the financial statements.
Annual Report
Financial Highlights - Class K
Years ended October 31, | 2012 | 2011 | 2010 | 2009 | 2008 G |
Selected Per-Share Data | | | | | |
Net asset value, beginning of period | $ 29.29 | $ 31.59 | $ 30.16 | $ 25.45 | $ 45.00 |
Income from Investment Operations | | | | | |
Net investment income (loss) D | .79 | .52 | .47 | .59 | .13 |
Net realized and unrealized gain (loss) | 2.18 | (2.27) | 1.50 | 4.54 | (19.68) |
Total from investment operations | 2.97 | (1.75) | 1.97 | 5.13 | (19.55) |
Distributions from net investment income | (.92) | (.55) | (.53) | (.42) | - |
Distributions from net realized gain | (.02) | - | (.01) | - | - |
Total distributions | (.94) | (.55) | (.54) | (.42) | - |
Redemption fees added to paid in capital D,I | - | - | - | - | - |
Net asset value, end of period | $ 31.32 | $ 29.29 | $ 31.59 | $ 30.16 | $ 25.45 |
Total Return B,C | 10.59% | (5.67)% | 6.55% | 20.73% | (43.44)% |
Ratios to Average Net Assets E,H | | | | | |
Expenses before reductions | .51% | .56% | .69% | .78% | .96% A |
Expenses net of fee waivers, if any | .51% | .55% | .69% | .78% | .96% A |
Expenses net of all reductions | .48% | .50% | .66% | .74% | .93% A |
Net investment income (loss) | 2.70% | 1.61% | 1.60% | 2.25% | 1.08% A |
Supplemental Data | | | | | |
Net assets, end of period (000 omitted) | $ 265,484 | $ 291,323 | $ 368,004 | $ 383,048 | $ 44,277 |
Portfolio turnover rate F | 90% | 77% | 111% | 115% | 113% |
A Annualized
B Total returns for periods of less than one year are not annualized.
C Total returns would have been lower if certain expenses had not been reduced during the applicable periods shown.
D Calculated based on average shares outstanding during the period.
E Fees and expenses of any underlying Fidelity Central Funds are not included in the Fund's expense ratio. The Fund indirectly bears its proportionate share of the expenses of any underlying Fidelity Central Funds.
F Amount does not include the portfolio activity of any underlying Fidelity Central Funds.
G For the period May 9, 2008 (commencement of sale of shares) to October 31, 2008.
H Expense ratios reflect operating expenses of the class. Expenses before reductions do not reflect amounts reimbursed by the investment adviser or reductions from brokerage service arrangements or reductions from other expense offset arrangements and do not represent the amount paid by the class during periods when reimbursements or reductions occur. Expense ratios before reductions for start-up periods may not be representative of longer-term operating periods. Expenses net of fee waivers reflect expenses after reimbursement by the investment adviser but prior to reductions from brokerage service arrangements or other expense offset arrangements. Expenses net of all reductions represent the net expenses paid by the class.
I Amount represents less than $.01 per share.
See accompanying notes which are an integral part of the financial statements.
Annual Report
Fidelity Overseas Fund
Notes to Financial Statements
For the period ended October 31, 2012
1. Organization.
Fidelity Overseas Fund (the Fund) is a fund of Fidelity Investment Trust (the Trust) and is authorized to issue an unlimited number of shares. The Trust is registered under the Investment Company Act of 1940, as amended (the 1940 Act), as an open-end management investment company organized as a Massachusetts business trust. The Fund offers Overseas and Class K shares each of which has equal rights as to assets and voting privileges. The Fund offered Class F shares during the period June 26, 2009 through December 16, 2011, and all outstanding shares were redeemed by December 16, 2011. Each class has exclusive voting rights with respect to matters that affect that class. Investment income, realized and unrealized capital gains and losses, the common expenses of the Fund, and certain fund-level expense reductions, if any, are allocated on a pro-rata basis to each class based on the relative net assets of each class to the total net assets of the Fund. Each class differs with respect to transfer agent fees incurred. Certain expense reductions may also differ by class.
2. Investments in Fidelity Central Funds.
The Fund invests in Fidelity Central Funds, which are open-end investment companies available only to other investment companies and accounts managed by Fidelity Management & Research Company (FMR) and its affiliates. The Fund's Schedule of Investments lists each of the Fidelity Central Funds held as of period end, as an investment of the Fund, but does not include the underlying holdings of each Fidelity Central Fund. As an Investing Fund, the Fund indirectly bears its proportionate share of the expenses of the underlying Fidelity Central Funds.
The Money Market Central Funds seek preservation of capital and current income and are managed by Fidelity Investments Money Management, Inc. (FIMM), an affiliate of FMR.
A complete unaudited list of holdings for each Fidelity Central Fund is available upon request or at the Securities and Exchange Commission (the SEC) web site at www.sec.gov. In addition, the financial statements of the Fidelity Central Funds, which are not covered by the Fund's Report of Independent Registered Public Accounting Firm, are available on the SEC web site or upon request.
3. Significant Accounting Policies.
The financial statements have been prepared in conformity with accounting principles generally accepted in the United States of America (GAAP), which require management to make certain estimates and assumptions at the date of the financial statements. Actual results could differ from those estimates. Subsequent events, if any, through the date that the financial statements were issued have been evaluated in the preparation of the financial statements. The following summarizes the significant accounting policies of the Fund:
Security Valuation. Investments are valued as of 4:00 p.m. Eastern time on the last calendar day of the period. In accordance with valuation policies and procedures approved by the Board of Trustees (the Board), the Fund attempts to obtain prices from one or more third party pricing vendors or brokers to value its investments. When current market prices, quotations or rates are not readily available or reliable, securities will be fair valued in good faith by the FMR Fair Value Committee (the Committee), in accordance with procedures adopted by the Fund's Board. Factors used in determining fair value vary by security type and may include market or security specific events. The frequency with which these procedures are used cannot be predicted and they may be utilized to a significant extent. The Committee oversees the Fund's valuation policies and procedures and is responsible for approving and reporting to the Board all fair value determinations.
The Fund categorizes the inputs to valuation techniques used to value its investments into a disclosure hierarchy consisting of three levels as shown below:
Level 1 - quoted prices in active markets for identical investments
Level 2 - other significant observable inputs (including quoted prices for similar investments, interest rates, prepayment speeds, etc.)
Level 3 - unobservable inputs (including the Fund's own assumptions based on the best information available)
Valuation techniques used to value the Fund's investments by major category are as follows:
Equity securities, including restricted securities, for which market quotations are readily available, are valued at the last reported sale price or official closing price as reported by a third party pricing vendor on the primary market or exchange on which they are traded and are categorized as Level 1 in the hierarchy. In the event there were no sales during the day or closing prices are not available, securities are valued at the last quoted bid price or may be valued using the last available price and are generally categorized as Level 2 in the hierarchy. For foreign equity securities, when significant market or security specific events arise, comparisons to the valuation of American Depositary Receipts (ADRs), futures contracts, Exchange-Traded Funds (ETFs) and certain indexes as well as quoted prices for similar securities are used and are categorized as Level 2 in the hierarchy. Utilizing these techniques may result in transfers between Level 1 and Level 2.
Annual Report
Fidelity Overseas Fund
Notes to Financial Statements - continued
3. Significant Accounting Policies - continued
Security Valuation - continued
Investments in open-end mutual funds, including the Fidelity Central Funds, are valued at their closing net asset value (NAV) each business day and are categorized as Level 1 in the hierarchy.
Changes in valuation techniques may result in transfers in or out of an assigned level within the disclosure hierarchy. The aggregate value of investments by input level, as of October 31, 2012, including information on transfers between Levels 1 and 2, is included at the end of the Fund's Schedule of Investments.
Foreign Currency Translation. The Fund may use foreign currency contracts to facilitate transactions in foreign-denominated securities. Gains and losses from these transactions may arise from changes in the value of the foreign currency or if the counterparties do not perform under the contracts' terms.
Foreign-denominated assets, including investment securities, and liabilities are translated into U.S. dollars at the exchange rates at period end. Purchases and sales of investment securities, income and dividends received and expenses denominated in foreign currencies are translated into U.S. dollars at the exchange rate in effect on the transaction date.
The effects of exchange rate fluctuations on investments are included with the net realized and unrealized gain (loss) on investment securities. Other foreign currency transactions resulting in realized and unrealized gain (loss) are disclosed separately.
Investment Transactions and Income. For financial reporting purposes, the Fund's investment holdings and NAV include trades executed through the end of the last business day of the period. The NAV per share for processing shareholder transactions is calculated as of the close of business of the New York Stock Exchange (NYSE), normally 4:00 p.m. Eastern time and includes trades executed through the end of the prior business day. Gains and losses on securities sold are determined on the basis of identified cost and may include proceeds received from litigation. Dividend income is recorded on the ex-dividend date, except for certain dividends from foreign securities where the ex-dividend date may have passed, which are recorded as soon as the Fund is informed of the ex-dividend date. Non-cash dividends included in dividend income, if any, are recorded at the fair market value of the securities received. Distributions received on securities that represent a return of capital or capital gain are recorded as a reduction of cost of investments and/or as a realized gain. The Fund estimates the components of distributions received that may be considered return of capital distributions or capital gain distributions. Interest income and distributions from the Fidelity Central Funds are accrued as earned. Interest income includes coupon interest and amortization of premium and accretion of discount on debt securities. Investment income is recorded net of foreign taxes withheld where recovery of such taxes is uncertain.
Expenses. Expenses directly attributable to a fund are charged to that fund. Expenses attributable to more than one fund are allocated among the respective funds on the basis of relative net assets or other appropriate methods. Expense estimates are accrued in the period to which they relate and adjustments are made when actual amounts are known.
Deferred Trustee Compensation. Under a Deferred Compensation Plan (the Plan), independent Trustees may elect to defer receipt of a portion of their annual compensation. Deferred amounts are invested in a cross-section of Fidelity funds, are marked-to-market and remain in the Fund until distributed in accordance with the Plan. The investment of deferred amounts and the offsetting payable to the Trustees are included in the accompanying Statement of Assets and Liabilities.
Income Tax Information and Distributions to Shareholders. Each year, the Fund intends to qualify as a regulated investment company under Subchapter M of the Internal Revenue Code, including distributing substantially all of its taxable income and realized gains. As a result, no provision for income taxes is required. As of October 31, 2012, the Fund did not have any unrecognized tax benefits in the financial statements; nor is the Fund aware of any tax positions for which it is reasonably possible that the total amounts of unrecognized tax benefits will significantly change in the next twelve months. The Fund files a U.S. federal tax return, in addition to state and local tax returns as required. A fund's federal income tax returns are subject to examination by the Internal Revenue Service (IRS) for a period of three fiscal years after they are filed. State and local tax returns may be subject to examination for an additional fiscal year depending on the jurisdiction. Foreign taxes are provided for based on the Fund's understanding of the tax rules and rates that exist in the foreign markets in which it invests.
Distributions are declared and recorded on the ex-dividend date. Income dividends and capital gain distributions are declared separately for each class. Income and capital gain distributions are determined in accordance with income tax regulations, which may differ from GAAP.
Capital accounts within the financial statements are adjusted for permanent book-tax differences. These adjustments have no impact on net assets or the results of operations. Temporary book-tax differences will reverse in a subsequent period.
Book-tax differences are primarily due to futures transactions, foreign currency transactions, passive foreign investment companies (PFIC), deferred trustees compensation, capital loss carryforwards and losses deferred due to wash sales.
Annual Report
3. Significant Accounting Policies - continued
Income Tax Information and Distributions to Shareholders - continued
The federal tax cost of investment securities and unrealized appreciation (depreciation) as of period end were as follows:
Gross unrealized appreciation | $ 181,334,156 |
Gross unrealized depreciation | (78,692,488) |
Net unrealized appreciation (depreciation) on securities and other investments | $ 102,641,668 |
| |
Tax Cost | $ 1,802,493,143 |
The tax-based components of distributable earnings as of period end were as follows:
Undistributed ordinary income | $ 44,077,257 |
Capital loss carryforward | $ (1,576,989,942) |
Net unrealized appreciation (depreciation) | $ 102,575,276 |
Capital loss carryforwards are only available to offset future capital gains of the Fund to the extent provided by regulations and may be limited. Under the Regulated Investment Company Modernization Act of 2010 (the Act), the Fund is permitted to carry forward capital losses incurred in taxable years beginning after December 22, 2010 for an unlimited period and such capital losses are required to be used prior to any losses that expire. Capital loss carryforwards were as follows:
Fiscal year of expiration | |
| |
2016 | $ (464,379,964) |
2017 | (939,719,765) |
Total with expiration | (1,404,099,729) |
No expiration | |
Short-term | (45,748,177) |
Long-term | (127,142,036) |
Total no expiration | (172,890,213) |
Total capital loss carryforward | $ (1,576,989,942) |
The tax character of distributions paid was as follows:
| October 31, 2012 | October 31, 2011 |
Ordinary Income | $ 71,739,856 | $ 92,196,839 |
Short-Term Trading (Redemption) Fees. Shares held by investors in the Fund less than 30 days are subject to a redemption fee equal to 1.00% of the net asset value of shares redeemed. All redemption fees, which reduce the proceeds of the shareholder redemption, are retained by the Fund and accounted for as an addition to paid in capital.
New Accounting Pronouncement. In December 2011, the Financial Accounting Standards Board issued Accounting Standard Update No. 2011-11, Disclosures about Offsetting Assets and Liabilities. The update creates new disclosure requirements requiring entities to disclose both gross and net information for derivatives and other financial instruments that are either offset in the Statement of Assets and Liabilities or subject to an enforceable master netting arrangement or similar agreement. The disclosure requirements are effective for annual reporting periods beginning on or after January 1, 2013, and interim periods within those annual periods. Management is currently evaluating the impact of the update's adoption on the Fund's financial statement disclosures.
4. Derivative Instruments.
Risk Exposures and the Use of Derivative Instruments. The Fund's investment objective allows the Fund to enter into various types of derivative contracts, including futures contracts. Derivatives are investments whose value is primarily derived from underlying assets, indices or reference rates and may be transacted on an exchange or over-the-counter (OTC). Derivatives may involve a future commitment to buy or sell a specified instrument based on specified terms, to exchange future cash flows at periodic intervals based on a notional principal amount, or for one party to make one or more payments upon the occurrence of specified events in exchange for periodic payments from the other party.
Annual Report
Fidelity Overseas Fund
Notes to Financial Statements - continued
4. Derivative Instruments - continued
Risk Exposures and the Use of Derivative Instruments - continued
The Fund used derivatives to increase returns and to manage exposure to certain risks as defined below. The success of any strategy involving derivatives depends on analysis of numerous economic factors, and if the strategies for investment do not work as intended, the Fund may not achieve its objectives.
The Fund's use of derivatives increased or decreased its exposure to the following risk:
Equity Risk | Equity risk relates to the fluctuations in the value of financial instruments as a result of changes in market prices (other than those arising from interest rate risk or foreign exchange risk), whether caused by factors specific to an individual investment, its issuer, or all factors affecting all instruments traded in a market or market segment. |
The Fund is also exposed to additional risks from investing in derivatives, such as liquidity risk and counterparty credit risk. Liquidity risk is the risk that the Fund will be unable to close out the derivative in the open market in a timely manner. Counterparty credit risk is the risk that the counterparty will not be able to fulfill its obligation to the Fund. Counterparty credit risk related to exchange-traded futures contracts is minimal because of the protection provided by the exchange on which they trade.
Investing in derivatives may involve greater risks than investing in the underlying assets directly and, to varying degrees, may involve risk of loss in excess of any initial investment and collateral received and amounts recognized in the Statement of Assets and Liabilities. In addition, there may be the risk that the change in value of the derivative contract does not correspond to the change in value of the underlying instrument.
Futures Contracts. A futures contract is an agreement between two parties to buy or sell a specified underlying instrument for a fixed price at a specified future date. The Fund used futures contracts to manage its exposure to the stock market.
Upon entering into a futures contract, a fund is required to deposit either cash or securities (initial margin) with a clearing broker in an amount equal to a certain percentage of the face value of the contract. Futures contracts are marked-to-market daily and subsequent payments (variation margin) are made or received by a fund depending on the daily fluctuations in the value of the futures contracts and are recorded as unrealized appreciation or (depreciation). This receivable and/or payable is included in daily variation margin on futures contracts in the Statement of Assets and Liabilities. Realized gain or (loss) is recorded upon the expiration or closing of a futures contract.
Any open futures contracts at period end are shown in the Schedule of Investments under the caption "Futures Contracts." The underlying face amount at value reflects each contract's exposure to the underlying instrument at period end.
During the period the Fund recognized net realized gain (loss) of $4,377,933 related to its investment in futures contracts. This amount is included in the Statement of Operations.
5. Purchases and Sales of Investments.
Purchases and sales of securities, other than short-term securities, aggregated $1,730,739,879 and $2,430,078,978, respectively.
6. Fees and Other Transactions with Affiliates.
Management Fee. FMR and its affiliates provide the Fund with investment management related services for which the Fund pays a monthly management fee. The management fee is the sum of an individual fund fee rate that is based on an annual rate of .45% of the Fund's average net assets and an annualized group fee rate that averaged .26% during the period. The group fee rate is based upon the average net assets of all the mutual funds advised by FMR. The group fee rate decreases as assets under management increase and increases as assets under management decrease. In addition, the management fee is subject to a performance adjustment (up to a maximum of ± .20% of the Fund's average net assets over a 36 month performance period). The upward or downward adjustment to the management fee is based on the relative investment performance of Overseas as compared to an appropriate benchmark index. For the period, the total annual management fee rate, including the performance adjustment, was .39% of the Fund's average net assets.
Annual Report
6. Fees and Other Transactions with Affiliates - continued
Transfer Agent Fees. Fidelity Investments Institutional Operations Company, Inc. (FIIOC), an affiliate of FMR, is the transfer, dividend disbursing and shareholder servicing agent for each class of the Fund. FIIOC receives account fees and asset-based fees that vary according to the account size and type of account of the shareholders of Overseas. FIIOC receives an asset-based fee of Class K's average net assets. FIIOC pays for typesetting, printing and mailing of shareholder reports, except proxy statements. For the period, transfer agent fees for each class were as follows:
| Amount | % of
Average
Net Assets |
Overseas | $ 3,904,215 | .23 |
Class K | 146,551 | .05 |
| $ 4,050,766 | |
Accounting and Security Lending Fees. Fidelity Service Company, Inc. (FSC), an affiliate of FMR, maintains the Fund's accounting records. The accounting fee is based on the level of average net assets for each month. Under a separate contract, FSC administers the security lending program. The security lending fee is based on the number and duration of lending transactions.
Brokerage Commissions. The Fund placed a portion of its portfolio transactions with brokerage firms which are affiliates of the investment adviser. The commissions paid to these affiliated firms were $737 for the period.
Interfund Lending Program. Pursuant to an Exemptive Order issued by the SEC, the Fund, along with other registered investment companies having management contracts with FMR, may participate in an interfund lending program. This program provides an alternative credit facility allowing the funds to borrow from, or lend money to, other participating affiliated funds. At period end, there were no interfund loans outstanding. The Fund's activity in this program during the period for which loans were outstanding was as follows:
Borrower or Lender | Average Loan
Balance | Weighted Average Interest Rate | Interest
Expense |
Borrower | $ 29,057,000 | .35% | $ 559 |
7. Committed Line of Credit.
The Fund participates with other funds managed by FMR or an affiliate in a $4.25 billion credit facility (the "line of credit") to be utilized for temporary or emergency purposes to fund shareholder redemptions or for other short-term liquidity purposes. The Fund has agreed to pay commitment fees on its pro-rata portion of the line of credit, which amounted to $5,640 and is reflected in Miscellaneous expenses on the Statement of Operations. During the period, there were no borrowings on this line of credit.
8. Security Lending.
The Fund lends portfolio securities through a lending agent from time to time in order to earn additional income. For equity securities, a lending agent is used and may loan securities to certain qualified borrowers, including Fidelity Capital Markets (FCM), a broker-dealer affiliated with the Fund. On the settlement date of the loan, the Fund receives collateral (in the form of U.S. Treasury obligations, letters of credit and/or cash) against the loaned securities and maintains collateral in an amount not less than 100% of the market value of the loaned securities during the period of the loan. The market value of the loaned securities is determined at the close of business of the Fund and any additional required collateral is delivered to the Fund on the next business day. If the borrower defaults on its obligation to return the securities loaned because of insolvency or other reasons, a fund could experience delays and costs in recovering the securities loaned or in gaining access to the collateral. Any cash collateral received is invested in the Fidelity Securities Lending Cash Central Fund. The value of loaned securities and cash collateral at period end are disclosed on the Fund's Statement of Assets and Liabilities. Security lending income represents the income earned on investing cash collateral, less rebates paid to borrowers and any lending agent fees associated with the loan, plus any premium payments received for lending certain types of securities. Security lending income is presented in the Statement of Operations as a component of income from Fidelity Central Funds. Total security lending income during the period amounted to $1,140,979. During the period, there were no securities loaned to FCM.
9. Expense Reductions.
Many of the brokers with whom FMR places trades on behalf of the Fund provided services to the Fund in addition to trade execution. These services included payments of certain expenses on behalf of the Fund totaling $533,174 for the period. In addition, through arrangements with the Fund's custodian, credits realized as a result of uninvested cash balances were used to reduce the Fund's expenses. During the period, these credits reduced the Fund's custody expenses by $12.
Annual Report
Fidelity Overseas Fund
Notes to Financial Statements - continued
10. Distributions to Shareholders.
Distributions to shareholders of each class were as follows:
Years ended October 31, | 2012 A | 2011 A |
From net investment income | | |
Overseas | $ 56,962,859 | $ 75,897,727 |
Class K | 9,516,308 | 6,408,873 |
Class F | 3,598,724 | 9,890,239 |
Total | $ 70,077,891 | $ 92,196,839 |
From net realized gain | | |
Overseas | $ 1,377,579 | $ - |
Class K | 207,326 | - |
Class F | 77,060 | - |
Total | $ 1,661,965 | $ - |
A All Class F shares were redeemed on December 16, 2011.
11. Share Transactions.
Transactions for each class of shares were as follows:
| Shares | Dollars |
Years ended October 31, | 2012 A | 2011 | 2012 A | 2011 |
Overseas | | | | |
Shares sold | 5,513,981 | 10,588,919 | $ 159,997,895 | $ 338,680,110 |
Reinvestment of distributions | 2,082,243 | 2,356,512 | 57,282,489 | 75,196,294 |
Shares redeemed | (30,970,724) | (113,084,725) | (876,498,461) | (3,611,089,764) |
Net increase (decrease) | (23,374,500) | (100,139,294) | $ (659,218,077) | $ (3,197,213,360) |
Class K | | | | |
Shares sold | 5,090,211 | 4,129,689 | $ 145,041,228 | $ 128,992,232 |
Reinvestment of distributions | 354,489 | 201,094 | 9,723,634 | 6,408,873 |
Shares redeemed | (6,913,669) | (6,034,878) | (205,273,028) | (198,074,826) |
Net increase (decrease) | (1,468,969) | (1,704,095) | $ (50,508,166) | $ (62,673,721) |
Class F | | | | |
Shares sold | 373,582 | 12,066,248 | $ 10,277,470 | $ 388,123,231 |
Reinvestment of distributions | 134,104 | 310,526 | 3,675,784 | 9,890,239 |
Shares redeemed | (5,923,991) | (25,830,866) | (161,227,552) | (810,088,528) |
Net increase (decrease) | (5,416,305) | (13,454,092) | $ (147,274,298) | $ (412,075,058) |
A All Class F shares were redeemed on December 16, 2011.
12. Other.
The Fund's organizational documents provide former and current trustees and officers with a limited indemnification against liabilities arising in connection with the performance of their duties to the Fund. In the normal course of business, the Fund may also enter into contracts that provide general indemnifications. The Fund's maximum exposure under these arrangements is unknown as this would be dependent on future claims that may be made against the Fund. The risk of material loss from such claims is considered remote.
Annual Report
Report of Independent Registered Public Accounting Firm
To the Trustees of Fidelity Investment Trust and the Shareholders of Fidelity Overseas Fund:
In our opinion, the accompanying statement of assets and liabilities, including the schedule of investments, and the related statements of operations and of changes in net assets and the financial highlights present fairly, in all material respects, the financial position of Fidelity Overseas Fund (a fund of Fidelity Investment Trust) at October 31, 2012, the results of its operations for the year then ended, the changes in its net assets for each of the two years in the period then ended and the financial highlights for each of the periods indicated, in conformity with accounting principles generally accepted in the United States of America. These financial statements and financial highlights (hereafter referred to as "financial statements") are the responsibility of the Fidelity Overseas Fund's management. Our responsibility is to express an opinion on these financial statements based on our audits. We conducted our audits of these financial statements in accordance with the standards of the Public Company Accounting Oversight Board (United States). Those standards require that we plan and perform the audit to obtain reasonable assurance about whether the financial statements are free of material misstatement. An audit includes examining, on a test basis, evidence supporting the amounts and disclosures in the financial statements, assessing the accounting principles used and significant estimates made by management, and evaluating the overall financial statement presentation. We believe that our audits, which included confirmation of securities at October 31, 2012 by correspondence with the custodian and brokers, provide a reasonable basis for our opinion.
PricewaterhouseCoopers LLP
Boston, Massachusetts
December 14, 2012
Annual Report
Fidelity Worldwide Fund
As a shareholder of the Fund, you incur two types of costs: (1) transaction costs, including sales charges (loads) on purchase payments or redemption proceeds, redemption fees and (2) ongoing costs, including management fees, distribution and/or service (12b-1) fees and other Fund expenses. This Example is intended to help you understand your ongoing costs (in dollars) of investing in the Fund and to compare these costs with the ongoing costs of investing in other mutual funds.
The Example is based on an investment of $1,000 invested at the beginning of the period and held for the entire period (May 1, 2012 to October 31, 2012).
Actual Expenses
The first line of the accompanying table for each class of the Fund provides information about actual account values and actual expenses. You may use the information in this line, together with the amount you invested, to estimate the expenses that you paid over the period. Simply divide your account value by $1,000.00 (for example, an $8,600 account value divided by $1,000.00 = 8.6), then multiply the result by the number in the first line for a class of the Fund under the heading entitled "Expenses Paid During Period" to estimate the expenses you paid on your account during this period. A small balance maintenance fee of $12.00 that is charged once a year may apply for certain accounts with a value of less than $2,000. This fee is not included in the table below. If it was, the estimate of expenses you paid during the period would be higher, and your ending account value lower, by this amount. In addition, the Fund, as a shareholder in the underlying Fidelity Central Funds, will indirectly bear its pro-rata share of the fees and expenses incurred by the underlying Fidelity Central Funds. These fees and expenses are not included in the Fund's annualized expense ratio used to calculate the expense estimate in the table below.
Hypothetical Example for Comparison Purposes
The second line of the accompanying table for each class of the Fund provides information about hypothetical account values and hypothetical expenses based on a Class' actual expense ratio and an assumed rate of return of 5% per year before expenses, which is not the Class' actual return. The hypothetical account values and expenses may not be used to estimate the actual ending account balance or expenses you paid for the period. You may use this information to compare the ongoing costs of investing in the Fund and other funds. To do so, compare this 5% hypothetical example with the 5% hypothetical examples that appear in the shareholder reports of the other funds. A small balance maintenance fee of $12.00 that is charged once a year may apply for certain accounts with a value of less than $2,000. This fee is not included in the table below. If it was, the estimate of expenses you paid during the period would be higher, and your ending account value lower, by this amount. In addition, the Fund, as a shareholder in the underlying Fidelity Central Funds, will indirectly bear its pro-rata share of the fees and expenses incurred by the underlying Fidelity Central Funds. These fees and expenses are not included in the Fund's annualized expense ratio used to calculate the expense estimate in the table below.
Please note that the expenses shown in the table are meant to highlight your ongoing costs only and do not reflect any transaction costs. Therefore, the second line of the table is useful in comparing ongoing costs only, and will not help you determine the relative total costs of owning different funds. In addition, if these transactional costs were included, your costs would have been higher.
| Annualized Expense Ratio | Beginning
Account Value
May 1, 2012 | Ending
Account Value
October 31, 2012 | Expenses Paid
During Period*
May 1, 2012 to October 31, 2012 |
Class A | 1.45% | | | |
Actual | | $ 1,000.00 | $ 1,011.80 | $ 7.33 |
HypotheticalA | | $ 1,000.00 | $ 1,017.85 | $ 7.35 |
Class T | 1.71% | | | |
Actual | | $ 1,000.00 | $ 1,010.80 | $ 8.64 |
HypotheticalA | | $ 1,000.00 | $ 1,016.54 | $ 8.67 |
Class B | 2.20% | | | |
Actual | | $ 1,000.00 | $ 1,008.30 | $ 11.11 |
HypotheticalA | | $ 1,000.00 | $ 1,014.08 | $ 11.14 |
Class C | 2.20% | | | |
Actual | | $ 1,000.00 | $ 1,008.30 | $ 11.11 |
HypotheticalA | | $ 1,000.00 | $ 1,014.08 | $ 11.14 |
Worldwide | 1.13% | | | |
Actual | | $ 1,000.00 | $ 1,013.30 | $ 5.72 |
HypotheticalA | | $ 1,000.00 | $ 1,019.46 | $ 5.74 |
Institutional Class | 1.20% | | | |
Actual | | $ 1,000.00 | $ 1,013.30 | $ 6.07 |
HypotheticalA | | $ 1,000.00 | $ 1,019.10 | $ 6.09 |
A 5% return per year before expenses
* Expenses are equal to each Class' annualized expense ratio, multiplied by the average account value over the period, multiplied by 184/366 (to reflect the one-half year period).
Annual Report
Fidelity Worldwide Fund
Performance: The Bottom Line
Average annual total return reflects the change in the value of an investment, assuming reinvestment of the class' distributions from dividend income and capital gains (the profits earned upon the sale of securities that have grown in value, if any) and assuming a constant rate of performance each year. The $10,000 table and the fund's returns do not reflect the deduction of taxes that a shareholder would pay on fund distributions or the redemption of fund shares. During periods of reimbursement by Fidelity, a fund's total return will be greater than it would be had the reimbursement not occurred. How a fund did yesterday is no guarantee of how it will do tomorrow.
Average Annual Total Returns
Periods ended October 31, 2012 | Past 1
year | Past 5
years | Past 10
years |
Fidelity Worldwide Fund | 10.56% | -1.90% | 8.94% |
$10,000 Over 10 Years
Let's say hypothetically that $10,000 was invested in Fidelity Worldwide Fund, a class of the fund, on October 31, 2002. The chart shows how the value of your investment would have changed, and also shows how the MSCI World Index performed over the same period.
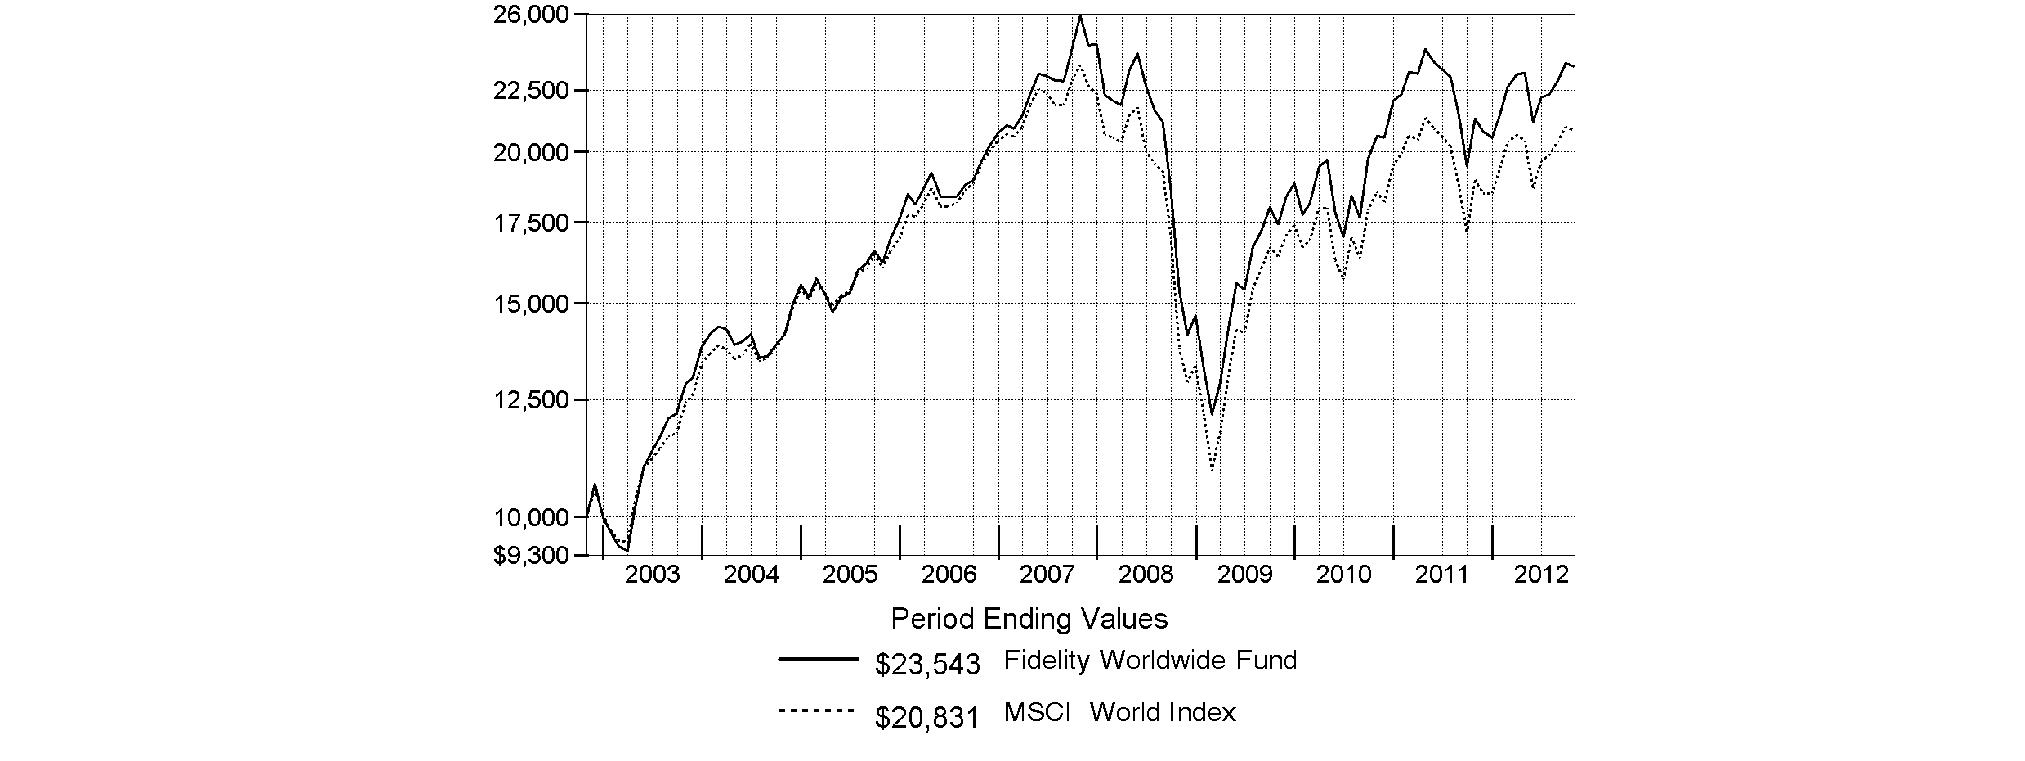
Annual Report
Fidelity Worldwide Fund
Market Recap: Returns for most domestic and international equities fluctuated during the 12 months ending October 31, 2012, as investor sentiment towards risk vacillated amid a changing global economic landscape. U.S. stocks overcame bouts of volatility to post strong gains for the past year, extending an uptrend that began in March 2009. The broad-based S&P 500® Index advanced 15.21%, while the blue-chip-laden Dow Jones Industrial AverageSM and technology-heavy Nasdaq Composite® Index rose 12.56% and 12.21%, respectively. Performance outside of the U.S. was relatively weak, as the MSCI® ACWI® (All Country World Index) ex USA Index rose 4.11%, hampered in part by a stronger U.S. dollar. International developed-markets generally struggled during the period as macroeconomic concerns ebbed and flowed, finishing with only a modest gain. The MSCI® EAFE® Index rose 4.76% for the year, largely buttressed in the summertime by pledges of accommodative monetary action from eurozone officials, as well as signs that the U.S. housing market was on the mend. Within the index, Asia-Pacific ex Japan showed the most impressive gain, advancing roughly 10%. A number of core European components, including Germany (+11%) and Switzerland (+10%), and the U.K. (+9%), benefited from optimism about the eurozone's ability to resolve its debt woes, which helped the region outpace the index overall. Elsewhere, Japan was among the few benchmark constituents to finish in the red, returning about -3%. Emerging-markets stocks gained 2.98% for the year, as measured by the MSCI Emerging Markets Index. A general uptrend in the final five months of the period lifted the index into positive territory for the full 12 months.
Comments from William Kennedy, Lead Portfolio Manager of Fidelity® Worldwide Fund and manager of its non-U.S. equity subportfolio, and Co-Portfolio Manager Stephen DuFour, who manages the fund's U.S. equity subportfolio: For the year, the fund's Retail Class shares returned 10.56%, compared with 9.92% for the MSCI® World Index. Security selection, especially in information technology, helped relative performance, as did market weightings, notably in Europe ex U.K. Sector allocation and a small cash position modestly detracted. Individual contributors included card processor MasterCard, whose stock benefited from more people worldwide paying with plastic, and homebuilder PulteGroup, whose steep share price gains were driven by the U.S. housing recovery. Another standout was TJX Companies, whose stock climbed as more consumers tried to stretch their paychecks by shopping at stores such as T.J. Maxx. By contrast, our timing with discount retailer Wal-Mart Stores hurt, as the stock rose sharply - especially in May and June - when it was not in the portfolio. Elsewhere, the fund lost ground from investing in energy processing and pipeline company Keyera when its shares were pressured by the warm winter and low natural gas prices. Keyera was not in the MSCI index and not held at period end.
The views expressed above reflect those of the portfolio manager(s) only through the end of the period as stated on the cover of this report and do not necessarily represent the views of Fidelity or any other person in the Fidelity organization. Any such views are subject to change at any time based upon market or other conditions and Fidelity disclaims any responsibility to update such views. These views may not be relied on as investment advice and, because investment decisions for a Fidelity fund are based on numerous factors, may not be relied on as an indication of trading intent on behalf of any Fidelity fund.
Annual Report
Fidelity Worldwide Fund
Investment Changes (Unaudited)
Geographic Diversification (% of fund's net assets) |
As of October 31, 2012 |
| United States of America | 54.0% | |
| United Kingdom | 10.0% | |
| Japan | 7.4% | |
| Germany | 4.0% | |
| France | 3.8% | |
| Switzerland | 3.1% | |
| Netherlands | 1.4% | |
| Australia | 1.4% | |
| Canada | 1.4% | |
| Other | 13.5% | |

Percentages are based on country or territory of incorporation and are adjusted for the effect of futures contracts, if applicable. |
As of April 30, 2012 |
| United States of America | 53.8% | |
| United Kingdom | 10.4% | |
| Japan | 7.7% | |
| France | 2.9% | |
| Netherlands | 2.5% | |
| Germany | 2.5% | |
| Switzerland | 2.0% | |
| Korea (South) | 1.8% | |
| Ireland | 1.7% | |
| Other | 14.7% | |

Percentages are based on country or territory of incorporation and are adjusted for the effect of futures contracts, if applicable. |
Asset Allocation |
| % of fund's
net assets | % of fund's net assets
6 months ago |
Stocks and Investment Companies | 95.6 | 98.0 |
Short-Term Investments and Net Other Assets (Liabilities) | 4.4 | 2.0 |
Top Ten Stocks as of October 31, 2012 |
| % of fund's
net assets | % of fund's net assets
6 months ago |
MasterCard, Inc. Class A (United States of America, IT Services) | 3.1 | 3.0 |
Amgen, Inc. (United States of America, Biotechnology) | 1.8 | 0.6 |
American Tower Corp. (United States of America, Real Estate Investment Trusts) | 1.8 | 0.8 |
Pioneer Natural Resources Co. (United States of America, Oil, Gas & Consumable Fuels) | 1.7 | 1.5 |
Gilead Sciences, Inc. (United States of America, Biotechnology) | 1.6 | 0.3 |
General Electric Co. (United States of America, Industrial Conglomerates) | 1.6 | 0.0 |
Apple, Inc. (United States of America, Computers & Peripherals) | 1.5 | 1.7 |
Phillips 66 (United States of America, Oil, Gas & Consumable Fuels) | 1.5 | 0.0 |
Wal-Mart Stores, Inc. (United States of America, Food & Staples Retailing) | 1.5 | 0.0 |
eBay, Inc. (United States of America, Internet Software & Services) | 1.4 | 0.0 |
| 17.5 | |
Market Sectors as of October 31, 2012 |
| % of fund's
net assets | % of fund's net assets
6 months ago |
Financials | 20.2 | 15.9 |
Consumer Discretionary | 16.4 | 17.8 |
Information Technology | 12.2 | 19.9 |
Health Care | 11.6 | 7.8 |
Industrials | 11.3 | 10.8 |
Energy | 8.8 | 7.3 |
Consumer Staples | 7.8 | 10.3 |
Materials | 3.9 | 4.8 |
Telecommunication Services | 2.5 | 2.1 |
Utilities | 0.9 | 1.3 |
Annual Report
Fidelity Worldwide Fund
Investments October 31, 2012
Showing Percentage of Net Assets
Common Stocks - 95.0% |
| Shares | | Value |
Australia - 1.4% |
Australia & New Zealand Banking Group Ltd. | 290,317 | | $ 7,669,703 |
Commonwealth Bank of Australia | 59,860 | | 3,588,451 |
Ramsay Health Care Ltd. | 86,433 | | 2,131,789 |
Spark Infrastructure Group unit | 1,274,589 | | 2,236,017 |
TOTAL AUSTRALIA | | 15,625,960 |
Bailiwick of Jersey - 0.8% |
Experian PLC | 300,300 | | 5,185,318 |
Wolseley PLC | 95,060 | | 4,155,689 |
TOTAL BAILIWICK OF JERSEY | | 9,341,007 |
Belgium - 1.2% |
Anheuser-Busch InBev SA NV | 165,711 | | 13,858,603 |
Bermuda - 0.2% |
Cheung Kong Infrastructure Holdings Ltd. | 398,000 | | 2,331,495 |
Brazil - 0.6% |
Arezzo Industria e Comercio SA | 34,300 | | 612,183 |
Qualicorp SA (a) | 329,000 | | 3,375,771 |
Souza Cruz SA | 112,500 | | 1,467,837 |
Totvs SA | 68,100 | | 1,384,766 |
TOTAL BRAZIL | | 6,840,557 |
British Virgin Islands - 0.1% |
Gem Diamonds Ltd. (a) | 43,875 | | 119,481 |
Mail.ru Group Ltd. GDR (Reg. S) | 41,300 | | 1,377,355 |
TOTAL BRITISH VIRGIN ISLANDS | | 1,496,836 |
Canada - 1.4% |
Canadian Pacific | 113,000 | | 10,395,434 |
Catamaran Corp. (a) | 60,150 | | 2,824,566 |
Goldcorp, Inc. | 35,100 | | 1,586,748 |
InterOil Corp. (a) | 10,500 | | 677,040 |
TOTAL CANADA | | 15,483,788 |
Cayman Islands - 0.2% |
Eurasia Drilling Co. Ltd. GDR (Reg. S) | 27,100 | | 937,660 |
Sands China Ltd. | 277,200 | | 1,042,623 |
TOTAL CAYMAN ISLANDS | | 1,980,283 |
Denmark - 0.8% |
Novo Nordisk A/S Series B | 48,916 | | 7,841,994 |
William Demant Holding A/S (a) | 19,000 | | 1,634,132 |
TOTAL DENMARK | | 9,476,126 |
France - 3.8% |
Arkema SA | 20,430 | | 1,862,627 |
Atos Origin SA | 24,076 | | 1,616,788 |
AXA SA | 237,737 | | 3,779,372 |
BNP Paribas SA | 136,530 | | 6,867,948 |
Bureau Veritas SA | 32,900 | | 3,493,768 |
Credit Agricole SA (a) | 218,100 | | 1,641,865 |
|
| Shares | | Value |
Iliad SA | 20,580 | | $ 3,170,296 |
Lafarge SA (Bearer) | 28,700 | | 1,680,674 |
LVMH Moet Hennessy - Louis Vuitton SA | 21,299 | | 3,461,880 |
PPR SA | 23,950 | | 4,210,955 |
Sanofi SA | 57,258 | | 5,028,826 |
Schneider Electric SA | 74,000 | | 4,626,465 |
Technip SA | 11,800 | | 1,329,098 |
TOTAL FRANCE | | 42,770,562 |
Germany - 3.4% |
Aareal Bank AG (a) | 63,891 | | 1,370,544 |
Allianz AG | 23,424 | | 2,904,335 |
BASF AG | 60,232 | | 4,990,996 |
Bayerische Motoren Werke AG (BMW) | 58,087 | | 4,626,538 |
Brenntag AG | 17,900 | | 2,256,074 |
Fresenius Medical Care AG & Co. KGaA | 22,400 | | 1,573,920 |
Fresenius SE & Co. KGaA | 15,800 | | 1,802,167 |
GEA Group AG | 59,653 | | 1,862,620 |
Gerry Weber International AG (Bearer) | 19,400 | | 880,589 |
GSW Immobilien AG | 32,983 | | 1,357,128 |
HeidelbergCement Finance AG | 31,600 | | 1,674,787 |
MTU Aero Engines Holdings AG | 17,300 | | 1,452,588 |
SAP AG | 75,739 | | 5,523,119 |
Siemens AG | 27,761 | | 2,797,170 |
Wirecard AG | 97,400 | | 2,225,700 |
TOTAL GERMANY | | 37,298,275 |
Hong Kong - 0.9% |
AIA Group Ltd. | 931,000 | | 3,687,938 |
HKT Trust / HKT Ltd. unit | 1,451,000 | | 1,346,145 |
Techtronic Industries Co. Ltd. | 2,334,000 | | 4,445,112 |
TOTAL HONG KONG | | 9,479,195 |
India - 0.5% |
Apollo Hospitals Enterprise Ltd. | 25,151 | | 364,585 |
Housing Development Finance Corp. Ltd. | 205,593 | | 2,912,997 |
Titan Industries Ltd. | 374,259 | | 1,803,649 |
TOTAL INDIA | | 5,081,231 |
Indonesia - 0.3% |
PT Media Nusantara Citra Tbk | 2,557,500 | | 752,203 |
PT Sarana Menara Nusantara Tbk (a) | 371,000 | | 753,198 |
PT Tower Bersama Infrastructure Tbk (a) | 3,318,000 | | 1,727,218 |
TOTAL INDONESIA | | 3,232,619 |
Ireland - 1.3% |
Accenture PLC Class A | 88,000 | | 5,932,080 |
Alkermes PLC (a) | 84,000 | | 1,556,520 |
James Hardie Industries NV CDI | 365,087 | | 3,497,972 |
Paddy Power PLC (Ireland) | 29,700 | | 2,191,943 |
Trinity Biotech PLC sponsored ADR | 35,000 | | 494,900 |
XL Group PLC Class A | 25,000 | | 618,500 |
TOTAL IRELAND | | 14,291,915 |
Common Stocks - continued |
| Shares | | Value |
Israel - 0.2% |
Check Point Software Technologies Ltd. (a) | 44,700 | | $ 1,990,491 |
Italy - 1.3% |
ENI SpA | 175,500 | | 4,038,418 |
Fiat Industrial SpA | 193,937 | | 2,100,208 |
Prada SpA | 253,200 | | 2,064,792 |
Prysmian SpA | 95,200 | | 1,831,159 |
Saipem SpA | 90,615 | | 4,070,839 |
TOTAL ITALY | | 14,105,416 |
Japan - 7.4% |
ABC-Mart, Inc. | 70,200 | | 3,077,790 |
Aeon Credit Service Co. Ltd. | 128,500 | | 2,726,782 |
Aozora Bank Ltd. | 474,000 | | 1,335,964 |
Calbee, Inc. | 21,000 | | 1,928,222 |
Chiyoda Corp. | 171,000 | | 2,758,963 |
Cosmos Pharmaceutical Corp. | 22,900 | | 2,257,585 |
Credit Saison Co. Ltd. | 48,900 | | 1,073,803 |
Daito Trust Construction Co. Ltd. | 13,300 | | 1,342,829 |
Don Quijote Co. Ltd. | 109,500 | | 4,313,886 |
Fanuc Corp. | 17,600 | | 2,802,155 |
Fast Retailing Co. Ltd. | 12,900 | | 2,873,130 |
Hitachi Ltd. | 530,000 | | 2,808,343 |
Honda Motor Co. Ltd. | 95,300 | | 2,865,028 |
Japan Tobacco, Inc. | 167,600 | | 4,631,412 |
JS Group Corp. | 116,000 | | 2,564,700 |
JSR Corp. | 137,200 | | 2,351,116 |
Kakaku.com, Inc. | 54,300 | | 1,860,334 |
Keyence Corp. | 18,460 | | 4,897,693 |
Mitsubishi Estate Co. Ltd. | 163,000 | | 3,224,064 |
Mitsubishi UFJ Financial Group, Inc. | 910,900 | | 4,120,883 |
Nintendo Co. Ltd. | 12,500 | | 1,609,671 |
ORIX Corp. | 79,370 | | 8,152,750 |
Park24 Co. Ltd. | 83,900 | | 1,441,949 |
Rakuten, Inc. | 480,600 | | 4,322,570 |
Seven Bank Ltd. | 795,700 | | 2,272,574 |
Ship Healthcare Holdings, Inc. | 33,300 | | 1,110,834 |
So-net M3, Inc. | 330 | | 634,123 |
Softbank Corp. | 47,800 | | 1,513,098 |
Suzuki Motor Corp. | 86,200 | | 1,952,269 |
Unicharm Corp. | 38,600 | | 2,088,839 |
USS Co. Ltd. | 12,140 | | 1,275,894 |
TOTAL JAPAN | | 82,189,253 |
Korea (South) - 1.1% |
Hyundai Motor Co. | 16,534 | | 3,404,398 |
Kia Motors Corp. | 17,240 | | 958,199 |
LG Household & Health Care Ltd. | 3,511 | | 2,064,120 |
NHN Corp. | 3,893 | | 901,554 |
Orion Corp. | 742 | | 696,867 |
Samsung Electronics Co. Ltd. | 3,934 | | 4,726,631 |
TOTAL KOREA (SOUTH) | | 12,751,769 |
|
| Shares | | Value |
Luxembourg - 0.3% |
Brait SA | 360,653 | | $ 1,418,379 |
Samsonite International SA | 798,000 | | 1,657,770 |
TOTAL LUXEMBOURG | | 3,076,149 |
Netherlands - 1.4% |
AEGON NV | 292,700 | | 1,636,970 |
ASML Holding NV | 59,100 | | 3,248,727 |
Gemalto NV | 33,993 | | 3,067,459 |
ING Groep NV (Certificaten Van Aandelen) (a) | 309,500 | | 2,753,973 |
LyondellBasell Industries NV Class A | 29,000 | | 1,548,310 |
Randstad Holding NV | 42,858 | | 1,399,037 |
Yandex NV (a) | 98,600 | | 2,295,408 |
TOTAL NETHERLANDS | | 15,949,884 |
Norway - 0.5% |
DnB NOR ASA | 326,400 | | 4,076,207 |
Gjensidige Forsikring ASA | 109,900 | | 1,605,716 |
TOTAL NORWAY | | 5,681,923 |
Poland - 0.2% |
Eurocash SA | 215,900 | | 2,636,663 |
Qatar - 0.1% |
Commercial Bank of Qatar GDR (Reg. S) | 306,102 | | 1,208,956 |
Russia - 0.3% |
Mobile TeleSystems OJSC sponsored ADR | 178,700 | | 3,062,918 |
South Africa - 0.3% |
Distell Group Ltd. | 126,410 | | 1,399,591 |
Shoprite Holdings Ltd. | 95,600 | | 1,965,883 |
TOTAL SOUTH AFRICA | | 3,365,474 |
Spain - 1.1% |
Amadeus IT Holding SA Class A | 63,100 | | 1,562,133 |
Banco Bilbao Vizcaya Argentaria SA | 402,808 | | 3,365,846 |
Grifols SA ADR | 71,850 | | 1,807,746 |
Inditex SA | 39,477 | | 5,036,989 |
TOTAL SPAIN | | 11,772,714 |
Sweden - 1.1% |
Atlas Copco AB (A Shares) | 176,100 | | 4,330,219 |
Intrum Justitia AB | 115,000 | | 1,664,430 |
Svenska Handelsbanken AB (A Shares) | 115,600 | | 3,959,704 |
Swedish Match Co. AB | 78,000 | | 2,657,661 |
TOTAL SWEDEN | | 12,612,014 |
Switzerland - 3.1% |
ACE Ltd. | 48,000 | | 3,775,200 |
Adecco SA (Reg.) | 35,860 | | 1,734,279 |
Partners Group Holding AG | 13,818 | | 2,924,437 |
Roche Holding AG (participation certificate) | 23,638 | | 4,545,867 |
Common Stocks - continued |
| Shares | | Value |
Switzerland - continued |
Schindler Holding AG (participation certificate) | 33,294 | | $ 4,386,528 |
SGS SA (Reg.) | 780 | | 1,651,627 |
Swatch Group AG (Bearer) | 2,200 | | 910,426 |
Syngenta AG (Switzerland) | 5,030 | | 1,961,144 |
UBS AG | 248,020 | | 3,721,191 |
UBS AG (NY Shares) | 225,000 | | 3,379,500 |
Zurich Financial Services AG | 20,820 | | 5,130,667 |
TOTAL SWITZERLAND | | 34,120,866 |
Turkey - 0.1% |
Boyner Buyuk Magazacilik A/S (a) | 280,000 | | 643,570 |
United Kingdom - 10.0% |
Aberdeen Asset Management PLC | 355,842 | | 1,863,409 |
Aggreko PLC | 86,400 | | 2,997,702 |
Anglo American PLC (United Kingdom) | 45,018 | | 1,382,488 |
Ashmore Group PLC | 187,900 | | 1,102,824 |
Barclays PLC | 772,037 | | 2,854,788 |
Bellway PLC | 60,700 | | 990,321 |
BG Group PLC | 274,063 | | 5,075,039 |
BHP Billiton PLC | 272,542 | | 8,735,313 |
British American Tobacco PLC (United Kingdom) | 145,200 | | 7,201,863 |
British Land Co. PLC | 332,855 | | 2,838,810 |
Diageo PLC | 244,804 | | 6,998,587 |
Domino's Pizza UK & IRL PLC | 149,600 | | 1,220,363 |
GlaxoSmithKline PLC | 169,900 | | 3,807,028 |
Hikma Pharmaceuticals PLC | 121,783 | | 1,453,319 |
HSBC Holdings PLC (United Kingdom) | 715,328 | | 7,052,627 |
Intertek Group PLC | 46,500 | | 2,115,360 |
Jazztel PLC (a) | 353,900 | | 2,343,995 |
Legal & General Group PLC | 2,217,925 | | 4,796,096 |
Lloyds Banking Group PLC (a) | 2,942,200 | | 1,937,448 |
London Stock Exchange Group PLC | 93,500 | | 1,471,889 |
Meggitt PLC | 416,600 | | 2,595,033 |
Next PLC | 43,800 | | 2,520,529 |
Ocado Group PLC (a)(d) | 898,900 | | 935,637 |
Persimmon PLC | 145,600 | | 1,867,948 |
Rolls-Royce Group PLC | 271,600 | | 3,745,227 |
Rolls-Royce Group PLC Class C | 20,641,600 | | 33,310 |
Rotork PLC | 44,510 | | 1,636,242 |
Royal Dutch Shell PLC Class B (United Kingdom) | 371,647 | | 13,146,061 |
SABMiller PLC | 68,400 | | 2,930,050 |
Standard Chartered PLC (United Kingdom) | 106,579 | | 2,517,101 |
Taylor Wimpey PLC | 1,367,400 | | 1,348,258 |
The Weir Group PLC | 47,100 | | 1,324,053 |
Ultra Electronics Holdings PLC | 36,900 | | 1,008,137 |
Vodafone Group PLC | 2,244,100 | | 6,094,158 |
Vodafone Group PLC sponsored ADR | 47,212 | | 1,285,111 |
TOTAL UNITED KINGDOM | | 111,226,124 |
|
| Shares | | Value |
United States of America - 49.6% |
Abbott Laboratories | 147,000 | | $ 9,631,440 |
American International Group, Inc. (a) | 332,000 | | 11,596,760 |
American Tower Corp. | 259,000 | | 19,500,110 |
Amgen, Inc. | 234,000 | | 20,251,530 |
Apple, Inc. | 28,600 | | 17,019,860 |
Beam, Inc. | 54,900 | | 3,050,244 |
Berkshire Hathaway, Inc. Class B (a) | 109,000 | | 9,412,150 |
Cabela's, Inc. Class A (a) | 263,000 | | 11,785,030 |
Cabot Oil & Gas Corp. | 291,000 | | 13,671,180 |
Capital One Financial Corp. | 165,000 | | 9,928,050 |
Citigroup, Inc. | 336,000 | | 12,563,040 |
Citrix Systems, Inc. (a) | 18,209 | | 1,125,498 |
Clean Harbors, Inc. (a) | 13,000 | | 758,550 |
Cognizant Technology Solutions Corp. Class A (a) | 23,300 | | 1,552,945 |
Comcast Corp. Class A | 404,000 | | 15,154,040 |
Constellation Brands, Inc. Class A (sub. vtg.) (a) | 69,000 | | 2,438,460 |
Crown Castle International Corp. (a) | 44,000 | | 2,937,000 |
Discover Financial Services | 211,000 | | 8,651,000 |
Discovery Communications, Inc. (a) | 254,000 | | 14,991,080 |
DISH Network Corp. Class A | 45,000 | | 1,603,350 |
Dollar General Corp. (a) | 23,900 | | 1,162,018 |
Eastman Chemical Co. | 13,000 | | 770,120 |
eBay, Inc. (a) | 324,800 | | 15,684,592 |
Estee Lauder Companies, Inc. Class A | 89,700 | | 5,527,314 |
Facebook, Inc. Class A | 88,000 | | 1,858,120 |
Foot Locker, Inc. | 71,000 | | 2,378,500 |
Freeport-McMoRan Copper & Gold, Inc. | 108,000 | | 4,199,040 |
G-III Apparel Group Ltd. (a) | 68,000 | | 2,513,280 |
General Electric Co. | 832,800 | | 17,538,768 |
Georgia Gulf Corp. (d) | 35,200 | | 1,245,728 |
Gilead Sciences, Inc. (a) | 270,000 | | 18,133,200 |
GNC Holdings, Inc. | 159,000 | | 6,148,530 |
Home Depot, Inc. | 134,000 | | 8,224,920 |
International Paper Co. | 90,000 | | 3,224,700 |
J.B. Hunt Transport Services, Inc. | 164,600 | | 9,662,020 |
James River Coal Co. (a)(d) | 310,000 | | 1,553,100 |
Johnson & Johnson | 128,000 | | 9,064,960 |
Lumber Liquidators Holdings, Inc. (a) | 25,000 | | 1,395,500 |
M&T Bank Corp. | 80,000 | | 8,328,000 |
Marathon Petroleum Corp. | 66,000 | | 3,625,380 |
MasterCard, Inc. Class A | 74,400 | | 34,293,189 |
Medivation, Inc. (a) | 44,000 | | 2,249,280 |
Merck & Co., Inc. | 148,000 | | 6,753,240 |
Michael Kors Holdings Ltd. | 33,200 | | 1,815,708 |
Noble Energy, Inc. | 78,000 | | 7,410,780 |
Ocwen Financial Corp. (a) | 73,000 | | 2,815,610 |
Onyx Pharmaceuticals, Inc. (a) | 101,000 | | 7,914,360 |
Palo Alto Networks, Inc. | 3,300 | | 181,434 |
Peabody Energy Corp. | 224,000 | | 6,249,600 |
Pfizer, Inc. | 365,000 | | 9,077,550 |
Common Stocks - continued |
| Shares | | Value |
United States of America - continued |
Phillips 66 | 360,000 | | $ 16,977,600 |
Pioneer Natural Resources Co. | 183,900 | | 19,429,035 |
Prestige Brands Holdings, Inc. (a) | 304,000 | | 5,286,560 |
PulteGroup, Inc. (a) | 384,000 | | 6,658,560 |
PVH Corp. | 50,000 | | 5,499,500 |
Ralph Lauren Corp. | 9,000 | | 1,383,210 |
Realogy Holdings Corp. | 78,800 | | 2,800,552 |
Royal Gold, Inc. | 24,200 | | 2,131,536 |
salesforce.com, Inc. (a) | 77,000 | | 11,240,460 |
SBA Communications Corp. Class A (a) | 54,000 | | 3,598,020 |
Sempra Energy | 75,800 | | 5,287,050 |
Sirius XM Radio, Inc. (a) | 415,000 | | 1,162,000 |
The Cooper Companies, Inc. | 25,000 | | 2,399,500 |
The Travelers Companies, Inc. | 70,000 | | 4,965,800 |
TJX Companies, Inc. | 237,500 | | 9,887,125 |
Toll Brothers, Inc. (a) | 108,000 | | 3,565,080 |
Total System Services, Inc. | 67,900 | | 1,527,071 |
Under Armour, Inc. Class A (sub. vtg.) (a) | 67,200 | | 3,511,872 |
Union Pacific Corp. | 120,400 | | 14,812,812 |
United Rentals, Inc. (a) | 88,000 | | 3,578,080 |
Urban Outfitters, Inc. (a) | 63,000 | | 2,252,880 |
USG Corp. (a) | 61,000 | | 1,629,310 |
Visa, Inc. Class A | 36,000 | | 4,995,360 |
Wal-Mart Stores, Inc. | 215,000 | | 16,129,300 |
Watson Pharmaceuticals, Inc. (a) | 19,100 | | 1,641,645 |
Wells Fargo & Co. | 230,000 | | 7,748,700 |
Whirlpool Corp. | 16,000 | | 1,562,880 |
Workday, Inc. | 16,250 | | 788,125 |
TOTAL UNITED STATES OF AMERICA | | 551,069,481 |
TOTAL COMMON STOCKS (Cost $954,498,052) |
1,056,052,117
|
Nonconvertible Preferred Stocks - 0.6% |
| | | |
Germany - 0.6% |
Volkswagen AG
(Cost $4,272,812) | 28,900 | |
5,978,414
|
Investment Companies - 0.0% |
| Shares | | Value |
Cyprus - 0.0% |
Aisi Realty Public Ltd. (a)
(Cost $430,048) | 31,822 | | $ 37,744 |
Money Market Funds - 4.8% |
| | | |
Fidelity Cash Central Fund, 0.19% (b) | 51,411,090 | | 51,411,090 |
Fidelity Securities Lending Cash Central Fund, 0.19% (b)(c) | 2,317,903 | | 2,317,903 |
TOTAL MONEY MARKET FUNDS (Cost $53,728,993) |
53,728,993
|
TOTAL INVESTMENT PORTFOLIO - 100.4% (Cost $1,012,929,905) | 1,115,797,268 |
NET OTHER ASSETS (LIABILITIES) - (0.4)% | (3,962,689) |
NET ASSETS - 100% | $ 1,111,834,579 |
Legend |
(a) Non-income producing |
(b) Affiliated fund that is available only to investment companies and other accounts managed by Fidelity Investments. The rate quoted is the annualized seven-day yield of the fund at period end. A complete unaudited listing of the fund's holdings as of its most recent quarter end is available upon request. In addition, each Fidelity Central Fund's financial statements, which are not covered by the Fund's Report of Independent Registered Public Accounting Firm, are available on the SEC's website or upon request. |
(c) Investment made with cash collateral received from securities on loan. |
(d) Security or a portion of the security is on loan at period end. |
Affiliated Central Funds |
Information regarding fiscal year to date income earned by the Fund from investments in Fidelity Central Funds is as follows: |
Fund | Income earned |
Fidelity Cash Central Fund | $ 40,337 |
Fidelity Securities Lending Cash Central Fund | 279,543 |
Total | $ 319,880 |
Other Information |
Categorizations in the Schedule of Investments are based on country or territory of incorporation. |
The following is a summary of the inputs used, as of October 31, 2012, involving the Fund's assets and liabilities carried at fair value. The inputs or methodology used for valuing securities may not be an indication of the risk associated with investing in those securities. For more information on valuation inputs, and their aggregation into the levels used in the tables below, please refer to the Security Valuation section in the accompanying Notes to Financial Statements. |
Valuation Inputs at Reporting Date: |
Description | Total | Level 1 | Level 2 | Level 3 |
Investments in Securities: | | | | |
Equities: | | | | |
Consumer Discretionary | $ 176,900,919 | $ 174,035,891 | $ 2,865,028 | $ - |
Consumer Staples | 87,215,661 | 59,156,608 | 28,059,053 | - |
Energy | 98,190,830 | 81,006,351 | 17,184,479 | - |
Financials | 224,349,940 | 196,906,214 | 27,443,726 | - |
Health Care | 129,104,792 | 110,853,024 | 18,251,768 | - |
Industrials | 128,324,984 | 125,527,814 | 2,797,170 | - |
Information Technology | 137,294,906 | 131,771,787 | 5,523,119 | - |
Materials | 42,962,780 | 32,266,323 | 10,696,457 | - |
Telecommunication Services | 27,831,157 | 21,736,999 | 6,094,158 | - |
Utilities | 9,854,562 | 9,854,562 | - | - |
Investment Companies | 37,744 | 37,744 | - | - |
Money Market Funds | 53,728,993 | 53,728,993 | - | - |
Total Investments in Securities: | $ 1,115,797,268 | $ 996,882,310 | $ 118,914,958 | $ - |
The following is a summary of transfers between Level 1 and Level 2 for the period ended October 31, 2012. Transfers are assumed to have occurred at the beginning of the period, and are primarily attributable to the valuation techniques used for foreign equity securities, as discussed in the accompanying Notes to Financial Statements. |
Transfers | Total |
Level 1 to Level 2 | $ 0 |
Level 2 to Level 1 | $ 90,641,463 |
See accompanying notes which are an integral part of the financial statements.
Annual Report
Fidelity Worldwide Fund
Statement of Assets and Liabilities
| October 31, 2012 |
| | |
Assets | | |
Investment in securities, at value (including securities loaned of $2,205,469) - See accompanying schedule: Unaffiliated issuers (cost $959,200,912) | $ 1,062,068,275 | |
Fidelity Central Funds (cost $53,728,993) | 53,728,993 | |
Total Investments (cost $1,012,929,905) | | $ 1,115,797,268 |
Foreign currency held at value (cost $44) | | 44 |
Receivable for investments sold | | 10,574,510 |
Receivable for fund shares sold | | 940,937 |
Dividends receivable | | 1,164,537 |
Distributions receivable from Fidelity Central Funds | | 22,934 |
Other receivables | | 304,491 |
Total assets | | 1,128,804,721 |
| | |
Liabilities | | |
Payable for investments purchased | $ 10,558,754 | |
Payable for fund shares redeemed | 2,935,923 | |
Accrued management fee | 817,065 | |
Distribution and service plan fees payable | 7,965 | |
Other affiliated payables | 252,086 | |
Other payables and accrued expenses | 80,446 | |
Collateral on securities loaned, at value | 2,317,903 | |
Total liabilities | | 16,970,142 |
| | |
Net Assets | | $ 1,111,834,579 |
Net Assets consist of: | | |
Paid in capital | | $ 1,006,383,968 |
Undistributed net investment income | | 7,478,979 |
Accumulated undistributed net realized gain (loss) on investments and foreign currency transactions | | (4,823,058) |
Net unrealized appreciation (depreciation) on investments and assets and liabilities in foreign currencies | | 102,794,690 |
Net Assets | | $ 1,111,834,579 |
Statement of Assets and Liabilities - continued
| October 31, 2012 |
| | |
Calculation of Maximum Offering Price Class A:
Net Asset Value and redemption price per share ($18,723,279 ÷ 950,719 shares) | | $ 19.69 |
| | |
Maximum offering price per share (100/94.25 of $19.69) | | $ 20.89 |
Class T:
Net Asset Value and redemption price per share ($5,550,095 ÷ 283,053 shares) | | $ 19.61 |
| | |
Maximum offering price per share (100/96.50 of $19.61) | | $ 20.32 |
Class B:
Net Asset Value and offering price per share ($303,960 ÷ 15,635 shares)A | | $ 19.44 |
| | |
Class C:
Net Asset Value and offering price per share ($1,726,205 ÷ 88,954 shares)A | | $ 19.41 |
| | |
Worldwide:
Net Asset Value, offering price and redemption price per share ($1,081,240,346 ÷ 54,468,873 shares) | | $ 19.85 |
| | |
Institutional Class:
Net Asset Value, offering price and redemption price per share ($4,290,694 ÷ 216,909 shares) | | $ 19.78 |
A Redemption price per share is equal to net asset value less any applicable contingent deferred sales charge.
See accompanying notes which are an integral part of the financial statements.
Annual Report
Statement of Operations
| Year ended October 31, 2012 |
Investment Income | | |
Dividends | | $ 21,411,923 |
Interest | | 1,045 |
Income from Fidelity Central Funds | | 319,880 |
Income before foreign taxes withheld | | 21,732,848 |
Less foreign taxes withheld | | (812,686) |
Total income | | 20,920,162 |
| | |
Expenses | | |
Management fee
Basic fee | $ 7,679,076 | |
Performance adjustment | 954,154 | |
Transfer agent fees | 2,526,973 | |
Distribution and service plan fees | 76,255 | |
Accounting and security lending fees | 503,914 | |
Custodian fees and expenses | 178,378 | |
Independent trustees' compensation | 7,299 | |
Registration fees | 91,889 | |
Audit | 78,615 | |
Legal | 6,059 | |
Interest | 56 | |
Miscellaneous | 12,139 | |
Total expenses before reductions | 12,114,807 | |
Expense reductions | (206,687) | 11,908,120 |
Net investment income (loss) | | 9,012,042 |
Realized and Unrealized Gain (Loss) Net realized gain (loss) on: | | |
Investment securities: | | |
Unaffiliated issuers | 52,952,242 | |
Foreign currency transactions | (72,889) | |
Total net realized gain (loss) | | 52,879,353 |
Change in net unrealized appreciation (depreciation) on: Investment securities | 45,677,356 | |
Assets and liabilities in foreign currencies | (88,023) | |
Total change in net unrealized appreciation (depreciation) | | 45,589,333 |
Net gain (loss) | | 98,468,686 |
Net increase (decrease) in net assets resulting from operations | | $ 107,480,728 |
Statement of Changes in Net Assets
| Year ended
October 31,
2012 | Year ended
October 31,
2011 |
Increase (Decrease) in Net Assets | | |
Operations | | |
Net investment income (loss) | $ 9,012,042 | $ 7,182,199 |
Net realized gain (loss) | 52,879,353 | 120,543,178 |
Change in net unrealized appreciation (depreciation) | 45,589,333 | (94,457,618) |
Net increase (decrease) in net assets resulting from operations | 107,480,728 | 33,267,759 |
Distributions to shareholders from net investment income | (4,089,511) | (6,244,141) |
Distributions to shareholders from net realized gain | - | (2,870,519) |
Total distributions | (4,089,511) | (9,114,660) |
Share transactions - net increase (decrease) | (126,253,328) | 12,558,124 |
Redemption fees | 23,898 | 33,448 |
Total increase (decrease) in net assets | (22,838,213) | 36,744,671 |
| | |
Net Assets | | |
Beginning of period | 1,134,672,792 | 1,097,928,121 |
End of period (including undistributed net investment income of $7,478,979 and undistributed net investment income of $2,700,979, respectively) | $ 1,111,834,579 | $ 1,134,672,792 |
See accompanying notes which are an integral part of the financial statements.
Annual Report
Financial Highlights - Class A
Years ended October 31, | 2012 | 2011 | 2010 | 2009 H |
Selected Per-Share Data | | | | |
Net asset value, beginning of period | $ 17.89 | $ 17.50 | $ 14.96 | $ 10.88 |
Income from Investment Operations | | | | |
Net investment income (loss) E | .10 | .05 | .03 | (.01) |
Net realized and unrealized gain (loss) | 1.72 | .47 | 2.63 | 4.09 |
Total from investment operations | 1.82 | .52 | 2.66 | 4.08 |
Distributions from net investment income | (.02) | (.08) | (.10) | - |
Distributions from net realized gain | - | (.05) | (.02) | - |
Total distributions | (.02) | (.13) | (.12) | - |
Redemption fees added to paid in capital E,J | - | - | - | - |
Net asset value, end of period | $ 19.69 | $ 17.89 | $ 17.50 | $ 14.96 |
Total Return B,C,D | 10.20% | 2.94% | 17.85% | 37.50% |
Ratios to Average Net Assets F,I | | | | |
Expenses before reductions | 1.43% | 1.41% | 1.43% | 1.52% A |
Expenses net of fee waivers, if any | 1.43% | 1.40% | 1.43% | 1.52% A |
Expenses net of all reductions | 1.41% | 1.38% | 1.41% | 1.49% A |
Net investment income (loss) | .52% | .28% | .21% | (.06)% A |
Supplemental Data | | | | |
Net assets, end of period (000 omitted) | $ 18,723 | $ 13,153 | $ 7,530 | $ 993 |
Portfolio turnover rate G | 186% | 203% | 166% | 224% |
A Annualized
B Total returns for periods of less than one year are not annualized.
C Total returns would have been lower if certain expenses had not been reduced during the applicable periods shown.
D Total returns do not include the effect of the sales charges.
E Calculated based on average shares outstanding during the period.
F Fees and expenses of any underlying Fidelity Central Funds are not included in the Fund's expense ratio. The Fund indirectly bears its proportionate share of the expenses of any underlying Fidelity Central Funds.
G Amount does not include the portfolio activity of any underlying Fidelity Central Funds.
H For the period February 19, 2009 (commencement of sale of shares) to October 31, 2009.
I Expense ratios reflect operating expenses of the class. Expenses before reductions do not reflect amounts reimbursed by the investment adviser or reductions from brokerage service arrangements or reductions from other expense offset arrangements and do not represent the amount paid by the class during periods when reimbursements or reductions occur. Expense ratios before reductions for start-up periods may not be representative of longer-term operating periods. Expenses net of fee waivers reflect expenses after reimbursement by the investment adviser but prior to reductions from brokerage service arrangements or other expense offset arrangements. Expenses net of all reductions represent the net expenses paid by the class.
J Amount represents less than $.01 per share.
Financial Highlights - Class T
Years ended October 31, | 2012 | 2011 | 2010 | 2009 H |
Selected Per-Share Data | | | | |
Net asset value, beginning of period | $ 17.83 | $ 17.46 | $ 14.94 | $ 10.88 |
Income from Investment Operations | | | | |
Net investment income (loss) E | .05 | .01 | (.01) | (.01) |
Net realized and unrealized gain (loss) | 1.73 | .45 | 2.62 | 4.07 |
Total from investment operations | 1.78 | .46 | 2.61 | 4.06 |
Distributions from net investment income | - | (.04) | (.08) | - |
Distributions from net realized gain | - | (.05) | (.02) | - |
Total distributions | - | (.09) | (.09) K | - |
Redemption fees added to paid in capital E,J | - | - | - | - |
Net asset value, end of period | $ 19.61 | $ 17.83 | $ 17.46 | $ 14.94 |
Total Return B,C,D | 9.98% | 2.61% | 17.53% | 37.32% |
Ratios to Average Net Assets F,I | | | | |
Expenses before reductions | 1.68% | 1.66% | 1.70% | 1.73% A |
Expenses net of fee waivers, if any | 1.68% | 1.65% | 1.70% | 1.73% A |
Expenses net of all reductions | 1.66% | 1.63% | 1.68% | 1.70% A |
Net investment income (loss) | .26% | .03% | (.05)% | (.08)% A |
Supplemental Data | | | | |
Net assets, end of period (000 omitted) | $ 5,550 | $ 2,187 | $ 1,120 | $ 458 |
Portfolio turnover rate G | 186% | 203% | 166% | 224% |
A Annualized
B Total returns for periods of less than one year are not annualized.
C Total returns would have been lower if certain expenses had not been reduced during the applicable periods shown.
D Total returns do not include the effect of the sales charges.
E Calculated based on average shares outstanding during the period.
F Fees and expenses of any underlying Fidelity Central Funds are not included in the Fund's expense ratio. The Fund indirectly bears its proportionate share of the expenses of any underlying Fidelity Central Funds.
G Amount does not include the portfolio activity of any underlying Fidelity Central Funds.
H For the period February 19, 2009 (commencement of sale of shares) to October 31, 2009.
I Expense ratios reflect operating expenses of the class. Expenses before reductions do not reflect amounts reimbursed by the investment adviser or reductions from brokerage service arrangements or reductions from other expense offset arrangements and do not represent the amount paid by the class during periods when reimbursements or reductions occur. Expense ratios before reductions for start-up periods may not be representative of longer-term operating periods. Expenses net of fee waivers reflect expenses after reimbursement by the investment adviser but prior to reductions from brokerage service arrangements or other expense offset arrangements. Expenses net of all reductions represent the net expenses paid by the class.
J Amount represents less than $.01 per share.
K Total distributions of $.09 per share is comprised of distributions from net investment income of $.075 and distributions from net realized gain of $.015 per share.
See accompanying notes which are an integral part of the financial statements.
Annual Report
Financial Highlights - Class B
Years ended October 31, | 2012 | 2011 | 2010 | 2009 H |
Selected Per-Share Data | | | | |
Net asset value, beginning of period | $ 17.77 | $ 17.39 | $ 14.89 | $ 10.88 |
Income from Investment Operations | | | | |
Net investment income (loss) E | (.04) | (.09) | (.09) | (.03) |
Net realized and unrealized gain (loss) | 1.71 | .47 | 2.61 | 4.04 |
Total from investment operations | 1.67 | .38 | 2.52 | 4.01 |
Distributions from net investment income | - | - | (.01) | - |
Distributions from net realized gain | - | - | (.01) | - |
Total distributions | - | - | (.02) | - |
Redemption fees added to paid in capital E,J | - | - | - | - |
Net asset value, end of period | $ 19.44 | $ 17.77 | $ 17.39 | $ 14.89 |
Total Return B,C,D | 9.40% | 2.19% | 16.92% | 36.86% |
Ratios to Average Net Assets F,I | | | | |
Expenses before reductions | 2.18% | 2.16% | 2.19% | 2.20% A |
Expenses net of fee waivers, if any | 2.18% | 2.16% | 2.19% | 2.20% A |
Expenses net of all reductions | 2.16% | 2.13% | 2.17% | 2.17% A |
Net investment income (loss) | (.23)% | (.47)% | (.55)% | (.30)% A |
Supplemental Data | | | | |
Net assets, end of period (000 omitted) | $ 304 | $ 256 | $ 305 | $ 224 |
Portfolio turnover rate G | 186% | 203% | 166% | 224% |
A Annualized
B Total returns for periods of less than one year are not annualized.
C Total returns would have been lower if certain expenses had not been reduced during the applicable periods shown.
D Total returns do not include the effect of the contingent deferred sales charge.
E Calculated based on average shares outstanding during the period.
F Fees and expenses of any underlying Fidelity Central Funds are not included in the Fund's expense ratio. The Fund indirectly bears its proportionate share of the expenses of any underlying Fidelity Central Funds.
G Amount does not include the portfolio activity of any underlying Fidelity Central Funds.
H For the period February 19, 2009 (commencement of sale of shares) to October 31, 2009.
I Expense ratios reflect operating expenses of the class. Expenses before reductions do not reflect amounts reimbursed by the investment adviser or reductions from brokerage service arrangements or reductions from other expense offset arrangements and do not represent the amount paid by the class during periods when reimbursements or reductions occur. Expense ratios before reductions for start-up periods may not be representative of longer-term operating periods. Expenses net of fee waivers reflect expenses after reimbursement by the investment adviser but prior to reductions from brokerage service arrangements or other expense offset arrangements. Expenses net of all reductions represent the net expenses paid by the class.
J Amount represents less than $.01 per share.
Financial Highlights - Class C
Years ended October 31, | 2012 | 2011 | 2010 | 2009 H |
Selected Per-Share Data | | | | |
Net asset value, beginning of period | $ 17.74 | $ 17.36 | $ 14.89 | $ 10.88 |
Income from Investment Operations | | | | |
Net investment income (loss) E | (.04) | (.09) | (.09) | (.04) |
Net realized and unrealized gain (loss) | 1.71 | .47 | 2.61 | 4.05 |
Total from investment operations | 1.67 | .38 | 2.52 | 4.01 |
Distributions from net investment income | - | - | (.03) | - |
Distributions from net realized gain | - | - | (.02) | - |
Total distributions | - | - | (.05) | - |
Redemption fees added to paid in capital E,J | - | - | - | - |
Net asset value, end of period | $ 19.41 | $ 17.74 | $ 17.36 | $ 14.89 |
Total Return B,C,D | 9.41% | 2.19% | 16.94% | 36.86% |
Ratios to Average Net Assets F,I | | | | |
Expenses before reductions | 2.18% | 2.16% | 2.19% | 2.18% A |
Expenses net of fee waivers, if any | 2.18% | 2.15% | 2.19% | 2.18% A |
Expenses net of all reductions | 2.16% | 2.13% | 2.16% | 2.15% A |
Net investment income (loss) | (.23)% | (.47)% | (.54)% | (.39)% A |
Supplemental Data | | | | |
Net assets, end of period (000 omitted) | $ 1,726 | $ 1,297 | $ 710 | $ 335 |
Portfolio turnover rate G | 186% | 203% | 166% | 224% |
A Annualized
B Total returns for periods of less than one year are not annualized.
C Total returns would have been lower if certain expenses had not been reduced during the applicable periods shown.
D Total returns do not include the effect of the contingent deferred sales charge.
E Calculated based on average shares outstanding during the period.
F Fees and expenses of any underlying Fidelity Central Funds are not included in the Fund's expense ratio. The Fund indirectly bears its proportionate share of the expenses of any underlying Fidelity Central Funds.
G Amount does not include the portfolio activity of any underlying Fidelity Central Funds.
H For the period February 19, 2009 (commencement of sale of shares) to October 31, 2009.
I Expense ratios reflect operating expenses of the class. Expenses before reductions do not reflect amounts reimbursed by the investment adviser or reductions from brokerage service arrangements or reductions from other expense offset arrangements and do not represent the amount paid by the class during periods when reimbursements or reductions occur. Expense ratios before reductions for start-up periods may not be representative of longer-term operating periods. Expenses net of fee waivers reflect expenses after reimbursement by the investment adviser but prior to reductions from brokerage service arrangements or other expense offset arrangements. Expenses net of all reductions represent the net expenses paid by the class.
J Amount represents less than $.01 per share.
See accompanying notes which are an integral part of the financial statements.
Annual Report
Financial Highlights - Worldwide
Years ended October 31, | 2012 | 2011 | 2010 | 2009 | 2008 |
Selected Per-Share Data | | | | | |
Net asset value, beginning of period | $ 18.02 | $ 17.58 | $ 14.98 | $ 13.40 | $ 25.18 |
Income from Investment Operations | | | | | |
Net investment income (loss) B | .16 | .11 | .08 | .12 | .16 |
Net realized and unrealized gain (loss) | 1.74 | .48 | 2.63 | 1.63 | (9.44) |
Total from investment operations | 1.90 | .59 | 2.71 | 1.75 | (9.28) |
Distributions from net investment income | (.07) | (.10) | (.10) | (.17) | (.12) |
Distributions from net realized gain | - | (.05) | (.02) | - | (2.38) |
Total distributions | (.07) | (.15) | (.11) G | (.17) | (2.50) |
Redemption fees added to paid in capital B,F | - | - | - | - | - |
Net asset value, end of period | $ 19.85 | $ 18.02 | $ 17.58 | $ 14.98 | $ 13.40 |
Total Return A | 10.56% | 3.32% | 18.18% | 13.39% | (40.66)% |
Ratios to Average Net Assets C,E | | | | | |
Expenses before reductions | 1.11% | 1.08% | 1.15% | 1.27% | 1.21% |
Expenses net of fee waivers, if any | 1.11% | 1.08% | 1.15% | 1.27% | 1.21% |
Expenses net of all reductions | 1.09% | 1.05% | 1.12% | 1.24% | 1.19% |
Net investment income (loss) | .84% | .60% | .50% | .92% | .84% |
Supplemental Data | | | | | |
Net assets, end of period (000 omitted) | $ 1,081,240 | $ 1,114,694 | $ 1,087,928 | $ 991,996 | $ 934,885 |
Portfolio turnover rate D | 186% | 203% | 166% | 224% | 264% |
A Total returns would have been lower if certain expenses had not been reduced during the applicable periods shown.
B Calculated based on average shares outstanding during the period.
C Fees and expenses of any underlying Fidelity Central Funds are not included in the Fund's expense ratio. The Fund indirectly bears its proportionate share of the expenses of any underlying Fidelity Central Funds.
D Amount does not include the portfolio activity of any underlying Fidelity Central Funds.
E Expense ratios reflect operating expenses of the class. Expenses before reductions do not reflect amounts reimbursed by the investment adviser or reductions from brokerage service arrangements or reductions from other expense offset arrangements and do not represent the amount paid by the class during periods when reimbursements or reductions occur. Expenses net of fee waivers reflect expenses after reimbursement by the investment adviser but prior to reductions from brokerage service arrangements or other expense offset arrangements. Expenses net of all reductions represent the net expenses paid by the class.
F Amount represents less than $.01 per share.
G Total distributions of $.11 per share is comprised of distributions from net investment income of $.097 and distributions from net realized gain of $.015 per share.
Financial Highlights - Institutional Class
Years ended October 31, | 2012 | 2011 | 2010 | 2009 G |
Selected Per-Share Data | | | | |
Net asset value, beginning of period | $ 17.98 | $ 17.57 | $ 15.00 | $ 10.88 |
Income from Investment Operations | | | | |
Net investment income (loss) D | .14 | .10 | .07 | .06 |
Net realized and unrealized gain (loss) | 1.74 | .47 | 2.63 | 4.06 |
Total from investment operations | 1.88 | .57 | 2.70 | 4.12 |
Distributions from net investment income | (.08) | (.11) | (.11) | - |
Distributions from net realized gain | - | (.05) | (.02) | - |
Total distributions | (.08) | (.16) | (.13) | - |
Redemption fees added to paid in capital D,I | - | - | - | - |
Net asset value, end of period | $ 19.78 | $ 17.98 | $ 17.57 | $ 15.00 |
Total Return B,C | 10.49% | 3.23% | 18.08% | 37.87% |
Ratios to Average Net Assets E,H | | | | |
Expenses before reductions | 1.18% | 1.13% | 1.21% | 1.17% A |
Expenses net of fee waivers, if any | 1.18% | 1.13% | 1.21% | 1.17% A |
Expenses net of all reductions | 1.16% | 1.10% | 1.19% | 1.15% A |
Net investment income (loss) | .77% | .56% | .44% | .62% A |
Supplemental Data | | | | |
Net assets, end of period (000 omitted) | $ 4,291 | $ 3,086 | $ 335 | $ 290 |
Portfolio turnover rate F | 186% | 203% | 166% | 224% |
A Annualized
B Total returns for periods of less than one year are not annualized.
C Total returns would have been lower if certain expenses had not been reduced during the applicable periods shown.
D Calculated based on average shares outstanding during the period.
E Fees and expenses of any underlying Fidelity Central Funds are not included in the Fund's expense ratio. The Fund indirectly bears its proportionate share of the expenses of any underlying Fidelity Central Funds.
F Amount does not include the portfolio activity of any underlying Fidelity Central Funds.
G For the period February 19, 2009 (commencement of sale of shares) to October 31, 2009.
H Expense ratios reflect operating expenses of the class. Expenses before reductions do not reflect amounts reimbursed by the investment adviser or reductions from brokerage service arrangements or reductions from other expense offset arrangements and do not represent the amount paid by the class during periods when reimbursements or reductions occur. Expense ratios before reductions for start-up periods may not be representative of longer-term operating periods. Expenses net of fee waivers reflect expenses after reimbursement by the investment adviser but prior to reductions from brokerage service arrangements or other expense offset arrangements. Expenses net of all reductions represent the net expenses paid by the class.
I Amount represents less than $.01 per share.
See accompanying notes which are an integral part of the financial statements.
Annual Report
Fidelity Worldwide Fund
Notes to Financial Statements
For the period ended October 31, 2012
1. Organization.
Fidelity Worldwide Fund (the Fund) is a fund of Fidelity Investment Trust (the Trust) and is authorized to issue an unlimited number of shares. The Trust is registered under the Investment Company Act of 1940, as amended (the 1940 Act), as an open-end management investment company organized as a Massachusetts business trust. The Fund offers Class A, Class T, Class C, Worldwide and Institutional Class shares, each of which, along with Class B shares, has equal rights as to assets and voting privileges. Effective after the close of business on September 1, 2010, Class B shares were closed to new accounts and additional purchases, except for exchanges and reinvestments. Each class has exclusive voting rights with respect to matters that affect that class. Class B shares will automatically convert to Class A shares after a holding period of seven years from the initial date of purchase. Investment income, realized and unrealized capital gains and losses, the common expenses of the Fund, and certain fund-level expense reductions, if any, are allocated on a pro-rata basis to each class based on the relative net assets of each class to the total net assets of the Fund. Each class differs with respect to transfer agent and distribution and service plan fees incurred. Certain expense reductions may also differ by class.
2. Investments in Fidelity Central Funds.
The Fund invests in Fidelity Central Funds, which are open-end investment companies available only to other investment companies and accounts managed by Fidelity Management & Research Company (FMR) and its affiliates. The Fund's Schedule of Investments lists each of the Fidelity Central Funds held as of period end, as an investment of the Fund, but does not include the underlying holdings of each Fidelity Central Fund. As an Investing Fund, the Fund indirectly bears its proportionate share of the expenses of the underlying Fidelity Central Funds.
The Money Market Central Funds seek preservation of capital and current income and are managed by Fidelity Investments Money Management, Inc. (FIMM), an affiliate of FMR.
A complete unaudited list of holdings for each Fidelity Central Fund is available upon request or at the Securities and Exchange Commission (the SEC) web site at www.sec.gov. In addition, the financial statements of the Fidelity Central Funds, which are not covered by the Fund's Report of Independent Registered Public Accounting Firm, are available on the SEC web site or upon request.
3. Significant Accounting Policies.
The financial statements have been prepared in conformity with accounting principles generally accepted in the United States of America (GAAP), which require management to make certain estimates and assumptions at the date of the financial statements. Actual results could differ from those estimates. Subsequent events, if any, through the date that the financial statements were issued have been evaluated in the preparation of the financial statements. The following summarizes the significant accounting policies of the Fund:
Security Valuation. Investments are valued as of 4:00 p.m. Eastern time on the last calendar day of the period. In accordance with valuation policies and procedures approved by the Board of Trustees (the Board), the Fund attempts to obtain prices from one or more third party pricing vendors or brokers to value its investments. When current market prices, quotations or rates are not readily available or reliable, securities will be fair valued in good faith by the FMR Fair Value Committee (the Committee), in accordance with procedures adopted by the Fund's Board. Factors used in determining fair value vary by security type and may include market or security specific events. The frequency with which these procedures are used cannot be predicted and they may be utilized to a significant extent. The Committee oversees the Fund's valuation policies and procedures and is responsible for approving and reporting to the Board all fair value determinations.
The Fund categorizes the inputs to valuation techniques used to value its investments into a disclosure hierarchy consisting of three levels as shown below:
Level 1 - quoted prices in active markets for identical investments
Level 2 - other significant observable inputs (including quoted prices for similar investments, interest rates, prepayment speeds, etc.)
Level 3 - unobservable inputs (including the Fund's own assumptions based on the best information available)
Valuation techniques used to value the Fund's investments by major category are as follows:
Equity securities, including restricted securities, for which market quotations are readily available, are valued at the last reported sale price or official closing price as reported by a third party pricing vendor on the primary market or exchange on which they are traded and are categorized as Level 1 in the hierarchy. In the event there were no sales during the day or closing prices are not available, securities are valued at the last quoted bid price or may be valued using the last available price and are generally categorized as Level 2 in the hierarchy. For foreign equity securities, when significant market or security specific events arise, comparisons to the valuation of American Depositary Receipts (ADRs), futures contracts, Exchange-Traded Funds (ETFs) and certain indexes as well as quoted prices for similar securities are used and are categorized as Level 2 in the hierarchy. Utilizing these techniques may result in transfers between Level 1 and Level 2.
Annual Report
3. Significant Accounting Policies - continued
Security Valuation - continued
Investments in open-end mutual funds, including the Fidelity Central Funds, are valued at their closing net asset value (NAV) each business day and are categorized as Level 1 in the hierarchy.
Changes in valuation techniques may result in transfers in or out of an assigned level within the disclosure hierarchy. The aggregate value of investments by input level, as of October 31, 2012, including information on transfers between Levels 1 and 2, is included at the end of the Fund's Schedule of Investments.
Foreign Currency Translation. The Fund may use foreign currency contracts to facilitate transactions in foreign-denominated securities. Gains and losses from these transactions may arise from changes in the value of the foreign currency or if the counterparties do not perform under the contracts' terms.
Foreign-denominated assets, including investment securities, and liabilities are translated into U.S. dollars at the exchange rates at period end. Purchases and sales of investment securities, income and dividends received and expenses denominated in foreign currencies are translated into U.S. dollars at the exchange rate in effect on the transaction date.
The effects of exchange rate fluctuations on investments are included with the net realized and unrealized gain (loss) on investment securities. Other foreign currency transactions resulting in realized and unrealized gain (loss) are disclosed separately.
Investment Transactions and Income. For financial reporting purposes, the Fund's investment holdings and NAV include trades executed through the end of the last business day of the period. The NAV per share for processing shareholder transactions is calculated as of the close of business of the New York Stock Exchange (NYSE), normally 4:00 p.m. Eastern time and includes trades executed through the end of the prior business day. Gains and losses on securities sold are determined on the basis of identified cost and may include proceeds received from litigation. Dividend income is recorded on the ex-dividend date, except for certain dividends from foreign securities where the ex-dividend date may have passed, which are recorded as soon as the Fund is informed of the ex-dividend date. Non-cash dividends included in dividend income, if any, are recorded at the fair market value of the securities received. Interest income and distributions from the Fidelity Central Funds are accrued as earned. Distributions received on securities that represent a return of capital or capital gain are recorded as a reduction of cost of investments and/or as a realized gain. The Fund estimates the components of distributions received that may be considered return of capital distributions or capital gain distributions. Interest income includes coupon interest and amortization of premium and accretion of discount on debt securities. Investment income is recorded net of foreign taxes withheld where recovery of such taxes is uncertain.
Expenses. Expenses directly attributable to a fund are charged to that fund. Expenses attributable to more than one fund are allocated among the respective funds on the basis of relative net assets or other appropriate methods. Expense estimates are accrued in the period to which they relate and adjustments are made when actual amounts are known.
Income Tax Information and Distributions to Shareholders. Each year, the Fund intends to qualify as a regulated investment company under Subchapter M of the Internal Revenue Code, including distributing substantially all of its taxable income and realized gains. As a result, no provision for income taxes is required. As of October 31, 2012, the Fund did not have any unrecognized tax benefits in the financial statements; nor is the Fund aware of any tax positions for which it is reasonably possible that the total amounts of unrecognized tax benefits will significantly change in the next twelve months. The Fund files a U.S. federal tax return, in addition to state and local tax returns as required. A fund's federal income tax returns are subject to examination by the Internal Revenue Service (IRS) for a period of three fiscal years after they are filed. State and local tax returns may be subject to examination for an additional fiscal year depending on the jurisdiction. Foreign taxes are provided for based on the Fund's understanding of the tax rules and rates that exist in the foreign markets in which it invests.
Distributions are declared and recorded on the ex-dividend date. Income dividends and capital gain distributions are declared separately for each class. Income and capital gain distributions are determined in accordance with income tax regulations, which may differ from GAAP. In addition, the Fund claimed a portion of the payment made to redeeming shareholders as a distribution for income tax purposes.
Capital accounts within the financial statements are adjusted for permanent book-tax differences. These adjustments have no impact on net assets or the results of operations. Temporary book-tax differences will reverse in a subsequent period.
Book-tax differences are primarily due to foreign currency transactions, passive foreign investment companies (PFIC), deferred trustees compensation, capital loss carryforwards and losses deferred due to wash sales.
Annual Report
Fidelity Worldwide Fund
Notes to Financial Statements - continued
3. Significant Accounting Policies - continued
Income Tax Information and Distributions to Shareholders - continued
The federal tax cost of investment securities and unrealized appreciation (depreciation) as of period end were as follows:
Gross unrealized appreciation | $ 122,955,424 |
Gross unrealized depreciation | (29,246,711) |
Net unrealized appreciation (depreciation) on securities and other investments | $ 93,708,713 |
| |
Tax Cost | $ 1,022,088,555 |
The tax-based components of distributable earnings as of period end were as follows:
Undistributed ordinary income | $ 8,068,312 |
Undistributed long-term capital gain | $ 3,746,668 |
Net unrealized appreciation (depreciation) | $ 93,636,040 |
The tax character of distributions paid was as follows:
| October 31, 2012 | October 31, 2011 |
Ordinary Income | $ 4,089,511 | $ 9,114,660 |
Short-Term Trading (Redemption) Fees. Shares held by investors in the Fund less than 30 days are subject to a redemption fee equal to 1.00% of the net asset value of shares redeemed. All redemption fees, which reduce the proceeds of the shareholder redemption, are retained by the Fund and accounted for as an addition to paid in capital.
New Accounting Pronouncement. In December 2011, the Financial Accounting Standards Board issued Accounting Standard Update No. 2011-11, Disclosures about Offsetting Assets and Liabilities. The update creates new disclosure requirements requiring entities to disclose both gross and net information for derivatives and other financial instruments that are either offset in the Statement of Assets and Liabilities or subject to an enforceable master netting arrangement or similar agreement. The disclosure requirements are effective for annual reporting periods beginning on or after January 1, 2013, and interim periods within those annual periods. Management is currently evaluating the impact of the update's adoption on the Fund's financial statement disclosures.
4. Purchases and Sales of Investments.
Purchases and sales of securities, other than short-term securities, aggregated $1,976,525,810 and $2,106,835,705, respectively.
5. Fees and Other Transactions with Affiliates.
Management Fee. FMR and its affiliates provide the Fund with investment management related services for which the Fund pays a monthly management fee. The management fee is the sum of an individual fund fee rate that is based on an annual rate of .45% of the Fund's average net assets and an annualized group fee rate that averaged .26% during the period. The group fee rate is based upon the average net assets of all the mutual funds advised by FMR. The group fee rate decreases as assets under management increase and increases as assets under management decrease. In addition, the management fee is subject to a performance adjustment (up to a maximum of ± .20% of the Fund's average net assets over a 36 month performance period). The upward or downward adjustment to the management fee is based on the relative investment performance of Worldwide as compared to an appropriate benchmark index. For the period, the total annual management fee rate, including the performance adjustment, was .80% of the Fund's average net assets.
Annual Report
5. Fees and Other Transactions with Affiliates - continued
Distribution and Service Plan Fees. In accordance with Rule 12b-1 of the 1940 Act, the Fund has adopted separate Distribution and Service Plans for each class of shares. Certain classes pay Fidelity Distributors Corporation (FDC), an affiliate of FMR, separate Distribution and Service Fees, each of which is based on an annual percentage of each class' average net assets. In addition, FDC may pay financial intermediaries for selling shares of the Fund and providing shareholder support services. For the period, the Distribution and Service Fee rates, total fees and amounts retained by FDC were as follows:
| Distribution
Fee | Service
Fee | Total Fees | Retained
by FDC |
Class A | -% | .25% | $ 37,612 | $ 2,060 |
Class T | .25% | .25% | 20,552 | 83 |
Class B | .75% | .25% | 2,828 | 2,126 |
Class C | .75% | .25% | 15,263 | 5,004 |
| | | $ 76,255 | $ 9,273 |
Sales Load. FDC may receive a front-end sales charge of up to 5.75% for selling Class A shares and 3.50% for selling Class T shares, some of which is paid to financial intermediaries for selling shares of the Fund. Depending on the holding period, FDC may receive contingent deferred sales charges levied on Class A, Class T, Class B and Class C redemptions. The deferred sales charges range from 5.00% to 1.00% for Class B shares, 1.00% for Class C shares, 1.00% for certain purchases of Class A shares and .25% for certain purchases of Class T shares.
For the period, sales charge amounts retained by FDC were as follows:
| Retained
by FDC |
Class A | $ 7,220 |
Class T | 1,258 |
Class B* | 616 |
Class C* | 1,466 |
| $ 10,560 |
* When Class B and Class C shares are initially sold, FDC pays commissions from its own resources to financial intermediaries through which the sales are made.
Transfer Agent Fees. Fidelity Investments Institutional Operations Company, Inc. (FIIOC), an affiliate of FMR, is the transfer, dividend disbursing and shareholder servicing agent for each class of the Fund. FIIOC receives account fees and asset-based fees that vary according to the account size and type of account of the shareholders of the respective classes of the Fund. FIIOC pays for typesetting, printing and mailing of shareholder reports, except proxy statements. For the period, transfer agent fees for each class were as follows:
| Amount | % of
Average
Net Assets |
Class A | $ 45,131 | .30 |
Class T | 12,753 | .31 |
Class B | 850 | .30 |
Class C | 4,641 | .30 |
Worldwide | 2,452,307 | .23 |
Institutional Class | 11,291 | .31 |
| $ 2,526,973 | |
Accounting and Security Lending Fees. Fidelity Service Company, Inc. (FSC), an affiliate of FMR, maintains the Fund's accounting records. The accounting fee is based on the level of average net assets for each month. Under a separate contract, FSC administers the security lending program. The security lending fee is based on the number and duration of lending transactions.
Brokerage Commissions. The Fund placed a portion of its portfolio transactions with brokerage firms which are affiliates of the investment adviser. The commissions paid to these affiliated firms were $46,686 for the period.
Annual Report
Fidelity Worldwide Fund
Notes to Financial Statements - continued
5. Fees and Other Transactions with Affiliates - continued
Interfund Lending Program. Pursuant to an Exemptive Order issued by the SEC, the Fund, along with other registered investment companies having management contracts with FMR, may participate in an interfund lending program. This program provides an alternative credit facility allowing the funds to borrow from, or lend money to, other participating affiliated funds. At period end, there were no interfund loans outstanding. The Fund's activity in this program during the period for which loans were outstanding was as follows:
Borrower or Lender | Average Loan
Balance | Weighted Average Interest Rate | Interest
Expense |
Borrower | $ 6,075,000 | .33% | $ 56 |
6. Committed Line of Credit.
The Fund participates with other funds managed by FMR or an affiliate in a $4.25 billion credit facility (the "line of credit") to be utilized for temporary or emergency purposes to fund shareholder redemptions or for other short-term liquidity purposes. The Fund has agreed to pay commitment fees on its pro-rata portion of the line of credit, which amounted to $2,986 and is reflected in Miscellaneous expenses on the Statement of Operations. During the period, there were no borrowings on this line of credit.
7. Security Lending.
The Fund lends portfolio securities through a lending agent from time to time in order to earn additional income. For equity securities, a lending agent is used and may loan securities to certain qualified borrowers, including Fidelity Capital Markets (FCM), a broker-dealer affiliated with the Fund. On the settlement date of the loan, the Fund receives collateral (in the form of U.S. Treasury obligations, letters of credit and/or cash) against the loaned securities and maintains collateral in an amount not less than 100% of the market value of the loaned securities during the period of the loan. The market value of the loaned securities is determined at the close of business of the Fund and any additional required collateral is delivered to the Fund on the next business day. If the borrower defaults on its obligation to return the securities loaned because of insolvency or other reasons, a fund could experience delays and costs in recovering the securities loaned or in gaining access to the collateral. Any cash collateral received is invested in the Fidelity Securities Lending Cash Central Fund. The value of loaned securities and cash collateral at period end are disclosed on the Fund's Statement of Assets and Liabilities. At period end, there were no security loans outstanding with FCM. Security lending income represents the income earned on investing cash collateral, less rebates paid to borrowers and any lending agent fees associated with the loan, plus any premium payments received for lending certain types of securities. Security lending income is presented in the Statement of Operations as a component of income from Fidelity Central Funds. Total security lending income during the period amounted to $279,543, including $261 from securities loaned to FCM.
8. Expense Reductions.
Many of the brokers with whom FMR places trades on behalf of the Fund provided services to the Fund in addition to trade execution. These services included payments of certain expenses on behalf of the Fund totaling $206,687 for the period.
9. Distributions to Shareholders.
Distributions to shareholders of each class were as follows:
Years ended October 31, | 2012 | 2011 |
From net investment income | | |
Class A | $ 16,598 | $ 36,687 |
Class T | - | 3,024 |
Class B | - | - |
Class C | - | - |
Worldwide | 4,059,519 | 6,199,611 |
Institutional Class | 13,394 | 4,819 |
Total | $ 4,089,511 | $ 6,244,141 |
From net realized gain | | |
Class A | $ - | $ 20,664 |
Class T | - | 3,280 |
Class B | - | - |
Class C | - | - |
Worldwide | - | 2,844,643 |
Institutional Class | - | 1,932 |
Total | $ - | $ 2,870,519 |
Annual Report
10. Share Transactions.
Transactions for each class of shares were as follows:
| Shares | Dollars |
Years ended October 31, | 2012 | 2011 | 2012 | 2011 |
Class A | | | | |
Shares sold | 433,206 | 446,295 | $ 8,109,308 | $ 8,440,354 |
Reinvestment of distributions | 720 | 2,409 | 12,524 | 44,007 |
Shares redeemed | (218,566) | (143,732) | (4,053,305) | (2,654,718) |
Net increase (decrease) | 215,360 | 304,972 | $ 4,068,527 | $ 5,829,643 |
Class T | | | | |
Shares sold | 202,603 | 307,740 | $ 3,780,147 | $ 5,853,479 |
Reinvestment of distributions | - | 344 | - | 6,293 |
Shares redeemed | (42,181) | (249,620) | (800,428) | (4,835,753) |
Net increase (decrease) | 160,422 | 58,464 | $ 2,979,719 | $ 1,024,019 |
Class B | | | | |
Shares sold | 4,060 | 3,768 | $ 73,532 | $ 71,519 |
Reinvestment of distributions | - | - | - | - |
Shares redeemed | (2,808) | (6,939) | (51,407) | (128,598) |
Net increase (decrease) | 1,252 | (3,171) | $ 22,125 | $ (57,079) |
Class C | | | | |
Shares sold | 38,075 | 41,472 | $ 696,495 | $ 784,669 |
Reinvestment of distributions | - | - | - | - |
Shares redeemed | (22,245) | (9,227) | (407,626) | (167,760) |
Net increase (decrease) | 15,830 | 32,245 | $ 288,869 | $ 616,909 |
Worldwide | | | | |
Shares sold | 8,155,382 | 12,255,493 | $ 150,136,706 | $ 231,984,939 |
Reinvestment of distributions | 226,349 | 480,262 | 3,956,581 | 8,805,760 |
Shares redeemed | (15,784,478) | (12,736,797) | (288,554,381) | (238,335,100) |
Net increase (decrease) | (7,402,747) | (1,042) | $ (134,461,094) | $ 2,455,599 |
Institutional Class | | | | |
Shares sold | 111,552 | 162,911 | $ 2,100,045 | $ 2,875,496 |
Reinvestment of distributions | 745 | 360 | 12,982 | 6,581 |
Shares redeemed | (67,062) | (10,647) | (1,264,501) | (193,044) |
Net increase (decrease) | 45,235 | 152,624 | $ 848,526 | $ 2,689,033 |
11. Other.
The Fund's organizational documents provide former and current trustees and officers with a limited indemnification against liabilities arising in connection with the performance of their duties to the Fund. In the normal course of business, the Fund may also enter into contracts that provide general indemnifications. The Fund's maximum exposure under these arrangements is unknown as this would be dependent on future claims that may be made against the Fund. The risk of material loss from such claims is considered remote.
Annual Report
Report of Independent Registered Public Accounting Firm
To the Trustees of Fidelity Investment Trust and Shareholders of Fidelity Worldwide Fund:
We have audited the accompanying statement of assets and liabilities of Fidelity Worldwide Fund (the Fund), a fund of Fidelity Investment Trust, including the schedule of investments, as of October 31, 2012, and the related statement of operations for the year then ended, the statement of changes in net assets for each of the two years in the period then ended, and the financial highlights for each of the five years in the period then ended. These financial statements and financial highlights are the responsibility of the Fund's management. Our responsibility is to express an opinion on these financial statements and financial highlights based on our audits.
We conducted our audits in accordance with the standards of the Public Company Accounting Oversight Board (United States). Those standards require that we plan and perform the audit to obtain reasonable assurance about whether the financial statements and financial highlights are free of material misstatement. The Fund is not required to have, nor were we engaged to perform, an audit of its internal control over financial reporting. Our audits included consideration of internal control over financial reporting as a basis for designing audit procedures that are appropriate in the circumstances, but not for the purpose of expressing an opinion on the effectiveness of the Fund's internal control over financial reporting. Accordingly, we express no such opinion. An audit also includes examining, on a test basis, evidence supporting the amounts and disclosures in the financial statements, assessing the accounting principles used and significant estimates made by management, as well as evaluating the overall financial statement presentation. Our procedures included confirmation of securities owned as of October 31, 2012, by correspondence with the custodians and brokers; where replies were not received from brokers, we performed other auditing procedures. We believe that our audits provide a reasonable basis for our opinion.
In our opinion, the financial statements and financial highlights referred to above present fairly, in all material respects, the financial position of Fidelity Worldwide Fund as of October 31, 2012, the results of its operations for the year then ended, the changes in its net assets for each of the two years in the period then ended, and the financial highlights for each of the five years in the period then ended, in conformity with accounting principles generally accepted in the United States of America.
DELOITTE & TOUCHE LLP
Boston, Massachusetts
December 14, 2012
Annual Report
The Trustees, Members of the Advisory Board, and executive officers of the trust and funds, as applicable, are listed below. The Board of Trustees governs each fund and is responsible for protecting the interests of shareholders. The Trustees are experienced executives who meet periodically throughout the year to oversee each fund's activities, review contractual arrangements with companies that provide services to each fund, oversee management of the risks associated with such activities and contractual arrangements, and review each fund's performance. Except for James C. Curvey, each of the Trustees oversees 236 funds advised by FMR or an affiliate. Mr. Curvey oversees 443 funds advised by FMR or an affiliate.
The Trustees hold office without limit in time except that (a) any Trustee may resign; (b) any Trustee may be removed by written instrument, signed by at least two-thirds of the number of Trustees prior to such removal; (c) any Trustee who requests to be retired or who has become incapacitated by illness or injury may be retired by written instrument signed by a majority of the other Trustees; and (d) any Trustee may be removed at any special meeting of shareholders by a two-thirds vote of the outstanding voting securities of the trust. Each Trustee who is not an interested person (as defined in the 1940 Act) (Independent Trustee), shall retire not later than the last day of the calendar year in which his or her 75th birthday occurs. The Independent Trustees may waive this mandatory retirement age policy with respect to individual Trustees. The executive officers and Advisory Board Members hold office without limit in time, except that any officer and Advisory Board Member may resign or may be removed by a vote of a majority of the Trustees at any regular meeting or any special meeting of the Trustees. Except as indicated, each individual has held the office shown or other offices in the same company for the past five years.
Experience, Skills, Attributes, and Qualifications of the Funds' Trustees. The Governance and Nominating Committee has adopted a statement of policy that describes the experience, qualifications, attributes, and skills that are necessary and desirable for potential Independent Trustee candidates (Statement of Policy). The Board believes that each Trustee satisfied at the time he or she was initially elected or appointed a Trustee, and continues to satisfy, the standards contemplated by the Statement of Policy. The Governance and Nominating Committee also engages professional search firms to help identify potential Independent Trustee candidates who have the experience, qualifications, attributes, and skills consistent with the Statement of Policy. From time to time, additional criteria based on the composition and skills of the current Independent Trustees, as well as experience or skills that may be appropriate in light of future changes to board composition, business conditions, and regulatory or other developments, have also been considered by the professional search firms and the Governance and Nominating Committee. In addition, the Board takes into account the Trustees' commitment and participation in Board and committee meetings, as well as their leadership of standing and ad hoc committees throughout their tenure.
In determining that a particular Trustee was and continues to be qualified to serve as a Trustee, the Board has considered a variety of criteria, none of which, in isolation, was controlling. The Board believes that, collectively, the Trustees have balanced and diverse experience, qualifications, attributes, and skills, which allow the Board to operate effectively in governing each fund and protecting the interests of shareholders. Information about the specific experience, skills, attributes, and qualifications of each Trustee, which in each case led to the Board's conclusion that the Trustee should serve (or continue to serve) as a trustee of the funds, is provided below.
Board Structure and Oversight Function. James C. Curvey is an interested person (as defined in the 1940 Act) and currently serves as Chairman. The Trustees have determined that an interested Chairman is appropriate and benefits shareholders because an interested Chairman has a personal and professional stake in the quality and continuity of services provided to the funds. Independent Trustees exercise their informed business judgment to appoint an individual of their choosing to serve as Chairman, regardless of whether the Trustee happens to be independent or a member of management. The Independent Trustees have determined that they can act independently and effectively without having an Independent Trustee serve as Chairman and that a key structural component for assuring that they are in a position to do so is for the Independent Trustees to constitute a substantial majority for the Board. The Independent Trustees also regularly meet in executive session. Ned C. Lautenbach serves as Chairman of the Independent Trustees and as such (i) acts as a liaison between the Independent Trustees and management with respect to matters important to the Independent Trustees and (ii) with management prepares agendas for Board meetings.
Fidelity funds are overseen by different Boards of Trustees. The funds' Board oversees Fidelity's equity and high income funds and another Board oversees Fidelity's investment-grade bond, money market, and asset allocation funds. The asset allocation funds may invest in Fidelity funds overseen by the funds' Board. The use of separate Boards, each with its own committee structure, allows the Trustees of each group of Fidelity funds to focus on the unique issues of the funds they oversee, including common research, investment, and operational issues. On occasion, the separate Boards establish joint committees to address issues of overlapping consequences for the Fidelity funds overseen by each Board.
The Trustees operate using a system of committees to facilitate the timely and efficient consideration of all matters of importance to the Trustees, each fund, and fund shareholders and to facilitate compliance with legal and regulatory requirements and oversight of the funds' activities and associated risks. The Board, acting through its committees, has charged FMR and its affiliates with (i) identifying events or circumstances the occurrence of which could have demonstrably adverse effects on the funds' business and/or reputation; (ii) implementing processes and controls to lessen the possibility that such events or circumstances occur or to mitigate the effects of such events or circumstances if they do occur; and (iii) creating and maintaining a system designed to evaluate continuously business and market conditions in order to facilitate the identification and implementation processes described in (i) and (ii) above. Because the day-to-day operations and activities of the funds are carried out by or through FMR, its affiliates and other service providers, the funds' exposure to risks is mitigated but not eliminated by the processes overseen by the Trustees. While each of the Board's committees has responsibility for overseeing different aspects of the funds' activities, oversight is exercised primarily through the Operations, Audit, and Compliance Committees. In addition, the Independent Trustees have worked with FMR to enhance the Board's oversight of investment and financial risks, legal and regulatory risks, technology risks, and operational risks, including the development of additional risk reporting to the Board. For example, a working group comprised of Independent Trustees and FMR has worked and continues to work to review the Fidelity funds' valuation-related activities, reporting and risk management. Appropriate personnel, including but not limited to the funds' Chief Compliance Officer (CCO), FMR's internal auditor, the independent accountants, the funds' Treasurer and portfolio management personnel, make periodic reports to the Board's committees, as appropriate, including an annual review of FMR's risk management program for the Fidelity funds. The responsibilities of each standing committee, including their oversight responsibilities, are described further under "Standing Committees of the Funds' Trustees."
Annual Report
The funds' Statement of Additional Information (SAI) includes more information about the Trustees. To request a free copy, call Fidelity at 1-800-544-8544.
Interested Trustees*:
Correspondence intended for each Trustee who is an interested person may be sent to Fidelity Investments, 82 Devonshire Street, Boston, Massachusetts 02109.
Name, Age; Principal Occupations and Other Relevant Experience+ |
James C. Curvey (77) |
| Year of Election or Appointment: 2007 Mr. Curvey is Trustee and Chairman of the Board of Trustees of certain Trusts. Mr. Curvey also serves as Trustee (2007-present) of other investment companies advised by FMR. Mr. Curvey is a Director of Fidelity Investments Money Management, Inc. (2009-present), Director of Fidelity Research & Analysis Co. (2009-present) and Director of FMR and FMR Co., Inc. (2007-present). Mr. Curvey is also Vice Chairman (2007-present) and Director of FMR LLC. In addition, Mr. Curvey serves as an Overseer for the Boston Symphony Orchestra and a member of the Trustees of Villanova University. Previously, Mr. Curvey was the Vice Chairman (2006-2007) and Director (2000-2007) of FMR Corp. |
Ronald P. O'Hanley (55) |
| Year of Election or Appointment: 2011 Mr. O'Hanley is Director of FMR Co., Inc. (2010-present), Director of Fidelity Investments Money Management, Inc. (2010-present), Director of Fidelity Research & Analysis Company (2010-present), President of Fidelity Asset Management and Corporate Services and a member of Fidelity's Executive Committee (2010-present). Previously, Mr. O'Hanley served as President and Chief Executive Officer of BNY Mellon Asset Management (2007-2010). Mr. O'Hanley also served as Vice Chairman of Bank New York Mellon Corp. and a member of that firm's Executive Committee. Prior to the 2007 merger of The Bank of New York and Mellon Financial Corporation, he was Vice Chairman of Mellon Financial Corporation and President and Chief Executive Officer of Mellon Asset Management. He joined Mellon in February 1997. Mr. O'Hanley currently serves as Chairman of the Boston Public Library Foundation Board of Directors and sits on the Board of Directors of Beth Israel Deaconess Medical Center, the Board of Trustees of the Marine Biological Laboratory and the Advisory Board of the Maxwell School of Citizenship and Public Administration at Syracuse University. Mr. O'Hanley also chairs the Council on Asset Management for the Financial Services Roundtable and is a member of the Board of Directors of Institutional Investor's U.S. Institute. |
* Trustees have been determined to be "Interested Trustees" by virtue of, among other things, their affiliation with the trust or various entities under common control with FMR.
+ The information above includes each Trustee's principal occupation during the last five years and other information relating to the experience, attributes, and skills relevant to each Trustee's qualifications to serve as a Trustee, which led to the conclusion that each Trustee should serve as a Trustee for each fund.
Independent Trustees:
Correspondence intended for each Independent Trustee (that is, the Trustees other than the Interested Trustees) may be sent to Fidelity Investments, P.O. Box 55235, Boston, Massachusetts 02205-5235.
Name, Age; Principal Occupations and Other Relevant Experience+ |
Dennis J. Dirks (64) |
| Year of Election or Appointment: 2005 Prior to his retirement in May 2003, Mr. Dirks was Chief Operating Officer and a member of the Board of The Depository Trust & Clearing Corporation (DTCC). He also served as President, Chief Operating Officer, and Board member of The Depository Trust Company (DTC) and President and Board member of the National Securities Clearing Corporation (NSCC). In addition, Mr. Dirks served as Chief Executive Officer and Board member of the Government Securities Clearing Corporation, Chief Executive Officer and Board member of the Mortgage-Backed Securities Clearing Corporation, as a Trustee and a member of the Finance Committee of Manhattan College (2005-2008), and as a Trustee and a member of the Finance Committee of AHRC of Nassau County (2006-2008). Mr. Dirks is a member of the Independent Directors Council (IDC) Governing Council (2010-present) and Board of Directors for The Brookville Center for Children's Services, Inc. (2009-present). |
Alan J. Lacy (59) |
| Year of Election or Appointment: 2008 Mr. Lacy serves as Senior Adviser (2007-present) of Oak Hill Capital Partners, L.P. (private equity). Mr. Lacy also served as Chief Executive Officer (2000-2005) and Vice Chairman (2005-2006) of Sears Holdings Corporation and Sears, Roebuck and Co. (retail). In addition, Mr. Lacy serves as a member of the Board of Directors of Dave & Buster's Entertainment, Inc. (restaurant and entertainment complexes, 2010-present), Earth Fare, Inc. (retail grocery, 2012-present), The Hillman Companies, Inc. (hardware wholesalers, 2010-present), and Bristol-Myers Squibb Company (global pharmaceuticals, 2008-present). Mr. Lacy is a member of the Board of Trustees of The National Parks Conservation Association (2006-present). Previously, Mr. Lacy served as Chairman of the Board of Trustees of the National Parks Conservation Association (2008-2011) and as a member of the Board of Directors for the Western Union Company (global money transfer, 2006-2011). |
Ned C. Lautenbach (68) |
| Year of Election or Appointment: 2000 Mr. Lautenbach is Chairman of the Independent Trustees of the Equity and High Income Funds (2006-present). Mr. Lautenbach currently serves as the Lead Director of the Eaton Corporation Board of Directors (diversified industrial, 1997-present). Mr. Lautenbach is Chairman of the Board of Directors of the Philharmonic Center for the Arts in Naples, Florida (2012-present) and a member of the Council on Foreign Relations (1994-present). Previously, Mr. Lautenbach was a Partner/Advisory Partner at Clayton, Dubilier & Rice, LLC (private equity investment, 1998-2010), as well as a Director of Sony Corporation (2006-2007). |
Joseph Mauriello (68) |
| Year of Election or Appointment: 2008 Prior to his retirement in January 2006, Mr. Mauriello served in numerous senior management positions including Deputy Chairman and Chief Operating Officer (2004-2005), and Vice Chairman of Financial Services (2002-2004) of KPMG LLP US (professional services, 1965-2005). Mr. Mauriello currently serves as a member of the Board of Directors of XL Group plc. (global insurance and re-insurance, 2006-present). Previously, Mr. Mauriello served as a Director of the Hamilton Funds of the Bank of New York (2006-2007) and of Arcadia Resources Inc. (health care services and products, 2007-2012). |
Robert W. Selander (62) |
| Year of Election or Appointment: 2011 Previously, Mr. Selander served as a Member of the Advisory Board of Fidelity's Equity and High Income Funds (2011), Executive Vice Chairman (2010), Chief Executive Officer (2009-2010), and President and Chief Executive Officer (1997-2009) of Mastercard, Inc. |
Cornelia M. Small (68) |
| Year of Election or Appointment: 2005 Ms. Small is a member of the Board of Directors (2009-present) and Chair of the Investment Committee (2010-present) of the Teagle Foundation. Ms. Small also serves on the Investment Committee of the Berkshire Taconic Community Foundation (2008-present). Previously, Ms. Small served as Chairperson (2002-2008) and a member of the Investment Committee and Chairperson (2008-2012) and a member of the Board of Trustees of Smith College. In addition, Ms. Small served as Chief Investment Officer, Director of Global Equity Investments, and a member of the Board of Directors of Scudder, Stevens & Clark and Scudder Kemper Investments. |
William S. Stavropoulos (73) |
| Year of Election or Appointment: 2001 Mr. Stavropoulos is Vice Chairman of the Independent Trustees of the Equity and High Income Funds (2006-present). Mr. Stavropoulos serves as President and Founder of the Michigan Baseball Foundation, the Great Lakes Loons (2007-present). Mr. Stavropoulos is Chairman Emeritus of the Board of Directors of The Dow Chemical Company, where he previously served in numerous senior management positions, including President, CEO (1995-2000; 2002-2004), Chairman of the Executive Committee (2000-2006), and as a member of the Board of Directors (1990-2006). Currently, Mr. Stavropoulos is a Director of Univar Inc. (global distributor of commodity and specialty chemicals, Chairman from 2010-May 2012 and Lead Director from May 2012-present), Teradata Corporation (data warehousing and technology solutions, 2008-present), Maersk Inc. (industrial conglomerate), and Tyco International, Ltd. (multinational manufacturing and services, 2007-present), and a member of the Advisory Board for Metalmark Capital LLC (private equity investment, 2005-present). Mr. Stavropoulos is an operating advisor to Clayton, Dubilier & Rice, LLC (private equity investment). In addition, Mr. Stavropoulos is a member of the University of Notre Dame Advisory Council for the College of Science, a Trustee of the Rollin L. Gerstacker Foundation, and a Director of the Naples Philharmonic Center for the Arts. Previously, Mr. Stavropoulos served as a Director of Chemical Financial Corporation (bank holding company, 1993-2012). |
David M. Thomas (63) |
| Year of Election or Appointment: 2008 Previously, Mr. Thomas served as Executive Chairman (2005-2006) and Chairman and Chief Executive Officer (2000-2005) of IMS Health, Inc. (pharmaceutical and healthcare information solutions), and a Director of Fortune Brands, Inc. (consumer products, 2000-2011). In addition, Mr. Thomas serves as Non-Executive Chairman of the Board of Directors of Fortune Brands Home and Security (home and security products, 2011-present), and as a member of the Board of Directors of Interpublic Group of Companies, Inc. (marketing communication, 2004-present). |
Michael E. Wiley (62) |
| Year of Election or Appointment: 2008 Mr. Wiley also serves as a Director of Asia Pacific Exploration Consolidated (international oil and gas exploration and production, 2008-present). Mr. Wiley serves as a Director of Tesoro Corporation (independent oil refiner and marketer, 2005-present), and a Director of Bill Barrett Corporation (exploration and production, 2005-present). In addition, Mr. Wiley also serves as a Director of Post Oak Bank (privately-held bank, 2004-present). Previously, Mr. Wiley served as a member of the Board of Trustees of the University of Tulsa (2000-2006; 2007-2010), as a Senior Energy Advisor of Katzenbach Partners, LLC (consulting, 2006-2007), as an Advisory Director of Riverstone Holdings (private investment), Chairman, President, and CEO of Baker Hughes, Inc. (oilfield services, 2000-2004), and as Director of Spinnaker Exploration Company (exploration and production, 2001-2005). |
+ The information above includes each Trustee's principal occupation during the last five years and other information relating to the experience, attributes, and skills relevant to each Trustee's qualifications to serve as a Trustee, which led to the conclusion that each Trustee should serve as a Trustee for each fund.
Advisory Board Members and Executive Officers:
Correspondence intended for David A. Rosow and Garnett A. Smith may be sent to Fidelity Investments, P.O. Box 55235, Boston, Massachusetts 02205-5235. Correspondence intended for each executive officer , Edward C. Johnson 3d, and Peter S. Lynch may be sent to Fidelity Investments, 82 Devonshire Street, Boston, Massachusetts 02109.
Name, Age; Principal Occupation |
Edward C. Johnson 3d (82) |
| Year of Election or Appointment: 2011 Member of the Advisory Board of Fidelity's Equity and High Income Funds. Mr. Johnson serves as Chief Executive Officer, Chairman, and a Director of FMR LLC, and also serves as Chairman and Director of FIL Limited. Previously, Mr. Johnson served as a Trustee and Chairman of the Board of certain Fidelity Trusts, Chairman and a Director of FMR, Chairman and a Director of FMR Co., Inc., and President of FMR LLC (2006-2007). |
Peter S. Lynch (68) |
| Year of Election or Appointment: 2003 Member of the Advisory Board of Fidelity's Equity and High Income Funds. Mr. Lynch is Vice Chairman and a Director of FMR and FMR Co., Inc. In addition, Mr. Lynch serves as a Trustee of Boston College and as the Chairman of the Inner-City Scholarship Fund. Previously, Mr. Lynch served on the Special Olympics International Board of Directors (1997-2006). |
David A. Rosow (70) |
| Year of Election or Appointment: 2012 Member of the Advisory Board of Fidelity's Equity and High Income Funds. Chairman and Chief Executive Officer of International Golf Group, Inc. (golf course development, 1989-present). Previously, Mr. Rosow served as Chairman and Chief Executive Officer of Rosow & Company, Inc. (private investment company, 1989-2011), a Lead Director of Hudson United Bancorp (2001-2006) and as a Director of TD Banknorth (1996-2006). In addition, Mr. Rosow is a member (2008-present) and President (2009-present) of the Town Council of Palm Beach, Florida. |
Garnett A. Smith (65) |
| Year of Election or Appointment: 2012 Member of the Advisory Board of Fidelity's Equity and High Income Funds. Prior to Mr. Smith's retirement, he served as Chairman and Chief Executive Officer of Inbrand Corp. (manufacturer of personal absorbent products, 1990-1997). He also served as President (1986-1990) of Inbrand Corp. Prior to his employment with Inbrand Corp., he was employed by a retail fabric chain and North Carolina National Bank. In addition, Mr. Smith is a board member of the Jackson Hole Land Trust (2009-present). |
Kenneth B. Robins (43) |
| Year of Election or Appointment: 2008 President and Treasurer of Fidelity's Equity and High Income Funds. Mr. Robins also serves as President and Treasurer (2010-present) and Assistant Treasurer (2009-present) of other Fidelity funds and is an employee of Fidelity Investments (2004-present). Previously, Mr. Robins served as Deputy Treasurer of the Fidelity funds (2005-2008) and Treasurer and Chief Financial Officer of The North Carolina Capital Management Trust: Cash and Term Portfolios (2006-2008). |
Bruce T. Herring (47) |
| Year of Election or Appointment: 2006 Vice President of certain Equity Funds. Mr. Herring also serves as President of Fidelity Research & Analysis Company (2010-present), Chief Investment Officer and Director of Fidelity Management & Research (U.K.) Inc. (2010-present) and Group Chief Investment Officer of FMR. Previously, Mr. Herring served as Vice President (2005-2006) and Senior Vice President (2006-2007) of Fidelity Management & Research Company, Vice President of FMR Co., Inc. (2001-2007) and as a portfolio manager for Fidelity U.S. Equity Funds. |
Brian B. Hogan (48) |
| Year of Election or Appointment: 2009 Vice President of Equity and High Income Funds. Mr. Hogan also serves as President of FMR's Equity Division (2009-present). Previously, Mr. Hogan served as Senior Vice President, Equity Research of FMR (2006-2009) and as a portfolio manager. |
Scott C. Goebel (44) |
| Year of Election or Appointment: 2008 Secretary and Chief Legal Officer (CLO) of the Fidelity funds. Mr. Goebel also serves as Secretary of Fidelity Investments Money Management, Inc. (FIMM) (2010-present) and Fidelity Research and Analysis Company (FRAC) (2010-present); Secretary and CLO of The North Carolina Capital Management Trust: Cash and Term Portfolios (2008-present); General Counsel, Secretary, and Senior Vice President of FMR (2008-present) and FMR Co., Inc. (2008-present); employed by FMR LLC or an affiliate (2001-present); Chief Legal Officer of Fidelity Management & Research (Hong Kong) Limited (2008-present) and Assistant Secretary of Fidelity Management & Research (Japan) Inc. (2008-present), and Fidelity Management & Research (U.K.) Inc. (2008-present). Previously, Mr. Goebel served as Assistant Secretary of FIMM (2008-2010), FRAC (2008-2010), and the Funds (2007-2008) and as Vice President and Secretary of Fidelity Distributors Corporation (FDC) (2005-2007). |
William C. Coffey (43) |
| Year of Election or Appointment: 2009 Assistant Secretary of Fidelity's Equity and High Income Funds. Mr. Coffey also serves as Senior Vice President and Deputy General Counsel of FMR LLC (2010-present), and is an employee of Fidelity Investments. Previously, Mr. Coffey served as Vice President and Associate General Counsel of FMR LLC (2005-2009). |
Elizabeth Paige Baumann (44) |
| Year of Election or Appointment: 2012 Anti-Money Laundering (AML) Officer of the Fidelity funds. Ms. Baumann also serves as AML Officer of The North Carolina Capital Management Trust: Cash and Term Portfolios (2012-present), Chief AML Officer of FMR LLC (2012-present), and is an employee of Fidelity Investments. Previously, Ms. Baumann served as Vice President and Deputy Anti-Money Laundering Officer (2007-2012). |
Christine Reynolds (54) |
| Year of Election or Appointment: 2008 Chief Financial Officer of the Fidelity funds. Ms. Reynolds became President of Fidelity Pricing and Cash Management Services (FPCMS) in August 2008. Ms. Reynolds served as Chief Operating Officer of FPCMS (2007-2008). Previously, Ms. Reynolds served as President, Treasurer, and Anti-Money Laundering officer of the Fidelity funds (2004-2007). |
Joseph A. Hanlon (44) |
| Year of Election or Appointment: 2012 Chief Compliance Officer of Fidelity's Equity and High Income Funds. Mr. Hanlon serves as Compliance Officer of FMR, FMR Co., Inc., Fidelity Investments Money Management, Inc. (FIMM), Fidelity Research and Analysis Company (FRAC), Fidelity Management & Research (Japan) Inc., Fidelity Management & Research (U.K.) Inc., Fidelity Management & Research (Hong Kong), and Strategic Advisers, Inc. (2009-present), as Senior Vice President of the Fidelity Asset Management Division (2009-present), and is an employee of Fidelity Investments. |
Joseph F. Zambello (55) |
| Year of Election or Appointment: 2011 Deputy Treasurer of the Fidelity funds. Mr. Zambello is an employee of Fidelity Investments. Previously, Mr. Zambello served as Vice President of FMR's Program Management Group (2009-2011) and Vice President of the Transfer Agent Oversight Group (2005-2009). |
Adrien E. Deberghes (45) |
| Year of Election or Appointment: 2008 Deputy Treasurer of Fidelity's Equity and High Income Funds. Mr. Deberghes also serves as Vice President (2011-present) and Assistant Treasurer (2010-present) of other Fidelity funds, and is an employee of Fidelity Investments (2008-present). Previously, Mr. Deberghes served as Senior Vice President of Mutual Fund Administration at State Street Corporation (2007-2008), Senior Director of Mutual Fund Administration at Investors Bank & Trust (2005-2007), and Director of Finance for Dunkin' Brands (2000-2005). |
Stephen Sadoski (41) |
| Year of Election or Appointment: 2012 Deputy Treasurer of Fidelity's Equity and High Income Funds. Mr. Sadoski also serves as Assistant Treasurer of other Fidelity funds (2012-present) and is an employee of Fidelity Investments (2012-present). Previously, Mr. Sadoski served as an assistant chief accountant in the Division of Investment Management of the Securities and Exchange Commission (SEC) (2009-2012) and as a senior manager at Deloitte & Touche (1997-2009). |
Stephanie J. Dorsey (43) |
| Year of Election or Appointment: 2010 Assistant Treasurer of Fidelity's Equity and High Income Funds. Ms. Dorsey also serves as Deputy Treasurer of other Fidelity funds (2008-present) and is an employee of Fidelity Investments (2008-present). Previously, Ms. Dorsey served as Treasurer (2004-2008) of the JPMorgan Mutual Funds and Vice President (2004-2008) of JPMorgan Chase Bank. |
John R. Hebble (54) |
| Year of Election or Appointment: 2009 Assistant Treasurer of Fidelity's Equity and High Income Funds. Mr. Hebble also serves as President (2011-present), Treasurer, and Chief Financial Officer of The North Carolina Capital Management Trust: Cash and Term Portfolios (2008-present), President and Treasurer of other Fidelity funds (2008-present) and is an employee of Fidelity Investments. |
Gary W. Ryan (54) |
| Year of Election or Appointment: 2005 Assistant Treasurer of the Fidelity funds. Mr. Ryan is an employee of Fidelity Investments. Previously, Mr. Ryan served as Vice President of Fund Reporting in Fidelity Pricing and Cash Management Services (FPCMS) (1999-2005). |
Jonathan Davis (44) |
| Year of Election or Appointment: 2010 Assistant Treasurer of the Fidelity funds. Mr. Davis is also Assistant Treasurer of Fidelity Rutland Square Trust II and Fidelity Commonwealth Trust II. Mr. Davis is an employee of Fidelity Investments. Previously, Mr. Davis served as Vice President and Associate General Counsel of FMR LLC (2003-2010). |
Annual Report
The Board of Trustees of each fund voted to pay to shareholders of record at the opening of business on record date the following distributions per share derived from capital gains realized from sales of portfolio securities and dividends derived from net investment income:
| Pay Date | Record Date | Dividends | Capital Gains |
Fidelity Diversified International Fund | 12/10/12 | 12/07/12 | $0.456 | $0.068 |
Fidelity International Capital Appreciation Fund | 12/10/12 | 12/07/12 | $0.120 | $0.000 |
Fidelity Overseas Fund | 12/10/12 | 12/07/12 | $0.774 | $0.000 |
Fidelity Worldwide Fund | 12/10/12 | 12/07/12 | $0.159 | $0.080 |
The funds hereby designate as capital gain dividend the amounts noted below for the taxable year ended October 31, 2012, or, if subsequently determined to be different, the net capital gain of such year.
Fidelity Worldwide Fund | $3,746,668 |
A percentage of the dividends distributed during the fiscal year for the following funds may be taken into account as a dividend for purposes of the maximum rate under section 1(h) (11) of the Internal Revenue Code:
Fidelity Diversified International Fund | 100% |
Fidelity Diversified International Fund: Class F | 100% |
Fidelity International Capital Appreciation Fund | 100% |
Fidelity Overseas Fund | 78% |
Fidelity Overseas Fund: Class F | 70% |
Fidelity Worldwide Fund | 100% |
A percentage of the dividends distributed during the fiscal year for the following funds qualifies for the dividends-received deduction for corporate shareholders:
Fidelity Diversified International Fund | 2% |
Fidelity Diversified International Fund: Class F | 1% |
Fidelity International Capital Appreciation Fund | 9% |
Fidelity Worldwide Fund | 98% |
The amounts per share which represent income derived from sources within, and taxes paid to, foreign countries or possessions of the United States are as follows:
| Pay Date | Income | Taxes |
Fidelity Diversified International Fund | 12/05/2011 | $0.512 | $0.0344 |
Fidelity Diversified International Fund: Class F | 12/05/2011 | $0.588 | $0.0344 |
Fidelity International Capital Appreciation Fund | 12/05/2011 | $0.141 | $0.0125 |
Fidelity Overseas Fund | 12/05/2011 | $0.814 | $0.0493 |
Fidelity Overseas Fund: Class F | 12/05/2011 | $0.912 | $0.0493 |
Fidelity Worldwide Fund | 12/05/2011 | $0.000 | $0.0000 |
The funds will notify shareholders in January 2013 of amounts for use in preparing 2012 income tax returns.
Annual Report
Board Approval of Investment Advisory Contracts and Management Fees
Broadly Diversified International Equity Funds
Each year, the Board of Trustees, including the Independent Trustees (together, the Board), votes on the renewal of the management contract and sub-advisory agreements (together, the Advisory Contracts) for each fund. The Board, assisted by the advice of fund counsel and Independent Trustees' counsel, requests and considers a broad range of information relevant to the renewal of the Advisory Contracts throughout the year.
The Board meets regularly and, at each of its meetings, considers factors that are relevant to its annual consideration of the renewal of each fund's Advisory Contracts, including the services and support provided to each fund and its shareholders. The Board has established various standing committees, each composed of and chaired by Independent Trustees with varying backgrounds, to which the Board has assigned specific subject matter responsibilities in order to enhance effective decision-making by the Board. The Board, acting directly and through its Committees, requests and receives information concerning the annual consideration of the renewal of each fund's Advisory Contracts. The Board also meets as needed to consider matters specifically related to the Board's annual consideration of the renewal of Advisory Contracts. Members of the Board may also meet with trustees of other Fidelity funds through ad hoc joint committees to discuss certain matters relevant to the Fidelity funds.
At its July 2012 meeting, the Board of Trustees, including the Independent Trustees, unanimously determined to renew each fund's Advisory Contracts. In reaching its determination, the Board considered all factors it believed relevant, including (i) the nature, extent, and quality of the services to be provided to each fund and its shareholders (including the investment performance of each fund); (ii) the competitiveness of each fund's management fee and total expense ratio relative to peer funds; (iii) the total costs of the services to be provided by and the profits to be realized by Fidelity from its relationship with each fund; (iv) the extent to which economies of scale exist and would be realized as each fund grows; and (v) whether fee levels reflect these economies of scale, if any, for the benefit of fund shareholders.
In considering whether to renew the Advisory Contracts for each fund, the Board reached a determination, with the assistance of fund counsel and Independent Trustees' counsel and through the exercise of its business judgment, that the renewal of the Advisory Contracts is in the best interests of each fund and its shareholders and that the compensation payable under the Advisory Contracts is fair and reasonable. The Board's decision to renew the Advisory Contracts was not based on any single factor, but rather was based on a comprehensive consideration of all the information provided to the Board at its meetings throughout the year. The Board, in reaching its determination to renew the Advisory Contracts, is aware that shareholders in each fund have a broad range of investment choices available to them, including a wide choice among mutual funds offered by Fidelity's competitors, and that each fund's shareholders, who have the opportunity to review and weigh the disclosure provided by the fund in its prospectus and other public disclosures, have chosen to invest in that fund, managed by Fidelity.
Nature, Extent, and Quality of Services Provided. The Board considered the staffing within the investment adviser, FMR, and the sub-advisers (together, the Investment Advisers), including the backgrounds of the funds' investment personnel, and also considered the funds' investment objectives, strategies, and related investment philosophies. The Independent Trustees also had discussions with senior management of Fidelity's investment operations and investment groups. The Board considered the structure of the portfolio manager compensation program and whether this structure provides appropriate incentives to act in the best interests of each fund.
Resources Dedicated to Investment Management and Support Services. The Board and the Fund Oversight and Research Committees reviewed the general qualifications and capabilities of the Investment Advisers' investment staff, including its size, education, experience, and resources, as well as the Investment Advisers' approach to recruiting, training, managing, and compensating investment personnel. The Board also noted that FMR has continued to increase the resources devoted to non-U.S. offices, including expansion of Fidelity's global investment organization. The Board noted that Fidelity's analysts have extensive resources, tools and capabilities that allow them to conduct sophisticated quantitative and fundamental analysis, as well as credit analysis of issuers, counterparties and guarantors. The Board also believes that Fidelity's investment professionals have sufficient access to global information and data so as to provide competitive investment results over time, and that those professionals also have access to sophisticated tools that permit them to assess portfolio construction and risk and performance attribution characteristics continuously, as well as to transmit new information and research conclusions rapidly around the world. Additionally, in its deliberations, the Board considered the Investment Advisers' trading and risk management capabilities and resources, which are an integral part of the investment management process.
Shareholder and Administrative Services. The Board considered (i) the nature, extent, quality, and cost of advisory, administrative, and shareholder services performed by the Investment Advisers and their affiliates under the Advisory Contracts and under separate agreements covering transfer agency, pricing and bookkeeping, and securities lending services for each fund; (ii) the nature and extent of the supervision of third party service providers, principally custodians and subcustodians; and (iii) the resources devoted to, and the record of compliance with, each fund's compliance policies and procedures. The Board also reviewed the allocation of fund brokerage, including allocations to brokers affiliated with the Investment Advisers, the use of brokerage commissions to pay fund expenses, and the use of "soft" commission dollars to pay for research services.
The Board noted that the growth of fund assets over time across the complex allows Fidelity to reinvest in the development of services designed to enhance the value or convenience of the Fidelity funds as investment vehicles. These services include 24-hour access to account information and market information through telephone representatives and over the Internet, investor education materials and asset allocation tools, and the expanded availability of Fidelity Investor Centers.
Annual Report
Board Approval of Investment Advisory Contracts and Management Fees - continued
Investment in a Large Fund Family. The Board considered the benefits to shareholders of investing in a Fidelity fund, including the benefits of investing in a fund that is part of a large family of funds offering a variety of investment disciplines and providing a large variety of mutual fund investor services. The Board noted that Fidelity had taken, or had made recommendations that resulted in the Fidelity funds taking, a number of actions over the previous year that benefited particular funds, including (i) continuing to dedicate additional resources to investment research and support of the senior management team that oversees asset management; (ii) persisting in efforts to enhance Fidelity's research capabilities, in particular, international research; (iii) launching new funds and making other enhancements to meet client needs for global and income-oriented solutions; (iv) continuing to launch dedicated lower cost underlying funds to meet investment management's portfolio construction needs related to expanding underlying fund options, specifically for the Freedom Fund product lines; (v) adopting a "Stock Selector" sector neutral investment approach and employing a team of portfolio managers who are sector specialists to manage certain funds; (vi) rationalizing product lines and gaining increased efficiencies through the mergers of several funds into other funds; (vii) strengthening the Spartan Index Fund product line by adding new funds and/or new low-cost institutional share classes, restructuring fund expenses to accommodate new classes, and reducing investment minimums for certain classes of shares; (viii) modifying the eligibility criteria for Institutional Class shares to increase their appeal to government entities and charitable investors; and (ix) reducing certain transfer agent fee rates.
Investment Performance (Diversified International Fund and Overseas Fund). The Board considered whether each fund has operated in accordance with its investment objective, as well as its record of compliance with its investment restrictions. It also reviewed each fund's absolute investment performance for each class, as well as each fund's relative investment performance for each class measured over multiple periods against (i) a broad-based securities market index, and (ii) a peer group of mutual funds deemed appropriate by Fidelity and reviewed by the Board. For each fund, the following charts considered by the Board show, over the one-, three-, and five-year periods ended December 31, 2011, as available, the cumulative total returns of Class K and the retail class of the fund, the cumulative total returns of a broad-based securities market index ("benchmark"), and a range of cumulative total returns of a peer group of mutual funds identified by Morningstar, Inc. as having an investment style similar to that of the fund based on underlying portfolio holdings. The box within each chart shows the 25th percentile return (top of box) and the 75th percentile return (bottom of box) of the peer group. Returns shown above the box are in the first quartile and returns shown below the box are in the fourth quartile. The percentage beaten numbers noted below each chart correspond to the percentile box and represent the percentage of funds in the peer group whose performance was equal to or lower than that of the class indicated.
Fidelity Diversified International Fund

The Board reviewed the fund's relative investment performance against its peer group and noted that the performance of the retail class of the fund (the class with the longer performance record) was in the second quartile for the one- and five-year periods and the third quartile for the three-year period. The Board also noted that the investment performance of the retail class of the fund was lower than its benchmark for the one- and three-year periods, although the five-year cumulative total return of the retail class compared favorably to its benchmark. The Board considered that the variations in performance between the fund's classes reflect the variations in class expenses, which result in lower performance for the higher expense class. The Board also reviewed the fund's performance since inception as well as performance in the current year.
Annual Report
Fidelity Overseas Fund
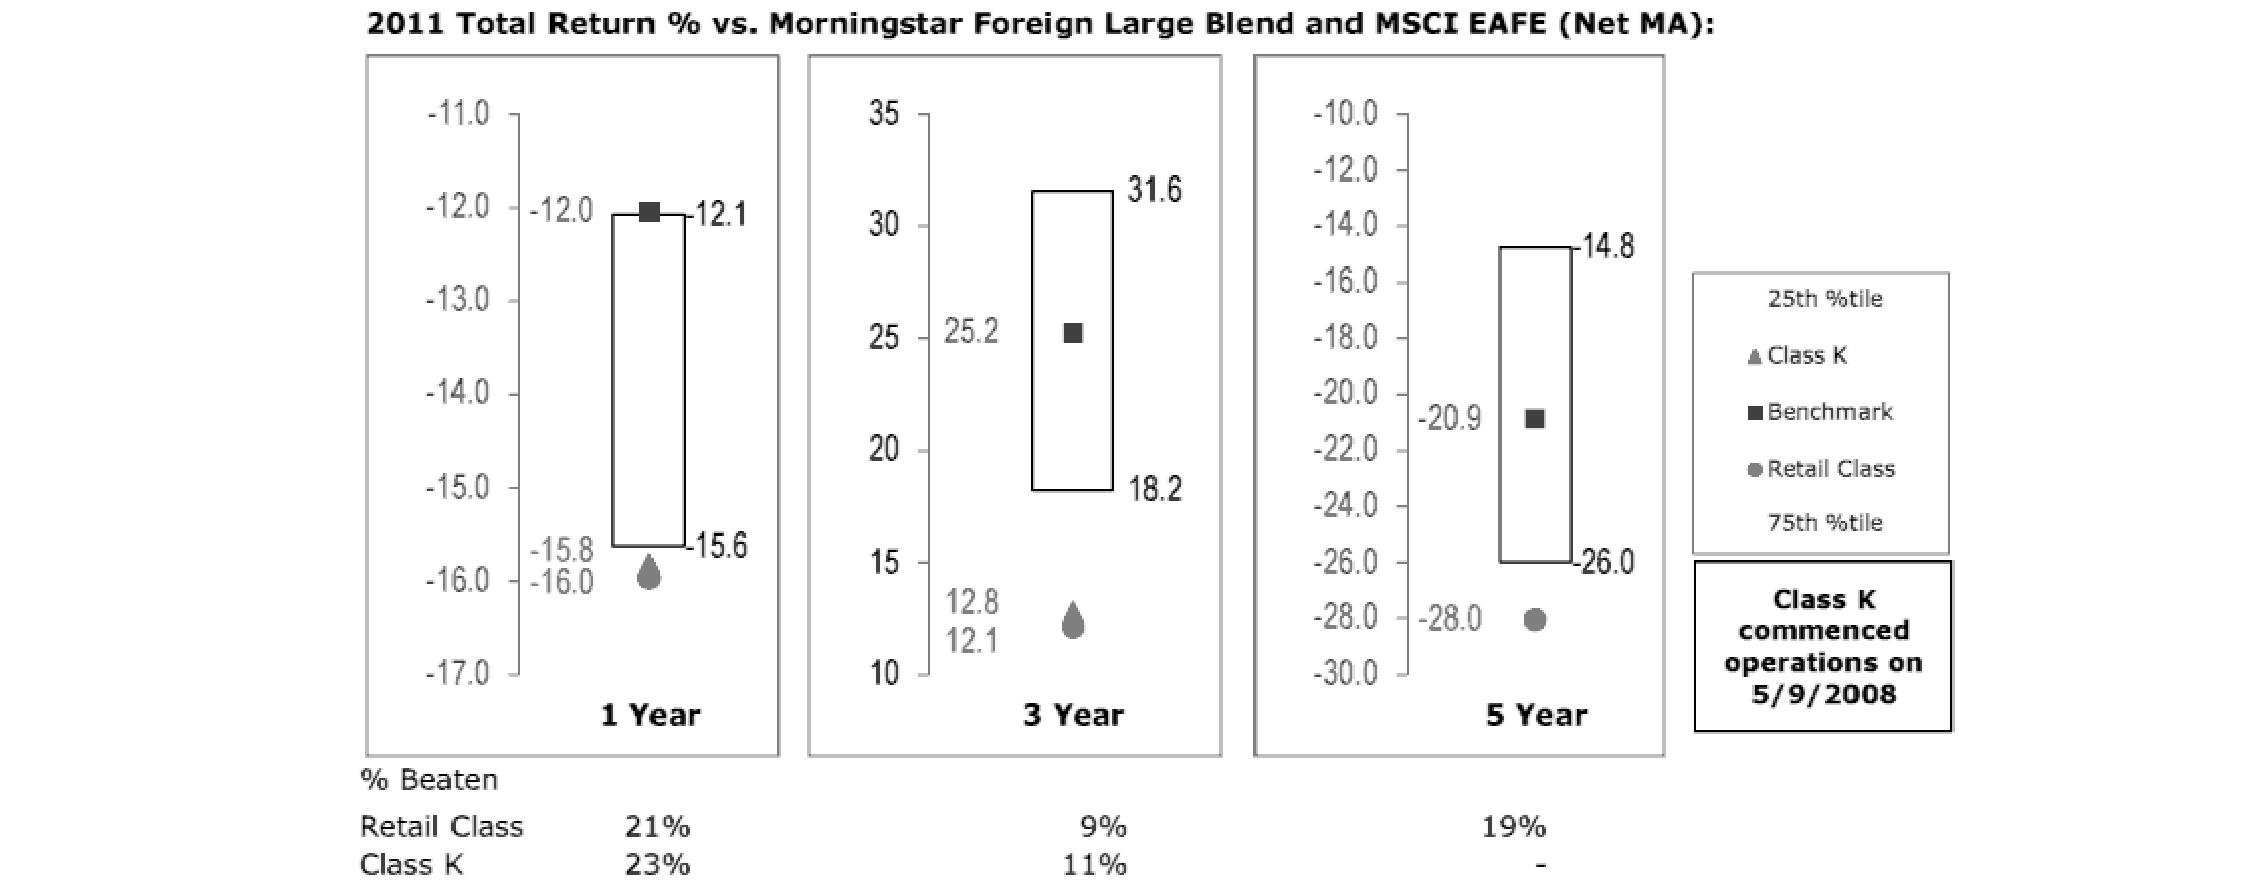
The Board reviewed the fund's relative investment performance against its peer group and noted that the performance of the retail class of the fund (the class with the longer performance record) was in the fourth quartile for all the periods shown. The Board also noted that the investment performance of the fund was lower than its benchmark for all the periods shown. The Board considered that the variations in performance between the fund's classes reflect the variations in class expenses, which result in lower performance for the higher expense class. The Board discussed with FMR actions to improve the fund's disappointing performance relative to its peer group and benchmark. The Board noted that this fund had underperformed in the past and discussed with FMR its disappointment with the continued underperformance of the fund. The Board noted that there was a portfolio management change for the fund in January 2012. The Board also reviewed the fund's performance since inception as well as performance in the current year. The Board will continue to closely monitor the performance of the fund in the coming year and discuss with FMR other appropriate actions to address the performance of the fund.
The Board also considered that each fund's management fee is subject to upward or downward adjustment depending upon whether, and to what extent, the fund's investment performance for the performance period exceeds, or is exceeded by, the record (over the same period) of a Board-approved performance adjustment index. The Board noted that the performance adjustment provides FMR with a strong economic incentive to seek to achieve superior performance for each fund's shareholders and helps to more closely align the interests of FMR and each fund's shareholders.
Based on its review, the Board concluded that the nature, extent, and quality of services provided to each fund under the Advisory Contracts should benefit each fund's shareholders.
Investment Performance (International Capital Appreciation Fund). The Board considered whether the fund has operated in accordance with its investment objective, as well as its record of compliance with its investment restrictions. It also reviewed the fund's absolute investment performance, as well as the fund's relative investment performance measured over multiple periods against (i) a broad-based securities market index, and (ii) a custom peer group of mutual funds deemed appropriate by Fidelity and reviewed by the Board. The following charts considered by the Board show, over the one-, three-, and five-year periods ended December 31, 2011, the fund's cumulative total returns, the cumulative total returns of a broad-based securities market index ("benchmark"), and a range of cumulative total returns of a custom peer group of mutual funds defined by FMR based on categories assigned by Morningstar, Inc. The fund's custom peer group, defined by FMR, is a peer group that FMR believes provides a more meaningful performance comparison than the peer group assigned by Morningstar, Inc., which assigns mutual funds to categories based on their investment styles as measured by their underlying portfolio holdings. The box within each chart shows the 25th percentile return (top of box) and the 75th percentile return (bottom of box) of the peer group. Returns shown above the box are in the first quartile and returns shown below the box are in the fourth quartile. The percentage beaten number noted below each chart corresponds to the percentile box and represents the percentage of funds in the peer group whose performance was equal to or lower than that of the fund.
Annual Report
Board Approval of Investment Advisory Contracts and Management Fees - continued
Fidelity International Capital Appreciation Fund
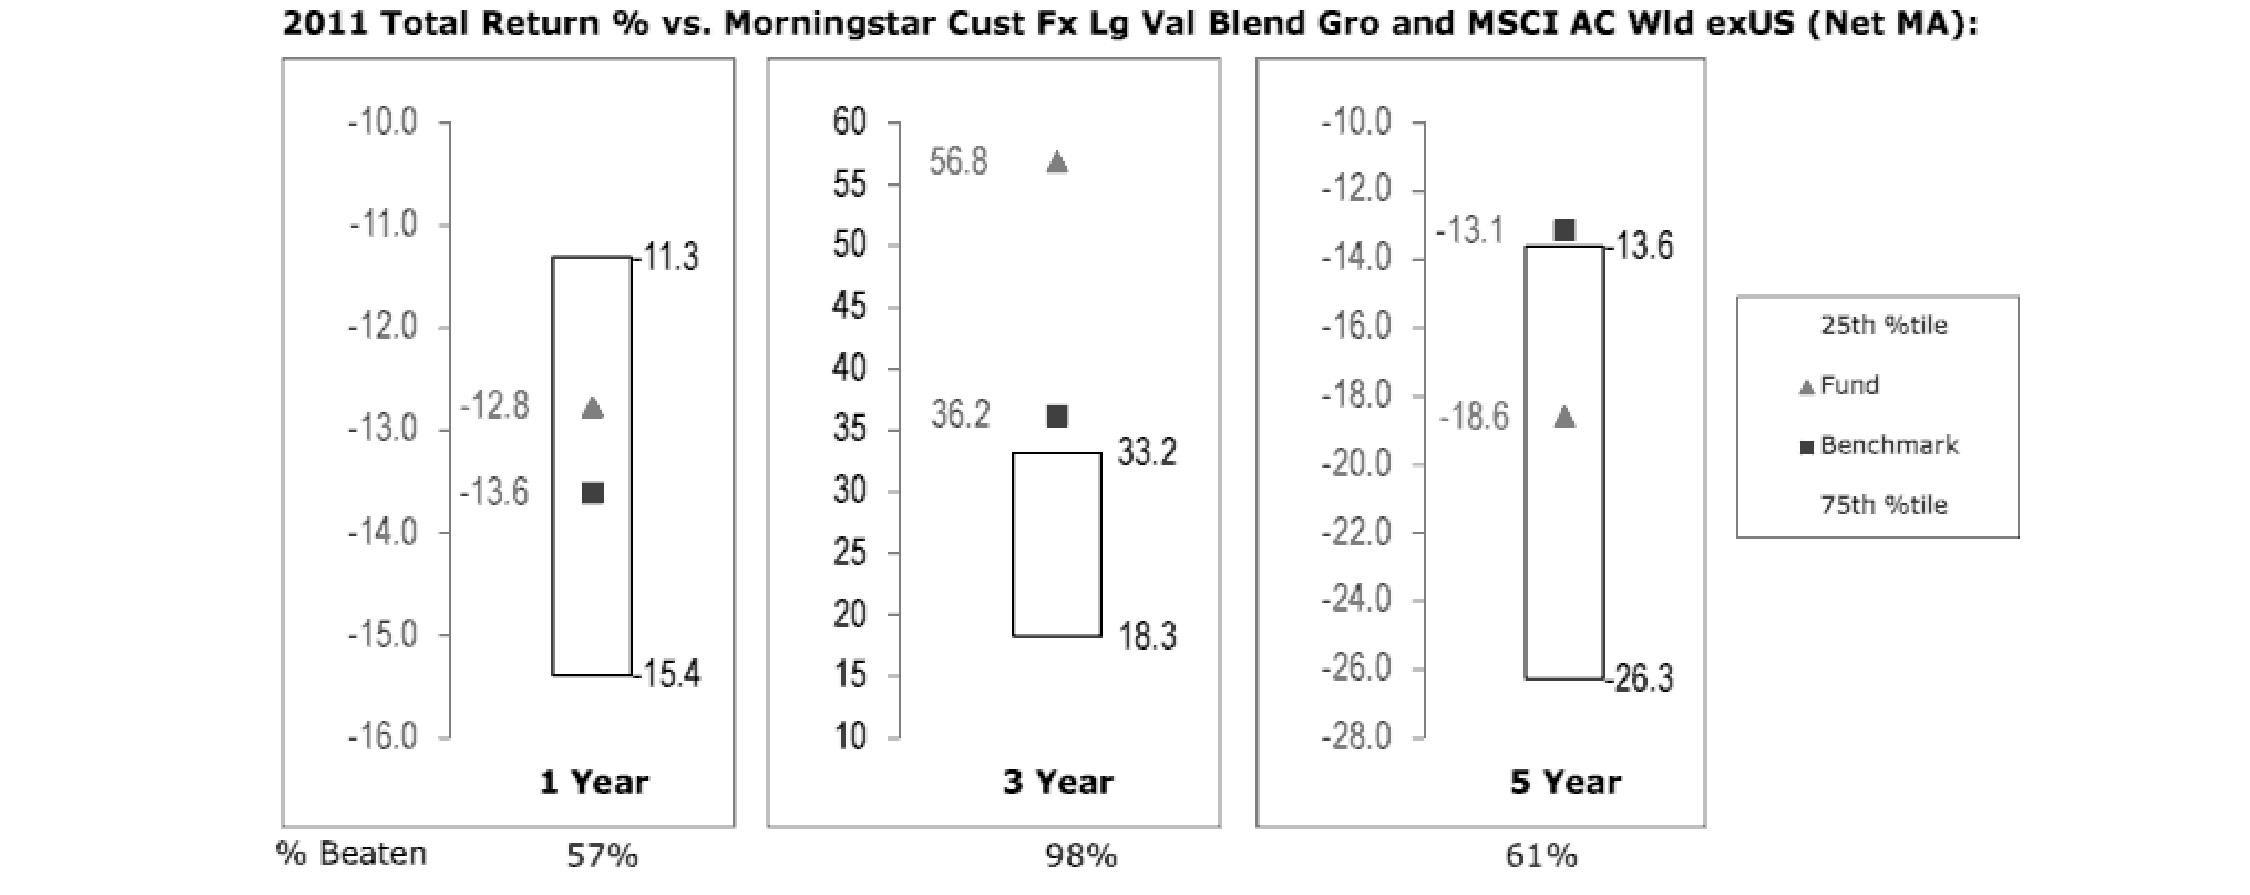
The Board reviewed the fund's relative investment performance against its peer group and noted that the performance of the fund was in the second quartile for the one- and five-year periods and the first quartile for the three-year period. The Board also noted that the investment performance of the fund compared favorably to its benchmark for the one- and three-year periods, although the fund's five-year cumulative total return was lower than its benchmark. The Board also reviewed the fund's performance since inception as well as performance in the current year.
The Board also considered that the fund's management fee is subject to upward or downward adjustment depending upon whether, and to what extent, the fund's investment performance for the performance period exceeds, or is exceeded by, the record (over the same period) of a Board-approved performance adjustment index. The Board noted that the performance adjustment provides FMR with a strong economic incentive to seek to achieve superior performance for the fund's shareholders and helps to more closely align the interests of FMR and the fund's shareholders.
Based on its review, the Board concluded that the nature, extent, and quality of services provided to the fund under the Advisory Contracts should benefit the fund's shareholders.
Investment Performance (Worldwide Fund). The Board considered whether the fund has operated in accordance with its investment objective, as well as its record of compliance with its investment restrictions. It also reviewed the fund's absolute investment performance for each class, as well as the fund's relative investment performance for each class measured over multiple periods against (i) a broad-based securities market index, and (ii) a peer group of mutual funds deemed appropriate by Fidelity and reviewed by the Board. The following charts considered by the Board show, over the one-, three-, and five-year periods ended December 31, 2011, as available, the cumulative total returns of the retail class and Class C of the fund, the cumulative total returns of a broad-based securities market index ("benchmark"), and a range of cumulative total returns of a peer group of mutual funds identified by Morningstar, Inc. as having an investment style similar to that of the fund based on underlying portfolio holdings. The returns of the retail class and Class C show the performance of the highest performing class (based on five-year performance) and the lowest performing class (based on one-year performance), respectively. The box within each chart shows the 25th percentile return (top of box) and the 75th percentile return (bottom of box) of the peer group. Returns shown above the box are in the first quartile and returns shown below the box are in the fourth quartile. The percentage beaten numbers noted below each chart correspond to the percentile box and represent the percentage of funds in the peer group whose performance was equal to or lower than that of the class indicated.
Annual Report
Fidelity Worldwide Fund

The Board reviewed the fund's relative investment performance against its peer group and noted that the performance of the retail class of the fund was in the second quartile for the one- and three-year periods and the first quartile for the five-year period. The Board also noted that the investment performance of the retail class of the fund compared favorably to its benchmark for the three- and five-year periods, although the fund's one-year total return was lower than its benchmark. The Board considered that the variations in performance among the fund's classes reflect the variations in class expenses, which result in lower performance for higher expense classes. The Board also reviewed the fund's performance since inception as well as performance in the current year.
The Board also considered that the fund's management fee is subject to upward or downward adjustment depending upon whether, and to what extent, the fund's investment performance for the performance period exceeds, or is exceeded by, the record (over the same period) of a Board-approved performance adjustment index. The Board noted that the performance adjustment provides FMR with a strong economic incentive to seek to achieve superior performance for the fund's shareholders and helps to more closely align the interests of FMR and the fund's shareholders.
Based on its review, the Board concluded that the nature, extent, and quality of services provided to the fund under the Advisory Contracts should benefit the fund's shareholders.
Competitiveness of Management Fee and Total Expense Ratio. The Board considered each fund's management fee and total expense ratio compared to "mapped groups" of competitive funds and classes. Fidelity creates "mapped groups" by combining similar Lipper investment objective categories that have comparable management fee characteristics. Combining Lipper investment objective categories aids the Board's management fee and total expense ratio comparisons by broadening the competitive group used for comparison and by reducing the number of universes to which various Fidelity funds are compared.
Management Fee. The Board considered two proprietary management fee comparisons for the 12-month periods shown in the charts below. The group of Lipper funds used by the Board for management fee comparisons is referred to below as the "Total Mapped Group." The Total Mapped Group comparison focuses on a fund's standing relative to the total universe of comparable funds available to investors in terms of gross management fees before expense reimbursements or caps, and without giving effect to a fund's performance adjustment. "TMG %" represents the percentage of funds in the Total Mapped Group that had management fees that were lower than a fund's. For example, a TMG % of 17% means that 83% of the funds in the Total Mapped Group had higher management fees than a fund. The "Asset-Size Peer Group" (ASPG) comparison focuses on a fund's standing relative to non-Fidelity funds similar in size to the fund within the Total Mapped Group. The ASPG represents at least 15% of the funds in the Total Mapped Group with comparable asset size and management fee characteristics, subject to a minimum of 50 funds (or all funds in the Total Mapped Group if fewer than 50). Additional information, such as the ASPG quartile in which a fund's management fee ranked and the impact of a fund's performance adjustment, is also included in the charts and considered by the Board.
Annual Report
Board Approval of Investment Advisory Contracts and Management Fees - continued
Fidelity Diversified International Fund
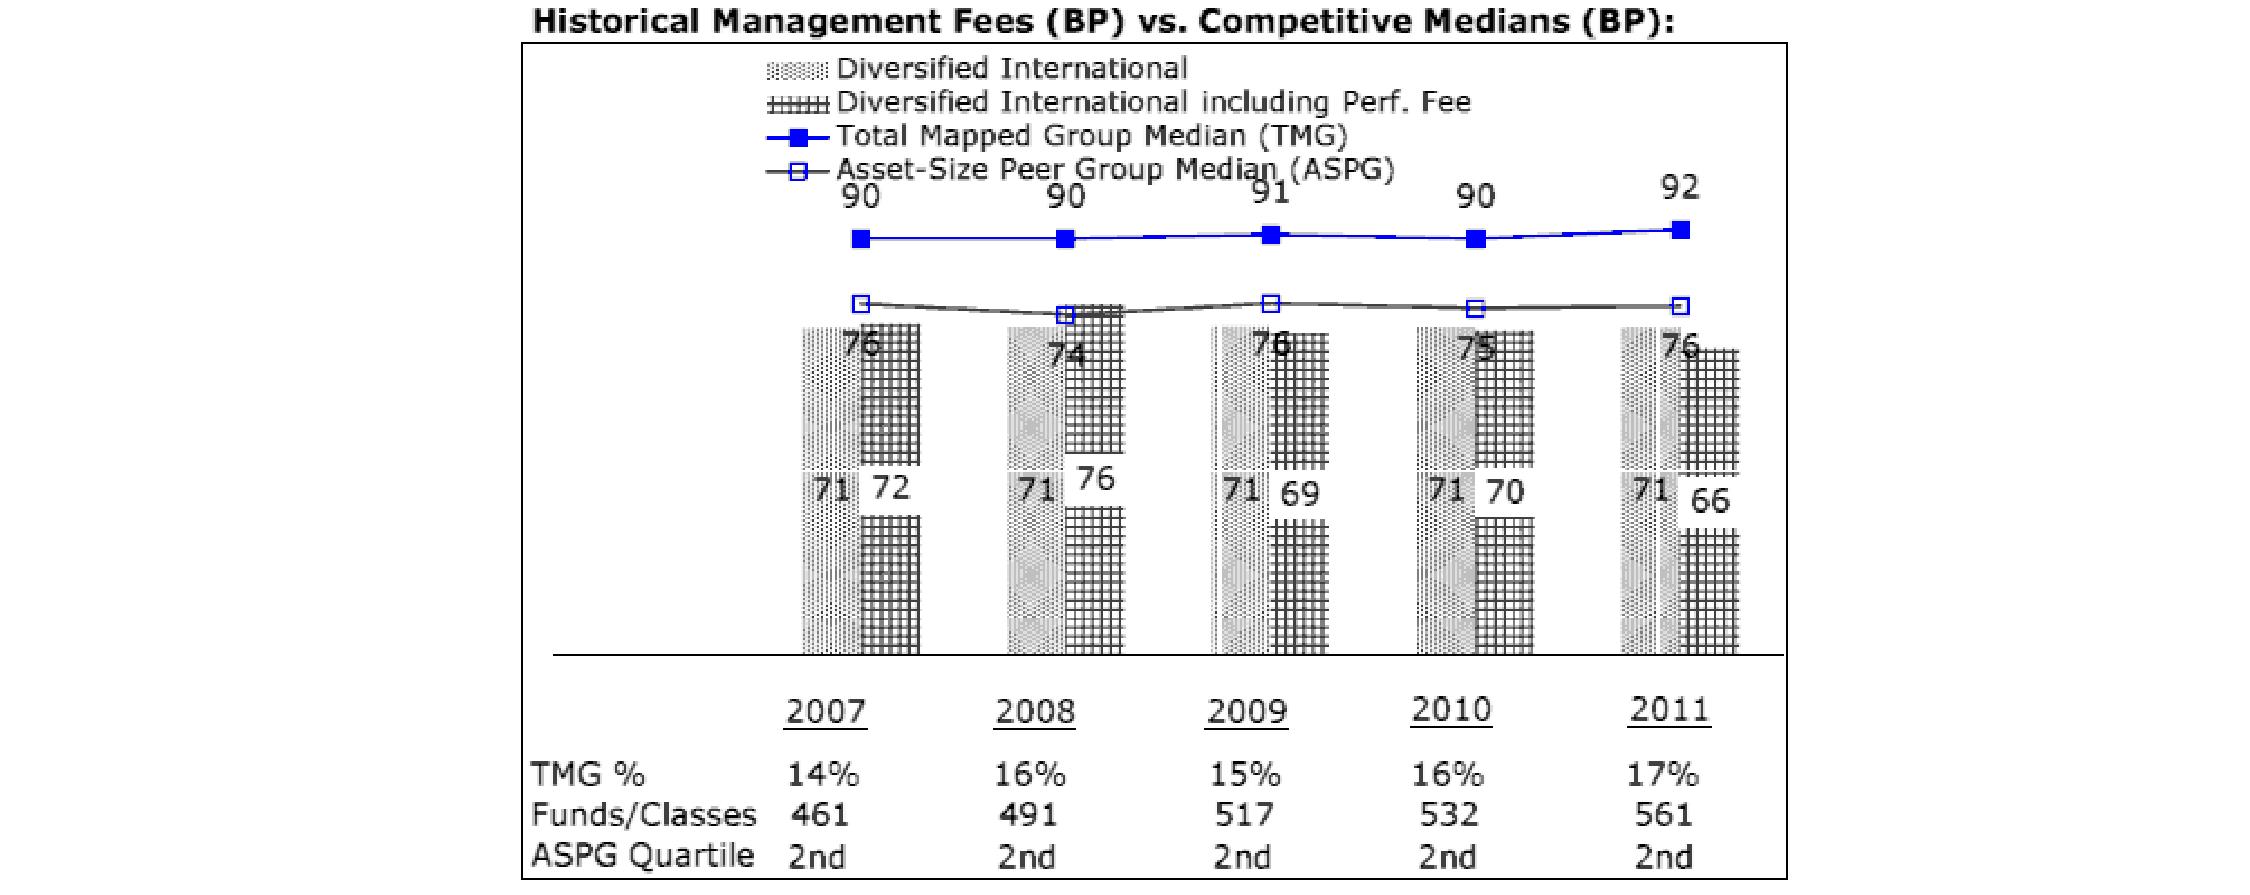
The Board noted that the fund's management fee ranked below the median of its Total Mapped Group and below the median of its ASPG for 2011. The Board also noted the effect of the fund's negative performance adjustment on the fund's management fee ranking. The Board noted that the performance adjustment for each year represents calculations for performance periods that differ from the periods shown in the performance charts above.
Fidelity International Capital Appreciation Fund
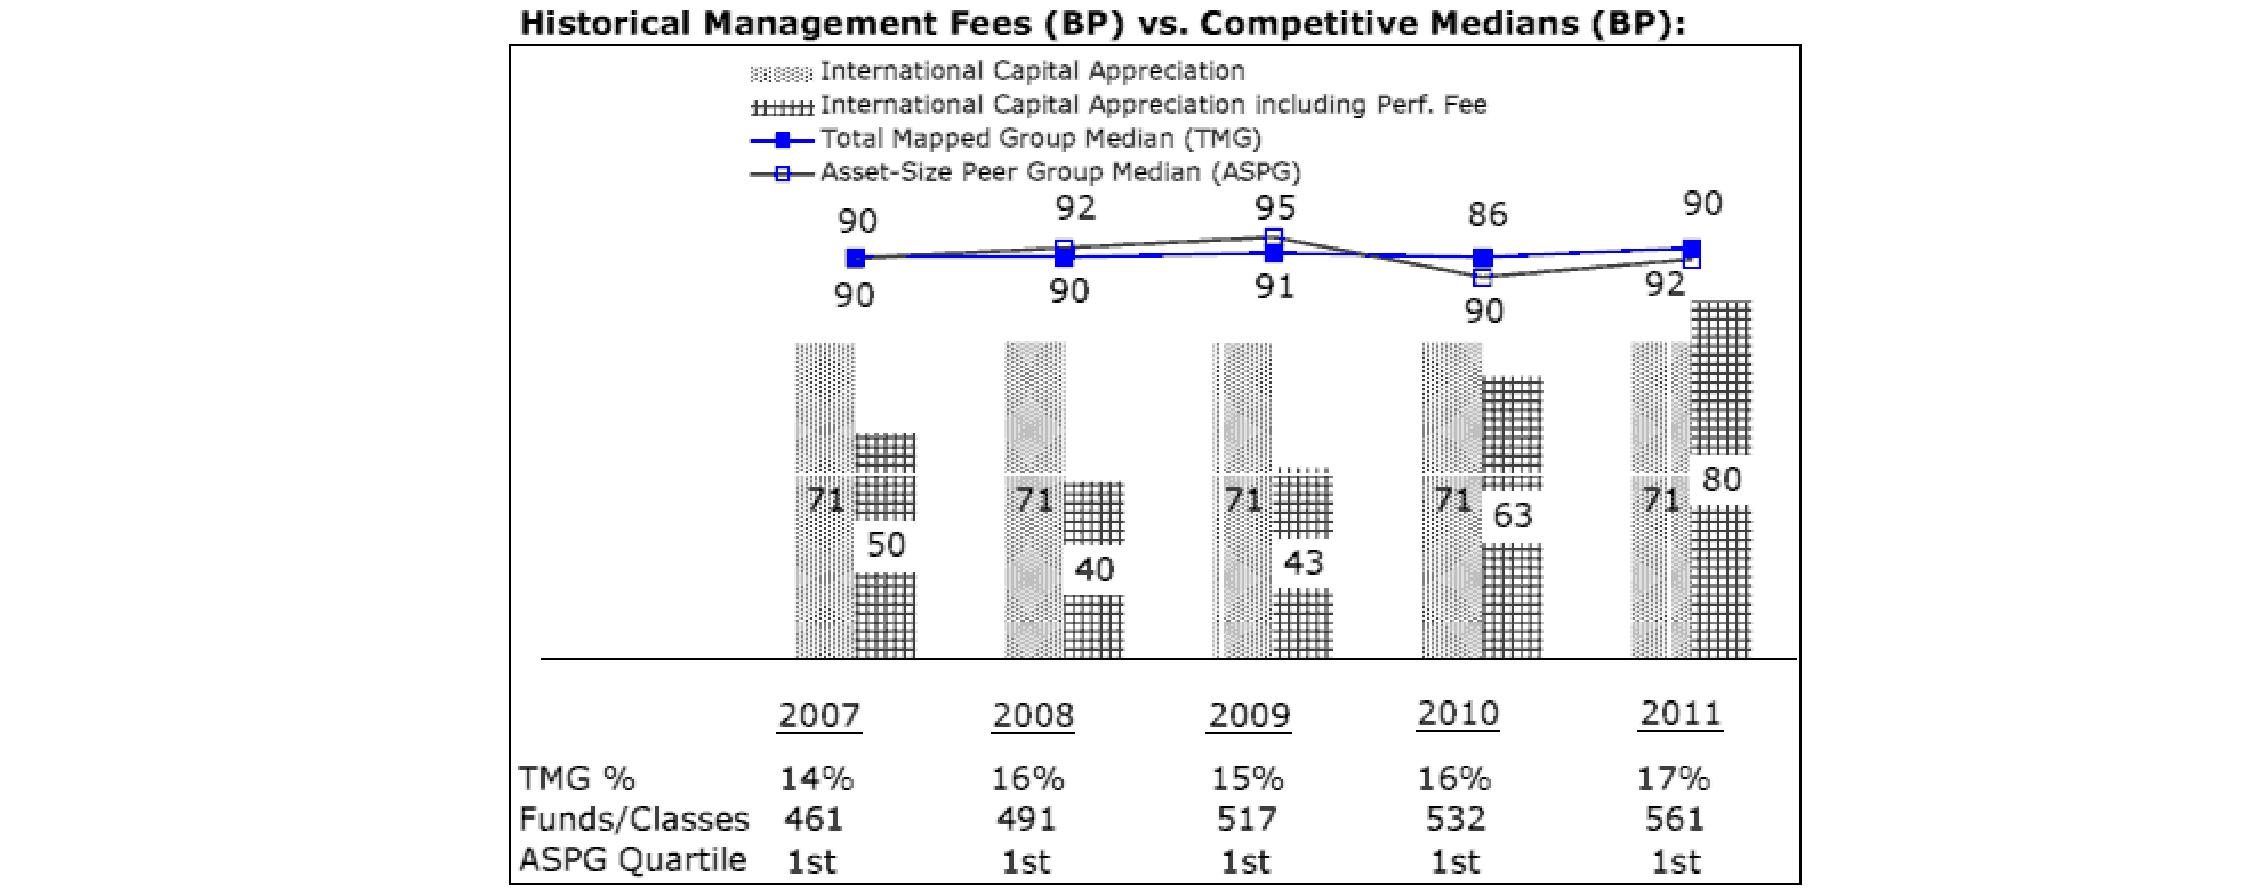
The Board noted that the fund's management fee ranked below the median of its Total Mapped Group and below the median of its ASPG for 2011. The Board also noted the effect of the fund's positive performance adjustment on the fund's management fee ranking. The Board noted that the performance adjustment for each year represents calculations for performance periods that differ from the periods shown in the performance charts above.
Annual Report
Fidelity Overseas Fund
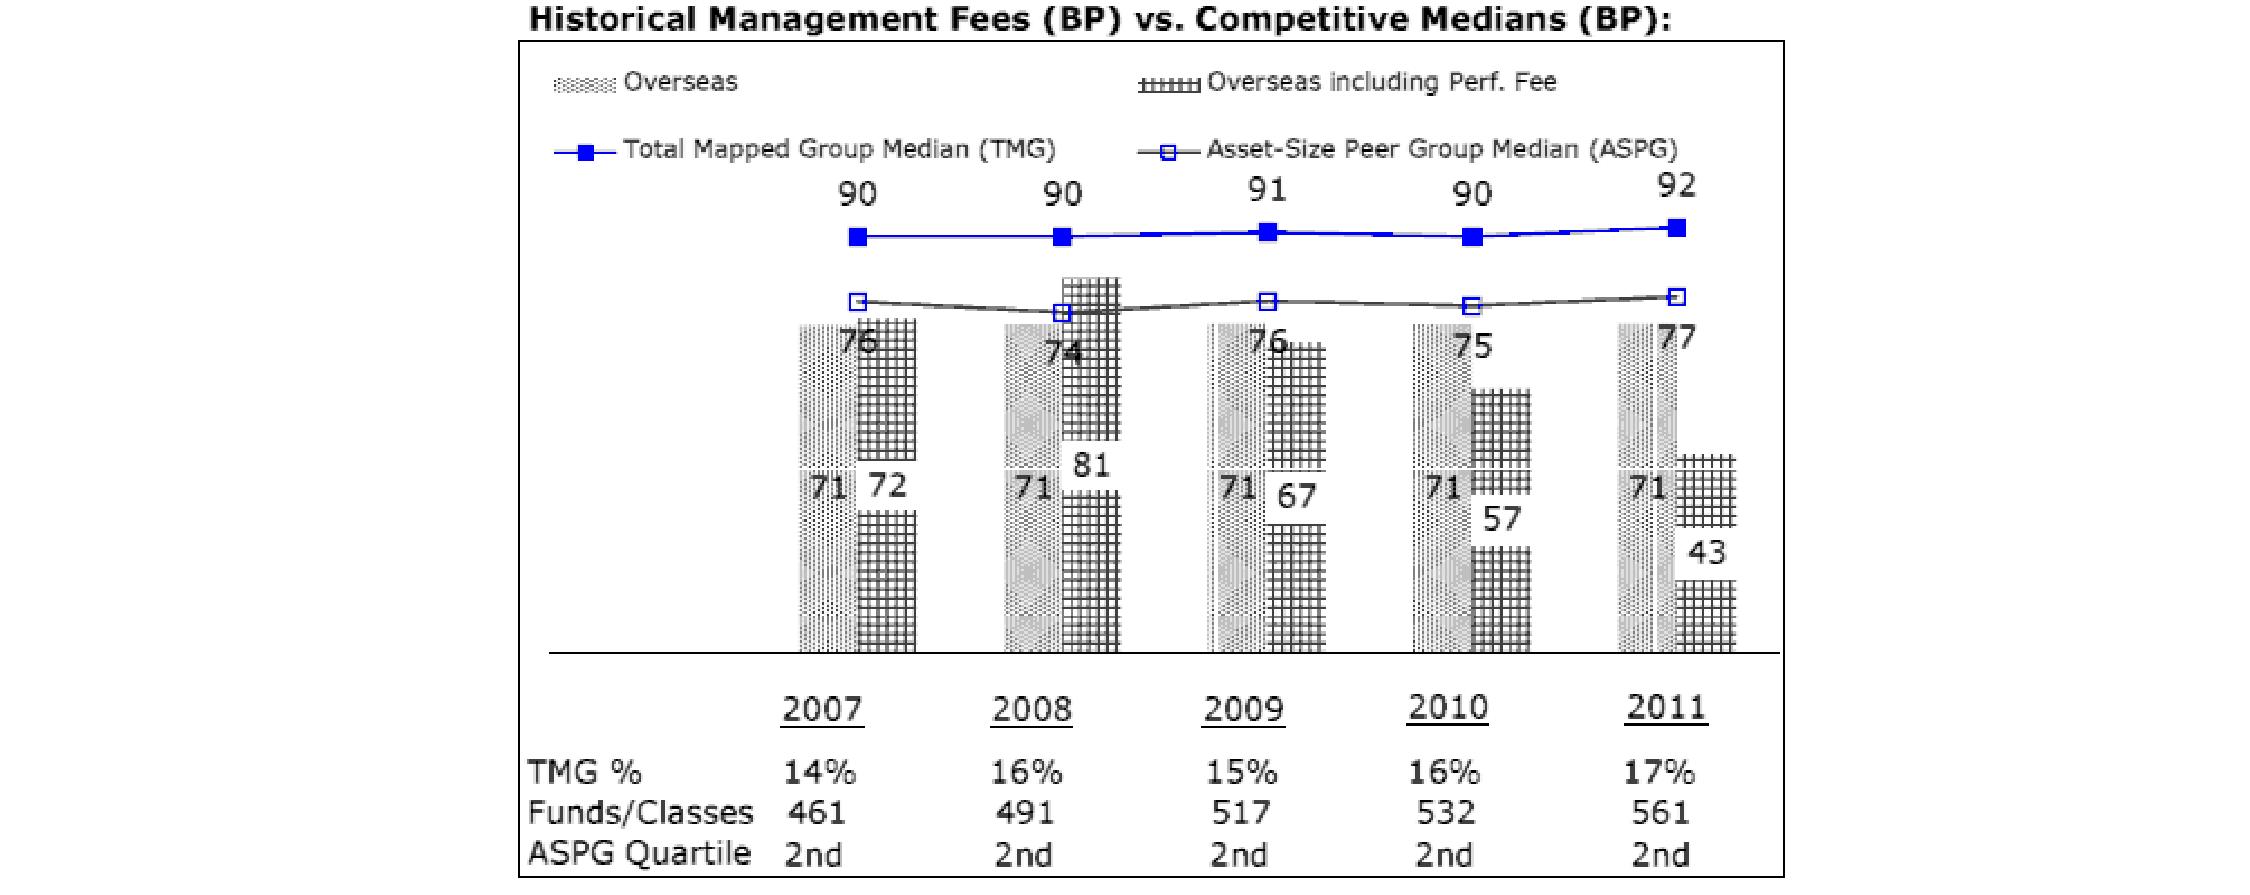
The Board noted that the fund's management fee ranked below the median of its Total Mapped Group and below the median of its ASPG for 2011. The Board also noted the effect of the fund's negative performance adjustment on the fund's management fee ranking. The Board noted that the performance adjustment for each year represents calculations for performance periods that differ from the periods shown in the performance charts above.
Fidelity Worldwide Fund
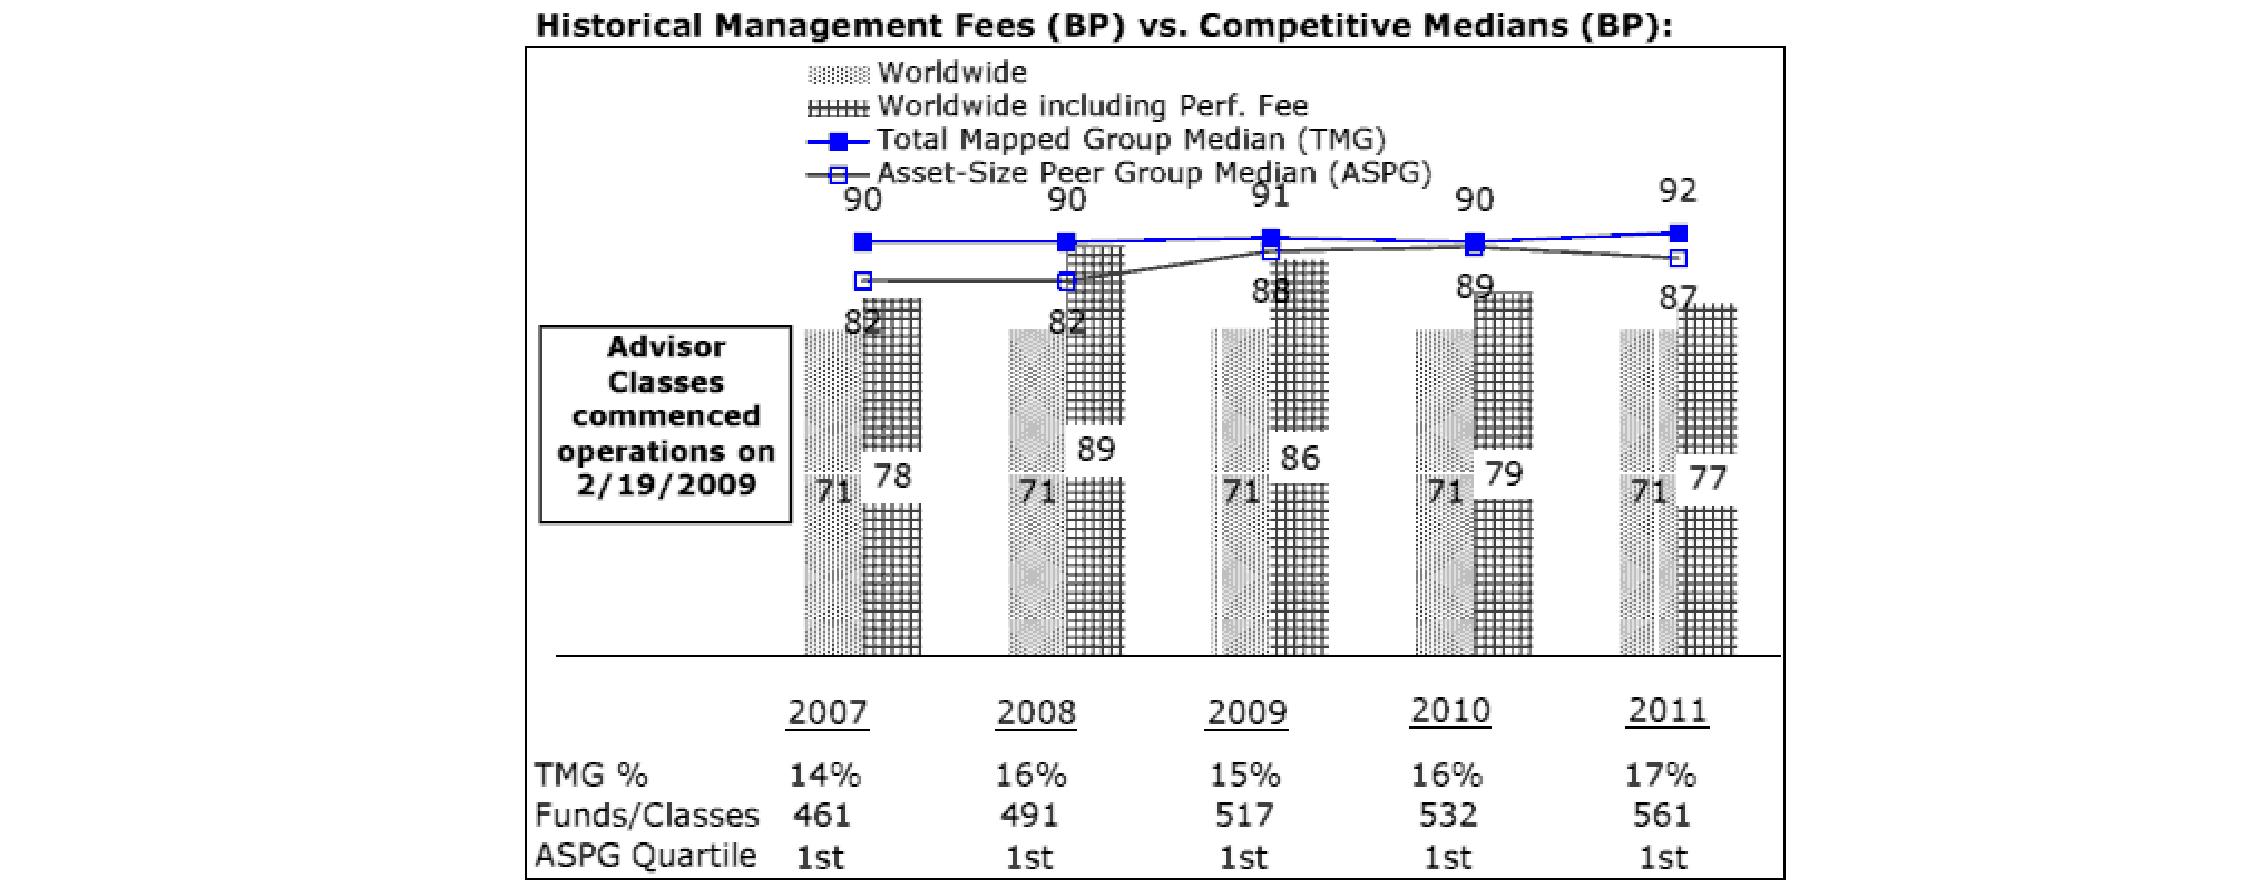
The Board noted that the fund's management fee ranked below the median of its Total Mapped Group and below the median of its ASPG for 2011. The Board also noted the effect of the fund's positive performance adjustment on the fund's management fee ranking. The Board noted that the performance adjustment for each year represents calculations for performance periods that differ from the periods shown in the performance charts above.
Based on its review, the Board concluded that each fund's management fee is fair and reasonable in light of the services that the fund receives and the other factors considered.
Total Expense Ratio. In its review of International Capital Appreciation Fund's total expense ratio, the Board considered the fund's management fee as well as other fund expenses, such as transfer agent fees, pricing and bookkeeping fees, and custodial, legal, and audit fees. The Board also noted the effects of any waivers and reimbursements on fees and expenses, as well as the impact of the fund's performance adjustment. As part of its review, the Board also considered the current and historical total expense ratios of the fund compared to competitive fund median expenses. The fund is compared to those funds and classes in the Total Mapped Group (used by the Board for management fee comparisons) that have a similar sales load structure.
Annual Report
Board Approval of Investment Advisory Contracts and Management Fees - continued
In its review of the total expense ratio of each class of each of Diversified International Fund, Overseas Fund, and Worldwide Fund, the Board considered the fund's management fee as well as other fund or class expenses, as applicable, such as transfer agent fees, pricing and bookkeeping fees, fund-paid 12b-1 fees (in the case of Worldwide Fund), and custodial, legal, and audit fees. The Board also noted the effects of any waivers and reimbursements on fees and expenses, as well as the impact of each fund's performance adjustment. As part of its review, the Board also considered the current and historical total expense ratios of each class of each fund compared to competitive fund median expenses. Each class of each fund is compared to those funds and classes in the Total Mapped Group (used by the Board for management fee comparisons) that have a similar sales load structure.
The Board noted that the total expense ratio of International Capital Appreciation Fund and each class of each of Diversified International Fund and Overseas Fund ranked below its competitive median for 2011.
The Board noted that the total expense ratio of each of Class A, Class B, Class C, and the retail class of Worldwide Fund ranked below its competitive median for 2011 and the total expense ratio of each of Class T and Institutional Class ranked above its competitive median for 2011. The Board considered that various factors, including 12b-1 fees, positive or negative performance adjustments, and relatively higher other expenses in the case of small fund size, can affect total expense ratios. The Board noted that the total expense ratio of Class T was above the competitive median primarily because of higher 12b-1 fees on Class T. Class T has a higher 12b-1 fee, but a lower front-end sales charge, than traditionally priced front-end sales charge classes. The Board considered that Class T is primarily sold load-waived in the retirement plan market where its 0.50% 12b-1 fee is comparable to competing no-load, higher 12b-1 fee classes designed specifically for retirement plans. The Board noted that the fund offers multiple classes, each of which has a different sales load and 12b-1 fee structure, and that the multiple structures are intended to offer a range of pricing options for the intermediary market. The Board also noted that the total expense ratios of the classes vary primarily by the level of their 12b-1 fees, although differences in transfer agent fees may also cause expenses to vary from class to class.
Fees Charged to Other Fidelity Clients. The Board also considered Fidelity fee structures and other information with respect to clients of FMR and its affiliates, such as other mutual funds advised or subadvised by FMR or its affiliates, pension plan clients, and other institutional clients. The Board noted the findings of the 2010 ad hoc joint committee (created with the board of other Fidelity funds), which reviewed and compared Fidelity's institutional investment advisory business with its business of providing services to the Fidelity funds, including the differences in services provided, fees charged, and costs incurred, as well as competition in their respective marketplaces.
Based on its review of total expense ratios and fees charged to other Fidelity clients, the Board concluded that the total expense ratio of International Capital Appreciation Fund and the total expense ratio of each class of Diversified International Fund, Overseas Fund, and Worldwide Fund were reasonable, although in some cases above the median of the universe presented for comparison, in light of the services that each fund and its shareholders receive and the other factors considered.
Costs of the Services and Profitability. The Board considered the revenues earned and the expenses incurred by Fidelity in conducting the business of developing, marketing, distributing, managing, administering and servicing each fund and its shareholders. The Board also considered the level of Fidelity's profits in respect of all the Fidelity funds.
On an annual basis, FMR presents to the Board Fidelity's profitability for each fund. Fidelity calculates the profitability for each fund, as well as aggregate profitability for groups of Fidelity funds and all Fidelity funds, using a series of detailed revenue and cost allocation methodologies which originate with the books and records of Fidelity on which Fidelity's audited financial statements are based. The Audit Committee of the Board reviews any significant changes from the prior year's methodologies.
PricewaterhouseCoopers LLP (PwC), independent registered public accounting firm and auditor to Fidelity and certain Fidelity funds, has been engaged annually by the Board as part of the Board's assessment of Fidelity's profitability analysis. PwC's engagement includes the review and assessment of Fidelity's methodologies used in determining the revenues and expenses attributable to Fidelity's mutual fund business, and completion of agreed-upon procedures surrounding the mathematical accuracy of fund profitability and its conformity to allocation methodologies. After considering PwC's reports issued under the engagement and information provided by Fidelity, the Board concluded that while other allocation methods may also be reasonable, Fidelity's profitability methodologies are reasonable in all material respects.
The Board also reviewed Fidelity's non-fund businesses and fall-out benefits related to the mutual fund business as well as cases where Fidelity's affiliates may benefit from or be related to the funds' business.
The Board considered the costs of the services provided by and the profits realized by Fidelity in connection with the operation of each fund and was satisfied that the profitability was not excessive in the circumstances.
Economies of Scale. The Board considered whether there have been economies of scale in respect of the management of the Fidelity funds, whether the Fidelity funds (including each fund) have appropriately benefited from any such economies of scale, and whether there is potential for realization of any further economies of scale. The Board considered the extent to which each fund will benefit from economies of scale through increased services to the fund, through waivers or reimbursements, or through fee or expense reductions. The Board also noted that in 2009, it and the board of other Fidelity funds created an ad hoc committee (the Economies of Scale Committee) to analyze whether FMR attains economies of scale in respect of the management and servicing of the Fidelity funds, whether the Fidelity funds have appropriately benefited from such economies of scale, and whether there is potential for realization of any further economies of scale.
Annual Report
The Board recognized that each fund's management contract incorporates a "group fee" structure, which provides for lower group fee rates as total fund assets under FMR's management increase, and for higher group fee rates as total fund assets under FMR's management decrease. FMR calculates the group fee rates based on a tiered asset "breakpoint" schedule that varies based on asset class. The Board considered that the group fee is designed to deliver the benefits of economies of scale to fund shareholders when total Fidelity fund assets increase, even if assets of any particular fund are unchanged or have declined, because some portion of Fidelity's costs are attributable to services provided to all Fidelity funds, and all funds benefit if those costs can be allocated among more assets. The Board concluded that, given the group fee structure, fund shareholders will benefit from lower management fees as assets under FMR's management increase at the fund complex level, regardless of whether Fidelity achieves any such economies of scale.
The Board concluded, taking into account the analysis of the Economies of Scale Committee, that economies of scale, if any, are being appropriately shared between fund shareholders and Fidelity.
Additional Information Requested by the Board. In order to develop fully the factual basis for consideration of the Fidelity funds' Advisory Contracts, the Board requested and received additional information on certain topics, including (i) fund performance trends, actions to be taken by FMR to improve certain funds' overall performance, and Fidelity's long-term strategies for certain funds; (ii) the potential to further rationalize the Fidelity fund lineup with the possibility of achieving savings for the funds and Fidelity; (iii) Fidelity's compensation structure for portfolio managers and other key investment personnel; (iv) the amount of the investment that each portfolio manager has made in the Fidelity fund(s) that he or she manages; (v) the realization of fall-out benefits in certain Fidelity business units; (vi) Fidelity's group fee structures, the potential impact of regulatory changes on such structures, and the rationale for the individual fee rates of certain funds; (vii) fund profitability methodology, including Fidelity's cost allocation methodology, and the impact of certain factors on fund profitability results; (viii) trends regarding industry use of performance fee structures and the possibility of implementing performance fee structures for additional funds; and (ix) the impact of net redemptions from the Fidelity funds.
Based on its evaluation of all of the conclusions noted above, and after considering all factors it believed relevant, the Board ultimately concluded that the advisory fee structures are fair and reasonable, and that each fund's Advisory Contracts should be renewed.
Annual Report
Investment Adviser
Fidelity Management & Research Company
Boston, MA
Investment Sub-Advisers
FMR Co., Inc.
Fidelity Management & Research
(U.K.) Inc.
Fidelity Management & Research
(Hong Kong) Limited
Fidelity Management & Research
(Japan) Inc.
FIL Investments (Japan) Limited
FIL Investment Advisors
FIL Investment Advisors
(UK) Limited
General Distributor
Fidelity Distributors Corporation
Smithfield, RI
Transfer and Service Agents
Fidelity Investments Institutional
Operations Company, Inc.
Boston, MA
Fidelity Service Company, Inc.
Boston, MA
Custodians
JPMorgan Chase Bank
New York, NY
Fidelity Diversified International Fund, Fidelity Overseas Fund, and Fidelity Worldwide Fund
The Northern Trust Company
Chicago, IL
Fidelity International Capital Appreciation Fund
Corporate Headquarters
82 Devonshire Street
Boston, MA 02109
www.fidelity.com
The Fidelity Telephone Connection
Mutual Fund 24-Hour Service
Exchanges/Redemptions
and Account Assistance 1-800-544-6666
Product Information 1-800-544-6666
Retirement Accounts 1-800-544-4774
(8 a.m. - 9 p.m.)
TDD Service 1-800-544-0118
for the deaf and hearing impaired
(9 a.m. - 9 p.m. Eastern time)
Fidelity Automated Service
Telephone (FAST®) (automated graphic)
1-800-544-5555
(automated graphic)
Automated line for quickest service
IBD-UANNPRO-1212
1.784774.109
(Fidelity Investment logo)(registered trademark)
Fidelity Advisor®
Emerging Europe,
Middle East, Africa (EMEA)
Fund - Class A, Class T, Class B
and Class C
Annual Report
October 31, 2012
(Fidelity Cover Art)
Class A, Class T, Class B, and Class C are classes of Fidelity® Emerging Europe,
Middle East, Africa (EMEA) Fund
Contents
Performance | (Click Here) | How the fund has done over time. |
Management's Discussion of Fund Performance | (Click Here) | The Portfolio Manager's review of fund performance and strategy. |
Shareholder Expense Example | (Click Here) | An example of shareholder expenses. |
Investment Changes | (Click Here) | A summary of major shifts in the fund's investments over the past six months. |
Investments | (Click Here) | A complete list of the fund's investments with their market values. |
Financial Statements | (Click Here) | Statements of assets and liabilities, operations, and changes in net assets, as well as financial highlights. |
Notes | (Click Here) | Notes to the financial statements. |
Report of Independent Registered Public Accounting Firm | (Click Here) | |
Trustees and Officers | (Click Here) | |
Distributions | (Click Here) | |
Board Approval of Investment Advisory Contracts and Management Fees | (Click Here) | |
To view a fund's proxy voting guidelines and proxy voting record for the 12-month period ended June 30, visit http://www.fidelity.com/proxyvotingresults or visit the Securities and Exchange Commission's (SEC) web site at http://www.sec.gov. You may also call 1-877-208-0098 to request a free copy of the proxy voting guidelines.
Standard & Poor's, S&P and S&P 500 are registered service marks of The McGraw-Hill Companies, Inc. and have been licensed for use by Fidelity Distributors Corporation.
Other third party marks appearing herein are the property of their respective owners.
All other marks appearing herein are registered or unregistered trademarks or service marks of FMR LLC or an affiliated company. © 2012 FMR LLC. All rights reserved.
Annual Report
This report and the financial statements contained herein are submitted for the general information of the shareholders of the fund. This report is not authorized for distribution to prospective investors in the fund unless preceded or accompanied by an effective prospectus.
A fund files its complete schedule of portfolio holdings with the SEC for the first and third quarters of each fiscal year on Form N-Q. Forms N-Q are available on the SEC's web site at http://www.sec.gov. A fund's Forms N-Q may be reviewed and copied at the SEC's Public Reference Room in Washington, DC. Information regarding the operation of the SEC's Public Reference Room may be obtained by calling 1-800-SEC-0330. For a complete list of a fund's portfolio holdings, view the most recent holdings listing, semiannual report, or annual report on Fidelity's web site at http://www.fidelity.com, http://www.advisor.fidelity.com, or http://www.401k.com, as applicable.
NOT FDIC INSURED • MAY LOSE VALUE • NO BANK GUARANTEE
Neither the fund nor Fidelity Distributors Corporation is a bank.
Annual Report
Average annual total return reflects the change in the value of an investment, assuming reinvestment of the class' distributions from dividend income and capital gains (the profits earned upon the sale of securities that have grown in value, if any) and assuming a constant rate of performance each year. The $10,000 table and the fund's returns do not reflect the deduction of taxes that a shareholder would pay on fund distributions or the redemption of fund shares. During periods of reimbursement by Fidelity, a fund's total return will be greater than it would be had the reimbursement not occurred. How a fund did yesterday is no guarantee of how it will do tomorrow.
Average Annual Total Returns
Periods ended October 31, 2012 | | Past 1
year | Life of
fundA |
Class A (incl. 5.75% sales charge) | | 0.26% | -3.36% |
Class T (incl. 3.50% sales charge) | | 2.42% | -3.11% |
Class B (incl. contingent deferred sales charge) B | | 0.56% | -3.25% |
Class C (incl. contingent deferred sales charge) C | | 4.68% | -2.80% |
A From May 8, 2008.
B Class B shares' contingent deferred sales charges included in the past one year and life of fund total return figures are 5% and 2%, respectively.
C Class C shares' contingent deferred sales charges included the past one year and life of fund total return figures are 1% and 0%, respectively.
Annual Report
$10,000 Over Life of Fund
Let's say hypothetically that $10,000 was invested in Fidelity Advisor® Emerging Europe, Middle East, Africa (EMEA) Fund - Class A on May 8, 2008, when the fund started, and the current 5.75% sales charge was paid. The chart shows how the value of your investment would have changed, and also shows how the MSCI® EM (Emerging Markets) Europe, Middle East and Africa Index performed over the same period.
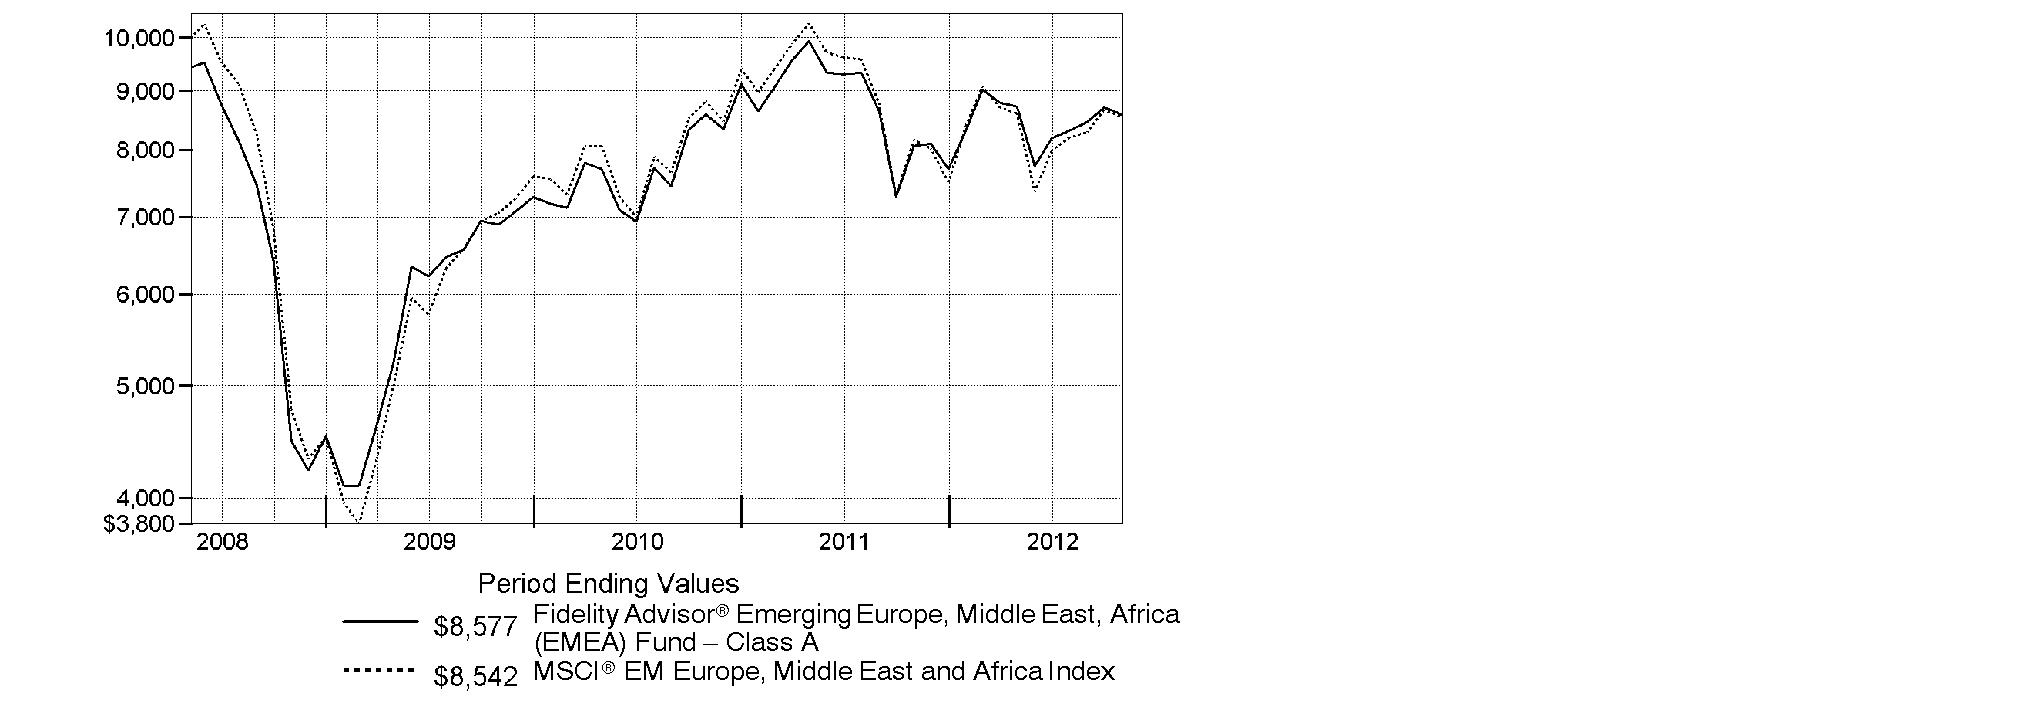
Annual Report
Market Recap: Emerging-markets stocks gained 2.98% for the year ending October 31, 2012, as measured by the MSCI® Emerging Markets Index. After some early choppiness, the index rallied strongly in the first two months of 2012 but retreated from March through May amid renewed concerns about Europe's sovereign debt crisis and continued economic sluggishness in key countries such as China and Brazil. A general uptrend in the final five months of the period lifted the index into positive territory for the full year, despite the head wind of a generally stronger U.S. dollar. Major benchmark component Brazil was a drag on performance, falling roughly 13%. The nation's inflation rate crept higher while economic growth ebbed, creating an unfavorable backdrop for stocks here. India's market retreated about 5%, while Russia gave up 4%. Conversely, Hong Kong advanced approximately 17%, aided by rebounding shares of property developers, while South Africa added 7%, China rose roughly 5% and South Korea and Taiwan gained about 4% and 1%, respectively. Sentiment about Chinese stocks improved following the government's September approval of massive outlays for infrastructure projects, in hopes of halting that nation's economic slowdown. However, China's ongoing transition to new Communist Party leadership created uncertainty that kept some investors on the sidelines.
Comments from Adam Kutas, Portfolio Manager of Fidelity Advisor® Emerging Europe, Middle East, Africa (EMEA) Fund: For the year, the fund's Class A, Class T, Class B and Class C shares returned 6.38%, 6.14%, 5.56% and 5.68%, respectively (excluding sales charges), outperforming the 4.73% gain of the MSCI® EM (Emerging Markets) Europe, Middle East and Africa Index. Relative to the index, an overweighting in consumer staples proved most fruitful, particularly within food and staples retailing. Our positioning in utilities also helped, as did an underweighting in materials and security selection in energy, financials and telecommunication services. Geographically, the fund was aided the most by stock selection in Kenya and out-of-benchmark holdings in Canada. Top contributors included Canada-based Africa Oil, three South African stocks - drug store chain Clicks Group, supermarket firm Shoprite Holdings and diversified financials firm FirstRand - and not owning Gold Fields and Impala Platinum Holdings, two underperforming index components located in South Africa. On the downside, an underweighting in consumer discretionary dampened relative returns, particularly in the media group. Regionally, positioning in Turkey and stock selection in Russia were negatives. Among the individual detractors were underweightings in South African media company Naspers and Russian retailer Magnit, an overweighting in South Africa's Harmony Gold Mining, an investment in Russian energy firm TNK-BP Holding and not owning Turkish bank and outperforming index component Akbank Turk Anonim Sirketi. Africa Oil and Magnit were not held by the fund at period end.
Note to shareholders: The fund may invest up to 35% of its total assets in any industry that represents more than 20% of the emerging Europe, Middle East and African markets. As of October 31, 2012, the fund did not have more than 25% of its total assets invested in any one industry.
The views expressed above reflect those of the portfolio manager(s) only through the end of the period as stated on the cover of this report and do not necessarily represent the views of Fidelity or any other person in the Fidelity organization. Any such views are subject to change at any time based upon market or other conditions and Fidelity disclaims any responsibility to update such views. These views may not be relied on as investment advice and, because investment decisions for a Fidelity fund are based on numerous factors, may not be relied on as an indication of trading intent on behalf of any Fidelity fund.
Annual Report
Shareholder Expense Example
As a shareholder of the Fund, you incur two types of costs: (1) transaction costs, including sales charges (loads) on purchase payments or redemption proceeds, redemption fees and (2) ongoing costs, including management fees, distribution and/or service (12b-1) fees and other Fund expenses. This Example is intended to help you understand your ongoing costs (in dollars) of investing in the Fund and to compare these costs with the ongoing costs of investing in other mutual funds.
The Example is based on an investment of $1,000 invested at the beginning of the period and held for the entire period (May 1, 2012 to October 31, 2012).
Actual Expenses
The first line of the accompanying table for each class of the Fund provides information about actual account values and actual expenses. You may use the information in this line, together with the amount you invested, to estimate the expenses that you paid over the period. Simply divide your account value by $1,000.00 (for example, an $8,600 account value divided by $1,000.00 = 8.6), then multiply the result by the number in the first line for a class of the Fund under the heading entitled "Expenses Paid During Period" to estimate the expenses you paid on your account during this period. A small balance maintenance fee of $12.00 that is charged once a year may apply for certain accounts with a value of less than $2,000. This fee is not included in the table below. If it was, the estimate of expenses you paid during the period would be higher, and your ending account value lower, by this amount. In addition, the Fund, as a shareholder in the underlying Fidelity Central Funds, will indirectly bear its pro-rata share of the fees and expenses incurred by the underlying Fidelity Central Funds. These fees and expenses are not included in the Fund's annualized expense ratio used to calculate the expense estimate in the table below.
Hypothetical Example for Comparison Purposes
The second line of the accompanying table for each class of the Fund provides information about hypothetical account values and hypothetical expenses based on a Class' actual expense ratio and an assumed rate of return of 5% per year before expenses, which is not the Class' actual return. The hypothetical account values and expenses may not be used to estimate the actual ending account balance or expenses you paid for the period. You may use this information to compare the ongoing costs of investing in the Fund and other funds. To do so, compare this 5% hypothetical example with the 5% hypothetical examples that appear in the shareholder reports of the other funds. A small balance maintenance fee of $12.00 that is charged once a year may apply for certain accounts with a value of less than $2,000. This fee is not included in the table below. If it was, the estimate of expenses you paid during the period would be higher, and your ending account value lower, by this amount. In addition, the Fund, as a shareholder in the underlying Fidelity Central Funds, will indirectly bear its pro-rata share of the fees and expenses incurred by the underlying Fidelity Central Funds. These fees and expenses are not included in the Fund's annualized expense ratio used to calculate the expense estimate in the table below.
Annual Report
Please note that the expenses shown in the table are meant to highlight your ongoing costs only and do not reflect any transaction costs. Therefore, the second line of the table is useful in comparing ongoing costs only, and will not help you determine the relative total costs of owning different funds. In addition, if these transactional costs were included, your costs would have been higher.
| Annualized
Expense Ratio | Beginning
Account Value
May 1, 2012 | Ending
Account Value
October 31, 2012 | Expenses Paid
During Period*
May 1, 2012 to
October 31, 2012 |
Class A | 1.59% | | | |
Actual | | $ 1,000.00 | $ 984.20 | $ 7.93 |
HypotheticalA | | $ 1,000.00 | $ 1,017.14 | $ 8.06 |
Class T | 1.88% | | | |
Actual | | $ 1,000.00 | $ 981.90 | $ 9.37 |
HypotheticalA | | $ 1,000.00 | $ 1,015.69 | $ 9.53 |
Class B | 2.34% | | | |
Actual | | $ 1,000.00 | $ 979.70 | $ 11.64 |
HypotheticalA | | $ 1,000.00 | $ 1,013.37 | $ 11.84 |
Class C | 2.35% | | | |
Actual | | $ 1,000.00 | $ 980.70 | $ 11.70 |
HypotheticalA | | $ 1,000.00 | $ 1,013.32 | $ 11.89 |
Emerging Europe, Middle East, Africa (EMEA) | 1.34% | | | |
Actual | | $ 1,000.00 | $ 986.50 | $ 6.69 |
HypotheticalA | | $ 1,000.00 | $ 1,018.40 | $ 6.80 |
Institutional Class | 1.24% | | | |
Actual | | $ 1,000.00 | $ 986.50 | $ 6.19 |
HypotheticalA | | $ 1,000.00 | $ 1,018.90 | $ 6.29 |
A 5% return per year before expenses
* Expenses are equal to each Class' annualized expense ratio, multiplied by the average account value over the period, multiplied by 184/366 (to reflect the one-half year period).
Annual Report
Investment Changes (Unaudited)
Geographic Diversification (% of fund's net assets) |
As of October 31, 2012 |
 | South Africa 42.4% | |
 | Russia 30.6% | |
 | Turkey 6.4% | |
 | United Arab Emirates 5.1% | |
 | Poland 2.6% | |
 | Kenya 2.3% | |
 | Nigeria 1.6% | |
 | Morocco 1.0% | |
| Other* 8.0% | |

* Includes short-term investments and net other assets. |
Percentages are based on country or territory of incorporation and are adjusted for the effect of futures contracts, if applicable. |
As of April 30, 2012 |
| South Africa 47.1% | |
| Russia 31.2% | |
| Turkey 5.0% | |
| United Arab Emirates 3.5% | |
 | Kenya 2.5% | |
| Poland 2.4% | |
| Nigeria 1.5% | |
| Morocco 1.0% | |
| Qatar 0.9% | |
| Other* 4.9% | |

* Includes short-term investments and net other assets. |
Percentages are based on country or territory of incorporation and are adjusted for the effect of futures contracts, if applicable. |
Asset Allocation |
| % of fund's
net assets | % of fund's net assets
6 months ago |
Stocks | 95.5 | 98.7 |
Bonds | 0.6 | 0.6 |
Short-Term Investments and Net Other Assets (Liabilities) | 3.9 | 0.7 |
Top Ten Stocks as of October 31, 2012 |
| % of fund's
net assets | % of fund's net assets
6 months ago |
MTN Group Ltd. (South Africa, Wireless Telecommunication Services) | 7.8 | 7.4 |
Lukoil Oil Co. (Russia, Oil, Gas & Consumable Fuels) | 7.6 | 6.3 |
Sberbank (Savings Bank of the Russian Federation) (Russia, Commercial Banks) | 6.8 | 6.5 |
Gazprom OAO (Russia, Oil, Gas & Consumable Fuels) | 6.4 | 8.0 |
Standard Bank Group Ltd. (South Africa, Commercial Banks) | 3.7 | 5.0 |
Turkiye Garanti Bankasi A/S (Turkey, Commercial Banks) | 3.3 | 2.4 |
FirstRand Ltd. (South Africa, Diversified Financial Services) | 3.2 | 4.2 |
Clicks Group Ltd. (South Africa, Food & Staples Retailing) | 3.0 | 2.8 |
NOVATEK OAO (Russia, Oil, Gas & Consumable Fuels) | 2.6 | 2.7 |
Surgutneftegaz JSC (Russia, Oil, Gas & Consumable Fuels) | 2.6 | 2.3 |
| 47.0 | |
Market Sectors as of October 31, 2012 |
| % of fund's
net assets | % of fund's net assets
6 months ago |
Financials | 28.0 | 26.8 |
Energy | 26.3 | 27.5 |
Telecommunication Services | 13.4 | 13.5 |
Materials | 9.7 | 10.8 |
Consumer Staples | 9.5 | 10.5 |
Industrials | 3.5 | 3.2 |
Consumer Discretionary | 3.0 | 4.1 |
Health Care | 1.6 | 1.3 |
Utilities | 0.5 | 1.0 |
Information Technology | 0.3 | 0.3 |
Annual Report
Investments October 31, 2012
Showing Percentage of Net Assets
Common Stocks - 92.9% |
| Shares | | Value |
Bailiwick of Jersey - 0.4% |
Randgold Resources Ltd. | 5,200 | | $ 621,595 |
Canada - 0.4% |
Silver Wheaton Corp. | 13,200 | | 531,965 |
Czech Republic - 0.7% |
Philip Morris CR A/S | 1,700 | | 910,824 |
Kenya - 2.3% |
Barclays Bank of Kenya Ltd. | 1,820,550 | | 337,812 |
British American Tobacco Kenya Ltd. | 76,700 | | 420,656 |
East African Breweries Ltd. | 153,906 | | 433,793 |
Kenya Airways Ltd. | 1,754,900 | | 256,588 |
Safaricom Ltd. | 25,380,571 | | 1,311,503 |
Uchumi Supermarket Ltd. | 2,000,000 | | 461,538 |
TOTAL KENYA | | 3,221,890 |
Morocco - 1.0% |
Maroc Telecom SA | 112,000 | | 1,415,396 |
Nigeria - 1.6% |
Guaranty Trust Bank PLC | 5,238,796 | | 660,437 |
Nigerian Breweries PLC | 124,501 | | 96,075 |
Skye Bank PLC | 28,071,010 | | 729,210 |
Zenith Bank PLC | 6,364,370 | | 730,205 |
TOTAL NIGERIA | | 2,215,927 |
Poland - 2.6% |
Bank Polska Kasa Opieki SA | 45,800 | | 2,199,157 |
Eurocash SA | 61,300 | | 748,622 |
Kruk SA (a) | 53,400 | | 729,250 |
TOTAL POLAND | | 3,677,029 |
Qatar - 0.9% |
Qatar National Bank SAQ | 18,153 | | 667,597 |
Vodafone Qatar QSC (a) | 254,173 | | 628,286 |
TOTAL QATAR | | 1,295,883 |
Russia - 28.0% |
Gazprom OAO | 1,948,900 | | 9,009,597 |
Lukoil Oil Co. | 5,000 | | 303,582 |
Lukoil Oil Co. sponsored ADR (United Kingdom) | 171,495 | | 10,366,873 |
NOVATEK OAO | 40,000 | | 434,273 |
NOVATEK OAO GDR (Reg. S) | 28,500 | | 3,249,000 |
Rosneft Oil Co. OJSC | 140,000 | | 1,038,970 |
Rosneft Oil Co. OJSC GDR (Reg. S) | 146,700 | | 1,085,580 |
Common Stocks - continued |
| Shares | | Value |
Russia - continued |
Sberbank (Savings Bank of the Russian Federation) | 3,263,700 | | $ 9,554,222 |
Sistema JSFC sponsored GDR | 11,700 | | 214,695 |
TNK-BP Holding | 909,300 | | 1,856,259 |
Uralkali OJSC | 282,800 | | 2,229,184 |
TOTAL RUSSIA | | 39,342,235 |
South Africa - 42.4% |
Adcock Ingram Holdings Ltd. | 62,000 | | 414,017 |
AngloGold Ashanti Ltd. | 86,100 | | 2,908,917 |
Aspen Pharmacare Holdings Ltd. | 74,300 | | 1,353,924 |
Cashbuild Ltd. | 60,100 | | 1,039,299 |
Clicks Group Ltd. | 609,706 | | 4,203,632 |
DRDGOLD Ltd. | 1,483,914 | | 1,040,544 |
FirstRand Ltd. | 1,370,500 | | 4,549,023 |
Harmony Gold Mining Co. Ltd. | 435,600 | | 3,568,840 |
Holdsport Ltd. | 80,000 | | 415,194 |
Kagiso Media Ltd. | 123,000 | | 283,716 |
Massmart Holdings Ltd. | 81,300 | | 1,635,255 |
MTN Group Ltd. | 610,950 | | 11,016,002 |
Nampak Ltd. | 689,600 | | 2,298,494 |
Naspers Ltd. Class N | 39,600 | | 2,570,884 |
Omnia Holdings Ltd. | 26,000 | | 384,873 |
Pinnacle Technology Holdings Ltd. | 218,800 | | 432,773 |
Pioneer Foods Ltd. | 172,000 | | 1,100,956 |
Rand Merchant Insurance Holdings Ltd. | 120,900 | | 315,265 |
Raubex Group Ltd. | 1,475,600 | | 2,808,025 |
RMB Holdings Ltd. | 286,500 | | 1,256,937 |
Sanlam Ltd. | 381,900 | | 1,705,868 |
Sasol Ltd. | 77,900 | | 3,318,546 |
Shoprite Holdings Ltd. | 111,100 | | 2,284,619 |
Standard Bank Group Ltd. | 419,763 | | 5,185,403 |
Vodacom Group Ltd. | 239,600 | | 3,020,336 |
Wilson Bayly Holmes-Ovcon Ltd. | 27,700 | | 453,965 |
TOTAL SOUTH AFRICA | | 59,565,307 |
Turkey - 6.4% |
Aygaz A/S | 159,000 | | 732,686 |
Koc Holding A/S | 143,850 | | 675,714 |
Turk Telekomunikasyon A/S | 324,100 | | 1,265,662 |
Turkiye Garanti Bankasi A/S | 984,000 | | 4,699,046 |
Turkiye Petrol Rafinerile A/S | 68,000 | | 1,661,590 |
TOTAL TURKEY | | 9,034,698 |
Common Stocks - continued |
| Shares | | Value |
United Arab Emirates - 5.1% |
Agthia Group PJSC | 734,869 | | $ 390,143 |
Aldar Properties PJSC (a) | 1,587,210 | | 587,696 |
Dubai Financial Market PJSC (a) | 5,815,429 | | 1,599,124 |
Emaar Properties (a) | 330,000 | | 324,340 |
Emirates NBD Bank PJSC | 396,999 | | 311,287 |
First Gulf Bank PJSC | 1,093,458 | | 3,110,982 |
National Bank of Abu Dhabi PJSC (a) | 156,000 | | 420,474 |
NMC Health PLC | 160,300 | | 468,218 |
TOTAL UNITED ARAB EMIRATES | | 7,212,264 |
United Kingdom - 0.7% |
Tullow Oil PLC | 40,500 | | 917,611 |
Zambia - 0.4% |
Zambeef Products PLC | 997,525 | | 509,548 |
TOTAL COMMON STOCKS (Cost $128,358,203) |
130,472,172
|
Nonconvertible Preferred Stocks - 2.6% |
| | | |
Russia - 2.6% |
Surgutneftegaz JSC
(Cost $3,238,242) | 5,826,700 | |
3,608,911
|
Nonconvertible Bonds - 0.3% |
| Principal Amount | | |
Multi-National - 0.3% |
International Bank for Reconstruction & Development 8.2% 12/12/12
(Cost $510,799) | NGN | 80,000,000 | |
501,719
|
Government Obligations - 0.3% |
|
Ghana - 0.3% |
Ghana Republic 14.99% 3/11/13
(Cost $672,328) | GHS | 950,000 | |
495,198
|
Money Market Funds - 3.4% |
| Shares | | Value |
Fidelity Cash Central Fund, 0.19% (b)
(Cost $4,780,137) | 4,780,137 | | $ 4,780,137 |
TOTAL INVESTMENT PORTFOLIO - 99.5% (Cost $137,559,709) | | 139,858,137 |
NET OTHER ASSETS (LIABILITIES) - 0.5% | | 649,226 |
NET ASSETS - 100% | $ 140,507,363 |
Currency Abbreviations |
GHS | - | Ghana Cedi |
NGN | - | Nigerian naira |
Legend |
(a) Non-income producing |
(b) Affiliated fund that is available only to investment companies and other accounts managed by Fidelity Investments. The rate quoted is the annualized seven-day yield of the fund at period end. A complete unaudited listing of the fund's holdings as of its most recent quarter end is available upon request. In addition, each Fidelity Central Fund's financial statements, which are not covered by the Fund's Report of Independent Registered Public Accounting Firm, are available on the SEC's website or upon request. |
Affiliated Central Funds |
Information regarding fiscal year to date income earned by the Fund from investments in Fidelity Central Funds is as follows: |
Fund | Income earned |
Fidelity Cash Central Fund | $ 1,816 |
Fidelity Securities Lending Cash Central Fund | 2,270 |
Total | $ 4,086 |
Other Information |
Categorizations in the Schedule of Investments are based on country or territory of incorporation. |
The following is a summary of the inputs used, as of October 31, 2012, involving the Fund's assets and liabilities carried at fair value. The inputs or methodology used for valuing securities may not be an indication of the risk associated with investing in those securities. For more information on valuation inputs, and their aggregation into the levels used in the table below, please refer to the Security Valuation section in the accompanying Notes to Financial Statements. |
Valuation Inputs at Reporting Date: |
Description | Total | Level 1 | Level 2 | Level 3 |
Investments in Securities: | | | | |
Equities: | | | | |
Consumer Discretionary | $ 4,309,093 | $ 4,309,093 | $ - | $ - |
Consumer Staples | 13,195,661 | 13,195,661 | - | - |
Energy | 36,850,792 | 33,532,246 | 3,318,546 | - |
Financials | 38,944,085 | 38,944,085 | - | - |
Health Care | 2,236,159 | 2,236,159 | - | - |
Industrials | 4,923,542 | 4,923,542 | - | - |
Information Technology | 432,773 | 432,773 | - | - |
Materials | 13,584,412 | 6,485,060 | 7,099,352 | - |
Telecommunication Services | 18,871,880 | 18,871,880 | - | - |
Utilities | 732,686 | 732,686 | - | - |
Corporate Bonds | 501,719 | - | 501,719 | - |
Government Obligations | 495,198 | - | 495,198 | - |
Money Market Funds | 4,780,137 | 4,780,137 | - | - |
Total Investments in Securities: | $ 139,858,137 | $ 128,443,322 | $ 11,414,815 | $ - |
See accompanying notes which are an integral part of the financial statements.
Annual Report
Statement of Assets and Liabilities
| October 31, 2012 |
| | |
Assets | | |
Investment in securities, at value - See accompanying schedule: Unaffiliated issuers (cost $132,779,572) | $ 135,078,000 | |
Fidelity Central Funds (cost $4,780,137) | 4,780,137 | |
Total Investments (cost $137,559,709) | | $ 139,858,137 |
Foreign currency held at value (cost $4) | | 4 |
Receivable for investments sold | | 932,927 |
Receivable for fund shares sold | | 236,104 |
Dividends receivable | | 137,560 |
Interest receivable | | 46,891 |
Distributions receivable from Fidelity Central Funds | | 384 |
Other receivables | | 20,009 |
Total assets | | 141,232,016 |
| | |
Liabilities | | |
Payable to custodian bank | $ 173,955 | |
Payable for investments purchased | 203,317 | |
Payable for fund shares redeemed | 116,731 | |
Accrued management fee | 94,834 | |
Distribution and service plan fees payable | 10,112 | |
Other affiliated payables | 40,250 | |
Other payables and accrued expenses | 85,454 | |
Total liabilities | | 724,653 |
| | |
Net Assets | | $ 140,507,363 |
Net Assets consist of: | | |
Paid in capital | | $ 137,298,110 |
Undistributed net investment income | | 2,631,143 |
Accumulated undistributed net realized gain (loss) on investments and foreign currency transactions | | (1,720,590) |
Net unrealized appreciation (depreciation) on investments and assets and liabilities in foreign currencies | | 2,298,700 |
Net Assets | | $ 140,507,363 |
See accompanying notes which are an integral part of the financial statements.
Annual Report
Statement of Assets and Liabilities - continued
| October 31, 2012 |
| | |
Calculation of Maximum Offering Price Class A:
Net Asset Value and redemption price per share ($8,933,695 ÷ 1,025,317 shares) | | $ 8.71 |
| | |
Maximum offering price per share (100/94.25 of $8.71) | | $ 9.24 |
Class T:
Net Asset Value and redemption price per share ($3,335,630 ÷ 384,126 shares) | | $ 8.68 |
| | |
Maximum offering price per share (100/96.50 of $8.68) | | $ 8.99 |
Class B:
Net Asset Value and offering price per share ($441,311 ÷ 50,760 shares)A | | $ 8.69 |
| | |
Class C:
Net Asset Value and offering price per share ($7,769,597 ÷ 901,585 shares)A | | $ 8.62 |
| | |
| | |
Emerging Europe, Middle East, Africa (EMEA):
Net Asset Value, offering price and redemption price per share ($111,441,166 ÷ 12,742,737 shares) | | $ 8.75 |
| | |
Institutional Class:
Net Asset Value, offering price and redemption price per share ($8,585,964 ÷ 981,532 shares) | | $ 8.75 |
A Redemption price per share is equal to net asset value less any applicable contingent deferred sales charge.
See accompanying notes which are an integral part of the financial statements.
Annual Report
Financial Statements - continued
Statement of Operations
| Year ended October 31, 2012 |
| | |
Investment Income | | |
Dividends | | $ 5,662,084 |
Interest | | 119,997 |
Income from Fidelity Central Funds | | 4,086 |
Income before foreign taxes withheld | | 5,786,167 |
Less foreign taxes withheld | | (570,242) |
Total income | | 5,215,925 |
| | |
Expenses | | |
Management fee | $ 1,144,017 | |
Transfer agent fees | 410,177 | |
Distribution and service plan fees | 121,246 | |
Accounting and security lending fees | 73,383 | |
Custodian fees and expenses | 162,444 | |
Independent trustees' compensation | 932 | |
Registration fees | 80,566 | |
Audit | 61,768 | |
Legal | 700 | |
Miscellaneous | 1,543 | |
Total expenses before reductions | 2,056,776 | |
Expense reductions | (39,356) | 2,017,420 |
Net investment income (loss) | | 3,198,505 |
Realized and Unrealized Gain (Loss) Net realized gain (loss) on: | | |
Investment securities: | | |
Unaffiliated issuers | 10,659,509 | |
Foreign currency transactions | (146,089) | |
Total net realized gain (loss) | | 10,513,420 |
Change in net unrealized appreciation (depreciation) on: Investment securities | (5,473,687) | |
Assets and liabilities in foreign currencies | 2,731 | |
Total change in net unrealized appreciation (depreciation) | | (5,470,956) |
Net gain (loss) | | 5,042,464 |
Net increase (decrease) in net assets resulting from operations | | $ 8,240,969 |
See accompanying notes which are an integral part of the financial statements.
Annual Report
Statement of Changes in Net Assets
| Year ended
October 31,
2012 | Year ended
October 31,
2011 |
Increase (Decrease) in Net Assets | | |
Operations | | |
Net investment income (loss) | $ 3,198,505 | $ 3,341,999 |
Net realized gain (loss) | 10,513,420 | 3,427,666 |
Change in net unrealized appreciation (depreciation) | (5,470,956) | (17,523,712) |
Net increase (decrease) in net assets resulting
from operations | 8,240,969 | (10,754,047) |
Distributions to shareholders from net investment income | (2,782,952) | (1,835,361) |
Distributions to shareholders from net realized gain | - | (302,617) |
Total distributions | (2,782,952) | (2,137,978) |
Share transactions - net increase (decrease) | (7,689,254) | (11,096,734) |
Redemption fees | 36,290 | 119,309 |
Total increase (decrease) in net assets | (2,194,947) | (23,869,450) |
| | |
Net Assets | | |
Beginning of period | 142,702,310 | 166,571,760 |
End of period (including undistributed net investment income of $2,631,143 and undistributed net investment income of $2,747,743, respectively) | $ 140,507,363 | $ 142,702,310 |
See accompanying notes which are an integral part of the financial statements.
Annual Report
Financial Highlights - Class A
Years ended October 31, | 2012 | 2011 | 2010 | 2009 | 2008 I |
Selected Per-Share Data | | | | | |
Net asset value, beginning of period | $ 8.34 | $ 8.97 | $ 7.26 | $ 4.75 | $ 10.00 |
Income from Investment Operations | | | | | |
Net investment income (loss) E | .18 | .16 H | .07 | .05 | .04 |
Net realized and unrealized gain (loss) | .34 | (.70) | 1.70 | 2.48 | (5.31) |
Total from investment operations | .52 | (.54) | 1.77 | 2.53 | (5.27) |
Distributions from net investment income | (.15) | (.08) | (.04) | (.03) | - |
Distributions from net realized gain | - | (.02) | (.02) | - | - |
Total distributions | (.15) | (.10) | (.07) L | (.03) | - |
Redemption fees added to paid in capital E | - K | .01 | .01 | .01 | .02 |
Net asset value, end of period | $ 8.71 | $ 8.34 | $ 8.97 | $ 7.26 | $ 4.75 |
Total Return B, C, D | 6.38% | (6.05)% | 24.66% | 53.78% | (52.50)% |
Ratios to Average Net Assets F, J | | | | | |
Expenses before reductions | 1.62% | 1.60% | 1.69% | 1.87% | 2.50% A |
Expenses net of fee waivers, if any | 1.62% | 1.56% | 1.50% | 1.50% | 1.50% A |
Expenses net of all reductions | 1.60% | 1.51% | 1.38% | 1.39% | 1.23% A |
Net investment income (loss) | 2.09% | 1.70% H | .95% | .84% | 1.20% A |
Supplemental Data | | | | | |
Net assets, end of period (000 omitted) | $ 8,934 | $ 10,260 | $ 10,045 | $ 4,817 | $ 1,368 |
Portfolio turnover rate G | 30% | 53% | 96% | 58% | 68% |
A Annualized
B Total returns for periods of less than one year are not annualized.
C Total returns would have been lower if certain expenses had not been reduced during the applicable periods shown.
D Total returns do not include the effect of the sales charges.
E Calculated based on average shares outstanding during the period.
F Fees and expenses of any underlying Fidelity Central Funds are not included in the Fund's expense ratio. The Fund indirectly bears its proportionate share of the expenses of any underlying Fidelity Central Funds.
G Amount does not include the portfolio activity of any underlying Fidelity Central Funds.
H Investment income per share reflects a large, non-recurring dividend which amounted to $.04 per share. Excluding this non-recurring dividend, the ratio of net investment income (loss) to average net assets would have been 1.25%.
I For the period May 8, 2008 (commencement of operations) to October 31, 2008.
J Expense ratios reflect operating expenses of the class. Expenses before reductions do not reflect amounts reimbursed by the investment adviser or reductions from brokerage service arrangements or reductions from other expense offset arrangements and do not represent the amount paid by the class during periods when reimbursements or reductions occur. Expense ratios before reductions for start-up periods may not be representative of longer-term operating periods. Expenses net of fee waivers reflect expenses after reimbursement by the investment adviser but prior to reductions from brokerage service arrangements or other expense offset arrangements. Expenses net of all reductions represent the net expenses paid by the class.
K Amount represents less than $.01 per share.
L Total distributions of $.07 per share is comprised of distributions from net investment income of $.041 and distributions from net realized gain of $.024 per share.
See accompanying notes which are an integral part of the financial statements.
Annual Report
Financial Highlights - Class T
Years ended October 31, | 2012 | 2011 | 2010 | 2009 | 2008 I |
Selected Per-Share Data | | | | | |
Net asset value, beginning of period | $ 8.31 | $ 8.96 | $ 7.25 | $ 4.75 | $ 10.00 |
Income from Investment Operations | | | | | |
Net investment income (loss) E | .15 | .13 H | .06 | .04 | .04 |
Net realized and unrealized gain (loss) | .35 | (.71) | 1.69 | 2.47 | (5.31) |
Total from investment operations | .50 | (.58) | 1.75 | 2.51 | (5.27) |
Distributions from net investment income | (.13) | (.07) | (.03) | (.02) | - |
Distributions from net realized gain | - | (.02) | (.02) | - | - |
Total distributions | (.13) | (.08) L | (.05) | (.02) | - |
Redemption fees added to paid in capital E | - K | .01 | .01 | .01 | .02 |
Net asset value, end of period | $ 8.68 | $ 8.31 | $ 8.96 | $ 7.25 | $ 4.75 |
Total Return B, C, D | 6.14% | (6.42)% | 24.44% | 53.20% | (52.50)% |
Ratios to Average Net Assets F, J | | | | | |
Expenses before reductions | 1.89% | 1.87% | 1.95% | 2.15% | 2.78% A |
Expenses net of fee waivers, if any | 1.89% | 1.84% | 1.75% | 1.75% | 1.75% A |
Expenses net of all reductions | 1.86% | 1.78% | 1.62% | 1.64% | 1.49% A |
Net investment income (loss) | 1.82% | 1.42% H | .70% | .59% | .95% A |
Supplemental Data | | | | | |
Net assets, end of period (000 omitted) | $ 3,336 | $ 3,502 | $ 3,114 | $ 1,560 | $ 568 |
Portfolio turnover rate G | 30% | 53% | 96% | 58% | 68% |
A Annualized
B Total returns for periods of less than one year are not annualized.
C Total returns would have been lower if certain expenses had not been reduced during the applicable periods shown.
D Total returns do not include the effect of the sales charges.
E Calculated based on average shares outstanding during the period.
F Fees and expenses of any underlying Fidelity Central Funds are not included in the Fund's expense ratio. The Fund indirectly bears its proportionate share of the expenses of any underlying Fidelity Central Funds.
G Amount does not include the portfolio activity of any underlying Fidelity Central Funds.
H Investment income per share reflects a large, non-recurring dividend which amounted to $.04 per share. Excluding this non-recurring dividend, the ratio of net investment income (loss) to average net assets would have been .98%.
I For the period May 8, 2008 (commencement of operations) to October 31, 2008.
J Expense ratios reflect operating expenses of the class. Expenses before reductions do not reflect amounts reimbursed by the investment adviser or reductions from brokerage service arrangements or reductions from other expense offset arrangements and do not represent the amount paid by the class during periods when reimbursements or reductions occur. Expense ratios before reductions for start-up periods may not be representative of longer-term operating periods. Expenses net of fee waivers reflect expenses after reimbursement by the investment adviser but prior to reductions from brokerage service arrangements or other expense offset arrangements. Expenses net of all reductions represent the net expenses paid by the class.
K Amount represents less than $.01 per share.
L Total distributions of $.08 per share is comprised of distributions from net investment income of $.068 and distributions from net realized gain of $.015 per share.
See accompanying notes which are an integral part of the financial statements.
Annual Report
Financial Highlights - Class B
Years ended October 31, | 2012 | 2011 | 2010 | 2009 | 2008 I |
Selected Per-Share Data | | | | | |
Net asset value, beginning of period | $ 8.29 | $ 8.93 | $ 7.23 | $ 4.73 | $ 10.00 |
Income from Investment Operations | | | | | |
Net investment income (loss) E | .11 | .09 H | .02 | .01 | .02 |
Net realized and unrealized gain (loss) | .35 | (.71) | 1.68 | 2.48 | (5.31) |
Total from investment operations | .46 | (.62) | 1.70 | 2.49 | (5.29) |
Distributions from net investment income | (.06) | (.02) | - | - | - |
Distributions from net realized gain | - | (.01) | (.01) | - | - |
Total distributions | (.06) | (.03) | (.01) | - | - |
Redemption fees added to paid in capital E | - K | .01 | .01 | .01 | .02 |
Net asset value, end of period | $ 8.69 | $ 8.29 | $ 8.93 | $ 7.23 | $ 4.73 |
Total Return B, C, D | 5.56% | (6.85)% | 23.72% | 52.85% | (52.70)% |
Ratios to Average Net Assets F, J | | | | | |
Expenses before reductions | 2.38% | 2.37% | 2.47% | 2.68% | 3.32% A |
Expenses net of fee waivers, if any | 2.38% | 2.33% | 2.25% | 2.25% | 2.25% A |
Expenses net of all reductions | 2.35% | 2.27% | 2.12% | 2.14% | 1.99% A |
Net investment income (loss) | 1.33% | .93% H | .20% | .09% | .45% A |
Supplemental Data | | | | | |
Net assets, end of period (000 omitted) | $ 441 | $ 539 | $ 822 | $ 782 | $ 487 |
Portfolio turnover rate G | 30% | 53% | 96% | 58% | 68% |
A Annualized
B Total returns for periods of less than one year are not annualized.
C Total returns would have been lower if certain expenses had not been reduced during the applicable periods shown.
D Total returns do not include the effect of the contingent deferred sales charge.
E Calculated based on average shares outstanding during the period.
F Fees and expenses of any underlying Fidelity Central Funds are not included in the Fund's expense ratio. The Fund indirectly bears its proportionate share of the expenses of any underlying Fidelity Central Funds.
G Amount does not include the portfolio activity of any underlying Fidelity Central Funds.
H Investment income per share reflects a large, non-recurring dividend which amounted to $.04 per share. Excluding this non-recurring dividend, the ratio of net investment income (loss) to average net assets would have been .49%.
I For the period May 8, 2008 (commencement of operations) to October 31, 2008.
J Expense ratios reflect operating expenses of the class. Expenses before reductions do not reflect amounts reimbursed by the investment adviser or reductions from brokerage service arrangements or reductions from other expense offset arrangements and do not represent the amount paid by the class during periods when reimbursements or reductions occur. Expense ratios before reductions for start-up periods may not be representative of longer-term operating periods. Expenses net of fee waivers reflect expenses after reimbursement by the investment adviser but prior to reductions from brokerage service arrangements or other expense offset arrangements. Expenses net of all reductions represent the net expenses paid by the class.
K Amount represents less than $.01 per share.
See accompanying notes which are an integral part of the financial statements.
Annual Report
Financial Highlights - Class C
Years ended October 31, | 2012 | 2011 | 2010 | 2009 | 2008 I |
Selected Per-Share Data | | | | | |
Net asset value, beginning of period | $ 8.24 | $ 8.90 | $ 7.23 | $ 4.73 | $ 10.00 |
Income from Investment Operations | | | | | |
Net investment income (loss) E | .11 | .08 H | .02 | .01 | .02 |
Net realized and unrealized gain (loss) | .35 | (.69) | 1.67 | 2.48 | (5.31) |
Total from investment operations | .46 | (.61) | 1.69 | 2.49 | (5.29) |
Distributions from net investment income | (.08) | (.05) | (.01) | - | - |
Distributions from net realized gain | - | (.02) | (.02) | - | - |
Total distributions | (.08) | (.06) L | (.03) | - | - |
Redemption fees added to paid in capital E | - K | .01 | .01 | .01 | .02 |
Net asset value, end of period | $ 8.62 | $ 8.24 | $ 8.90 | $ 7.23 | $ 4.73 |
Total Return B, C, D | 5.68% | (6.79)% | 23.61% | 52.85% | (52.70)% |
Ratios to Average Net Assets F, J | | | | | |
Expenses before reductions | 2.37% | 2.36% | 2.45% | 2.61% | 3.28% A |
Expenses net of fee waivers, if any | 2.37% | 2.33% | 2.25% | 2.25% | 2.25% A |
Expenses net of all reductions | 2.35% | 2.27% | 2.13% | 2.14% | 1.99% A |
Net investment income (loss) | 1.34% | .93% H | .20% | .09% | .45% A |
Supplemental Data | | | | | |
Net assets, end of period (000 omitted) | $ 7,770 | $ 6,650 | $ 5,151 | $ 2,677 | $ 741 |
Portfolio turnover rate G | 30% | 53% | 96% | 58% | 68% |
A Annualized
B Total returns for periods of less than one year are not annualized.
C Total returns would have been lower if certain expenses had not been reduced during the applicable periods shown.
D Total returns do not include the effect of the contingent deferred sales charge.
E Calculated based on average shares outstanding during the period.
F Fees and expenses of any underlying Fidelity Central Funds are not included in the Fund's expense ratio. The Fund indirectly bears its proportionate share of the expenses of any underlying Fidelity Central Funds.
G Amount does not include the portfolio activity of any underlying Fidelity Central Funds.
H Investment income per share reflects a large, non-recurring dividend which amounted to $.04 per share. Excluding this non-recurring dividend, the ratio of net investment income (loss) to average net assets would have been .49%.
I For the period May 8, 2008 (commencement of operations) to October 31, 2008.
J Expense ratios reflect operating expenses of the class. Expenses before reductions do not reflect amounts reimbursed by the investment adviser or reductions from brokerage service arrangements or reductions from other expense offset arrangements and do not represent the amount paid by the class during periods when reimbursements or reductions occur. Expense ratios before reductions for start-up periods may not be representative of longer-term operating periods. Expenses net of fee waivers reflect expenses after reimbursement by the investment adviser but prior to reductions from brokerage service arrangements or other expense offset arrangements. Expenses net of all reductions represent the net expenses paid by the class.
K Amount represents less than $.01 per share.
L Total distributions of $.06 per share is comprised of distributions from net investment income of $.047 and distributions from net realized gain of $.015 per share.
See accompanying notes which are an integral part of the financial statements.
Annual Report
Financial Highlights - Emerging Europe, Middle East, Africa (EMEA)
Years ended October 31, | 2012 | 2011 | 2010 | 2009 | 2008 H |
Selected Per-Share Data | | | | | |
Net asset value, beginning of period | $ 8.37 | $ 9.00 | $ 7.28 | $ 4.76 | $ 10.00 |
Income from Investment Operations | | | | | |
Net investment income (loss) D | .20 | .18 G | .09 | .07 | .05 |
Net realized and unrealized gain (loss) | .35 | (.71) | 1.70 | 2.48 | (5.31) |
Total from investment operations | .55 | (.53) | 1.79 | 2.55 | (5.26) |
Distributions from net investment income | (.17) | (.09) | (.05) | (.04) | - |
Distributions from net realized gain | - | (.02) | (.02) | - | - |
Total distributions | (.17) | (.11) | (.08) K | (.04) | - |
Redemption fees added to paid in capital D | - J | .01 | .01 | .01 | .02 |
Net asset value, end of period | $ 8.75 | $ 8.37 | $ 9.00 | $ 7.28 | $ 4.76 |
Total Return B, C | 6.81% | (5.91)% | 24.92% | 54.15% | (52.40)% |
Ratios to Average Net Assets E, I | | | | | |
Expenses before reductions | 1.37% | 1.35% | 1.45% | 1.61% | 2.19% A |
Expenses net of fee waivers, if any | 1.37% | 1.31% | 1.25% | 1.25% | 1.25% A |
Expenses net of all reductions | 1.34% | 1.25% | 1.12% | 1.14% | .98% A |
Net investment income (loss) | 2.34% | 1.95% G | 1.21% | 1.09% | 1.45% A |
Supplemental Data | | | | | |
Net assets, end of period (000 omitted) | $ 111,441 | $ 114,117 | $ 140,270 | $ 104,141 | $ 32,535 |
Portfolio turnover rate F | 30% | 53% | 96% | 58% | 68% |
A Annualized
B Total returns for periods of less than one year are not annualized.
C Total returns would have been lower if certain expenses had not been reduced during the applicable periods shown.
D Calculated based on average shares outstanding during the period.
E Fees and expenses of any underlying Fidelity Central Funds are not included in the Fund's expense ratio. The Fund indirectly bears its proportionate share of the expenses of any underlying Fidelity Central Funds.
F Amount does not include the portfolio activity of any underlying Fidelity Central Funds.
G Investment income per share reflects a large, non-recurring dividend which amounted to $.04 per share. Excluding this non-recurring dividend, the ratio of net investment income (loss) to average net assets would have been 1.51%.
H For the period May 8, 2008 (commencement of operations) to October 31, 2008.
I Expense ratios reflect operating expenses of the class. Expenses before reductions do not reflect amounts reimbursed by the investment adviser or reductions from brokerage service arrangements or reductions from other expense offset arrangements and do not represent the amount paid by the class during periods when reimbursements or reductions occur. Expense ratios before reductions for start-up periods may not be representative of longer-term operating periods. Expenses net of fee waivers reflect expenses after reimbursement by the investment adviser but prior to reductions from brokerage service arrangements or other expense offset arrangements. Expenses net of all reductions represent the net expenses paid by the class.
J Amount represents less than $.01 per share.
K Total distributions of $.08 per share is comprised of distributions from net investment income of $.052 and distributions from net realized gain of $.024 per share.
See accompanying notes which are an integral part of the financial statements.
Annual Report
Financial Highlights - Institutional Class
Years ended October 31, | 2012 | 2011 | 2010 | 2009 | 2008 H |
Selected Per-Share Data | | | | | |
Net asset value, beginning of period | $ 8.37 | $ 9.00 | $ 7.28 | $ 4.76 | $ 10.00 |
Income from Investment Operations | | | | | |
Net investment income (loss) D | .21 | .19 G | .09 | .06 | .05 |
Net realized and unrealized gain (loss) | .35 | (.72) | 1.70 | 2.49 | (5.31) |
Total from investment operations | .56 | (.53) | 1.79 | 2.55 | (5.26) |
Distributions from net investment income | (.18) | (.09) | (.05) | (.04) | - |
Distributions from net realized gain | - | (.02) | (.02) | - | - |
Total distributions | (.18) | (.11) | (.08) K | (.04) | - |
Redemption fees added to paid in capital D | - J | .01 | .01 | .01 | .02 |
Net asset value, end of period | $ 8.75 | $ 8.37 | $ 9.00 | $ 7.28 | $ 4.76 |
Total Return B, C | 6.93% | (5.91)% | 24.95% | 54.15% | (52.40)% |
Ratios to Average Net Assets E, I | | | | | |
Expenses before reductions | 1.28% | 1.26% | 1.34% | 1.60% | 2.12% A |
Expenses net of fee waivers, if any | 1.28% | 1.24% | 1.25% | 1.25% | 1.25% A |
Expenses net of all reductions | 1.25% | 1.19% | 1.13% | 1.14% | .98% A |
Net investment income (loss) | 2.43% | 2.02% G | 1.20% | 1.09% | 1.46% A |
Supplemental Data | | | | | |
Net assets, end of period (000 omitted) | $ 8,586 | $ 7,633 | $ 7,171 | $ 4,235 | $ 2,695 |
Portfolio turnover rate F | 30% | 53% | 96% | 58% | 68% |
A Annualized
B Total returns for periods of less than one year are not annualized.
C Total returns would have been lower if certain expenses had not been reduced during the applicable periods shown.
D Calculated based on average shares outstanding during the period.
E Fees and expenses of any underlying Fidelity Central Funds are not included in the Fund's expense ratio. The Fund indirectly bears its proportionate share of the expenses of any underlying Fidelity Central Funds.
F Amount does not include the portfolio activity of any underlying Fidelity Central Funds.
G Investment income per share reflects a large, non-recurring dividend which amounted to $.04 per share. Excluding this non-recurring dividend, the ratio of net investment income (loss) to average net assets would have been 1.58%.
H For the period May 8, 2008 (commencement of operations) to October 31, 2008.
I Expense ratios reflect operating expenses of the class. Expenses before reductions do not reflect amounts reimbursed by the investment adviser or reductions from brokerage service arrangements or reductions from other expense offset arrangements and do not represent the amount paid by the class during periods when reimbursements or reductions occur. Expense ratios before reductions for start-up periods may not be representative of longer-term operating periods. Expenses net of fee waivers reflect expenses after reimbursement by the investment adviser but prior to reductions from brokerage service arrangements or other expense offset arrangements. Expenses net of all reductions represent the net expenses paid by the class.
J Amount represents less than $.01 per share.
K Total distributions of $.08 per share is comprised of distributions from net investment income of $.054 and distributions from net realized gain of $.024 per share.
See accompanying notes which are an integral part of the financial statements.
Annual Report
Notes to Financial Statements
For the period ended October 31, 2012
1. Organization.
Fidelity Emerging Europe, Middle East, Africa (EMEA) Fund (the Fund) is a non-diversified fund of Fidelity Investment Trust (the Trust) and is authorized to issue an unlimited number of shares. The Trust is registered under the Investment Company Act of 1940, as amended (the 1940 Act), as an open-end management investment company organized as a Massachusetts business trust. The Fund offers Class A, Class T, Class C, Emerging Europe, Middle East, Africa (EMEA)and Institutional Class shares, each of which, along with Class B shares, has equal rights as to assets and voting privileges. Effective after the close of business on September 1, 2010, Class B shares were closed to new accounts and additional purchases, except for exchanges and reinvestments. Each class has exclusive voting rights with respect to matters that affect that class. Class B shares will automatically convert to Class A shares after a holding period of seven years from the initial date of purchase. Investment income, realized and unrealized capital gains and losses, the common expenses of the Fund, and certain fund-level expense reductions, if any, are allocated on a pro-rata basis to each class based on the relative net assets of each class to the total net assets of the Fund. Each class differs with respect to transfer agent and distribution and service plan fees incurred. Certain expense reductions may also differ by class. The Fund's investments in emerging markets can be subject to social, economic, regulatory, and political uncertainties and can be extremely volatile.
2. Investments in Fidelity Central Funds.
The Fund invests in Fidelity Central Funds, which are open-end investment companies available only to other investment companies and accounts managed by Fidelity Management & Research Company (FMR) and its affiliates. The Fund's Schedule of Investments lists each of the Fidelity Central Funds held as of period end, if any, as an investment of the Fund, but does not include the underlying holdings of each Fidelity Central Fund. As an Investing Fund, the Fund indirectly bears its proportionate share of the expenses of the underlying Fidelity Central Funds.
The Money Market Central Funds seek preservation of capital and current income and are managed by Fidelity Investments Money Management, Inc. (FIMM), an affiliate of FMR.
A complete unaudited list of holdings for each Fidelity Central Fund is available upon request or at the Securities and Exchange Commission (the SEC) web site at www.sec.gov. In addition, the financial statements of the Fidelity Central Funds, which are not covered by the Fund's Report of Independent Registered Public Accounting Firm, are available on the SEC web site or upon request.
Annual Report
3. Significant Accounting Policies.
The financial statements have been prepared in conformity with accounting principles generally accepted in the United States of America (GAAP), which require management to make certain estimates and assumptions at the date of the financial statements. Actual results could differ from those estimates. Subsequent events, if any, through the date that the financial statements were issued have been evaluated in the preparation of the financial statements. The following summarizes the significant accounting policies of the Fund:
Security Valuation. Investments are valued as of 4:00 p.m. Eastern time on the last calendar day of the period. In accordance with valuation policies and procedures approved by the Board of Trustees (the Board), the Fund attempts to obtain prices from one or more third party pricing vendors or brokers to value its investments. When current market prices, quotations or rates are not readily available or reliable, securities will be fair valued in good faith by the FMR Fair Value Committee (the Committee), in accordance with procedures adopted by the Fund's Board. Factors used in determining fair value vary by security type and may include market or security specific events, changes in interest rates and credit quality. The frequency with which these procedures are used cannot be predicted and they may be utilized to a significant extent. The Committee oversees the Fund's valuation policies and procedures and is responsible for approving and reporting to the Board all fair value determinations.
The Fund categorizes the inputs to valuation techniques used to value its investments into a disclosure hierarchy consisting of three levels as shown below:
Level 1 - quoted prices in active markets for identical investments
Level 2 - other significant observable inputs (including quoted prices for similar investments, interest rates, prepayment speeds, etc.)
Level 3 - unobservable inputs (including the Fund's own assumptions based on the best information available)
Valuation techniques used to value the Fund's investments by major category are as follows:
Equity securities, including restricted securities, for which market quotations are readily available, are valued at the last reported sale price or official closing price as reported by a third party pricing vendor on the primary market or exchange on which they are traded and are categorized as Level 1 in the hierarchy. In the event there were no sales during the day or closing prices are not available, securities are valued at the last quoted bid price or may be valued using the last available price and are generally categorized as Level 2 in the hierarchy. For foreign equity securities, when significant market or security specific events arise, comparisons to the valuation of American Depositary Receipts
Annual Report
Notes to Financial Statements - continued
3. Significant Accounting Policies - continued
Security Valuation - continued
(ADRs), futures contracts, Exchange-Traded Funds (ETFs) and certain indexes as well as quoted prices for similar securities are used and are categorized as Level 2 in the hierarchy. Utilizing these techniques may result in transfers between Level 1 and Level 2.
Debt securities, including restricted securities, are valued based on evaluated prices received from third party pricing vendors or from brokers who make markets in such securities. For corporate bonds and foreign government and government agency obligations, pricing vendors utilize matrix pricing which considers yield or price of bonds of comparable quality, coupon, maturity and type as well as broker-supplied prices and are generally categorized as Level 2 in the hierarchy.
When independent prices are unavailable or unreliable, debt securities may be valued utilizing pricing methodologies which consider similar factors that would be used by third party pricing vendors. These are generally categorized as Level 2 in the hierarchy but may be Level 3 depending on the circumstances.
Investments in open-end mutual funds, including the Fidelity Central Funds, are valued at their closing net asset value (NAV) each business day and are categorized as Level 1 in the hierarchy.
Changes in valuation techniques may result in transfers in or out of an assigned level within the disclosure hierarchy. The aggregate value of investments by input level, as of October 31, 2012, is included at the end of the Fund's Schedule of Investments.
Foreign Currency Translation. The Fund may use foreign currency contracts to facilitate transactions in foreign-denominated securities. Gains and losses from these transactions may arise from changes in the value of the foreign currency or if the counterparties do not perform under the contracts' terms.
Foreign-denominated assets, including investment securities, and liabilities are translated into U.S. dollars at the exchange rates at period end. Purchases and sales of investment securities, income and dividends received and expenses denominated in foreign currencies are translated into U.S. dollars at the exchange rate in effect on the transaction date.
The effects of exchange rate fluctuations on investments are included with the net realized and unrealized gain (loss) on investment securities. Other foreign currency transactions resulting in realized and unrealized gain (loss) are disclosed separately.
Investment Transactions and Income. For financial reporting purposes, the Fund's investment holdings and NAV include trades executed through the end of the last business day of the period. The NAV per share for processing shareholder transactions is
Annual Report
3. Significant Accounting Policies - continued
Investment Transactions and Income - continued
calculated as of the close of business of the New York Stock Exchange (NYSE), normally 4:00 p.m. Eastern time and includes trades executed through the end of the prior business day. Gains and losses on securities sold are determined on the basis of identified cost. Dividend income is recorded on the ex-dividend date, except for certain dividends from foreign securities where the ex-dividend date may have passed, which are recorded as soon as the Fund is informed of the ex-dividend date. Non-cash dividends included in dividend income, if any, are recorded at the fair market value of the securities received. Interest income and distributions from the Fidelity Central Funds are accrued as earned. Interest income includes coupon interest and amortization of premium and accretion of discount on debt securities. Investment income is recorded net of foreign taxes withheld where recovery of such taxes is uncertain.
Expenses. Expenses directly attributable to a fund are charged to that fund. Expenses attributable to more than one fund are allocated among the respective funds on the basis of relative net assets or other appropriate methods. Expense estimates are accrued in the period to which they relate and adjustments are made when actual amounts are known.
Income Tax Information and Distributions to Shareholders. Each year, the Fund intends to qualify as a regulated investment company under Subchapter M of the Internal Revenue Code, including distributing substantially all of its taxable income and realized gains. As a result, no provision for income taxes is required. As of October 31, 2012, the Fund did not have any unrecognized tax benefits in the financial statements; nor is the Fund aware of any tax positions for which it is reasonably possible that the total amounts of unrecognized tax benefits will significantly change in the next twelve months. The Fund files a U.S. federal tax return, in addition to state and local tax returns as required. A fund's federal income tax returns are subject to examination by the Internal Revenue Service (IRS) for a period of three fiscal years after they are filed. State and local tax returns may be subject to examination for an additional fiscal year depending on the jurisdiction. Foreign taxes are provided for based on the Fund's understanding of the tax rules and rates that exist in the foreign markets in which it invests.
Distributions are declared and recorded on the ex-dividend date. Income dividends and capital gain distributions are declared separately for each class. Income and capital gain distributions are determined in accordance with income tax regulations, which may differ from GAAP. In addition, the Fund claimed a portion of the payment made to redeeming shareholders as a distribution for income tax purposes.
Capital accounts within the financial statements are adjusted for permanent book-tax differences. These adjustments have no impact on net assets or the results of operations. Temporary book-tax differences will reverse in a subsequent period.
Annual Report
Notes to Financial Statements - continued
3. Significant Accounting Policies - continued
Income Tax Information and Distributions to Shareholders - continued
Book-tax differences are primarily due to foreign currency transactions, passive foreign investment companies (PFIC), capital loss carryforwards and losses deferred due to wash sales.
The federal tax cost of investment securities and unrealized appreciation (depreciation) as of period end were as follows:
Gross unrealized appreciation | $ 16,922,441 |
Gross unrealized depreciation | (15,370,673) |
Net unrealized appreciation (depreciation) on securities and other investments | $ 1,551,768 |
| |
Tax Cost | $ 138,306,369 |
The tax-based components of distributable earnings as of period end were as follows:
Undistributed ordinary income | $ 3,778,819 |
Capital loss carryforward | $ (2,121,605) |
Net unrealized appreciation (depreciation) | $ 1,552,040 |
Capital loss carryforwards are only available to offset future capital gains of the Fund to the extent provided by regulations and may be limited. Under the Regulated Investment Company Modernization Act of 2010 (the Act), the Fund is permitted to carry forward capital losses incurred in taxable years beginning after December 22, 2010 for an unlimited period and such capital losses are required to be used prior to any losses that expire. Capital loss carryforwards were as follows:
Fiscal year of expiration | |
2018 | $ (2,121,605) |
The tax character of distributions paid was as follows:
| October 31, 2012 | October 31, 2011 |
Ordinary Income | $ 2,782,952 | $ 2,137,978 |
Short-Term Trading (Redemption) Fees. Shares held by investors in the Fund less than 90 days are subject to a redemption fee equal to 1.50% of the net asset value of shares redeemed. All redemption fees, which reduce the proceeds of the shareholder redemption, are retained by the Fund and accounted for as an addition to paid in capital.
Annual Report
3. Significant Accounting Policies - continued
New Accounting Pronouncement. In December 2011, the Financial Accounting Standards Board issued Accounting Standard Update No. 2011-11, Disclosures about Offsetting Assets and Liabilities. The update creates new disclosure requirements requiring entities to disclose both gross and net information for derivatives and other financial instruments that are either offset in the Statement of Assets and Liabilities or subject to an enforceable master netting arrangement or similar agreement. The disclosure requirements are effective for annual reporting periods beginning on or after January 1, 2013, and interim periods within those annual periods. Management is currently evaluating the impact of the update's adoption on the Fund's financial statement disclosures.
4. Purchases and Sales of Investments.
Purchases and sales of securities, other than short-term securities, aggregated $42,139,137 and $54,373,981, respectively.
5. Fees and Other Transactions with Affiliates.
Management Fee. FMR and its affiliates provide the Fund with investment management related services for which the Fund pays a monthly management fee. The management fee is the sum of an individual fund fee rate that is based on an annual rate of .55% of the Fund's average net assets and an annualized group fee rate that averaged .26% during the period. The group fee rate is based upon the average net assets of all the mutual funds advised by FMR. The group fee rate decreases as assets under management increase and increases as assets under management decrease. For the period, the total annual management fee rate was .81% of the Fund's average net assets.
Distribution and Service Plan Fees. In accordance with Rule 12b-1 of the 1940 Act, the Fund has adopted separate Distribution and Service Plans for each class of shares. Certain classes pay Fidelity Distributors Corporation (FDC), an affiliate of FMR, separate Distribution and Service Fees, each of which is based on an annual percentage of each class' average net assets. In addition, FDC may pay financial intermediaries for selling shares of the Fund and providing shareholder support services. For the period, the Distribution and Service Fee rates, total fees and amounts retained by FDC were as follows:
| Distribution
Fee | Service
Fee | Total Fees | Retained
by FDC |
Class A | -% | .25% | $ 22,962 | $ 252 |
Class T | .25% | .25% | 17,208 | 64 |
Class B | .75% | .25% | 4,896 | 3,697 |
Class C | .75% | .25% | 76,180 | 10,823 |
| | | $ 121,246 | $ 14,836 |
Annual Report
Notes to Financial Statements - continued
5. Fees and Other Transactions with Affiliates - continued
Sales Load. FDC may receive a front-end sales charge of up to 5.75% for selling Class A shares and 3.50% for selling Class T shares, some of which is paid to financial intermediaries for selling shares of the Fund. Depending on the holding period, FDC may receive contingent deferred sales charges levied on Class A, Class T, Class B, and Class C redemptions. The deferred sales charges range from 5.00% to 1.00% for Class B shares, 1.00% for Class C shares, 1.00% for certain purchases of Class A shares and .25% for certain purchases of Class T shares.
For the period, sales charge amounts retained by FDC were as follows:
| Retained
by FDC |
Class A | $ 4,269 |
Class T | 1,365 |
Class B* | 2,582 |
Class C* | 2,232 |
| $ 10,448 |
* When Class B and Class C shares are initially sold, FDC pays commissions from its own resources to financial intermediaries through which the sales are made.
Transfer Agent Fees. Fidelity Investments Institutional Operations Company, Inc. (FIIOC), an affiliate of FMR, is the transfer, dividend disbursing and shareholder servicing agent for each class of the Fund. FIIOC receives account fees and asset-based fees that vary according to the account size and type of account of the shareholders of the respective classes of the Fund. FIIOC pays for typesetting, printing and mailing of shareholder reports, except proxy statements. For the period, transfer agent fees for each class were as follows:
| Amount | % of
Average
Net Assets |
Class A | $ 27,199 | .30 |
Class T | 10,795 | .31 |
Class B | 1,463 | .30 |
Class C | 22,681 | .30 |
Emerging Europe, Middle East, Africa (EMEA) | 331,681 | .29 |
Institutional Class | 16,358 | .20 |
| $ 410,177 | |
Accounting and Security Lending Fees. Fidelity Service Company, Inc. (FSC), an affiliate of FMR, maintains the Fund's accounting records. The accounting fee is based on the level of average net assets for each month. Under a separate contract, FSC administers the security lending program. The security lending fee is based on the number and duration of lending transactions.
Annual Report
6. Committed Line of Credit.
The Fund participates with other funds managed by FMR or an affiliate in a $4.25 billion credit facility (the "line of credit") to be utilized for temporary or emergency purposes to fund shareholder redemptions or for other short-term liquidity purposes. The Fund has agreed to pay commitment fees on its pro-rata portion of the line of credit, which amounted to $389 and is reflected in Miscellaneous expenses on the Statement of Operations. During the period, there were no borrowings on this line of credit.
7. Security Lending.
The Fund lends portfolio securities through a lending agent from time to time in order to earn additional income. For equity securities, a lending agent is used and may loan securities to certain qualified borrowers, including Fidelity Capital Markets (FCM), a broker-dealer affiliated with the Fund. On the settlement date of the loan, the Fund receives collateral (in the form of U.S. Treasury obligations, letters of credit and/or cash) against the loaned securities and maintains collateral in an amount not less than 100% of the market value of the loaned securities during the period of the loan. The market value of the loaned securities is determined at the close of business of the Fund and any additional required collateral is delivered to the Fund on the next business day. If the borrower defaults on its obligation to return the securities loaned because of insolvency or other reasons, a fund could experience delays and costs in recovering the securities loaned or in gaining access to the collateral. Any cash collateral received is invested in the Fidelity Securities Lending Cash Central Fund. At period end, there were no security loans outstanding. Security lending income represents the income earned on investing cash collateral, less rebates paid to borrowers and any lending agent fees associated with the loan, plus any premium payments received for lending certain types of securities. Security lending income is presented in the Statement of Operations as a component of income from Fidelity Central Funds. Total security lending income during the period amounted to $2,270. During the period, there were no securities loaned to FCM.
8. Expense Reductions.
Many of the brokers with whom FMR places trades on behalf of the Fund provided services to the Fund in addition to trade execution. These services included payments of certain expenses on behalf of the Fund totaling $39,356 for the period.
Annual Report
Notes to Financial Statements - continued
9. Distributions to Shareholders.
Distributions to shareholders of each class were as follows:
Years ended October 31, | 2012 | 2011 |
From net investment income | | |
Class A | $ 173,376 | $ 97,896 |
Class T | 52,030 | 26,168 |
Class B | 3,592 | 1,907 |
Class C | 61,819 | 32,267 |
Emerging Europe, Middle East, Africa (EMEA) | 2,310,485 | 1,585,636 |
Institutional Class | 181,650 | 91,487 |
Total | $ 2,782,952 | $ 1,835,361 |
From net realized gain | | |
Class A | $ - | $ 18,012 |
Class T | - | 5,690 |
Class B | - | 902 |
Class C | - | 9,924 |
Emerging Europe, Middle East, Africa (EMEA) | - | 253,422 |
Institutional Class | - | 14,667 |
Total | $ - | $ 302,617 |
10. Share Transactions.
Transactions for each class of shares were as follows:
| Shares | Dollars |
Years ended October 31, | 2012 | 2011 | 2012 | 2011 |
Class A | | | | |
Shares sold | 188,687 | 827,297 | $ 1,610,923 | $ 7,697,437 |
Reinvestment of distributions | 16,919 | 10,020 | 134,509 | 92,483 |
Shares redeemed | (411,198) | (725,856) | (3,440,999) | (6,651,188) |
Net increase (decrease) | (205,592) | 111,461 | $ (1,695,567) | $ 1,138,732 |
Class T | | | | |
Shares sold | 75,037 | 164,342 | $ 636,446 | $ 1,527,510 |
Reinvestment of distributions | 6,513 | 3,447 | 51,713 | 31,848 |
Shares redeemed | (118,919) | (94,003) | (995,876) | (862,784) |
Net increase (decrease) | (37,369) | 73,786 | $ (307,717) | $ 696,574 |
Class B | | | | |
Shares sold | 2,520 | 9,372 | $ 21,721 | $ 87,632 |
Reinvestment of distributions | 430 | 285 | 3,432 | 2,673 |
Shares redeemed | (17,241) | (36,653) | (147,235) | (325,442) |
Net increase (decrease) | (14,291) | (26,996) | $ (122,082) | $ (235,137) |
Annual Report
10. Share Transactions - continued
| Shares | Dollars |
Years ended October 31, | 2012 | 2011 | 2012 | 2011 |
Class C | | | | |
Shares sold | 337,293 | 438,284 | $ 2,767,333 | $ 4,066,195 |
Reinvestment of distributions | 7,082 | 4,100 | 56,016 | 37,820 |
Shares redeemed | (250,062) | (213,656) | (2,064,165) | (1,892,778) |
Net increase (decrease) | 94,313 | 228,728 | $ 759,184 | $ 2,211,237 |
Emerging Europe, Middle East, Africa (EMEA) | | | | |
Shares sold | 3,688,393 | 7,381,313 | $ 31,635,971 | $ 68,910,601 |
Reinvestment of distributions | 276,215 | 187,137 | 2,198,675 | 1,730,170 |
Shares redeemed | (4,854,267) | (9,520,946) | (40,803,317) | (86,802,311) |
Net increase (decrease) | (889,659) | (1,952,496) | $ (6,968,671) | $ (16,161,540) |
Institutional Class | | | | |
Shares sold | 336,442 | 597,666 | $ 2,842,158 | $ 5,560,036 |
Reinvestment of distributions | 5,723 | 1,263 | 45,553 | 11,681 |
Shares redeemed | (272,120) | (484,423) | (2,242,112) | (4,318,317) |
Net increase (decrease) | 70,045 | 114,506 | $ 645,599 | $ 1,253,400 |
11. Other.
The Fund's organizational documents provide former and current trustees and officers with a limited indemnification against liabilities arising in connection with the performance of their duties to the Fund. In the normal course of business, the Fund may also enter into contracts that provide general indemnifications. The Fund's maximum exposure under these arrangements is unknown as this would be dependent on future claims that may be made against the Fund. The risk of material loss from such claims is considered remote.
At the end of the period, FMR or its affiliates were the owners of record of 10% of the total outstanding shares of the Fund.
Annual Report
To the Trustees of Fidelity Investment Trust and Shareholders of Fidelity Emerging Europe, Middle East, Africa (EMEA) Fund:
We have audited the accompanying statement of assets and liabilities of Fidelity Emerging Europe, Middle East, Africa (EMEA) Fund (the Fund), a fund of Fidelity Investment Trust, including the schedule of investments, as of October 31, 2012, and the related statement of operations for the year then ended, the statement of changes in net assets for each of the two years in the period then ended, and the financial highlights for each of the four years in the period then ended and the period May 8, 2008 (commencement of operations) to October 31, 2008. These financial statements and financial highlights are the responsibility of the Fund's management. Our responsibility is to express an opinion on these financial statements and financial highlights based on our audits.
We conducted our audits in accordance with the standards of the Public Company Accounting Oversight Board (United States). Those standards require that we plan and perform the audit to obtain reasonable assurance about whether the financial statements and financial highlights are free of material misstatement. The Fund is not required to have, nor were we engaged to perform, an audit of its internal control over financial reporting. Our audits included consideration of internal control over financial reporting as a basis for designing audit procedures that are appropriate in the circumstances, but not for the purpose of expressing an opinion on the effectiveness of the Fund's internal control over financial reporting. Accordingly, we express no such opinion. An audit also includes examining, on a test basis, evidence supporting the amounts and disclosures in the financial statements, assessing the accounting principles used and significant estimates made by management, as well as evaluating the overall financial statement presentation. Our procedures included confirmation of securities owned as of October 31, 2012, by correspondence with the custodians and brokers; where replies were not received from brokers, we performed other auditing procedures. We believe that our audits provide a reasonable basis for our opinion.
In our opinion, the financial statements and financial highlights referred to above present fairly, in all material respects, the financial position of Fidelity Emerging Europe, Middle East, Africa (EMEA) Fund as of October 31, 2012, the results of its operations for the year then ended, the changes in its net assets for each of the two years in the period then ended, and the financial highlights for each of the four years in the period then ended and the period May 8, 2008 (commencement of operations) to October 31, 2008, in conformity with accounting principles generally accepted in the United States of America.
DELOITTE & TOUCHE LLP
Boston, Massachusetts
December 14, 2012
Annual Report
The Trustees, Members of the Advisory Board, and executive officers of the trust and fund, as applicable, are listed below. The Board of Trustees governs the fund and is responsible for protecting the interests of shareholders. The Trustees are experienced executives who meet periodically throughout the year to oversee the fund's activities, review contractual arrangements with companies that provide services to the fund, oversee management of the risks associated with such activities and contractual arrangements, and review the fund's performance. Except for James C. Curvey, each of the Trustees oversees 236 funds advised by FMR or an affiliate. Mr. Curvery oversees 443 funds advised by FMR or an affiliate.
The Trustees hold office without limit in time except that (a) any Trustee may resign; (b) any Trustee may be removed by written instrument, signed by at least two-thirds of the number of Trustees prior to such removal; (c) any Trustee who requests to be retired or who has become incapacitated by illness or injury may be retired by written instrument signed by a majority of the other Trustees; and (d) any Trustee may be removed at any special meeting of shareholders by a two-thirds vote of the outstanding voting securities of the trust. Each Trustee who is not an interested person (as defined in the 1940 Act) (Independent Trustee), shall retire not later than the last day of the calendar year in which his or her 75th birthday occurs. The Independent Trustees may waive this mandatory retirement age policy with respect to individual Trustees. The executive officers and Advisory Board Members hold office without limit in time, except that any officer and Advisory Board Member may resign or may be removed by a vote of a majority of the Trustees at any regular meeting or any special meeting of the Trustees. Except as indicated, each individual has held the office shown or other offices in the same company for the past five years.
Experience, Skills, Attributes, and Qualifications of the Fund's Trustees. The Governance and Nominating Committee has adopted a statement of policy that describes the experience, qualifications, attributes, and skills that are necessary and desirable for potential Independent Trustee candidates (Statement of Policy). The Board believes that each Trustee satisfied at the time he or she was initially elected or appointed a Trustee, and continues to satisfy, the standards contemplated by the Statement of Policy. The Governance and Nominating Committee also engages professional search firms to help identify potential Independent Trustee candidates who have the experience, qualifications, attributes, and skills consistent with the Statement of Policy. From time to time, additional criteria based on the composition and skills of the current Independent Trustees, as well as experience or skills that may be appropriate in light of future changes to board composition, business conditions, and regulatory or other developments, have also been considered by the professional search firms and the Governance and Nominating Committee. In addition, the Board takes into account the Trustees' commitment and participation in Board and committee meetings, as well as their leadership of standing and ad hoc committees throughout their tenure.
In determining that a particular Trustee was and continues to be qualified to serve as a Trustee, the Board has considered a variety of criteria, none of which, in isolation, was controlling. The Board believes that, collectively, the Trustees have balanced and diverse experience, qualifications, attributes, and skills, which allow the Board to operate effectively in governing the fund and protecting the interests of shareholders. Information about the specific experience, skills, attributes, and qualifications of each Trustee, which in each case led to the Board's conclusion that the Trustee should serve (or continue to serve) as a trustee of the fund, is provided below.
Annual Report
Board Structure and Oversight Function. James C. Curvey is an interested person (as defined in the 1940 Act) and currently serves as Chairman. The Trustees have determined that an interested Chairman is appropriate and benefits shareholders because an interested Chairman has a personal and professional stake in the quality and continuity of services provided to the fund. Independent Trustees exercise their informed business judgment to appoint an individual of their choosing to serve as Chairman, regardless of whether the Trustee happens to be independent or a member of management. The Independent Trustees have determined that they can act independently and effectively without having an Independent Trustee serve as Chairman and that a key structural component for assuring that they are in a position to do so is for the Independent Trustees to constitute a substantial majority for the Board. The Independent Trustees also regularly meet in executive session. Ned C. Lautenbach serves as Chairman of the Independent Trustees and as such (i) acts as a liaison between the Independent Trustees and management with respect to matters important to the Independent Trustees and (ii) with management prepares agendas for Board meetings.
Fidelity funds are overseen by different Boards of Trustees. The fund's Board oversees Fidelity's equity and high income funds and another Board oversees Fidelity's investment-grade bond, money market, and asset allocation funds. The asset allocation funds may invest in Fidelity funds overseen by the fund's Board. The use of separate Boards, each with its own committee structure, allows the Trustees of each group of Fidelity funds to focus on the unique issues of the funds they oversee, including common research, investment, and operational issues. On occasion, the separate Boards establish joint committees to address issues of overlapping consequences for the Fidelity funds overseen by each Board.
The Trustees operate using a system of committees to facilitate the timely and efficient consideration of all matters of importance to the Trustees, the fund, and fund shareholders and to facilitate compliance with legal and regulatory requirements and oversight of the fund's activities and associated risks. The Board, acting through its committees, has charged FMR and its affiliates with (i) identifying events or circumstances the occurrence of which could have demonstrably adverse effects on the fund's business and/or reputation; (ii) implementing processes and controls to lessen the possibility that such events or circumstances occur or to mitigate the effects of such events or circumstances if they do occur; and (iii) creating and maintaining a system designed to evaluate continuously business and market conditions in order to facilitate the identification and implementation processes described in (i) and (ii) above. Because the day-to-day operations and activities of the fund are carried out by or through FMR, its affiliates and other service providers, the fund's exposure to risks is mitigated but not eliminated by the processes overseen by the Trustees. While each of the Board's committees has responsibility for overseeing different aspects of the fund's activities, oversight is exercised primarily through the Operations, Audit, and Compliance Committees. In addition, the Independent Trustees have worked with FMR to enhance the Board's oversight of investment and financial risks, legal and regulatory risks, technology risks, and operational risks, including the development of additional risk reporting to the Board. For example, a working group comprised of Independent Trustees and FMR has worked and continues to work to review the Fidelity funds' valuation-related activities, reporting and risk management. Appropriate personnel, including but not limited to the fund's Chief Compliance Officer (CCO), FMR's internal auditor, the independent accountants, the fund's Treasurer and portfolio management personnel, make periodic reports to the Board's committees, as appropriate, including an annual review of FMR's risk management program for the Fidelity funds. The responsibilities of each standing committee, including their oversight responsibilities, are described further under "Standing Committees of the Fund's Trustees."
Annual Report
Trustees and Officers - continued
The fund's Statement of Additional Information (SAI) includes more information about the Trustees. To request a free copy, call Fidelity at 1-877-208-0098.
Interested Trustees*:
Correspondence intended for each Trustee who is an interested person may be sent to Fidelity Investments, 82 Devonshire Street, Boston, Massachusetts 02109.
Name, Age; Principal Occupations and Other Relevant Experience+ |
James C. Curvey (77) |
| Year of Election or Appointment: 2007 Mr. Curvey is Trustee and Chairman of the Board of Trustees of certain Trusts. Mr. Curvey also serves as Trustee (2007-present) of other investment companies advised by FMR. Mr. Curvey is a Director of Fidelity Investments Money Management, Inc. (2009-present), Director of Fidelity Research & Analysis Co. (2009-present) and Director of FMR and FMR Co., Inc. (2007-present). Mr. Curvey is also Vice Chairman (2007-present) and Director of FMR LLC. In addition, Mr. Curvey serves as an Overseer for the Boston Symphony Orchestra and a member of the Trustees of Villanova University. Previously, Mr. Curvey was the Vice Chairman (2006-2007) and Director (2000-2007) of FMR Corp. |
Ronald P. O'Hanley (55) |
| Year of Election or Appointment: 2011 Mr. O'Hanley is Director of FMR Co., Inc. (2010-present), Director of Fidelity Investments Money Management, Inc. (2010-present), Director of Fidelity Research & Analysis Company (2010-present), President of Fidelity Asset Management and Corporate Services and a member of Fidelity's Executive Committee (2010-present). Previously, Mr. O'Hanley served as President and Chief Executive Officer of BNY Mellon Asset Management (2007-2010). Mr. O'Hanley also served as Vice Chairman of Bank New York Mellon Corp. and a member of that firm's Executive Committee. Prior to the 2007 merger of The Bank of New York and Mellon Financial Corporation, he was Vice Chairman of Mellon Financial Corporation and President and Chief Executive Officer of Mellon Asset Management. He joined Mellon in February 1997. Mr. O'Hanley currently serves as Chairman of the Boston Public Library Foundation Board of Directors and sits on the Board of Directors of Beth Israel Deaconess Medical Center, the Board of Trustees of the Marine Biological Laboratory and the Advisory Board of the Maxwell School of Citizenship and Public Administration at Syracuse University. Mr. O'Hanley also chairs the Council on Asset Management for the Financial Services Roundtable and is a member of the Board of Directors of Institutional Investor's U.S. Institute. |
* Trustees have been determined to be "Interested Trustees" by virtue of, among other things, their affiliation with the trust or various entities under common control with FMR.
+ The information above includes each Trustee's principal occupation during the last five years and other information relating to the experience, attributes, and skills relevant to each Trustee's qualifications to serve as a Trustee, which led to the conclusion that each Trustee should serve as a Trustee for the fund.
Annual Report
Trustees and Officers - continued
Independent Trustees:
Correspondence intended for each Independent Trustee (that is, the Trustees other than the Interested Trustees) may be sent to Fidelity Investments, P.O. Box 55235, Boston, Massachusetts 02205-5235.
Name, Age; Principal Occupations and Other Relevant Experience+ |
Dennis J. Dirks (64) |
| Year of Election or Appointment: 2005 Prior to his retirement in May 2003, Mr. Dirks was Chief Operating Officer and a member of the Board of The Depository Trust & Clearing Corporation (DTCC). He also served as President, Chief Operating Officer, and Board member of The Depository Trust Company (DTC) and President and Board member of the National Securities Clearing Corporation (NSCC). In addition, Mr. Dirks served as Chief Executive Officer and Board member of the Government Securities Clearing Corporation, Chief Executive Officer and Board member of the Mortgage-Backed Securities Clearing Corporation, as a Trustee and a member of the Finance Committee of Manhattan College (2005-2008), and as a Trustee and a member of the Finance Committee of AHRC of Nassau County (2006-2008). Mr. Dirks is a member of the Independent Directors Council (IDC) Governing Council (2010-present) and Board of Directors for The Brookville Center for Children's Services, Inc. (2009-present). |
Alan J. Lacy (59) |
| Year of Election or Appointment: 2008 Mr. Lacy serves as Senior Adviser (2007-present) of Oak Hill Capital Partners, L.P. (private equity). Mr. Lacy also served as Chief Executive Officer (2000-2005) and Vice Chairman (2005-2006) of Sears Holdings Corporation and Sears, Roebuck and Co. (retail). In addition, Mr. Lacy serves as a member of the Board of Directors of Dave & Buster's Entertainment, Inc. (restaurant and entertainment complexes, 2010-present), Earth Fare, Inc. (retail grocery, 2012-present), The Hillman Companies, Inc. (hardware wholesalers, 2010-present), and Bristol-Myers Squibb Company (global pharmaceuticals, 2008-present). Mr. Lacy is a member of the Board of Trustees of The National Parks Conservation Association (2006-present). Previously, Mr. Lacy served as Chairman of the Board of Trustees of the National Parks Conservation Association (2008-2011) and as a member of the Board of Directors for the Western Union Company (global money transfer, 2006-2011). |
Ned C. Lautenbach (68) |
| Year of Election or Appointment: 2000 Mr. Lautenbach is Chairman of the Independent Trustees of the Equity and High Income Funds (2006-present). Mr. Lautenbach currently serves as the Lead Director of the Eaton Corporation Board of Directors (diversified industrial, 1997-present). Mr. Lautenbach is Chairman of the Board of Directors of the Philharmonic Center for the Arts in Naples, Florida (2012-present) and a member of the Council on Foreign Relations (1994-present). Previously, Mr. Lautenbach was a Partner/Advisory Partner at Clayton, Dubilier & Rice, LLC (private equity investment, 1998-2010), as well as a Director of Sony Corporation (2006-2007). |
Joseph Mauriello (68) |
| Year of Election or Appointment: 2008 Prior to his retirement in January 2006, Mr. Mauriello served in numerous senior management positions including Deputy Chairman and Chief Operating Officer (2004-2005), and Vice Chairman of Financial Services (2002-2004) of KPMG LLP US (professional services, 1965-2005). Mr. Mauriello currently serves as a member of the Board of Directors of XL Group plc. (global insurance and re-insurance, 2006-present). Previously, Mr. Mauriello served as a Director of the Hamilton Funds of the Bank of New York (2006-2007) and of Arcadia Resources Inc. (health care services and products, 2007-2012). |
Robert W. Selander (62) |
| Year of Election or Appointment: 2011 Previously, Mr. Selander served as a Member of the Advisory Board of Fidelity's Equity and High Income Funds (2011), Executive Vice Chairman (2010), Chief Executive Officer (2009-2010), and President and Chief Executive Officer (1997-2009) of Mastercard, Inc. |
Cornelia M. Small (68) |
| Year of Election or Appointment: 2005 Ms. Small is a member of the Board of Directors (2009-present) and Chair of the Investment Committee (2010-present) of the Teagle Foundation. Ms. Small also serves on the Investment Committee of the Berkshire Taconic Community Foundation (2008-present). Previously, Ms. Small served as Chairperson (2002-2008) and a member of the Investment Committee and Chairperson (2008-2012) and a member of the Board of Trustees of Smith College. In addition, Ms. Small served as Chief Investment Officer, Director of Global Equity Investments, and a member of the Board of Directors of Scudder, Stevens & Clark and Scudder Kemper Investments. |
William S. Stavropoulos (73) |
| Year of Election or Appointment: 2001 Mr. Stavropoulos is Vice Chairman of the Independent Trustees of the Equity and High Income Funds (2006-present). Mr. Stavropoulos serves as President and Founder of the Michigan Baseball Foundation, the Great Lakes Loons (2007-present). Mr. Stavropoulos is Chairman Emeritus of the Board of Directors of The Dow Chemical Company, where he previously served in numerous senior management positions, including President, CEO (1995-2000; 2002-2004), Chairman of the Executive Committee (2000-2006), and as a member of the Board of Directors (1990-2006). Currently, Mr. Stavropoulos is a Director of Univar Inc. (global distributor of commodity and specialty chemicals, Chairman from 2010-May 2012 and Lead Director from May 2012-present), Teradata Corporation (data warehousing and technology solutions, 2008-present), Maersk Inc. (industrial conglomerate), and Tyco International, Ltd. (multinational manufacturing and services, 2007-present), and a member of the Advisory Board for Metalmark Capital LLC (private equity investment, 2005-present). Mr. Stavropoulos is an operating advisor to Clayton, Dubilier & Rice, LLC (private equity investment). In addition, Mr. Stavropoulos is a member of the University of Notre Dame Advisory Council for the College of Science, a Trustee of the Rollin L. Gerstacker Foundation, and a Director of the Naples Philharmonic Center for the Arts. Previously, Mr. Stavropoulos served as a Director of Chemical Financial Corporation (bank holding company, 1993-2012). |
David M. Thomas (63) |
| Year of Election or Appointment: 2008 Previously, Mr. Thomas served as Executive Chairman (2005-2006) and Chairman and Chief Executive Officer (2000-2005) of IMS Health, Inc. (pharmaceutical and healthcare information solutions), and a Director of Fortune Brands, Inc. (consumer products, 2000-2011). In addition, Mr. Thomas serves as Non-Executive Chairman of the Board of Directors of Fortune Brands Home and Security (home and security products, 2011-present), and as a member of the Board of Directors of Interpublic Group of Companies, Inc. (marketing communication, 2004-present). |
Michael E. Wiley (62) |
| Year of Election or Appointment: 2008 Mr. Wiley also serves as a Director of Asia Pacific Exploration Consolidated (international oil and gas exploration and production, 2008-present). Mr. Wiley serves as a Director of Tesoro Corporation (independent oil refiner and marketer, 2005-present), and a Director of Bill Barrett Corporation (exploration and production, 2005-present). In addition, Mr. Wiley also serves as a Director of Post Oak Bank (privately-held bank, 2004-present). Previously, Mr. Wiley served as a member of the Board of Trustees of the University of Tulsa (2000-2006; 2007-2010), as a Senior Energy Advisor of Katzenbach Partners, LLC (consulting, 2006-2007), as an Advisory Director of Riverstone Holdings (private investment), Chairman, President, and CEO of Baker Hughes, Inc. (oilfield services, 2000-2004), and as Director of Spinnaker Exploration Company (exploration and production, 2001-2005). |
+ The information above includes each Trustee's principal occupation during the last five years and other information relating to the experience, attributes, and skills relevant to each Trustee's qualifications to serve as a Trustee, which led to the conclusion that each Trustee should serve as a Trustee for the fund.
Advisory Board Members and Executive Officers:
Correspondence intended for David A. Rosow and Garnett A. Smith may be sent to Fidelity Investments, P.O. Box 55235, Boston, Massachusetts 02205-5235. Correspondence intended for each executive officer, Edward C. Johnson 3d, and Peter S. Lynch may be sent to Fidelity Investments, 82 Devonshire Street, Boston, Massachusetts 02109.
Name, Age; Principal Occupation |
Edward C. Johnson 3d (82) |
| Year of Election or Appointment: 2011 Member of the Advisory Board of Fidelity's Equity and High Income Funds. Mr. Johnson serves as Chief Executive Officer, Chairman, and a Director of FMR LLC, and also serves as Chairman and Director of FIL Limited. Previously, Mr. Johnson served as a Trustee and Chairman of the Board of certain Fidelity Trusts, Chairman and a Director of FMR, Chairman and a Director of FMR Co., Inc., and President of FMR LLC (2006-2007). |
Peter S. Lynch (68) |
| Year of Election or Appointment: 2003 Member of the Advisory Board of Fidelity's Equity and High Income Funds. Mr. Lynch is Vice Chairman and a Director of FMR and FMR Co., Inc. In addition, Mr. Lynch serves as a Trustee of Boston College and as the Chairman of the Inner-City Scholarship Fund. Previously, Mr. Lynch served on the Special Olympics International Board of Directors (1997-2006). |
David A. Rosow (70) |
| Year of Election or Appointment: 2012 Member of the Advisory Board of Fidelity's Equity and High Income Funds. Chairman and Chief Executive Officer of International Golf Group, Inc. (golf course development, 1989-present). Previously, Mr. Rosow served as Chairman and Chief Executive Officer of Rosow & Company, Inc. (private investment company, 1989-2011), a Lead Director of Hudson United Bancorp (2001-2006) and as a Director of TD Banknorth (1996-2006). In addition, Mr. Rosow is a member (2008-present) and President (2009-present) of the Town Council of Palm Beach, Florida. |
Garnett A. Smith (65) |
| Year of Election or Appointment: 2012 Member of the Advisory Board of Fidelity's Equity and High Income Funds. Prior to Mr. Smith's retirement, he served as Chairman and Chief Executive Officer of Inbrand Corp. (manufacturer of personal absorbent products, 1990-1997). He also served as President (1986-1990) of Inbrand Corp. Prior to his employment with Inbrand Corp., he was employed by a retail fabric chain and North Carolina National Bank. In addition, Mr. Smith is a board member of the Jackson Hole Land Trust (2009-present). |
Kenneth B. Robins (43) |
| Year of Election or Appointment: 2008 President and Treasurer of Fidelity's Equity and High Income Funds. Mr. Robins also serves as President and Treasurer (2010-present) and Assistant Treasurer (2009-present) of other Fidelity funds and is an employee of Fidelity Investments (2004-present). Previously, Mr. Robins served as Deputy Treasurer of the Fidelity funds (2005-2008) and Treasurer and Chief Financial Officer of The North Carolina Capital Management Trust: Cash and Term Portfolios (2006-2008). |
Bruce T. Herring (47) |
| Year of Election or Appointment: 2006 Vice President of certain Equity Funds. Mr. Herring also serves as President of Fidelity Research & Analysis Company (2010-present), Chief Investment Officer and Director of Fidelity Management & Research (U.K.) Inc. (2010-present) and Group Chief Investment Officer of FMR. Previously, Mr. Herring served as Vice President (2005-2006) and Senior Vice President (2006-2007) of Fidelity Management & Research Company, Vice President of FMR Co., Inc. (2001-2007) and as a portfolio manager for Fidelity U.S. Equity Funds. |
Brian B. Hogan (48) |
| Year of Election or Appointment: 2009 Vice President of Equity and High Income Funds. Mr. Hogan also serves as President of FMR's Equity Division (2009-present). Previously, Mr. Hogan served as Senior Vice President, Equity Research of FMR (2006-2009) and as a portfolio manager. |
Scott C. Goebel (44) |
| Year of Election or Appointment: 2008 Secretary and Chief Legal Officer (CLO) of the Fidelity funds. Mr. Goebel also serves as Secretary of Fidelity Investments Money Management, Inc. (FIMM) (2010-present) and Fidelity Research and Analysis Company (FRAC) (2010-present); Secretary and CLO of The North Carolina Capital Management Trust: Cash and Term Portfolios (2008-present); General Counsel, Secretary, and Senior Vice President of FMR (2008-present) and FMR Co., Inc. (2008-present); employed by FMR LLC or an affiliate (2001-present); Chief Legal Officer of Fidelity Management & Research (Hong Kong) Limited (2008-present) and Assistant Secretary of Fidelity Management & Research (Japan) Inc. (2008-present), and Fidelity Management & Research (U.K.) Inc. (2008-present). Previously, Mr. Goebel served as Assistant Secretary of FIMM (2008-2010), FRAC (2008-2010), and the Funds (2007-2008) and as Vice President and Secretary of Fidelity Distributors Corporation (FDC) (2005-2007). |
William C. Coffey (43) |
| Year of Election or Appointment: 2009 Assistant Secretary of Fidelity's Equity and High Income Funds. Mr. Coffey also serves as Senior Vice President and Deputy General Counsel of FMR LLC (2010-present), and is an employee of Fidelity Investments. Previously, Mr. Coffey served as Vice President and Associate General Counsel of FMR LLC (2005-2009). |
Elizabeth Paige Baumann (44) |
| Year of Election or Appointment: 2012 Anti-Money Laundering (AML) Officer of the Fidelity funds. Ms. Baumann also serves as AML Officer of The North Carolina Capital Management Trust: Cash and Term Portfolios (2012-present), Chief AML Officer of FMR LLC (2012-present), and is an employee of Fidelity Investments. Previously, Ms. Baumann served as Vice President and Deputy Anti-Money Laundering Officer (2007-2012). |
Christine Reynolds (54) |
| Year of Election or Appointment: 2008 Chief Financial Officer of the Fidelity funds. Ms. Reynolds became President of Fidelity Pricing and Cash Management Services (FPCMS) in August 2008. Ms. Reynolds served as Chief Operating Officer of FPCMS (2007-2008). Previously, Ms. Reynolds served as President, Treasurer, and Anti-Money Laundering officer of the Fidelity funds (2004-2007). |
Joseph A. Hanlon (44) |
| Year of Election or Appointment: 2012 Chief Compliance Officer of Fidelity's Equity and High Income Funds. Mr. Hanlon serves as Compliance Officer of FMR, FMR Co., Inc., Fidelity Investments Money Management, Inc. (FIMM), Fidelity Research and Analysis Company (FRAC), Fidelity Management & Research (Japan) Inc., Fidelity Management & Research (U.K.) Inc., Fidelity Management & Research (Hong Kong), and Strategic Advisers, Inc. (2009-present), as Senior Vice President of the Fidelity Asset Management Division (2009-present), and is an employee of Fidelity Investments. |
Joseph F. Zambello (55) |
| Year of Election or Appointment: 2011 Deputy Treasurer of the Fidelity funds. Mr. Zambello is an employee of Fidelity Investments. Previously, Mr. Zambello served as Vice President of FMR's Program Management Group (2009-2011) and Vice President of the Transfer Agent Oversight Group (2005-2009). |
Adrien E. Deberghes (45) |
| Year of Election or Appointment: 2008 Deputy Treasurer of Fidelity's Equity and High Income Funds. Mr. Deberghes also serves as Vice President (2011-present) and Assistant Treasurer (2010-present) of other Fidelity funds, and is an employee of Fidelity Investments (2008-present). Previously, Mr. Deberghes served as Senior Vice President of Mutual Fund Administration at State Street Corporation (2007-2008), Senior Director of Mutual Fund Administration at Investors Bank & Trust (2005-2007), and Director of Finance for Dunkin' Brands (2000-2005). |
Stephen Sadoski (41) |
| Year of Election or Appointment: 2012 Deputy Treasurer of Fidelity's Equity and High Income Funds. Mr. Sadoski also serves as Assistant Treasurer of other Fidelity funds (2012-present) and is an employee of Fidelity Investments (2012-present). Previously, Mr. Sadoski served as an assistant chief accountant in the Division of Investment Management of the Securities and Exchange Commission (SEC) (2009-2012) and as a senior manager at Deloitte & Touche (1997-2009). |
Stephanie J. Dorsey (43) |
| Year of Election or Appointment: 2010 Assistant Treasurer of Fidelity's Equity and High Income Funds. Ms. Dorsey also serves as Deputy Treasurer of other Fidelity funds (2008-present) and is an employee of Fidelity Investments (2008-present). Previously, Ms. Dorsey served as Treasurer (2004-2008) of the JPMorgan Mutual Funds and Vice President (2004-2008) of JPMorgan Chase Bank. |
John R. Hebble (54) |
| Year of Election or Appointment: 2009 Assistant Treasurer of Fidelity's Equity and High Income Funds. Mr. Hebble also serves as President (2011-present), Treasurer, and Chief Financial Officer of The North Carolina Capital Management Trust: Cash and Term Portfolios (2008-present), President and Treasurer of other Fidelity funds (2008-present) and is an employee of Fidelity Investments. |
Gary W. Ryan (54) |
| Year of Election or Appointment: 2005 Assistant Treasurer of the Fidelity funds. Mr. Ryan is an employee of Fidelity Investments. Previously, Mr. Ryan served as Vice President of Fund Reporting in Fidelity Pricing and Cash Management Services (FPCMS) (1999-2005). |
Jonathan Davis (44) |
| Year of Election or Appointment: 2010 Assistant Treasurer of the Fidelity funds. Mr. Davis is also Assistant Treasurer of Fidelity Rutland Square Trust II and Fidelity Commonwealth Trust II. Mr. Davis is an employee of Fidelity Investments. Previously, Mr. Davis served as Vice President and Associate General Counsel of FMR LLC (2003-2010). |
Annual Report
The Board of Trustees of Fidelity Emerging Europe, Middle East, Africa (EMEA) Fund voted to pay to shareholders of record at the opening of business on record date, the following distributions per share derived from capital gains realized from sales of portfolio securities, and dividends derived from net investment income:
| Pay Date | Record Date | Dividends | Capital Gains |
Class A | 12/10/12 | 12/07/12 | $0.151 | $0.074 |
Class T | 12/10/12 | 12/07/12 | $0.122 | $0.074 |
Class B | 12/10/12 | 12/07/12 | $0.057 | $0.074 |
Class C | 12/10/12 | 12/07/12 | $0.078 | $0.074 |
Class A, T, B and C designate 100% of the dividend distributed during the fiscal year, as amounts which may be taken into account as a dividend for purposes of the maximum rate under section 1(h)(11) of the Internal Revenue Code.
The amounts per share which represent income derived from sources within, and taxes paid to, foreign countries or possessions of the United States are as follows:
| Pay Date | Income | Taxes |
Class A | 12/12/11 | $0.040 | $0.0204 |
Class T | 12/12/11 | $0.035 | $0.0204 |
Class B | 12/12/11 | $0.018 | $0.0204 |
Class C | 12/12/11 | $0.024 | $0.0204 |
The fund will notify shareholders in January 2013 of amounts for use in preparing 2012 income tax returns.
Annual Report
Board Approval of Investment Advisory Contracts and Management Fees
Fidelity Emerging Europe, Middle East, Africa (EMEA) Fund
Each year, the Board of Trustees, including the Independent Trustees (together, the Board), votes on the renewal of the management contract and sub-advisory agreements (together, the Advisory Contracts) for the fund. The Board, assisted by the advice of fund counsel and Independent Trustees' counsel, requests and considers a broad range of information relevant to the renewal of the Advisory Contracts throughout the year.
The Board meets regularly and, at each of its meetings, considers factors that are relevant to its annual consideration of the renewal of the fund's Advisory Contracts, including the services and support provided to the fund and its shareholders. The Board has established various standing committees, each composed of and chaired by Independent Trustees with varying backgrounds, to which the Board has assigned specific subject matter responsibilities in order to enhance effective decision-making by the Board. The Board, acting directly and through its Committees, requests and receives information concerning the annual consideration of the renewal of the fund's Advisory Contracts. The Board also meets as needed to consider matters specifically related to the Board's annual consideration of the renewal of Advisory Contracts. Members of the Board may also meet with trustees of other Fidelity funds through ad hoc joint committees to discuss certain matters relevant to the Fidelity funds.
At its July 2012 meeting, the Board of Trustees, including the Independent Trustees, unanimously determined to renew the fund's Advisory Contracts. In reaching its determination, the Board considered all factors it believed relevant, including (i) the nature, extent, and quality of the services to be provided to the fund and its shareholders (including the investment performance of the fund); (ii) the competitiveness of the fund's management fee and total expense ratio relative to peer funds; (iii) the total costs of the services to be provided by and the profits to be realized by Fidelity from its relationship with the fund; (iv) the extent to which economies of scale exist and would be realized as the fund grows; and (v) whether fee levels reflect these economies of scale, if any, for the benefit of fund shareholders.
In considering whether to renew the Advisory Contracts for the fund, the Board reached a determination, with the assistance of fund counsel and Independent Trustees' counsel and through the exercise of its business judgment, that the renewal of the Advisory Contracts is in the best interests of the fund and its shareholders and that the compensation payable under the Advisory Contracts is fair and reasonable. The Board's decision to renew the Advisory Contracts was not based on any single factor, but rather was based on a comprehensive consideration of all the information provided to the Board at its meetings throughout the year. The Board, in reaching its determination to renew the Advisory Contracts, is aware that shareholders in the fund have a broad range of investment choices available to them, including a wide choice among mutual funds offered by Fidelity's competitors, and that the fund's shareholders, who have the opportunity to review and weigh the disclosure provided by the fund in its prospectus and other public disclosures, have chosen to invest in this fund, managed by Fidelity.
Annual Report
Board Approval of Investment Advisory Contracts and
Management Fees - continued
Nature, Extent, and Quality of Services Provided. The Board considered the staffing within the investment adviser, FMR, and the sub-advisers (together, the Investment Advisers), including the backgrounds of the fund's investment personnel, and also considered the fund's investment objective, strategies, and related investment philosophy. The Independent Trustees also had discussions with senior management of Fidelity's investment operations and investment groups. The Board considered the structure of the portfolio manager compensation program and whether this structure provides appropriate incentives to act in the best interests of the fund.
Resources Dedicated to Investment Management and Support Services. The Board and the Fund Oversight and Research Committees reviewed the general qualifications and capabilities of the Investment Advisers' investment staff, including its size, education, experience, and resources, as well as the Investment Advisers' approach to recruiting, training, managing, and compensating investment personnel. The Board also noted that FMR has continued to increase the resources devoted to non-U.S. offices, including expansion of Fidelity's global investment organization. The Board noted that Fidelity's analysts have extensive resources, tools and capabilities that allow them to conduct sophisticated quantitative and fundamental analysis, as well as credit analysis of issuers, counterparties and guarantors. The Board also believes that Fidelity's investment professionals have sufficient access to global information and data so as to provide competitive investment results over time, and that those professionals also have access to sophisticated tools that permit them to assess portfolio construction and risk and performance attribution characteristics continuously, as well as to transmit new information and research conclusions rapidly around the world. Additionally, in its deliberations, the Board considered the Investment Advisers' trading and risk management capabilities and resources, which are an integral part of the investment management process.
Shareholder and Administrative Services. The Board considered (i) the nature, extent, quality, and cost of advisory, administrative, and shareholder services performed by the Investment Advisers and their affiliates under the Advisory Contracts and under separate agreements covering transfer agency, pricing and bookkeeping, and securities lending services for the fund; (ii) the nature and extent of the supervision of third party service providers, principally custodians and subcustodians; and (iii) the resources devoted to, and the record of compliance with, the fund's compliance policies and procedures. The Board also reviewed the allocation of fund brokerage, including allocations to brokers affiliated with the Investment Advisers, the use of brokerage commissions to pay fund expenses, and the use of "soft" commission dollars to pay for research services.
Annual Report
The Board noted that the growth of fund assets over time across the complex allows Fidelity to reinvest in the development of services designed to enhance the value or convenience of the Fidelity funds as investment vehicles. These services include 24-hour access to account information and market information through telephone representatives and over the Internet, investor education materials and asset allocation tools, and the expanded availability of Fidelity Investor Centers.
Investment in a Large Fund Family. The Board considered the benefits to shareholders of investing in a Fidelity fund, including the benefits of investing in a fund that is part of a large family of funds offering a variety of investment disciplines and providing a large variety of mutual fund investor services. The Board noted that Fidelity had taken, or had made recommendations that resulted in the Fidelity funds taking, a number of actions over the previous year that benefited particular funds, including (i) continuing to dedicate additional resources to investment research and support of the senior management team that oversees asset management; (ii) persisting in efforts to enhance Fidelity's research capabilities, in particular, international research; (iii) launching new funds and making other enhancements to meet client needs for global and income-oriented solutions; (iv) continuing to launch dedicated lower cost underlying funds to meet investment management's portfolio construction needs related to expanding underlying fund options, specifically for the Freedom Fund product lines; (v) adopting a "Stock Selector" sector neutral investment approach and employing a team of portfolio managers who are sector specialists to manage certain funds; (vi) rationalizing product lines and gaining increased efficiencies through the mergers of several funds into other funds; (vii) strengthening the Spartan Index Fund product line by adding new funds and/or new low-cost institutional share classes, restructuring fund expenses to accommodate new classes, and reducing investment minimums for certain classes of shares; (viii) modifying the eligibility criteria for Institutional Class shares to increase their appeal to government entities and charitable investors; and (ix) reducing certain transfer agent fee rates.
Investment Performance. The Board considered whether the fund has operated in accordance with its investment objective, as well as its record of compliance with its investment restrictions. It also reviewed the fund's absolute investment performance for each class, as well as the fund's relative investment performance for each class measured against a broad-based securities market index. The Board noted that FMR believes that no meaningful peer group exists for the fund principally because most other funds in the fund's third-party peer group have different and/or broader investment mandates than the fund's more specialized strategies. Because the fund had been in existence less than five calendar years, the following charts considered by the Board show, over the one- and three-year periods ended December 31, 2011, the cumulative total returns of Institutional Class (Class I) and Class B of the fund and the cumulative total returns of a broad-based securities market index ("benchmark"). The returns of Institutional Class (Class I) and Class B show the performance of the highest and lowest performing classes, respectively (based on three-year performance).
Annual Report
Board Approval of Investment Advisory Contracts and
Management Fees - continued
Fidelity Emerging Europe, Middle East, Africa (EMEA) Fund

The Board noted that the investment performance of Institutional Class (Class I) of the fund compared favorably to its benchmark for all the periods shown. The Board considered that the variations in performance among the fund's classes reflect the variations in class expenses, which result in lower performance for higher expense classes. The Board also reviewed the fund's performance since inception as well as performance in the current year.
Based on its review, the Board concluded that the nature, extent, and quality of services provided to the fund under the Advisory Contracts should benefit the fund's shareholders.
Competitiveness of Management Fee and Total Expense Ratio. The Board considered the fund's management fee and total expense ratio compared to "mapped groups" of competitive funds and classes. Fidelity creates "mapped groups" by combining similar Lipper investment objective categories that have comparable management fee characteristics. Combining Lipper investment objective categories aids the Board's management fee and total expense ratio comparisons by broadening the competitive group used for comparison and by reducing the number of universes to which various Fidelity funds are compared.
Management Fee. The Board considered two proprietary management fee comparisons for the 12-month (or shorter) periods shown in the chart below. The group of Lipper funds used by the Board for management fee comparisons is referred to below as the "Total Mapped Group." The Total Mapped Group comparison focuses on a fund's standing relative to the total universe of comparable funds available to investors in terms of gross management fees before expense reimbursements or caps. "TMG %" represents the percentage of funds in the Total Mapped Group that had management fees that were lower than the fund's. For example, a TMG % of 13% means that 87% of the funds in the Total Mapped Group had higher management fees than the fund. The "Asset-Size Peer Group" (ASPG) comparison focuses on a fund's standing relative to non-Fidelity funds similar in size to the fund within the Total Mapped Group. The ASPG represents at least 15% of the funds in the Total Mapped Group with comparable asset size and management fee characteristics, subject to a minimum of 50 funds (or all funds in the Total Mapped Group if fewer than 50). Additional information, such as the ASPG quartile in which the fund's management fee ranked, is also included in the chart and considered by the Board.
Annual Report
Fidelity Emerging Europe, Middle East, Africa (EMEA) Fund
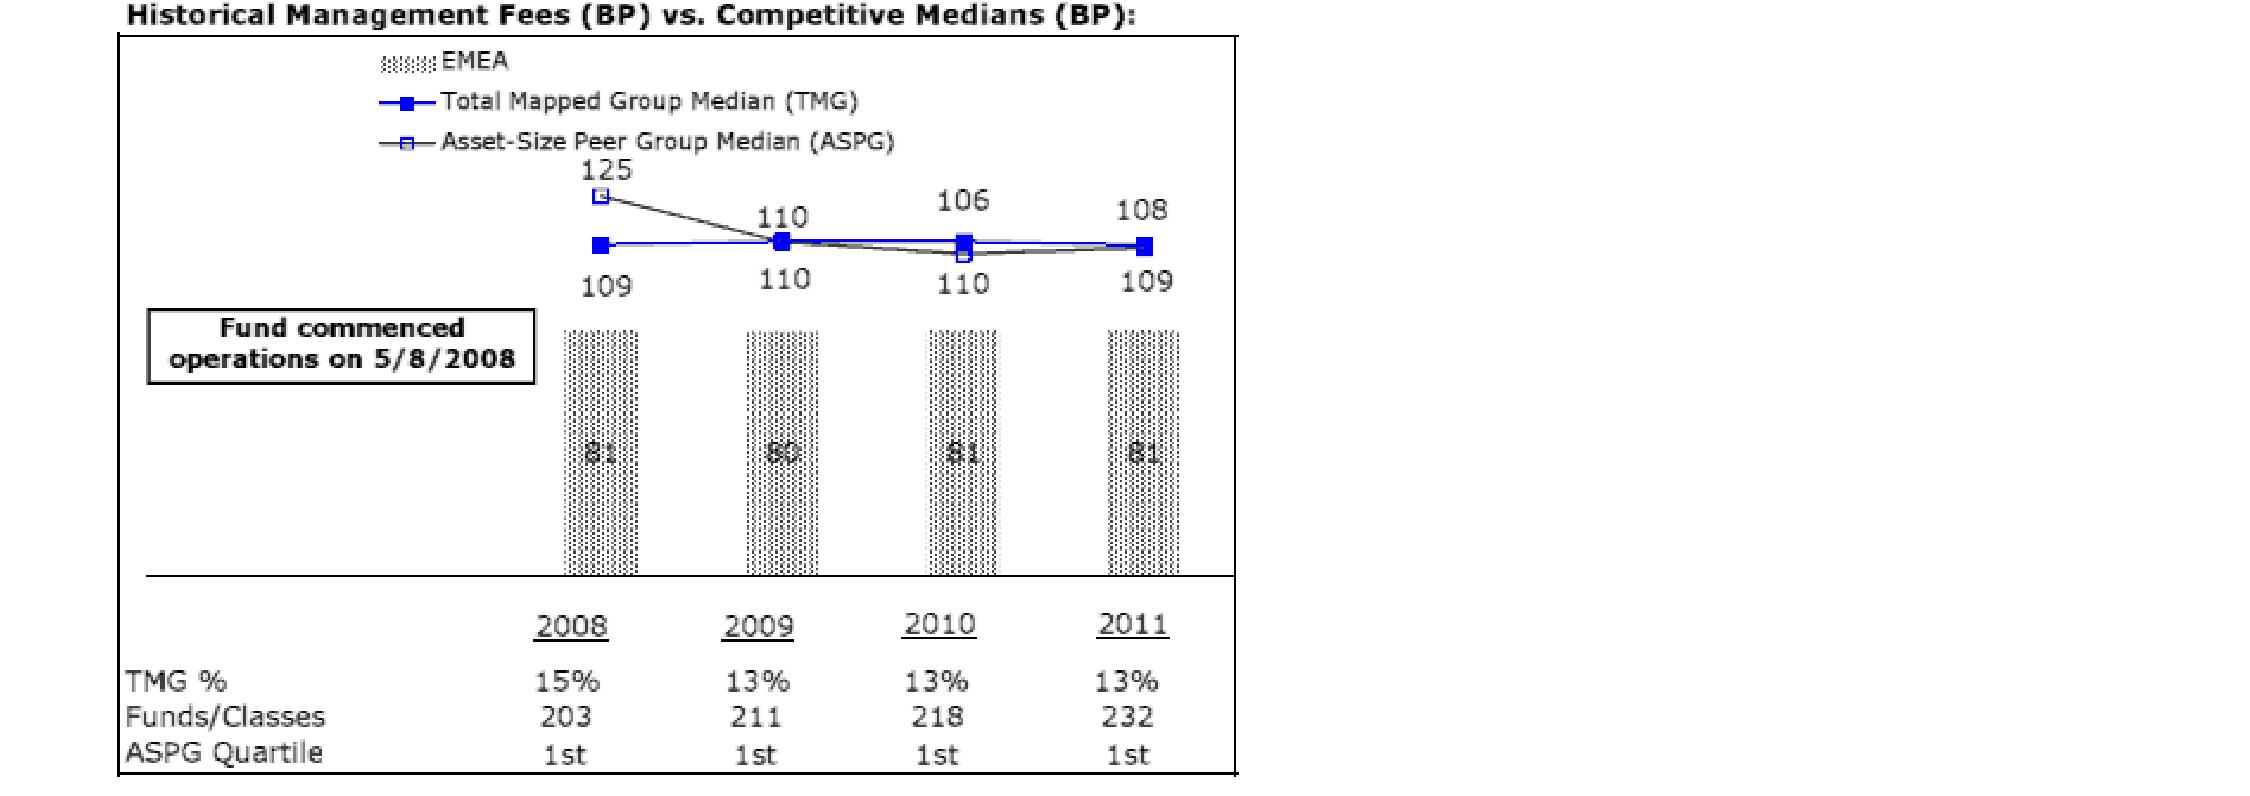
The Board noted that the fund's management fee ranked below the median of its Total Mapped Group and below the median of its ASPG for 2011.
Based on its review, the Board concluded that the fund's management fee is fair and reasonable in light of the services that the fund receives and the other factors considered.
Total Expense Ratio. In its review of each class's total expense ratio, the Board considered the fund's management fee as well as other fund or class expenses, as applicable, such as transfer agent fees, pricing and bookkeeping fees, fund-paid 12b-1 fees, and custodial, legal, and audit fees. The Board also noted the effects of any waivers and reimbursements on fees and expenses. As part of its review, the Board also considered the current and historical total expense ratios of each class of the fund compared to competitive fund median expenses. Each class of the fund is compared to those funds and classes in the Total Mapped Group (used by the Board for management fee comparisons) that have a similar sales load structure.
Annual Report
Board Approval of Investment Advisory Contracts and
Management Fees - continued
The Board noted that the total expense ratio of each of Class A, Class B, Class C, Institutional Class, and the retail class ranked below its competitive median for 2011 and the total expense ratio of Class T ranked above its competitive median for 2011. The Board considered that various factors, including 12b-1 fees, positive or negative performance adjustments, and relatively higher other expenses in the case of small fund size, can affect total expense ratios. The Board noted that the total expense ratio of Class T was above the competitive median primarily because of higher 12b-1 fees on Class T. Class T has a higher 12b-1 fee, but a lower front-end sales charge, than traditionally priced front-end sales charge classes. The Board considered that Class T is primarily sold load-waived in the retirement plan market where its 0.50% 12b-1 fee is comparable to competing no-load, higher 12b-1 fee classes designed specifically for retirement plans. The Board noted that the fund offers multiple classes, each of which has a different sales load and 12b-1 fee structure, and that the multiple structures are intended to offer a range of pricing options for the intermediary market. The Board also noted that the total expense ratios of the classes vary primarily by the level of their 12b-1 fees, although differences in transfer agent fees may also cause expenses to vary from class to class.
Fees Charged to Other Fidelity Clients. The Board also considered Fidelity fee structures and other information with respect to clients of FMR and its affiliates, such as other mutual funds advised or subadvised by FMR or its affiliates, pension plan clients, and other institutional clients. The Board noted the findings of the 2010 ad hoc joint committee (created with the board of other Fidelity funds), which reviewed and compared Fidelity's institutional investment advisory business with its business of providing services to the Fidelity funds, including the differences in services provided, fees charged, and costs incurred, as well as competition in their respective marketplaces.
Based on its review of total expense ratios and fees charged to other Fidelity clients, the Board concluded that the total expense ratio of each class of the fund was reasonable, although Class T was above the median of the universe presented for comparison, in light of the services that the fund and its shareholders receive and the other factors considered.
Costs of the Services and Profitability. The Board considered the revenues earned and the expenses incurred by Fidelity in conducting the business of developing, marketing, distributing, managing, administering and servicing the fund and its shareholders. The Board also considered the level of Fidelity's profits in respect of all the Fidelity funds.
Annual Report
On an annual basis, FMR presents to the Board Fidelity's profitability for the fund. Fidelity calculates the profitability for each fund, as well as aggregate profitability for groups of Fidelity funds and all Fidelity funds, using a series of detailed revenue and cost allocation methodologies which originate with the books and records of Fidelity on which Fidelity's audited financial statements are based. The Audit Committee of the Board reviews any significant changes from the prior year's methodologies.
PricewaterhouseCoopers LLP (PwC), independent registered public accounting firm and auditor to Fidelity and certain Fidelity funds, has been engaged annually by the Board as part of the Board's assessment of Fidelity's profitability analysis. PwC's engagement includes the review and assessment of Fidelity's methodologies used in determining the revenues and expenses attributable to Fidelity's mutual fund business, and completion of agreed-upon procedures surrounding the mathematical accuracy of fund profitability and its conformity to allocation methodologies. After considering PwC's reports issued under the engagement and information provided by Fidelity, the Board concluded that while other allocation methods may also be reasonable, Fidelity's profitability methodologies are reasonable in all material respects.
The Board also reviewed Fidelity's non-fund businesses and fall-out benefits related to the mutual fund business as well as cases where Fidelity's affiliates may benefit from or be related to the fund's business.
The Board considered the costs of the services provided by and the profits realized by Fidelity in connection with the operation of the fund and was satisfied that the profitability was not excessive in the circumstances.
Economies of Scale. The Board considered whether there have been economies of scale in respect of the management of the Fidelity funds, whether the Fidelity funds (including the fund) have appropriately benefited from any such economies of scale, and whether there is potential for realization of any further economies of scale. The Board considered the extent to which the fund will benefit from economies of scale through increased services to the fund, through waivers or reimbursements, or through fee or expense reductions. The Board also noted that in 2009, it and the board of other Fidelity funds created an ad hoc committee (the Economies of Scale Committee) to analyze whether FMR attains economies of scale in respect of the management and servicing of the Fidelity funds, whether the Fidelity funds have appropriately benefited from such economies of scale, and whether there is potential for realization of any further economies of scale.
The Board recognized that the fund's management contract incorporates a "group fee" structure, which provides for lower group fee rates as total fund assets under FMR's management increase, and for higher group fee rates as total fund assets under FMR's management decrease. FMR calculates the group fee rates based on a tiered asset "breakpoint" schedule that varies based on asset class. The Board considered that the group fee is designed to deliver the benefits of economies of scale to fund shareholders when total Fidelity fund assets increase, even if assets of any particular fund are unchanged or have declined, because some portion of Fidelity's costs are attributable to services provided to all Fidelity funds, and all funds benefit if those costs can be allocated among more assets. The Board concluded that, given the group fee structure, fund shareholders will benefit from lower management fees as assets under FMR's management increase at the fund complex level, regardless of whether Fidelity achieves any such economies of scale.
Annual Report
Board Approval of Investment Advisory Contracts and
Management Fees - continued
The Board concluded, taking into account the analysis of the Economies of Scale Committee, that economies of scale, if any, are being appropriately shared between fund shareholders and Fidelity.
Additional Information Requested by the Board. In order to develop fully the factual basis for consideration of the Fidelity funds' Advisory Contracts, the Board requested and received additional information on certain topics, including (i) fund performance trends, actions to be taken by FMR to improve certain funds' overall performance, and Fidelity's long-term strategies for certain funds; (ii) the potential to further rationalize the Fidelity fund lineup with the possibility of achieving savings for the funds and Fidelity; (iii) Fidelity's compensation structure for portfolio managers and other key investment personnel; (iv) the amount of the investment that each portfolio manager has made in the Fidelity fund(s) that he or she manages; (v) the realization of fall-out benefits in certain Fidelity business units; (vi) Fidelity's group fee structures, the potential impact of regulatory changes on such structures, and the rationale for the individual fee rates of certain funds; (vii) fund profitability methodology, including Fidelity's cost allocation methodology, and the impact of certain factors on fund profitability results; (viii) trends regarding industry use of performance fee structures and the possibility of implementing performance fee structures for additional funds; and (ix) the impact of net redemptions from the Fidelity funds.
Based on its evaluation of all of the conclusions noted above, and after considering all factors it believed relevant, the Board ultimately concluded that the advisory fee structures are fair and reasonable, and that the fund's Advisory Contracts should be renewed.
Annual Report
Investment Adviser
Fidelity Management & Research Company
Boston, MA
Investment Sub-Advisers
FMR Co., Inc.
Fidelity Management & Research
(U.K.) Inc.
FIL Investments (Japan) Limited
FIL Investment Advisors
FIL Investment Advisors
(U.K.) Limited
Fidelity Management & Research
(Hong Kong) Limited
Fidelity Management & Research
(Japan) Inc.
General Distributor
Fidelity Distributors Corporation
Smithfield, RI
Transfer and Service Agents
Fidelity Investments Institutional
Operations Company, Inc.
Boston, MA
Fidelity Service Company, Inc.
Boston, MA
Custodian
State Street Bank & Trust Company
Quincy, MA
(Fidelity Investment logo)(registered trademark)
AEME-UANN-1212
1.861988.104
(Fidelity Investment logo)(registered trademark)
Fidelity Advisor®
Emerging Europe,
Middle East, Africa (EMEA)
Fund - Institutional Class
Annual Report
October 31, 2012
(Fidelity Cover Art)
Institutional Class is a
class of Fidelity® Emerging Europe, Middle East, Africa (EMEA) Fund
Contents
Performance | (Click Here) | How the fund has done over time. |
Management's Discussion of Fund Performance | (Click Here) | The Portfolio Manager's review of fund performance and strategy. |
Shareholder Expense Example | (Click Here) | An example of shareholder expenses. |
Investment Changes | (Click Here) | A summary of major shifts in the fund's investments over the past six months. |
Investments | (Click Here) | A complete list of the fund's investments with their market values. |
Financial Statements | (Click Here) | Statements of assets and liabilities, operations, and changes in net assets, as well as financial highlights. |
Notes | (Click Here) | Notes to the financial statements. |
Report of Independent Registered Public Accounting Firm | (Click Here) | |
Trustees and Officers | (Click Here) | |
Distributions | (Click Here) | |
Board Approval of Investment Advisory Contracts and Management Fees | (Click Here) | |
To view a fund's proxy voting guidelines and proxy voting record for the 12-month period ended June 30, visit http://www.fidelity.com/proxyvotingresults or visit the Securities and Exchange Commission's (SEC) web site at http://www.sec.gov. You may also call 1-877-208-0098 to request a free copy of the proxy voting guidelines.
Standard & Poor's, S&P and S&P 500 are registered service marks of The McGraw-Hill Companies, Inc. and have been licensed for use by Fidelity Distributors Corporation.
Other third party marks appearing herein are the property of their respective owners.
All other marks appearing herein are registered or unregistered trademarks or service marks of FMR LLC or an affiliated company. © 2012 FMR LLC. All rights reserved.
Annual Report
This report and the financial statements contained herein are submitted for the general information of the shareholders of the fund. This report is not authorized for distribution to prospective investors in the fund unless preceded or accompanied by an effective prospectus.
A fund files its complete schedule of portfolio holdings with the SEC for the first and third quarters of each fiscal year on Form N-Q. Forms N-Q are available on the SEC's web site at http://www.sec.gov. A fund's Forms N-Q may be reviewed and copied at the SEC's Public Reference Room in Washington, DC. Information regarding the operation of the SEC's Public Reference Room may be obtained by calling 1-800-SEC-0330. For a complete list of a fund's portfolio holdings, view the most recent holdings listing, semiannual report, or annual report on Fidelity's web site at http://www.fidelity.com, http://www.advisor.fidelity.com, or http://www.401k.com, as applicable.
NOT FDIC INSURED • MAY LOSE VALUE • NO BANK GUARANTEE
Neither the fund nor Fidelity Distributors Corporation is a bank.
Annual Report
Average annual total return reflects the change in the value of an investment, assuming reinvestment of the class' distributions from dividend income and capital gains (the profits earned upon the sale of securities that have grown in value, if any) and assuming a constant rate of performance each year. The $10,000 table and the fund's returns do not reflect the deduction of taxes that a shareholder would pay on fund distributions or the redemption of fund shares. During periods of reimbursement by Fidelity, a fund's total return will be greater than it would be had the reimbursement not occurred. How a fund did yesterday is no guarantee of how it will do tomorrow.
Average Annual Total Returns
Periods ended October 31, 2012 | | Past 1
year | Life of
fund A |
Institutional Class | | 6.93% | -1.78% |
A From May 8, 2008.
$10,000 Over Life of Fund
Let's say hypothetically that $10,000 was invested in Fidelity Advisor® Emerging Europe, Middle East, Africa (EMEA) Fund - Institutional Class on May 8, 2008, when the fund started. The chart shows how the value of your investment would have changed, and also shows how the MSCI® EM (Emerging Markets) Europe, Middle East and Africa Index performed over the same period.
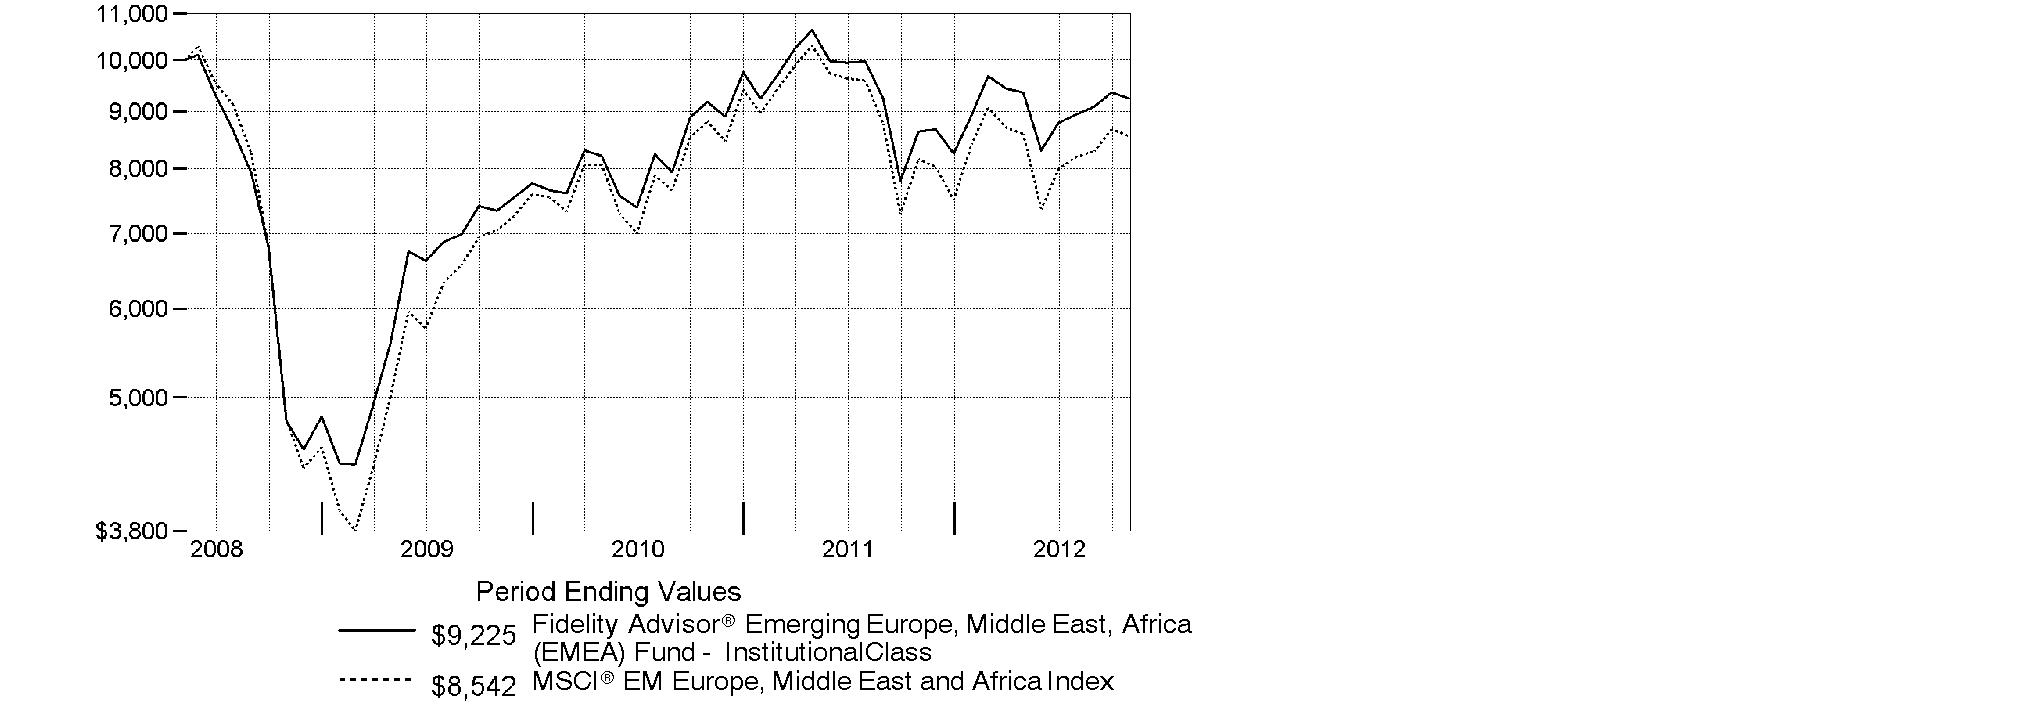
Annual Report
Market Recap: Emerging-markets stocks gained 2.98% for the year ending October 31, 2012, as measured by the MSCI® Emerging Markets Index. After some early choppiness, the index rallied strongly in the first two months of 2012 but retreated from March through May amid renewed concerns about Europe's sovereign debt crisis and continued economic sluggishness in key countries such as China and Brazil. A general uptrend in the final five months of the period lifted the index into positive territory for the full year, despite the head wind of a generally stronger U.S. dollar. Major benchmark component Brazil was a drag on performance, falling roughly 13%. The nation's inflation rate crept higher while economic growth ebbed, creating an unfavorable backdrop for stocks here. India's market retreated about 5%, while Russia gave up 4%. Conversely, Hong Kong advanced approximately 17%, aided by rebounding shares of property developers, while South Africa added 7%, China rose roughly 5% and South Korea and Taiwan gained about 4% and 1%, respectively. Sentiment about Chinese stocks improved following the government's September approval of massive outlays for infrastructure projects, in hopes of halting that nation's economic slowdown. However, China's ongoing transition to new Communist Party leadership created uncertainty that kept some investors on the sidelines.
Comments from Adam Kutas, Portfolio Manager of Fidelity Advisor® Emerging Europe, Middle East, Africa (EMEA) Fund: For the year, the fund's Institutional Class shares returned 6.93%, outperforming the 4.73% gain of the MSCI® EM (Emerging Markets) Europe, Middle East and Africa Index. Relative to the index, an overweighting in consumer staples proved most fruitful, particularly within food and staples retailing. Our positioning in utilities also helped, as did an underweighting in materials and security selection in energy, financials and telecommunication services. Geographically, the fund was aided the most by stock selection in Kenya and out-of-benchmark holdings in Canada. Top contributors included Canada-based Africa Oil, three South African stocks - drug store chain Clicks Group, supermarket firm Shoprite Holdings and diversified financials firm FirstRand - and not owning Gold Fields and Impala Platinum Holdings, two underperforming index components located in South Africa. On the downside, an underweighting in consumer discretionary dampened relative returns, particularly in the media group. Regionally, positioning in Turkey and stock selection in Russia were negatives. Among the individual detractors were underweightings in South African media company Naspers and Russian retailer Magnit, an overweighting in South Africa's Harmony Gold Mining, an investment in Russian energy firm TNK-BP Holding and not owning Turkish bank and outperforming index component Akbank Turk Anonim Sirketi. Africa Oil and Magnit were not held by the fund at period end.
Note to shareholders: The fund may invest up to 35% of its total assets in any industry that represents more than 20% of the emerging Europe, Middle East and African markets. As of October 31, 2012, the fund did not have more than 25% of its total assets invested in any one industry.
The views expressed above reflect those of the portfolio manager(s) only through the end of the period as stated on the cover of this report and do not necessarily represent the views of Fidelity or any other person in the Fidelity organization. Any such views are subject to change at any time based upon market or other conditions and Fidelity disclaims any responsibility to update such views. These views may not be relied on as investment advice and, because investment decisions for a Fidelity fund are based on numerous factors, may not be relied on as an indication of trading intent on behalf of any Fidelity fund.
Annual Report
Shareholder Expense Example
As a shareholder of the Fund, you incur two types of costs: (1) transaction costs, including sales charges (loads) on purchase payments or redemption proceeds, redemption fees and (2) ongoing costs, including management fees, distribution and/or service (12b-1) fees and other Fund expenses. This Example is intended to help you understand your ongoing costs (in dollars) of investing in the Fund and to compare these costs with the ongoing costs of investing in other mutual funds.
The Example is based on an investment of $1,000 invested at the beginning of the period and held for the entire period (May 1, 2012 to October 31, 2012).
Actual Expenses
The first line of the accompanying table for each class of the Fund provides information about actual account values and actual expenses. You may use the information in this line, together with the amount you invested, to estimate the expenses that you paid over the period. Simply divide your account value by $1,000.00 (for example, an $8,600 account value divided by $1,000.00 = 8.6), then multiply the result by the number in the first line for a class of the Fund under the heading entitled "Expenses Paid During Period" to estimate the expenses you paid on your account during this period. A small balance maintenance fee of $12.00 that is charged once a year may apply for certain accounts with a value of less than $2,000. This fee is not included in the table below. If it was, the estimate of expenses you paid during the period would be higher, and your ending account value lower, by this amount. In addition, the Fund, as a shareholder in the underlying Fidelity Central Funds, will indirectly bear its pro-rata share of the fees and expenses incurred by the underlying Fidelity Central Funds. These fees and expenses are not included in the Fund's annualized expense ratio used to calculate the expense estimate in the table below.
Hypothetical Example for Comparison Purposes
The second line of the accompanying table for each class of the Fund provides information about hypothetical account values and hypothetical expenses based on a Class' actual expense ratio and an assumed rate of return of 5% per year before expenses, which is not the Class' actual return. The hypothetical account values and expenses may not be used to estimate the actual ending account balance or expenses you paid for the period. You may use this information to compare the ongoing costs of investing in the Fund and other funds. To do so, compare this 5% hypothetical example with the 5% hypothetical examples that appear in the shareholder reports of the other funds. A small balance maintenance fee of $12.00 that is charged once a year may apply for certain accounts with a value of less than $2,000. This fee is not included in the table below. If it was, the estimate of expenses you paid during the period would be higher, and your ending account value lower, by this amount. In addition, the Fund, as a shareholder in the underlying Fidelity Central Funds, will indirectly bear its pro-rata share of the fees and expenses incurred by the underlying Fidelity Central Funds. These fees and expenses are not included in the Fund's annualized expense ratio used to calculate the expense estimate in the table below.
Annual Report
Shareholder Expense Example - continued
Please note that the expenses shown in the table are meant to highlight your ongoing costs only and do not reflect any transaction costs. Therefore, the second line of the table is useful in comparing ongoing costs only, and will not help you determine the relative total costs of owning different funds. In addition, if these transactional costs were included, your costs would have been higher.
| Annualized
Expense Ratio | Beginning
Account Value
May 1, 2012 | Ending
Account Value
October 31, 2012 | Expenses Paid
During Period*
May 1, 2012 to
October 31, 2012 |
Class A | 1.59% | | | |
Actual | | $ 1,000.00 | $ 984.20 | $ 7.93 |
HypotheticalA | | $ 1,000.00 | $ 1,017.14 | $ 8.06 |
Class T | 1.88% | | | |
Actual | | $ 1,000.00 | $ 981.90 | $ 9.37 |
HypotheticalA | | $ 1,000.00 | $ 1,015.69 | $ 9.53 |
Class B | 2.34% | | | |
Actual | | $ 1,000.00 | $ 979.70 | $ 11.64 |
HypotheticalA | | $ 1,000.00 | $ 1,013.37 | $ 11.84 |
Class C | 2.35% | | | |
Actual | | $ 1,000.00 | $ 980.70 | $ 11.70 |
HypotheticalA | | $ 1,000.00 | $ 1,013.32 | $ 11.89 |
Emerging Europe, Middle East, Africa (EMEA) | 1.34% | | | |
Actual | | $ 1,000.00 | $ 986.50 | $ 6.69 |
HypotheticalA | | $ 1,000.00 | $ 1,018.40 | $ 6.80 |
Institutional Class | 1.24% | | | |
Actual | | $ 1,000.00 | $ 986.50 | $ 6.19 |
HypotheticalA | | $ 1,000.00 | $ 1,018.90 | $ 6.29 |
A 5% return per year before expenses
* Expenses are equal to each Class' annualized expense ratio, multiplied by the average account value over the period, multiplied by 184/366 (to reflect the one-half year period).
Annual Report
Investment Changes (Unaudited)
Geographic Diversification (% of fund's net assets) |
As of October 31, 2012 |
 | South Africa 42.4% | |
 | Russia 30.6% | |
 | Turkey 6.4% | |
 | United Arab Emirates 5.1% | |
 | Poland 2.6% | |
 | Kenya 2.3% | |
 | Nigeria 1.6% | |
 | Morocco 1.0% | |
| Other* 8.0% | |

* Includes short-term investments and net other assets. |
Percentages are based on country or territory of incorporation and are adjusted for the effect of futures contracts, if applicable. |
As of April 30, 2012 |
| South Africa 47.1% | |
| Russia 31.2% | |
| Turkey 5.0% | |
| United Arab Emirates 3.5% | |
 | Kenya 2.5% | |
| Poland 2.4% | |
| Nigeria 1.5% | |
| Morocco 1.0% | |
| Qatar 0.9% | |
| Other* 4.9% | |

* Includes short-term investments and net other assets. |
Percentages are based on country or territory of incorporation and are adjusted for the effect of futures contracts, if applicable. |
Asset Allocation |
| % of fund's
net assets | % of fund's net assets
6 months ago |
Stocks | 95.5 | 98.7 |
Bonds | 0.6 | 0.6 |
Short-Term Investments and Net Other Assets (Liabilities) | 3.9 | 0.7 |
Top Ten Stocks as of October 31, 2012 |
| % of fund's
net assets | % of fund's net assets
6 months ago |
MTN Group Ltd. (South Africa, Wireless Telecommunication Services) | 7.8 | 7.4 |
Lukoil Oil Co. (Russia, Oil, Gas & Consumable Fuels) | 7.6 | 6.3 |
Sberbank (Savings Bank of the Russian Federation) (Russia, Commercial Banks) | 6.8 | 6.5 |
Gazprom OAO (Russia, Oil, Gas & Consumable Fuels) | 6.4 | 8.0 |
Standard Bank Group Ltd. (South Africa, Commercial Banks) | 3.7 | 5.0 |
Turkiye Garanti Bankasi A/S (Turkey, Commercial Banks) | 3.3 | 2.4 |
FirstRand Ltd. (South Africa, Diversified Financial Services) | 3.2 | 4.2 |
Clicks Group Ltd. (South Africa, Food & Staples Retailing) | 3.0 | 2.8 |
NOVATEK OAO (Russia, Oil, Gas & Consumable Fuels) | 2.6 | 2.7 |
Surgutneftegaz JSC (Russia, Oil, Gas & Consumable Fuels) | 2.6 | 2.3 |
| 47.0 | |
Market Sectors as of October 31, 2012 |
| % of fund's
net assets | % of fund's net assets
6 months ago |
Financials | 28.0 | 26.8 |
Energy | 26.3 | 27.5 |
Telecommunication Services | 13.4 | 13.5 |
Materials | 9.7 | 10.8 |
Consumer Staples | 9.5 | 10.5 |
Industrials | 3.5 | 3.2 |
Consumer Discretionary | 3.0 | 4.1 |
Health Care | 1.6 | 1.3 |
Utilities | 0.5 | 1.0 |
Information Technology | 0.3 | 0.3 |
Annual Report
Investments October 31, 2012
Showing Percentage of Net Assets
Common Stocks - 92.9% |
| Shares | | Value |
Bailiwick of Jersey - 0.4% |
Randgold Resources Ltd. | 5,200 | | $ 621,595 |
Canada - 0.4% |
Silver Wheaton Corp. | 13,200 | | 531,965 |
Czech Republic - 0.7% |
Philip Morris CR A/S | 1,700 | | 910,824 |
Kenya - 2.3% |
Barclays Bank of Kenya Ltd. | 1,820,550 | | 337,812 |
British American Tobacco Kenya Ltd. | 76,700 | | 420,656 |
East African Breweries Ltd. | 153,906 | | 433,793 |
Kenya Airways Ltd. | 1,754,900 | | 256,588 |
Safaricom Ltd. | 25,380,571 | | 1,311,503 |
Uchumi Supermarket Ltd. | 2,000,000 | | 461,538 |
TOTAL KENYA | | 3,221,890 |
Morocco - 1.0% |
Maroc Telecom SA | 112,000 | | 1,415,396 |
Nigeria - 1.6% |
Guaranty Trust Bank PLC | 5,238,796 | | 660,437 |
Nigerian Breweries PLC | 124,501 | | 96,075 |
Skye Bank PLC | 28,071,010 | | 729,210 |
Zenith Bank PLC | 6,364,370 | | 730,205 |
TOTAL NIGERIA | | 2,215,927 |
Poland - 2.6% |
Bank Polska Kasa Opieki SA | 45,800 | | 2,199,157 |
Eurocash SA | 61,300 | | 748,622 |
Kruk SA (a) | 53,400 | | 729,250 |
TOTAL POLAND | | 3,677,029 |
Qatar - 0.9% |
Qatar National Bank SAQ | 18,153 | | 667,597 |
Vodafone Qatar QSC (a) | 254,173 | | 628,286 |
TOTAL QATAR | | 1,295,883 |
Russia - 28.0% |
Gazprom OAO | 1,948,900 | | 9,009,597 |
Lukoil Oil Co. | 5,000 | | 303,582 |
Lukoil Oil Co. sponsored ADR (United Kingdom) | 171,495 | | 10,366,873 |
NOVATEK OAO | 40,000 | | 434,273 |
NOVATEK OAO GDR (Reg. S) | 28,500 | | 3,249,000 |
Rosneft Oil Co. OJSC | 140,000 | | 1,038,970 |
Rosneft Oil Co. OJSC GDR (Reg. S) | 146,700 | | 1,085,580 |
Common Stocks - continued |
| Shares | | Value |
Russia - continued |
Sberbank (Savings Bank of the Russian Federation) | 3,263,700 | | $ 9,554,222 |
Sistema JSFC sponsored GDR | 11,700 | | 214,695 |
TNK-BP Holding | 909,300 | | 1,856,259 |
Uralkali OJSC | 282,800 | | 2,229,184 |
TOTAL RUSSIA | | 39,342,235 |
South Africa - 42.4% |
Adcock Ingram Holdings Ltd. | 62,000 | | 414,017 |
AngloGold Ashanti Ltd. | 86,100 | | 2,908,917 |
Aspen Pharmacare Holdings Ltd. | 74,300 | | 1,353,924 |
Cashbuild Ltd. | 60,100 | | 1,039,299 |
Clicks Group Ltd. | 609,706 | | 4,203,632 |
DRDGOLD Ltd. | 1,483,914 | | 1,040,544 |
FirstRand Ltd. | 1,370,500 | | 4,549,023 |
Harmony Gold Mining Co. Ltd. | 435,600 | | 3,568,840 |
Holdsport Ltd. | 80,000 | | 415,194 |
Kagiso Media Ltd. | 123,000 | | 283,716 |
Massmart Holdings Ltd. | 81,300 | | 1,635,255 |
MTN Group Ltd. | 610,950 | | 11,016,002 |
Nampak Ltd. | 689,600 | | 2,298,494 |
Naspers Ltd. Class N | 39,600 | | 2,570,884 |
Omnia Holdings Ltd. | 26,000 | | 384,873 |
Pinnacle Technology Holdings Ltd. | 218,800 | | 432,773 |
Pioneer Foods Ltd. | 172,000 | | 1,100,956 |
Rand Merchant Insurance Holdings Ltd. | 120,900 | | 315,265 |
Raubex Group Ltd. | 1,475,600 | | 2,808,025 |
RMB Holdings Ltd. | 286,500 | | 1,256,937 |
Sanlam Ltd. | 381,900 | | 1,705,868 |
Sasol Ltd. | 77,900 | | 3,318,546 |
Shoprite Holdings Ltd. | 111,100 | | 2,284,619 |
Standard Bank Group Ltd. | 419,763 | | 5,185,403 |
Vodacom Group Ltd. | 239,600 | | 3,020,336 |
Wilson Bayly Holmes-Ovcon Ltd. | 27,700 | | 453,965 |
TOTAL SOUTH AFRICA | | 59,565,307 |
Turkey - 6.4% |
Aygaz A/S | 159,000 | | 732,686 |
Koc Holding A/S | 143,850 | | 675,714 |
Turk Telekomunikasyon A/S | 324,100 | | 1,265,662 |
Turkiye Garanti Bankasi A/S | 984,000 | | 4,699,046 |
Turkiye Petrol Rafinerile A/S | 68,000 | | 1,661,590 |
TOTAL TURKEY | | 9,034,698 |
Common Stocks - continued |
| Shares | | Value |
United Arab Emirates - 5.1% |
Agthia Group PJSC | 734,869 | | $ 390,143 |
Aldar Properties PJSC (a) | 1,587,210 | | 587,696 |
Dubai Financial Market PJSC (a) | 5,815,429 | | 1,599,124 |
Emaar Properties (a) | 330,000 | | 324,340 |
Emirates NBD Bank PJSC | 396,999 | | 311,287 |
First Gulf Bank PJSC | 1,093,458 | | 3,110,982 |
National Bank of Abu Dhabi PJSC (a) | 156,000 | | 420,474 |
NMC Health PLC | 160,300 | | 468,218 |
TOTAL UNITED ARAB EMIRATES | | 7,212,264 |
United Kingdom - 0.7% |
Tullow Oil PLC | 40,500 | | 917,611 |
Zambia - 0.4% |
Zambeef Products PLC | 997,525 | | 509,548 |
TOTAL COMMON STOCKS (Cost $128,358,203) |
130,472,172
|
Nonconvertible Preferred Stocks - 2.6% |
| | | |
Russia - 2.6% |
Surgutneftegaz JSC
(Cost $3,238,242) | 5,826,700 | |
3,608,911
|
Nonconvertible Bonds - 0.3% |
| Principal Amount | | |
Multi-National - 0.3% |
International Bank for Reconstruction & Development 8.2% 12/12/12
(Cost $510,799) | NGN | 80,000,000 | |
501,719
|
Government Obligations - 0.3% |
|
Ghana - 0.3% |
Ghana Republic 14.99% 3/11/13
(Cost $672,328) | GHS | 950,000 | |
495,198
|
Money Market Funds - 3.4% |
| Shares | | Value |
Fidelity Cash Central Fund, 0.19% (b)
(Cost $4,780,137) | 4,780,137 | | $ 4,780,137 |
TOTAL INVESTMENT PORTFOLIO - 99.5% (Cost $137,559,709) | | 139,858,137 |
NET OTHER ASSETS (LIABILITIES) - 0.5% | | 649,226 |
NET ASSETS - 100% | $ 140,507,363 |
Currency Abbreviations |
GHS | - | Ghana Cedi |
NGN | - | Nigerian naira |
Legend |
(a) Non-income producing |
(b) Affiliated fund that is available only to investment companies and other accounts managed by Fidelity Investments. The rate quoted is the annualized seven-day yield of the fund at period end. A complete unaudited listing of the fund's holdings as of its most recent quarter end is available upon request. In addition, each Fidelity Central Fund's financial statements, which are not covered by the Fund's Report of Independent Registered Public Accounting Firm, are available on the SEC's website or upon request. |
Affiliated Central Funds |
Information regarding fiscal year to date income earned by the Fund from investments in Fidelity Central Funds is as follows: |
Fund | Income earned |
Fidelity Cash Central Fund | $ 1,816 |
Fidelity Securities Lending Cash Central Fund | 2,270 |
Total | $ 4,086 |
Other Information |
Categorizations in the Schedule of Investments are based on country or territory of incorporation. |
The following is a summary of the inputs used, as of October 31, 2012, involving the Fund's assets and liabilities carried at fair value. The inputs or methodology used for valuing securities may not be an indication of the risk associated with investing in those securities. For more information on valuation inputs, and their aggregation into the levels used in the table below, please refer to the Security Valuation section in the accompanying Notes to Financial Statements. |
Valuation Inputs at Reporting Date: |
Description | Total | Level 1 | Level 2 | Level 3 |
Investments in Securities: | | | | |
Equities: | | | | |
Consumer Discretionary | $ 4,309,093 | $ 4,309,093 | $ - | $ - |
Consumer Staples | 13,195,661 | 13,195,661 | - | - |
Energy | 36,850,792 | 33,532,246 | 3,318,546 | - |
Financials | 38,944,085 | 38,944,085 | - | - |
Health Care | 2,236,159 | 2,236,159 | - | - |
Industrials | 4,923,542 | 4,923,542 | - | - |
Information Technology | 432,773 | 432,773 | - | - |
Materials | 13,584,412 | 6,485,060 | 7,099,352 | - |
Telecommunication Services | 18,871,880 | 18,871,880 | - | - |
Utilities | 732,686 | 732,686 | - | - |
Corporate Bonds | 501,719 | - | 501,719 | - |
Government Obligations | 495,198 | - | 495,198 | - |
Money Market Funds | 4,780,137 | 4,780,137 | - | - |
Total Investments in Securities: | $ 139,858,137 | $ 128,443,322 | $ 11,414,815 | $ - |
See accompanying notes which are an integral part of the financial statements.
Annual Report
Statement of Assets and Liabilities
| October 31, 2012 |
| | |
Assets | | |
Investment in securities, at value - See accompanying schedule: Unaffiliated issuers (cost $132,779,572) | $ 135,078,000 | |
Fidelity Central Funds (cost $4,780,137) | 4,780,137 | |
Total Investments (cost $137,559,709) | | $ 139,858,137 |
Foreign currency held at value (cost $4) | | 4 |
Receivable for investments sold | | 932,927 |
Receivable for fund shares sold | | 236,104 |
Dividends receivable | | 137,560 |
Interest receivable | | 46,891 |
Distributions receivable from Fidelity Central Funds | | 384 |
Other receivables | | 20,009 |
Total assets | | 141,232,016 |
| | |
Liabilities | | |
Payable to custodian bank | $ 173,955 | |
Payable for investments purchased | 203,317 | |
Payable for fund shares redeemed | 116,731 | |
Accrued management fee | 94,834 | |
Distribution and service plan fees payable | 10,112 | |
Other affiliated payables | 40,250 | |
Other payables and accrued expenses | 85,454 | |
Total liabilities | | 724,653 |
| | |
Net Assets | | $ 140,507,363 |
Net Assets consist of: | | |
Paid in capital | | $ 137,298,110 |
Undistributed net investment income | | 2,631,143 |
Accumulated undistributed net realized gain (loss) on investments and foreign currency transactions | | (1,720,590) |
Net unrealized appreciation (depreciation) on investments and assets and liabilities in foreign currencies | | 2,298,700 |
Net Assets | | $ 140,507,363 |
See accompanying notes which are an integral part of the financial statements.
Annual Report
Financial Statements - continued
Statement of Assets and Liabilities - continued
| October 31, 2012 |
| | |
Calculation of Maximum Offering Price Class A:
Net Asset Value and redemption price per share ($8,933,695 ÷ 1,025,317 shares) | | $ 8.71 |
| | |
Maximum offering price per share (100/94.25 of $8.71) | | $ 9.24 |
Class T:
Net Asset Value and redemption price per share ($3,335,630 ÷ 384,126 shares) | | $ 8.68 |
| | |
Maximum offering price per share (100/96.50 of $8.68) | | $ 8.99 |
Class B:
Net Asset Value and offering price per share ($441,311 ÷ 50,760 shares)A | | $ 8.69 |
| | |
Class C:
Net Asset Value and offering price per share ($7,769,597 ÷ 901,585 shares)A | | $ 8.62 |
| | |
| | |
Emerging Europe, Middle East, Africa (EMEA):
Net Asset Value, offering price and redemption price per share ($111,441,166 ÷ 12,742,737 shares) | | $ 8.75 |
| | |
Institutional Class:
Net Asset Value, offering price and redemption price per share ($8,585,964 ÷ 981,532 shares) | | $ 8.75 |
A Redemption price per share is equal to net asset value less any applicable contingent deferred sales charge.
See accompanying notes which are an integral part of the financial statements.
Annual Report
Statement of Operations
| Year ended October 31, 2012 |
| | |
Investment Income | | |
Dividends | | $ 5,662,084 |
Interest | | 119,997 |
Income from Fidelity Central Funds | | 4,086 |
Income before foreign taxes withheld | | 5,786,167 |
Less foreign taxes withheld | | (570,242) |
Total income | | 5,215,925 |
| | |
Expenses | | |
Management fee | $ 1,144,017 | |
Transfer agent fees | 410,177 | |
Distribution and service plan fees | 121,246 | |
Accounting and security lending fees | 73,383 | |
Custodian fees and expenses | 162,444 | |
Independent trustees' compensation | 932 | |
Registration fees | 80,566 | |
Audit | 61,768 | |
Legal | 700 | |
Miscellaneous | 1,543 | |
Total expenses before reductions | 2,056,776 | |
Expense reductions | (39,356) | 2,017,420 |
Net investment income (loss) | | 3,198,505 |
Realized and Unrealized Gain (Loss) Net realized gain (loss) on: | | |
Investment securities: | | |
Unaffiliated issuers | 10,659,509 | |
Foreign currency transactions | (146,089) | |
Total net realized gain (loss) | | 10,513,420 |
Change in net unrealized appreciation (depreciation) on: Investment securities | (5,473,687) | |
Assets and liabilities in foreign currencies | 2,731 | |
Total change in net unrealized appreciation (depreciation) | | (5,470,956) |
Net gain (loss) | | 5,042,464 |
Net increase (decrease) in net assets resulting from operations | | $ 8,240,969 |
See accompanying notes which are an integral part of the financial statements.
Annual Report
Financial Statements - continued
Statement of Changes in Net Assets
| Year ended
October 31,
2012 | Year ended
October 31,
2011 |
Increase (Decrease) in Net Assets | | |
Operations | | |
Net investment income (loss) | $ 3,198,505 | $ 3,341,999 |
Net realized gain (loss) | 10,513,420 | 3,427,666 |
Change in net unrealized appreciation (depreciation) | (5,470,956) | (17,523,712) |
Net increase (decrease) in net assets resulting
from operations | 8,240,969 | (10,754,047) |
Distributions to shareholders from net investment income | (2,782,952) | (1,835,361) |
Distributions to shareholders from net realized gain | - | (302,617) |
Total distributions | (2,782,952) | (2,137,978) |
Share transactions - net increase (decrease) | (7,689,254) | (11,096,734) |
Redemption fees | 36,290 | 119,309 |
Total increase (decrease) in net assets | (2,194,947) | (23,869,450) |
| | |
Net Assets | | |
Beginning of period | 142,702,310 | 166,571,760 |
End of period (including undistributed net investment income of $2,631,143 and undistributed net investment income of $2,747,743, respectively) | $ 140,507,363 | $ 142,702,310 |
See accompanying notes which are an integral part of the financial statements.
Annual Report
Financial Highlights - Class A
Years ended October 31, | 2012 | 2011 | 2010 | 2009 | 2008 I |
Selected Per-Share Data | | | | | |
Net asset value, beginning of period | $ 8.34 | $ 8.97 | $ 7.26 | $ 4.75 | $ 10.00 |
Income from Investment Operations | | | | | |
Net investment income (loss) E | .18 | .16 H | .07 | .05 | .04 |
Net realized and unrealized gain (loss) | .34 | (.70) | 1.70 | 2.48 | (5.31) |
Total from investment operations | .52 | (.54) | 1.77 | 2.53 | (5.27) |
Distributions from net investment income | (.15) | (.08) | (.04) | (.03) | - |
Distributions from net realized gain | - | (.02) | (.02) | - | - |
Total distributions | (.15) | (.10) | (.07) L | (.03) | - |
Redemption fees added to paid in capital E | - K | .01 | .01 | .01 | .02 |
Net asset value, end of period | $ 8.71 | $ 8.34 | $ 8.97 | $ 7.26 | $ 4.75 |
Total Return B, C, D | 6.38% | (6.05)% | 24.66% | 53.78% | (52.50)% |
Ratios to Average Net Assets F, J | | | | | |
Expenses before reductions | 1.62% | 1.60% | 1.69% | 1.87% | 2.50% A |
Expenses net of fee waivers, if any | 1.62% | 1.56% | 1.50% | 1.50% | 1.50% A |
Expenses net of all reductions | 1.60% | 1.51% | 1.38% | 1.39% | 1.23% A |
Net investment income (loss) | 2.09% | 1.70% H | .95% | .84% | 1.20% A |
Supplemental Data | | | | | |
Net assets, end of period (000 omitted) | $ 8,934 | $ 10,260 | $ 10,045 | $ 4,817 | $ 1,368 |
Portfolio turnover rate G | 30% | 53% | 96% | 58% | 68% |
A Annualized
B Total returns for periods of less than one year are not annualized.
C Total returns would have been lower if certain expenses had not been reduced during the applicable periods shown.
D Total returns do not include the effect of the sales charges.
E Calculated based on average shares outstanding during the period.
F Fees and expenses of any underlying Fidelity Central Funds are not included in the Fund's expense ratio. The Fund indirectly bears its proportionate share of the expenses of any underlying Fidelity Central Funds.
G Amount does not include the portfolio activity of any underlying Fidelity Central Funds.
H Investment income per share reflects a large, non-recurring dividend which amounted to $.04 per share. Excluding this non-recurring dividend, the ratio of net investment income (loss) to average net assets would have been 1.25%.
I For the period May 8, 2008 (commencement of operations) to October 31, 2008.
J Expense ratios reflect operating expenses of the class. Expenses before reductions do not reflect amounts reimbursed by the investment adviser or reductions from brokerage service arrangements or reductions from other expense offset arrangements and do not represent the amount paid by the class during periods when reimbursements or reductions occur. Expense ratios before reductions for start-up periods may not be representative of longer-term operating periods. Expenses net of fee waivers reflect expenses after reimbursement by the investment adviser but prior to reductions from brokerage service arrangements or other expense offset arrangements. Expenses net of all reductions represent the net expenses paid by the class.
K Amount represents less than $.01 per share.
L Total distributions of $.07 per share is comprised of distributions from net investment income of $.041 and distributions from net realized gain of $.024 per share.
See accompanying notes which are an integral part of the financial statements.
Annual Report
Financial Highlights - Class T
Years ended October 31, | 2012 | 2011 | 2010 | 2009 | 2008 I |
Selected Per-Share Data | | | | | |
Net asset value, beginning of period | $ 8.31 | $ 8.96 | $ 7.25 | $ 4.75 | $ 10.00 |
Income from Investment Operations | | | | | |
Net investment income (loss) E | .15 | .13 H | .06 | .04 | .04 |
Net realized and unrealized gain (loss) | .35 | (.71) | 1.69 | 2.47 | (5.31) |
Total from investment operations | .50 | (.58) | 1.75 | 2.51 | (5.27) |
Distributions from net investment income | (.13) | (.07) | (.03) | (.02) | - |
Distributions from net realized gain | - | (.02) | (.02) | - | - |
Total distributions | (.13) | (.08) L | (.05) | (.02) | - |
Redemption fees added to paid in capital E | - K | .01 | .01 | .01 | .02 |
Net asset value, end of period | $ 8.68 | $ 8.31 | $ 8.96 | $ 7.25 | $ 4.75 |
Total Return B, C, D | 6.14% | (6.42)% | 24.44% | 53.20% | (52.50)% |
Ratios to Average Net Assets F, J | | | | | |
Expenses before reductions | 1.89% | 1.87% | 1.95% | 2.15% | 2.78% A |
Expenses net of fee waivers, if any | 1.89% | 1.84% | 1.75% | 1.75% | 1.75% A |
Expenses net of all reductions | 1.86% | 1.78% | 1.62% | 1.64% | 1.49% A |
Net investment income (loss) | 1.82% | 1.42% H | .70% | .59% | .95% A |
Supplemental Data | | | | | |
Net assets, end of period (000 omitted) | $ 3,336 | $ 3,502 | $ 3,114 | $ 1,560 | $ 568 |
Portfolio turnover rate G | 30% | 53% | 96% | 58% | 68% |
A Annualized
B Total returns for periods of less than one year are not annualized.
C Total returns would have been lower if certain expenses had not been reduced during the applicable periods shown.
D Total returns do not include the effect of the sales charges.
E Calculated based on average shares outstanding during the period.
F Fees and expenses of any underlying Fidelity Central Funds are not included in the Fund's expense ratio. The Fund indirectly bears its proportionate share of the expenses of any underlying Fidelity Central Funds.
G Amount does not include the portfolio activity of any underlying Fidelity Central Funds.
H Investment income per share reflects a large, non-recurring dividend which amounted to $.04 per share. Excluding this non-recurring dividend, the ratio of net investment income (loss) to average net assets would have been .98%.
I For the period May 8, 2008 (commencement of operations) to October 31, 2008.
J Expense ratios reflect operating expenses of the class. Expenses before reductions do not reflect amounts reimbursed by the investment adviser or reductions from brokerage service arrangements or reductions from other expense offset arrangements and do not represent the amount paid by the class during periods when reimbursements or reductions occur. Expense ratios before reductions for start-up periods may not be representative of longer-term operating periods. Expenses net of fee waivers reflect expenses after reimbursement by the investment adviser but prior to reductions from brokerage service arrangements or other expense offset arrangements. Expenses net of all reductions represent the net expenses paid by the class.
K Amount represents less than $.01 per share.
L Total distributions of $.08 per share is comprised of distributions from net investment income of $.068 and distributions from net realized gain of $.015 per share.
See accompanying notes which are an integral part of the financial statements.
Annual Report
Financial Highlights - Class B
Years ended October 31, | 2012 | 2011 | 2010 | 2009 | 2008 I |
Selected Per-Share Data | | | | | |
Net asset value, beginning of period | $ 8.29 | $ 8.93 | $ 7.23 | $ 4.73 | $ 10.00 |
Income from Investment Operations | | | | | |
Net investment income (loss) E | .11 | .09 H | .02 | .01 | .02 |
Net realized and unrealized gain (loss) | .35 | (.71) | 1.68 | 2.48 | (5.31) |
Total from investment operations | .46 | (.62) | 1.70 | 2.49 | (5.29) |
Distributions from net investment income | (.06) | (.02) | - | - | - |
Distributions from net realized gain | - | (.01) | (.01) | - | - |
Total distributions | (.06) | (.03) | (.01) | - | - |
Redemption fees added to paid in capital E | - K | .01 | .01 | .01 | .02 |
Net asset value, end of period | $ 8.69 | $ 8.29 | $ 8.93 | $ 7.23 | $ 4.73 |
Total Return B, C, D | 5.56% | (6.85)% | 23.72% | 52.85% | (52.70)% |
Ratios to Average Net Assets F, J | | | | | |
Expenses before reductions | 2.38% | 2.37% | 2.47% | 2.68% | 3.32% A |
Expenses net of fee waivers, if any | 2.38% | 2.33% | 2.25% | 2.25% | 2.25% A |
Expenses net of all reductions | 2.35% | 2.27% | 2.12% | 2.14% | 1.99% A |
Net investment income (loss) | 1.33% | .93% H | .20% | .09% | .45% A |
Supplemental Data | | | | | |
Net assets, end of period (000 omitted) | $ 441 | $ 539 | $ 822 | $ 782 | $ 487 |
Portfolio turnover rate G | 30% | 53% | 96% | 58% | 68% |
A Annualized
B Total returns for periods of less than one year are not annualized.
C Total returns would have been lower if certain expenses had not been reduced during the applicable periods shown.
D Total returns do not include the effect of the contingent deferred sales charge.
E Calculated based on average shares outstanding during the period.
F Fees and expenses of any underlying Fidelity Central Funds are not included in the Fund's expense ratio. The Fund indirectly bears its proportionate share of the expenses of any underlying Fidelity Central Funds.
G Amount does not include the portfolio activity of any underlying Fidelity Central Funds.
H Investment income per share reflects a large, non-recurring dividend which amounted to $.04 per share. Excluding this non-recurring dividend, the ratio of net investment income (loss) to average net assets would have been .49%.
I For the period May 8, 2008 (commencement of operations) to October 31, 2008.
J Expense ratios reflect operating expenses of the class. Expenses before reductions do not reflect amounts reimbursed by the investment adviser or reductions from brokerage service arrangements or reductions from other expense offset arrangements and do not represent the amount paid by the class during periods when reimbursements or reductions occur. Expense ratios before reductions for start-up periods may not be representative of longer-term operating periods. Expenses net of fee waivers reflect expenses after reimbursement by the investment adviser but prior to reductions from brokerage service arrangements or other expense offset arrangements. Expenses net of all reductions represent the net expenses paid by the class.
K Amount represents less than $.01 per share.
See accompanying notes which are an integral part of the financial statements.
Annual Report
Financial Highlights - Class C
Years ended October 31, | 2012 | 2011 | 2010 | 2009 | 2008 I |
Selected Per-Share Data | | | | | |
Net asset value, beginning of period | $ 8.24 | $ 8.90 | $ 7.23 | $ 4.73 | $ 10.00 |
Income from Investment Operations | | | | | |
Net investment income (loss) E | .11 | .08 H | .02 | .01 | .02 |
Net realized and unrealized gain (loss) | .35 | (.69) | 1.67 | 2.48 | (5.31) |
Total from investment operations | .46 | (.61) | 1.69 | 2.49 | (5.29) |
Distributions from net investment income | (.08) | (.05) | (.01) | - | - |
Distributions from net realized gain | - | (.02) | (.02) | - | - |
Total distributions | (.08) | (.06) L | (.03) | - | - |
Redemption fees added to paid in capital E | - K | .01 | .01 | .01 | .02 |
Net asset value, end of period | $ 8.62 | $ 8.24 | $ 8.90 | $ 7.23 | $ 4.73 |
Total Return B, C, D | 5.68% | (6.79)% | 23.61% | 52.85% | (52.70)% |
Ratios to Average Net Assets F, J | | | | | |
Expenses before reductions | 2.37% | 2.36% | 2.45% | 2.61% | 3.28% A |
Expenses net of fee waivers, if any | 2.37% | 2.33% | 2.25% | 2.25% | 2.25% A |
Expenses net of all reductions | 2.35% | 2.27% | 2.13% | 2.14% | 1.99% A |
Net investment income (loss) | 1.34% | .93% H | .20% | .09% | .45% A |
Supplemental Data | | | | | |
Net assets, end of period (000 omitted) | $ 7,770 | $ 6,650 | $ 5,151 | $ 2,677 | $ 741 |
Portfolio turnover rate G | 30% | 53% | 96% | 58% | 68% |
A Annualized
B Total returns for periods of less than one year are not annualized.
C Total returns would have been lower if certain expenses had not been reduced during the applicable periods shown.
D Total returns do not include the effect of the contingent deferred sales charge.
E Calculated based on average shares outstanding during the period.
F Fees and expenses of any underlying Fidelity Central Funds are not included in the Fund's expense ratio. The Fund indirectly bears its proportionate share of the expenses of any underlying Fidelity Central Funds.
G Amount does not include the portfolio activity of any underlying Fidelity Central Funds.
H Investment income per share reflects a large, non-recurring dividend which amounted to $.04 per share. Excluding this non-recurring dividend, the ratio of net investment income (loss) to average net assets would have been .49%.
I For the period May 8, 2008 (commencement of operations) to October 31, 2008.
J Expense ratios reflect operating expenses of the class. Expenses before reductions do not reflect amounts reimbursed by the investment adviser or reductions from brokerage service arrangements or reductions from other expense offset arrangements and do not represent the amount paid by the class during periods when reimbursements or reductions occur. Expense ratios before reductions for start-up periods may not be representative of longer-term operating periods. Expenses net of fee waivers reflect expenses after reimbursement by the investment adviser but prior to reductions from brokerage service arrangements or other expense offset arrangements. Expenses net of all reductions represent the net expenses paid by the class.
K Amount represents less than $.01 per share.
L Total distributions of $.06 per share is comprised of distributions from net investment income of $.047 and distributions from net realized gain of $.015 per share.
See accompanying notes which are an integral part of the financial statements.
Annual Report
Financial Highlights - Emerging Europe, Middle East, Africa (EMEA)
Years ended October 31, | 2012 | 2011 | 2010 | 2009 | 2008 H |
Selected Per-Share Data | | | | | |
Net asset value, beginning of period | $ 8.37 | $ 9.00 | $ 7.28 | $ 4.76 | $ 10.00 |
Income from Investment Operations | | | | | |
Net investment income (loss) D | .20 | .18 G | .09 | .07 | .05 |
Net realized and unrealized gain (loss) | .35 | (.71) | 1.70 | 2.48 | (5.31) |
Total from investment operations | .55 | (.53) | 1.79 | 2.55 | (5.26) |
Distributions from net investment income | (.17) | (.09) | (.05) | (.04) | - |
Distributions from net realized gain | - | (.02) | (.02) | - | - |
Total distributions | (.17) | (.11) | (.08) K | (.04) | - |
Redemption fees added to paid in capital D | - J | .01 | .01 | .01 | .02 |
Net asset value, end of period | $ 8.75 | $ 8.37 | $ 9.00 | $ 7.28 | $ 4.76 |
Total Return B, C | 6.81% | (5.91)% | 24.92% | 54.15% | (52.40)% |
Ratios to Average Net Assets E, I | | | | | |
Expenses before reductions | 1.37% | 1.35% | 1.45% | 1.61% | 2.19% A |
Expenses net of fee waivers, if any | 1.37% | 1.31% | 1.25% | 1.25% | 1.25% A |
Expenses net of all reductions | 1.34% | 1.25% | 1.12% | 1.14% | .98% A |
Net investment income (loss) | 2.34% | 1.95% G | 1.21% | 1.09% | 1.45% A |
Supplemental Data | | | | | |
Net assets, end of period (000 omitted) | $ 111,441 | $ 114,117 | $ 140,270 | $ 104,141 | $ 32,535 |
Portfolio turnover rate F | 30% | 53% | 96% | 58% | 68% |
A Annualized
B Total returns for periods of less than one year are not annualized.
C Total returns would have been lower if certain expenses had not been reduced during the applicable periods shown.
D Calculated based on average shares outstanding during the period.
E Fees and expenses of any underlying Fidelity Central Funds are not included in the Fund's expense ratio. The Fund indirectly bears its proportionate share of the expenses of any underlying Fidelity Central Funds.
F Amount does not include the portfolio activity of any underlying Fidelity Central Funds.
G Investment income per share reflects a large, non-recurring dividend which amounted to $.04 per share. Excluding this non-recurring dividend, the ratio of net investment income (loss) to average net assets would have been 1.51%.
H For the period May 8, 2008 (commencement of operations) to October 31, 2008.
I Expense ratios reflect operating expenses of the class. Expenses before reductions do not reflect amounts reimbursed by the investment adviser or reductions from brokerage service arrangements or reductions from other expense offset arrangements and do not represent the amount paid by the class during periods when reimbursements or reductions occur. Expense ratios before reductions for start-up periods may not be representative of longer-term operating periods. Expenses net of fee waivers reflect expenses after reimbursement by the investment adviser but prior to reductions from brokerage service arrangements or other expense offset arrangements. Expenses net of all reductions represent the net expenses paid by the class.
J Amount represents less than $.01 per share.
K Total distributions of $.08 per share is comprised of distributions from net investment income of $.052 and distributions from net realized gain of $.024 per share.
See accompanying notes which are an integral part of the financial statements.
Annual Report
Financial Highlights - Institutional Class
Years ended October 31, | 2012 | 2011 | 2010 | 2009 | 2008 H |
Selected Per-Share Data | | | | | |
Net asset value, beginning of period | $ 8.37 | $ 9.00 | $ 7.28 | $ 4.76 | $ 10.00 |
Income from Investment Operations | | | | | |
Net investment income (loss) D | .21 | .19 G | .09 | .06 | .05 |
Net realized and unrealized gain (loss) | .35 | (.72) | 1.70 | 2.49 | (5.31) |
Total from investment operations | .56 | (.53) | 1.79 | 2.55 | (5.26) |
Distributions from net investment income | (.18) | (.09) | (.05) | (.04) | - |
Distributions from net realized gain | - | (.02) | (.02) | - | - |
Total distributions | (.18) | (.11) | (.08) K | (.04) | - |
Redemption fees added to paid in capital D | - J | .01 | .01 | .01 | .02 |
Net asset value, end of period | $ 8.75 | $ 8.37 | $ 9.00 | $ 7.28 | $ 4.76 |
Total Return B, C | 6.93% | (5.91)% | 24.95% | 54.15% | (52.40)% |
Ratios to Average Net Assets E, I | | | | | |
Expenses before reductions | 1.28% | 1.26% | 1.34% | 1.60% | 2.12% A |
Expenses net of fee waivers, if any | 1.28% | 1.24% | 1.25% | 1.25% | 1.25% A |
Expenses net of all reductions | 1.25% | 1.19% | 1.13% | 1.14% | .98% A |
Net investment income (loss) | 2.43% | 2.02% G | 1.20% | 1.09% | 1.46% A |
Supplemental Data | | | | | |
Net assets, end of period (000 omitted) | $ 8,586 | $ 7,633 | $ 7,171 | $ 4,235 | $ 2,695 |
Portfolio turnover rate F | 30% | 53% | 96% | 58% | 68% |
A Annualized
B Total returns for periods of less than one year are not annualized.
C Total returns would have been lower if certain expenses had not been reduced during the applicable periods shown.
D Calculated based on average shares outstanding during the period.
E Fees and expenses of any underlying Fidelity Central Funds are not included in the Fund's expense ratio. The Fund indirectly bears its proportionate share of the expenses of any underlying Fidelity Central Funds.
F Amount does not include the portfolio activity of any underlying Fidelity Central Funds.
G Investment income per share reflects a large, non-recurring dividend which amounted to $.04 per share. Excluding this non-recurring dividend, the ratio of net investment income (loss) to average net assets would have been 1.58%.
H For the period May 8, 2008 (commencement of operations) to October 31, 2008.
I Expense ratios reflect operating expenses of the class. Expenses before reductions do not reflect amounts reimbursed by the investment adviser or reductions from brokerage service arrangements or reductions from other expense offset arrangements and do not represent the amount paid by the class during periods when reimbursements or reductions occur. Expense ratios before reductions for start-up periods may not be representative of longer-term operating periods. Expenses net of fee waivers reflect expenses after reimbursement by the investment adviser but prior to reductions from brokerage service arrangements or other expense offset arrangements. Expenses net of all reductions represent the net expenses paid by the class.
J Amount represents less than $.01 per share.
K Total distributions of $.08 per share is comprised of distributions from net investment income of $.054 and distributions from net realized gain of $.024 per share.
See accompanying notes which are an integral part of the financial statements.
Annual Report
Notes to Financial Statements
For the period ended October 31, 2012
1. Organization.
Fidelity Emerging Europe, Middle East, Africa (EMEA) Fund (the Fund) is a non-diversified fund of Fidelity Investment Trust (the Trust) and is authorized to issue an unlimited number of shares. The Trust is registered under the Investment Company Act of 1940, as amended (the 1940 Act), as an open-end management investment company organized as a Massachusetts business trust. The Fund offers Class A, Class T, Class C, Emerging Europe, Middle East, Africa (EMEA)and Institutional Class shares, each of which, along with Class B shares, has equal rights as to assets and voting privileges. Effective after the close of business on September 1, 2010, Class B shares were closed to new accounts and additional purchases, except for exchanges and reinvestments. Each class has exclusive voting rights with respect to matters that affect that class. Class B shares will automatically convert to Class A shares after a holding period of seven years from the initial date of purchase. Investment income, realized and unrealized capital gains and losses, the common expenses of the Fund, and certain fund-level expense reductions, if any, are allocated on a pro-rata basis to each class based on the relative net assets of each class to the total net assets of the Fund. Each class differs with respect to transfer agent and distribution and service plan fees incurred. Certain expense reductions may also differ by class. The Fund's investments in emerging markets can be subject to social, economic, regulatory, and political uncertainties and can be extremely volatile.
2. Investments in Fidelity Central Funds.
The Fund invests in Fidelity Central Funds, which are open-end investment companies available only to other investment companies and accounts managed by Fidelity Management & Research Company (FMR) and its affiliates. The Fund's Schedule of Investments lists each of the Fidelity Central Funds held as of period end, if any, as an investment of the Fund, but does not include the underlying holdings of each Fidelity Central Fund. As an Investing Fund, the Fund indirectly bears its proportionate share of the expenses of the underlying Fidelity Central Funds.
The Money Market Central Funds seek preservation of capital and current income and are managed by Fidelity Investments Money Management, Inc. (FIMM), an affiliate of FMR.
A complete unaudited list of holdings for each Fidelity Central Fund is available upon request or at the Securities and Exchange Commission (the SEC) web site at www.sec.gov. In addition, the financial statements of the Fidelity Central Funds, which are not covered by the Fund's Report of Independent Registered Public Accounting Firm, are available on the SEC web site or upon request.
Annual Report
3. Significant Accounting Policies.
The financial statements have been prepared in conformity with accounting principles generally accepted in the United States of America (GAAP), which require management to make certain estimates and assumptions at the date of the financial statements. Actual results could differ from those estimates. Subsequent events, if any, through the date that the financial statements were issued have been evaluated in the preparation of the financial statements. The following summarizes the significant accounting policies of the Fund:
Security Valuation. Investments are valued as of 4:00 p.m. Eastern time on the last calendar day of the period. In accordance with valuation policies and procedures approved by the Board of Trustees (the Board), the Fund attempts to obtain prices from one or more third party pricing vendors or brokers to value its investments. When current market prices, quotations or rates are not readily available or reliable, securities will be fair valued in good faith by the FMR Fair Value Committee (the Committee), in accordance with procedures adopted by the Fund's Board. Factors used in determining fair value vary by security type and may include market or security specific events, changes in interest rates and credit quality. The frequency with which these procedures are used cannot be predicted and they may be utilized to a significant extent. The Committee oversees the Fund's valuation policies and procedures and is responsible for approving and reporting to the Board all fair value determinations.
The Fund categorizes the inputs to valuation techniques used to value its investments into a disclosure hierarchy consisting of three levels as shown below:
Level 1 - quoted prices in active markets for identical investments
Level 2 - other significant observable inputs (including quoted prices for similar investments, interest rates, prepayment speeds, etc.)
Level 3 - unobservable inputs (including the Fund's own assumptions based on the best information available)
Valuation techniques used to value the Fund's investments by major category are as follows:
Equity securities, including restricted securities, for which market quotations are readily available, are valued at the last reported sale price or official closing price as reported by a third party pricing vendor on the primary market or exchange on which they are traded and are categorized as Level 1 in the hierarchy. In the event there were no sales during the day or closing prices are not available, securities are valued at the last quoted bid price or may be valued using the last available price and are generally categorized as Level 2 in the hierarchy. For foreign equity securities, when significant market or security specific events arise, comparisons to the valuation of American Depositary Receipts
Annual Report
Notes to Financial Statements - continued
3. Significant Accounting Policies - continued
Security Valuation - continued
(ADRs), futures contracts, Exchange-Traded Funds (ETFs) and certain indexes as well as quoted prices for similar securities are used and are categorized as Level 2 in the hierarchy. Utilizing these techniques may result in transfers between Level 1 and Level 2.
Debt securities, including restricted securities, are valued based on evaluated prices received from third party pricing vendors or from brokers who make markets in such securities. For corporate bonds and foreign government and government agency obligations, pricing vendors utilize matrix pricing which considers yield or price of bonds of comparable quality, coupon, maturity and type as well as broker-supplied prices and are generally categorized as Level 2 in the hierarchy.
When independent prices are unavailable or unreliable, debt securities may be valued utilizing pricing methodologies which consider similar factors that would be used by third party pricing vendors. These are generally categorized as Level 2 in the hierarchy but may be Level 3 depending on the circumstances.
Investments in open-end mutual funds, including the Fidelity Central Funds, are valued at their closing net asset value (NAV) each business day and are categorized as Level 1 in the hierarchy.
Changes in valuation techniques may result in transfers in or out of an assigned level within the disclosure hierarchy. The aggregate value of investments by input level, as of October 31, 2012, is included at the end of the Fund's Schedule of Investments.
Foreign Currency Translation. The Fund may use foreign currency contracts to facilitate transactions in foreign-denominated securities. Gains and losses from these transactions may arise from changes in the value of the foreign currency or if the counterparties do not perform under the contracts' terms.
Foreign-denominated assets, including investment securities, and liabilities are translated into U.S. dollars at the exchange rates at period end. Purchases and sales of investment securities, income and dividends received and expenses denominated in foreign currencies are translated into U.S. dollars at the exchange rate in effect on the transaction date.
The effects of exchange rate fluctuations on investments are included with the net realized and unrealized gain (loss) on investment securities. Other foreign currency transactions resulting in realized and unrealized gain (loss) are disclosed separately.
Investment Transactions and Income. For financial reporting purposes, the Fund's investment holdings and NAV include trades executed through the end of the last business day of the period. The NAV per share for processing shareholder transactions is
Annual Report
3. Significant Accounting Policies - continued
Investment Transactions and Income - continued
calculated as of the close of business of the New York Stock Exchange (NYSE), normally 4:00 p.m. Eastern time and includes trades executed through the end of the prior business day. Gains and losses on securities sold are determined on the basis of identified cost. Dividend income is recorded on the ex-dividend date, except for certain dividends from foreign securities where the ex-dividend date may have passed, which are recorded as soon as the Fund is informed of the ex-dividend date. Non-cash dividends included in dividend income, if any, are recorded at the fair market value of the securities received. Interest income and distributions from the Fidelity Central Funds are accrued as earned. Interest income includes coupon interest and amortization of premium and accretion of discount on debt securities. Investment income is recorded net of foreign taxes withheld where recovery of such taxes is uncertain.
Expenses. Expenses directly attributable to a fund are charged to that fund. Expenses attributable to more than one fund are allocated among the respective funds on the basis of relative net assets or other appropriate methods. Expense estimates are accrued in the period to which they relate and adjustments are made when actual amounts are known.
Income Tax Information and Distributions to Shareholders. Each year, the Fund intends to qualify as a regulated investment company under Subchapter M of the Internal Revenue Code, including distributing substantially all of its taxable income and realized gains. As a result, no provision for income taxes is required. As of October 31, 2012, the Fund did not have any unrecognized tax benefits in the financial statements; nor is the Fund aware of any tax positions for which it is reasonably possible that the total amounts of unrecognized tax benefits will significantly change in the next twelve months. The Fund files a U.S. federal tax return, in addition to state and local tax returns as required. A fund's federal income tax returns are subject to examination by the Internal Revenue Service (IRS) for a period of three fiscal years after they are filed. State and local tax returns may be subject to examination for an additional fiscal year depending on the jurisdiction. Foreign taxes are provided for based on the Fund's understanding of the tax rules and rates that exist in the foreign markets in which it invests.
Distributions are declared and recorded on the ex-dividend date. Income dividends and capital gain distributions are declared separately for each class. Income and capital gain distributions are determined in accordance with income tax regulations, which may differ from GAAP. In addition, the Fund claimed a portion of the payment made to redeeming shareholders as a distribution for income tax purposes.
Capital accounts within the financial statements are adjusted for permanent book-tax differences. These adjustments have no impact on net assets or the results of operations. Temporary book-tax differences will reverse in a subsequent period.
Annual Report
Notes to Financial Statements - continued
3. Significant Accounting Policies - continued
Income Tax Information and Distributions to Shareholders - continued
Book-tax differences are primarily due to foreign currency transactions, passive foreign investment companies (PFIC), capital loss carryforwards and losses deferred due to wash sales.
The federal tax cost of investment securities and unrealized appreciation (depreciation) as of period end were as follows:
Gross unrealized appreciation | $ 16,922,441 |
Gross unrealized depreciation | (15,370,673) |
Net unrealized appreciation (depreciation) on securities and other investments | $ 1,551,768 |
| |
Tax Cost | $ 138,306,369 |
The tax-based components of distributable earnings as of period end were as follows:
Undistributed ordinary income | $ 3,778,819 |
Capital loss carryforward | $ (2,121,605) |
Net unrealized appreciation (depreciation) | $ 1,552,040 |
Capital loss carryforwards are only available to offset future capital gains of the Fund to the extent provided by regulations and may be limited. Under the Regulated Investment Company Modernization Act of 2010 (the Act), the Fund is permitted to carry forward capital losses incurred in taxable years beginning after December 22, 2010 for an unlimited period and such capital losses are required to be used prior to any losses that expire. Capital loss carryforwards were as follows:
Fiscal year of expiration | |
2018 | $ (2,121,605) |
The tax character of distributions paid was as follows:
| October 31, 2012 | October 31, 2011 |
Ordinary Income | $ 2,782,952 | $ 2,137,978 |
Short-Term Trading (Redemption) Fees. Shares held by investors in the Fund less than 90 days are subject to a redemption fee equal to 1.50% of the net asset value of shares redeemed. All redemption fees, which reduce the proceeds of the shareholder redemption, are retained by the Fund and accounted for as an addition to paid in capital.
Annual Report
3. Significant Accounting Policies - continued
New Accounting Pronouncement. In December 2011, the Financial Accounting Standards Board issued Accounting Standard Update No. 2011-11, Disclosures about Offsetting Assets and Liabilities. The update creates new disclosure requirements requiring entities to disclose both gross and net information for derivatives and other financial instruments that are either offset in the Statement of Assets and Liabilities or subject to an enforceable master netting arrangement or similar agreement. The disclosure requirements are effective for annual reporting periods beginning on or after January 1, 2013, and interim periods within those annual periods. Management is currently evaluating the impact of the update's adoption on the Fund's financial statement disclosures.
4. Purchases and Sales of Investments.
Purchases and sales of securities, other than short-term securities, aggregated $42,139,137 and $54,373,981, respectively.
5. Fees and Other Transactions with Affiliates.
Management Fee. FMR and its affiliates provide the Fund with investment management related services for which the Fund pays a monthly management fee. The management fee is the sum of an individual fund fee rate that is based on an annual rate of .55% of the Fund's average net assets and an annualized group fee rate that averaged .26% during the period. The group fee rate is based upon the average net assets of all the mutual funds advised by FMR. The group fee rate decreases as assets under management increase and increases as assets under management decrease. For the period, the total annual management fee rate was .81% of the Fund's average net assets.
Distribution and Service Plan Fees. In accordance with Rule 12b-1 of the 1940 Act, the Fund has adopted separate Distribution and Service Plans for each class of shares. Certain classes pay Fidelity Distributors Corporation (FDC), an affiliate of FMR, separate Distribution and Service Fees, each of which is based on an annual percentage of each class' average net assets. In addition, FDC may pay financial intermediaries for selling shares of the Fund and providing shareholder support services. For the period, the Distribution and Service Fee rates, total fees and amounts retained by FDC were as follows:
| Distribution
Fee | Service
Fee | Total Fees | Retained
by FDC |
Class A | -% | .25% | $ 22,962 | $ 252 |
Class T | .25% | .25% | 17,208 | 64 |
Class B | .75% | .25% | 4,896 | 3,697 |
Class C | .75% | .25% | 76,180 | 10,823 |
| | | $ 121,246 | $ 14,836 |
Annual Report
Notes to Financial Statements - continued
5. Fees and Other Transactions with Affiliates - continued
Sales Load. FDC may receive a front-end sales charge of up to 5.75% for selling Class A shares and 3.50% for selling Class T shares, some of which is paid to financial intermediaries for selling shares of the Fund. Depending on the holding period, FDC may receive contingent deferred sales charges levied on Class A, Class T, Class B, and Class C redemptions. The deferred sales charges range from 5.00% to 1.00% for Class B shares, 1.00% for Class C shares, 1.00% for certain purchases of Class A shares and .25% for certain purchases of Class T shares.
For the period, sales charge amounts retained by FDC were as follows:
| Retained
by FDC |
Class A | $ 4,269 |
Class T | 1,365 |
Class B* | 2,582 |
Class C* | 2,232 |
| $ 10,448 |
* When Class B and Class C shares are initially sold, FDC pays commissions from its own resources to financial intermediaries through which the sales are made.
Transfer Agent Fees. Fidelity Investments Institutional Operations Company, Inc. (FIIOC), an affiliate of FMR, is the transfer, dividend disbursing and shareholder servicing agent for each class of the Fund. FIIOC receives account fees and asset-based fees that vary according to the account size and type of account of the shareholders of the respective classes of the Fund. FIIOC pays for typesetting, printing and mailing of shareholder reports, except proxy statements. For the period, transfer agent fees for each class were as follows:
| Amount | % of
Average
Net Assets |
Class A | $ 27,199 | .30 |
Class T | 10,795 | .31 |
Class B | 1,463 | .30 |
Class C | 22,681 | .30 |
Emerging Europe, Middle East, Africa (EMEA) | 331,681 | .29 |
Institutional Class | 16,358 | .20 |
| $ 410,177 | |
Accounting and Security Lending Fees. Fidelity Service Company, Inc. (FSC), an affiliate of FMR, maintains the Fund's accounting records. The accounting fee is based on the level of average net assets for each month. Under a separate contract, FSC administers the security lending program. The security lending fee is based on the number and duration of lending transactions.
Annual Report
6. Committed Line of Credit.
The Fund participates with other funds managed by FMR or an affiliate in a $4.25 billion credit facility (the "line of credit") to be utilized for temporary or emergency purposes to fund shareholder redemptions or for other short-term liquidity purposes. The Fund has agreed to pay commitment fees on its pro-rata portion of the line of credit, which amounted to $389 and is reflected in Miscellaneous expenses on the Statement of Operations. During the period, there were no borrowings on this line of credit.
7. Security Lending.
The Fund lends portfolio securities through a lending agent from time to time in order to earn additional income. For equity securities, a lending agent is used and may loan securities to certain qualified borrowers, including Fidelity Capital Markets (FCM), a broker-dealer affiliated with the Fund. On the settlement date of the loan, the Fund receives collateral (in the form of U.S. Treasury obligations, letters of credit and/or cash) against the loaned securities and maintains collateral in an amount not less than 100% of the market value of the loaned securities during the period of the loan. The market value of the loaned securities is determined at the close of business of the Fund and any additional required collateral is delivered to the Fund on the next business day. If the borrower defaults on its obligation to return the securities loaned because of insolvency or other reasons, a fund could experience delays and costs in recovering the securities loaned or in gaining access to the collateral. Any cash collateral received is invested in the Fidelity Securities Lending Cash Central Fund. At period end, there were no security loans outstanding. Security lending income represents the income earned on investing cash collateral, less rebates paid to borrowers and any lending agent fees associated with the loan, plus any premium payments received for lending certain types of securities. Security lending income is presented in the Statement of Operations as a component of income from Fidelity Central Funds. Total security lending income during the period amounted to $2,270. During the period, there were no securities loaned to FCM.
8. Expense Reductions.
Many of the brokers with whom FMR places trades on behalf of the Fund provided services to the Fund in addition to trade execution. These services included payments of certain expenses on behalf of the Fund totaling $39,356 for the period.
Annual Report
Notes to Financial Statements - continued
9. Distributions to Shareholders.
Distributions to shareholders of each class were as follows:
Years ended October 31, | 2012 | 2011 |
From net investment income | | |
Class A | $ 173,376 | $ 97,896 |
Class T | 52,030 | 26,168 |
Class B | 3,592 | 1,907 |
Class C | 61,819 | 32,267 |
Emerging Europe, Middle East, Africa (EMEA) | 2,310,485 | 1,585,636 |
Institutional Class | 181,650 | 91,487 |
Total | $ 2,782,952 | $ 1,835,361 |
From net realized gain | | |
Class A | $ - | $ 18,012 |
Class T | - | 5,690 |
Class B | - | 902 |
Class C | - | 9,924 |
Emerging Europe, Middle East, Africa (EMEA) | - | 253,422 |
Institutional Class | - | 14,667 |
Total | $ - | $ 302,617 |
10. Share Transactions.
Transactions for each class of shares were as follows:
| Shares | Dollars |
Years ended October 31, | 2012 | 2011 | 2012 | 2011 |
Class A | | | | |
Shares sold | 188,687 | 827,297 | $ 1,610,923 | $ 7,697,437 |
Reinvestment of distributions | 16,919 | 10,020 | 134,509 | 92,483 |
Shares redeemed | (411,198) | (725,856) | (3,440,999) | (6,651,188) |
Net increase (decrease) | (205,592) | 111,461 | $ (1,695,567) | $ 1,138,732 |
Class T | | | | |
Shares sold | 75,037 | 164,342 | $ 636,446 | $ 1,527,510 |
Reinvestment of distributions | 6,513 | 3,447 | 51,713 | 31,848 |
Shares redeemed | (118,919) | (94,003) | (995,876) | (862,784) |
Net increase (decrease) | (37,369) | 73,786 | $ (307,717) | $ 696,574 |
Class B | | | | |
Shares sold | 2,520 | 9,372 | $ 21,721 | $ 87,632 |
Reinvestment of distributions | 430 | 285 | 3,432 | 2,673 |
Shares redeemed | (17,241) | (36,653) | (147,235) | (325,442) |
Net increase (decrease) | (14,291) | (26,996) | $ (122,082) | $ (235,137) |
Annual Report
10. Share Transactions - continued
| Shares | Dollars |
Years ended October 31, | 2012 | 2011 | 2012 | 2011 |
Class C | | | | |
Shares sold | 337,293 | 438,284 | $ 2,767,333 | $ 4,066,195 |
Reinvestment of distributions | 7,082 | 4,100 | 56,016 | 37,820 |
Shares redeemed | (250,062) | (213,656) | (2,064,165) | (1,892,778) |
Net increase (decrease) | 94,313 | 228,728 | $ 759,184 | $ 2,211,237 |
Emerging Europe, Middle East, Africa (EMEA) | | | | |
Shares sold | 3,688,393 | 7,381,313 | $ 31,635,971 | $ 68,910,601 |
Reinvestment of distributions | 276,215 | 187,137 | 2,198,675 | 1,730,170 |
Shares redeemed | (4,854,267) | (9,520,946) | (40,803,317) | (86,802,311) |
Net increase (decrease) | (889,659) | (1,952,496) | $ (6,968,671) | $ (16,161,540) |
Institutional Class | | | | |
Shares sold | 336,442 | 597,666 | $ 2,842,158 | $ 5,560,036 |
Reinvestment of distributions | 5,723 | 1,263 | 45,553 | 11,681 |
Shares redeemed | (272,120) | (484,423) | (2,242,112) | (4,318,317) |
Net increase (decrease) | 70,045 | 114,506 | $ 645,599 | $ 1,253,400 |
11. Other.
The Fund's organizational documents provide former and current trustees and officers with a limited indemnification against liabilities arising in connection with the performance of their duties to the Fund. In the normal course of business, the Fund may also enter into contracts that provide general indemnifications. The Fund's maximum exposure under these arrangements is unknown as this would be dependent on future claims that may be made against the Fund. The risk of material loss from such claims is considered remote.
At the end of the period, FMR or its affiliates were the owners of record of 10% of the total outstanding shares of the Fund.
Annual Report
To the Trustees of Fidelity Investment Trust and Shareholders of Fidelity Emerging Europe, Middle East, Africa (EMEA) Fund:
We have audited the accompanying statement of assets and liabilities of Fidelity Emerging Europe, Middle East, Africa (EMEA) Fund (the Fund), a fund of Fidelity Investment Trust, including the schedule of investments, as of October 31, 2012, and the related statement of operations for the year then ended, the statement of changes in net assets for each of the two years in the period then ended, and the financial highlights for each of the four years in the period then ended and the period May 8, 2008 (commencement of operations) to October 31, 2008. These financial statements and financial highlights are the responsibility of the Fund's management. Our responsibility is to express an opinion on these financial statements and financial highlights based on our audits.
We conducted our audits in accordance with the standards of the Public Company Accounting Oversight Board (United States). Those standards require that we plan and perform the audit to obtain reasonable assurance about whether the financial statements and financial highlights are free of material misstatement. The Fund is not required to have, nor were we engaged to perform, an audit of its internal control over financial reporting. Our audits included consideration of internal control over financial reporting as a basis for designing audit procedures that are appropriate in the circumstances, but not for the purpose of expressing an opinion on the effectiveness of the Fund's internal control over financial reporting. Accordingly, we express no such opinion. An audit also includes examining, on a test basis, evidence supporting the amounts and disclosures in the financial statements, assessing the accounting principles used and significant estimates made by management, as well as evaluating the overall financial statement presentation. Our procedures included confirmation of securities owned as of October 31, 2012, by correspondence with the custodians and brokers; where replies were not received from brokers, we performed other auditing procedures. We believe that our audits provide a reasonable basis for our opinion.
In our opinion, the financial statements and financial highlights referred to above present fairly, in all material respects, the financial position of Fidelity Emerging Europe, Middle East, Africa (EMEA) Fund as of October 31, 2012, the results of its operations for the year then ended, the changes in its net assets for each of the two years in the period then ended, and the financial highlights for each of the four years in the period then ended and the period May 8, 2008 (commencement of operations) to October 31, 2008, in conformity with accounting principles generally accepted in the United States of America.
DELOITTE & TOUCHE LLP
Boston, Massachusetts
December 14, 2012
Annual Report
The Trustees, Members of the Advisory Board, and executive officers of the trust and fund, as applicable, are listed below. The Board of Trustees governs the fund and is responsible for protecting the interests of shareholders. The Trustees are experienced executives who meet periodically throughout the year to oversee the fund's activities, review contractual arrangements with companies that provide services to the fund, oversee management of the risks associated with such activities and contractual arrangements, and review the fund's performance. Except for James C. Curvey, each of the Trustees oversees 236 funds advised by FMR or an affiliate. Mr. Curvery oversees 443 funds advised by FMR or an affiliate.
The Trustees hold office without limit in time except that (a) any Trustee may resign; (b) any Trustee may be removed by written instrument, signed by at least two-thirds of the number of Trustees prior to such removal; (c) any Trustee who requests to be retired or who has become incapacitated by illness or injury may be retired by written instrument signed by a majority of the other Trustees; and (d) any Trustee may be removed at any special meeting of shareholders by a two-thirds vote of the outstanding voting securities of the trust. Each Trustee who is not an interested person (as defined in the 1940 Act) (Independent Trustee), shall retire not later than the last day of the calendar year in which his or her 75th birthday occurs. The Independent Trustees may waive this mandatory retirement age policy with respect to individual Trustees. The executive officers and Advisory Board Members hold office without limit in time, except that any officer and Advisory Board Member may resign or may be removed by a vote of a majority of the Trustees at any regular meeting or any special meeting of the Trustees. Except as indicated, each individual has held the office shown or other offices in the same company for the past five years.
Experience, Skills, Attributes, and Qualifications of the Fund's Trustees. The Governance and Nominating Committee has adopted a statement of policy that describes the experience, qualifications, attributes, and skills that are necessary and desirable for potential Independent Trustee candidates (Statement of Policy). The Board believes that each Trustee satisfied at the time he or she was initially elected or appointed a Trustee, and continues to satisfy, the standards contemplated by the Statement of Policy. The Governance and Nominating Committee also engages professional search firms to help identify potential Independent Trustee candidates who have the experience, qualifications, attributes, and skills consistent with the Statement of Policy. From time to time, additional criteria based on the composition and skills of the current Independent Trustees, as well as experience or skills that may be appropriate in light of future changes to board composition, business conditions, and regulatory or other developments, have also been considered by the professional search firms and the Governance and Nominating Committee. In addition, the Board takes into account the Trustees' commitment and participation in Board and committee meetings, as well as their leadership of standing and ad hoc committees throughout their tenure.
In determining that a particular Trustee was and continues to be qualified to serve as a Trustee, the Board has considered a variety of criteria, none of which, in isolation, was controlling. The Board believes that, collectively, the Trustees have balanced and diverse experience, qualifications, attributes, and skills, which allow the Board to operate effectively in governing the fund and protecting the interests of shareholders. Information about the specific experience, skills, attributes, and qualifications of each Trustee, which in each case led to the Board's conclusion that the Trustee should serve (or continue to serve) as a trustee of the fund, is provided below.
Annual Report
Board Structure and Oversight Function. James C. Curvey is an interested person (as defined in the 1940 Act) and currently serves as Chairman. The Trustees have determined that an interested Chairman is appropriate and benefits shareholders because an interested Chairman has a personal and professional stake in the quality and continuity of services provided to the fund. Independent Trustees exercise their informed business judgment to appoint an individual of their choosing to serve as Chairman, regardless of whether the Trustee happens to be independent or a member of management. The Independent Trustees have determined that they can act independently and effectively without having an Independent Trustee serve as Chairman and that a key structural component for assuring that they are in a position to do so is for the Independent Trustees to constitute a substantial majority for the Board. The Independent Trustees also regularly meet in executive session. Ned C. Lautenbach serves as Chairman of the Independent Trustees and as such (i) acts as a liaison between the Independent Trustees and management with respect to matters important to the Independent Trustees and (ii) with management prepares agendas for Board meetings.
Fidelity funds are overseen by different Boards of Trustees. The fund's Board oversees Fidelity's equity and high income funds and another Board oversees Fidelity's investment-grade bond, money market, and asset allocation funds. The asset allocation funds may invest in Fidelity funds overseen by the fund's Board. The use of separate Boards, each with its own committee structure, allows the Trustees of each group of Fidelity funds to focus on the unique issues of the funds they oversee, including common research, investment, and operational issues. On occasion, the separate Boards establish joint committees to address issues of overlapping consequences for the Fidelity funds overseen by each Board.
The Trustees operate using a system of committees to facilitate the timely and efficient consideration of all matters of importance to the Trustees, the fund, and fund shareholders and to facilitate compliance with legal and regulatory requirements and oversight of the fund's activities and associated risks. The Board, acting through its committees, has charged FMR and its affiliates with (i) identifying events or circumstances the occurrence of which could have demonstrably adverse effects on the fund's business and/or reputation; (ii) implementing processes and controls to lessen the possibility that such events or circumstances occur or to mitigate the effects of such events or circumstances if they do occur; and (iii) creating and maintaining a system designed to evaluate continuously business and market conditions in order to facilitate the identification and implementation processes described in (i) and (ii) above. Because the day-to-day operations and activities of the fund are carried out by or through FMR, its affiliates and other service providers, the fund's exposure to risks is mitigated but not eliminated by the processes overseen by the Trustees. While each of the Board's committees has responsibility for overseeing different aspects of the fund's activities, oversight is exercised primarily through the Operations, Audit, and Compliance Committees. In addition, the Independent Trustees have worked with FMR to enhance the Board's oversight of investment and financial risks, legal and regulatory risks, technology risks, and operational risks, including the development of additional risk reporting to the Board. For example, a working group comprised of Independent Trustees and FMR has worked and continues to work to review the Fidelity funds' valuation-related activities, reporting and risk management. Appropriate personnel, including but not limited to the fund's Chief Compliance Officer (CCO), FMR's internal auditor, the independent accountants, the fund's Treasurer and portfolio management personnel, make periodic reports to the Board's committees, as appropriate, including an annual review of FMR's risk management program for the Fidelity funds. The responsibilities of each standing committee, including their oversight responsibilities, are described further under "Standing Committees of the Fund's Trustees."
Annual Report
Trustees and Officers - continued
The fund's Statement of Additional Information (SAI) includes more information about the Trustees. To request a free copy, call Fidelity at 1-877-208-0098.
Interested Trustees*:
Correspondence intended for each Trustee who is an interested person may be sent to Fidelity Investments, 82 Devonshire Street, Boston, Massachusetts 02109.
Name, Age; Principal Occupations and Other Relevant Experience+ |
James C. Curvey (77) |
| Year of Election or Appointment: 2007 Mr. Curvey is Trustee and Chairman of the Board of Trustees of certain Trusts. Mr. Curvey also serves as Trustee (2007-present) of other investment companies advised by FMR. Mr. Curvey is a Director of Fidelity Investments Money Management, Inc. (2009-present), Director of Fidelity Research & Analysis Co. (2009-present) and Director of FMR and FMR Co., Inc. (2007-present). Mr. Curvey is also Vice Chairman (2007-present) and Director of FMR LLC. In addition, Mr. Curvey serves as an Overseer for the Boston Symphony Orchestra and a member of the Trustees of Villanova University. Previously, Mr. Curvey was the Vice Chairman (2006-2007) and Director (2000-2007) of FMR Corp. |
Ronald P. O'Hanley (55) |
| Year of Election or Appointment: 2011 Mr. O'Hanley is Director of FMR Co., Inc. (2010-present), Director of Fidelity Investments Money Management, Inc. (2010-present), Director of Fidelity Research & Analysis Company (2010-present), President of Fidelity Asset Management and Corporate Services and a member of Fidelity's Executive Committee (2010-present). Previously, Mr. O'Hanley served as President and Chief Executive Officer of BNY Mellon Asset Management (2007-2010). Mr. O'Hanley also served as Vice Chairman of Bank New York Mellon Corp. and a member of that firm's Executive Committee. Prior to the 2007 merger of The Bank of New York and Mellon Financial Corporation, he was Vice Chairman of Mellon Financial Corporation and President and Chief Executive Officer of Mellon Asset Management. He joined Mellon in February 1997. Mr. O'Hanley currently serves as Chairman of the Boston Public Library Foundation Board of Directors and sits on the Board of Directors of Beth Israel Deaconess Medical Center, the Board of Trustees of the Marine Biological Laboratory and the Advisory Board of the Maxwell School of Citizenship and Public Administration at Syracuse University. Mr. O'Hanley also chairs the Council on Asset Management for the Financial Services Roundtable and is a member of the Board of Directors of Institutional Investor's U.S. Institute. |
* Trustees have been determined to be "Interested Trustees" by virtue of, among other things, their affiliation with the trust or various entities under common control with FMR.
+ The information above includes each Trustee's principal occupation during the last five years and other information relating to the experience, attributes, and skills relevant to each Trustee's qualifications to serve as a Trustee, which led to the conclusion that each Trustee should serve as a Trustee for the fund.
Annual Report
Trustees and Officers - continued
Independent Trustees:
Correspondence intended for each Independent Trustee (that is, the Trustees other than the Interested Trustees) may be sent to Fidelity Investments, P.O. Box 55235, Boston, Massachusetts 02205-5235.
Name, Age; Principal Occupations and Other Relevant Experience+ |
Dennis J. Dirks (64) |
| Year of Election or Appointment: 2005 Prior to his retirement in May 2003, Mr. Dirks was Chief Operating Officer and a member of the Board of The Depository Trust & Clearing Corporation (DTCC). He also served as President, Chief Operating Officer, and Board member of The Depository Trust Company (DTC) and President and Board member of the National Securities Clearing Corporation (NSCC). In addition, Mr. Dirks served as Chief Executive Officer and Board member of the Government Securities Clearing Corporation, Chief Executive Officer and Board member of the Mortgage-Backed Securities Clearing Corporation, as a Trustee and a member of the Finance Committee of Manhattan College (2005-2008), and as a Trustee and a member of the Finance Committee of AHRC of Nassau County (2006-2008). Mr. Dirks is a member of the Independent Directors Council (IDC) Governing Council (2010-present) and Board of Directors for The Brookville Center for Children's Services, Inc. (2009-present). |
Alan J. Lacy (59) |
| Year of Election or Appointment: 2008 Mr. Lacy serves as Senior Adviser (2007-present) of Oak Hill Capital Partners, L.P. (private equity). Mr. Lacy also served as Chief Executive Officer (2000-2005) and Vice Chairman (2005-2006) of Sears Holdings Corporation and Sears, Roebuck and Co. (retail). In addition, Mr. Lacy serves as a member of the Board of Directors of Dave & Buster's Entertainment, Inc. (restaurant and entertainment complexes, 2010-present), Earth Fare, Inc. (retail grocery, 2012-present), The Hillman Companies, Inc. (hardware wholesalers, 2010-present), and Bristol-Myers Squibb Company (global pharmaceuticals, 2008-present). Mr. Lacy is a member of the Board of Trustees of The National Parks Conservation Association (2006-present). Previously, Mr. Lacy served as Chairman of the Board of Trustees of the National Parks Conservation Association (2008-2011) and as a member of the Board of Directors for the Western Union Company (global money transfer, 2006-2011). |
Ned C. Lautenbach (68) |
| Year of Election or Appointment: 2000 Mr. Lautenbach is Chairman of the Independent Trustees of the Equity and High Income Funds (2006-present). Mr. Lautenbach currently serves as the Lead Director of the Eaton Corporation Board of Directors (diversified industrial, 1997-present). Mr. Lautenbach is Chairman of the Board of Directors of the Philharmonic Center for the Arts in Naples, Florida (2012-present) and a member of the Council on Foreign Relations (1994-present). Previously, Mr. Lautenbach was a Partner/Advisory Partner at Clayton, Dubilier & Rice, LLC (private equity investment, 1998-2010), as well as a Director of Sony Corporation (2006-2007). |
Joseph Mauriello (68) |
| Year of Election or Appointment: 2008 Prior to his retirement in January 2006, Mr. Mauriello served in numerous senior management positions including Deputy Chairman and Chief Operating Officer (2004-2005), and Vice Chairman of Financial Services (2002-2004) of KPMG LLP US (professional services, 1965-2005). Mr. Mauriello currently serves as a member of the Board of Directors of XL Group plc. (global insurance and re-insurance, 2006-present). Previously, Mr. Mauriello served as a Director of the Hamilton Funds of the Bank of New York (2006-2007) and of Arcadia Resources Inc. (health care services and products, 2007-2012). |
Robert W. Selander (62) |
| Year of Election or Appointment: 2011 Previously, Mr. Selander served as a Member of the Advisory Board of Fidelity's Equity and High Income Funds (2011), Executive Vice Chairman (2010), Chief Executive Officer (2009-2010), and President and Chief Executive Officer (1997-2009) of Mastercard, Inc. |
Cornelia M. Small (68) |
| Year of Election or Appointment: 2005 Ms. Small is a member of the Board of Directors (2009-present) and Chair of the Investment Committee (2010-present) of the Teagle Foundation. Ms. Small also serves on the Investment Committee of the Berkshire Taconic Community Foundation (2008-present). Previously, Ms. Small served as Chairperson (2002-2008) and a member of the Investment Committee and Chairperson (2008-2012) and a member of the Board of Trustees of Smith College. In addition, Ms. Small served as Chief Investment Officer, Director of Global Equity Investments, and a member of the Board of Directors of Scudder, Stevens & Clark and Scudder Kemper Investments. |
William S. Stavropoulos (73) |
| Year of Election or Appointment: 2001 Mr. Stavropoulos is Vice Chairman of the Independent Trustees of the Equity and High Income Funds (2006-present). Mr. Stavropoulos serves as President and Founder of the Michigan Baseball Foundation, the Great Lakes Loons (2007-present). Mr. Stavropoulos is Chairman Emeritus of the Board of Directors of The Dow Chemical Company, where he previously served in numerous senior management positions, including President, CEO (1995-2000; 2002-2004), Chairman of the Executive Committee (2000-2006), and as a member of the Board of Directors (1990-2006). Currently, Mr. Stavropoulos is a Director of Univar Inc. (global distributor of commodity and specialty chemicals, Chairman from 2010-May 2012 and Lead Director from May 2012-present), Teradata Corporation (data warehousing and technology solutions, 2008-present), Maersk Inc. (industrial conglomerate), and Tyco International, Ltd. (multinational manufacturing and services, 2007-present), and a member of the Advisory Board for Metalmark Capital LLC (private equity investment, 2005-present). Mr. Stavropoulos is an operating advisor to Clayton, Dubilier & Rice, LLC (private equity investment). In addition, Mr. Stavropoulos is a member of the University of Notre Dame Advisory Council for the College of Science, a Trustee of the Rollin L. Gerstacker Foundation, and a Director of the Naples Philharmonic Center for the Arts. Previously, Mr. Stavropoulos served as a Director of Chemical Financial Corporation (bank holding company, 1993-2012). |
David M. Thomas (63) |
| Year of Election or Appointment: 2008 Previously, Mr. Thomas served as Executive Chairman (2005-2006) and Chairman and Chief Executive Officer (2000-2005) of IMS Health, Inc. (pharmaceutical and healthcare information solutions), and a Director of Fortune Brands, Inc. (consumer products, 2000-2011). In addition, Mr. Thomas serves as Non-Executive Chairman of the Board of Directors of Fortune Brands Home and Security (home and security products, 2011-present), and as a member of the Board of Directors of Interpublic Group of Companies, Inc. (marketing communication, 2004-present). |
Michael E. Wiley (62) |
| Year of Election or Appointment: 2008 Mr. Wiley also serves as a Director of Asia Pacific Exploration Consolidated (international oil and gas exploration and production, 2008-present). Mr. Wiley serves as a Director of Tesoro Corporation (independent oil refiner and marketer, 2005-present), and a Director of Bill Barrett Corporation (exploration and production, 2005-present). In addition, Mr. Wiley also serves as a Director of Post Oak Bank (privately-held bank, 2004-present). Previously, Mr. Wiley served as a member of the Board of Trustees of the University of Tulsa (2000-2006; 2007-2010), as a Senior Energy Advisor of Katzenbach Partners, LLC (consulting, 2006-2007), as an Advisory Director of Riverstone Holdings (private investment), Chairman, President, and CEO of Baker Hughes, Inc. (oilfield services, 2000-2004), and as Director of Spinnaker Exploration Company (exploration and production, 2001-2005). |
+ The information above includes each Trustee's principal occupation during the last five years and other information relating to the experience, attributes, and skills relevant to each Trustee's qualifications to serve as a Trustee, which led to the conclusion that each Trustee should serve as a Trustee for the fund.
Advisory Board Members and Executive Officers:
Correspondence intended for David A. Rosow and Garnett A. Smith may be sent to Fidelity Investments, P.O. Box 55235, Boston, Massachusetts 02205-5235. Correspondence intended for each executive officer, Edward C. Johnson 3d, and Peter S. Lynch may be sent to Fidelity Investments, 82 Devonshire Street, Boston, Massachusetts 02109.
Name, Age; Principal Occupation |
Edward C. Johnson 3d (82) |
| Year of Election or Appointment: 2011 Member of the Advisory Board of Fidelity's Equity and High Income Funds. Mr. Johnson serves as Chief Executive Officer, Chairman, and a Director of FMR LLC, and also serves as Chairman and Director of FIL Limited. Previously, Mr. Johnson served as a Trustee and Chairman of the Board of certain Fidelity Trusts, Chairman and a Director of FMR, Chairman and a Director of FMR Co., Inc., and President of FMR LLC (2006-2007). |
Peter S. Lynch (68) |
| Year of Election or Appointment: 2003 Member of the Advisory Board of Fidelity's Equity and High Income Funds. Mr. Lynch is Vice Chairman and a Director of FMR and FMR Co., Inc. In addition, Mr. Lynch serves as a Trustee of Boston College and as the Chairman of the Inner-City Scholarship Fund. Previously, Mr. Lynch served on the Special Olympics International Board of Directors (1997-2006). |
David A. Rosow (70) |
| Year of Election or Appointment: 2012 Member of the Advisory Board of Fidelity's Equity and High Income Funds. Chairman and Chief Executive Officer of International Golf Group, Inc. (golf course development, 1989-present). Previously, Mr. Rosow served as Chairman and Chief Executive Officer of Rosow & Company, Inc. (private investment company, 1989-2011), a Lead Director of Hudson United Bancorp (2001-2006) and as a Director of TD Banknorth (1996-2006). In addition, Mr. Rosow is a member (2008-present) and President (2009-present) of the Town Council of Palm Beach, Florida. |
Garnett A. Smith (65) |
| Year of Election or Appointment: 2012 Member of the Advisory Board of Fidelity's Equity and High Income Funds. Prior to Mr. Smith's retirement, he served as Chairman and Chief Executive Officer of Inbrand Corp. (manufacturer of personal absorbent products, 1990-1997). He also served as President (1986-1990) of Inbrand Corp. Prior to his employment with Inbrand Corp., he was employed by a retail fabric chain and North Carolina National Bank. In addition, Mr. Smith is a board member of the Jackson Hole Land Trust (2009-present). |
Kenneth B. Robins (43) |
| Year of Election or Appointment: 2008 President and Treasurer of Fidelity's Equity and High Income Funds. Mr. Robins also serves as President and Treasurer (2010-present) and Assistant Treasurer (2009-present) of other Fidelity funds and is an employee of Fidelity Investments (2004-present). Previously, Mr. Robins served as Deputy Treasurer of the Fidelity funds (2005-2008) and Treasurer and Chief Financial Officer of The North Carolina Capital Management Trust: Cash and Term Portfolios (2006-2008). |
Bruce T. Herring (47) |
| Year of Election or Appointment: 2006 Vice President of certain Equity Funds. Mr. Herring also serves as President of Fidelity Research & Analysis Company (2010-present), Chief Investment Officer and Director of Fidelity Management & Research (U.K.) Inc. (2010-present) and Group Chief Investment Officer of FMR. Previously, Mr. Herring served as Vice President (2005-2006) and Senior Vice President (2006-2007) of Fidelity Management & Research Company, Vice President of FMR Co., Inc. (2001-2007) and as a portfolio manager for Fidelity U.S. Equity Funds. |
Brian B. Hogan (48) |
| Year of Election or Appointment: 2009 Vice President of Equity and High Income Funds. Mr. Hogan also serves as President of FMR's Equity Division (2009-present). Previously, Mr. Hogan served as Senior Vice President, Equity Research of FMR (2006-2009) and as a portfolio manager. |
Scott C. Goebel (44) |
| Year of Election or Appointment: 2008 Secretary and Chief Legal Officer (CLO) of the Fidelity funds. Mr. Goebel also serves as Secretary of Fidelity Investments Money Management, Inc. (FIMM) (2010-present) and Fidelity Research and Analysis Company (FRAC) (2010-present); Secretary and CLO of The North Carolina Capital Management Trust: Cash and Term Portfolios (2008-present); General Counsel, Secretary, and Senior Vice President of FMR (2008-present) and FMR Co., Inc. (2008-present); employed by FMR LLC or an affiliate (2001-present); Chief Legal Officer of Fidelity Management & Research (Hong Kong) Limited (2008-present) and Assistant Secretary of Fidelity Management & Research (Japan) Inc. (2008-present), and Fidelity Management & Research (U.K.) Inc. (2008-present). Previously, Mr. Goebel served as Assistant Secretary of FIMM (2008-2010), FRAC (2008-2010), and the Funds (2007-2008) and as Vice President and Secretary of Fidelity Distributors Corporation (FDC) (2005-2007). |
William C. Coffey (43) |
| Year of Election or Appointment: 2009 Assistant Secretary of Fidelity's Equity and High Income Funds. Mr. Coffey also serves as Senior Vice President and Deputy General Counsel of FMR LLC (2010-present), and is an employee of Fidelity Investments. Previously, Mr. Coffey served as Vice President and Associate General Counsel of FMR LLC (2005-2009). |
Elizabeth Paige Baumann (44) |
| Year of Election or Appointment: 2012 Anti-Money Laundering (AML) Officer of the Fidelity funds. Ms. Baumann also serves as AML Officer of The North Carolina Capital Management Trust: Cash and Term Portfolios (2012-present), Chief AML Officer of FMR LLC (2012-present), and is an employee of Fidelity Investments. Previously, Ms. Baumann served as Vice President and Deputy Anti-Money Laundering Officer (2007-2012). |
Christine Reynolds (54) |
| Year of Election or Appointment: 2008 Chief Financial Officer of the Fidelity funds. Ms. Reynolds became President of Fidelity Pricing and Cash Management Services (FPCMS) in August 2008. Ms. Reynolds served as Chief Operating Officer of FPCMS (2007-2008). Previously, Ms. Reynolds served as President, Treasurer, and Anti-Money Laundering officer of the Fidelity funds (2004-2007). |
Joseph A. Hanlon (44) |
| Year of Election or Appointment: 2012 Chief Compliance Officer of Fidelity's Equity and High Income Funds. Mr. Hanlon serves as Compliance Officer of FMR, FMR Co., Inc., Fidelity Investments Money Management, Inc. (FIMM), Fidelity Research and Analysis Company (FRAC), Fidelity Management & Research (Japan) Inc., Fidelity Management & Research (U.K.) Inc., Fidelity Management & Research (Hong Kong), and Strategic Advisers, Inc. (2009-present), as Senior Vice President of the Fidelity Asset Management Division (2009-present), and is an employee of Fidelity Investments. |
Joseph F. Zambello (55) |
| Year of Election or Appointment: 2011 Deputy Treasurer of the Fidelity funds. Mr. Zambello is an employee of Fidelity Investments. Previously, Mr. Zambello served as Vice President of FMR's Program Management Group (2009-2011) and Vice President of the Transfer Agent Oversight Group (2005-2009). |
Adrien E. Deberghes (45) |
| Year of Election or Appointment: 2008 Deputy Treasurer of Fidelity's Equity and High Income Funds. Mr. Deberghes also serves as Vice President (2011-present) and Assistant Treasurer (2010-present) of other Fidelity funds, and is an employee of Fidelity Investments (2008-present). Previously, Mr. Deberghes served as Senior Vice President of Mutual Fund Administration at State Street Corporation (2007-2008), Senior Director of Mutual Fund Administration at Investors Bank & Trust (2005-2007), and Director of Finance for Dunkin' Brands (2000-2005). |
Stephen Sadoski (41) |
| Year of Election or Appointment: 2012 Deputy Treasurer of Fidelity's Equity and High Income Funds. Mr. Sadoski also serves as Assistant Treasurer of other Fidelity funds (2012-present) and is an employee of Fidelity Investments (2012-present). Previously, Mr. Sadoski served as an assistant chief accountant in the Division of Investment Management of the Securities and Exchange Commission (SEC) (2009-2012) and as a senior manager at Deloitte & Touche (1997-2009). |
Stephanie J. Dorsey (43) |
| Year of Election or Appointment: 2010 Assistant Treasurer of Fidelity's Equity and High Income Funds. Ms. Dorsey also serves as Deputy Treasurer of other Fidelity funds (2008-present) and is an employee of Fidelity Investments (2008-present). Previously, Ms. Dorsey served as Treasurer (2004-2008) of the JPMorgan Mutual Funds and Vice President (2004-2008) of JPMorgan Chase Bank. |
John R. Hebble (54) |
| Year of Election or Appointment: 2009 Assistant Treasurer of Fidelity's Equity and High Income Funds. Mr. Hebble also serves as President (2011-present), Treasurer, and Chief Financial Officer of The North Carolina Capital Management Trust: Cash and Term Portfolios (2008-present), President and Treasurer of other Fidelity funds (2008-present) and is an employee of Fidelity Investments. |
Gary W. Ryan (54) |
| Year of Election or Appointment: 2005 Assistant Treasurer of the Fidelity funds. Mr. Ryan is an employee of Fidelity Investments. Previously, Mr. Ryan served as Vice President of Fund Reporting in Fidelity Pricing and Cash Management Services (FPCMS) (1999-2005). |
Jonathan Davis (44) |
| Year of Election or Appointment: 2010 Assistant Treasurer of the Fidelity funds. Mr. Davis is also Assistant Treasurer of Fidelity Rutland Square Trust II and Fidelity Commonwealth Trust II. Mr. Davis is an employee of Fidelity Investments. Previously, Mr. Davis served as Vice President and Associate General Counsel of FMR LLC (2003-2010). |
Annual Report
The Board of Trustees of Fidelity Emerging Europe, Middle East, Africa, (EMEA) Fund voted to pay to shareholders of record at the opening of business on record date, the following distributions per share derived from capital gains realized from sales of portfolio securities, and dividends derived from net investment income:
| Pay Date | Record Date | Dividends | Capital Gains |
Institutional Class | 12/10/12 | 12/07/12 | $0.188 | $0.074 |
Institutional Class designates 100% of the dividend distributed during the fiscal year, as amounts which may be taken into account as a dividend for purposes of the maximum rate under section 1(h)(11) of the Internal Revenue Code.
The amounts per share which represent income derived from sources within, and taxes paid to, foreign countries or possessions of the United States are as follows:
| Pay Date | Income | Taxes |
Institutional Class | 12/12/2011 | $0.048 | $0.0204 |
The fund will notify shareholders in January 2013 of amounts for use in preparing 2012 income tax returns.
Annual Report
Board Approval of Investment Advisory Contracts and Management Fees
Fidelity Emerging Europe, Middle East, Africa (EMEA) Fund
Each year, the Board of Trustees, including the Independent Trustees (together, the Board), votes on the renewal of the management contract and sub-advisory agreements (together, the Advisory Contracts) for the fund. The Board, assisted by the advice of fund counsel and Independent Trustees' counsel, requests and considers a broad range of information relevant to the renewal of the Advisory Contracts throughout the year.
The Board meets regularly and, at each of its meetings, considers factors that are relevant to its annual consideration of the renewal of the fund's Advisory Contracts, including the services and support provided to the fund and its shareholders. The Board has established various standing committees, each composed of and chaired by Independent Trustees with varying backgrounds, to which the Board has assigned specific subject matter responsibilities in order to enhance effective decision-making by the Board. The Board, acting directly and through its Committees, requests and receives information concerning the annual consideration of the renewal of the fund's Advisory Contracts. The Board also meets as needed to consider matters specifically related to the Board's annual consideration of the renewal of Advisory Contracts. Members of the Board may also meet with trustees of other Fidelity funds through ad hoc joint committees to discuss certain matters relevant to the Fidelity funds.
At its July 2012 meeting, the Board of Trustees, including the Independent Trustees, unanimously determined to renew the fund's Advisory Contracts. In reaching its determination, the Board considered all factors it believed relevant, including (i) the nature, extent, and quality of the services to be provided to the fund and its shareholders (including the investment performance of the fund); (ii) the competitiveness of the fund's management fee and total expense ratio relative to peer funds; (iii) the total costs of the services to be provided by and the profits to be realized by Fidelity from its relationship with the fund; (iv) the extent to which economies of scale exist and would be realized as the fund grows; and (v) whether fee levels reflect these economies of scale, if any, for the benefit of fund shareholders.
In considering whether to renew the Advisory Contracts for the fund, the Board reached a determination, with the assistance of fund counsel and Independent Trustees' counsel and through the exercise of its business judgment, that the renewal of the Advisory Contracts is in the best interests of the fund and its shareholders and that the compensation payable under the Advisory Contracts is fair and reasonable. The Board's decision to renew the Advisory Contracts was not based on any single factor, but rather was based on a comprehensive consideration of all the information provided to the Board at its meetings throughout the year. The Board, in reaching its determination to renew the Advisory Contracts, is aware that shareholders in the fund have a broad range of investment choices available to them, including a wide choice among mutual funds offered by Fidelity's competitors, and that the fund's shareholders, who have the opportunity to review and weigh the disclosure provided by the fund in its prospectus and other public disclosures, have chosen to invest in this fund, managed by Fidelity.
Annual Report
Board Approval of Investment Advisory Contracts and
Management Fees - continued
Nature, Extent, and Quality of Services Provided. The Board considered the staffing within the investment adviser, FMR, and the sub-advisers (together, the Investment Advisers), including the backgrounds of the fund's investment personnel, and also considered the fund's investment objective, strategies, and related investment philosophy. The Independent Trustees also had discussions with senior management of Fidelity's investment operations and investment groups. The Board considered the structure of the portfolio manager compensation program and whether this structure provides appropriate incentives to act in the best interests of the fund.
Resources Dedicated to Investment Management and Support Services. The Board and the Fund Oversight and Research Committees reviewed the general qualifications and capabilities of the Investment Advisers' investment staff, including its size, education, experience, and resources, as well as the Investment Advisers' approach to recruiting, training, managing, and compensating investment personnel. The Board also noted that FMR has continued to increase the resources devoted to non-U.S. offices, including expansion of Fidelity's global investment organization. The Board noted that Fidelity's analysts have extensive resources, tools and capabilities that allow them to conduct sophisticated quantitative and fundamental analysis, as well as credit analysis of issuers, counterparties and guarantors. The Board also believes that Fidelity's investment professionals have sufficient access to global information and data so as to provide competitive investment results over time, and that those professionals also have access to sophisticated tools that permit them to assess portfolio construction and risk and performance attribution characteristics continuously, as well as to transmit new information and research conclusions rapidly around the world. Additionally, in its deliberations, the Board considered the Investment Advisers' trading and risk management capabilities and resources, which are an integral part of the investment management process.
Shareholder and Administrative Services. The Board considered (i) the nature, extent, quality, and cost of advisory, administrative, and shareholder services performed by the Investment Advisers and their affiliates under the Advisory Contracts and under separate agreements covering transfer agency, pricing and bookkeeping, and securities lending services for the fund; (ii) the nature and extent of the supervision of third party service providers, principally custodians and subcustodians; and (iii) the resources devoted to, and the record of compliance with, the fund's compliance policies and procedures. The Board also reviewed the allocation of fund brokerage, including allocations to brokers affiliated with the Investment Advisers, the use of brokerage commissions to pay fund expenses, and the use of "soft" commission dollars to pay for research services.
Annual Report
The Board noted that the growth of fund assets over time across the complex allows Fidelity to reinvest in the development of services designed to enhance the value or convenience of the Fidelity funds as investment vehicles. These services include 24-hour access to account information and market information through telephone representatives and over the Internet, investor education materials and asset allocation tools, and the expanded availability of Fidelity Investor Centers.
Investment in a Large Fund Family. The Board considered the benefits to shareholders of investing in a Fidelity fund, including the benefits of investing in a fund that is part of a large family of funds offering a variety of investment disciplines and providing a large variety of mutual fund investor services. The Board noted that Fidelity had taken, or had made recommendations that resulted in the Fidelity funds taking, a number of actions over the previous year that benefited particular funds, including (i) continuing to dedicate additional resources to investment research and support of the senior management team that oversees asset management; (ii) persisting in efforts to enhance Fidelity's research capabilities, in particular, international research; (iii) launching new funds and making other enhancements to meet client needs for global and income-oriented solutions; (iv) continuing to launch dedicated lower cost underlying funds to meet investment management's portfolio construction needs related to expanding underlying fund options, specifically for the Freedom Fund product lines; (v) adopting a "Stock Selector" sector neutral investment approach and employing a team of portfolio managers who are sector specialists to manage certain funds; (vi) rationalizing product lines and gaining increased efficiencies through the mergers of several funds into other funds; (vii) strengthening the Spartan Index Fund product line by adding new funds and/or new low-cost institutional share classes, restructuring fund expenses to accommodate new classes, and reducing investment minimums for certain classes of shares; (viii) modifying the eligibility criteria for Institutional Class shares to increase their appeal to government entities and charitable investors; and (ix) reducing certain transfer agent fee rates.
Investment Performance. The Board considered whether the fund has operated in accordance with its investment objective, as well as its record of compliance with its investment restrictions. It also reviewed the fund's absolute investment performance for each class, as well as the fund's relative investment performance for each class measured against a broad-based securities market index. The Board noted that FMR believes that no meaningful peer group exists for the fund principally because most other funds in the fund's third-party peer group have different and/or broader investment mandates than the fund's more specialized strategies. Because the fund had been in existence less than five calendar years, the following charts considered by the Board show, over the one- and three-year periods ended December 31, 2011, the cumulative total returns of Institutional Class (Class I) and Class B of the fund and the cumulative total returns of a broad-based securities market index ("benchmark"). The returns of Institutional Class (Class I) and Class B show the performance of the highest and lowest performing classes, respectively (based on three-year performance).
Annual Report
Board Approval of Investment Advisory Contracts and
Management Fees - continued
Fidelity Emerging Europe, Middle East, Africa (EMEA) Fund

The Board noted that the investment performance of Institutional Class (Class I) of the fund compared favorably to its benchmark for all the periods shown. The Board considered that the variations in performance among the fund's classes reflect the variations in class expenses, which result in lower performance for higher expense classes. The Board also reviewed the fund's performance since inception as well as performance in the current year.
Based on its review, the Board concluded that the nature, extent, and quality of services provided to the fund under the Advisory Contracts should benefit the fund's shareholders.
Competitiveness of Management Fee and Total Expense Ratio. The Board considered the fund's management fee and total expense ratio compared to "mapped groups" of competitive funds and classes. Fidelity creates "mapped groups" by combining similar Lipper investment objective categories that have comparable management fee characteristics. Combining Lipper investment objective categories aids the Board's management fee and total expense ratio comparisons by broadening the competitive group used for comparison and by reducing the number of universes to which various Fidelity funds are compared.
Management Fee. The Board considered two proprietary management fee comparisons for the 12-month (or shorter) periods shown in the chart below. The group of Lipper funds used by the Board for management fee comparisons is referred to below as the "Total Mapped Group." The Total Mapped Group comparison focuses on a fund's standing relative to the total universe of comparable funds available to investors in terms of gross management fees before expense reimbursements or caps. "TMG %" represents the percentage of funds in the Total Mapped Group that had management fees that were lower than the fund's. For example, a TMG % of 13% means that 87% of the funds in the Total Mapped Group had higher management fees than the fund. The "Asset-Size Peer Group" (ASPG) comparison focuses on a fund's standing relative to non-Fidelity funds similar in size to the fund within the Total Mapped Group. The ASPG represents at least 15% of the funds in the Total Mapped Group with comparable asset size and management fee characteristics, subject to a minimum of 50 funds (or all funds in the Total Mapped Group if fewer than 50). Additional information, such as the ASPG quartile in which the fund's management fee ranked, is also included in the chart and considered by the Board.
Annual Report
Fidelity Emerging Europe, Middle East, Africa (EMEA) Fund

The Board noted that the fund's management fee ranked below the median of its Total Mapped Group and below the median of its ASPG for 2011.
Based on its review, the Board concluded that the fund's management fee is fair and reasonable in light of the services that the fund receives and the other factors considered.
Total Expense Ratio. In its review of each class's total expense ratio, the Board considered the fund's management fee as well as other fund or class expenses, as applicable, such as transfer agent fees, pricing and bookkeeping fees, fund-paid 12b-1 fees, and custodial, legal, and audit fees. The Board also noted the effects of any waivers and reimbursements on fees and expenses. As part of its review, the Board also considered the current and historical total expense ratios of each class of the fund compared to competitive fund median expenses. Each class of the fund is compared to those funds and classes in the Total Mapped Group (used by the Board for management fee comparisons) that have a similar sales load structure.
Annual Report
Board Approval of Investment Advisory Contracts and
Management Fees - continued
The Board noted that the total expense ratio of each of Class A, Class B, Class C, Institutional Class, and the retail class ranked below its competitive median for 2011 and the total expense ratio of Class T ranked above its competitive median for 2011. The Board considered that various factors, including 12b-1 fees, positive or negative performance adjustments, and relatively higher other expenses in the case of small fund size, can affect total expense ratios. The Board noted that the total expense ratio of Class T was above the competitive median primarily because of higher 12b-1 fees on Class T. Class T has a higher 12b-1 fee, but a lower front-end sales charge, than traditionally priced front-end sales charge classes. The Board considered that Class T is primarily sold load-waived in the retirement plan market where its 0.50% 12b-1 fee is comparable to competing no-load, higher 12b-1 fee classes designed specifically for retirement plans. The Board noted that the fund offers multiple classes, each of which has a different sales load and 12b-1 fee structure, and that the multiple structures are intended to offer a range of pricing options for the intermediary market. The Board also noted that the total expense ratios of the classes vary primarily by the level of their 12b-1 fees, although differences in transfer agent fees may also cause expenses to vary from class to class.
Fees Charged to Other Fidelity Clients. The Board also considered Fidelity fee structures and other information with respect to clients of FMR and its affiliates, such as other mutual funds advised or subadvised by FMR or its affiliates, pension plan clients, and other institutional clients. The Board noted the findings of the 2010 ad hoc joint committee (created with the board of other Fidelity funds), which reviewed and compared Fidelity's institutional investment advisory business with its business of providing services to the Fidelity funds, including the differences in services provided, fees charged, and costs incurred, as well as competition in their respective marketplaces.
Based on its review of total expense ratios and fees charged to other Fidelity clients, the Board concluded that the total expense ratio of each class of the fund was reasonable, although Class T was above the median of the universe presented for comparison, in light of the services that the fund and its shareholders receive and the other factors considered.
Costs of the Services and Profitability. The Board considered the revenues earned and the expenses incurred by Fidelity in conducting the business of developing, marketing, distributing, managing, administering and servicing the fund and its shareholders. The Board also considered the level of Fidelity's profits in respect of all the Fidelity funds.
Annual Report
On an annual basis, FMR presents to the Board Fidelity's profitability for the fund. Fidelity calculates the profitability for each fund, as well as aggregate profitability for groups of Fidelity funds and all Fidelity funds, using a series of detailed revenue and cost allocation methodologies which originate with the books and records of Fidelity on which Fidelity's audited financial statements are based. The Audit Committee of the Board reviews any significant changes from the prior year's methodologies.
PricewaterhouseCoopers LLP (PwC), independent registered public accounting firm and auditor to Fidelity and certain Fidelity funds, has been engaged annually by the Board as part of the Board's assessment of Fidelity's profitability analysis. PwC's engagement includes the review and assessment of Fidelity's methodologies used in determining the revenues and expenses attributable to Fidelity's mutual fund business, and completion of agreed-upon procedures surrounding the mathematical accuracy of fund profitability and its conformity to allocation methodologies. After considering PwC's reports issued under the engagement and information provided by Fidelity, the Board concluded that while other allocation methods may also be reasonable, Fidelity's profitability methodologies are reasonable in all material respects.
The Board also reviewed Fidelity's non-fund businesses and fall-out benefits related to the mutual fund business as well as cases where Fidelity's affiliates may benefit from or be related to the fund's business.
The Board considered the costs of the services provided by and the profits realized by Fidelity in connection with the operation of the fund and was satisfied that the profitability was not excessive in the circumstances.
Economies of Scale. The Board considered whether there have been economies of scale in respect of the management of the Fidelity funds, whether the Fidelity funds (including the fund) have appropriately benefited from any such economies of scale, and whether there is potential for realization of any further economies of scale. The Board considered the extent to which the fund will benefit from economies of scale through increased services to the fund, through waivers or reimbursements, or through fee or expense reductions. The Board also noted that in 2009, it and the board of other Fidelity funds created an ad hoc committee (the Economies of Scale Committee) to analyze whether FMR attains economies of scale in respect of the management and servicing of the Fidelity funds, whether the Fidelity funds have appropriately benefited from such economies of scale, and whether there is potential for realization of any further economies of scale.
The Board recognized that the fund's management contract incorporates a "group fee" structure, which provides for lower group fee rates as total fund assets under FMR's management increase, and for higher group fee rates as total fund assets under FMR's management decrease. FMR calculates the group fee rates based on a tiered asset "breakpoint" schedule that varies based on asset class. The Board considered that the group fee is designed to deliver the benefits of economies of scale to fund shareholders when total Fidelity fund assets increase, even if assets of any particular fund are unchanged or have declined, because some portion of Fidelity's costs are attributable to services provided to all Fidelity funds, and all funds benefit if those costs can be allocated among more assets. The Board concluded that, given the group fee structure, fund shareholders will benefit from lower management fees as assets under FMR's management increase at the fund complex level, regardless of whether Fidelity achieves any such economies of scale.
Annual Report
Board Approval of Investment Advisory Contracts and
Management Fees - continued
The Board concluded, taking into account the analysis of the Economies of Scale Committee, that economies of scale, if any, are being appropriately shared between fund shareholders and Fidelity.
Additional Information Requested by the Board. In order to develop fully the factual basis for consideration of the Fidelity funds' Advisory Contracts, the Board requested and received additional information on certain topics, including (i) fund performance trends, actions to be taken by FMR to improve certain funds' overall performance, and Fidelity's long-term strategies for certain funds; (ii) the potential to further rationalize the Fidelity fund lineup with the possibility of achieving savings for the funds and Fidelity; (iii) Fidelity's compensation structure for portfolio managers and other key investment personnel; (iv) the amount of the investment that each portfolio manager has made in the Fidelity fund(s) that he or she manages; (v) the realization of fall-out benefits in certain Fidelity business units; (vi) Fidelity's group fee structures, the potential impact of regulatory changes on such structures, and the rationale for the individual fee rates of certain funds; (vii) fund profitability methodology, including Fidelity's cost allocation methodology, and the impact of certain factors on fund profitability results; (viii) trends regarding industry use of performance fee structures and the possibility of implementing performance fee structures for additional funds; and (ix) the impact of net redemptions from the Fidelity funds.
Based on its evaluation of all of the conclusions noted above, and after considering all factors it believed relevant, the Board ultimately concluded that the advisory fee structures are fair and reasonable, and that the fund's Advisory Contracts should be renewed.
Annual Report
Investment Adviser
Fidelity Management & Research Company
Boston, MA
Investment Sub-Advisers
FMR Co., Inc.
Fidelity Management & Research
(U.K.) Inc.
FIL Investments (Japan) Limited
FIL Investment Advisors
FIL Investment Advisors
(U.K.) Limited
Fidelity Management & Research
(Hong Kong) Limited
Fidelity Management & Research
(Japan) Inc.
General Distributor
Fidelity Distributors Corporation
Smithfield, RI
Transfer and Service Agents
Fidelity Investments Institutional
Operations Company, Inc.
Boston, MA
Fidelity Service Company, Inc.
Boston, MA
Custodian
State Street Bank & Trust Company
Quincy, MA
(Fidelity Investment logo)(registered trademark)
AEMEI-UANN-1212
1.861980.104
Fidelity®
Emerging Europe,
Middle East, Africa (EMEA)
Fund
Annual Report
October 31, 2012
(Fidelity Cover Art)
Contents
Performance | (Click Here) | How the fund has done over time. |
Management's Discussion of Fund Performance | (Click Here) | The Portfolio Manager's review of fund performance and strategy. |
Shareholder Expense Example | (Click Here) | An example of shareholder expenses. |
Investment Changes | (Click Here) | A summary of major shifts in the fund's investments over the past six months. |
Investments | (Click Here) | A complete list of the fund's investments with their market values. |
Financial Statements | (Click Here) | Statements of assets and liabilities, operations, and changes in net assets, as well as financial highlights. |
Notes | (Click Here) | Notes to the financial statements. |
Report of Independent Registered Public Accounting Firm | (Click Here) | |
Trustees and Officers | (Click Here) | |
Distributions | (Click Here) | |
Board Approval of Investment Advisory Contracts and Management Fees | (Click Here) | |
To view a fund's proxy voting guidelines and proxy voting record for the 12-month period ended June 30, visit http://www.fidelity.com/proxyvotingresults or visit the Securities and Exchange Commission's (SEC) web site at http://www.sec.gov. You may also call 1-800-544-8544 to request a free copy of the proxy voting guidelines.
Standard & Poor's, S&P and S&P 500 are registered service marks of The McGraw-Hill Companies, Inc. and have been licensed for use by Fidelity Distributors Corporation.
Other third party marks appearing herein are the property of their respective owners.
All other marks appearing herein are registered or unregistered trademarks or service marks of FMR LLC or an affiliated company. © 2012 FMR LLC. All rights reserved.
Annual Report
This report and the financial statements contained herein are submitted for the general information of the shareholders of the fund. This report is not authorized for distribution to prospective investors in the fund unless preceded or accompanied by an effective prospectus.
A fund files its complete schedule of portfolio holdings with the SEC for the first and third quarters of each fiscal year on Form N-Q. Forms N-Q are available on the SEC's web site at http://www.sec.gov. A fund's Forms N-Q may be reviewed and copied at the SEC's Public Reference Room in Washington, DC. Information regarding the operation of the SEC's Public Reference Room may be obtained by calling 1-800-SEC-0330. For a complete list of a fund's portfolio holdings, view the most recent holdings listing, semiannual report, or annual report on Fidelity's web site at http://www.fidelity.com, http://www.advisor.fidelity.com, or http://www.401k.com, as applicable.
NOT FDIC INSURED • MAY LOSE VALUE • NO BANK GUARANTEE
Neither the fund nor Fidelity Distributors Corporation is a bank.
Annual Report
Average annual total return reflects the change in the value of an investment, assuming reinvestment of the class' distributions from dividend income and capital gains (the profits earned upon the sale of securities that have grown in value, if any) and assuming a constant rate of performance each year. The $10,000 table and the fund's returns do not reflect the deduction of taxes that a shareholder would pay on fund distributions or the redemption of fund shares. During periods of reimbursement by Fidelity, a fund's total return will be greater than it would be had the reimbursement not occurred. How a fund did yesterday is no guarantee of how it will do tomorrow.
Average Annual Total Returns
Periods ended October 31, 2012 | Past 1
year | Life of
fund A |
Fidelity® Emerging Europe, Middle East, Africa (EMEA) Fund | 6.81% | -1.81% |
A From May 8, 2008.
$10,000 Over Life of Fund
Let's say hypothetically that $10,000 was invested in Fidelity® Emerging Europe, Middle East, Africa (EMEA) Fund, a class of the fund, on May 8, 2008, when the fund started. The chart shows how the value of your investment would have changed, and also shows how the MSCI® EM (Emerging Markets) Europe, Middle East and Africa Index performed over the same period.
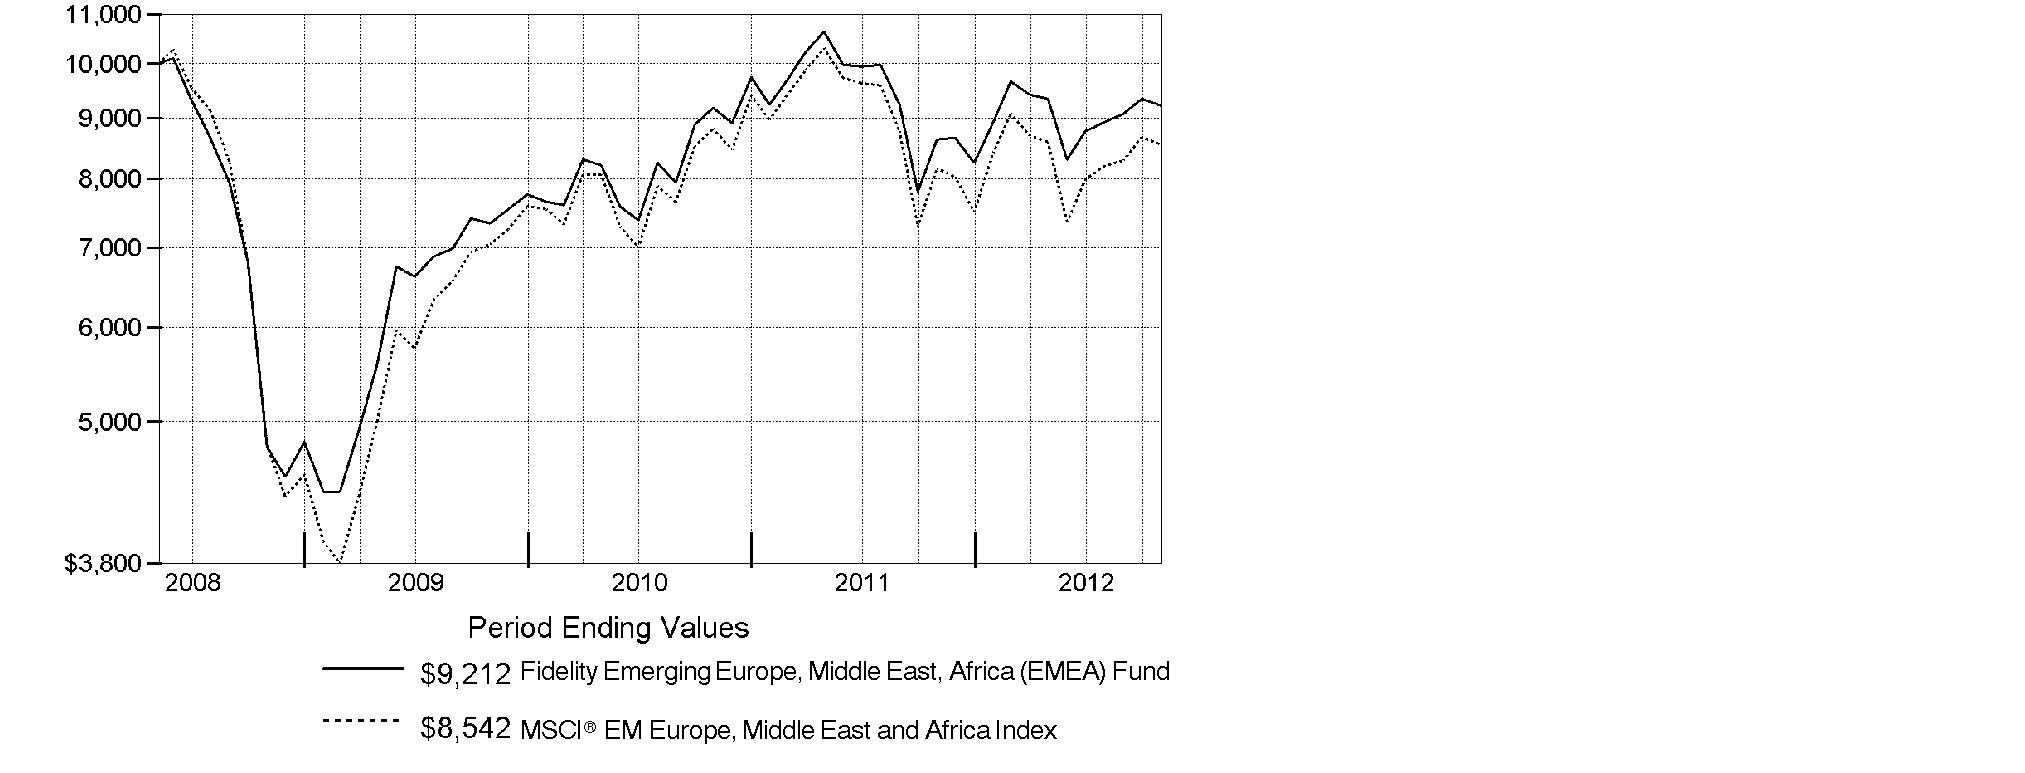
Annual Report
Market Recap: Emerging-markets stocks gained 2.98% for the year ending October 31, 2012, as measured by the MSCI® Emerging Markets Index. After some early choppiness, the index rallied strongly in the first two months of 2012 but retreated from March through May amid renewed concerns about Europe's sovereign debt crisis and continued economic sluggishness in key countries such as China and Brazil. A general uptrend in the final five months of the period lifted the index into positive territory for the full year, despite the head wind of a generally stronger U.S. dollar. Major benchmark component Brazil was a drag on performance, falling roughly 13%. The nation's inflation rate crept higher while economic growth ebbed, creating an unfavorable backdrop for stocks here. India's market retreated about 5%, while Russia gave up 4%. Conversely, Hong Kong advanced approximately 17%, aided by rebounding shares of property developers, while South Africa added 7%, China rose roughly 5% and South Korea and Taiwan gained about 4% and 1%, respectively. Sentiment about Chinese stocks improved following the government's September approval of massive outlays for infrastructure projects, in hopes of halting that nation's economic slowdown. However, China's ongoing transition to new Communist Party leadership created uncertainty that kept some investors on the sidelines.
Comments from Adam Kutas, Portfolio Manager of Fidelity® Emerging Europe, Middle East, Africa (EMEA) Fund: For the year, the fund's Retail Class shares returned 6.81%, outperforming the 4.73% gain of the MSCI® EM (Emerging Markets) Europe, Middle East and Africa Index. Relative to the index, an overweighting in consumer staples proved most fruitful, particularly within food and staples retailing. Our positioning in utilities also helped, as did an underweighting in materials and security selection in energy, financials and telecommunication services. Geographically, the fund was aided the most by stock selection in Kenya and out-of-benchmark holdings in Canada. Top contributors included Canada-based Africa Oil, three South African stocks - drug store chain Clicks Group, supermarket firm Shoprite Holdings and diversified financials firm FirstRand - and not owning Gold Fields and Impala Platinum Holdings, two underperforming index components located in South Africa. On the downside, an underweighting in consumer discretionary dampened relative returns, particularly in the media group. Regionally, positioning in Turkey and stock selection in Russia were negatives. Among the individual detractors were underweightings in South African media company Naspers and Russian retailer Magnit, an overweighting in South Africa's Harmony Gold Mining, an investment in Russian energy firm TNK-BP Holding and not owning Turkish bank and outperforming index component Akbank Turk Anonim Sirketi. Africa Oil and Magnit were not held by the fund at period end.
Note to shareholders: The fund may invest up to 35% of its total assets in any industry that represents more than 20% of the emerging Europe, Middle East and African markets. As of October 31, 2012, the fund did not have more than 25% of its total assets invested in any one industry.
The views expressed above reflect those of the portfolio manager(s) only through the end of the period as stated on the cover of this report and do not necessarily represent the views of Fidelity or any other person in the Fidelity organization. Any such views are subject to change at any time based upon market or other conditions and Fidelity disclaims any responsibility to update such views. These views may not be relied on as investment advice and, because investment decisions for a Fidelity fund are based on numerous factors, may not be relied on as an indication of trading intent on behalf of any Fidelity fund.
Annual Report
Shareholder Expense Example
As a shareholder of the Fund, you incur two types of costs: (1) transaction costs, including sales charges (loads) on purchase payments or redemption proceeds, redemption fees and (2) ongoing costs, including management fees, distribution and/or service (12b-1) fees and other Fund expenses. This Example is intended to help you understand your ongoing costs (in dollars) of investing in the Fund and to compare these costs with the ongoing costs of investing in other mutual funds.
The Example is based on an investment of $1,000 invested at the beginning of the period and held for the entire period (May 1, 2012 to October 31, 2012).
Actual Expenses
The first line of the accompanying table for each class of the Fund provides information about actual account values and actual expenses. You may use the information in this line, together with the amount you invested, to estimate the expenses that you paid over the period. Simply divide your account value by $1,000.00 (for example, an $8,600 account value divided by $1,000.00 = 8.6), then multiply the result by the number in the first line for a class of the Fund under the heading entitled "Expenses Paid During Period" to estimate the expenses you paid on your account during this period. A small balance maintenance fee of $12.00 that is charged once a year may apply for certain accounts with a value of less than $2,000. This fee is not included in the table below. If it was, the estimate of expenses you paid during the period would be higher, and your ending account value lower, by this amount. In addition, the Fund, as a shareholder in the underlying Fidelity Central Funds, will indirectly bear its pro-rata share of the fees and expenses incurred by the underlying Fidelity Central Funds. These fees and expenses are not included in the Fund's annualized expense ratio used to calculate the expense estimate in the table below.
Hypothetical Example for Comparison Purposes
The second line of the accompanying table for each class of the Fund provides information about hypothetical account values and hypothetical expenses based on a Class' actual expense ratio and an assumed rate of return of 5% per year before expenses, which is not the Class' actual return. The hypothetical account values and expenses may not be used to estimate the actual ending account balance or expenses you paid for the period. You may use this information to compare the ongoing costs of investing in the Fund and other funds. To do so, compare this 5% hypothetical example with the 5% hypothetical examples that appear in the shareholder reports of the other funds. A small balance maintenance fee of $12.00 that is charged once a year may apply for certain accounts with a value of less than $2,000. This fee is not included in the table below. If it was, the estimate of expenses you paid during the period would be higher, and your ending account value lower, by this amount. In addition, the Fund, as a shareholder in the underlying Fidelity Central Funds, will indirectly bear its pro-rata share of the fees and expenses incurred by the underlying Fidelity Central Funds. These fees and expenses are not included in the Fund's annualized expense ratio used to calculate the expense estimate in the table below.
Annual Report
Please note that the expenses shown in the table are meant to highlight your ongoing costs only and do not reflect any transaction costs. Therefore, the second line of the table is useful in comparing ongoing costs only, and will not help you determine the relative total costs of owning different funds. In addition, if these transactional costs were included, your costs would have been higher.
| Annualized
Expense Ratio | Beginning
Account Value
May 1, 2012 | Ending
Account Value
October 31, 2012 | Expenses Paid
During Period*
May 1, 2012 to
October 31, 2012 |
Class A | 1.59% | | | |
Actual | | $ 1,000.00 | $ 984.20 | $ 7.93 |
HypotheticalA | | $ 1,000.00 | $ 1,017.14 | $ 8.06 |
Class T | 1.88% | | | |
Actual | | $ 1,000.00 | $ 981.90 | $ 9.37 |
HypotheticalA | | $ 1,000.00 | $ 1,015.69 | $ 9.53 |
Class B | 2.34% | | | |
Actual | | $ 1,000.00 | $ 979.70 | $ 11.64 |
HypotheticalA | | $ 1,000.00 | $ 1,013.37 | $ 11.84 |
Class C | 2.35% | | | |
Actual | | $ 1,000.00 | $ 980.70 | $ 11.70 |
HypotheticalA | | $ 1,000.00 | $ 1,013.32 | $ 11.89 |
Emerging Europe, Middle East, Africa (EMEA) | 1.34% | | | |
Actual | | $ 1,000.00 | $ 986.50 | $ 6.69 |
HypotheticalA | | $ 1,000.00 | $ 1,018.40 | $ 6.80 |
Institutional Class | 1.24% | | | |
Actual | | $ 1,000.00 | $ 986.50 | $ 6.19 |
HypotheticalA | | $ 1,000.00 | $ 1,018.90 | $ 6.29 |
A 5% return per year before expenses
* Expenses are equal to each Class' annualized expense ratio, multiplied by the average account value over the period, multiplied by 184/366 (to reflect the one-half year period).
Annual Report
Investment Changes (Unaudited)
Geographic Diversification (% of fund's net assets) |
As of October 31, 2012 |
 | South Africa 42.4% | |
 | Russia 30.6% | |
 | Turkey 6.4% | |
 | United Arab Emirates 5.1% | |
 | Poland 2.6% | |
 | Kenya 2.3% | |
 | Nigeria 1.6% | |
 | Morocco 1.0% | |
| Other* 8.0% | |

* Includes short-term investments and net other assets. |
Percentages are based on country or territory of incorporation and are adjusted for the effect of futures contracts, if applicable. |
As of April 30, 2012 |
| South Africa 47.1% | |
| Russia 31.2% | |
| Turkey 5.0% | |
| United Arab Emirates 3.5% | |
 | Kenya 2.5% | |
| Poland 2.4% | |
| Nigeria 1.5% | |
| Morocco 1.0% | |
| Qatar 0.9% | |
| Other* 4.9% | |

* Includes short-term investments and net other assets. |
Percentages are based on country or territory of incorporation and are adjusted for the effect of futures contracts, if applicable. |
Asset Allocation |
| % of fund's
net assets | % of fund's net assets
6 months ago |
Stocks | 95.5 | 98.7 |
Bonds | 0.6 | 0.6 |
Short-Term Investments and Net Other Assets (Liabilities) | 3.9 | 0.7 |
Top Ten Stocks as of October 31, 2012 |
| % of fund's
net assets | % of fund's net assets
6 months ago |
MTN Group Ltd. (South Africa, Wireless Telecommunication Services) | 7.8 | 7.4 |
Lukoil Oil Co. (Russia, Oil, Gas & Consumable Fuels) | 7.6 | 6.3 |
Sberbank (Savings Bank of the Russian Federation) (Russia, Commercial Banks) | 6.8 | 6.5 |
Gazprom OAO (Russia, Oil, Gas & Consumable Fuels) | 6.4 | 8.0 |
Standard Bank Group Ltd. (South Africa, Commercial Banks) | 3.7 | 5.0 |
Turkiye Garanti Bankasi A/S (Turkey, Commercial Banks) | 3.3 | 2.4 |
FirstRand Ltd. (South Africa, Diversified Financial Services) | 3.2 | 4.2 |
Clicks Group Ltd. (South Africa, Food & Staples Retailing) | 3.0 | 2.8 |
NOVATEK OAO (Russia, Oil, Gas & Consumable Fuels) | 2.6 | 2.7 |
Surgutneftegaz JSC (Russia, Oil, Gas & Consumable Fuels) | 2.6 | 2.3 |
| 47.0 | |
Market Sectors as of October 31, 2012 |
| % of fund's
net assets | % of fund's net assets
6 months ago |
Financials | 28.0 | 26.8 |
Energy | 26.3 | 27.5 |
Telecommunication Services | 13.4 | 13.5 |
Materials | 9.7 | 10.8 |
Consumer Staples | 9.5 | 10.5 |
Industrials | 3.5 | 3.2 |
Consumer Discretionary | 3.0 | 4.1 |
Health Care | 1.6 | 1.3 |
Utilities | 0.5 | 1.0 |
Information Technology | 0.3 | 0.3 |
Annual Report
Investments October 31, 2012
Showing Percentage of Net Assets
Common Stocks - 92.9% |
| Shares | | Value |
Bailiwick of Jersey - 0.4% |
Randgold Resources Ltd. | 5,200 | | $ 621,595 |
Canada - 0.4% |
Silver Wheaton Corp. | 13,200 | | 531,965 |
Czech Republic - 0.7% |
Philip Morris CR A/S | 1,700 | | 910,824 |
Kenya - 2.3% |
Barclays Bank of Kenya Ltd. | 1,820,550 | | 337,812 |
British American Tobacco Kenya Ltd. | 76,700 | | 420,656 |
East African Breweries Ltd. | 153,906 | | 433,793 |
Kenya Airways Ltd. | 1,754,900 | | 256,588 |
Safaricom Ltd. | 25,380,571 | | 1,311,503 |
Uchumi Supermarket Ltd. | 2,000,000 | | 461,538 |
TOTAL KENYA | | 3,221,890 |
Morocco - 1.0% |
Maroc Telecom SA | 112,000 | | 1,415,396 |
Nigeria - 1.6% |
Guaranty Trust Bank PLC | 5,238,796 | | 660,437 |
Nigerian Breweries PLC | 124,501 | | 96,075 |
Skye Bank PLC | 28,071,010 | | 729,210 |
Zenith Bank PLC | 6,364,370 | | 730,205 |
TOTAL NIGERIA | | 2,215,927 |
Poland - 2.6% |
Bank Polska Kasa Opieki SA | 45,800 | | 2,199,157 |
Eurocash SA | 61,300 | | 748,622 |
Kruk SA (a) | 53,400 | | 729,250 |
TOTAL POLAND | | 3,677,029 |
Qatar - 0.9% |
Qatar National Bank SAQ | 18,153 | | 667,597 |
Vodafone Qatar QSC (a) | 254,173 | | 628,286 |
TOTAL QATAR | | 1,295,883 |
Russia - 28.0% |
Gazprom OAO | 1,948,900 | | 9,009,597 |
Lukoil Oil Co. | 5,000 | | 303,582 |
Lukoil Oil Co. sponsored ADR (United Kingdom) | 171,495 | | 10,366,873 |
NOVATEK OAO | 40,000 | | 434,273 |
NOVATEK OAO GDR (Reg. S) | 28,500 | | 3,249,000 |
Rosneft Oil Co. OJSC | 140,000 | | 1,038,970 |
Rosneft Oil Co. OJSC GDR (Reg. S) | 146,700 | | 1,085,580 |
Common Stocks - continued |
| Shares | | Value |
Russia - continued |
Sberbank (Savings Bank of the Russian Federation) | 3,263,700 | | $ 9,554,222 |
Sistema JSFC sponsored GDR | 11,700 | | 214,695 |
TNK-BP Holding | 909,300 | | 1,856,259 |
Uralkali OJSC | 282,800 | | 2,229,184 |
TOTAL RUSSIA | | 39,342,235 |
South Africa - 42.4% |
Adcock Ingram Holdings Ltd. | 62,000 | | 414,017 |
AngloGold Ashanti Ltd. | 86,100 | | 2,908,917 |
Aspen Pharmacare Holdings Ltd. | 74,300 | | 1,353,924 |
Cashbuild Ltd. | 60,100 | | 1,039,299 |
Clicks Group Ltd. | 609,706 | | 4,203,632 |
DRDGOLD Ltd. | 1,483,914 | | 1,040,544 |
FirstRand Ltd. | 1,370,500 | | 4,549,023 |
Harmony Gold Mining Co. Ltd. | 435,600 | | 3,568,840 |
Holdsport Ltd. | 80,000 | | 415,194 |
Kagiso Media Ltd. | 123,000 | | 283,716 |
Massmart Holdings Ltd. | 81,300 | | 1,635,255 |
MTN Group Ltd. | 610,950 | | 11,016,002 |
Nampak Ltd. | 689,600 | | 2,298,494 |
Naspers Ltd. Class N | 39,600 | | 2,570,884 |
Omnia Holdings Ltd. | 26,000 | | 384,873 |
Pinnacle Technology Holdings Ltd. | 218,800 | | 432,773 |
Pioneer Foods Ltd. | 172,000 | | 1,100,956 |
Rand Merchant Insurance Holdings Ltd. | 120,900 | | 315,265 |
Raubex Group Ltd. | 1,475,600 | | 2,808,025 |
RMB Holdings Ltd. | 286,500 | | 1,256,937 |
Sanlam Ltd. | 381,900 | | 1,705,868 |
Sasol Ltd. | 77,900 | | 3,318,546 |
Shoprite Holdings Ltd. | 111,100 | | 2,284,619 |
Standard Bank Group Ltd. | 419,763 | | 5,185,403 |
Vodacom Group Ltd. | 239,600 | | 3,020,336 |
Wilson Bayly Holmes-Ovcon Ltd. | 27,700 | | 453,965 |
TOTAL SOUTH AFRICA | | 59,565,307 |
Turkey - 6.4% |
Aygaz A/S | 159,000 | | 732,686 |
Koc Holding A/S | 143,850 | | 675,714 |
Turk Telekomunikasyon A/S | 324,100 | | 1,265,662 |
Turkiye Garanti Bankasi A/S | 984,000 | | 4,699,046 |
Turkiye Petrol Rafinerile A/S | 68,000 | | 1,661,590 |
TOTAL TURKEY | | 9,034,698 |
Common Stocks - continued |
| Shares | | Value |
United Arab Emirates - 5.1% |
Agthia Group PJSC | 734,869 | | $ 390,143 |
Aldar Properties PJSC (a) | 1,587,210 | | 587,696 |
Dubai Financial Market PJSC (a) | 5,815,429 | | 1,599,124 |
Emaar Properties (a) | 330,000 | | 324,340 |
Emirates NBD Bank PJSC | 396,999 | | 311,287 |
First Gulf Bank PJSC | 1,093,458 | | 3,110,982 |
National Bank of Abu Dhabi PJSC (a) | 156,000 | | 420,474 |
NMC Health PLC | 160,300 | | 468,218 |
TOTAL UNITED ARAB EMIRATES | | 7,212,264 |
United Kingdom - 0.7% |
Tullow Oil PLC | 40,500 | | 917,611 |
Zambia - 0.4% |
Zambeef Products PLC | 997,525 | | 509,548 |
TOTAL COMMON STOCKS (Cost $128,358,203) |
130,472,172
|
Nonconvertible Preferred Stocks - 2.6% |
| | | |
Russia - 2.6% |
Surgutneftegaz JSC
(Cost $3,238,242) | 5,826,700 | |
3,608,911
|
Nonconvertible Bonds - 0.3% |
| Principal Amount | | |
Multi-National - 0.3% |
International Bank for Reconstruction & Development 8.2% 12/12/12
(Cost $510,799) | NGN | 80,000,000 | |
501,719
|
Government Obligations - 0.3% |
|
Ghana - 0.3% |
Ghana Republic 14.99% 3/11/13
(Cost $672,328) | GHS | 950,000 | |
495,198
|
Money Market Funds - 3.4% |
| Shares | | Value |
Fidelity Cash Central Fund, 0.19% (b)
(Cost $4,780,137) | 4,780,137 | | $ 4,780,137 |
TOTAL INVESTMENT PORTFOLIO - 99.5% (Cost $137,559,709) | | 139,858,137 |
NET OTHER ASSETS (LIABILITIES) - 0.5% | | 649,226 |
NET ASSETS - 100% | $ 140,507,363 |
Currency Abbreviations |
GHS | - | Ghana Cedi |
NGN | - | Nigerian naira |
Legend |
(a) Non-income producing |
(b) Affiliated fund that is available only to investment companies and other accounts managed by Fidelity Investments. The rate quoted is the annualized seven-day yield of the fund at period end. A complete unaudited listing of the fund's holdings as of its most recent quarter end is available upon request. In addition, each Fidelity Central Fund's financial statements, which are not covered by the Fund's Report of Independent Registered Public Accounting Firm, are available on the SEC's website or upon request. |
Affiliated Central Funds |
Information regarding fiscal year to date income earned by the Fund from investments in Fidelity Central Funds is as follows: |
Fund | Income earned |
Fidelity Cash Central Fund | $ 1,816 |
Fidelity Securities Lending Cash Central Fund | 2,270 |
Total | $ 4,086 |
Other Information |
Categorizations in the Schedule of Investments are based on country or territory of incorporation. |
The following is a summary of the inputs used, as of October 31, 2012, involving the Fund's assets and liabilities carried at fair value. The inputs or methodology used for valuing securities may not be an indication of the risk associated with investing in those securities. For more information on valuation inputs, and their aggregation into the levels used in the table below, please refer to the Security Valuation section in the accompanying Notes to Financial Statements. |
Valuation Inputs at Reporting Date: |
Description | Total | Level 1 | Level 2 | Level 3 |
Investments in Securities: | | | | |
Equities: | | | | |
Consumer Discretionary | $ 4,309,093 | $ 4,309,093 | $ - | $ - |
Consumer Staples | 13,195,661 | 13,195,661 | - | - |
Energy | 36,850,792 | 33,532,246 | 3,318,546 | - |
Financials | 38,944,085 | 38,944,085 | - | - |
Health Care | 2,236,159 | 2,236,159 | - | - |
Industrials | 4,923,542 | 4,923,542 | - | - |
Information Technology | 432,773 | 432,773 | - | - |
Materials | 13,584,412 | 6,485,060 | 7,099,352 | - |
Telecommunication Services | 18,871,880 | 18,871,880 | - | - |
Utilities | 732,686 | 732,686 | - | - |
Corporate Bonds | 501,719 | - | 501,719 | - |
Government Obligations | 495,198 | - | 495,198 | - |
Money Market Funds | 4,780,137 | 4,780,137 | - | - |
Total Investments in Securities: | $ 139,858,137 | $ 128,443,322 | $ 11,414,815 | $ - |
See accompanying notes which are an integral part of the financial statements.
Annual Report
Statement of Assets and Liabilities
| October 31, 2012 |
| | |
Assets | | |
Investment in securities, at value - See accompanying schedule: Unaffiliated issuers (cost $132,779,572) | $ 135,078,000 | |
Fidelity Central Funds (cost $4,780,137) | 4,780,137 | |
Total Investments (cost $137,559,709) | | $ 139,858,137 |
Foreign currency held at value (cost $4) | | 4 |
Receivable for investments sold | | 932,927 |
Receivable for fund shares sold | | 236,104 |
Dividends receivable | | 137,560 |
Interest receivable | | 46,891 |
Distributions receivable from Fidelity Central Funds | | 384 |
Other receivables | | 20,009 |
Total assets | | 141,232,016 |
| | |
Liabilities | | |
Payable to custodian bank | $ 173,955 | |
Payable for investments purchased | 203,317 | |
Payable for fund shares redeemed | 116,731 | |
Accrued management fee | 94,834 | |
Distribution and service plan fees payable | 10,112 | |
Other affiliated payables | 40,250 | |
Other payables and accrued expenses | 85,454 | |
Total liabilities | | 724,653 |
| | |
Net Assets | | $ 140,507,363 |
Net Assets consist of: | | |
Paid in capital | | $ 137,298,110 |
Undistributed net investment income | | 2,631,143 |
Accumulated undistributed net realized gain (loss) on investments and foreign currency transactions | | (1,720,590) |
Net unrealized appreciation (depreciation) on investments and assets and liabilities in foreign currencies | | 2,298,700 |
Net Assets | | $ 140,507,363 |
See accompanying notes which are an integral part of the financial statements.
Annual Report
Statement of Assets and Liabilities - continued
| October 31, 2012 |
| | |
Calculation of Maximum Offering Price Class A:
Net Asset Value and redemption price per share ($8,933,695 ÷ 1,025,317 shares) | | $ 8.71 |
| | |
Maximum offering price per share (100/94.25 of $8.71) | | $ 9.24 |
Class T:
Net Asset Value and redemption price per share ($3,335,630 ÷ 384,126 shares) | | $ 8.68 |
| | |
Maximum offering price per share (100/96.50 of $8.68) | | $ 8.99 |
Class B:
Net Asset Value and offering price per share ($441,311 ÷ 50,760 shares)A | | $ 8.69 |
| | |
Class C:
Net Asset Value and offering price per share ($7,769,597 ÷ 901,585 shares)A | | $ 8.62 |
| | |
| | |
Emerging Europe, Middle East, Africa (EMEA):
Net Asset Value, offering price and redemption price per share ($111,441,166 ÷ 12,742,737 shares) | | $ 8.75 |
| | |
Institutional Class:
Net Asset Value, offering price and redemption price per share ($8,585,964 ÷ 981,532 shares) | | $ 8.75 |
A Redemption price per share is equal to net asset value less any applicable contingent deferred sales charge.
See accompanying notes which are an integral part of the financial statements.
Annual Report
Financial Statements - continued
Statement of Operations
| Year ended October 31, 2012 |
| | |
Investment Income | | |
Dividends | | $ 5,662,084 |
Interest | | 119,997 |
Income from Fidelity Central Funds | | 4,086 |
Income before foreign taxes withheld | | 5,786,167 |
Less foreign taxes withheld | | (570,242) |
Total income | | 5,215,925 |
| | |
Expenses | | |
Management fee | $ 1,144,017 | |
Transfer agent fees | 410,177 | |
Distribution and service plan fees | 121,246 | |
Accounting and security lending fees | 73,383 | |
Custodian fees and expenses | 162,444 | |
Independent trustees' compensation | 932 | |
Registration fees | 80,566 | |
Audit | 61,768 | |
Legal | 700 | |
Miscellaneous | 1,543 | |
Total expenses before reductions | 2,056,776 | |
Expense reductions | (39,356) | 2,017,420 |
Net investment income (loss) | | 3,198,505 |
Realized and Unrealized Gain (Loss) Net realized gain (loss) on: | | |
Investment securities: | | |
Unaffiliated issuers | 10,659,509 | |
Foreign currency transactions | (146,089) | |
Total net realized gain (loss) | | 10,513,420 |
Change in net unrealized appreciation (depreciation) on: Investment securities | (5,473,687) | |
Assets and liabilities in foreign currencies | 2,731 | |
Total change in net unrealized appreciation (depreciation) | | (5,470,956) |
Net gain (loss) | | 5,042,464 |
Net increase (decrease) in net assets resulting from operations | | $ 8,240,969 |
See accompanying notes which are an integral part of the financial statements.
Annual Report
Statement of Changes in Net Assets
| Year ended
October 31,
2012 | Year ended
October 31,
2011 |
Increase (Decrease) in Net Assets | | |
Operations | | |
Net investment income (loss) | $ 3,198,505 | $ 3,341,999 |
Net realized gain (loss) | 10,513,420 | 3,427,666 |
Change in net unrealized appreciation (depreciation) | (5,470,956) | (17,523,712) |
Net increase (decrease) in net assets resulting
from operations | 8,240,969 | (10,754,047) |
Distributions to shareholders from net investment income | (2,782,952) | (1,835,361) |
Distributions to shareholders from net realized gain | - | (302,617) |
Total distributions | (2,782,952) | (2,137,978) |
Share transactions - net increase (decrease) | (7,689,254) | (11,096,734) |
Redemption fees | 36,290 | 119,309 |
Total increase (decrease) in net assets | (2,194,947) | (23,869,450) |
| | |
Net Assets | | |
Beginning of period | 142,702,310 | 166,571,760 |
End of period (including undistributed net investment income of $2,631,143 and undistributed net investment income of $2,747,743, respectively) | $ 140,507,363 | $ 142,702,310 |
See accompanying notes which are an integral part of the financial statements.
Annual Report
Financial Highlights - Class A
Years ended October 31, | 2012 | 2011 | 2010 | 2009 | 2008 I |
Selected Per-Share Data | | | | | |
Net asset value, beginning of period | $ 8.34 | $ 8.97 | $ 7.26 | $ 4.75 | $ 10.00 |
Income from Investment Operations | | | | | |
Net investment income (loss) E | .18 | .16 H | .07 | .05 | .04 |
Net realized and unrealized gain (loss) | .34 | (.70) | 1.70 | 2.48 | (5.31) |
Total from investment operations | .52 | (.54) | 1.77 | 2.53 | (5.27) |
Distributions from net investment income | (.15) | (.08) | (.04) | (.03) | - |
Distributions from net realized gain | - | (.02) | (.02) | - | - |
Total distributions | (.15) | (.10) | (.07) L | (.03) | - |
Redemption fees added to paid in capital E | - K | .01 | .01 | .01 | .02 |
Net asset value, end of period | $ 8.71 | $ 8.34 | $ 8.97 | $ 7.26 | $ 4.75 |
Total Return B, C, D | 6.38% | (6.05)% | 24.66% | 53.78% | (52.50)% |
Ratios to Average Net Assets F, J | | | | | |
Expenses before reductions | 1.62% | 1.60% | 1.69% | 1.87% | 2.50% A |
Expenses net of fee waivers, if any | 1.62% | 1.56% | 1.50% | 1.50% | 1.50% A |
Expenses net of all reductions | 1.60% | 1.51% | 1.38% | 1.39% | 1.23% A |
Net investment income (loss) | 2.09% | 1.70% H | .95% | .84% | 1.20% A |
Supplemental Data | | | | | |
Net assets, end of period (000 omitted) | $ 8,934 | $ 10,260 | $ 10,045 | $ 4,817 | $ 1,368 |
Portfolio turnover rate G | 30% | 53% | 96% | 58% | 68% |
A Annualized
B Total returns for periods of less than one year are not annualized.
C Total returns would have been lower if certain expenses had not been reduced during the applicable periods shown.
D Total returns do not include the effect of the sales charges.
E Calculated based on average shares outstanding during the period.
F Fees and expenses of any underlying Fidelity Central Funds are not included in the Fund's expense ratio. The Fund indirectly bears its proportionate share of the expenses of any underlying Fidelity Central Funds.
G Amount does not include the portfolio activity of any underlying Fidelity Central Funds.
H Investment income per share reflects a large, non-recurring dividend which amounted to $.04 per share. Excluding this non-recurring dividend, the ratio of net investment income (loss) to average net assets would have been 1.25%.
I For the period May 8, 2008 (commencement of operations) to October 31, 2008.
J Expense ratios reflect operating expenses of the class. Expenses before reductions do not reflect amounts reimbursed by the investment adviser or reductions from brokerage service arrangements or reductions from other expense offset arrangements and do not represent the amount paid by the class during periods when reimbursements or reductions occur. Expense ratios before reductions for start-up periods may not be representative of longer-term operating periods. Expenses net of fee waivers reflect expenses after reimbursement by the investment adviser but prior to reductions from brokerage service arrangements or other expense offset arrangements. Expenses net of all reductions represent the net expenses paid by the class.
K Amount represents less than $.01 per share.
L Total distributions of $.07 per share is comprised of distributions from net investment income of $.041 and distributions from net realized gain of $.024 per share.
See accompanying notes which are an integral part of the financial statements.
Annual Report
Financial Highlights - Class T
Years ended October 31, | 2012 | 2011 | 2010 | 2009 | 2008 I |
Selected Per-Share Data | | | | | |
Net asset value, beginning of period | $ 8.31 | $ 8.96 | $ 7.25 | $ 4.75 | $ 10.00 |
Income from Investment Operations | | | | | |
Net investment income (loss) E | .15 | .13 H | .06 | .04 | .04 |
Net realized and unrealized gain (loss) | .35 | (.71) | 1.69 | 2.47 | (5.31) |
Total from investment operations | .50 | (.58) | 1.75 | 2.51 | (5.27) |
Distributions from net investment income | (.13) | (.07) | (.03) | (.02) | - |
Distributions from net realized gain | - | (.02) | (.02) | - | - |
Total distributions | (.13) | (.08) L | (.05) | (.02) | - |
Redemption fees added to paid in capital E | - K | .01 | .01 | .01 | .02 |
Net asset value, end of period | $ 8.68 | $ 8.31 | $ 8.96 | $ 7.25 | $ 4.75 |
Total Return B, C, D | 6.14% | (6.42)% | 24.44% | 53.20% | (52.50)% |
Ratios to Average Net Assets F, J | | | | | |
Expenses before reductions | 1.89% | 1.87% | 1.95% | 2.15% | 2.78% A |
Expenses net of fee waivers, if any | 1.89% | 1.84% | 1.75% | 1.75% | 1.75% A |
Expenses net of all reductions | 1.86% | 1.78% | 1.62% | 1.64% | 1.49% A |
Net investment income (loss) | 1.82% | 1.42% H | .70% | .59% | .95% A |
Supplemental Data | | | | | |
Net assets, end of period (000 omitted) | $ 3,336 | $ 3,502 | $ 3,114 | $ 1,560 | $ 568 |
Portfolio turnover rate G | 30% | 53% | 96% | 58% | 68% |
A Annualized
B Total returns for periods of less than one year are not annualized.
C Total returns would have been lower if certain expenses had not been reduced during the applicable periods shown.
D Total returns do not include the effect of the sales charges.
E Calculated based on average shares outstanding during the period.
F Fees and expenses of any underlying Fidelity Central Funds are not included in the Fund's expense ratio. The Fund indirectly bears its proportionate share of the expenses of any underlying Fidelity Central Funds.
G Amount does not include the portfolio activity of any underlying Fidelity Central Funds.
H Investment income per share reflects a large, non-recurring dividend which amounted to $.04 per share. Excluding this non-recurring dividend, the ratio of net investment income (loss) to average net assets would have been .98%.
I For the period May 8, 2008 (commencement of operations) to October 31, 2008.
J Expense ratios reflect operating expenses of the class. Expenses before reductions do not reflect amounts reimbursed by the investment adviser or reductions from brokerage service arrangements or reductions from other expense offset arrangements and do not represent the amount paid by the class during periods when reimbursements or reductions occur. Expense ratios before reductions for start-up periods may not be representative of longer-term operating periods. Expenses net of fee waivers reflect expenses after reimbursement by the investment adviser but prior to reductions from brokerage service arrangements or other expense offset arrangements. Expenses net of all reductions represent the net expenses paid by the class.
K Amount represents less than $.01 per share.
L Total distributions of $.08 per share is comprised of distributions from net investment income of $.068 and distributions from net realized gain of $.015 per share.
See accompanying notes which are an integral part of the financial statements.
Annual Report
Financial Highlights - Class B
Years ended October 31, | 2012 | 2011 | 2010 | 2009 | 2008 I |
Selected Per-Share Data | | | | | |
Net asset value, beginning of period | $ 8.29 | $ 8.93 | $ 7.23 | $ 4.73 | $ 10.00 |
Income from Investment Operations | | | | | |
Net investment income (loss) E | .11 | .09 H | .02 | .01 | .02 |
Net realized and unrealized gain (loss) | .35 | (.71) | 1.68 | 2.48 | (5.31) |
Total from investment operations | .46 | (.62) | 1.70 | 2.49 | (5.29) |
Distributions from net investment income | (.06) | (.02) | - | - | - |
Distributions from net realized gain | - | (.01) | (.01) | - | - |
Total distributions | (.06) | (.03) | (.01) | - | - |
Redemption fees added to paid in capital E | - K | .01 | .01 | .01 | .02 |
Net asset value, end of period | $ 8.69 | $ 8.29 | $ 8.93 | $ 7.23 | $ 4.73 |
Total Return B, C, D | 5.56% | (6.85)% | 23.72% | 52.85% | (52.70)% |
Ratios to Average Net Assets F, J | | | | | |
Expenses before reductions | 2.38% | 2.37% | 2.47% | 2.68% | 3.32% A |
Expenses net of fee waivers, if any | 2.38% | 2.33% | 2.25% | 2.25% | 2.25% A |
Expenses net of all reductions | 2.35% | 2.27% | 2.12% | 2.14% | 1.99% A |
Net investment income (loss) | 1.33% | .93% H | .20% | .09% | .45% A |
Supplemental Data | | | | | |
Net assets, end of period (000 omitted) | $ 441 | $ 539 | $ 822 | $ 782 | $ 487 |
Portfolio turnover rate G | 30% | 53% | 96% | 58% | 68% |
A Annualized
B Total returns for periods of less than one year are not annualized.
C Total returns would have been lower if certain expenses had not been reduced during the applicable periods shown.
D Total returns do not include the effect of the contingent deferred sales charge.
E Calculated based on average shares outstanding during the period.
F Fees and expenses of any underlying Fidelity Central Funds are not included in the Fund's expense ratio. The Fund indirectly bears its proportionate share of the expenses of any underlying Fidelity Central Funds.
G Amount does not include the portfolio activity of any underlying Fidelity Central Funds.
H Investment income per share reflects a large, non-recurring dividend which amounted to $.04 per share. Excluding this non-recurring dividend, the ratio of net investment income (loss) to average net assets would have been .49%.
I For the period May 8, 2008 (commencement of operations) to October 31, 2008.
J Expense ratios reflect operating expenses of the class. Expenses before reductions do not reflect amounts reimbursed by the investment adviser or reductions from brokerage service arrangements or reductions from other expense offset arrangements and do not represent the amount paid by the class during periods when reimbursements or reductions occur. Expense ratios before reductions for start-up periods may not be representative of longer-term operating periods. Expenses net of fee waivers reflect expenses after reimbursement by the investment adviser but prior to reductions from brokerage service arrangements or other expense offset arrangements. Expenses net of all reductions represent the net expenses paid by the class.
K Amount represents less than $.01 per share.
See accompanying notes which are an integral part of the financial statements.
Annual Report
Financial Highlights - Class C
Years ended October 31, | 2012 | 2011 | 2010 | 2009 | 2008 I |
Selected Per-Share Data | | | | | |
Net asset value, beginning of period | $ 8.24 | $ 8.90 | $ 7.23 | $ 4.73 | $ 10.00 |
Income from Investment Operations | | | | | |
Net investment income (loss) E | .11 | .08 H | .02 | .01 | .02 |
Net realized and unrealized gain (loss) | .35 | (.69) | 1.67 | 2.48 | (5.31) |
Total from investment operations | .46 | (.61) | 1.69 | 2.49 | (5.29) |
Distributions from net investment income | (.08) | (.05) | (.01) | - | - |
Distributions from net realized gain | - | (.02) | (.02) | - | - |
Total distributions | (.08) | (.06) L | (.03) | - | - |
Redemption fees added to paid in capital E | - K | .01 | .01 | .01 | .02 |
Net asset value, end of period | $ 8.62 | $ 8.24 | $ 8.90 | $ 7.23 | $ 4.73 |
Total Return B, C, D | 5.68% | (6.79)% | 23.61% | 52.85% | (52.70)% |
Ratios to Average Net Assets F, J | | | | | |
Expenses before reductions | 2.37% | 2.36% | 2.45% | 2.61% | 3.28% A |
Expenses net of fee waivers, if any | 2.37% | 2.33% | 2.25% | 2.25% | 2.25% A |
Expenses net of all reductions | 2.35% | 2.27% | 2.13% | 2.14% | 1.99% A |
Net investment income (loss) | 1.34% | .93% H | .20% | .09% | .45% A |
Supplemental Data | | | | | |
Net assets, end of period (000 omitted) | $ 7,770 | $ 6,650 | $ 5,151 | $ 2,677 | $ 741 |
Portfolio turnover rate G | 30% | 53% | 96% | 58% | 68% |
A Annualized
B Total returns for periods of less than one year are not annualized.
C Total returns would have been lower if certain expenses had not been reduced during the applicable periods shown.
D Total returns do not include the effect of the contingent deferred sales charge.
E Calculated based on average shares outstanding during the period.
F Fees and expenses of any underlying Fidelity Central Funds are not included in the Fund's expense ratio. The Fund indirectly bears its proportionate share of the expenses of any underlying Fidelity Central Funds.
G Amount does not include the portfolio activity of any underlying Fidelity Central Funds.
H Investment income per share reflects a large, non-recurring dividend which amounted to $.04 per share. Excluding this non-recurring dividend, the ratio of net investment income (loss) to average net assets would have been .49%.
I For the period May 8, 2008 (commencement of operations) to October 31, 2008.
J Expense ratios reflect operating expenses of the class. Expenses before reductions do not reflect amounts reimbursed by the investment adviser or reductions from brokerage service arrangements or reductions from other expense offset arrangements and do not represent the amount paid by the class during periods when reimbursements or reductions occur. Expense ratios before reductions for start-up periods may not be representative of longer-term operating periods. Expenses net of fee waivers reflect expenses after reimbursement by the investment adviser but prior to reductions from brokerage service arrangements or other expense offset arrangements. Expenses net of all reductions represent the net expenses paid by the class.
K Amount represents less than $.01 per share.
L Total distributions of $.06 per share is comprised of distributions from net investment income of $.047 and distributions from net realized gain of $.015 per share.
See accompanying notes which are an integral part of the financial statements.
Annual Report
Financial Highlights - Emerging Europe, Middle East, Africa (EMEA)
Years ended October 31, | 2012 | 2011 | 2010 | 2009 | 2008 H |
Selected Per-Share Data | | | | | |
Net asset value, beginning of period | $ 8.37 | $ 9.00 | $ 7.28 | $ 4.76 | $ 10.00 |
Income from Investment Operations | | | | | |
Net investment income (loss) D | .20 | .18 G | .09 | .07 | .05 |
Net realized and unrealized gain (loss) | .35 | (.71) | 1.70 | 2.48 | (5.31) |
Total from investment operations | .55 | (.53) | 1.79 | 2.55 | (5.26) |
Distributions from net investment income | (.17) | (.09) | (.05) | (.04) | - |
Distributions from net realized gain | - | (.02) | (.02) | - | - |
Total distributions | (.17) | (.11) | (.08) K | (.04) | - |
Redemption fees added to paid in capital D | - J | .01 | .01 | .01 | .02 |
Net asset value, end of period | $ 8.75 | $ 8.37 | $ 9.00 | $ 7.28 | $ 4.76 |
Total Return B, C | 6.81% | (5.91)% | 24.92% | 54.15% | (52.40)% |
Ratios to Average Net Assets E, I | | | | | |
Expenses before reductions | 1.37% | 1.35% | 1.45% | 1.61% | 2.19% A |
Expenses net of fee waivers, if any | 1.37% | 1.31% | 1.25% | 1.25% | 1.25% A |
Expenses net of all reductions | 1.34% | 1.25% | 1.12% | 1.14% | .98% A |
Net investment income (loss) | 2.34% | 1.95% G | 1.21% | 1.09% | 1.45% A |
Supplemental Data | | | | | |
Net assets, end of period (000 omitted) | $ 111,441 | $ 114,117 | $ 140,270 | $ 104,141 | $ 32,535 |
Portfolio turnover rate F | 30% | 53% | 96% | 58% | 68% |
A Annualized
B Total returns for periods of less than one year are not annualized.
C Total returns would have been lower if certain expenses had not been reduced during the applicable periods shown.
D Calculated based on average shares outstanding during the period.
E Fees and expenses of any underlying Fidelity Central Funds are not included in the Fund's expense ratio. The Fund indirectly bears its proportionate share of the expenses of any underlying Fidelity Central Funds.
F Amount does not include the portfolio activity of any underlying Fidelity Central Funds.
G Investment income per share reflects a large, non-recurring dividend which amounted to $.04 per share. Excluding this non-recurring dividend, the ratio of net investment income (loss) to average net assets would have been 1.51%.
H For the period May 8, 2008 (commencement of operations) to October 31, 2008.
I Expense ratios reflect operating expenses of the class. Expenses before reductions do not reflect amounts reimbursed by the investment adviser or reductions from brokerage service arrangements or reductions from other expense offset arrangements and do not represent the amount paid by the class during periods when reimbursements or reductions occur. Expense ratios before reductions for start-up periods may not be representative of longer-term operating periods. Expenses net of fee waivers reflect expenses after reimbursement by the investment adviser but prior to reductions from brokerage service arrangements or other expense offset arrangements. Expenses net of all reductions represent the net expenses paid by the class.
J Amount represents less than $.01 per share.
K Total distributions of $.08 per share is comprised of distributions from net investment income of $.052 and distributions from net realized gain of $.024 per share.
See accompanying notes which are an integral part of the financial statements.
Annual Report
Financial Highlights - Institutional Class
Years ended October 31, | 2012 | 2011 | 2010 | 2009 | 2008 H |
Selected Per-Share Data | | | | | |
Net asset value, beginning of period | $ 8.37 | $ 9.00 | $ 7.28 | $ 4.76 | $ 10.00 |
Income from Investment Operations | | | | | |
Net investment income (loss) D | .21 | .19 G | .09 | .06 | .05 |
Net realized and unrealized gain (loss) | .35 | (.72) | 1.70 | 2.49 | (5.31) |
Total from investment operations | .56 | (.53) | 1.79 | 2.55 | (5.26) |
Distributions from net investment income | (.18) | (.09) | (.05) | (.04) | - |
Distributions from net realized gain | - | (.02) | (.02) | - | - |
Total distributions | (.18) | (.11) | (.08) K | (.04) | - |
Redemption fees added to paid in capital D | - J | .01 | .01 | .01 | .02 |
Net asset value, end of period | $ 8.75 | $ 8.37 | $ 9.00 | $ 7.28 | $ 4.76 |
Total Return B, C | 6.93% | (5.91)% | 24.95% | 54.15% | (52.40)% |
Ratios to Average Net Assets E, I | | | | | |
Expenses before reductions | 1.28% | 1.26% | 1.34% | 1.60% | 2.12% A |
Expenses net of fee waivers, if any | 1.28% | 1.24% | 1.25% | 1.25% | 1.25% A |
Expenses net of all reductions | �� 1.25% | 1.19% | 1.13% | 1.14% | .98% A |
Net investment income (loss) | 2.43% | 2.02% G | 1.20% | 1.09% | 1.46% A |
Supplemental Data | | | | | |
Net assets, end of period (000 omitted) | $ 8,586 | $ 7,633 | $ 7,171 | $ 4,235 | $ 2,695 |
Portfolio turnover rate F | 30% | 53% | 96% | 58% | 68% |
A Annualized
B Total returns for periods of less than one year are not annualized.
C Total returns would have been lower if certain expenses had not been reduced during the applicable periods shown.
D Calculated based on average shares outstanding during the period.
E Fees and expenses of any underlying Fidelity Central Funds are not included in the Fund's expense ratio. The Fund indirectly bears its proportionate share of the expenses of any underlying Fidelity Central Funds.
F Amount does not include the portfolio activity of any underlying Fidelity Central Funds.
G Investment income per share reflects a large, non-recurring dividend which amounted to $.04 per share. Excluding this non-recurring dividend, the ratio of net investment income (loss) to average net assets would have been 1.58%.
H For the period May 8, 2008 (commencement of operations) to October 31, 2008.
I Expense ratios reflect operating expenses of the class. Expenses before reductions do not reflect amounts reimbursed by the investment adviser or reductions from brokerage service arrangements or reductions from other expense offset arrangements and do not represent the amount paid by the class during periods when reimbursements or reductions occur. Expense ratios before reductions for start-up periods may not be representative of longer-term operating periods. Expenses net of fee waivers reflect expenses after reimbursement by the investment adviser but prior to reductions from brokerage service arrangements or other expense offset arrangements. Expenses net of all reductions represent the net expenses paid by the class.
J Amount represents less than $.01 per share.
K Total distributions of $.08 per share is comprised of distributions from net investment income of $.054 and distributions from net realized gain of $.024 per share.
See accompanying notes which are an integral part of the financial statements.
Annual Report
Notes to Financial Statements
For the period ended October 31, 2012
1. Organization.
Fidelity Emerging Europe, Middle East, Africa (EMEA) Fund (the Fund) is a non-diversified fund of Fidelity Investment Trust (the Trust) and is authorized to issue an unlimited number of shares. The Trust is registered under the Investment Company Act of 1940, as amended (the 1940 Act), as an open-end management investment company organized as a Massachusetts business trust. The Fund offers Class A, Class T, Class C, Emerging Europe, Middle East, Africa (EMEA)and Institutional Class shares, each of which, along with Class B shares, has equal rights as to assets and voting privileges. Effective after the close of business on September 1, 2010, Class B shares were closed to new accounts and additional purchases, except for exchanges and reinvestments. Each class has exclusive voting rights with respect to matters that affect that class. Class B shares will automatically convert to Class A shares after a holding period of seven years from the initial date of purchase. Investment income, realized and unrealized capital gains and losses, the common expenses of the Fund, and certain fund-level expense reductions, if any, are allocated on a pro-rata basis to each class based on the relative net assets of each class to the total net assets of the Fund. Each class differs with respect to transfer agent and distribution and service plan fees incurred. Certain expense reductions may also differ by class. The Fund's investments in emerging markets can be subject to social, economic, regulatory, and political uncertainties and can be extremely volatile.
2. Investments in Fidelity Central Funds.
The Fund invests in Fidelity Central Funds, which are open-end investment companies available only to other investment companies and accounts managed by Fidelity Management & Research Company (FMR) and its affiliates. The Fund's Schedule of Investments lists each of the Fidelity Central Funds held as of period end, if any, as an investment of the Fund, but does not include the underlying holdings of each Fidelity Central Fund. As an Investing Fund, the Fund indirectly bears its proportionate share of the expenses of the underlying Fidelity Central Funds.
The Money Market Central Funds seek preservation of capital and current income and are managed by Fidelity Investments Money Management, Inc. (FIMM), an affiliate of FMR.
A complete unaudited list of holdings for each Fidelity Central Fund is available upon request or at the Securities and Exchange Commission (the SEC) web site at www.sec.gov. In addition, the financial statements of the Fidelity Central Funds, which are not covered by the Fund's Report of Independent Registered Public Accounting Firm, are available on the SEC web site or upon request.
Annual Report
3. Significant Accounting Policies.
The financial statements have been prepared in conformity with accounting principles generally accepted in the United States of America (GAAP), which require management to make certain estimates and assumptions at the date of the financial statements. Actual results could differ from those estimates. Subsequent events, if any, through the date that the financial statements were issued have been evaluated in the preparation of the financial statements. The following summarizes the significant accounting policies of the Fund:
Security Valuation. Investments are valued as of 4:00 p.m. Eastern time on the last calendar day of the period. In accordance with valuation policies and procedures approved by the Board of Trustees (the Board), the Fund attempts to obtain prices from one or more third party pricing vendors or brokers to value its investments. When current market prices, quotations or rates are not readily available or reliable, securities will be fair valued in good faith by the FMR Fair Value Committee (the Committee), in accordance with procedures adopted by the Fund's Board. Factors used in determining fair value vary by security type and may include market or security specific events, changes in interest rates and credit quality. The frequency with which these procedures are used cannot be predicted and they may be utilized to a significant extent. The Committee oversees the Fund's valuation policies and procedures and is responsible for approving and reporting to the Board all fair value determinations.
The Fund categorizes the inputs to valuation techniques used to value its investments into a disclosure hierarchy consisting of three levels as shown below:
Level 1 - quoted prices in active markets for identical investments
Level 2 - other significant observable inputs (including quoted prices for similar investments, interest rates, prepayment speeds, etc.)
Level 3 - unobservable inputs (including the Fund's own assumptions based on the best information available)
Valuation techniques used to value the Fund's investments by major category are as follows:
Equity securities, including restricted securities, for which market quotations are readily available, are valued at the last reported sale price or official closing price as reported by a third party pricing vendor on the primary market or exchange on which they are traded and are categorized as Level 1 in the hierarchy. In the event there were no sales during the day or closing prices are not available, securities are valued at the last quoted bid price or may be valued using the last available price and are generally categorized as Level 2 in the hierarchy. For foreign equity securities, when significant market or security specific events arise, comparisons to the valuation of American Depositary Receipts
Annual Report
Notes to Financial Statements - continued
3. Significant Accounting Policies - continued
Security Valuation - continued
(ADRs), futures contracts, Exchange-Traded Funds (ETFs) and certain indexes as well as quoted prices for similar securities are used and are categorized as Level 2 in the hierarchy. Utilizing these techniques may result in transfers between Level 1 and Level 2.
Debt securities, including restricted securities, are valued based on evaluated prices received from third party pricing vendors or from brokers who make markets in such securities. For corporate bonds and foreign government and government agency obligations, pricing vendors utilize matrix pricing which considers yield or price of bonds of comparable quality, coupon, maturity and type as well as broker-supplied prices and are generally categorized as Level 2 in the hierarchy.
When independent prices are unavailable or unreliable, debt securities may be valued utilizing pricing methodologies which consider similar factors that would be used by third party pricing vendors. These are generally categorized as Level 2 in the hierarchy but may be Level 3 depending on the circumstances.
Investments in open-end mutual funds, including the Fidelity Central Funds, are valued at their closing net asset value (NAV) each business day and are categorized as Level 1 in the hierarchy.
Changes in valuation techniques may result in transfers in or out of an assigned level within the disclosure hierarchy. The aggregate value of investments by input level, as of October 31, 2012, is included at the end of the Fund's Schedule of Investments.
Foreign Currency Translation. The Fund may use foreign currency contracts to facilitate transactions in foreign-denominated securities. Gains and losses from these transactions may arise from changes in the value of the foreign currency or if the counterparties do not perform under the contracts' terms.
Foreign-denominated assets, including investment securities, and liabilities are translated into U.S. dollars at the exchange rates at period end. Purchases and sales of investment securities, income and dividends received and expenses denominated in foreign currencies are translated into U.S. dollars at the exchange rate in effect on the transaction date.
The effects of exchange rate fluctuations on investments are included with the net realized and unrealized gain (loss) on investment securities. Other foreign currency transactions resulting in realized and unrealized gain (loss) are disclosed separately.
Investment Transactions and Income. For financial reporting purposes, the Fund's investment holdings and NAV include trades executed through the end of the last business day of the period. The NAV per share for processing shareholder transactions is
Annual Report
3. Significant Accounting Policies - continued
Investment Transactions and Income - continued
calculated as of the close of business of the New York Stock Exchange (NYSE), normally 4:00 p.m. Eastern time and includes trades executed through the end of the prior business day. Gains and losses on securities sold are determined on the basis of identified cost. Dividend income is recorded on the ex-dividend date, except for certain dividends from foreign securities where the ex-dividend date may have passed, which are recorded as soon as the Fund is informed of the ex-dividend date. Non-cash dividends included in dividend income, if any, are recorded at the fair market value of the securities received. Interest income and distributions from the Fidelity Central Funds are accrued as earned. Interest income includes coupon interest and amortization of premium and accretion of discount on debt securities. Investment income is recorded net of foreign taxes withheld where recovery of such taxes is uncertain.
Expenses. Expenses directly attributable to a fund are charged to that fund. Expenses attributable to more than one fund are allocated among the respective funds on the basis of relative net assets or other appropriate methods. Expense estimates are accrued in the period to which they relate and adjustments are made when actual amounts are known.
Income Tax Information and Distributions to Shareholders. Each year, the Fund intends to qualify as a regulated investment company under Subchapter M of the Internal Revenue Code, including distributing substantially all of its taxable income and realized gains. As a result, no provision for income taxes is required. As of October 31, 2012, the Fund did not have any unrecognized tax benefits in the financial statements; nor is the Fund aware of any tax positions for which it is reasonably possible that the total amounts of unrecognized tax benefits will significantly change in the next twelve months. The Fund files a U.S. federal tax return, in addition to state and local tax returns as required. A fund's federal income tax returns are subject to examination by the Internal Revenue Service (IRS) for a period of three fiscal years after they are filed. State and local tax returns may be subject to examination for an additional fiscal year depending on the jurisdiction. Foreign taxes are provided for based on the Fund's understanding of the tax rules and rates that exist in the foreign markets in which it invests.
Distributions are declared and recorded on the ex-dividend date. Income dividends and capital gain distributions are declared separately for each class. Income and capital gain distributions are determined in accordance with income tax regulations, which may differ from GAAP. In addition, the Fund claimed a portion of the payment made to redeeming shareholders as a distribution for income tax purposes.
Capital accounts within the financial statements are adjusted for permanent book-tax differences. These adjustments have no impact on net assets or the results of operations. Temporary book-tax differences will reverse in a subsequent period.
Annual Report
Notes to Financial Statements - continued
3. Significant Accounting Policies - continued
Income Tax Information and Distributions to Shareholders - continued
Book-tax differences are primarily due to foreign currency transactions, passive foreign investment companies (PFIC), capital loss carryforwards and losses deferred due to wash sales.
The federal tax cost of investment securities and unrealized appreciation (depreciation) as of period end were as follows:
Gross unrealized appreciation | $ 16,922,441 |
Gross unrealized depreciation | (15,370,673) |
Net unrealized appreciation (depreciation) on securities and other investments | $ 1,551,768 |
| |
Tax Cost | $ 138,306,369 |
The tax-based components of distributable earnings as of period end were as follows:
Undistributed ordinary income | $ 3,778,819 |
Capital loss carryforward | $ (2,121,605) |
Net unrealized appreciation (depreciation) | $ 1,552,040 |
Capital loss carryforwards are only available to offset future capital gains of the Fund to the extent provided by regulations and may be limited. Under the Regulated Investment Company Modernization Act of 2010 (the Act), the Fund is permitted to carry forward capital losses incurred in taxable years beginning after December 22, 2010 for an unlimited period and such capital losses are required to be used prior to any losses that expire. Capital loss carryforwards were as follows:
Fiscal year of expiration | |
2018 | $ (2,121,605) |
The tax character of distributions paid was as follows:
| October 31, 2012 | October 31, 2011 |
Ordinary Income | $ 2,782,952 | $ 2,137,978 |
Short-Term Trading (Redemption) Fees. Shares held by investors in the Fund less than 90 days are subject to a redemption fee equal to 1.50% of the net asset value of shares redeemed. All redemption fees, which reduce the proceeds of the shareholder redemption, are retained by the Fund and accounted for as an addition to paid in capital.
Annual Report
3. Significant Accounting Policies - continued
New Accounting Pronouncement. In December 2011, the Financial Accounting Standards Board issued Accounting Standard Update No. 2011-11, Disclosures about Offsetting Assets and Liabilities. The update creates new disclosure requirements requiring entities to disclose both gross and net information for derivatives and other financial instruments that are either offset in the Statement of Assets and Liabilities or subject to an enforceable master netting arrangement or similar agreement. The disclosure requirements are effective for annual reporting periods beginning on or after January 1, 2013, and interim periods within those annual periods. Management is currently evaluating the impact of the update's adoption on the Fund's financial statement disclosures.
4. Purchases and Sales of Investments.
Purchases and sales of securities, other than short-term securities, aggregated $42,139,137 and $54,373,981, respectively.
5. Fees and Other Transactions with Affiliates.
Management Fee. FMR and its affiliates provide the Fund with investment management related services for which the Fund pays a monthly management fee. The management fee is the sum of an individual fund fee rate that is based on an annual rate of .55% of the Fund's average net assets and an annualized group fee rate that averaged .26% during the period. The group fee rate is based upon the average net assets of all the mutual funds advised by FMR. The group fee rate decreases as assets under management increase and increases as assets under management decrease. For the period, the total annual management fee rate was .81% of the Fund's average net assets.
Distribution and Service Plan Fees. In accordance with Rule 12b-1 of the 1940 Act, the Fund has adopted separate Distribution and Service Plans for each class of shares. Certain classes pay Fidelity Distributors Corporation (FDC), an affiliate of FMR, separate Distribution and Service Fees, each of which is based on an annual percentage of each class' average net assets. In addition, FDC may pay financial intermediaries for selling shares of the Fund and providing shareholder support services. For the period, the Distribution and Service Fee rates, total fees and amounts retained by FDC were as follows:
| Distribution
Fee | Service
Fee | Total Fees | Retained
by FDC |
Class A | -% | .25% | $ 22,962 | $ 252 |
Class T | .25% | .25% | 17,208 | 64 |
Class B | .75% | .25% | 4,896 | 3,697 |
Class C | .75% | .25% | 76,180 | 10,823 |
| | | $ 121,246 | $ 14,836 |
Annual Report
Notes to Financial Statements - continued
5. Fees and Other Transactions with Affiliates - continued
Sales Load. FDC may receive a front-end sales charge of up to 5.75% for selling Class A shares and 3.50% for selling Class T shares, some of which is paid to financial intermediaries for selling shares of the Fund. Depending on the holding period, FDC may receive contingent deferred sales charges levied on Class A, Class T, Class B, and Class C redemptions. The deferred sales charges range from 5.00% to 1.00% for Class B shares, 1.00% for Class C shares, 1.00% for certain purchases of Class A shares and .25% for certain purchases of Class T shares.
For the period, sales charge amounts retained by FDC were as follows:
| Retained
by FDC |
Class A | $ 4,269 |
Class T | 1,365 |
Class B* | 2,582 |
Class C* | 2,232 |
| $ 10,448 |
* When Class B and Class C shares are initially sold, FDC pays commissions from its own resources to financial intermediaries through which the sales are made.
Transfer Agent Fees. Fidelity Investments Institutional Operations Company, Inc. (FIIOC), an affiliate of FMR, is the transfer, dividend disbursing and shareholder servicing agent for each class of the Fund. FIIOC receives account fees and asset-based fees that vary according to the account size and type of account of the shareholders of the respective classes of the Fund. FIIOC pays for typesetting, printing and mailing of shareholder reports, except proxy statements. For the period, transfer agent fees for each class were as follows:
| Amount | % of
Average
Net Assets |
Class A | $ 27,199 | .30 |
Class T | 10,795 | .31 |
Class B | 1,463 | .30 |
Class C | 22,681 | .30 |
Emerging Europe, Middle East, Africa (EMEA) | 331,681 | .29 |
Institutional Class | 16,358 | .20 |
| $ 410,177 | |
Accounting and Security Lending Fees. Fidelity Service Company, Inc. (FSC), an affiliate of FMR, maintains the Fund's accounting records. The accounting fee is based on the level of average net assets for each month. Under a separate contract, FSC administers the security lending program. The security lending fee is based on the number and duration of lending transactions.
Annual Report
6. Committed Line of Credit.
The Fund participates with other funds managed by FMR or an affiliate in a $4.25 billion credit facility (the "line of credit") to be utilized for temporary or emergency purposes to fund shareholder redemptions or for other short-term liquidity purposes. The Fund has agreed to pay commitment fees on its pro-rata portion of the line of credit, which amounted to $389 and is reflected in Miscellaneous expenses on the Statement of Operations. During the period, there were no borrowings on this line of credit.
7. Security Lending.
The Fund lends portfolio securities through a lending agent from time to time in order to earn additional income. For equity securities, a lending agent is used and may loan securities to certain qualified borrowers, including Fidelity Capital Markets (FCM), a broker-dealer affiliated with the Fund. On the settlement date of the loan, the Fund receives collateral (in the form of U.S. Treasury obligations, letters of credit and/or cash) against the loaned securities and maintains collateral in an amount not less than 100% of the market value of the loaned securities during the period of the loan. The market value of the loaned securities is determined at the close of business of the Fund and any additional required collateral is delivered to the Fund on the next business day. If the borrower defaults on its obligation to return the securities loaned because of insolvency or other reasons, a fund could experience delays and costs in recovering the securities loaned or in gaining access to the collateral. Any cash collateral received is invested in the Fidelity Securities Lending Cash Central Fund. At period end, there were no security loans outstanding. Security lending income represents the income earned on investing cash collateral, less rebates paid to borrowers and any lending agent fees associated with the loan, plus any premium payments received for lending certain types of securities. Security lending income is presented in the Statement of Operations as a component of income from Fidelity Central Funds. Total security lending income during the period amounted to $2,270. During the period, there were no securities loaned to FCM.
8. Expense Reductions.
Many of the brokers with whom FMR places trades on behalf of the Fund provided services to the Fund in addition to trade execution. These services included payments of certain expenses on behalf of the Fund totaling $39,356 for the period.
Annual Report
Notes to Financial Statements - continued
9. Distributions to Shareholders.
Distributions to shareholders of each class were as follows:
Years ended October 31, | 2012 | 2011 |
From net investment income | | |
Class A | $ 173,376 | $ 97,896 |
Class T | 52,030 | 26,168 |
Class B | 3,592 | 1,907 |
Class C | 61,819 | 32,267 |
Emerging Europe, Middle East, Africa (EMEA) | 2,310,485 | 1,585,636 |
Institutional Class | 181,650 | 91,487 |
Total | $ 2,782,952 | $ 1,835,361 |
From net realized gain | | |
Class A | $ - | $ 18,012 |
Class T | - | 5,690 |
Class B | - | 902 |
Class C | - | 9,924 |
Emerging Europe, Middle East, Africa (EMEA) | - | 253,422 |
Institutional Class | - | 14,667 |
Total | $ - | $ 302,617 |
10. Share Transactions.
Transactions for each class of shares were as follows:
| Shares | Dollars |
Years ended October 31, | 2012 | 2011 | 2012 | 2011 |
Class A | | | | |
Shares sold | 188,687 | 827,297 | $ 1,610,923 | $ 7,697,437 |
Reinvestment of distributions | 16,919 | 10,020 | 134,509 | 92,483 |
Shares redeemed | (411,198) | (725,856) | (3,440,999) | (6,651,188) |
Net increase (decrease) | (205,592) | 111,461 | $ (1,695,567) | $ 1,138,732 |
Class T | | | | |
Shares sold | 75,037 | 164,342 | $ 636,446 | $ 1,527,510 |
Reinvestment of distributions | 6,513 | 3,447 | 51,713 | 31,848 |
Shares redeemed | (118,919) | (94,003) | (995,876) | (862,784) |
Net increase (decrease) | (37,369) | 73,786 | $ (307,717) | $ 696,574 |
Class B | | | | |
Shares sold | 2,520 | 9,372 | $ 21,721 | $ 87,632 |
Reinvestment of distributions | 430 | 285 | 3,432 | 2,673 |
Shares redeemed | (17,241) | (36,653) | (147,235) | (325,442) |
Net increase (decrease) | (14,291) | (26,996) | $ (122,082) | $ (235,137) |
Annual Report
10. Share Transactions - continued
| Shares | Dollars |
Years ended October 31, | 2012 | 2011 | 2012 | 2011 |
Class C | | | | |
Shares sold | 337,293 | 438,284 | $ 2,767,333 | $ 4,066,195 |
Reinvestment of distributions | 7,082 | 4,100 | 56,016 | 37,820 |
Shares redeemed | (250,062) | (213,656) | (2,064,165) | (1,892,778) |
Net increase (decrease) | 94,313 | 228,728 | $ 759,184 | $ 2,211,237 |
Emerging Europe, Middle East, Africa (EMEA) | | | | |
Shares sold | 3,688,393 | 7,381,313 | $ 31,635,971 | $ 68,910,601 |
Reinvestment of distributions | 276,215 | 187,137 | 2,198,675 | 1,730,170 |
Shares redeemed | (4,854,267) | (9,520,946) | (40,803,317) | (86,802,311) |
Net increase (decrease) | (889,659) | (1,952,496) | $ (6,968,671) | $ (16,161,540) |
Institutional Class | | | | |
Shares sold | 336,442 | 597,666 | $ 2,842,158 | $ 5,560,036 |
Reinvestment of distributions | 5,723 | 1,263 | 45,553 | 11,681 |
Shares redeemed | (272,120) | (484,423) | (2,242,112) | (4,318,317) |
Net increase (decrease) | 70,045 | 114,506 | $ 645,599 | $ 1,253,400 |
11. Other.
The Fund's organizational documents provide former and current trustees and officers with a limited indemnification against liabilities arising in connection with the performance of their duties to the Fund. In the normal course of business, the Fund may also enter into contracts that provide general indemnifications. The Fund's maximum exposure under these arrangements is unknown as this would be dependent on future claims that may be made against the Fund. The risk of material loss from such claims is considered remote.
At the end of the period, FMR or its affiliates were the owners of record of 10% of the total outstanding shares of the Fund.
Annual Report
To the Trustees of Fidelity Investment Trust and Shareholders of Fidelity Emerging Europe, Middle East, Africa (EMEA) Fund:
We have audited the accompanying statement of assets and liabilities of Fidelity Emerging Europe, Middle East, Africa (EMEA) Fund (the Fund), a fund of Fidelity Investment Trust, including the schedule of investments, as of October 31, 2012, and the related statement of operations for the year then ended, the statement of changes in net assets for each of the two years in the period then ended, and the financial highlights for each of the four years in the period then ended and the period May 8, 2008 (commencement of operations) to October 31, 2008. These financial statements and financial highlights are the responsibility of the Fund's management. Our responsibility is to express an opinion on these financial statements and financial highlights based on our audits.
We conducted our audits in accordance with the standards of the Public Company Accounting Oversight Board (United States). Those standards require that we plan and perform the audit to obtain reasonable assurance about whether the financial statements and financial highlights are free of material misstatement. The Fund is not required to have, nor were we engaged to perform, an audit of its internal control over financial reporting. Our audits included consideration of internal control over financial reporting as a basis for designing audit procedures that are appropriate in the circumstances, but not for the purpose of expressing an opinion on the effectiveness of the Fund's internal control over financial reporting. Accordingly, we express no such opinion. An audit also includes examining, on a test basis, evidence supporting the amounts and disclosures in the financial statements, assessing the accounting principles used and significant estimates made by management, as well as evaluating the overall financial statement presentation. Our procedures included confirmation of securities owned as of October 31, 2012, by correspondence with the custodians and brokers; where replies were not received from brokers, we performed other auditing procedures. We believe that our audits provide a reasonable basis for our opinion.
In our opinion, the financial statements and financial highlights referred to above present fairly, in all material respects, the financial position of Fidelity Emerging Europe, Middle East, Africa (EMEA) Fund as of October 31, 2012, the results of its operations for the year then ended, the changes in its net assets for each of the two years in the period then ended, and the financial highlights for each of the four years in the period then ended and the period May 8, 2008 (commencement of operations) to October 31, 2008, in conformity with accounting principles generally accepted in the United States of America.
DELOITTE & TOUCHE LLP
Boston, Massachusetts
December 14, 2012
Annual Report
The Trustees, Members of the Advisory Board, and executive officers of the trust and fund, as applicable, are listed below. The Board of Trustees governs the fund and is responsible for protecting the interests of shareholders. The Trustees are experienced executives who meet periodically throughout the year to oversee the fund's activities, review contractual arrangements with companies that provide services to the fund, oversee management of the risks associated with such activities and contractual arrangements, and review the fund's performance. Except for James C. Curvey, each of the Trustees oversees 236 funds advised by FMR or an affiliate. Mr. Curvery oversees 443 funds advised by FMR or an affiliate.
The Trustees hold office without limit in time except that (a) any Trustee may resign; (b) any Trustee may be removed by written instrument, signed by at least two-thirds of the number of Trustees prior to such removal; (c) any Trustee who requests to be retired or who has become incapacitated by illness or injury may be retired by written instrument signed by a majority of the other Trustees; and (d) any Trustee may be removed at any special meeting of shareholders by a two-thirds vote of the outstanding voting securities of the trust. Each Trustee who is not an interested person (as defined in the 1940 Act) (Independent Trustee), shall retire not later than the last day of the calendar year in which his or her 75th birthday occurs. The Independent Trustees may waive this mandatory retirement age policy with respect to individual Trustees. The executive officers and Advisory Board Members hold office without limit in time, except that any officer and Advisory Board Member may resign or may be removed by a vote of a majority of the Trustees at any regular meeting or any special meeting of the Trustees. Except as indicated, each individual has held the office shown or other offices in the same company for the past five years.
Experience, Skills, Attributes, and Qualifications of the Fund's Trustees. The Governance and Nominating Committee has adopted a statement of policy that describes the experience, qualifications, attributes, and skills that are necessary and desirable for potential Independent Trustee candidates (Statement of Policy). The Board believes that each Trustee satisfied at the time he or she was initially elected or appointed a Trustee, and continues to satisfy, the standards contemplated by the Statement of Policy. The Governance and Nominating Committee also engages professional search firms to help identify potential Independent Trustee candidates who have the experience, qualifications, attributes, and skills consistent with the Statement of Policy. From time to time, additional criteria based on the composition and skills of the current Independent Trustees, as well as experience or skills that may be appropriate in light of future changes to board composition, business conditions, and regulatory or other developments, have also been considered by the professional search firms and the Governance and Nominating Committee. In addition, the Board takes into account the Trustees' commitment and participation in Board and committee meetings, as well as their leadership of standing and ad hoc committees throughout their tenure.
In determining that a particular Trustee was and continues to be qualified to serve as a Trustee, the Board has considered a variety of criteria, none of which, in isolation, was controlling. The Board believes that, collectively, the Trustees have balanced and diverse experience, qualifications, attributes, and skills, which allow the Board to operate effectively in governing the fund and protecting the interests of shareholders. Information about the specific experience, skills, attributes, and qualifications of each Trustee, which in each case led to the Board's conclusion that the Trustee should serve (or continue to serve) as a trustee of the fund, is provided below.
Annual Report
Board Structure and Oversight Function. James C. Curvey is an interested person (as defined in the 1940 Act) and currently serves as Chairman. The Trustees have determined that an interested Chairman is appropriate and benefits shareholders because an interested Chairman has a personal and professional stake in the quality and continuity of services provided to the fund. Independent Trustees exercise their informed business judgment to appoint an individual of their choosing to serve as Chairman, regardless of whether the Trustee happens to be independent or a member of management. The Independent Trustees have determined that they can act independently and effectively without having an Independent Trustee serve as Chairman and that a key structural component for assuring that they are in a position to do so is for the Independent Trustees to constitute a substantial majority for the Board. The Independent Trustees also regularly meet in executive session. Ned C. Lautenbach serves as Chairman of the Independent Trustees and as such (i) acts as a liaison between the Independent Trustees and management with respect to matters important to the Independent Trustees and (ii) with management prepares agendas for Board meetings.
Fidelity funds are overseen by different Boards of Trustees. The fund's Board oversees Fidelity's equity and high income funds and another Board oversees Fidelity's investment-grade bond, money market, and asset allocation funds. The asset allocation funds may invest in Fidelity funds overseen by the fund's Board. The use of separate Boards, each with its own committee structure, allows the Trustees of each group of Fidelity funds to focus on the unique issues of the funds they oversee, including common research, investment, and operational issues. On occasion, the separate Boards establish joint committees to address issues of overlapping consequences for the Fidelity funds overseen by each Board.
The Trustees operate using a system of committees to facilitate the timely and efficient consideration of all matters of importance to the Trustees, the fund, and fund shareholders and to facilitate compliance with legal and regulatory requirements and oversight of the fund's activities and associated risks. The Board, acting through its committees, has charged FMR and its affiliates with (i) identifying events or circumstances the occurrence of which could have demonstrably adverse effects on the fund's business and/or reputation; (ii) implementing processes and controls to lessen the possibility that such events or circumstances occur or to mitigate the effects of such events or circumstances if they do occur; and (iii) creating and maintaining a system designed to evaluate continuously business and market conditions in order to facilitate the identification and implementation processes described in (i) and (ii) above. Because the day-to-day operations and activities of the fund are carried out by or through FMR, its affiliates and other service providers, the fund's exposure to risks is mitigated but not eliminated by the processes overseen by the Trustees. While each of the Board's committees has responsibility for overseeing different aspects of the fund's activities, oversight is exercised primarily through the Operations, Audit, and Compliance Committees. In addition, the Independent Trustees have worked with FMR to enhance the Board's oversight of investment and financial risks, legal and regulatory risks, technology risks, and operational risks, including the development of additional risk reporting to the Board. For example, a working group comprised of Independent Trustees and FMR has worked and continues to work to review the Fidelity funds' valuation-related activities, reporting and risk management. Appropriate personnel, including but not limited to the fund's Chief Compliance Officer (CCO), FMR's internal auditor, the independent accountants, the fund's Treasurer and portfolio management personnel, make periodic reports to the Board's committees, as appropriate, including an annual review of FMR's risk management program for the Fidelity funds. The responsibilities of each standing committee, including their oversight responsibilities, are described further under "Standing Committees of the Fund's Trustees."
Annual Report
Trustees and Officers - continued
The fund's Statement of Additional Information (SAI) includes more information about the Trustees. To request a free copy, call Fidelity at 1-800-544-8544.
Interested Trustees*:
Correspondence intended for each Trustee who is an interested person may be sent to Fidelity Investments, 82 Devonshire Street, Boston, Massachusetts 02109.
Name, Age; Principal Occupations and Other Relevant Experience+ |
James C. Curvey (77) |
| Year of Election or Appointment: 2007 Mr. Curvey is Trustee and Chairman of the Board of Trustees of certain Trusts. Mr. Curvey also serves as Trustee (2007-present) of other investment companies advised by FMR. Mr. Curvey is a Director of Fidelity Investments Money Management, Inc. (2009-present), Director of Fidelity Research & Analysis Co. (2009-present) and Director of FMR and FMR Co., Inc. (2007-present). Mr. Curvey is also Vice Chairman (2007-present) and Director of FMR LLC. In addition, Mr. Curvey serves as an Overseer for the Boston Symphony Orchestra and a member of the Trustees of Villanova University. Previously, Mr. Curvey was the Vice Chairman (2006-2007) and Director (2000-2007) of FMR Corp. |
Ronald P. O'Hanley (55) |
| Year of Election or Appointment: 2011 Mr. O'Hanley is Director of FMR Co., Inc. (2010-present), Director of Fidelity Investments Money Management, Inc. (2010-present), Director of Fidelity Research & Analysis Company (2010-present), President of Fidelity Asset Management and Corporate Services and a member of Fidelity's Executive Committee (2010-present). Previously, Mr. O'Hanley served as President and Chief Executive Officer of BNY Mellon Asset Management (2007-2010). Mr. O'Hanley also served as Vice Chairman of Bank New York Mellon Corp. and a member of that firm's Executive Committee. Prior to the 2007 merger of The Bank of New York and Mellon Financial Corporation, he was Vice Chairman of Mellon Financial Corporation and President and Chief Executive Officer of Mellon Asset Management. He joined Mellon in February 1997. Mr. O'Hanley currently serves as Chairman of the Boston Public Library Foundation Board of Directors and sits on the Board of Directors of Beth Israel Deaconess Medical Center, the Board of Trustees of the Marine Biological Laboratory and the Advisory Board of the Maxwell School of Citizenship and Public Administration at Syracuse University. Mr. O'Hanley also chairs the Council on Asset Management for the Financial Services Roundtable and is a member of the Board of Directors of Institutional Investor's U.S. Institute. |
* Trustees have been determined to be "Interested Trustees" by virtue of, among other things, their affiliation with the trust or various entities under common control with FMR.
+ The information above includes each Trustee's principal occupation during the last five years and other information relating to the experience, attributes, and skills relevant to each Trustee's qualifications to serve as a Trustee, which led to the conclusion that each Trustee should serve as a Trustee for the fund.
Annual Report
Trustees and Officers - continued
Independent Trustees:
Correspondence intended for each Independent Trustee (that is, the Trustees other than the Interested Trustees) may be sent to Fidelity Investments, P.O. Box 55235, Boston, Massachusetts 02205-5235.
Name, Age; Principal Occupations and Other Relevant Experience+ |
Dennis J. Dirks (64) |
| Year of Election or Appointment: 2005 Prior to his retirement in May 2003, Mr. Dirks was Chief Operating Officer and a member of the Board of The Depository Trust & Clearing Corporation (DTCC). He also served as President, Chief Operating Officer, and Board member of The Depository Trust Company (DTC) and President and Board member of the National Securities Clearing Corporation (NSCC). In addition, Mr. Dirks served as Chief Executive Officer and Board member of the Government Securities Clearing Corporation, Chief Executive Officer and Board member of the Mortgage-Backed Securities Clearing Corporation, as a Trustee and a member of the Finance Committee of Manhattan College (2005-2008), and as a Trustee and a member of the Finance Committee of AHRC of Nassau County (2006-2008). Mr. Dirks is a member of the Independent Directors Council (IDC) Governing Council (2010-present) and Board of Directors for The Brookville Center for Children's Services, Inc. (2009-present). |
Alan J. Lacy (59) |
| Year of Election or Appointment: 2008 Mr. Lacy serves as Senior Adviser (2007-present) of Oak Hill Capital Partners, L.P. (private equity). Mr. Lacy also served as Chief Executive Officer (2000-2005) and Vice Chairman (2005-2006) of Sears Holdings Corporation and Sears, Roebuck and Co. (retail). In addition, Mr. Lacy serves as a member of the Board of Directors of Dave & Buster's Entertainment, Inc. (restaurant and entertainment complexes, 2010-present), Earth Fare, Inc. (retail grocery, 2012-present), The Hillman Companies, Inc. (hardware wholesalers, 2010-present), and Bristol-Myers Squibb Company (global pharmaceuticals, 2008-present). Mr. Lacy is a member of the Board of Trustees of The National Parks Conservation Association (2006-present). Previously, Mr. Lacy served as Chairman of the Board of Trustees of the National Parks Conservation Association (2008-2011) and as a member of the Board of Directors for the Western Union Company (global money transfer, 2006-2011). |
Ned C. Lautenbach (68) |
| Year of Election or Appointment: 2000 Mr. Lautenbach is Chairman of the Independent Trustees of the Equity and High Income Funds (2006-present). Mr. Lautenbach currently serves as the Lead Director of the Eaton Corporation Board of Directors (diversified industrial, 1997-present). Mr. Lautenbach is Chairman of the Board of Directors of the Philharmonic Center for the Arts in Naples, Florida (2012-present) and a member of the Council on Foreign Relations (1994-present). Previously, Mr. Lautenbach was a Partner/Advisory Partner at Clayton, Dubilier & Rice, LLC (private equity investment, 1998-2010), as well as a Director of Sony Corporation (2006-2007). |
Joseph Mauriello (68) |
| Year of Election or Appointment: 2008 Prior to his retirement in January 2006, Mr. Mauriello served in numerous senior management positions including Deputy Chairman and Chief Operating Officer (2004-2005), and Vice Chairman of Financial Services (2002-2004) of KPMG LLP US (professional services, 1965-2005). Mr. Mauriello currently serves as a member of the Board of Directors of XL Group plc. (global insurance and re-insurance, 2006-present). Previously, Mr. Mauriello served as a Director of the Hamilton Funds of the Bank of New York (2006-2007) and of Arcadia Resources Inc. (health care services and products, 2007-2012). |
Robert W. Selander (62) |
| Year of Election or Appointment: 2011 Previously, Mr. Selander served as a Member of the Advisory Board of Fidelity's Equity and High Income Funds (2011), Executive Vice Chairman (2010), Chief Executive Officer (2009-2010), and President and Chief Executive Officer (1997-2009) of Mastercard, Inc. |
Cornelia M. Small (68) |
| Year of Election or Appointment: 2005 Ms. Small is a member of the Board of Directors (2009-present) and Chair of the Investment Committee (2010-present) of the Teagle Foundation. Ms. Small also serves on the Investment Committee of the Berkshire Taconic Community Foundation (2008-present). Previously, Ms. Small served as Chairperson (2002-2008) and a member of the Investment Committee and Chairperson (2008-2012) and a member of the Board of Trustees of Smith College. In addition, Ms. Small served as Chief Investment Officer, Director of Global Equity Investments, and a member of the Board of Directors of Scudder, Stevens & Clark and Scudder Kemper Investments. |
William S. Stavropoulos (73) |
| Year of Election or Appointment: 2001 Mr. Stavropoulos is Vice Chairman of the Independent Trustees of the Equity and High Income Funds (2006-present). Mr. Stavropoulos serves as President and Founder of the Michigan Baseball Foundation, the Great Lakes Loons (2007-present). Mr. Stavropoulos is Chairman Emeritus of the Board of Directors of The Dow Chemical Company, where he previously served in numerous senior management positions, including President, CEO (1995-2000; 2002-2004), Chairman of the Executive Committee (2000-2006), and as a member of the Board of Directors (1990-2006). Currently, Mr. Stavropoulos is a Director of Univar Inc. (global distributor of commodity and specialty chemicals, Chairman from 2010-May 2012 and Lead Director from May 2012-present), Teradata Corporation (data warehousing and technology solutions, 2008-present), Maersk Inc. (industrial conglomerate), and Tyco International, Ltd. (multinational manufacturing and services, 2007-present), and a member of the Advisory Board for Metalmark Capital LLC (private equity investment, 2005-present). Mr. Stavropoulos is an operating advisor to Clayton, Dubilier & Rice, LLC (private equity investment). In addition, Mr. Stavropoulos is a member of the University of Notre Dame Advisory Council for the College of Science, a Trustee of the Rollin L. Gerstacker Foundation, and a Director of the Naples Philharmonic Center for the Arts. Previously, Mr. Stavropoulos served as a Director of Chemical Financial Corporation (bank holding company, 1993-2012). |
David M. Thomas (63) |
| Year of Election or Appointment: 2008 Previously, Mr. Thomas served as Executive Chairman (2005-2006) and Chairman and Chief Executive Officer (2000-2005) of IMS Health, Inc. (pharmaceutical and healthcare information solutions), and a Director of Fortune Brands, Inc. (consumer products, 2000-2011). In addition, Mr. Thomas serves as Non-Executive Chairman of the Board of Directors of Fortune Brands Home and Security (home and security products, 2011-present), and as a member of the Board of Directors of Interpublic Group of Companies, Inc. (marketing communication, 2004-present). |
Michael E. Wiley (62) |
| Year of Election or Appointment: 2008 Mr. Wiley also serves as a Director of Asia Pacific Exploration Consolidated (international oil and gas exploration and production, 2008-present). Mr. Wiley serves as a Director of Tesoro Corporation (independent oil refiner and marketer, 2005-present), and a Director of Bill Barrett Corporation (exploration and production, 2005-present). In addition, Mr. Wiley also serves as a Director of Post Oak Bank (privately-held bank, 2004-present). Previously, Mr. Wiley served as a member of the Board of Trustees of the University of Tulsa (2000-2006; 2007-2010), as a Senior Energy Advisor of Katzenbach Partners, LLC (consulting, 2006-2007), as an Advisory Director of Riverstone Holdings (private investment), Chairman, President, and CEO of Baker Hughes, Inc. (oilfield services, 2000-2004), and as Director of Spinnaker Exploration Company (exploration and production, 2001-2005). |
+ The information above includes each Trustee's principal occupation during the last five years and other information relating to the experience, attributes, and skills relevant to each Trustee's qualifications to serve as a Trustee, which led to the conclusion that each Trustee should serve as a Trustee for the fund.
Advisory Board Members and Executive Officers:
Correspondence intended for David A. Rosow and Garnett A. Smith may be sent to Fidelity Investments, P.O. Box 55235, Boston, Massachusetts 02205-5235. Correspondence intended for each executive officer, Edward C. Johnson 3d, and Peter S. Lynch may be sent to Fidelity Investments, 82 Devonshire Street, Boston, Massachusetts 02109.
Name, Age; Principal Occupation |
Edward C. Johnson 3d (82) |
| Year of Election or Appointment: 2011 Member of the Advisory Board of Fidelity's Equity and High Income Funds. Mr. Johnson serves as Chief Executive Officer, Chairman, and a Director of FMR LLC, and also serves as Chairman and Director of FIL Limited. Previously, Mr. Johnson served as a Trustee and Chairman of the Board of certain Fidelity Trusts, Chairman and a Director of FMR, Chairman and a Director of FMR Co., Inc., and President of FMR LLC (2006-2007). |
Peter S. Lynch (68) |
| Year of Election or Appointment: 2003 Member of the Advisory Board of Fidelity's Equity and High Income Funds. Mr. Lynch is Vice Chairman and a Director of FMR and FMR Co., Inc. In addition, Mr. Lynch serves as a Trustee of Boston College and as the Chairman of the Inner-City Scholarship Fund. Previously, Mr. Lynch served on the Special Olympics International Board of Directors (1997-2006). |
David A. Rosow (70) |
| Year of Election or Appointment: 2012 Member of the Advisory Board of Fidelity's Equity and High Income Funds. Chairman and Chief Executive Officer of International Golf Group, Inc. (golf course development, 1989-present). Previously, Mr. Rosow served as Chairman and Chief Executive Officer of Rosow & Company, Inc. (private investment company, 1989-2011), a Lead Director of Hudson United Bancorp (2001-2006) and as a Director of TD Banknorth (1996-2006). In addition, Mr. Rosow is a member (2008-present) and President (2009-present) of the Town Council of Palm Beach, Florida. |
Garnett A. Smith (65) |
| Year of Election or Appointment: 2012 Member of the Advisory Board of Fidelity's Equity and High Income Funds. Prior to Mr. Smith's retirement, he served as Chairman and Chief Executive Officer of Inbrand Corp. (manufacturer of personal absorbent products, 1990-1997). He also served as President (1986-1990) of Inbrand Corp. Prior to his employment with Inbrand Corp., he was employed by a retail fabric chain and North Carolina National Bank. In addition, Mr. Smith is a board member of the Jackson Hole Land Trust (2009-present). |
Kenneth B. Robins (43) |
| Year of Election or Appointment: 2008 President and Treasurer of Fidelity's Equity and High Income Funds. Mr. Robins also serves as President and Treasurer (2010-present) and Assistant Treasurer (2009-present) of other Fidelity funds and is an employee of Fidelity Investments (2004-present). Previously, Mr. Robins served as Deputy Treasurer of the Fidelity funds (2005-2008) and Treasurer and Chief Financial Officer of The North Carolina Capital Management Trust: Cash and Term Portfolios (2006-2008). |
Bruce T. Herring (47) |
| Year of Election or Appointment: 2006 Vice President of certain Equity Funds. Mr. Herring also serves as President of Fidelity Research & Analysis Company (2010-present), Chief Investment Officer and Director of Fidelity Management & Research (U.K.) Inc. (2010-present) and Group Chief Investment Officer of FMR. Previously, Mr. Herring served as Vice President (2005-2006) and Senior Vice President (2006-2007) of Fidelity Management & Research Company, Vice President of FMR Co., Inc. (2001-2007) and as a portfolio manager for Fidelity U.S. Equity Funds. |
Brian B. Hogan (48) |
| Year of Election or Appointment: 2009 Vice President of Equity and High Income Funds. Mr. Hogan also serves as President of FMR's Equity Division (2009-present). Previously, Mr. Hogan served as Senior Vice President, Equity Research of FMR (2006-2009) and as a portfolio manager. |
Scott C. Goebel (44) |
| Year of Election or Appointment: 2008 Secretary and Chief Legal Officer (CLO) of the Fidelity funds. Mr. Goebel also serves as Secretary of Fidelity Investments Money Management, Inc. (FIMM) (2010-present) and Fidelity Research and Analysis Company (FRAC) (2010-present); Secretary and CLO of The North Carolina Capital Management Trust: Cash and Term Portfolios (2008-present); General Counsel, Secretary, and Senior Vice President of FMR (2008-present) and FMR Co., Inc. (2008-present); employed by FMR LLC or an affiliate (2001-present); Chief Legal Officer of Fidelity Management & Research (Hong Kong) Limited (2008-present) and Assistant Secretary of Fidelity Management & Research (Japan) Inc. (2008-present), and Fidelity Management & Research (U.K.) Inc. (2008-present). Previously, Mr. Goebel served as Assistant Secretary of FIMM (2008-2010), FRAC (2008-2010), and the Funds (2007-2008) and as Vice President and Secretary of Fidelity Distributors Corporation (FDC) (2005-2007). |
William C. Coffey (43) |
| Year of Election or Appointment: 2009 Assistant Secretary of Fidelity's Equity and High Income Funds. Mr. Coffey also serves as Senior Vice President and Deputy General Counsel of FMR LLC (2010-present), and is an employee of Fidelity Investments. Previously, Mr. Coffey served as Vice President and Associate General Counsel of FMR LLC (2005-2009). |
Elizabeth Paige Baumann (44) |
| Year of Election or Appointment: 2012 Anti-Money Laundering (AML) Officer of the Fidelity funds. Ms. Baumann also serves as AML Officer of The North Carolina Capital Management Trust: Cash and Term Portfolios (2012-present), Chief AML Officer of FMR LLC (2012-present), and is an employee of Fidelity Investments. Previously, Ms. Baumann served as Vice President and Deputy Anti-Money Laundering Officer (2007-2012). |
Christine Reynolds (54) |
| Year of Election or Appointment: 2008 Chief Financial Officer of the Fidelity funds. Ms. Reynolds became President of Fidelity Pricing and Cash Management Services (FPCMS) in August 2008. Ms. Reynolds served as Chief Operating Officer of FPCMS (2007-2008). Previously, Ms. Reynolds served as President, Treasurer, and Anti-Money Laundering officer of the Fidelity funds (2004-2007). |
Joseph A. Hanlon (44) |
| Year of Election or Appointment: 2012 Chief Compliance Officer of Fidelity's Equity and High Income Funds. Mr. Hanlon serves as Compliance Officer of FMR, FMR Co., Inc., Fidelity Investments Money Management, Inc. (FIMM), Fidelity Research and Analysis Company (FRAC), Fidelity Management & Research (Japan) Inc., Fidelity Management & Research (U.K.) Inc., Fidelity Management & Research (Hong Kong), and Strategic Advisers, Inc. (2009-present), as Senior Vice President of the Fidelity Asset Management Division (2009-present), and is an employee of Fidelity Investments. |
Joseph F. Zambello (55) |
| Year of Election or Appointment: 2011 Deputy Treasurer of the Fidelity funds. Mr. Zambello is an employee of Fidelity Investments. Previously, Mr. Zambello served as Vice President of FMR's Program Management Group (2009-2011) and Vice President of the Transfer Agent Oversight Group (2005-2009). |
Adrien E. Deberghes (45) |
| Year of Election or Appointment: 2008 Deputy Treasurer of Fidelity's Equity and High Income Funds. Mr. Deberghes also serves as Vice President (2011-present) and Assistant Treasurer (2010-present) of other Fidelity funds, and is an employee of Fidelity Investments (2008-present). Previously, Mr. Deberghes served as Senior Vice President of Mutual Fund Administration at State Street Corporation (2007-2008), Senior Director of Mutual Fund Administration at Investors Bank & Trust (2005-2007), and Director of Finance for Dunkin' Brands (2000-2005). |
Stephen Sadoski (41) |
| Year of Election or Appointment: 2012 Deputy Treasurer of Fidelity's Equity and High Income Funds. Mr. Sadoski also serves as Assistant Treasurer of other Fidelity funds (2012-present) and is an employee of Fidelity Investments (2012-present). Previously, Mr. Sadoski served as an assistant chief accountant in the Division of Investment Management of the Securities and Exchange Commission (SEC) (2009-2012) and as a senior manager at Deloitte & Touche (1997-2009). |
Stephanie J. Dorsey (43) |
| Year of Election or Appointment: 2010 Assistant Treasurer of Fidelity's Equity and High Income Funds. Ms. Dorsey also serves as Deputy Treasurer of other Fidelity funds (2008-present) and is an employee of Fidelity Investments (2008-present). Previously, Ms. Dorsey served as Treasurer (2004-2008) of the JPMorgan Mutual Funds and Vice President (2004-2008) of JPMorgan Chase Bank. |
John R. Hebble (54) |
| Year of Election or Appointment: 2009 Assistant Treasurer of Fidelity's Equity and High Income Funds. Mr. Hebble also serves as President (2011-present), Treasurer, and Chief Financial Officer of The North Carolina Capital Management Trust: Cash and Term Portfolios (2008-present), President and Treasurer of other Fidelity funds (2008-present) and is an employee of Fidelity Investments. |
Gary W. Ryan (54) |
| Year of Election or Appointment: 2005 Assistant Treasurer of the Fidelity funds. Mr. Ryan is an employee of Fidelity Investments. Previously, Mr. Ryan served as Vice President of Fund Reporting in Fidelity Pricing and Cash Management Services (FPCMS) (1999-2005). |
Jonathan Davis (44) |
| Year of Election or Appointment: 2010 Assistant Treasurer of the Fidelity funds. Mr. Davis is also Assistant Treasurer of Fidelity Rutland Square Trust II and Fidelity Commonwealth Trust II. Mr. Davis is an employee of Fidelity Investments. Previously, Mr. Davis served as Vice President and Associate General Counsel of FMR LLC (2003-2010). |
Annual Report
The Board of Trustees of Fidelity Emerging Europe, Middle East, Africa (EMEA) Fund voted to pay on December 10, 2012, to shareholders of record at the opening of business on December 7, 2012, a distribution of $0.074 per share derived from capital gains realized from sales of portfolio securities and a dividend of $0.176 per share from net investment income:
Fidelity Emerging Europe, Middle East, Africa (EMEA) Fund designates 100% of the dividend distributed during the fiscal year, as amounts which may be taken into account as a dividend for purposes of the maximum rate under section 1 (h) (11) of the Internal Revenue Code.
The amounts per share which represent income derived from sources within, and taxes paid to, foreign countries or possessions of the United States are as follows:
| Pay Date | Income | Taxes |
Fidelity Emerging Europe, Middle East, Africa (EMEA) Fund | 12/12/11 | $0.046 | $0.0204 |
The fund will notify shareholders in January 2013 of amounts for use in preparing 2012 income tax returns.
Annual Report
Board Approval of Investment Advisory Contracts and Management Fees
Fidelity Emerging Europe, Middle East, Africa (EMEA) Fund
Each year, the Board of Trustees, including the Independent Trustees (together, the Board), votes on the renewal of the management contract and sub-advisory agreements (together, the Advisory Contracts) for the fund. The Board, assisted by the advice of fund counsel and Independent Trustees' counsel, requests and considers a broad range of information relevant to the renewal of the Advisory Contracts throughout the year.
The Board meets regularly and, at each of its meetings, considers factors that are relevant to its annual consideration of the renewal of the fund's Advisory Contracts, including the services and support provided to the fund and its shareholders. The Board has established various standing committees, each composed of and chaired by Independent Trustees with varying backgrounds, to which the Board has assigned specific subject matter responsibilities in order to enhance effective decision-making by the Board. The Board, acting directly and through its Committees, requests and receives information concerning the annual consideration of the renewal of the fund's Advisory Contracts. The Board also meets as needed to consider matters specifically related to the Board's annual consideration of the renewal of Advisory Contracts. Members of the Board may also meet with trustees of other Fidelity funds through ad hoc joint committees to discuss certain matters relevant to the Fidelity funds.
At its July 2012 meeting, the Board of Trustees, including the Independent Trustees, unanimously determined to renew the fund's Advisory Contracts. In reaching its determination, the Board considered all factors it believed relevant, including (i) the nature, extent, and quality of the services to be provided to the fund and its shareholders (including the investment performance of the fund); (ii) the competitiveness of the fund's management fee and total expense ratio relative to peer funds; (iii) the total costs of the services to be provided by and the profits to be realized by Fidelity from its relationship with the fund; (iv) the extent to which economies of scale exist and would be realized as the fund grows; and (v) whether fee levels reflect these economies of scale, if any, for the benefit of fund shareholders.
In considering whether to renew the Advisory Contracts for the fund, the Board reached a determination, with the assistance of fund counsel and Independent Trustees' counsel and through the exercise of its business judgment, that the renewal of the Advisory Contracts is in the best interests of the fund and its shareholders and that the compensation payable under the Advisory Contracts is fair and reasonable. The Board's decision to renew the Advisory Contracts was not based on any single factor, but rather was based on a comprehensive consideration of all the information provided to the Board at its meetings throughout the year. The Board, in reaching its determination to renew the Advisory Contracts, is aware that shareholders in the fund have a broad range of investment choices available to them, including a wide choice among mutual funds offered by Fidelity's competitors, and that the fund's shareholders, who have the opportunity to review and weigh the disclosure provided by the fund in its prospectus and other public disclosures, have chosen to invest in this fund, managed by Fidelity.
Annual Report
Board Approval of Investment Advisory Contracts and
Management Fees - continued
Nature, Extent, and Quality of Services Provided. The Board considered the staffing within the investment adviser, FMR, and the sub-advisers (together, the Investment Advisers), including the backgrounds of the fund's investment personnel, and also considered the fund's investment objective, strategies, and related investment philosophy. The Independent Trustees also had discussions with senior management of Fidelity's investment operations and investment groups. The Board considered the structure of the portfolio manager compensation program and whether this structure provides appropriate incentives to act in the best interests of the fund.
Resources Dedicated to Investment Management and Support Services. The Board and the Fund Oversight and Research Committees reviewed the general qualifications and capabilities of the Investment Advisers' investment staff, including its size, education, experience, and resources, as well as the Investment Advisers' approach to recruiting, training, managing, and compensating investment personnel. The Board also noted that FMR has continued to increase the resources devoted to non-U.S. offices, including expansion of Fidelity's global investment organization. The Board noted that Fidelity's analysts have extensive resources, tools and capabilities that allow them to conduct sophisticated quantitative and fundamental analysis, as well as credit analysis of issuers, counterparties and guarantors. The Board also believes that Fidelity's investment professionals have sufficient access to global information and data so as to provide competitive investment results over time, and that those professionals also have access to sophisticated tools that permit them to assess portfolio construction and risk and performance attribution characteristics continuously, as well as to transmit new information and research conclusions rapidly around the world. Additionally, in its deliberations, the Board considered the Investment Advisers' trading and risk management capabilities and resources, which are an integral part of the investment management process.
Shareholder and Administrative Services. The Board considered (i) the nature, extent, quality, and cost of advisory, administrative, and shareholder services performed by the Investment Advisers and their affiliates under the Advisory Contracts and under separate agreements covering transfer agency, pricing and bookkeeping, and securities lending services for the fund; (ii) the nature and extent of the supervision of third party service providers, principally custodians and subcustodians; and (iii) the resources devoted to, and the record of compliance with, the fund's compliance policies and procedures. The Board also reviewed the allocation of fund brokerage, including allocations to brokers affiliated with the Investment Advisers, the use of brokerage commissions to pay fund expenses, and the use of "soft" commission dollars to pay for research services.
Annual Report
The Board noted that the growth of fund assets over time across the complex allows Fidelity to reinvest in the development of services designed to enhance the value or convenience of the Fidelity funds as investment vehicles. These services include 24-hour access to account information and market information through telephone representatives and over the Internet, investor education materials and asset allocation tools, and the expanded availability of Fidelity Investor Centers.
Investment in a Large Fund Family. The Board considered the benefits to shareholders of investing in a Fidelity fund, including the benefits of investing in a fund that is part of a large family of funds offering a variety of investment disciplines and providing a large variety of mutual fund investor services. The Board noted that Fidelity had taken, or had made recommendations that resulted in the Fidelity funds taking, a number of actions over the previous year that benefited particular funds, including (i) continuing to dedicate additional resources to investment research and support of the senior management team that oversees asset management; (ii) persisting in efforts to enhance Fidelity's research capabilities, in particular, international research; (iii) launching new funds and making other enhancements to meet client needs for global and income-oriented solutions; (iv) continuing to launch dedicated lower cost underlying funds to meet investment management's portfolio construction needs related to expanding underlying fund options, specifically for the Freedom Fund product lines; (v) adopting a "Stock Selector" sector neutral investment approach and employing a team of portfolio managers who are sector specialists to manage certain funds; (vi) rationalizing product lines and gaining increased efficiencies through the mergers of several funds into other funds; (vii) strengthening the Spartan Index Fund product line by adding new funds and/or new low-cost institutional share classes, restructuring fund expenses to accommodate new classes, and reducing investment minimums for certain classes of shares; (viii) modifying the eligibility criteria for Institutional Class shares to increase their appeal to government entities and charitable investors; and (ix) reducing certain transfer agent fee rates.
Investment Performance. The Board considered whether the fund has operated in accordance with its investment objective, as well as its record of compliance with its investment restrictions. It also reviewed the fund's absolute investment performance for each class, as well as the fund's relative investment performance for each class measured against a broad-based securities market index. The Board noted that FMR believes that no meaningful peer group exists for the fund principally because most other funds in the fund's third-party peer group have different and/or broader investment mandates than the fund's more specialized strategies. Because the fund had been in existence less than five calendar years, the following charts considered by the Board show, over the one- and three-year periods ended December 31, 2011, the cumulative total returns of Institutional Class (Class I) and Class B of the fund and the cumulative total returns of a broad-based securities market index ("benchmark"). The returns of Institutional Class (Class I) and Class B show the performance of the highest and lowest performing classes, respectively (based on three-year performance).
Annual Report
Board Approval of Investment Advisory Contracts and
Management Fees - continued
Fidelity Emerging Europe, Middle East, Africa (EMEA) Fund
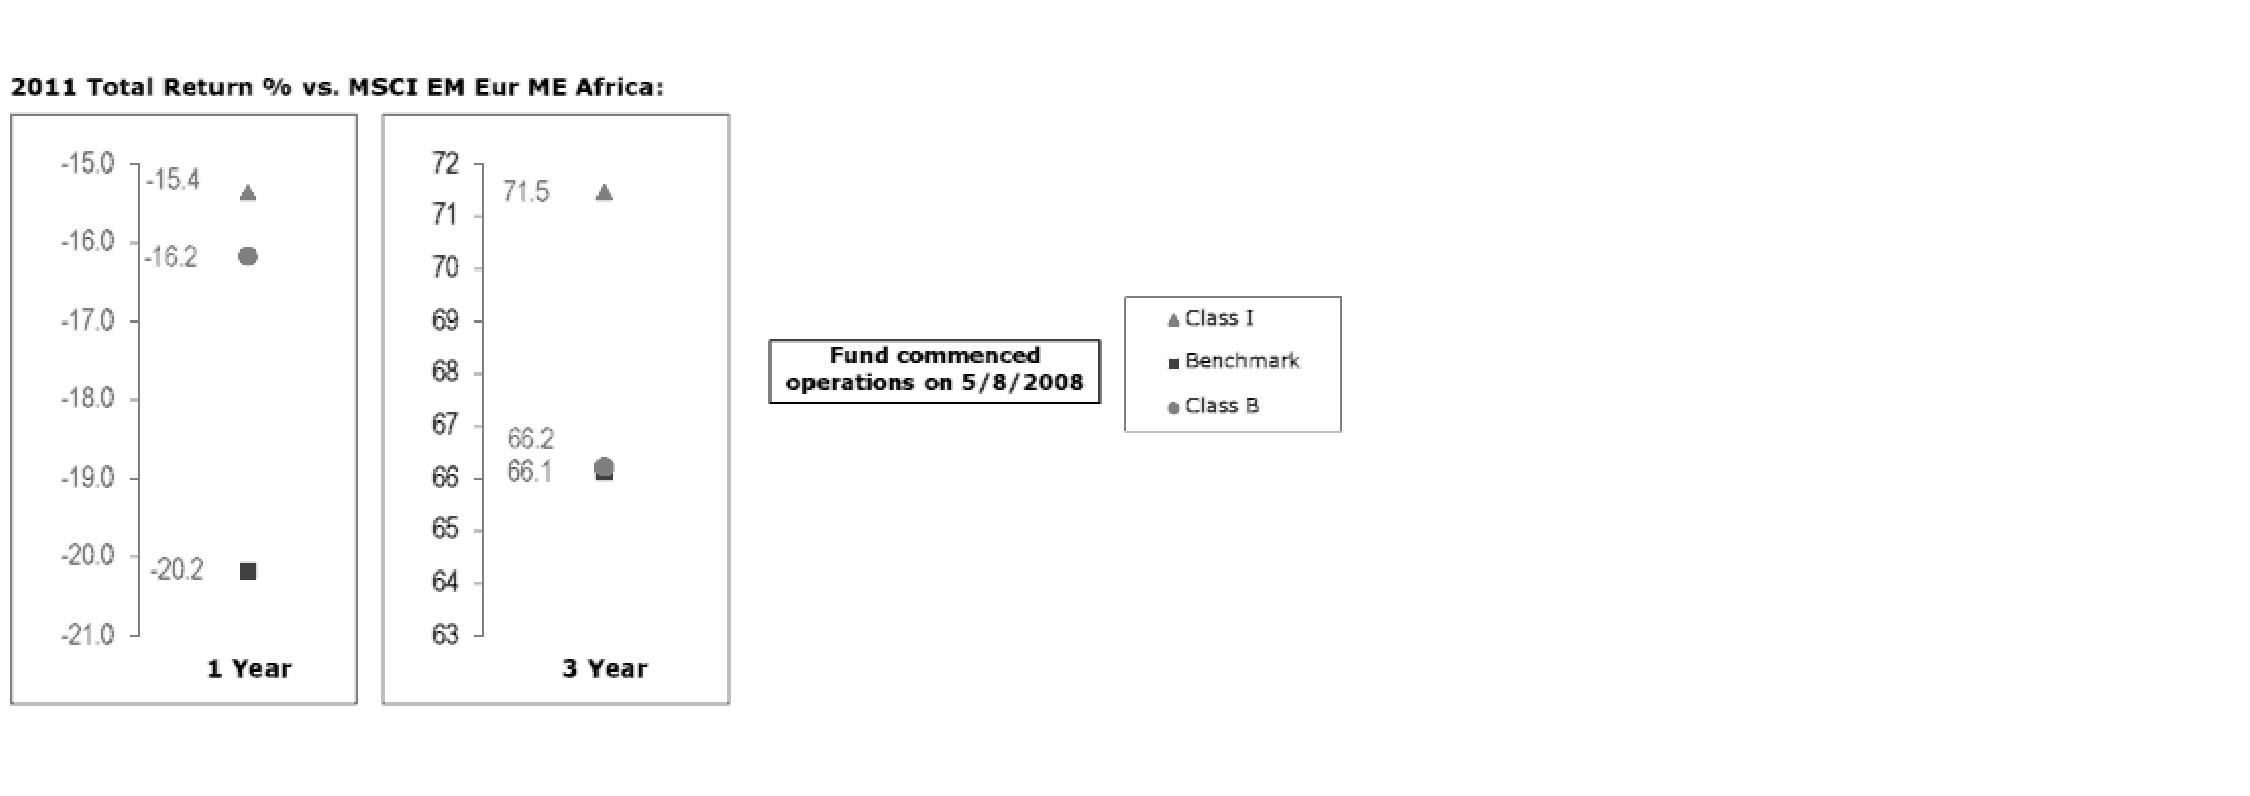
The Board noted that the investment performance of Institutional Class (Class I) of the fund compared favorably to its benchmark for all the periods shown. The Board considered that the variations in performance among the fund's classes reflect the variations in class expenses, which result in lower performance for higher expense classes. The Board also reviewed the fund's performance since inception as well as performance in the current year.
Based on its review, the Board concluded that the nature, extent, and quality of services provided to the fund under the Advisory Contracts should benefit the fund's shareholders.
Competitiveness of Management Fee and Total Expense Ratio. The Board considered the fund's management fee and total expense ratio compared to "mapped groups" of competitive funds and classes. Fidelity creates "mapped groups" by combining similar Lipper investment objective categories that have comparable management fee characteristics. Combining Lipper investment objective categories aids the Board's management fee and total expense ratio comparisons by broadening the competitive group used for comparison and by reducing the number of universes to which various Fidelity funds are compared.
Management Fee. The Board considered two proprietary management fee comparisons for the 12-month (or shorter) periods shown in the chart below. The group of Lipper funds used by the Board for management fee comparisons is referred to below as the "Total Mapped Group." The Total Mapped Group comparison focuses on a fund's standing relative to the total universe of comparable funds available to investors in terms of gross management fees before expense reimbursements or caps. "TMG %" represents the percentage of funds in the Total Mapped Group that had management fees that were lower than the fund's. For example, a TMG % of 13% means that 87% of the funds in the Total Mapped Group had higher management fees than the fund. The "Asset-Size Peer Group" (ASPG) comparison focuses on a fund's standing relative to non-Fidelity funds similar in size to the fund within the Total Mapped Group. The ASPG represents at least 15% of the funds in the Total Mapped Group with comparable asset size and management fee characteristics, subject to a minimum of 50 funds (or all funds in the Total Mapped Group if fewer than 50). Additional information, such as the ASPG quartile in which the fund's management fee ranked, is also included in the chart and considered by the Board.
Annual Report
Fidelity Emerging Europe, Middle East, Africa (EMEA) Fund

The Board noted that the fund's management fee ranked below the median of its Total Mapped Group and below the median of its ASPG for 2011.
Based on its review, the Board concluded that the fund's management fee is fair and reasonable in light of the services that the fund receives and the other factors considered.
Total Expense Ratio. In its review of each class's total expense ratio, the Board considered the fund's management fee as well as other fund or class expenses, as applicable, such as transfer agent fees, pricing and bookkeeping fees, fund-paid 12b-1 fees, and custodial, legal, and audit fees. The Board also noted the effects of any waivers and reimbursements on fees and expenses. As part of its review, the Board also considered the current and historical total expense ratios of each class of the fund compared to competitive fund median expenses. Each class of the fund is compared to those funds and classes in the Total Mapped Group (used by the Board for management fee comparisons) that have a similar sales load structure.
Annual Report
Board Approval of Investment Advisory Contracts and
Management Fees - continued
The Board noted that the total expense ratio of each of Class A, Class B, Class C, Institutional Class, and the retail class ranked below its competitive median for 2011 and the total expense ratio of Class T ranked above its competitive median for 2011. The Board considered that various factors, including 12b-1 fees, positive or negative performance adjustments, and relatively higher other expenses in the case of small fund size, can affect total expense ratios. The Board noted that the total expense ratio of Class T was above the competitive median primarily because of higher 12b-1 fees on Class T. Class T has a higher 12b-1 fee, but a lower front-end sales charge, than traditionally priced front-end sales charge classes. The Board considered that Class T is primarily sold load-waived in the retirement plan market where its 0.50% 12b-1 fee is comparable to competing no-load, higher 12b-1 fee classes designed specifically for retirement plans. The Board noted that the fund offers multiple classes, each of which has a different sales load and 12b-1 fee structure, and that the multiple structures are intended to offer a range of pricing options for the intermediary market. The Board also noted that the total expense ratios of the classes vary primarily by the level of their 12b-1 fees, although differences in transfer agent fees may also cause expenses to vary from class to class.
Fees Charged to Other Fidelity Clients. The Board also considered Fidelity fee structures and other information with respect to clients of FMR and its affiliates, such as other mutual funds advised or subadvised by FMR or its affiliates, pension plan clients, and other institutional clients. The Board noted the findings of the 2010 ad hoc joint committee (created with the board of other Fidelity funds), which reviewed and compared Fidelity's institutional investment advisory business with its business of providing services to the Fidelity funds, including the differences in services provided, fees charged, and costs incurred, as well as competition in their respective marketplaces.
Based on its review of total expense ratios and fees charged to other Fidelity clients, the Board concluded that the total expense ratio of each class of the fund was reasonable, although Class T was above the median of the universe presented for comparison, in light of the services that the fund and its shareholders receive and the other factors considered.
Costs of the Services and Profitability. The Board considered the revenues earned and the expenses incurred by Fidelity in conducting the business of developing, marketing, distributing, managing, administering and servicing the fund and its shareholders. The Board also considered the level of Fidelity's profits in respect of all the Fidelity funds.
Annual Report
On an annual basis, FMR presents to the Board Fidelity's profitability for the fund. Fidelity calculates the profitability for each fund, as well as aggregate profitability for groups of Fidelity funds and all Fidelity funds, using a series of detailed revenue and cost allocation methodologies which originate with the books and records of Fidelity on which Fidelity's audited financial statements are based. The Audit Committee of the Board reviews any significant changes from the prior year's methodologies.
PricewaterhouseCoopers LLP (PwC), independent registered public accounting firm and auditor to Fidelity and certain Fidelity funds, has been engaged annually by the Board as part of the Board's assessment of Fidelity's profitability analysis. PwC's engagement includes the review and assessment of Fidelity's methodologies used in determining the revenues and expenses attributable to Fidelity's mutual fund business, and completion of agreed-upon procedures surrounding the mathematical accuracy of fund profitability and its conformity to allocation methodologies. After considering PwC's reports issued under the engagement and information provided by Fidelity, the Board concluded that while other allocation methods may also be reasonable, Fidelity's profitability methodologies are reasonable in all material respects.
The Board also reviewed Fidelity's non-fund businesses and fall-out benefits related to the mutual fund business as well as cases where Fidelity's affiliates may benefit from or be related to the fund's business.
The Board considered the costs of the services provided by and the profits realized by Fidelity in connection with the operation of the fund and was satisfied that the profitability was not excessive in the circumstances.
Economies of Scale. The Board considered whether there have been economies of scale in respect of the management of the Fidelity funds, whether the Fidelity funds (including the fund) have appropriately benefited from any such economies of scale, and whether there is potential for realization of any further economies of scale. The Board considered the extent to which the fund will benefit from economies of scale through increased services to the fund, through waivers or reimbursements, or through fee or expense reductions. The Board also noted that in 2009, it and the board of other Fidelity funds created an ad hoc committee (the Economies of Scale Committee) to analyze whether FMR attains economies of scale in respect of the management and servicing of the Fidelity funds, whether the Fidelity funds have appropriately benefited from such economies of scale, and whether there is potential for realization of any further economies of scale.
The Board recognized that the fund's management contract incorporates a "group fee" structure, which provides for lower group fee rates as total fund assets under FMR's management increase, and for higher group fee rates as total fund assets under FMR's management decrease. FMR calculates the group fee rates based on a tiered asset "breakpoint" schedule that varies based on asset class. The Board considered that the group fee is designed to deliver the benefits of economies of scale to fund shareholders when total Fidelity fund assets increase, even if assets of any particular fund are unchanged or have declined, because some portion of Fidelity's costs are attributable to services provided to all Fidelity funds, and all funds benefit if those costs can be allocated among more assets. The Board concluded that, given the group fee structure, fund shareholders will benefit from lower management fees as assets under FMR's management increase at the fund complex level, regardless of whether Fidelity achieves any such economies of scale.
Annual Report
Board Approval of Investment Advisory Contracts and
Management Fees - continued
The Board concluded, taking into account the analysis of the Economies of Scale Committee, that economies of scale, if any, are being appropriately shared between fund shareholders and Fidelity.
Additional Information Requested by the Board. In order to develop fully the factual basis for consideration of the Fidelity funds' Advisory Contracts, the Board requested and received additional information on certain topics, including (i) fund performance trends, actions to be taken by FMR to improve certain funds' overall performance, and Fidelity's long-term strategies for certain funds; (ii) the potential to further rationalize the Fidelity fund lineup with the possibility of achieving savings for the funds and Fidelity; (iii) Fidelity's compensation structure for portfolio managers and other key investment personnel; (iv) the amount of the investment that each portfolio manager has made in the Fidelity fund(s) that he or she manages; (v) the realization of fall-out benefits in certain Fidelity business units; (vi) Fidelity's group fee structures, the potential impact of regulatory changes on such structures, and the rationale for the individual fee rates of certain funds; (vii) fund profitability methodology, including Fidelity's cost allocation methodology, and the impact of certain factors on fund profitability results; (viii) trends regarding industry use of performance fee structures and the possibility of implementing performance fee structures for additional funds; and (ix) the impact of net redemptions from the Fidelity funds.
Based on its evaluation of all of the conclusions noted above, and after considering all factors it believed relevant, the Board ultimately concluded that the advisory fee structures are fair and reasonable, and that the fund's Advisory Contracts should be renewed.
Annual Report
Investment Adviser
Fidelity Management &
Research Company
Boston, MA
Investment Sub-Advisers
FMR Co., Inc.
Fidelity Management & Research
(U.K.) Inc.
FIL Investments (Japan) Limited
FIL Investment Advisors
FIL Investment Advisors
(U.K.) Limited
Fidelity Management & Research
(Hong Kong) Limited
Fidelity Management & Research
(Japan) Inc.
General Distributor
Fidelity Distributors Corporation
Smithfield, RI
Transfer and Service Agents
Fidelity Investments Institutional
Operations Company, Inc.
Boston, MA
Fidelity Service Company, Inc.
Boston, MA
Custodian
State Street Bank & Trust Company
Quincy, MA
The Fidelity Telephone Connection
Mutual Fund 24-Hour Service
Exchanges/Redemptions
and Account Assistance 1-800-544-6666
Product Information 1-800-544-6666
Retirement Accounts 1-800-544-4774
(8 a.m. - 9 p.m.)
TDD Service 1-800-544-0118
for the deaf and hearing impaired
(9 a.m. - 9 p.m. Eastern time)
Fidelity Automated Service
Telephone (FAST®) (automated graphic)
1-800-544-5555
(automated graphic)
Automated line for quickest service
(Fidelity Investment logo)(registered trademark)
Corporate Headquarters
82 Devonshire St., Boston, MA 02109
www.fidelity.com
EME-UANN-1212
1.861971.104
(Fidelity Investment logo)(registered trademark)
Fidelity Advisor®
International Value
Fund - Class A, Class T, Class B
and Class C
Annual Report
October 31, 2012
(Fidelity Cover Art)
Class A, Class T, Class B, and Class C are classes of Fidelity® International Value Fund
Contents
Performance | (Click Here) | How the fund has done over time. |
Management's Discussion of Fund Performance | (Click Here) | The Portfolio Manager's review of fund performance and strategy. |
Shareholder Expense Example | (Click Here) | An example of shareholder expenses. |
Investment Changes | (Click Here) | A summary of major shifts in the fund's investments over the past six months. |
Investments | (Click Here) | A complete list of the fund's investments with their market values. |
Financial Statements | (Click Here) | Statements of assets and liabilities, operations, and changes in net assets, as well as financial highlights. |
Notes | (Click Here) | Notes to financial statements. |
Report of Independent Registered Public Accounting Firm | (Click Here) | |
Trustees and Officers | (Click Here) | |
Distributions | (Click Here) | |
Board Approval of Investment Advisory Contracts and Management Fees | (Click Here) | |
To view a fund's proxy voting guidelines and proxy voting record for the 12-month period ended June 30, visit http://www.fidelity.com/proxyvotingresults or visit the Securities and Exchange Commission's (SEC) web site at http://www.sec.gov. You may also call 1-877-208-0098 to request a free copy of the proxy voting guidelines.
Standard & Poor's, S&P and S&P 500 are registered service marks of The McGraw-Hill Companies, Inc. and have been licensed for use by Fidelity Distributors Corporation.
Other third party marks appearing herein are the property of their respective owners.
All other marks appearing herein are registered or unregistered trademarks or service marks of FMR LLC or an affiliated company. © 2012 FMR LLC. All rights reserved.
Annual Report
This report and the financial statements contained herein are submitted for the general information of the shareholders of the fund. This report is not authorized for distribution to prospective investors in the fund unless preceded or accompanied by an effective prospectus.
A fund files its complete schedule of portfolio holdings with the SEC for the first and third quarters of each fiscal year on Form N-Q. Forms N-Q are available on the SEC's web site at http://www.sec.gov. A fund's Forms N-Q may be reviewed and copied at the SEC's Public Reference Room in Washington, DC. Information regarding the operation of the SEC's Public Reference Room may be obtained by calling 1-800-SEC-0330. For a complete list of a fund's portfolio holdings, view the most recent holdings listing, semiannual report, or annual report on Fidelity's web site at http://www.fidelity.com, http://www.advisor.fidelity.com, or http://www.401k.com, as applicable.
NOT FDIC INSURED • MAY LOSE VALUE • NO BANK GUARANTEE
Neither the fund nor Fidelity Distributors Corporation is a bank.
Annual Report
Average annual total return reflects the change in the value of an investment, assuming reinvestment of the class' distributions from dividend income and capital gains (the profits earned upon the sale of securities that have grown in value, if any) and assuming a constant rate of performance each year. The $10,000 table and the fund's returns do not reflect the deduction of taxes that a shareholder would pay on fund distributions or the redemption of fund shares. During periods of reimbursement by Fidelity, a fund's total return will be greater than it would be had the reimbursement not occurred. How a fund did yesterday is no guarantee of how it will do tomorrow.
Average Annual Total Returns
Periods ended October 31, 2012 | Past 1
year | Past 5
years | Life of
fund A |
Class A (incl. 5.75% sales charge) | 2.57% | -9.01% | -3.10% |
Class T (incl. 3.50% sales charge) | 4.80% | -8.83% | -3.00% |
Class B (incl. contingent deferred sales charge)B | 3.07% | -8.94% | -2.93% |
Class C (incl. contingent deferred sales charge)C | 7.12% | -8.59% | -2.92% |
A From May 18, 2006.
B Class B shares' contingent deferred sales charges included in the past one year, past five years, and life of class total return figures are 5%, 2%, and 0%, respectively.
C Class C shares' contingent deferred sales charges included in the past one year, past five years, and life of class total return figures are 1%, 0%, and 0%, respectively.
Annual Report
$10,000 Over Life of Fund
Let's say hypothetically that $10,000 was invested in Fidelity Advisor® International Value Fund - Class A on May 18, 2006, when the fund started, and the current 5.75% sales charge was paid. The chart shows how the value of your investment would have changed, and also shows how the MSCI® EAFE® Value Index performed over the same period.
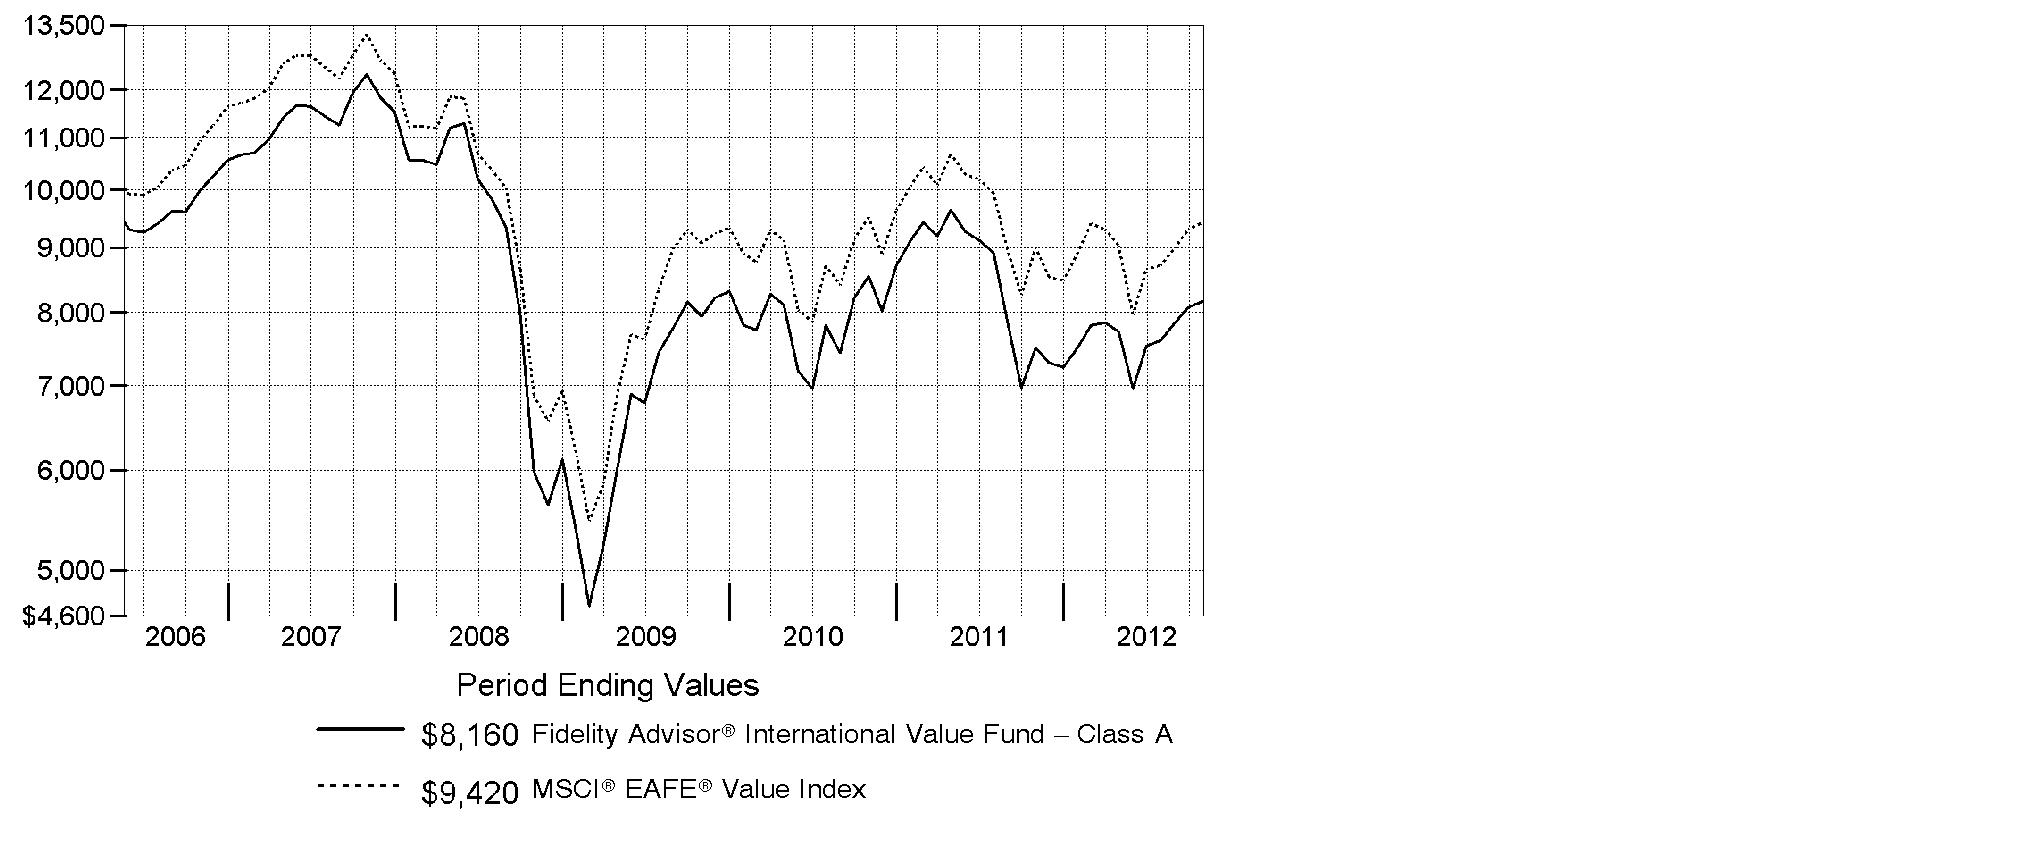
Annual Report
Market Recap: International stocks experienced pendulum-like swings during the 12 months ending October 31, 2012, finishing the period with a modest advance. The market faced periodic bouts of volatility this past year, as a number of macroeconomic concerns - including the eurozone debt crisis, the strength and pace of the U.S. economic recovery, and a slowdown in China's once-blistering growth - dominated headlines and weighed on investors. While a stronger U.S. dollar provided an additional head wind, foreign developed- and emerging-markets stocks still managed a gain for the 12 months, as the MSCI® ACWI® (All Country World Index) ex USA Index rose 4.11%, largely buttressed in the summertime by pledges of accommodative monetary action from eurozone officials, as well as signs that the U.S. housing market was on the mend. Within the index, Asia-Pacific ex Japan showed the most impressive gains, advancing roughly 11%. A number of core European components, most notably Germany (+11%), Switzerland (+10%) and the U.K. (+9%), benefited from optimism about the eurozone's ability to resolve its debt woes, which also helped the region outpace the index overall. Elsewhere, results from Canada (+3%) and the generally more volatile emerging markets (+2%) each fell short of the MSCI index, while Japan was among the few benchmark constituents to finish in the red, returning about -3%.
Comments from Alex Zavratsky, Portfolio Manager of Fidelity Advisor® International Value Fund: For the year, the fund's Class A, Class T, Class B and Class C shares rose 8.82%, 8.60%, 8.07% and 8.12%, respectively (excluding sales charges), easily outpacing the 4.64% gain of the benchmark MSCI® EAFE® Value Index. Investments in two pharmaceuticals firms - France's Sanofi and non-index Roche Holding of Switzerland - were standouts. Within this industry, I focused on companies where product patent cliffs were either behind them or were well understood so they could focus on future growth. Elsewhere, I avoided benchmark components Telefonica - Spain's telecom giant - and France Telecom, as I believed pressure on both companies' cash flow, too much debt, poor business fundamentals and unsustainable dividend yields would hamper each stock. That proved to be the right call. Similarly, I did not invest in Finnish mobile device maker Nokia. Given the strength of competitors Samsung Electronics and Apple, I believed Nokia, with its non-differentiated product, was at a technological and brand disadvantage. Individual detractors included Repsol, a Spain-based integrated oil and gas company that suffered because Argentina moved to nationalize the company's local unit. An untimely investment in Japanese electronics manufacturer Hitachi also hurt.
The views expressed above reflect those of the portfolio manager(s) only through the end of the period as stated on the cover of this report and do not necessarily represent the views of Fidelity or any other person in the Fidelity organization. Any such views are subject to change at any time based upon market or other conditions and Fidelity disclaims any responsibility to update such views. These views may not be relied on as investment advice and, because investment decisions for a Fidelity fund are based on numerous factors, may not be relied on as an indication of trading intent on behalf of any Fidelity fund.
Annual Report
Shareholder Expense Example
As a shareholder of the Fund, you incur two types of costs: (1) transaction costs, including sales charges (loads) on purchase payments or redemption proceeds, redemption fees and (2) ongoing costs, including management fees, distribution and/or service (12b-1) fees and other Fund expenses. This Example is intended to help you understand your ongoing costs (in dollars) of investing in the Fund and to compare these costs with the ongoing costs of investing in other mutual funds.
The Example is based on an investment of $1,000 invested at the beginning of the period and held for the entire period (May 1, 2012 to October 31, 2012).
Actual Expenses
The first line of the accompanying table for each class of the Fund provides information about actual account values and actual expenses. You may use the information in this line, together with the amount you invested, to estimate the expenses that you paid over the period. Simply divide your account value by $1,000.00 (for example, an $8,600 account value divided by $1,000.00 = 8.6), then multiply the result by the number in the first line for a class of the Fund under the heading entitled "Expenses Paid During Period" to estimate the expenses you paid on your account during this period. A small balance maintenance fee of $12.00 that is charged once a year may apply for certain accounts with a value of less than $2,000. This fee is not included in the table below. If it was, the estimate of expenses you paid during the period would be higher, and your ending account value lower, by this amount. In addition, the Fund, as a shareholder in the underlying Fidelity Central Funds, will indirectly bear its pro-rata share of the fees and expenses incurred by the underlying Fidelity Central Funds. These fees and expenses are not included in the Fund's annualized expense ratio used to calculate the expense estimate in the table below.
Hypothetical Example for Comparison Purposes
The second line of the accompanying table for each class of the Fund provides information about hypothetical account values and hypothetical expenses based on a Class' actual expense ratio and an assumed rate of return of 5% per year before expenses, which is not the Class' actual return. The hypothetical account values and expenses may not be used to estimate the actual ending account balance or expenses you paid for the period. You may use this information to compare the ongoing costs of investing in the Fund and other funds. To do so, compare this 5% hypothetical example with the 5% hypothetical examples that appear in the shareholder reports of the other funds. A small balance maintenance fee of $12.00 that is charged once a year may apply for certain accounts with a value of less than $2,000. This fee is not included in the table below. If it was, the estimate of expenses you paid during the period would be higher, and your ending account value lower, by this amount. In addition, the Fund, as a shareholder in the underlying Fidelity Central Funds, will indirectly bear its pro-rata share of the fees and expenses incurred by the underlying Fidelity Central Funds. These fees and expenses are not included in the Fund's annualized expense ratio used to calculate the expense estimate in the table below.
Please note that the expenses shown in the table are meant to highlight your ongoing costs only and do not reflect any transaction costs. Therefore, the second line of the table is useful in comparing ongoing costs only, and will not help you determine the relative total costs of owning different funds. In addition, if these transactional costs were included, your costs would have been higher.
Annual Report
| Annualized Expense Ratio | Beginning
Account Value
May 1, 2012 | Ending
Account Value
October 31, 2012 | Expenses Paid
During Period*
May 1, 2012 to October 31, 2012 |
Class A | 1.45% | | | |
Actual | | $ 1,000.00 | $ 1,057.20 | $ 7.50 |
HypotheticalA | | $ 1,000.00 | $ 1,017.85 | $ 7.35 |
Class T | 1.70% | | | |
Actual | | $ 1,000.00 | $ 1,055.80 | $ 8.78 |
HypotheticalA | | $ 1,000.00 | $ 1,016.59 | $ 8.62 |
Class B | 2.20% | | | |
Actual | | $ 1,000.00 | $ 1,054.20 | $ 11.36 |
HypotheticalA | | $ 1,000.00 | $ 1,014.08 | $ 11.14 |
Class C | 2.20% | | | |
Actual | | $ 1,000.00 | $ 1,054.30 | $ 11.36 |
HypotheticalA | | $ 1,000.00 | $ 1,014.08 | $ 11.14 |
International Value | 1.16% | | | |
Actual | | $ 1,000.00 | $ 1,060.20 | $ 6.01 |
HypotheticalA | | $ 1,000.00 | $ 1,019.30 | $ 5.89 |
Institutional Class | 1.13% | | | |
Actual | | $ 1,000.00 | $ 1,058.60 | $ 5.85 |
HypotheticalA | | $ 1,000.00 | $ 1,019.46 | $ 5.74 |
A 5% return per year before expenses
* Expenses are equal to each Class' annualized expense ratio, multiplied by the average account value over the period, multiplied by 184/366 (to reflect the one-half year period).
Annual Report
Investment Changes (Unaudited)
Geographic Diversification (% of fund's net assets) |
As of October 31, 2012 |
 | United Kingdom 26.3% | |
 | Japan 17.2% | |
 | Germany 10.3% | |
 | Switzerland 9.8% | |
 | France 9.8% | |
 | Australia 8.3% | |
 | Italy 3.3% | |
 | Netherlands 2.9% | |
 | Singapore 2.5% | |
| Other * 9.6% | |

* Includes short-term investments and net other assets (liabilities).
Percentages are based on country or territory of incorporation and are adjusted for the effect of futures contracts, if applicable. |
As of April 30, 2012 |
| United Kingdom 27.4% | |
| Japan 22.7% | |
| Germany 10.3% | |
| Switzerland 9.7% | |
| Australia 7.5% | |
| France 7.4% | |
| Netherlands 3.5% | |
| Italy 2.7% | |
| Spain 1.8% | |
| Other * 7.0% | |

* Includes short-term investments and net other assets (liabilities).
Percentages are based on country or territory of incorporation and are adjusted for the effect of futures contracts, if applicable. |
Asset Allocation |
| % of fund's
net assets | % of fund's net assets
6 months ago |
Stocks | 99.0 | 99.1 |
Short-Term Investments and Net Other Assets (Liabilities) | 1.0 | 0.9 |
Top Ten Stocks as of October 31, 2012 |
| % of fund's
net assets | % of fund's net assets
6 months ago |
Royal Dutch Shell PLC Class A sponsored ADR (United Kingdom, Oil, Gas & Consumable Fuels) | 4.6 | 5.1 |
Sanofi SA (France, Pharmaceuticals) | 3.5 | 3.2 |
Roche Holding AG (participation certificate) (Switzerland, Pharmaceuticals) | 3.0 | 3.8 |
Vodafone Group PLC (United Kingdom, Wireless Telecommunication Services) | 3.0 | 3.5 |
HSBC Holdings PLC sponsored ADR (United Kingdom, Commercial Banks) | 2.6 | 2.1 |
Commonwealth Bank of Australia (Australia, Commercial Banks) | 2.5 | 2.3 |
ENI SpA (Italy, Oil, Gas & Consumable Fuels) | 2.5 | 1.9 |
Australia & New Zealand Banking Group Ltd. (Australia, Commercial Banks) | 2.1 | 2.4 |
BHP Billiton PLC (United Kingdom, Metals & Mining) | 1.9 | 0.0 |
BNP Paribas SA (France, Commercial Banks) | 1.9 | 1.0 |
| 27.6 | |
Market Sectors as of October 31, 2012 |
| % of fund's
net assets | % of fund's net assets
6 months ago |
Financials | 32.5 | 26.7 |
Health Care | 11.9 | 13.2 |
Energy | 11.1 | 11.8 |
Consumer Discretionary | 8.6 | 9.0 |
Industrials | 7.7 | 7.5 |
Consumer Staples | 7.5 | 9.1 |
Telecommunication Services | 6.8 | 7.0 |
Utilities | 6.0 | 7.1 |
Materials | 5.6 | 5.0 |
Information Technology | 1.3 | 2.7 |
Annual Report
Investments October 31, 2012
Showing Percentage of Net Assets
Common Stocks - 97.7% |
| Shares | | Value |
Australia - 8.3% |
Australia & New Zealand Banking Group Ltd. | 110,422 | | $ 2,917,170 |
Commonwealth Bank of Australia | 57,527 | | 3,448,593 |
Origin Energy Ltd. | 46,320 | | 546,217 |
Sydney Airport unit | 236,028 | | 830,580 |
Telstra Corp. Ltd. | 279,594 | | 1,201,563 |
Transurban Group unit | 89,247 | | 563,269 |
Westfield Group unit | 136,805 | | 1,513,831 |
Woolworths Ltd. | 17,763 | | 542,288 |
TOTAL AUSTRALIA | | 11,563,511 |
Bailiwick of Jersey - 0.5% |
Wolseley PLC | 16,207 | | 708,513 |
Belgium - 0.2% |
KBC Groupe SA | 12,008 | | 281,867 |
Bermuda - 0.3% |
Cheung Kong Infrastructure Holdings Ltd. | 81,000 | | 474,500 |
Canada - 0.5% |
Suncor Energy, Inc. | 20,900 | | 701,445 |
Cayman Islands - 0.4% |
ENN Energy Holdings Ltd. | 148,000 | | 615,867 |
Finland - 0.7% |
Sampo OYJ (A Shares) | 33,034 | | 1,035,316 |
France - 9.8% |
Arkema SA | 9,139 | | 833,214 |
Atos Origin SA | 12,769 | | 857,483 |
BNP Paribas SA | 51,793 | | 2,605,373 |
Compagnie de St. Gobain | 20,100 | | 708,371 |
GDF Suez | 48,080 | | 1,103,356 |
Pernod Ricard SA | 6,700 | | 721,050 |
PPR SA | 3,642 | | 640,346 |
Sanofi SA | 55,722 | | 4,893,923 |
Schneider Electric SA | 7,500 | | 468,898 |
Unibail-Rodamco | 3,500 | | 788,675 |
TOTAL FRANCE | | 13,620,689 |
Germany - 9.0% |
Allianz AG | 19,369 | | 2,401,557 |
BASF AG | 9,769 | | 809,487 |
Bayer AG | 29,490 | | 2,568,235 |
Daimler AG (Germany) | 27,237 | | 1,271,799 |
Deutsche Post AG | 48,764 | | 966,727 |
Common Stocks - continued |
| Shares | | Value |
Germany - continued |
Fresenius SE & Co. KGaA | 7,100 | | $ 809,835 |
HeidelbergCement Finance AG | 13,393 | | 709,823 |
RWE AG | 28,200 | | 1,288,621 |
Siemens AG | 16,709 | | 1,683,582 |
TOTAL GERMANY | | 12,509,666 |
Hong Kong - 1.1% |
Cheung Kong Holdings Ltd. | 94,000 | | 1,388,765 |
Hysan Development Co. Ltd. | 35,000 | | 154,676 |
TOTAL HONG KONG | | 1,543,441 |
Italy - 3.3% |
ENI SpA | 148,500 | | 3,417,123 |
Fiat Industrial SpA | 37,600 | | 407,183 |
Saipem SpA | 16,432 | | 738,200 |
TOTAL ITALY | | 4,562,506 |
Japan - 17.2% |
Aeon Credit Service Co. Ltd. | 40,900 | | 867,902 |
Air Water, Inc. | 57,000 | | 714,017 |
Aozora Bank Ltd. | 160,000 | | 450,958 |
Astellas Pharma, Inc. | 33,100 | | 1,644,012 |
Chubu Electric Power Co., Inc. | 45,400 | | 468,047 |
Credit Saison Co. Ltd. | 29,800 | | 654,383 |
Denso Corp. | 29,700 | | 929,729 |
Hitachi Ltd. | 195,000 | | 1,033,258 |
Honda Motor Co. Ltd. | 60,900 | | 1,830,852 |
INPEX Corp. | 80 | | 455,969 |
Itochu Corp. | 74,300 | | 743,652 |
Japan Retail Fund Investment Corp. | 322 | | 586,885 |
Japan Tobacco, Inc. | 49,400 | | 1,365,106 |
JSR Corp. | 34,600 | | 592,920 |
Mitsubishi Corp. | 52,600 | | 938,933 |
Mitsubishi Estate Co. Ltd. | 56,000 | | 1,107,654 |
Nippon Telegraph & Telephone Corp. | 14,500 | | 663,058 |
ORIX Corp. | 7,800 | | 801,203 |
Santen Pharmaceutical Co. Ltd. | 16,100 | | 704,867 |
Seven & i Holdings Co., Ltd. | 61,300 | | 1,890,525 |
Seven Bank Ltd. | 237,800 | | 679,173 |
Softbank Corp. | 24,200 | | 766,045 |
Sumitomo Mitsui Financial Group, Inc. | 79,100 | | 2,417,059 |
Sumitomo Realty & Development Co. Ltd. | 24,000 | | 662,608 |
Common Stocks - continued |
| Shares | | Value |
Japan - continued |
Toyo Suisan Kaisha Ltd. | 21,000 | | $ 523,224 |
USS Co. Ltd. | 4,950 | | 520,237 |
TOTAL JAPAN | | 24,012,276 |
Netherlands - 2.9% |
ING Groep NV (Certificaten Van Aandelen) (a) | 185,100 | | 1,647,045 |
Koninklijke Philips Electronics NV | 44,813 | | 1,122,389 |
Unilever NV (Certificaten Van Aandelen) (Bearer) (d) | 33,231 | | 1,221,393 |
TOTAL NETHERLANDS | | 3,990,827 |
Norway - 1.1% |
Orkla ASA (A Shares) | 62,718 | | 496,129 |
Telenor ASA | 55,400 | | 1,089,285 |
TOTAL NORWAY | | 1,585,414 |
Singapore - 2.5% |
Ascendas Real Estate Investment Trust | 370,000 | | 715,855 |
ComfortDelgro Corp. Ltd. | 322,000 | | 446,122 |
Singapore Telecommunications Ltd. | 319,000 | | 842,089 |
United Overseas Bank Ltd. | 95,480 | | 1,430,087 |
TOTAL SINGAPORE | | 3,434,153 |
Spain - 2.1% |
Banco Bilbao Vizcaya Argentaria SA sponsored ADR | 235,732 | | 1,956,576 |
Repsol YPF SA | 51,674 | | 1,032,789 |
TOTAL SPAIN | | 2,989,365 |
Sweden - 1.0% |
Svenska Handelsbanken AB (A Shares) | 39,700 | | 1,359,864 |
Switzerland - 9.8% |
Nestle SA | 40,121 | | 2,546,066 |
Roche Holding AG (participation certificate) | 21,838 | | 4,199,706 |
Swisscom AG | 2,015 | | 837,113 |
Syngenta AG (Switzerland) | 3,805 | | 1,483,530 |
UBS AG (NY Shares) | 170,471 | | 2,560,474 |
Zurich Financial Services AG | 8,244 | | 2,031,567 |
TOTAL SWITZERLAND | | 13,658,456 |
United Kingdom - 26.3% |
Barclays PLC | 497,760 | | 1,840,585 |
BHP Billiton PLC | 81,621 | | 2,616,056 |
BP PLC sponsored ADR | 51,735 | | 2,218,914 |
British American Tobacco PLC (United Kingdom) | 20,547 | | 1,019,123 |
Common Stocks - continued |
| Shares | | Value |
United Kingdom - continued |
British Land Co. PLC | 103,823 | | $ 885,472 |
Bunzl PLC | 53,625 | | 887,008 |
Centrica PLC | 243,703 | | 1,274,607 |
Compass Group PLC | 114,100 | | 1,252,076 |
GlaxoSmithKline PLC sponsored ADR | 35,885 | | 1,611,237 |
HSBC Holdings PLC sponsored ADR | 74,201 | | 3,662,561 |
Imperial Tobacco Group PLC | 15,487 | | 584,816 |
Kingfisher PLC | 141,328 | | 660,257 |
Legal & General Group PLC | 561,996 | | 1,215,274 |
National Grid PLC | 167,609 | | 1,911,507 |
Next PLC | 11,500 | | 661,783 |
Prudential PLC | 82,740 | | 1,136,318 |
Reed Elsevier PLC | 129,874 | | 1,270,080 |
Royal Dutch Shell PLC Class A sponsored ADR | 92,447 | | 6,330,767 |
Scottish & Southern Energy PLC | 61,534 | | 1,437,871 |
Vodafone Group PLC sponsored ADR | 153,508 | | 4,178,488 |
TOTAL UNITED KINGDOM | | 36,654,800 |
United States of America - 0.7% |
Virgin Media, Inc. | 27,467 | | 902,454 |
TOTAL COMMON STOCKS (Cost $135,187,370) |
136,204,930
|
Nonconvertible Preferred Stocks - 1.3% |
| | | |
Germany - 1.3% |
ProSiebenSat.1 Media AG | 25,880 | | 721,204 |
Volkswagen AG | 5,327 | | 1,101,973 |
TOTAL NONCONVERTIBLE PREFERRED STOCKS (Cost $1,562,166) |
1,823,177
|
Money Market Funds - 1.2% |
| Shares | | Value |
Fidelity Cash Central Fund, 0.19% (b) | 918,421 | | $ 918,421 |
Fidelity Securities Lending Cash Central Fund, 0.19% (b)(c) | 752,220 | | 752,220 |
TOTAL MONEY MARKET FUNDS (Cost $1,670,641) |
1,670,641
|
TOTAL INVESTMENT PORTFOLIO - 100.2% (Cost $138,420,177) | 139,698,748 |
NET OTHER ASSETS (LIABILITIES) - (0.2)% | (220,612) |
NET ASSETS - 100% | $ 139,478,136 |
Legend |
(a) Non-income producing |
(b) Affiliated fund that is available only to investment companies and other accounts managed by Fidelity Investments. The rate quoted is the annualized seven-day yield of the fund at period end. A complete unaudited listing of the fund's holdings as of its most recent quarter end is available upon request. In addition, each Fidelity Central Fund's financial statements, which are not covered by the Fund's Report of Independent Registered Public Accounting Firm, are available on the SEC's website or upon request. |
(c) Investment made with cash collateral received from securities on loan. |
(d) Security or a portion of the security is on loan at period end. |
Affiliated Central Funds |
Information regarding fiscal year to date income earned by the Fund from investments in Fidelity Central Funds is as follows: |
Fund | Income earned |
Fidelity Cash Central Fund | $ 558 |
Fidelity Securities Lending Cash Central Fund | 188,349 |
Total | $ 188,907 |
Other Information |
Categorizations in the Schedule of Investments are based on country or territory of incorporation. |
The following is a summary of the inputs used, as of October 31, 2012, involving the Fund's assets and liabilities carried at fair value. The inputs or methodology used for valuing securities may not be an indication of the risk associated with investing in those securities. For more information on valuation inputs, and their aggregation into the levels used in the tables below, please refer to the Security Valuation section in the accompanying Notes to Financial Statements. |
Valuation Inputs at Reporting Date: |
Description | Total | Level 1 | Level 2 | Level 3 |
Investments in Securities: | | | | |
Equities: | | | | |
Consumer Discretionary | $ 11,762,790 | $ 9,931,938 | $ 1,830,852 | $ - |
Consumer Staples | 10,413,591 | 8,173,075 | 2,240,516 | - |
Energy | 15,441,424 | 12,024,301 | 3,417,123 | - |
Financials | 45,205,326 | 38,164,319 | 7,041,007 | - |
Health Care | 16,431,815 | 11,537,892 | 4,893,923 | - |
Industrials | 10,971,356 | 8,165,385 | 2,805,971 | - |
Information Technology | 1,890,741 | 1,890,741 | - | - |
Materials | 7,759,047 | 3,659,461 | 4,099,586 | - |
Telecommunication Services | 9,577,641 | 8,914,583 | 663,058 | - |
Utilities | 8,574,376 | 6,662,869 | 1,911,507 | - |
Money Market Funds | 1,670,641 | 1,670,641 | - | - |
Total Investments in Securities: | $ 139,698,748 | $ 110,795,205 | $ 28,903,543 | $ - |
The following is a summary of transfers between Level 1 and Level 2 for the period ended October 31, 2012. Transfers are assumed to have occurred at the beginning of the period, and are primarily attributable to the valuation techniques used for foreign equity securities, as discussed in the accompanying Notes to Financial Statements: |
Transfers | Total |
Level 1 to Level 2 | $ 0 |
Level 2 to Level 1 | $ 30,093,824 |
See accompanying notes which are an integral part of the financial statements.
Annual Report
Statement of Assets and Liabilities
| October 31, 2012 |
| | |
Assets | | |
Investment in securities, at value (including securities loaned of $730,981) - See accompanying schedule: Unaffiliated issuers (cost $136,749,536) | $ 138,028,107 | |
Fidelity Central Funds (cost $1,670,641) | 1,670,641 | |
Total Investments (cost $138,420,177) | | $ 139,698,748 |
Cash | | 25,252 |
Receivable for investments sold | | 490,430 |
Receivable for fund shares sold | | 141,722 |
Dividends receivable | | 555,670 |
Distributions receivable from Fidelity Central Funds | | 1,693 |
Other receivables | | 8,173 |
Total assets | | 140,921,688 |
| | |
Liabilities | | |
Payable to custodian bank | $ 1,519 | |
Payable for investments purchased | 329,190 | |
Payable for fund shares redeemed | 173,709 | |
Accrued management fee | 85,006 | |
Distribution and service plan fees payable | 4,529 | |
Other affiliated payables | 33,818 | |
Other payables and accrued expenses | 63,561 | |
Collateral on securities loaned, at value | 752,220 | |
Total liabilities | | 1,443,552 |
| | |
Net Assets | | $ 139,478,136 |
Net Assets consist of: | | |
Paid in capital | | $ 258,984,945 |
Undistributed net investment income | | 3,836,975 |
Accumulated undistributed net realized gain (loss) on investments and foreign currency transactions | | (124,613,392) |
Net unrealized appreciation (depreciation) on investments and assets and liabilities in foreign currencies | | 1,269,608 |
Net Assets | | $ 139,478,136 |
See accompanying notes which are an integral part of the financial statements.
Annual Report
Statement of Assets and Liabilities - continued
| October 31, 2012 |
| | |
Calculation of Maximum Offering Price
Class A:
Net Asset Value and redemption price per share
($4,490,817 ÷ 607,664 shares) | | $ 7.39 |
| | |
Maximum offering price per share (100/94.25 of $7.39) | | $ 7.84 |
Class T:
Net Asset Value and redemption price per share ($2,692,907 ÷ 364,932 shares) | | $ 7.38 |
| | |
Maximum offering price per share (100/96.50 of $7.38) | | $ 7.65 |
Class B:
Net Asset Value and offering price per share ($691,141 ÷ 93,508 shares)A | | $ 7.39 |
| | |
Class C:
Net Asset Value and offering price per share ($2,248,556 ÷ 304,873 shares)A | | $ 7.38 |
| | |
International Value:
Net Asset Value, offering price and redemption price per share ($128,983,126 ÷ 17,438,274 shares) | | $ 7.40 |
| | |
Institutional Class:
Net Asset Value, offering price and redemption price per share ($371,589 ÷ 50,137 shares) | | $ 7.41 |
A Redemption price per share is equal to net asset value less any applicable contingent deferred sales charge.
See accompanying notes which are an integral part of the financial statements.
Annual Report
Financial Statements - continued
Statement of Operations
| Year ended October 31, 2012 |
| | |
Investment Income | | |
Dividends | | $ 6,445,326 |
Income from Fidelity Central Funds | | 188,907 |
Income before foreign taxes withheld | | 6,634,233 |
Less foreign taxes withheld | | (488,192) |
Total income | | 6,146,041 |
| | |
Expenses | | |
Management fee
Basic fee | $ 1,023,931 | |
Performance adjustment | (61,752) | |
Transfer agent fees | 355,462 | |
Distribution and service plan fees | 52,465 | |
Accounting and security lending fees | 76,123 | |
Custodian fees and expenses | 102,964 | |
Independent trustees' compensation | 963 | |
Registration fees | 72,448 | |
Audit | 63,728 | |
Legal | 772 | |
Miscellaneous | 1,645 | |
Total expenses before reductions | 1,688,749 | |
Expense reductions | (46,878) | 1,641,871 |
Net investment income (loss) | | 4,504,170 |
Realized and Unrealized Gain (Loss) Net realized gain (loss) on: | | |
Investment securities: | | |
Unaffiliated issuers | (6,001,087) | |
Foreign currency transactions | (21,483) | |
Total net realized gain (loss) | | (6,022,570) |
Change in net unrealized appreciation (depreciation) on: Investment securities | 12,847,185 | |
Assets and liabilities in foreign currencies | (19,483) | |
Total change in net unrealized appreciation (depreciation) | | 12,827,702 |
Net gain (loss) | | 6,805,132 |
Net increase (decrease) in net assets resulting from operations | | $ 11,309,302 |
See accompanying notes which are an integral part of the financial statements.
Annual Report
Statement of Changes in Net Assets
| Year ended
October 31,
2012 | Year ended
October 31,
2011 |
Increase (Decrease) in Net Assets | | |
Operations | | |
Net investment income (loss) | $ 4,504,170 | $ 5,953,007 |
Net realized gain (loss) | (6,022,570) | (31,214,422) |
Change in net unrealized appreciation (depreciation) | 12,827,702 | (382,882) |
Net increase (decrease) in net assets resulting
from operations | 11,309,302 | (25,644,297) |
Distributions to shareholders from net investment income | (5,463,877) | (4,441,935) |
Distributions to shareholders from net realized gain | - | (710,581) |
Total distributions | (5,463,877) | (5,152,516) |
Share transactions - net increase (decrease) | (27,953,937) | 18,454,243 |
Redemption fees | 2,109 | 3,151 |
Total increase (decrease) in net assets | (22,106,403) | (12,339,419) |
| | |
Net Assets | | |
Beginning of period | 161,584,539 | 173,923,958 |
End of period (including undistributed net investment income of $3,836,975 and undistributed net investment income of $4,796,682, respectively) | $ 139,478,136 | $ 161,584,539 |
See accompanying notes which are an integral part of the financial statements.
Annual Report
Financial Highlights - Class A
Years ended October 31, | 2012 | 2011 | 2010 | 2009 | 2008 |
Selected Per-Share Data | | | | | |
Net asset value, beginning of period | $ 7.02 | $ 8.22 | $ 7.75 | $ 5.93 | $ 13.02 |
Income from Investment Operations | | | | | |
Net investment income (loss) C | .20 | .22 | .15 | .12 | .21 |
Net realized and unrealized gain (loss) | .39 | (1.19) | .44 | 1.78 | (6.53) |
Total from investment operations | .59 | (.97) | .59 | 1.90 | (6.32) |
Distributions from net investment income | (.22) | (.19) | (.11) | (.08) | (.15) |
Distributions from net realized gain | - | (.03) | (.01) | - | (.62) |
Total distributions | (.22) | (.23) H | (.12) | (.08) | (.77) |
Redemption fees added to paid in capital C,G | - | - | - | - | - |
Net asset value, end of period | $ 7.39 | $ 7.02 | $ 8.22 | $ 7.75 | $ 5.93 |
Total Return A,B | 8.82% | (12.19)% | 7.60% | 32.71% | (51.50)% |
Ratios to Average Net Assets D,F | | | | | |
Expenses before reductions | 1.44% | 1.36% | 1.40% | 1.34% | 1.42% |
Expenses net of fee waivers, if any | 1.44% | 1.36% | 1.40% | 1.34% | 1.42% |
Expenses net of all reductions | 1.41% | 1.34% | 1.38% | 1.32% | 1.41% |
Net investment income (loss) | 2.85% | 2.79% | 1.93% | 1.86% | 2.05% |
Supplemental Data | | | | | |
Net assets, end of period (000 omitted) | $ 4,491 | $ 4,668 | $ 4,699 | $ 4,456 | $ 2,854 |
Portfolio turnover rate E | 74% | 83% | 43% | 46% | 68% |
A Total returns would have been lower if certain expenses had not been reduced during the applicable periods shown.
B Total returns do not include the effect of the sales charges.
C Calculated based on average shares outstanding during the period.
D Fees and expenses of any underlying Fidelity Central Funds are not included in the Fund's expense ratio. The Fund indirectly bears its proportionate share of the expenses of any underlying Fidelity Central Funds.
E Amount does not include the portfolio activity of any underlying Fidelity Central Funds.
F Expense ratios reflect operating expenses of the class. Expenses before reductions do not reflect amounts reimbursed by the investment adviser or reductions from brokerage service arrangements or reductions from other expense offset arrangements and do not represent the amount paid by the class during periods when reimbursements or reductions occur. Expenses net of fee waivers reflect expenses after reimbursement by the investment adviser but prior to reductions from brokerage service arrangements or other expense offset arrangements. Expenses net of all reductions represent the net expenses paid by the class.
G Amount represents less than $.01 per share.
H Total distributions of $.23 per share is comprised of distributions from net investment income of $.191 and distributions from net realized gain of $.034 per share.
See accompanying notes which are an integral part of the financial statements.
Annual Report
Financial Highlights - Class T
Years ended October 31, | 2012 | 2011 | 2010 | 2009 | 2008 |
Selected Per-Share Data | | | | | |
Net asset value, beginning of period | $ 7.00 | $ 8.20 | $ 7.73 | $ 5.91 | $ 12.99 |
Income from Investment Operations | | | | | |
Net investment income (loss) C | .18 | .20 | .13 | .10 | .18 |
Net realized and unrealized gain (loss) | .40 | (1.19) | .44 | 1.77 | (6.50) |
Total from investment operations | .58 | (.99) | .57 | 1.87 | (6.32) |
Distributions from net investment income | (.20) | (.17) | (.09) | (.05) | (.14) |
Distributions from net realized gain | - | (.03) | (.01) | - | (.62) |
Total distributions | (.20) | (.21) H | (.10) | (.05) | (.76) |
Redemption fees added to paid in capital C,G | - | - | - | - | - |
Net asset value, end of period | $ 7.38 | $ 7.00 | $ 8.20 | $ 7.73 | $ 5.91 |
Total Return A,B | 8.60% | (12.42)% | 7.32% | 32.14% | (51.60)% |
Ratios to Average Net Assets D,F | | | | | |
Expenses before reductions | 1.71% | 1.63% | 1.67% | 1.60% | 1.67% |
Expenses net of fee waivers, if any | 1.70% | 1.62% | 1.67% | 1.60% | 1.67% |
Expenses net of all reductions | 1.67% | 1.60% | 1.65% | 1.59% | 1.66% |
Net investment income (loss) | 2.58% | 2.52% | 1.65% | 1.59% | 1.80% |
Supplemental Data | | | | | |
Net assets, end of period (000 omitted) | $ 2,693 | $ 2,468 | $ 2,276 | $ 2,395 | $ 2,087 |
Portfolio turnover rate E | 74% | 83% | 43% | 46% | 68% |
A Total returns would have been lower if certain expenses had not been reduced during the applicable periods shown.
B Total returns do not include the effect of the sales charges.
C Calculated based on average shares outstanding during the period.
D Fees and expenses of any underlying Fidelity Central Funds are not included in the Fund's expense ratio. The Fund indirectly bears its proportionate share of the expenses of any underlying Fidelity Central Funds.
E Amount does not include the portfolio activity of any underlying Fidelity Central Funds.
F Expense ratios reflect operating expenses of the class. Expenses before reductions do not reflect amounts reimbursed by the investment adviser or reductions from brokerage service arrangements or reductions from other expense offset arrangements and do not represent the amount paid by the class during periods when reimbursements or reductions occur. Expenses net of fee waivers reflect expenses after reimbursement by the investment adviser but prior to reductions from brokerage service arrangements or other expense offset arrangements. Expenses net of all reductions represent the net expenses paid by the class.
G Amount represents less than $.01 per share.
H Total distributions of $.21 per share is comprised of distributions from net investment income of $.173 and distributions from net realized gain of $.034 per share.
See accompanying notes which are an integral part of the financial statements.
Annual Report
Financial Highlights - Class B
Years ended October 31, | 2012 | 2011 | 2010 | 2009 | 2008 |
Selected Per-Share Data | | | | | |
Net asset value, beginning of period | $ 7.00 | $ 8.20 | $ 7.74 | $ 5.88 | $ 12.93 |
Income from Investment Operations | | | | | |
Net investment income (loss) C | .14 | .17 | .09 | .07 | .13 |
Net realized and unrealized gain (loss) | .41 | (1.20) | .44 | 1.79 | (6.48) |
Total from investment operations | .55 | (1.03) | .53 | 1.86 | (6.35) |
Distributions from net investment income | (.16) | (.13) | (.06) | - | (.08) |
Distributions from net realized gain | - | (.03) | (.01) | - | (.62) |
Total distributions | (.16) | (.17) H | (.07) | - | (.70) |
Redemption fees added to paid in capital C,G | - | - | - | - | - |
Net asset value, end of period | $ 7.39 | $ 7.00 | $ 8.20 | $ 7.74 | $ 5.88 |
Total Return A,B | 8.07% | (12.88)% | 6.82% | 31.63% | (51.85)% |
Ratios to Average Net Assets D,F | | | | | |
Expenses before reductions | 2.19% | 2.11% | 2.15% | 2.08% | 2.18% |
Expenses net of fee waivers, if any | 2.19% | 2.11% | 2.15% | 2.08% | 2.18% |
Expenses net of all reductions | 2.16% | 2.09% | 2.13% | 2.07% | 2.17% |
Net investment income (loss) | 2.09% | 2.04% | 1.18% | 1.11% | 1.29% |
Supplemental Data | | | | | |
Net assets, end of period (000 omitted) | $ 691 | $ 901 | $ 1,216 | $ 1,076 | $ 931 |
Portfolio turnover rate E | 74% | 83% | 43% | 46% | 68% |
A Total returns would have been lower if certain expenses had not been reduced during the applicable periods shown.
B Total returns do not include the effect of the contingent deferred sales charge.
C Calculated based on average shares outstanding during the period.
D Fees and expenses of any underlying Fidelity Central Funds are not included in the Fund's expense ratio. The Fund indirectly bears its proportionate share of the expenses of any underlying Fidelity Central Funds.
E Amount does not include the portfolio activity of any underlying Fidelity Central Funds.
F Expense ratios reflect operating expenses of the class. Expenses before reductions do not reflect amounts reimbursed by the investment adviser or reductions from brokerage service arrangements or reductions from other expense offset arrangements and do not represent the amount paid by the class during periods when reimbursements or reductions occur. Expenses net of fee waivers reflect expenses after reimbursement by the investment adviser but prior to reductions from brokerage service arrangements or other expense offset arrangements. Expenses net of all reductions represent the net expenses paid by the class.
G Amount represents less than $.01 per share.
H Total distributions of $.17 per share is comprised of distributions from net investment income of $.131 and distributions from net realized gain of $.034 per share.
See accompanying notes which are an integral part of the financial statements.
Annual Report
Financial Highlights - Class C
Years ended October 31, | 2012 | 2011 | 2010 | 2009 | 2008 |
Selected Per-Share Data | | | | | |
Net asset value, beginning of period | $ 7.00 | $ 8.20 | $ 7.73 | $ 5.88 | $ 12.92 |
Income from Investment Operations | | | | | |
Net investment income (loss) C | .14 | .16 | .09 | .07 | .13 |
Net realized and unrealized gain (loss) | .41 | (1.19) | .44 | 1.78 | (6.47) |
Total from investment operations | .55 | (1.03) | .53 | 1.85 | (6.34) |
Distributions from net investment income | (.17) | (.14) | (.05) | - | (.08) |
Distributions from net realized gain | - | (.03) | (.01) | - | (.62) |
Total distributions | (.17) | (.17) | (.06) | - | (.70) |
Redemption fees added to paid in capital C,G | - | - | - | - | - |
Net asset value, end of period | $ 7.38 | $ 7.00 | $ 8.20 | $ 7.73 | $ 5.88 |
Total Return A,B | 8.12% | (12.84)% | 6.84% | 31.46% | (51.80)% |
Ratios to Average Net Assets D,F | | | | | |
Expenses before reductions | 2.19% | 2.12% | 2.15% | 2.08% | 2.17% |
Expenses net of fee waivers, if any | 2.19% | 2.11% | 2.15% | 2.08% | 2.17% |
Expenses net of all reductions | 2.16% | 2.09% | 2.13% | 2.06% | 2.16% |
Net investment income (loss) | 2.09% | 2.04% | 1.18% | 1.12% | 1.30% |
Supplemental Data | | | | | |
Net assets, end of period (000 omitted) | $ 2,249 | $ 2,108 | $ 2,123 | $ 2,108 | $ 1,784 |
Portfolio turnover rate E | 74% | 83% | 43% | 46% | 68% |
A Total returns would have been lower if certain expenses had not been reduced during the applicable periods shown.
B Total returns do not include the effect of the contingent deferred sales charge.
C Calculated based on average shares outstanding during the period.
D Fees and expenses of any underlying Fidelity Central Funds are not included in the Fund's expense ratio. The Fund indirectly bears its proportionate share of the expenses of any underlying Fidelity Central Funds.
E Amount does not include the portfolio activity of any underlying Fidelity Central Funds.
F Expense ratios reflect operating expenses of the class. Expenses before reductions do not reflect amounts reimbursed by the investment adviser or reductions from brokerage service arrangements or reductions from other expense offset arrangements and do not represent the amount paid by the class during periods when reimbursements or reductions occur. Expenses net of fee waivers reflect expenses after reimbursement by the investment adviser but prior to reductions from brokerage service arrangements or other expense offset arrangements. Expenses net of all reductions represent the net expenses paid by the class.
G Amount represents less than $.01 per share.
See accompanying notes which are an integral part of the financial statements.
Annual Report
Financial Highlights - International Value
Years ended October 31, | 2012 | 2011 | 2010 | 2009 | 2008 |
Selected Per-Share Data | | | | | |
Net asset value, beginning of period | $ 7.03 | $ 8.23 | $ 7.75 | $ 5.95 | $ 13.06 |
Income from Investment Operations | | | | | |
Net investment income (loss) B | .22 | .25 | .17 | .13 | .24 |
Net realized and unrealized gain (loss) | .40 | (1.20) | .44 | 1.78 | (6.54) |
Total from investment operations | .62 | (.95) | .61 | 1.91 | (6.30) |
Distributions from net investment income | (.25) | (.22) | (.13) | (.11) | (.19) |
Distributions from net realized gain | - | (.03) | (.01) | - | (.62) |
Total distributions | (.25) | (.25) | (.13) G | (.11) | (.81) |
Redemption fees added to paid in capital B,F | - | - | - | - | - |
Net asset value, end of period | $ 7.40 | $ 7.03 | $ 8.23 | $ 7.75 | $ 5.95 |
Total Return A | 9.19% | (11.91)% | 7.95% | 33.09% | (51.34)% |
Ratios to Average Net Assets C,E | | | | | |
Expenses before reductions | 1.13% | 1.04% | 1.09% | 1.07% | 1.10% |
Expenses net of fee waivers, if any | 1.13% | 1.03% | 1.09% | 1.07% | 1.10% |
Expenses net of all reductions | 1.10% | 1.01% | 1.08% | 1.06% | 1.09% |
Net investment income (loss) | 3.16% | 3.11% | 2.23% | 2.12% | 2.37% |
Supplemental Data | | | | | |
Net assets, end of period (000 omitted) | $ 128,983 | $ 150,967 | $ 163,090 | $ 180,447 | $ 160,777 |
Portfolio turnover rate D | 74% | 83% | 43% | 46% | 68% |
A Total returns would have been lower if certain expenses had not been reduced during the applicable periods shown.
B Calculated based on average shares outstanding during the period.
C Fees and expenses of any underlying Fidelity Central Funds are not included in the Fund's expense ratio. The Fund indirectly bears its proportionate share of the expenses of any underlying Fidelity Central Funds.
D Amount does not include the portfolio activity of any underlying Fidelity Central Funds.
E Expense ratios reflect operating expenses of the class. Expenses before reductions do not reflect amounts reimbursed by the investment adviser or reductions from brokerage service arrangements or reductions from other expense offset arrangements and do not represent the amount paid by the class during periods when reimbursements or reductions occur. Expenses net of fee waivers reflect expenses after reimbursement by the investment adviser but prior to reductions from brokerage service arrangements or other expense offset arrangements. Expenses net of all reductions represent the net expenses paid by the class.
F Amount represents less than $.01 per share.
G Total distributions of $.13 per share is comprised of distributions from net investment income of $.129 and distributions from net realized gain of $.005 per share.
See accompanying notes which are an integral part of the financial statements.
Annual Report
Financial Highlights - Institutional Class
Years ended October 31, | 2012 | 2011 | 2010 | 2009 | 2008 |
Selected Per-Share Data | | | | | |
Net asset value, beginning of period | $ 7.04 | $ 8.24 | $ 7.76 | $ 5.96 | $ 13.07 |
Income from Investment Operations | | | | | |
Net investment income (loss) B | .22 | .25 | .18 | .14 | .25 |
Net realized and unrealized gain (loss) | .40 | (1.19) | .44 | 1.78 | (6.54) |
Total from investment operations | .62 | (.94) | .62 | 1.92 | (6.29) |
Distributions from net investment income | (.25) | (.22) | (.14) | (.12) | (.20) |
Distributions from net realized gain | - | (.03) | (.01) | - | (.62) |
Total distributions | (.25) | (.26) H | (.14) G | (.12) | (.82) |
Redemption fees added to paid in capital B,F | - | - | - | - | - |
Net asset value, end of period | $ 7.41 | $ 7.04 | $ 8.24 | $ 7.76 | $ 5.96 |
Total Return A | 9.22% | (11.83)% | 8.05% | 33.06% | (51.27)% |
Ratios to Average Net Assets C,E | | | | | |
Expenses before reductions | 1.10% | .98% | .98% | .93% | 1.02% |
Expenses net of fee waivers, if any | 1.10% | .98% | .98% | .93% | 1.02% |
Expenses net of all reductions | 1.07% | .96% | .97% | .92% | 1.01% |
Net investment income (loss) | 3.18% | 3.17% | 2.34% | 2.26% | 2.45% |
Supplemental Data | | | | | |
Net assets, end of period (000 omitted) | $ 372 | $ 473 | $ 519 | $ 814 | $ 1,052 |
Portfolio turnover rate D | 74% | 83% | 43% | 46% | 68% |
A Total returns would have been lower if certain expenses had not been reduced during the applicable periods shown.
B Calculated based on average shares outstanding during the period.
C Fees and expenses of any underlying Fidelity Central Funds are not included in the Fund's expense ratio. The Fund indirectly bears its proportionate share of the expenses of any underlying Fidelity Central Funds.
D Amount does not include the portfolio activity of any underlying Fidelity Central Funds.
E Expense ratios reflect operating expenses of the class. Expenses before reductions do not reflect amounts reimbursed by the investment adviser or reductions from brokerage service arrangements or reductions from other expense offset arrangements and do not represent the amount paid by the class during periods when reimbursements or reductions occur. Expenses net of fee waivers reflect expenses after reimbursement by the investment adviser but prior to reductions from brokerage service arrangements or other expense offset arrangements. Expenses net of all reductions represent the net expenses paid by the class.
F Amount represents less than $.01 per share.
G Total distributions of $.14 per share is comprised of distributions from net investment income of $.137 and distributions from net realized gain of $.005 per share.
H Total distributions of $.26 per share is comprised of distributions from net investment income of $.221 and distributions from net realized gain of $.034 per share.
See accompanying notes which are an integral part of the financial statements.
Annual Report
Notes to Financial Statements
For the period ended October 31, 2012
1. Organization.
Fidelity® International Value Fund (the Fund) is a fund of Fidelity Investment Trust (the Trust) and is authorized to issue an unlimited number of shares. The Trust is registered under the Investment Company Act of 1940, as amended (the 1940 Act), as an open-end management investment company organized as a Massachusetts business trust. The Fund offers Class A, Class T, Class C, International Value and Institutional Class shares, each of which, along with Class B shares, has equal rights as to assets and voting privileges. Effective after the close of business on September 1, 2010, Class B shares were closed to new accounts and additional purchases, except for exchanges and reinvestments. Each class has exclusive voting rights with respect to matters that affect that class. Class B shares will automatically convert to Class A shares after a holding period of seven years from the initial date of purchase. Investment income, realized and unrealized capital gains and losses, the common expenses of the Fund, and certain fund-level expense reductions, if any, are allocated on a pro-rata basis to each class based on the relative net assets of each class to the total net assets of the Fund. Each class differs with respect to transfer agent and distribution and service plan fees incurred. Certain expense reductions may also differ by class.
2. Investments in Fidelity Central Funds.
The Fund invests in Fidelity Central Funds, which are open-end investment companies available only to other investment companies and accounts managed by Fidelity Management & Research Company (FMR) and its affiliates. The Fund's Schedule of Investments lists each of the Fidelity Central Funds held as of period end, if any, as an investment of the Fund, but does not include the underlying holdings of each Fidelity Central Fund. As an Investing Fund, the Fund indirectly bears its proportionate share of the expenses of the underlying Fidelity Central Funds.
The Money Market Central Funds seek preservation of capital and current income and are managed by Fidelity Investments Money Management, Inc. (FIMM), an affiliate of FMR.
A complete unaudited list of holdings for each Fidelity Central Fund is available upon request or at the Securities and Exchange Commission (the SEC) web site at www.sec.gov. In addition, the financial statements of the Fidelity Central Funds, which are not covered by the Fund's Report of Independent Registered Public Accounting Firm, are available on the SEC web site or upon request.
Annual Report
3. Significant Accounting Policies.
The financial statements have been prepared in conformity with accounting principles generally accepted in the United States of America (GAAP), which require management to make certain estimates and assumptions at the date of the financial statements. Actual results could differ from those estimates. Subsequent events, if any, through the date that the financial statements were issued have been evaluated in the preparation of the financial statements. The following summarizes the significant accounting policies of the Fund:
Security Valuation. Investments are valued as of 4:00 p.m. Eastern time on the last calendar day of the period. In accordance with valuation policies and procedures approved by the Board of Trustees (the Board), the Fund attempts to obtain prices from one or more third party pricing vendors or brokers to value its investments. When current market prices, quotations or rates are not readily available or reliable, securities will be fair valued in good faith by the FMR Fair Value Committee (the Committee), in accordance with procedures adopted by the Fund's Board. Factors used in determining fair value vary by security type and may include market or security specific events. The frequency with which these procedures are used cannot be predicted and they may be utilized to a significant extent. The Committee oversees the Fund's valuation policies and procedures and is responsible for approving and reporting to the Board all fair value determinations.
The Fund categorizes the inputs to valuation techniques used to value its investments into a disclosure hierarchy consisting of three levels as shown below:
Level 1 - quoted prices in active markets for identical investments
Level 2 - other significant observable inputs (including quoted prices for similar investments, interest rates, prepayment speeds, etc.)
Level 3 - unobservable inputs (including the Fund's own assumptions based on the best information available)
Valuation techniques used to value the Fund's investments by major category are as follows:
Equity securities, including restricted securities, for which market quotations are readily available, are valued at the last reported sale price or official closing price as reported by a third party pricing vendor on the primary market or exchange on which they are traded and are categorized as Level 1 in the hierarchy. In the event there were no sales during the day or closing prices are not available, securities are valued at the last quoted bid price or may be valued using the last available price and are generally categorized as
Annual Report
Notes to Financial Statements - continued
3. Significant Accounting Policies - continued
Security Valuation - continued
Level 2 in the hierarchy. For foreign equity securities, when significant market or security specific events arise, comparisons to the valuation of American Depositary Receipts (ADRs), futures contracts, Exchange-Traded Funds (ETFs) and certain indexes as well as quoted prices for similar securities are used and are categorized as Level 2 in the hierarchy. Utilizing these techniques may result in transfers between Level 1 and Level 2.
Investments in open-end mutual funds, including the Fidelity Central Funds, are valued at their closing net asset value (NAV) each business day and are categorized as Level 1 in the hierarchy.
Changes in valuation techniques may result in transfers in or out of an assigned level within the disclosure hierarchy. The aggregate value of investments by input level, as of October 31, 2012, including information on transfers between Levels 1 and 2, is included at the end of the Fund's Schedule of Investments.
Foreign Currency Translation. The Fund may use foreign currency contracts to facilitate transactions in foreign-denominated securities. Gains and losses from these transactions may arise from changes in the value of the foreign currency or if the counterparties do not perform under the contracts' terms.
Foreign-denominated assets, including investment securities, and liabilities are translated into U.S. dollars at the exchange rates at period end. Purchases and sales of investment securities, income and dividends received and expenses denominated in foreign currencies are translated into U.S. dollars at the exchange rate in effect on the transaction date.
The effects of exchange rate fluctuations on investments are included with the net realized and unrealized gain (loss) on investment securities. Other foreign currency transactions resulting in realized and unrealized gain (loss) are disclosed separately.
Investment Transactions and Income. For financial reporting purposes, the Fund's investment holdings and NAV include trades executed through the end of the last business day of the period. The NAV per share for processing shareholder transactions is calculated as of the close of business of the New York Stock Exchange (NYSE), normally 4:00 p.m. Eastern time and includes trades executed through the end of the prior business day. Gains and losses on securities sold are determined on the basis of identified cost and may include proceeds received from litigation. Dividend income is recorded on the ex-dividend date, except for certain dividends from foreign securities where the ex-dividend date may have passed, which are recorded as soon as the Fund is informed of the ex-dividend date. Non-cash dividends included in dividend income, if any, are
Annual Report
3. Significant Accounting Policies - continued
Investment Transactions and Income - continued
recorded at the fair market value of the securities received. Interest income and distributions from the Fidelity Central Funds are accrued as earned. Investment income is recorded net of foreign taxes withheld where recovery of such taxes is uncertain.
Expenses. Expenses directly attributable to a fund are charged to that fund. Expenses attributable to more than one fund are allocated among the respective funds on the basis of relative net assets or other appropriate methods. Expense estimates are accrued in the period to which they relate and adjustments are made when actual amounts are known.
Income Tax Information and Distributions to Shareholders. Each year, the Fund intends to qualify as a regulated investment company under Subchapter M of the Internal Revenue Code, including distributing substantially all of its taxable income and realized gains. As a result, no provision for income taxes is required. As of October 31, 2012, the Fund did not have any unrecognized tax benefits in the financial statements; nor is the Fund aware of any tax positions for which it is reasonably possible that the total amounts of unrecognized tax benefits will significantly change in the next twelve months. The Fund files a U.S. federal tax return, in addition to state and local tax returns as required. A fund's federal income tax returns are subject to examination by the Internal Revenue Service (IRS) for a period of three fiscal years after they are filed. State and local tax returns may be subject to examination for an additional fiscal year depending on the jurisdiction. Foreign taxes are provided for based on the Fund's understanding of the tax rules and rates that exist in the foreign markets in which it invests.
Distributions are declared and recorded on the ex-dividend date. Income dividends and capital gain distributions are declared separately for each class. Income and capital gain distributions are determined in accordance with income tax regulations, which may differ from GAAP.
Capital accounts within the financial statements are adjusted for permanent book-tax differences. These adjustments have no impact on net assets or the results of operations. Temporary book-tax differences will reverse in a subsequent period.
Book-tax differences are primarily due to foreign currency transactions, passive foreign investment companies (PFIC), capital loss carryforwards and losses deferred due to wash sales.
Annual Report
Notes to Financial Statements - continued
3. Significant Accounting Policies - continued
Income Tax Information and Distributions to Shareholders - continued
The federal tax cost of investment securities and unrealized appreciation (depreciation) as of period end were as follows:
Gross unrealized appreciation | $ 11,923,750 |
Gross unrealized depreciation | (12,677,916) |
Net unrealized appreciation (depreciation) on securities and other investments | $ (754,166) |
| |
Tax Cost | $ 140,452,914 |
The tax-based components of distributable earnings as of period end were as follows:
Undistributed ordinary income | $ 4,576,774 |
Capital loss carryforward | $ (123,320,454) |
Net unrealized appreciation (depreciation) | $ (763,129) |
Capital loss carryforwards are only available to offset future capital gains of the Fund to the extent provided by regulations and may be limited. Under the Regulated Investment Company Modernization Act of 2010 (the Act), the Fund is permitted to carry forward capital losses incurred in taxable years beginning after December 22, 2010 for an unlimited period and such capital losses are required to be used prior to any losses that expire. Capital loss carryforwards were as follows:
Fiscal year of expiration | |
2016 | $ (17,089,067) |
2017 | (65,376,972) |
2018 | (3,571,319) |
2019 | (31,368,797) |
Total with expiration | (117,406,155) |
No expiration | |
Long-term | (5,914,299) |
Total capital loss carryforward | $ (123,320,454) |
The tax character of distributions paid was as follows:
| October 31, 2012 | October 31, 2011 |
Ordinary Income | $ 5,463,877 | $ 5,152,516 |
Annual Report
3. Significant Accounting Policies - continued
Short-Term Trading (Redemption) Fees. Shares held by investors in the Fund less than 30 days are subject to a redemption fee equal to 1.00% of the net asset value of shares redeemed. All redemption fees, which reduce the proceeds of the shareholder redemption, are retained by the Fund and accounted for as an addition to paid in capital.
New Accounting Pronouncement. In December 2011, the Financial Accounting Standards Board issued Accounting Standard Update No. 2011-11, Disclosures about Offsetting Assets and Liabilities. The update creates new disclosure requirements requiring entities to disclose both gross and net information for derivatives and other financial instruments that are either offset in the Statement of Assets and Liabilities or subject to an enforceable master netting arrangement or similar agreement. The disclosure requirements are effective for annual reporting periods beginning on or after January 1, 2013, and interim periods within those annual periods. Management is currently evaluating the impact of the update's adoption on the Fund's financial statement disclosures.
4. Purchases and Sales of Investments.
Purchases and sales of securities, other than short-term securities, aggregated $107,516,996 and $136,721,066, respectively.
5. Fees and Other Transactions with Affiliates.
Management Fee. FMR and its affiliates provide the Fund with investment management related services for which the Fund pays a monthly management fee. The management fee is the sum of an individual fund fee rate that is based on an annual rate of .45% of the Fund's average net assets and an annualized group fee rate that averaged .26% during the period. The group fee rate is based upon the average net assets of all the mutual funds advised by FMR. The group fee rate decreases as assets under management increase and increases as assets under management decrease. In addition, the management fee is subject to a performance adjustment (up to a maximum of ± .20% of the Fund's average net assets over a 36 month performance period). The upward or downward adjustment to the management fee is based on the relative investment performance of International Value as compared to an appropriate benchmark index. For the period, the total annual management fee rate, including the performance adjustment, was .67% of the Fund's average net assets.
Annual Report
Notes to Financial Statements - continued
5. Fees and Other Transactions with Affiliates - continued
Distribution and Service Plan Fees. In accordance with Rule 12b-1 of the 1940 Act, the Fund has adopted separate Distribution and Service Plans for each class of shares. Certain classes pay Fidelity Distributors Corporation (FDC), an affiliate of FMR, separate Distribution and Service Fees, each of which is based on an annual percentage of each class' average net assets. In addition, FDC may pay financial intermediaries for selling shares of the Fund and providing shareholder support services. For the period, the Distribution and Service Fee rates, total fees and amounts retained by FDC were as follows:
| Distribution
Fee | Service
Fee | Total Fees | Retained
by FDC |
Class A | -% | .25% | $ 11,016 | $ 291 |
Class T | .25% | .25% | 12,196 | 22 |
Class B | .75% | .25% | 8,001 | 6,009 |
Class C | .75% | .25% | 21,252 | 5,108 |
| | | $ 52,465 | $ 11,430 |
Sales Load. FDC may receive a front-end sales charge of up to 5.75% for selling Class A shares and 3.50% for selling Class T shares, some of which is paid to financial intermediaries for selling shares of the Fund. Depending on the holding period, FDC may receive contingent deferred sales charges levied on Class A, Class T, Class B, and Class C redemptions. The deferred sales charges range from 5.00% to 1.00% for Class B shares, 1.00% for Class C shares, 1.00% for certain purchases of Class A shares and .25% for certain purchases of Class T shares.
For the period, sales charge amounts retained by FDC were as follows:
| Retained
by FDC |
Class A | $ 1,851 |
Class T | 589 |
Class B* | 4,309 |
Class C* | 943 |
| $ 7,692 |
* When Class B and Class C shares are initially sold, FDC pays commissions from its own resources to financial intermediaries through which the sales are made.
Annual Report
5. Fees and Other Transactions with Affiliates - continued
Transfer Agent Fees. Fidelity Investments Institutional Operations Company, Inc. (FIIOC), an affiliate of FMR, is the transfer, dividend disbursing and shareholder servicing agent for each class of the Fund. FIIOC receives account fees and asset-based fees that vary according to the account size and type of account of the shareholders of the respective classes of the Fund. FIIOC pays for typesetting, printing and mailing of shareholder reports, except proxy statements. For the period, transfer agent fees for each class were as follows:
| Amount | % of
Average
Net Assets |
Class A | $ 13,342 | .30 |
Class T | 7,912 | .32 |
Class B | 2,419 | .30 |
Class C | 6,455 | .30 |
International Value | 324,523 | .24 |
Institutional Class | 811 | .21 |
| $ 355,462 | |
Accounting and Security Lending Fees. Fidelity Service Company, Inc. (FSC), an affiliate of FMR, maintains the Fund's accounting records. The accounting fee is based on the level of average net assets for each month. Under a separate contract, FSC administers the security lending program. The security lending fee is based on the number and duration of lending transactions.
Brokerage Commissions. The Fund placed a portion of its portfolio transactions with brokerage firms which are affiliates of the investment adviser. The commissions paid to these affiliated firms were $129 for the period.
6. Committed Line of Credit.
The Fund participates with other funds managed by FMR or an affiliate in a $4.25 billion credit facility (the "line of credit") to be utilized for temporary or emergency purposes to fund shareholder redemptions or for other short-term liquidity purposes. The Fund has agreed to pay commitment fees on its pro-rata portion of the line of credit, which amounted to $405 and is reflected in Miscellaneous expenses on the Statement of Operations. During the period, there were no borrowings on this line of credit.
Annual Report
Notes to Financial Statements - continued
7. Security Lending.
The Fund lends portfolio securities through a lending agent from time to time in order to earn additional income. For equity securities, a lending agent is used and may loan securities to certain qualified borrowers, including Fidelity Capital Markets (FCM), a broker-dealer affiliated with the Fund. On the settlement date of the loan, the Fund receives collateral (in the form of U.S. Treasury obligations, letters of credit and/or cash) against the loaned securities and maintains collateral in an amount not less than 100% of the market value of the loaned securities during the period of the loan. The market value of the loaned securities is determined at the close of business of the Fund and any additional required collateral is delivered to the Fund on the next business day. If the borrower defaults on its obligation to return the securities loaned because of insolvency or other reasons, a fund could experience delays and costs in recovering the securities loaned or in gaining access to the collateral. Any cash collateral received is invested in the Fidelity Securities Lending Cash Central Fund. The value of loaned securities and cash collateral at period end are disclosed on the Fund's Statement of Assets and Liabilities. At period end, there were no security loans outstanding with FCM. Security lending income represents the income earned on investing cash collateral, less rebates paid to borrowers and any lending agent fees associated with the loan, plus any premium payments received for lending certain types of securities. Security lending income is presented in the Statement of Operations as a component of income from Fidelity Central Funds. Total security lending income during the period amounted to $188,349, including $5 from securities loaned to FCM.
8. Expense Reductions.
FMR voluntarily agreed to reimburse each class to the extent annual operating expenses exceeded certain levels of average net assets as noted in the table below. Some expenses, for example interest expense, including commitment fees, are excluded from this reimbursement.
The following classes were in reimbursement during the period:
| Expense
Limitations | Reimbursement
from adviser |
Class T | 1.70% | $ 243 |
Many of the brokers with whom FMR places trades on behalf of the Fund provided services to the Fund in addition to trade execution. These services included payments of certain expenses on behalf of the Fund totaling $46,635 for the period.
Annual Report
9. Distributions to Shareholders.
Distributions to shareholders of each class were as follows:
Years ended October 31, | 2012 | 2011 |
From net investment income | | |
Class A | $ 143,989 | $ 109,917 |
Class T | 67,838 | 48,265 |
Class B | 19,758 | 18,831 |
Class C | 50,970 | 34,950 |
International Value | 5,163,324 | 4,218,039 |
Institutional Class | 17,998 | 11,933 |
Total | $ 5,463,877 | $ 4,441,935 |
From net realized gain | | |
Class A | $ - | $ 19,461 |
Class T | - | 9,435 |
Class B | - | 4,893 |
Class C | - | 8,796 |
International Value | - | 666,153 |
Institutional Class | - | 1,843 |
Total | $ - | $ 710,581 |
10. Share Transactions.
Transactions for each class of shares were as follows:
| Shares | Dollars |
Years ended October 31, | 2012 | 2011 | 2012 | 2011 |
Class A | | | | |
Shares sold | 186,877 | 297,051 | $ 1,294,428 | $ 2,472,449 |
Reinvestment of distributions | 19,578 | 14,168 | 128,823 | 113,424 |
Shares redeemed | (263,913) | (217,894) | (1,814,670) | (1,776,674) |
Net increase (decrease) | (57,458) | 93,325 | $ (391,419) | $ 809,199 |
Class T | | | | |
Shares sold | 87,833 | 184,684 | $ 599,355 | $ 1,564,957 |
Reinvestment of distributions | 10,069 | 7,104 | 66,355 | 56,884 |
Shares redeemed | (85,446) | (116,856) | (585,214) | (949,653) |
Net increase (decrease) | 12,456 | 74,932 | $ 80,496 | $ 672,188 |
Class B | | | | |
Shares sold | 2,850 | 10,615 | $ 19,157 | $ 84,177 |
Reinvestment of distributions | 2,474 | 2,474 | 16,400 | 19,918 |
Shares redeemed | (40,532) | (32,689) | (279,913) | (270,345) |
Net increase (decrease) | (35,208) | (19,600) | $ (244,356) | $ (166,250) |
Annual Report
Notes to Financial Statements - continued
10. Share Transactions - continued
| Shares | Dollars |
Years ended October 31, | 2012 | 2011 | 2012 | 2011 |
Class C | | | | |
Shares sold | 72,761 | 94,118 | $ 498,768 | $ 764,274 |
Reinvestment of distributions | 6,699 | 4,468 | 44,283 | 35,965 |
Shares redeemed | (75,717) | (56,323) | (522,498) | (453,389) |
Net increase (decrease) | 3,743 | 42,263 | $ 20,553 | $ 346,850 |
International Value | | | | |
Shares sold | 2,278,492 | 9,000,450 | $ 15,694,819 | $ 76,813,955 |
Reinvestment of distributions | 762,294 | 587,427 | 5,008,269 | 4,695,920 |
Shares redeemed | (7,089,505) | (7,927,908) | (48,008,194) | (64,758,392) |
Net increase (decrease) | (4,048,719) | 1,659,969 | $ (27,305,106) | $ 16,751,483 |
Institutional Class | | | | |
Shares sold | 18,483 | 19,868 | $ 132,098 | $ 168,608 |
Reinvestment of distributions | 1,234 | 395 | 8,117 | 3,160 |
Shares redeemed | (36,776) | (16,071) | (254,320) | (130,995) |
Net increase (decrease) | (17,059) | 4,192 | $ (114,105) | $ 40,773 |
11. Other.
The Fund's organizational documents provide former and current trustees and officers with a limited indemnification against liabilities arising in connection with the performance of their duties to the Fund. In the normal course of business, the Fund may also enter into contracts that provide general indemnifications. The Fund's maximum exposure under these arrangements is unknown as this would be dependent on future claims that may be made against the Fund. The risk of material loss from such claims is considered remote.
At the end of the period, Strategic Advisers International II Fund and VIP FundsManager 60% Portfolio were owners of record of approximately 21% and 16%, respectively, of the total outstanding shares of the Fund.
Mutual funds managed by FMR or its affiliates were owners of record, in the aggregate, of approximately 38% of the total outstanding shares of the Fund.
Annual Report
To the Trustees of Fidelity Investment Trust and Shareholders of Fidelity International Value Fund:
We have audited the accompanying statement of assets and liabilities of Fidelity International Value Fund (the Fund), a fund of Fidelity Investment Trust, including the schedule of investments, as of October 31, 2012, and the related statement of operations for the year then ended, the statement of changes in net assets for each of the two years in the period then ended, and the financial highlights for each of the five years in the period then ended. These financial statements and financial highlights are the responsibility of the Fund's management. Our responsibility is to express an opinion on these financial statements and financial highlights based on our audits.
We conducted our audits in accordance with the standards of the Public Company Accounting Oversight Board (United States). Those standards require that we plan and perform the audit to obtain reasonable assurance about whether the financial statements and financial highlights are free of material misstatement. The Fund is not required to have, nor were we engaged to perform, an audit of its internal control over financial reporting. Our audits included consideration of internal control over financial reporting as a basis for designing audit procedures that are appropriate in the circumstances, but not for the purpose of expressing an opinion on the effectiveness of the Fund's internal control over financial reporting. Accordingly, we express no such opinion. An audit also includes examining, on a test basis, evidence supporting the amounts and disclosures in the financial statements, assessing the accounting principles used and significant estimates made by management, as well as evaluating the overall financial statement presentation. Our procedures included confirmation of securities owned as of October 31, 2012, by correspondence with the custodians and brokers; where replies were not received from brokers, we performed other auditing procedures. We believe that our audits provide a reasonable basis for our opinion.
In our opinion, the financial statements and financial highlights referred to above present fairly, in all material respects, the financial position of Fidelity International Value Fund as of October 31, 2012, the results of its operations for the year then ended, the changes in its net assets for each of the two years in the period then ended, and the financial highlights for each of the five years in the period then ended, in conformity with accounting principles generally accepted in the United States of America.
DELOITTE & TOUCHE LLP
Boston, Massachusetts
December 14, 2012
Annual Report
The Trustees, Members of the Advisory Board, and executive officers of the trust and fund, as applicable, are listed below. The Board of Trustees governs the fund and is responsible for protecting the interests of shareholders. The Trustees are experienced executives who meet periodically throughout the year to oversee the fund's activities, review contractual arrangements with companies that provide services to the fund, oversee management of the risks associated with such activities and contractual arrangements, and review the fund's performance. Except for James C. Curvey, each of the Trustees oversees 236 funds advised by FMR or an affiliate. Mr. Curvey oversees 443 funds advised by FMR or an affiliate.
The Trustees hold office without limit in time except that (a) any Trustee may resign; (b) any Trustee may be removed by written instrument, signed by at least two-thirds of the number of Trustees prior to such removal; (c) any Trustee who requests to be retired or who has become incapacitated by illness or injury may be retired by written instrument signed by a majority of the other Trustees; and (d) any Trustee may be removed at any special meeting of shareholders by a two-thirds vote of the outstanding voting securities of the trust. Each Trustee who is not an interested person (as defined in the 1940 Act) (Independent Trustee), shall retire not later than the last day of the calendar year in which his or her 75th birthday occurs. The Independent Trustees may waive this mandatory retirement age policy with respect to individual Trustees. The executive officers and Advisory Board Members hold office without limit in time, except that any officer and Advisory Board Member may resign or may be removed by a vote of a majority of the Trustees at any regular meeting or any special meeting of the Trustees. Except as indicated, each individual has held the office shown or other offices in the same company for the past five years.
Experience, Skills, Attributes, and Qualifications of the Fund's Trustees. The Governance and Nominating Committee has adopted a statement of policy that describes the experience, qualifications, attributes, and skills that are necessary and desirable for potential Independent Trustee candidates (Statement of Policy). The Board believes that each Trustee satisfied at the time he or she was initially elected or appointed a Trustee, and continues to satisfy, the standards contemplated by the Statement of Policy. The Governance and Nominating Committee also engages professional search firms to help identify potential Independent Trustee candidates who have the experience, qualifications, attributes, and skills consistent with the Statement of Policy. From time to time, additional criteria based on the composition and skills of the current Independent Trustees, as well as experience or skills that may be appropriate in light of future changes to board composition, business conditions, and regulatory or other developments, have also been considered by the professional search firms and the Governance and Nominating Committee. In addition, the Board takes into account the Trustees' commitment and participation in Board and committee meetings, as well as their leadership of standing and ad hoc committees throughout their tenure.
In determining that a particular Trustee was and continues to be qualified to serve as a Trustee, the Board has considered a variety of criteria, none of which, in isolation, was controlling. The Board believes that, collectively, the Trustees have balanced and diverse experience, qualifications, attributes, and skills, which allow the Board to operate effectively in governing the fund and protecting the interests of shareholders. Information about the specific experience, skills, attributes, and qualifications of each Trustee, which in each case led to the Board's conclusion that the Trustee should serve (or continue to serve) as a trustee of the fund, is provided below.
Annual Report
Trustees and Officers - continued
Board Structure and Oversight Function. James C. Curvey is an interested person (as defined in the 1940 Act) and currently serves as Chairman. The Trustees have determined that an interested Chairman is appropriate and benefits shareholders because an interested Chairman has a personal and professional stake in the quality and continuity of services provided to the fund. Independent Trustees exercise their informed business judgment to appoint an individual of their choosing to serve as Chairman, regardless of whether the Trustee happens to be independent or a member of management. The Independent Trustees have determined that they can act independently and effectively without having an Independent Trustee serve as Chairman and that a key structural component for assuring that they are in a position to do so is for the Independent Trustees to constitute a substantial majority for the Board. The Independent Trustees also regularly meet in executive session. Ned C. Lautenbach serves as Chairman of the Independent Trustees and as such (i) acts as a liaison between the Independent Trustees and management with respect to matters important to the Independent Trustees and (ii) with management prepares agendas for Board meetings.
Fidelity funds are overseen by different Boards of Trustees. The fund's Board oversees Fidelity's equity and high income funds and another Board oversees Fidelity's investment-grade bond, money market, and asset allocation funds. The asset allocation funds may invest in Fidelity funds overseen by the fund's Board. The use of separate Boards, each with its own committee structure, allows the Trustees of each group of Fidelity funds to focus on the unique issues of the funds they oversee, including common research, investment, and operational issues. On occasion, the separate Boards establish joint committees to address issues of overlapping consequences for the Fidelity funds overseen by each Board.
The Trustees operate using a system of committees to facilitate the timely and efficient consideration of all matters of importance to the Trustees, the fund, and fund shareholders and to facilitate compliance with legal and regulatory requirements and oversight of the fund's activities and associated risks. The Board, acting through its committees, has charged FMR and its affiliates with (i) identifying events or circumstances the occurrence of which could have demonstrably adverse effects on the fund's business and/or reputation; (ii) implementing processes and controls to lessen the possibility that such events or circumstances occur or to mitigate the effects of such events or circumstances if they do occur; and (iii) creating and maintaining a system designed to evaluate continuously business and market conditions in order to facilitate the identification and implementation processes described in (i) and (ii) above. Because the day-to-day operations and activities of the fund are carried out by or through FMR, its affiliates and other service providers, the fund's exposure to risks is mitigated but not eliminated by the processes overseen by the Trustees. While each of the Board's committees has responsibility for overseeing different aspects of the fund's activities, oversight is exercised primarily through the Operations, Audit, and Compliance Committees. In addition, the Independent Trustees have worked with FMR to enhance the Board's oversight of investment and financial risks, legal and regulatory risks, technology risks, and operational risks, including the development of additional risk reporting to the Board. For example, a working group comprised of Independent Trustees and FMR has worked and continues to work to review the Fidelity funds' valuation-related activities, reporting and risk management. Appropriate personnel, including but not limited to the fund's Chief Compliance Officer (CCO), FMR's internal auditor, the independent accountants, the fund's Treasurer and portfolio management personnel, make periodic reports to the Board's committees, as appropriate, including an annual review of FMR's risk management program for the Fidelity funds. The responsibilities of each standing committee, including their oversight responsibilities, are described further under "Standing Committees of the Fund's Trustees."
Annual Report
The fund's Statement of Additional Information (SAI) includes more information about the Trustees. To request a free copy, call Fidelity at 1-877-208-0098.
Interested Trustees*:
Correspondence intended for each Trustee who is an interested person may be sent to Fidelity Investments, 82 Devonshire Street, Boston, Massachusetts 02109.
Name, Age; Principal Occupations and Other Relevant Experience+ |
James C. Curvey (77) |
| Year of Election or Appointment: 2007 Mr. Curvey is Trustee and Chairman of the Board of Trustees of certain Trusts. Mr. Curvey also serves as Trustee (2007-present) of other investment companies advised by FMR. Mr. Curvey is a Director of Fidelity Investments Money Management, Inc. (2009-present), Director of Fidelity Research & Analysis Co. (2009-present) and Director of FMR and FMR Co., Inc. (2007-present). Mr. Curvey is also Vice Chairman (2007-present) and Director of FMR LLC. In addition, Mr. Curvey serves as an Overseer for the Boston Symphony Orchestra and a member of the Trustees of Villanova University. Previously, Mr. Curvey was the Vice Chairman (2006-2007) and Director (2000-2007) of FMR Corp. |
Ronald P. O'Hanley (55) |
| Year of Election or Appointment: 2011 Mr. O'Hanley is Director of FMR Co., Inc. (2010-present), Director of Fidelity Investments Money Management, Inc. (2010-present), Director of Fidelity Research & Analysis Company (2010-present), President of Fidelity Asset Management and Corporate Services and a member of Fidelity's Executive Committee (2010-present). Previously, Mr. O'Hanley served as President and Chief Executive Officer of BNY Mellon Asset Management (2007-2010). Mr. O'Hanley also served as Vice Chairman of Bank New York Mellon Corp. and a member of that firm's Executive Committee. Prior to the 2007 merger of The Bank of New York and Mellon Financial Corporation, he was Vice Chairman of Mellon Financial Corporation and President and Chief Executive Officer of Mellon Asset Management. He joined Mellon in February 1997. Mr. O'Hanley currently serves as Chairman of the Boston Public Library Foundation Board of Directors and sits on the Board of Directors of Beth Israel Deaconess Medical Center, the Board of Trustees of the Marine Biological Laboratory and the Advisory Board of the Maxwell School of Citizenship and Public Administration at Syracuse University. Mr. O'Hanley also chairs the Council on Asset Management for the Financial Services Roundtable and is a member of the Board of Directors of Institutional Investor's U.S. Institute. |
* Trustees have been determined to be "Interested Trustees" by virtue of, among other things, their affiliation with the trust or various entities under common control with FMR.
+ The information above includes each Trustee's principal occupation during the last five years and other information relating to the experience, attributes, and skills relevant to each Trustee's qualifications to serve as a Trustee, which led to the conclusion that each Trustee should serve as a Trustee for the fund.
Annual Report
Independent Trustees:
Correspondence intended for each Independent Trustee (that is, the Trustees other than the Interested Trustees) may be sent to Fidelity Investments, P.O. Box 55235, Boston, Massachusetts 02205-5235.
Name, Age; Principal Occupations and Other Relevant Experience+ |
Dennis J. Dirks (64) |
| Year of Election or Appointment: 2005 Prior to his retirement in May 2003, Mr. Dirks was Chief Operating Officer and a member of the Board of The Depository Trust & Clearing Corporation (DTCC). He also served as President, Chief Operating Officer, and Board member of The Depository Trust Company (DTC) and President and Board member of the National Securities Clearing Corporation (NSCC). In addition, Mr. Dirks served as Chief Executive Officer and Board member of the Government Securities Clearing Corporation, Chief Executive Officer and Board member of the Mortgage-Backed Securities Clearing Corporation, as a Trustee and a member of the Finance Committee of Manhattan College (2005-2008), and as a Trustee and a member of the Finance Committee of AHRC of Nassau County (2006-2008). Mr. Dirks is a member of the Independent Directors Council (IDC) Governing Council (2010-present) and Board of Directors for The Brookville Center for Children's Services, Inc. (2009-present). |
Alan J. Lacy (59) |
| Year of Election or Appointment: 2008 Mr. Lacy serves as Senior Adviser (2007-present) of Oak Hill Capital Partners, L.P. (private equity). Mr. Lacy also served as Chief Executive Officer (2000-2005) and Vice Chairman (2005-2006) of Sears Holdings Corporation and Sears, Roebuck and Co. (retail). In addition, Mr. Lacy serves as a member of the Board of Directors of Dave & Buster's Entertainment, Inc. (restaurant and entertainment complexes, 2010-present), Earth Fare, Inc. (retail grocery, 2012-present), The Hillman Companies, Inc. (hardware wholesalers, 2010-present), and Bristol-Myers Squibb Company (global pharmaceuticals, 2008-present). Mr. Lacy is a member of the Board of Trustees of The National Parks Conservation Association (2006-present). Previously, Mr. Lacy served as Chairman of the Board of Trustees of the National Parks Conservation Association (2008-2011) and as a member of the Board of Directors for the Western Union Company (global money transfer, 2006-2011). |
Ned C. Lautenbach (68) |
| Year of Election or Appointment: 2000 Mr. Lautenbach is Chairman of the Independent Trustees of the Equity and High Income Funds (2006-present). Mr. Lautenbach currently serves as the Lead Director of the Eaton Corporation Board of Directors (diversified industrial, 1997-present). Mr. Lautenbach is Chairman of the Board of Directors of the Philharmonic Center for the Arts in Naples, Florida (2012-present) and a member of the Council on Foreign Relations (1994-present). Previously, Mr. Lautenbach was a Partner/Advisory Partner at Clayton, Dubilier & Rice, LLC (private equity investment, 1998-2010), as well as a Director of Sony Corporation (2006-2007). |
Joseph Mauriello (68) |
| Year of Election or Appointment: 2008 Prior to his retirement in January 2006, Mr. Mauriello served in numerous senior management positions including Deputy Chairman and Chief Operating Officer (2004-2005), and Vice Chairman of Financial Services (2002-2004) of KPMG LLP US (professional services, 1965-2005). Mr. Mauriello currently serves as a member of the Board of Directors of XL Group plc. (global insurance and re-insurance, 2006-present). Previously, Mr. Mauriello served as a Director of the Hamilton Funds of the Bank of New York (2006-2007) and of Arcadia Resources Inc. (health care services and products, 2007-2012). |
Robert W. Selander (62) |
| Year of Election or Appointment: 2011 Previously, Mr. Selander served as a Member of the Advisory Board of Fidelity's Equity and High Income Funds (2011), Executive Vice Chairman (2010), Chief Executive Officer (2009-2010), and President and Chief Executive Officer (1997-2009) of Mastercard, Inc. |
Cornelia M. Small (68) |
| Year of Election or Appointment: 2005 Ms. Small is a member of the Board of Directors (2009-present) and Chair of the Investment Committee (2010-present) of the Teagle Foundation. Ms. Small also serves on the Investment Committee of the Berkshire Taconic Community Foundation (2008-present). Previously, Ms. Small served as Chairperson (2002-2008) and a member of the Investment Committee and Chairperson (2008-2012) and a member of the Board of Trustees of Smith College. In addition, Ms. Small served as Chief Investment Officer, Director of Global Equity Investments, and a member of the Board of Directors of Scudder, Stevens & Clark and Scudder Kemper Investments. |
William S. Stavropoulos (73) |
| Year of Election or Appointment: 2001 Mr. Stavropoulos is Vice Chairman of the Independent Trustees of the Equity and High Income Funds (2006-present). Mr. Stavropoulos serves as President and Founder of the Michigan Baseball Foundation, the Great Lakes Loons (2007-present). Mr. Stavropoulos is Chairman Emeritus of the Board of Directors of The Dow Chemical Company, where he previously served in numerous senior management positions, including President, CEO (1995-2000; 2002-2004), Chairman of the Executive Committee (2000-2006), and as a member of the Board of Directors (1990-2006). Currently, Mr. Stavropoulos is a Director of Univar Inc. (global distributor of commodity and specialty chemicals, Chairman from 2010-May 2012 and Lead Director from May 2012-present), Teradata Corporation (data warehousing and technology solutions, 2008-present), Maersk Inc. (industrial conglomerate), and Tyco International, Ltd. (multinational manufacturing and services, 2007-present), and a member of the Advisory Board for Metalmark Capital LLC (private equity investment, 2005-present). Mr. Stavropoulos is an operating advisor to Clayton, Dubilier & Rice, LLC (private equity investment). In addition, Mr. Stavropoulos is a member of the University of Notre Dame Advisory Council for the College of Science, a Trustee of the Rollin L. Gerstacker Foundation, and a Director of the Naples Philharmonic Center for the Arts. Previously, Mr. Stavropoulos served as a Director of Chemical Financial Corporation (bank holding company, 1993-2012). |
David M. Thomas (63) |
| Year of Election or Appointment: 2008 Previously, Mr. Thomas served as Executive Chairman (2005-2006) and Chairman and Chief Executive Officer (2000-2005) of IMS Health, Inc. (pharmaceutical and healthcare information solutions), and a Director of Fortune Brands, Inc. (consumer products, 2000-2011). In addition, Mr. Thomas serves as Non-Executive Chairman of the Board of Directors of Fortune Brands Home and Security (home and security products, 2011-present), and as a member of the Board of Directors of Interpublic Group of Companies, Inc. (marketing communication, 2004-present). |
Michael E. Wiley (62) |
| Year of Election or Appointment: 2008 Mr. Wiley also serves as a Director of Asia Pacific Exploration Consolidated (international oil and gas exploration and production, 2008-present). Mr. Wiley serves as a Director of Tesoro Corporation (independent oil refiner and marketer, 2005-present), and a Director of Bill Barrett Corporation (exploration and production, 2005-present). In addition, Mr. Wiley also serves as a Director of Post Oak Bank (privately-held bank, 2004-present). Previously, Mr. Wiley served as a member of the Board of Trustees of the University of Tulsa (2000-2006; 2007-2010), as a Senior Energy Advisor of Katzenbach Partners, LLC (consulting, 2006-2007), as an Advisory Director of Riverstone Holdings (private investment), Chairman, President, and CEO of Baker Hughes, Inc. (oilfield services, 2000-2004), and as Director of Spinnaker Exploration Company (exploration and production, 2001-2005). |
+ The information above includes each Trustee's principal occupation during the last five years and other information relating to the experience, attributes, and skills relevant to each Trustee's qualifications to serve as a Trustee, which led to the conclusion that each Trustee should serve as a Trustee for the fund.
Advisory Board Members and Executive Officers:
Correspondence intended for David A. Rosow and Garnett A. Smith may be sent to Fidelity Investments, P.O. Box 55235, Boston, Massachusetts 02205-5235. Correspondence intended for each executive officer, Edward C. Johnson 3d, and Peter S. Lynch may be sent to Fidelity Investments, 82 Devonshire Street, Boston, Massachusetts 02109.
Name, Age; Principal Occupation |
Edward C. Johnson 3d (82) |
| Year of Election or Appointment: 2011 Member of the Advisory Board of Fidelity's Equity and High Income Funds. Mr. Johnson serves as Chief Executive Officer, Chairman, and a Director of FMR LLC, and also serves as Chairman and Director of FIL Limited. Previously, Mr. Johnson served as a Trustee and Chairman of the Board of certain Fidelity Trusts, Chairman and a Director of FMR, Chairman and a Director of FMR Co., Inc., and President of FMR LLC (2006-2007). |
Peter S. Lynch (68) |
| Year of Election or Appointment: 2003 Member of the Advisory Board of Fidelity's Equity and High Income Funds. Mr. Lynch is Vice Chairman and a Director of FMR and FMR Co., Inc. In addition, Mr. Lynch serves as a Trustee of Boston College and as the Chairman of the Inner-City Scholarship Fund. Previously, Mr. Lynch served on the Special Olympics International Board of Directors (1997-2006). |
David A. Rosow (70) |
| Year of Election or Appointment: 2012 Member of the Advisory Board of Fidelity's Equity and High Income Funds. Chairman and Chief Executive Officer of International Golf Group, Inc. (golf course development, 1989-present). Previously, Mr. Rosow served as Chairman and Chief Executive Officer of Rosow & Company, Inc. (private investment company, 1989-2011), a Lead Director of Hudson United Bancorp (2001-2006) and as a Director of TD Banknorth (1996-2006). In addition, Mr. Rosow is a member (2008-present) and President (2009-present) of the Town Council of Palm Beach, Florida. |
Garnett A. Smith (65) |
| Year of Election or Appointment: 2012 Member of the Advisory Board of Fidelity's Equity and High Income Funds. Prior to Mr. Smith's retirement, he served as Chairman and Chief Executive Officer of Inbrand Corp. (manufacturer of personal absorbent products, 1990-1997). He also served as President (1986-1990) of Inbrand Corp. Prior to his employment with Inbrand Corp., he was employed by a retail fabric chain and North Carolina National Bank. In addition, Mr. Smith is a board member of the Jackson Hole Land Trust (2009-present). |
Kenneth B. Robins (43) |
| Year of Election or Appointment: 2008 President and Treasurer of Fidelity's Equity and High Income Funds. Mr. Robins also serves as President and Treasurer (2010-present) and Assistant Treasurer (2009-present) of other Fidelity funds and is an employee of Fidelity Investments (2004-present). Previously, Mr. Robins served as Deputy Treasurer of the Fidelity funds (2005-2008) and Treasurer and Chief Financial Officer of The North Carolina Capital Management Trust: Cash and Term Portfolios (2006-2008). |
Bruce T. Herring (47) |
| Year of Election or Appointment: 2006 Vice President of certain Equity Funds. Mr. Herring also serves as President of Fidelity Research & Analysis Company (2010-present), Chief Investment Officer and Director of Fidelity Management & Research (U.K.) Inc. (2010-present) and Group Chief Investment Officer of FMR. Previously, Mr. Herring served as Vice President (2005-2006) and Senior Vice President (2006-2007) of Fidelity Management & Research Company, Vice President of FMR Co., Inc. (2001-2007) and as a portfolio manager for Fidelity U.S. Equity Funds. |
Brian B. Hogan (48) |
| Year of Election or Appointment: 2009 Vice President of Equity and High Income Funds. Mr. Hogan also serves as President of FMR's Equity Division (2009-present). Previously, Mr. Hogan served as Senior Vice President, Equity Research of FMR (2006-2009) and as a portfolio manager. |
Scott C. Goebel (44) |
| Year of Election or Appointment: 2008 Secretary and Chief Legal Officer (CLO) of the Fidelity funds. Mr. Goebel also serves as Secretary of Fidelity Investments Money Management, Inc. (FIMM) (2010-present) and Fidelity Research and Analysis Company (FRAC) (2010-present); Secretary and CLO of The North Carolina Capital Management Trust: Cash and Term Portfolios (2008-present); General Counsel, Secretary, and Senior Vice President of FMR (2008-present) and FMR Co., Inc. (2008-present); employed by FMR LLC or an affiliate (2001-present); Chief Legal Officer of Fidelity Management & Research (Hong Kong) Limited (2008-present) and Assistant Secretary of Fidelity Management & Research (Japan) Inc. (2008-present), and Fidelity Management & Research (U.K.) Inc. (2008-present). Previously, Mr. Goebel served as Assistant Secretary of FIMM (2008-2010), FRAC (2008-2010), and the Funds (2007-2008) and as Vice President and Secretary of Fidelity Distributors Corporation (FDC) (2005-2007). |
William C. Coffey (43) |
| Year of Election or Appointment: 2009 Assistant Secretary of Fidelity's Equity and High Income Funds. Mr. Coffey also serves as Senior Vice President and Deputy General Counsel of FMR LLC (2010-present), and is an employee of Fidelity Investments. Previously, Mr. Coffey served as Vice President and Associate General Counsel of FMR LLC (2005-2009). |
Elizabeth Paige Baumann (44) |
| Year of Election or Appointment: 2012 Anti-Money Laundering (AML) Officer of the Fidelity funds. Ms. Baumann also serves as AML Officer of The North Carolina Capital Management Trust: Cash and Term Portfolios (2012-present), Chief AML Officer of FMR LLC (2012-present), and is an employee of Fidelity Investments. Previously, Ms. Baumann served as Vice President and Deputy Anti-Money Laundering Officer (2007-2012). |
Christine Reynolds (54) |
| Year of Election or Appointment: 2008 Chief Financial Officer of the Fidelity funds. Ms. Reynolds became President of Fidelity Pricing and Cash Management Services (FPCMS) in August 2008. Ms. Reynolds served as Chief Operating Officer of FPCMS (2007-2008). Previously, Ms. Reynolds served as President, Treasurer, and Anti-Money Laundering officer of the Fidelity funds (2004-2007). |
Joseph A. Hanlon (44) |
| Year of Election or Appointment: 2012 Chief Compliance Officer of Fidelity's Equity and High Income Funds. Mr. Hanlon serves as Compliance Officer of FMR, FMR Co., Inc., Fidelity Investments Money Management, Inc. (FIMM), Fidelity Research and Analysis Company (FRAC), Fidelity Management & Research (Japan) Inc., Fidelity Management & Research (U.K.) Inc., Fidelity Management & Research (Hong Kong), and Strategic Advisers, Inc. (2009-present), as Senior Vice President of the Fidelity Asset Management Division (2009-present), and is an employee of Fidelity Investments. |
Joseph F. Zambello (55) |
| Year of Election or Appointment: 2011 Deputy Treasurer of the Fidelity funds. Mr. Zambello is an employee of Fidelity Investments. Previously, Mr. Zambello served as Vice President of FMR's Program Management Group (2009-2011) and Vice President of the Transfer Agent Oversight Group (2005-2009). |
Adrien E. Deberghes (45) |
| Year of Election or Appointment: 2008 Deputy Treasurer of Fidelity's Equity and High Income Funds. Mr. Deberghes also serves as Vice President (2011-present) and Assistant Treasurer (2010-present) of other Fidelity funds, and is an employee of Fidelity Investments (2008-present). Previously, Mr. Deberghes served as Senior Vice President of Mutual Fund Administration at State Street Corporation (2007-2008), Senior Director of Mutual Fund Administration at Investors Bank & Trust (2005-2007), and Director of Finance for Dunkin' Brands (2000-2005). |
Stephen Sadoski (41) |
| Year of Election or Appointment: 2012 Deputy Treasurer of Fidelity's Equity and High Income Funds. Mr. Sadoski also serves as Assistant Treasurer of other Fidelity funds (2012-present) and is an employee of Fidelity Investments (2012-present). Previously, Mr. Sadoski served as an assistant chief accountant in the Division of Investment Management of the Securities and Exchange Commission (SEC) (2009-2012) and as a senior manager at Deloitte & Touche (1997-2009). |
Stephanie J. Dorsey (43) |
| Year of Election or Appointment: 2010 Assistant Treasurer of Fidelity's Equity and High Income Funds. Ms. Dorsey also serves as Deputy Treasurer of other Fidelity funds (2008-present) and is an employee of Fidelity Investments (2008-present). Previously, Ms. Dorsey served as Treasurer (2004-2008) of the JPMorgan Mutual Funds and Vice President (2004-2008) of JPMorgan Chase Bank. |
John R. Hebble (54) |
| Year of Election or Appointment: 2009 Assistant Treasurer of Fidelity's Equity and High Income Funds. Mr. Hebble also serves as President (2011-present), Treasurer, and Chief Financial Officer of The North Carolina Capital Management Trust: Cash and Term Portfolios (2008-present), President and Treasurer of other Fidelity funds (2008-present) and is an employee of Fidelity Investments. |
Gary W. Ryan (54) |
| Year of Election or Appointment: 2005 Assistant Treasurer of the Fidelity funds. Mr. Ryan is an employee of Fidelity Investments. Previously, Mr. Ryan served as Vice President of Fund Reporting in Fidelity Pricing and Cash Management Services (FPCMS) (1999-2005). |
Jonathan Davis (44) |
| Year of Election or Appointment: 2010 Assistant Treasurer of the Fidelity funds. Mr. Davis is also Assistant Treasurer of Fidelity Rutland Square Trust II and Fidelity Commonwealth Trust II. Mr. Davis is an employee of Fidelity Investments. Previously, Mr. Davis served as Vice President and Associate General Counsel of FMR LLC (2003-2010). |
Annual Report
The Board of Trustees of Advisor International Value Fund voted to pay to shareholders of record at the opening of business on record date, the following distributions per share derived from capital gains realized from sales of portfolio securities, and dividends derived from net investment income:
| Pay Date | Record Date | Dividends | Capital Gains |
Class A | 12/10/12 | 12/07/12 | $0.201 | $0.042 |
Class T | 12/10/12 | 12/07/12 | $0.185 | $0.042 |
Class B | 12/10/12 | 12/07/12 | $0.129 | $0.042 |
Class C | 12/10/12 | 12/07/12 | $0.152 | $0.042 |
A percentage of the dividends distributed during the fiscal year for the following fund may be taken into account as a dividend for the purpose of the maximum rate under section 1(h)(11) of the Internal Revenue Code.
| December 2011 |
Class A | 86% |
Class T | 96% |
Class B | 100% |
Class C | 100% |
The amounts per share which represent income derived from sources within, and taxes paid to, foreign countries or possessions of the United States are as follows:
| Pay Date | Income | Taxes |
Class A | 12/05/11 | $0.199 | $0.0133 |
Class T | 12/05/11 | $0.179 | $0.0133 |
Class B | 12/05/11 | $0.144 | $0.0133 |
Class C | 12/05/11 | $0.154 | $0.0133 |
The fund will notify shareholders in January 2013 of amounts for use in preparing 2012 income tax returns.
Annual Report
Board Approval of Investment Advisory Contracts and Management Fees
Fidelity International Value Fund
Each year, the Board of Trustees, including the Independent Trustees (together, the Board), votes on the renewal of the management contract and sub-advisory agreements (together, the Advisory Contracts) for the fund. The Board, assisted by the advice of fund counsel and Independent Trustees' counsel, requests and considers a broad range of information relevant to the renewal of the Advisory Contracts throughout the year.
The Board meets regularly and, at each of its meetings, considers factors that are relevant to its annual consideration of the renewal of the fund's Advisory Contracts, including the services and support provided to the fund and its shareholders. The Board has established various standing committees, each composed of and chaired by Independent Trustees with varying backgrounds, to which the Board has assigned specific subject matter responsibilities in order to enhance effective decision-making by the Board. The Board, acting directly and through its Committees, requests and receives information concerning the annual consideration of the renewal of the fund's Advisory Contracts. The Board also meets as needed to consider matters specifically related to the Board's annual consideration of the renewal of Advisory Contracts. Members of the Board may also meet with trustees of other Fidelity funds through ad hoc joint committees to discuss certain matters relevant to the Fidelity funds.
At its July 2012 meeting, the Board of Trustees, including the Independent Trustees, unanimously determined to renew the fund's Advisory Contracts. In reaching its determination, the Board considered all factors it believed relevant, including (i) the nature, extent, and quality of the services to be provided to the fund and its shareholders (including the investment performance of the fund); (ii) the competitiveness of the fund's management fee and total expense ratio relative to peer funds; (iii) the total costs of the services to be provided by and the profits to be realized by Fidelity from its relationship with the fund; (iv) the extent to which economies of scale exist and would be realized as the fund grows; and (v) whether fee levels reflect these economies of scale, if any, for the benefit of fund shareholders.
In considering whether to renew the Advisory Contracts for the fund, the Board reached a determination, with the assistance of fund counsel and Independent Trustees' counsel and through the exercise of its business judgment, that the renewal of the Advisory Contracts is in the best interests of the fund and its shareholders and that the compensation payable under the Advisory Contracts is fair and reasonable. The Board's decision to renew the Advisory Contracts was not based on any single factor, but rather was based on a comprehensive consideration of all the information provided to the Board at its meetings throughout the year. The Board, in reaching its determination to renew the Advisory Contracts, is aware that shareholders in the fund have a broad range of investment choices available to them, including a wide choice among mutual funds offered by Fidelity's competitors, and that the fund's shareholders, who have the opportunity to review and weigh the disclosure provided by the fund in its prospectus and other public disclosures, have chosen to invest in this fund, managed by Fidelity.
Annual Report
Nature, Extent, and Quality of Services Provided. The Board considered the staffing within the investment adviser, FMR, and the sub-advisers (together, the Investment Advisers), including the backgrounds of the fund's investment personnel, and also considered the fund's investment objective, strategies, and related investment philosophy. The Independent Trustees also had discussions with senior management of Fidelity's investment operations and investment groups. The Board considered the structure of the portfolio manager compensation program and whether this structure provides appropriate incentives to act in the best interests of the fund.
Resources Dedicated to Investment Management and Support Services. The Board and the Fund Oversight and Research Committees reviewed the general qualifications and capabilities of the Investment Advisers' investment staff, including its size, education, experience, and resources, as well as the Investment Advisers' approach to recruiting, training, managing, and compensating investment personnel. The Board also noted that FMR has continued to increase the resources devoted to non-U.S. offices, including expansion of Fidelity's global investment organization. The Board noted that Fidelity's analysts have extensive resources, tools and capabilities that allow them to conduct sophisticated quantitative and fundamental analysis, as well as credit analysis of issuers, counterparties and guarantors. The Board also believes that Fidelity's investment professionals have sufficient access to global information and data so as to provide competitive investment results over time, and that those professionals also have access to sophisticated tools that permit them to assess portfolio construction and risk and performance attribution characteristics continuously, as well as to transmit new information and research conclusions rapidly around the world. Additionally, in its deliberations, the Board considered the Investment Advisers' trading and risk management capabilities and resources, which are an integral part of the investment management process.
Shareholder and Administrative Services. The Board considered (i) the nature, extent, quality, and cost of advisory, administrative, and shareholder services performed by the Investment Advisers and their affiliates under the Advisory Contracts and under separate agreements covering transfer agency, pricing and bookkeeping, and securities lending services for the fund; (ii) the nature and extent of the supervision of third party service providers, principally custodians and subcustodians; and (iii) the resources devoted to, and the record of compliance with, the fund's compliance policies and procedures. The Board also reviewed the allocation of fund brokerage, including allocations to brokers affiliated with the Investment Advisers, the use of brokerage commissions to pay fund expenses, and the use of "soft" commission dollars to pay for research services.
Annual Report
Board Approval of Investment Advisory Contracts and
Management Fees - continued
The Board noted that the growth of fund assets over time across the complex allows Fidelity to reinvest in the development of services designed to enhance the value or convenience of the Fidelity funds as investment vehicles. These services include 24-hour access to account information and market information through telephone representatives and over the Internet, investor education materials and asset allocation tools, and the expanded availability of Fidelity Investor Centers.
Investment in a Large Fund Family. The Board considered the benefits to shareholders of investing in a Fidelity fund, including the benefits of investing in a fund that is part of a large family of funds offering a variety of investment disciplines and providing a large variety of mutual fund investor services. The Board noted that Fidelity had taken, or had made recommendations that resulted in the Fidelity funds taking, a number of actions over the previous year that benefited particular funds, including (i) continuing to dedicate additional resources to investment research and support of the senior management team that oversees asset management; (ii) persisting in efforts to enhance Fidelity's research capabilities, in particular, international research; (iii) launching new funds and making other enhancements to meet client needs for global and income-oriented solutions; (iv) continuing to launch dedicated lower cost underlying funds to meet investment management's portfolio construction needs related to expanding underlying fund options, specifically for the Freedom Fund product lines; (v) adopting a "Stock Selector" sector neutral investment approach and employing a team of portfolio managers who are sector specialists to manage certain funds; (vi) rationalizing product lines and gaining increased efficiencies through the mergers of several funds into other funds; (vii) strengthening the Spartan Index Fund product line by adding new funds and/or new low-cost institutional share classes, restructuring fund expenses to accommodate new classes, and reducing investment minimums for certain classes of shares; (viii) modifying the eligibility criteria for Institutional Class shares to increase their appeal to government entities and charitable investors; and (ix) reducing certain transfer agent fee rates.
Investment Performance. The Board considered whether the fund has operated in accordance with its investment objective, as well as its record of compliance with its investment restrictions. It also reviewed the fund's absolute investment performance for each class, as well as the fund's relative investment performance for each class measured over multiple periods against (i) a broad-based securities market index, and (ii) a custom peer group of mutual funds deemed appropriate by Fidelity and reviewed by the Board. The following charts considered by the Board show, over the one-, three-, and five-year periods ended December 31, 2011, the cumulative total returns of Institutional Class (Class I) and Class B of the fund, the cumulative total returns of a broad-based securities market index ("benchmark"), and a range of cumulative total returns of a custom peer group of mutual funds defined by FMR based on categories assigned by Morningstar, Inc. The returns of Institutional Class (Class I) and Class B show the performance of the highest and lowest performing classes, respectively (based on five-year performance). The box within each chart shows the 25th percentile return (top of box) and the 75th percentile return (bottom of box) of the peer group. Returns shown above the box are in the first quartile and returns shown below the box are in the fourth quartile. The percentage beaten numbers noted below each chart correspond to the percentile box and represent the percentage of funds in the peer group whose performance was equal to or lower than that of the class indicated. The fund's custom peer group, defined by FMR, is a peer group that FMR believes provides a more meaningful performance comparison than the peer group assigned by Morningstar, Inc., which assigns mutual funds to categories based on their investment styles as measured by their underlying portfolio holdings.
Annual Report
Fidelity International Value Fund
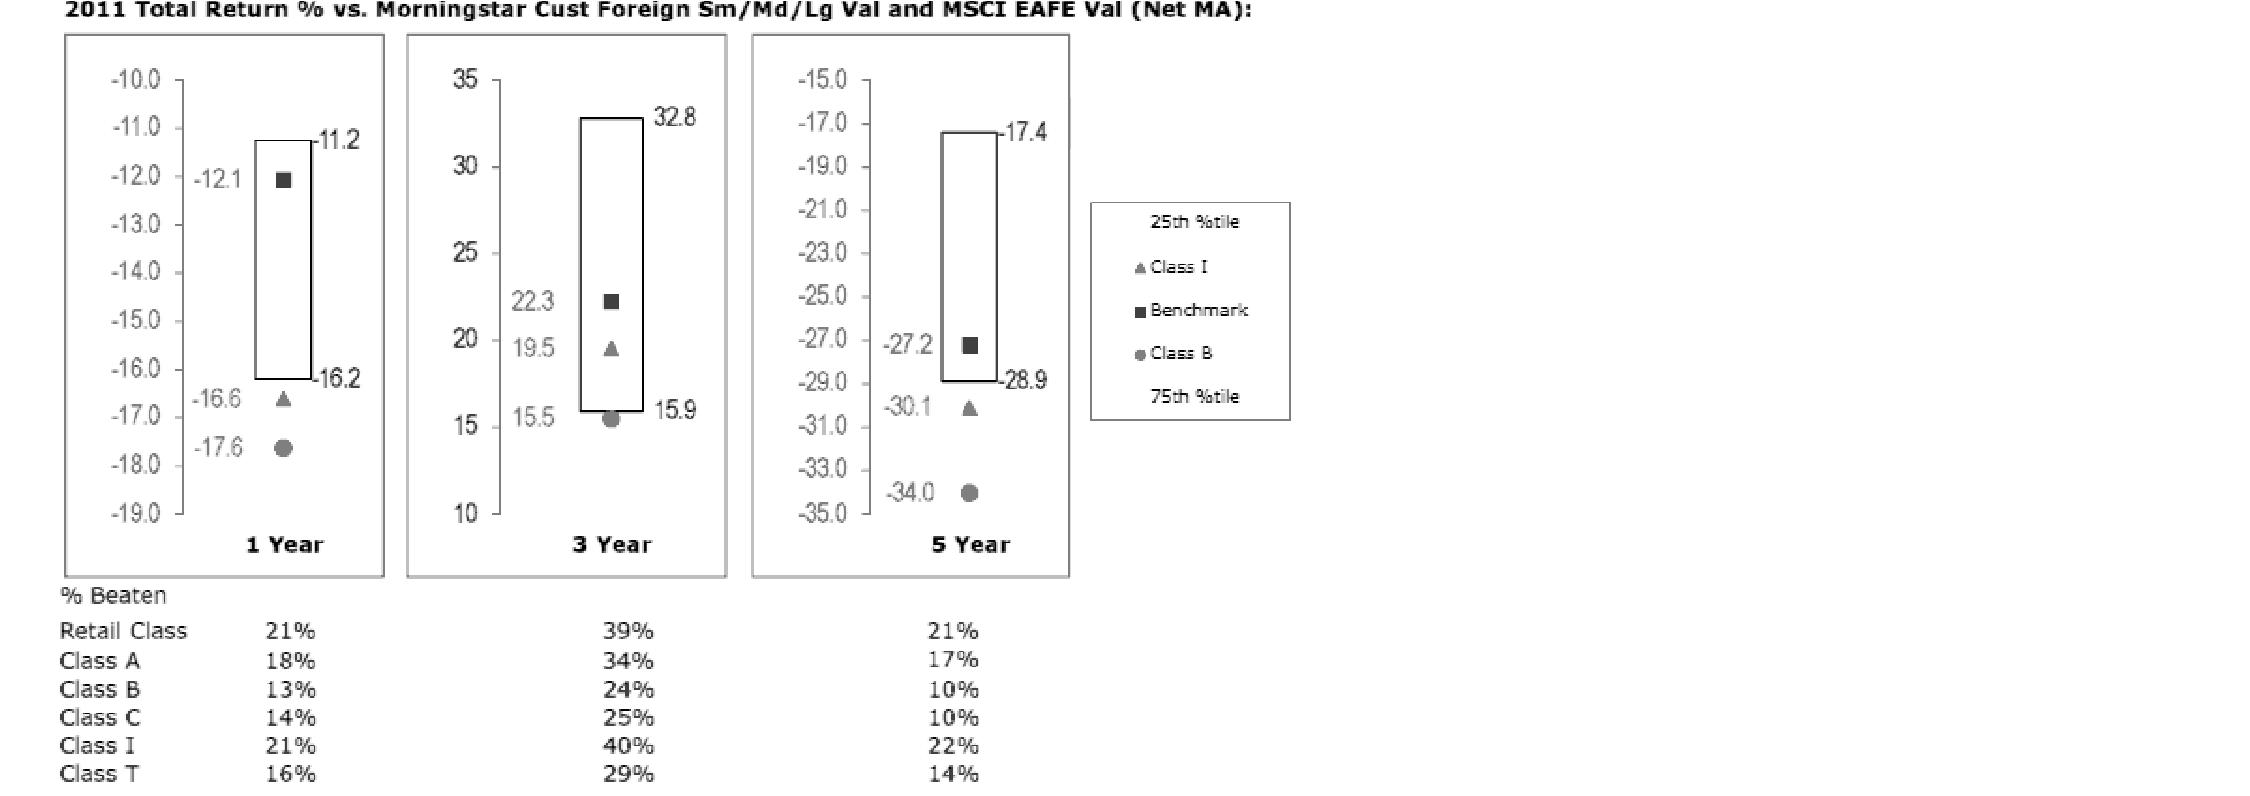
The Board reviewed the fund's relative investment performance against its peer group and noted that the performance of Institutional Class (Class I) of the fund was in the fourth quartile for the one- and five-year periods and the third quartile for the three-year period. The Board also noted that the investment performance of the fund was lower than its benchmark for all the periods shown. The Board considered that the variations in performance among the fund's classes reflect the variations in class expenses, which result in lower performance for higher expense classes. The Board discussed with FMR actions to improve the fund's disappointing performance relative to its peer group and benchmark. The Board noted that this fund had underperformed in the past and discussed with FMR its disappointment with the continued underperformance of the fund. The Board noted that there was a portfolio management change for the fund in September 2011. The Board also reviewed the fund's performance since inception as well as performance in the current year. The Board will continue to closely monitor the performance of the fund in the coming year and discuss with FMR other appropriate actions to address the performance of the fund.
Annual Report
Board Approval of Investment Advisory Contracts and
Management Fees - continued
The Board also considered that the fund's management fee is subject to upward or downward adjustment depending upon whether, and to what extent, the fund's investment performance for the performance period exceeds, or is exceeded by, the record (over the same period) of a Board-approved performance adjustment index. The Board noted that the performance adjustment provides FMR with a strong economic incentive to seek to achieve superior performance for the fund's shareholders and helps to more closely align the interests of FMR and the fund's shareholders.
Based on its review, the Board concluded that the nature, extent, and quality of services provided to the fund under the Advisory Contracts should benefit the fund's shareholders.
Competitiveness of Management Fee and Total Expense Ratio. The Board considered the fund's management fee and total expense ratio compared to "mapped groups" of competitive funds and classes. Fidelity creates "mapped groups" by combining similar Lipper investment objective categories that have comparable management fee characteristics. Combining Lipper investment objective categories aids the Board's management fee and total expense ratio comparisons by broadening the competitive group used for comparison and by reducing the number of universes to which various Fidelity funds are compared.
Management Fee. The Board considered two proprietary management fee comparisons for the 12-month periods shown in the chart below. The group of Lipper funds used by the Board for management fee comparisons is referred to below as the "Total Mapped Group." The Total Mapped Group comparison focuses on a fund's standing relative to the total universe of comparable funds available to investors in terms of gross management fees before expense reimbursements or caps, and without giving effect to the fund's performance adjustment. "TMG %" represents the percentage of funds in the Total Mapped Group that had management fees that were lower than the fund's. For example, a TMG % of 17% means that 83% of the funds in the Total Mapped Group had higher management fees than the fund. The "Asset-Size Peer Group" (ASPG) comparison focuses on a fund's standing relative to non-Fidelity funds similar in size to the fund within the Total Mapped Group. The ASPG represents at least 15% of the funds in the Total Mapped Group with comparable asset size and management fee characteristics, subject to a minimum of 50 funds (or all funds in the Total Mapped Group if fewer than 50). Additional information, such as the ASPG quartile in which the fund's management fee ranked and the impact of the fund's performance adjustment, is also included in the chart and considered by the Board.
Annual Report
Fidelity International Value Fund

The Board noted that the fund's management fee ranked below the median of its Total Mapped Group and below the median of its ASPG for 2011. The Board also noted the effect of the fund's negative performance adjustment on the fund's management fee ranking. The Board noted that the performance adjustment for each year represents calculations for performance periods that differ from the periods shown in the performance charts above.
Based on its review, the Board concluded that the fund's management fee is fair and reasonable in light of the services that the fund receives and the other factors considered.
Total Expense Ratio. In its review of each class's total expense ratio, the Board considered the fund's management fee as well as other fund or class expenses, as applicable, such as transfer agent fees, pricing and bookkeeping fees, fund-paid 12b-1 fees, and custodial, legal, and audit fees. The Board also noted the effects of any waivers and reimbursements on fees and expenses, as well as the impact of the fund's performance adjustment. As part of its review, the Board also considered the current and historical total expense ratios of each class of the fund compared to competitive fund median expenses. Each class of the fund is compared to those funds and classes in the Total Mapped Group (used by the Board for management fee comparisons) that have a similar sales load structure.
The Board noted that the total expense ratio of each of Class A, Class B, Class C, Institutional Class, and the retail class ranked below its competitive median for 2011 and the total expense ratio of Class T ranked above its competitive median for 2011. The Board considered that various factors, including 12b-1 fees, positive or negative performance adjustments, and relatively higher other expenses in the case of small fund size, can affect total expense ratios. The Board noted that the total expense ratio of Class T was above the competitive median primarily because of higher 12b-1 fees on Class T. Class T has a higher 12b-1 fee, but a lower front-end sales charge, than traditionally priced front-end sales charge classes. The Board considered that Class T is primarily sold load-waived in the retirement plan market where its 0.50% 12b-1 fee is comparable to competing no-load, higher 12b-1 fee classes designed specifically for retirement plans. The Board noted that the fund offers multiple classes, each of which has a different sales load and 12b-1 fee structure, and that the multiple structures are intended to offer a range of pricing options for the intermediary market. The Board also noted that the total expense ratios of the classes vary primarily by the level of their 12b-1 fees, although differences in transfer agent fees may also cause expenses to vary from class to class.
Annual Report
Board Approval of Investment Advisory Contracts and
Management Fees - continued
Fees Charged to Other Fidelity Clients. The Board also considered Fidelity fee structures and other information with respect to clients of FMR and its affiliates, such as other mutual funds advised or subadvised by FMR or its affiliates, pension plan clients, and other institutional clients. The Board noted the findings of the 2010 ad hoc joint committee (created with the board of other Fidelity funds), which reviewed and compared Fidelity's institutional investment advisory business with its business of providing services to the Fidelity funds, including the differences in services provided, fees charged, and costs incurred, as well as competition in their respective marketplaces.
Based on its review of total expense ratios and fees charged to other Fidelity clients, the Board concluded that the total expense ratio of each class of the fund was reasonable, although Class T was above the median of the universe presented for comparison, in light of the services that the fund and its shareholders receive and the other factors considered.
Costs of the Services and Profitability. The Board considered the revenues earned and the expenses incurred by Fidelity in conducting the business of developing, marketing, distributing, managing, administering and servicing the fund and its shareholders. The Board also considered the level of Fidelity's profits in respect of all the Fidelity funds.
On an annual basis, FMR presents to the Board Fidelity's profitability for the fund. Fidelity calculates the profitability for each fund, as well as aggregate profitability for groups of Fidelity funds and all Fidelity funds, using a series of detailed revenue and cost allocation methodologies which originate with the books and records of Fidelity on which Fidelity's audited financial statements are based. The Audit Committee of the Board reviews any significant changes from the prior year's methodologies.
PricewaterhouseCoopers LLP (PwC), independent registered public accounting firm and auditor to Fidelity and certain Fidelity funds, has been engaged annually by the Board as part of the Board's assessment of Fidelity's profitability analysis. PwC's engagement includes the review and assessment of Fidelity's methodologies used in determining the revenues and expenses attributable to Fidelity's mutual fund business, and completion of agreed-upon procedures surrounding the mathematical accuracy of fund profitability and its conformity to allocation methodologies. After considering PwC's reports issued under the engagement and information provided by Fidelity, the Board concluded that while other allocation methods may also be reasonable, Fidelity's profitability methodologies are reasonable in all material respects.
Annual Report
The Board also reviewed Fidelity's non-fund businesses and fall-out benefits related to the mutual fund business as well as cases where Fidelity's affiliates may benefit from or be related to the fund's business.
The Board considered the costs of the services provided by and the profits realized by Fidelity in connection with the operation of the fund and was satisfied that the profitability was not excessive in the circumstances.
Economies of Scale. The Board considered whether there have been economies of scale in respect of the management of the Fidelity funds, whether the Fidelity funds (including the fund) have appropriately benefited from any such economies of scale, and whether there is potential for realization of any further economies of scale. The Board considered the extent to which the fund will benefit from economies of scale through increased services to the fund, through waivers or reimbursements, or through fee or expense reductions. The Board also noted that in 2009, it and the board of other Fidelity funds created an ad hoc committee (the Economies of Scale Committee) to analyze whether FMR attains economies of scale in respect of the management and servicing of the Fidelity funds, whether the Fidelity funds have appropriately benefited from such economies of scale, and whether there is potential for realization of any further economies of scale.
The Board recognized that the fund's management contract incorporates a "group fee" structure, which provides for lower group fee rates as total fund assets under FMR's management increase, and for higher group fee rates as total fund assets under FMR's management decrease. FMR calculates the group fee rates based on a tiered asset "breakpoint" schedule that varies based on asset class. The Board considered that the group fee is designed to deliver the benefits of economies of scale to fund shareholders when total Fidelity fund assets increase, even if assets of any particular fund are unchanged or have declined, because some portion of Fidelity's costs are attributable to services provided to all Fidelity funds, and all funds benefit if those costs can be allocated among more assets. The Board concluded that, given the group fee structure, fund shareholders will benefit from lower management fees as assets under FMR's management increase at the fund complex level, regardless of whether Fidelity achieves any such economies of scale.
Annual Report
Board Approval of Investment Advisory Contracts and
Management Fees - continued
The Board concluded, taking into account the analysis of the Economies of Scale Committee, that economies of scale, if any, are being appropriately shared between fund shareholders and Fidelity.
Additional Information Requested by the Board. In order to develop fully the factual basis for consideration of the Fidelity funds' Advisory Contracts, the Board requested and received additional information on certain topics, including (i) fund performance trends, actions to be taken by FMR to improve certain funds' overall performance, and Fidelity's long-term strategies for certain funds; (ii) the potential to further rationalize the Fidelity fund lineup with the possibility of achieving savings for the funds and Fidelity; (iii) Fidelity's compensation structure for portfolio managers and other key investment personnel; (iv) the amount of the investment that each portfolio manager has made in the Fidelity fund(s) that he or she manages; (v) the realization of fall-out benefits in certain Fidelity business units; (vi) Fidelity's group fee structures, the potential impact of regulatory changes on such structures, and the rationale for the individual fee rates of certain funds; (vii) fund profitability methodology, including Fidelity's cost allocation methodology, and the impact of certain factors on fund profitability results; (viii) trends regarding industry use of performance fee structures and the possibility of implementing performance fee structures for additional funds; and (ix) the impact of net redemptions from the Fidelity funds.
Based on its evaluation of all of the conclusions noted above, and after considering all factors it believed relevant, the Board ultimately concluded that the advisory fee structures are fair and reasonable, and that the fund's Advisory Contracts should be renewed.
Annual Report
Investment Adviser
Fidelity Management & Research Company
Boston, MA
Investment Sub-Advisers
FMR Co., Inc.
Fidelity Management & Research
(U.K.) Inc.
Fidelity Management & Research
(Hong Kong) Limited
Fidelity Management & Research
(Japan) Inc.
FIL Investment Advisors
FIL Investments (Japan) Limited
FIL Investment Advisors (U.K.) Ltd.
General Distributor
Fidelity Distributors Corporation
Smithfield, RI
Transfer and Service Agents
Fidelity Investments Institutional Operations Company, Inc.
Boston, MA
Fidelity Service Company, Inc.
Boston, MA
Custodian
The Northern Trust Company
Chicago, IL
(Fidelity Investment logo)(registered trademark)
AFIV-UANN-1212
1.827496.106
(Fidelity Investment logo)(registered trademark)
Fidelity Advisor®
International Value
Fund - Institutional Class
Annual Report
October 31, 2012
(Fidelity Cover Art)
Institutional Class is
a class of Fidelity®
International Value Fund
Contents
Performance | (Click Here) | How the fund has done over time. |
Management's Discussion of Fund Performance | (Click Here) | The Portfolio Manager's review of fund performance and strategy. |
Shareholder Expense Example | (Click Here) | An example of shareholder expenses. |
Investment Changes | (Click Here) | A summary of major shifts in the fund's investments over the past six months. |
Investments | (Click Here) | A complete list of the fund's investments with their market values. |
Financial Statements | (Click Here) | Statements of assets and liabilities, operations, and changes in net assets, as well as financial highlights. |
Notes | (Click Here) | Notes to financial statements. |
Report of Independent Registered Public Accounting Firm | (Click Here) | |
Trustees and Officers | (Click Here) | |
Distributions | (Click Here) | |
Board Approval of Investment Advisory Contracts and Management Fees | (Click Here) | |
To view a fund's proxy voting guidelines and proxy voting record for the 12-month period ended June 30, visit http://www.fidelity.com/proxyvotingresults or visit the Securities and Exchange Commission's (SEC) web site at http://www.sec.gov. You may also call 1-877-208-0098 to request a free copy of the proxy voting guidelines.
Standard & Poor's, S&P and S&P 500 are registered service marks of The McGraw-Hill Companies, Inc. and have been licensed for use by Fidelity Distributors Corporation.
Other third party marks appearing herein are the property of their respective owners.
All other marks appearing herein are registered or unregistered trademarks or service marks of FMR LLC or an affiliated company. © 2012 FMR LLC. All rights reserved.
Annual Report
This report and the financial statements contained herein are submitted for the general information of the shareholders of the fund. This report is not authorized for distribution to prospective investors in the fund unless preceded or accompanied by an effective prospectus.
A fund files its complete schedule of portfolio holdings with the SEC for the first and third quarters of each fiscal year on Form N-Q. Forms N-Q are available on the SEC's web site at http://www.sec.gov. A fund's Forms N-Q may be reviewed and copied at the SEC's Public Reference Room in Washington, DC. Information regarding the operation of the SEC's Public Reference Room may be obtained by calling 1-800-SEC-0330. For a complete list of a fund's portfolio holdings, view the most recent holdings listing, semiannual report, or annual report on Fidelity's web site at http://www.fidelity.com, http://www.advisor.fidelity.com, or http://www.401k.com, as applicable.
NOT FDIC INSURED • MAY LOSE VALUE • NO BANK GUARANTEE
Neither the fund nor Fidelity Distributors Corporation is a bank.
Annual Report
Average annual total return reflects the change in the value of an investment, assuming reinvestment of the class' distributions from dividend income and capital gains (the profits earned upon the sale of securities that have grown in value, if any) and assuming a constant rate of performance each year. The $10,000 table and the fund's returns do not reflect the deduction of taxes that a shareholder would pay on fund distributions or the redemption of fund shares. During periods of reimbursement by Fidelity, a fund's total return will be greater than it would be had the reimbursement not occurred. How a fund did yesterday is no guarantee of how it will do tomorrow.
Average Annual Total Returns
Periods ended October 31, 2012 | Past 1
year | Past 5
years | Life of
fund A |
Institutional Class | 9.22% | -7.57% | -1.84% |
A From May 18, 2006.
$10,000 Over Life of Fund
Let's say hypothetically that $10,000 was invested in Fidelity Advisor® International Value Fund - Institutional Class on May 18, 2006, when the fund started. The chart shows how the value of your investment would have changed, and also shows how the MSCI® EAFE® Value Index performed over the same period.
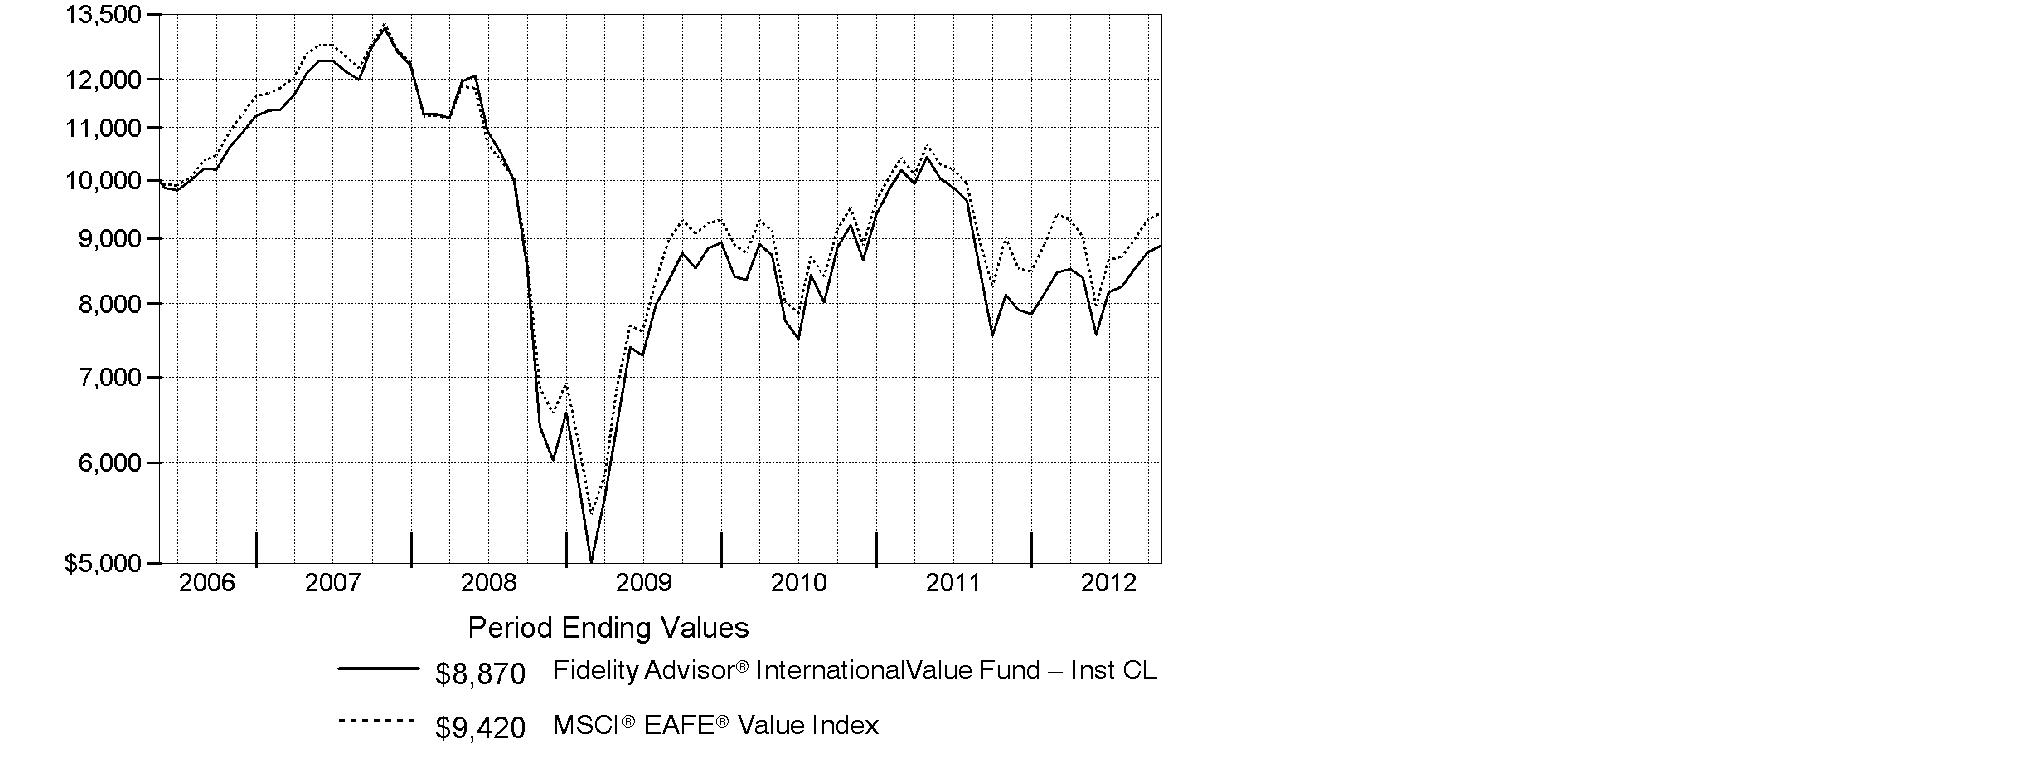
Annual Report
Market Recap: International stocks experienced pendulum-like swings during the 12 months ending October 31, 2012, finishing the period with a modest advance. The market faced periodic bouts of volatility this past year, as a number of macroeconomic concerns - including the eurozone debt crisis, the strength and pace of the U.S. economic recovery, and a slowdown in China's once-blistering growth - dominated headlines and weighed on investors. While a stronger U.S. dollar provided an additional head wind, foreign developed- and emerging-markets stocks still managed a gain for the 12 months, as the MSCI® ACWI® (All Country World Index) ex USA Index rose 4.11%, largely buttressed in the summertime by pledges of accommodative monetary action from eurozone officials, as well as signs that the U.S. housing market was on the mend. Within the index, Asia-Pacific ex Japan showed the most impressive gains, advancing roughly 11%. A number of core European components, most notably Germany (+11%), Switzerland (+10%) and the U.K. (+9%), benefited from optimism about the eurozone's ability to resolve its debt woes, which also helped the region outpace the index overall. Elsewhere, results from Canada (+3%) and the generally more volatile emerging markets (+2%) each fell short of the MSCI index, while Japan was among the few benchmark constituents to finish in the red, returning about -3%.
Comments from Alex Zavratsky, Portfolio Manager of Fidelity Advisor® International Value Fund: For the year, the fund's Institutional Class shares rose 9.22%, easily outpacing the 4.64% gain of the benchmark MSCI® EAFE® Value Index. Investments in two pharmaceuticals firms - France's Sanofi and non-index Roche Holding of Switzerland - were standouts. Within this industry, I focused on companies where product patent cliffs were either behind them or were well understood so they could focus on future growth. Elsewhere, I avoided benchmark components Telefonica - Spain's telecom giant - and France Telecom, as I believed pressure on both companies' cash flow, too much debt, poor business fundamentals and unsustainable dividend yields would hamper each stock. That proved to be the right call. Similarly, I did not invest in Finnish mobile device maker Nokia. Given the strength of competitors Samsung Electronics and Apple, I believed Nokia, with its non-differentiated product, was at a technological and brand disadvantage. Individual detractors included Repsol, a Spain-based integrated oil and gas company that suffered because Argentina moved to nationalize the company's local unit. An untimely investment in Japanese electronics manufacturer Hitachi also hurt.
The views expressed above reflect those of the portfolio manager(s) only through the end of the period as stated on the cover of this report and do not necessarily represent the views of Fidelity or any other person in the Fidelity organization. Any such views are subject to change at any time based upon market or other conditions and Fidelity disclaims any responsibility to update such views. These views may not be relied on as investment advice and, because investment decisions for a Fidelity fund are based on numerous factors, may not be relied on as an indication of trading intent on behalf of any Fidelity fund.
Annual Report
Shareholder Expense Example
As a shareholder of the Fund, you incur two types of costs: (1) transaction costs, including sales charges (loads) on purchase payments or redemption proceeds, redemption fees and (2) ongoing costs, including management fees, distribution and/or service (12b-1) fees and other Fund expenses. This Example is intended to help you understand your ongoing costs (in dollars) of investing in the Fund and to compare these costs with the ongoing costs of investing in other mutual funds.
The Example is based on an investment of $1,000 invested at the beginning of the period and held for the entire period (May 1, 2012 to October 31, 2012).
Actual Expenses
The first line of the accompanying table for each class of the Fund provides information about actual account values and actual expenses. You may use the information in this line, together with the amount you invested, to estimate the expenses that you paid over the period. Simply divide your account value by $1,000.00 (for example, an $8,600 account value divided by $1,000.00 = 8.6), then multiply the result by the number in the first line for a class of the Fund under the heading entitled "Expenses Paid During Period" to estimate the expenses you paid on your account during this period. A small balance maintenance fee of $12.00 that is charged once a year may apply for certain accounts with a value of less than $2,000. This fee is not included in the table below. If it was, the estimate of expenses you paid during the period would be higher, and your ending account value lower, by this amount. In addition, the Fund, as a shareholder in the underlying Fidelity Central Funds, will indirectly bear its pro-rata share of the fees and expenses incurred by the underlying Fidelity Central Funds. These fees and expenses are not included in the Fund's annualized expense ratio used to calculate the expense estimate in the table below.
Hypothetical Example for Comparison Purposes
The second line of the accompanying table for each class of the Fund provides information about hypothetical account values and hypothetical expenses based on a Class' actual expense ratio and an assumed rate of return of 5% per year before expenses, which is not the Class' actual return. The hypothetical account values and expenses may not be used to estimate the actual ending account balance or expenses you paid for the period. You may use this information to compare the ongoing costs of investing in the Fund and other funds. To do so, compare this 5% hypothetical example with the 5% hypothetical examples that appear in the shareholder reports of the other funds. A small balance maintenance fee of $12.00 that is charged once a year may apply for certain accounts with a value of less than $2,000. This fee is not included in the table below. If it was, the estimate of expenses you paid during the period would be higher, and your ending account value lower, by this amount. In addition, the Fund, as a shareholder in the underlying Fidelity Central Funds, will indirectly bear its pro-rata share of the fees and expenses incurred by the underlying Fidelity Central Funds. These fees and expenses are not included in the Fund's annualized expense ratio used to calculate the expense estimate in the table below.
Please note that the expenses shown in the table are meant to highlight your ongoing costs only and do not reflect any transaction costs. Therefore, the second line of the table is useful in comparing ongoing costs only, and will not help you determine the relative total costs of owning different funds. In addition, if these transactional costs were included, your costs would have been higher.
Annual Report
Shareholder Expense Example - continued
| Annualized Expense Ratio | Beginning
Account Value
May 1, 2012 | Ending
Account Value
October 31, 2012 | Expenses Paid
During Period*
May 1, 2012 to October 31, 2012 |
Class A | 1.45% | | | |
Actual | | $ 1,000.00 | $ 1,057.20 | $ 7.50 |
HypotheticalA | | $ 1,000.00 | $ 1,017.85 | $ 7.35 |
Class T | 1.70% | | | |
Actual | | $ 1,000.00 | $ 1,055.80 | $ 8.78 |
HypotheticalA | | $ 1,000.00 | $ 1,016.59 | $ 8.62 |
Class B | 2.20% | | | |
Actual | | $ 1,000.00 | $ 1,054.20 | $ 11.36 |
HypotheticalA | | $ 1,000.00 | $ 1,014.08 | $ 11.14 |
Class C | 2.20% | | | |
Actual | | $ 1,000.00 | $ 1,054.30 | $ 11.36 |
HypotheticalA | | $ 1,000.00 | $ 1,014.08 | $ 11.14 |
International Value | 1.16% | | | |
Actual | | $ 1,000.00 | $ 1,060.20 | $ 6.01 |
HypotheticalA | | $ 1,000.00 | $ 1,019.30 | $ 5.89 |
Institutional Class | 1.13% | | | |
Actual | | $ 1,000.00 | $ 1,058.60 | $ 5.85 |
HypotheticalA | | $ 1,000.00 | $ 1,019.46 | $ 5.74 |
A 5% return per year before expenses
* Expenses are equal to each Class' annualized expense ratio, multiplied by the average account value over the period, multiplied by 184/366 (to reflect the one-half year period).
Annual Report
Investment Changes (Unaudited)
Geographic Diversification (% of fund's net assets) |
As of October 31, 2012 |
 | United Kingdom 26.3% | |
 | Japan 17.2% | |
 | Germany 10.3% | |
 | Switzerland 9.8% | |
 | France 9.8% | |
 | Australia 8.3% | |
 | Italy 3.3% | |
 | Netherlands 2.9% | |
 | Singapore 2.5% | |
| Other * 9.6% | |

* Includes short-term investments and net other assets (liabilities).
Percentages are based on country or territory of incorporation and are adjusted for the effect of futures contracts, if applicable. |
As of April 30, 2012 |
| United Kingdom 27.4% | |
| Japan 22.7% | |
| Germany 10.3% | |
| Switzerland 9.7% | |
| Australia 7.5% | |
| France 7.4% | |
| Netherlands 3.5% | |
| Italy 2.7% | |
| Spain 1.8% | |
| Other * 7.0% | |

* Includes short-term investments and net other assets (liabilities).
Percentages are based on country or territory of incorporation and are adjusted for the effect of futures contracts, if applicable. |
Asset Allocation |
| % of fund's
net assets | % of fund's net assets
6 months ago |
Stocks | 99.0 | 99.1 |
Short-Term Investments and Net Other Assets (Liabilities) | 1.0 | 0.9 |
Top Ten Stocks as of October 31, 2012 |
| % of fund's
net assets | % of fund's net assets
6 months ago |
Royal Dutch Shell PLC Class A sponsored ADR (United Kingdom, Oil, Gas & Consumable Fuels) | 4.6 | 5.1 |
Sanofi SA (France, Pharmaceuticals) | 3.5 | 3.2 |
Roche Holding AG (participation certificate) (Switzerland, Pharmaceuticals) | 3.0 | 3.8 |
Vodafone Group PLC (United Kingdom, Wireless Telecommunication Services) | 3.0 | 3.5 |
HSBC Holdings PLC sponsored ADR (United Kingdom, Commercial Banks) | 2.6 | 2.1 |
Commonwealth Bank of Australia (Australia, Commercial Banks) | 2.5 | 2.3 |
ENI SpA (Italy, Oil, Gas & Consumable Fuels) | 2.5 | 1.9 |
Australia & New Zealand Banking Group Ltd. (Australia, Commercial Banks) | 2.1 | 2.4 |
BHP Billiton PLC (United Kingdom, Metals & Mining) | 1.9 | 0.0 |
BNP Paribas SA (France, Commercial Banks) | 1.9 | 1.0 |
| 27.6 | |
Market Sectors as of October 31, 2012 |
| % of fund's
net assets | % of fund's net assets
6 months ago |
Financials | 32.5 | 26.7 |
Health Care | 11.9 | 13.2 |
Energy | 11.1 | 11.8 |
Consumer Discretionary | 8.6 | 9.0 |
Industrials | 7.7 | 7.5 |
Consumer Staples | 7.5 | 9.1 |
Telecommunication Services | 6.8 | 7.0 |
Utilities | 6.0 | 7.1 |
Materials | 5.6 | 5.0 |
Information Technology | 1.3 | 2.7 |
Annual Report
Investments October 31, 2012
Showing Percentage of Net Assets
Common Stocks - 97.7% |
| Shares | | Value |
Australia - 8.3% |
Australia & New Zealand Banking Group Ltd. | 110,422 | | $ 2,917,170 |
Commonwealth Bank of Australia | 57,527 | | 3,448,593 |
Origin Energy Ltd. | 46,320 | | 546,217 |
Sydney Airport unit | 236,028 | | 830,580 |
Telstra Corp. Ltd. | 279,594 | | 1,201,563 |
Transurban Group unit | 89,247 | | 563,269 |
Westfield Group unit | 136,805 | | 1,513,831 |
Woolworths Ltd. | 17,763 | | 542,288 |
TOTAL AUSTRALIA | | 11,563,511 |
Bailiwick of Jersey - 0.5% |
Wolseley PLC | 16,207 | | 708,513 |
Belgium - 0.2% |
KBC Groupe SA | 12,008 | | 281,867 |
Bermuda - 0.3% |
Cheung Kong Infrastructure Holdings Ltd. | 81,000 | | 474,500 |
Canada - 0.5% |
Suncor Energy, Inc. | 20,900 | | 701,445 |
Cayman Islands - 0.4% |
ENN Energy Holdings Ltd. | 148,000 | | 615,867 |
Finland - 0.7% |
Sampo OYJ (A Shares) | 33,034 | | 1,035,316 |
France - 9.8% |
Arkema SA | 9,139 | | 833,214 |
Atos Origin SA | 12,769 | | 857,483 |
BNP Paribas SA | 51,793 | | 2,605,373 |
Compagnie de St. Gobain | 20,100 | | 708,371 |
GDF Suez | 48,080 | | 1,103,356 |
Pernod Ricard SA | 6,700 | | 721,050 |
PPR SA | 3,642 | | 640,346 |
Sanofi SA | 55,722 | | 4,893,923 |
Schneider Electric SA | 7,500 | | 468,898 |
Unibail-Rodamco | 3,500 | | 788,675 |
TOTAL FRANCE | | 13,620,689 |
Germany - 9.0% |
Allianz AG | 19,369 | | 2,401,557 |
BASF AG | 9,769 | | 809,487 |
Bayer AG | 29,490 | | 2,568,235 |
Daimler AG (Germany) | 27,237 | | 1,271,799 |
Deutsche Post AG | 48,764 | | 966,727 |
Common Stocks - continued |
| Shares | | Value |
Germany - continued |
Fresenius SE & Co. KGaA | 7,100 | | $ 809,835 |
HeidelbergCement Finance AG | 13,393 | | 709,823 |
RWE AG | 28,200 | | 1,288,621 |
Siemens AG | 16,709 | | 1,683,582 |
TOTAL GERMANY | | 12,509,666 |
Hong Kong - 1.1% |
Cheung Kong Holdings Ltd. | 94,000 | | 1,388,765 |
Hysan Development Co. Ltd. | 35,000 | | 154,676 |
TOTAL HONG KONG | | 1,543,441 |
Italy - 3.3% |
ENI SpA | 148,500 | | 3,417,123 |
Fiat Industrial SpA | 37,600 | | 407,183 |
Saipem SpA | 16,432 | | 738,200 |
TOTAL ITALY | | 4,562,506 |
Japan - 17.2% |
Aeon Credit Service Co. Ltd. | 40,900 | | 867,902 |
Air Water, Inc. | 57,000 | | 714,017 |
Aozora Bank Ltd. | 160,000 | | 450,958 |
Astellas Pharma, Inc. | 33,100 | | 1,644,012 |
Chubu Electric Power Co., Inc. | 45,400 | | 468,047 |
Credit Saison Co. Ltd. | 29,800 | | 654,383 |
Denso Corp. | 29,700 | | 929,729 |
Hitachi Ltd. | 195,000 | | 1,033,258 |
Honda Motor Co. Ltd. | 60,900 | | 1,830,852 |
INPEX Corp. | 80 | | 455,969 |
Itochu Corp. | 74,300 | | 743,652 |
Japan Retail Fund Investment Corp. | 322 | | 586,885 |
Japan Tobacco, Inc. | 49,400 | | 1,365,106 |
JSR Corp. | 34,600 | | 592,920 |
Mitsubishi Corp. | 52,600 | | 938,933 |
Mitsubishi Estate Co. Ltd. | 56,000 | | 1,107,654 |
Nippon Telegraph & Telephone Corp. | 14,500 | | 663,058 |
ORIX Corp. | 7,800 | | 801,203 |
Santen Pharmaceutical Co. Ltd. | 16,100 | | 704,867 |
Seven & i Holdings Co., Ltd. | 61,300 | | 1,890,525 |
Seven Bank Ltd. | 237,800 | | 679,173 |
Softbank Corp. | 24,200 | | 766,045 |
Sumitomo Mitsui Financial Group, Inc. | 79,100 | | 2,417,059 |
Sumitomo Realty & Development Co. Ltd. | 24,000 | | 662,608 |
Common Stocks - continued |
| Shares | | Value |
Japan - continued |
Toyo Suisan Kaisha Ltd. | 21,000 | | $ 523,224 |
USS Co. Ltd. | 4,950 | | 520,237 |
TOTAL JAPAN | | 24,012,276 |
Netherlands - 2.9% |
ING Groep NV (Certificaten Van Aandelen) (a) | 185,100 | | 1,647,045 |
Koninklijke Philips Electronics NV | 44,813 | | 1,122,389 |
Unilever NV (Certificaten Van Aandelen) (Bearer) (d) | 33,231 | | 1,221,393 |
TOTAL NETHERLANDS | | 3,990,827 |
Norway - 1.1% |
Orkla ASA (A Shares) | 62,718 | | 496,129 |
Telenor ASA | 55,400 | | 1,089,285 |
TOTAL NORWAY | | 1,585,414 |
Singapore - 2.5% |
Ascendas Real Estate Investment Trust | 370,000 | | 715,855 |
ComfortDelgro Corp. Ltd. | 322,000 | | 446,122 |
Singapore Telecommunications Ltd. | 319,000 | | 842,089 |
United Overseas Bank Ltd. | 95,480 | | 1,430,087 |
TOTAL SINGAPORE | | 3,434,153 |
Spain - 2.1% |
Banco Bilbao Vizcaya Argentaria SA sponsored ADR | 235,732 | | 1,956,576 |
Repsol YPF SA | 51,674 | | 1,032,789 |
TOTAL SPAIN | | 2,989,365 |
Sweden - 1.0% |
Svenska Handelsbanken AB (A Shares) | 39,700 | | 1,359,864 |
Switzerland - 9.8% |
Nestle SA | 40,121 | | 2,546,066 |
Roche Holding AG (participation certificate) | 21,838 | | 4,199,706 |
Swisscom AG | 2,015 | | 837,113 |
Syngenta AG (Switzerland) | 3,805 | | 1,483,530 |
UBS AG (NY Shares) | 170,471 | | 2,560,474 |
Zurich Financial Services AG | 8,244 | | 2,031,567 |
TOTAL SWITZERLAND | | 13,658,456 |
United Kingdom - 26.3% |
Barclays PLC | 497,760 | | 1,840,585 |
BHP Billiton PLC | 81,621 | | 2,616,056 |
BP PLC sponsored ADR | 51,735 | | 2,218,914 |
British American Tobacco PLC (United Kingdom) | 20,547 | | 1,019,123 |
Common Stocks - continued |
| Shares | | Value |
United Kingdom - continued |
British Land Co. PLC | 103,823 | | $ 885,472 |
Bunzl PLC | 53,625 | | 887,008 |
Centrica PLC | 243,703 | | 1,274,607 |
Compass Group PLC | 114,100 | | 1,252,076 |
GlaxoSmithKline PLC sponsored ADR | 35,885 | | 1,611,237 |
HSBC Holdings PLC sponsored ADR | 74,201 | | 3,662,561 |
Imperial Tobacco Group PLC | 15,487 | | 584,816 |
Kingfisher PLC | 141,328 | | 660,257 |
Legal & General Group PLC | 561,996 | | 1,215,274 |
National Grid PLC | 167,609 | | 1,911,507 |
Next PLC | 11,500 | | 661,783 |
Prudential PLC | 82,740 | | 1,136,318 |
Reed Elsevier PLC | 129,874 | | 1,270,080 |
Royal Dutch Shell PLC Class A sponsored ADR | 92,447 | | 6,330,767 |
Scottish & Southern Energy PLC | 61,534 | | 1,437,871 |
Vodafone Group PLC sponsored ADR | 153,508 | | 4,178,488 |
TOTAL UNITED KINGDOM | | 36,654,800 |
United States of America - 0.7% |
Virgin Media, Inc. | 27,467 | | 902,454 |
TOTAL COMMON STOCKS (Cost $135,187,370) |
136,204,930
|
Nonconvertible Preferred Stocks - 1.3% |
| | | |
Germany - 1.3% |
ProSiebenSat.1 Media AG | 25,880 | | 721,204 |
Volkswagen AG | 5,327 | | 1,101,973 |
TOTAL NONCONVERTIBLE PREFERRED STOCKS (Cost $1,562,166) |
1,823,177
|
Money Market Funds - 1.2% |
| Shares | | Value |
Fidelity Cash Central Fund, 0.19% (b) | 918,421 | | $ 918,421 |
Fidelity Securities Lending Cash Central Fund, 0.19% (b)(c) | 752,220 | | 752,220 |
TOTAL MONEY MARKET FUNDS (Cost $1,670,641) |
1,670,641
|
TOTAL INVESTMENT PORTFOLIO - 100.2% (Cost $138,420,177) | 139,698,748 |
NET OTHER ASSETS (LIABILITIES) - (0.2)% | (220,612) |
NET ASSETS - 100% | $ 139,478,136 |
Legend |
(a) Non-income producing |
(b) Affiliated fund that is available only to investment companies and other accounts managed by Fidelity Investments. The rate quoted is the annualized seven-day yield of the fund at period end. A complete unaudited listing of the fund's holdings as of its most recent quarter end is available upon request. In addition, each Fidelity Central Fund's financial statements, which are not covered by the Fund's Report of Independent Registered Public Accounting Firm, are available on the SEC's website or upon request. |
(c) Investment made with cash collateral received from securities on loan. |
(d) Security or a portion of the security is on loan at period end. |
Affiliated Central Funds |
Information regarding fiscal year to date income earned by the Fund from investments in Fidelity Central Funds is as follows: |
Fund | Income earned |
Fidelity Cash Central Fund | $ 558 |
Fidelity Securities Lending Cash Central Fund | 188,349 |
Total | $ 188,907 |
Other Information |
Categorizations in the Schedule of Investments are based on country or territory of incorporation. |
The following is a summary of the inputs used, as of October 31, 2012, involving the Fund's assets and liabilities carried at fair value. The inputs or methodology used for valuing securities may not be an indication of the risk associated with investing in those securities. For more information on valuation inputs, and their aggregation into the levels used in the tables below, please refer to the Security Valuation section in the accompanying Notes to Financial Statements. |
Valuation Inputs at Reporting Date: |
Description | Total | Level 1 | Level 2 | Level 3 |
Investments in Securities: | | | | |
Equities: | | | | |
Consumer Discretionary | $ 11,762,790 | $ 9,931,938 | $ 1,830,852 | $ - |
Consumer Staples | 10,413,591 | 8,173,075 | 2,240,516 | - |
Energy | 15,441,424 | 12,024,301 | 3,417,123 | - |
Financials | 45,205,326 | 38,164,319 | 7,041,007 | - |
Health Care | 16,431,815 | 11,537,892 | 4,893,923 | - |
Industrials | 10,971,356 | 8,165,385 | 2,805,971 | - |
Information Technology | 1,890,741 | 1,890,741 | - | - |
Materials | 7,759,047 | 3,659,461 | 4,099,586 | - |
Telecommunication Services | 9,577,641 | 8,914,583 | 663,058 | - |
Utilities | 8,574,376 | 6,662,869 | 1,911,507 | - |
Money Market Funds | 1,670,641 | 1,670,641 | - | - |
Total Investments in Securities: | $ 139,698,748 | $ 110,795,205 | $ 28,903,543 | $ - |
The following is a summary of transfers between Level 1 and Level 2 for the period ended October 31, 2012. Transfers are assumed to have occurred at the beginning of the period, and are primarily attributable to the valuation techniques used for foreign equity securities, as discussed in the accompanying Notes to Financial Statements: |
Transfers | Total |
Level 1 to Level 2 | $ 0 |
Level 2 to Level 1 | $ 30,093,824 |
See accompanying notes which are an integral part of the financial statements.
Annual Report
Statement of Assets and Liabilities
| October 31, 2012 |
| | |
Assets | | |
Investment in securities, at value (including securities loaned of $730,981) - See accompanying schedule: Unaffiliated issuers (cost $136,749,536) | $ 138,028,107 | |
Fidelity Central Funds (cost $1,670,641) | 1,670,641 | |
Total Investments (cost $138,420,177) | | $ 139,698,748 |
Cash | | 25,252 |
Receivable for investments sold | | 490,430 |
Receivable for fund shares sold | | 141,722 |
Dividends receivable | | 555,670 |
Distributions receivable from Fidelity Central Funds | | 1,693 |
Other receivables | | 8,173 |
Total assets | | 140,921,688 |
| | |
Liabilities | | |
Payable to custodian bank | $ 1,519 | |
Payable for investments purchased | 329,190 | |
Payable for fund shares redeemed | 173,709 | |
Accrued management fee | 85,006 | |
Distribution and service plan fees payable | 4,529 | |
Other affiliated payables | 33,818 | |
Other payables and accrued expenses | 63,561 | |
Collateral on securities loaned, at value | 752,220 | |
Total liabilities | | 1,443,552 |
| | |
Net Assets | | $ 139,478,136 |
Net Assets consist of: | | |
Paid in capital | | $ 258,984,945 |
Undistributed net investment income | | 3,836,975 |
Accumulated undistributed net realized gain (loss) on investments and foreign currency transactions | | (124,613,392) |
Net unrealized appreciation (depreciation) on investments and assets and liabilities in foreign currencies | | 1,269,608 |
Net Assets | | $ 139,478,136 |
See accompanying notes which are an integral part of the financial statements.
Annual Report
Financial Statements - continued
Statement of Assets and Liabilities - continued
| October 31, 2012 |
| | |
Calculation of Maximum Offering Price
Class A:
Net Asset Value and redemption price per share
($4,490,817 ÷ 607,664 shares) | | $ 7.39 |
| | |
Maximum offering price per share (100/94.25 of $7.39) | | $ 7.84 |
Class T:
Net Asset Value and redemption price per share ($2,692,907 ÷ 364,932 shares) | | $ 7.38 |
| | |
Maximum offering price per share (100/96.50 of $7.38) | | $ 7.65 |
Class B:
Net Asset Value and offering price per share ($691,141 ÷ 93,508 shares)A | | $ 7.39 |
| | |
Class C:
Net Asset Value and offering price per share ($2,248,556 ÷ 304,873 shares)A | | $ 7.38 |
| | |
International Value:
Net Asset Value, offering price and redemption price per share ($128,983,126 ÷ 17,438,274 shares) | | $ 7.40 |
| | |
Institutional Class:
Net Asset Value, offering price and redemption price per share ($371,589 ÷ 50,137 shares) | | $ 7.41 |
A Redemption price per share is equal to net asset value less any applicable contingent deferred sales charge.
See accompanying notes which are an integral part of the financial statements.
Annual Report
Statement of Operations
| Year ended October 31, 2012 |
| | |
Investment Income | | |
Dividends | | $ 6,445,326 |
Income from Fidelity Central Funds | | 188,907 |
Income before foreign taxes withheld | | 6,634,233 |
Less foreign taxes withheld | | (488,192) |
Total income | | 6,146,041 |
| | |
Expenses | | |
Management fee
Basic fee | $ 1,023,931 | |
Performance adjustment | (61,752) | |
Transfer agent fees | 355,462 | |
Distribution and service plan fees | 52,465 | |
Accounting and security lending fees | 76,123 | |
Custodian fees and expenses | 102,964 | |
Independent trustees' compensation | 963 | |
Registration fees | 72,448 | |
Audit | 63,728 | |
Legal | 772 | |
Miscellaneous | 1,645 | |
Total expenses before reductions | 1,688,749 | |
Expense reductions | (46,878) | 1,641,871 |
Net investment income (loss) | | 4,504,170 |
Realized and Unrealized Gain (Loss) Net realized gain (loss) on: | | |
Investment securities: | | |
Unaffiliated issuers | (6,001,087) | |
Foreign currency transactions | (21,483) | |
Total net realized gain (loss) | | (6,022,570) |
Change in net unrealized appreciation (depreciation) on: Investment securities | 12,847,185 | |
Assets and liabilities in foreign currencies | (19,483) | |
Total change in net unrealized appreciation (depreciation) | | 12,827,702 |
Net gain (loss) | | 6,805,132 |
Net increase (decrease) in net assets resulting from operations | | $ 11,309,302 |
See accompanying notes which are an integral part of the financial statements.
Annual Report
Financial Statements - continued
Statement of Changes in Net Assets
| Year ended
October 31,
2012 | Year ended
October 31,
2011 |
Increase (Decrease) in Net Assets | | |
Operations | | |
Net investment income (loss) | $ 4,504,170 | $ 5,953,007 |
Net realized gain (loss) | (6,022,570) | (31,214,422) |
Change in net unrealized appreciation (depreciation) | 12,827,702 | (382,882) |
Net increase (decrease) in net assets resulting
from operations | 11,309,302 | (25,644,297) |
Distributions to shareholders from net investment income | (5,463,877) | (4,441,935) |
Distributions to shareholders from net realized gain | - | (710,581) |
Total distributions | (5,463,877) | (5,152,516) |
Share transactions - net increase (decrease) | (27,953,937) | 18,454,243 |
Redemption fees | 2,109 | 3,151 |
Total increase (decrease) in net assets | (22,106,403) | (12,339,419) |
| | |
Net Assets | | |
Beginning of period | 161,584,539 | 173,923,958 |
End of period (including undistributed net investment income of $3,836,975 and undistributed net investment income of $4,796,682, respectively) | $ 139,478,136 | $ 161,584,539 |
See accompanying notes which are an integral part of the financial statements.
Annual Report
Financial Highlights - Class A
Years ended October 31, | 2012 | 2011 | 2010 | 2009 | 2008 |
Selected Per-Share Data | | | | | |
Net asset value, beginning of period | $ 7.02 | $ 8.22 | $ 7.75 | $ 5.93 | $ 13.02 |
Income from Investment Operations | | | | | |
Net investment income (loss) C | .20 | .22 | .15 | .12 | .21 |
Net realized and unrealized gain (loss) | .39 | (1.19) | .44 | 1.78 | (6.53) |
Total from investment operations | .59 | (.97) | .59 | 1.90 | (6.32) |
Distributions from net investment income | (.22) | (.19) | (.11) | (.08) | (.15) |
Distributions from net realized gain | - | (.03) | (.01) | - | (.62) |
Total distributions | (.22) | (.23) H | (.12) | (.08) | (.77) |
Redemption fees added to paid in capital C,G | - | - | - | - | - |
Net asset value, end of period | $ 7.39 | $ 7.02 | $ 8.22 | $ 7.75 | $ 5.93 |
Total Return A,B | 8.82% | (12.19)% | 7.60% | 32.71% | (51.50)% |
Ratios to Average Net Assets D,F | | | | | |
Expenses before reductions | 1.44% | 1.36% | 1.40% | 1.34% | 1.42% |
Expenses net of fee waivers, if any | 1.44% | 1.36% | 1.40% | 1.34% | 1.42% |
Expenses net of all reductions | 1.41% | 1.34% | 1.38% | 1.32% | 1.41% |
Net investment income (loss) | 2.85% | 2.79% | 1.93% | 1.86% | 2.05% |
Supplemental Data | | | | | |
Net assets, end of period (000 omitted) | $ 4,491 | $ 4,668 | $ 4,699 | $ 4,456 | $ 2,854 |
Portfolio turnover rate E | 74% | 83% | 43% | 46% | 68% |
A Total returns would have been lower if certain expenses had not been reduced during the applicable periods shown.
B Total returns do not include the effect of the sales charges.
C Calculated based on average shares outstanding during the period.
D Fees and expenses of any underlying Fidelity Central Funds are not included in the Fund's expense ratio. The Fund indirectly bears its proportionate share of the expenses of any underlying Fidelity Central Funds.
E Amount does not include the portfolio activity of any underlying Fidelity Central Funds.
F Expense ratios reflect operating expenses of the class. Expenses before reductions do not reflect amounts reimbursed by the investment adviser or reductions from brokerage service arrangements or reductions from other expense offset arrangements and do not represent the amount paid by the class during periods when reimbursements or reductions occur. Expenses net of fee waivers reflect expenses after reimbursement by the investment adviser but prior to reductions from brokerage service arrangements or other expense offset arrangements. Expenses net of all reductions represent the net expenses paid by the class.
G Amount represents less than $.01 per share.
H Total distributions of $.23 per share is comprised of distributions from net investment income of $.191 and distributions from net realized gain of $.034 per share.
See accompanying notes which are an integral part of the financial statements.
Annual Report
Financial Highlights - Class T
Years ended October 31, | 2012 | 2011 | 2010 | 2009 | 2008 |
Selected Per-Share Data | | | | | |
Net asset value, beginning of period | $ 7.00 | $ 8.20 | $ 7.73 | $ 5.91 | $ 12.99 |
Income from Investment Operations | | | | | |
Net investment income (loss) C | .18 | .20 | .13 | .10 | .18 |
Net realized and unrealized gain (loss) | .40 | (1.19) | .44 | 1.77 | (6.50) |
Total from investment operations | .58 | (.99) | .57 | 1.87 | (6.32) |
Distributions from net investment income | (.20) | (.17) | (.09) | (.05) | (.14) |
Distributions from net realized gain | - | (.03) | (.01) | - | (.62) |
Total distributions | (.20) | (.21) H | (.10) | (.05) | (.76) |
Redemption fees added to paid in capital C,G | - | - | - | - | - |
Net asset value, end of period | $ 7.38 | $ 7.00 | $ 8.20 | $ 7.73 | $ 5.91 |
Total Return A,B | 8.60% | (12.42)% | 7.32% | 32.14% | (51.60)% |
Ratios to Average Net Assets D,F | | | | | |
Expenses before reductions | 1.71% | 1.63% | 1.67% | 1.60% | 1.67% |
Expenses net of fee waivers, if any | 1.70% | 1.62% | 1.67% | 1.60% | 1.67% |
Expenses net of all reductions | 1.67% | 1.60% | 1.65% | 1.59% | 1.66% |
Net investment income (loss) | 2.58% | 2.52% | 1.65% | 1.59% | 1.80% |
Supplemental Data | | | | | |
Net assets, end of period (000 omitted) | $ 2,693 | $ 2,468 | $ 2,276 | $ 2,395 | $ 2,087 |
Portfolio turnover rate E | 74% | 83% | 43% | 46% | 68% |
A Total returns would have been lower if certain expenses had not been reduced during the applicable periods shown.
B Total returns do not include the effect of the sales charges.
C Calculated based on average shares outstanding during the period.
D Fees and expenses of any underlying Fidelity Central Funds are not included in the Fund's expense ratio. The Fund indirectly bears its proportionate share of the expenses of any underlying Fidelity Central Funds.
E Amount does not include the portfolio activity of any underlying Fidelity Central Funds.
F Expense ratios reflect operating expenses of the class. Expenses before reductions do not reflect amounts reimbursed by the investment adviser or reductions from brokerage service arrangements or reductions from other expense offset arrangements and do not represent the amount paid by the class during periods when reimbursements or reductions occur. Expenses net of fee waivers reflect expenses after reimbursement by the investment adviser but prior to reductions from brokerage service arrangements or other expense offset arrangements. Expenses net of all reductions represent the net expenses paid by the class.
G Amount represents less than $.01 per share.
H Total distributions of $.21 per share is comprised of distributions from net investment income of $.173 and distributions from net realized gain of $.034 per share.
See accompanying notes which are an integral part of the financial statements.
Annual Report
Financial Highlights - Class B
Years ended October 31, | 2012 | 2011 | 2010 | 2009 | 2008 |
Selected Per-Share Data | | | | | |
Net asset value, beginning of period | $ 7.00 | $ 8.20 | $ 7.74 | $ 5.88 | $ 12.93 |
Income from Investment Operations | | | | | |
Net investment income (loss) C | .14 | .17 | .09 | .07 | .13 |
Net realized and unrealized gain (loss) | .41 | (1.20) | .44 | 1.79 | (6.48) |
Total from investment operations | .55 | (1.03) | .53 | 1.86 | (6.35) |
Distributions from net investment income | (.16) | (.13) | (.06) | - | (.08) |
Distributions from net realized gain | - | (.03) | (.01) | - | (.62) |
Total distributions | (.16) | (.17) H | (.07) | - | (.70) |
Redemption fees added to paid in capital C,G | - | - | - | - | - |
Net asset value, end of period | $ 7.39 | $ 7.00 | $ 8.20 | $ 7.74 | $ 5.88 |
Total Return A,B | 8.07% | (12.88)% | 6.82% | 31.63% | (51.85)% |
Ratios to Average Net Assets D,F | | | | | |
Expenses before reductions | 2.19% | 2.11% | 2.15% | 2.08% | 2.18% |
Expenses net of fee waivers, if any | 2.19% | 2.11% | 2.15% | 2.08% | 2.18% |
Expenses net of all reductions | 2.16% | 2.09% | 2.13% | 2.07% | 2.17% |
Net investment income (loss) | 2.09% | 2.04% | 1.18% | 1.11% | 1.29% |
Supplemental Data | | | | | |
Net assets, end of period (000 omitted) | $ 691 | $ 901 | $ 1,216 | $ 1,076 | $ 931 |
Portfolio turnover rate E | 74% | 83% | 43% | 46% | 68% |
A Total returns would have been lower if certain expenses had not been reduced during the applicable periods shown.
B Total returns do not include the effect of the contingent deferred sales charge.
C Calculated based on average shares outstanding during the period.
D Fees and expenses of any underlying Fidelity Central Funds are not included in the Fund's expense ratio. The Fund indirectly bears its proportionate share of the expenses of any underlying Fidelity Central Funds.
E Amount does not include the portfolio activity of any underlying Fidelity Central Funds.
F Expense ratios reflect operating expenses of the class. Expenses before reductions do not reflect amounts reimbursed by the investment adviser or reductions from brokerage service arrangements or reductions from other expense offset arrangements and do not represent the amount paid by the class during periods when reimbursements or reductions occur. Expenses net of fee waivers reflect expenses after reimbursement by the investment adviser but prior to reductions from brokerage service arrangements or other expense offset arrangements. Expenses net of all reductions represent the net expenses paid by the class.
G Amount represents less than $.01 per share.
H Total distributions of $.17 per share is comprised of distributions from net investment income of $.131 and distributions from net realized gain of $.034 per share.
See accompanying notes which are an integral part of the financial statements.
Annual Report
Financial Highlights - Class C
Years ended October 31, | 2012 | 2011 | 2010 | 2009 | 2008 |
Selected Per-Share Data | | | | | |
Net asset value, beginning of period | $ 7.00 | $ 8.20 | $ 7.73 | $ 5.88 | $ 12.92 |
Income from Investment Operations | | | | | |
Net investment income (loss) C | .14 | .16 | .09 | .07 | .13 |
Net realized and unrealized gain (loss) | .41 | (1.19) | .44 | 1.78 | (6.47) |
Total from investment operations | .55 | (1.03) | .53 | 1.85 | (6.34) |
Distributions from net investment income | (.17) | (.14) | (.05) | - | (.08) |
Distributions from net realized gain | - | (.03) | (.01) | - | (.62) |
Total distributions | (.17) | (.17) | (.06) | - | (.70) |
Redemption fees added to paid in capital C,G | - | - | - | - | - |
Net asset value, end of period | $ 7.38 | $ 7.00 | $ 8.20 | $ 7.73 | $ 5.88 |
Total Return A,B | 8.12% | (12.84)% | 6.84% | 31.46% | (51.80)% |
Ratios to Average Net Assets D,F | | | | | |
Expenses before reductions | 2.19% | 2.12% | 2.15% | 2.08% | 2.17% |
Expenses net of fee waivers, if any | 2.19% | 2.11% | 2.15% | 2.08% | 2.17% |
Expenses net of all reductions | 2.16% | 2.09% | 2.13% | 2.06% | 2.16% |
Net investment income (loss) | 2.09% | 2.04% | 1.18% | 1.12% | 1.30% |
Supplemental Data | | | | | |
Net assets, end of period (000 omitted) | $ 2,249 | $ 2,108 | $ 2,123 | $ 2,108 | $ 1,784 |
Portfolio turnover rate E | 74% | 83% | 43% | 46% | 68% |
A Total returns would have been lower if certain expenses had not been reduced during the applicable periods shown.
B Total returns do not include the effect of the contingent deferred sales charge.
C Calculated based on average shares outstanding during the period.
D Fees and expenses of any underlying Fidelity Central Funds are not included in the Fund's expense ratio. The Fund indirectly bears its proportionate share of the expenses of any underlying Fidelity Central Funds.
E Amount does not include the portfolio activity of any underlying Fidelity Central Funds.
F Expense ratios reflect operating expenses of the class. Expenses before reductions do not reflect amounts reimbursed by the investment adviser or reductions from brokerage service arrangements or reductions from other expense offset arrangements and do not represent the amount paid by the class during periods when reimbursements or reductions occur. Expenses net of fee waivers reflect expenses after reimbursement by the investment adviser but prior to reductions from brokerage service arrangements or other expense offset arrangements. Expenses net of all reductions represent the net expenses paid by the class.
G Amount represents less than $.01 per share.
See accompanying notes which are an integral part of the financial statements.
Annual Report
Financial Highlights - International Value
Years ended October 31, | 2012 | 2011 | 2010 | 2009 | 2008 |
Selected Per-Share Data | | | | | |
Net asset value, beginning of period | $ 7.03 | $ 8.23 | $ 7.75 | $ 5.95 | $ 13.06 |
Income from Investment Operations | | | | | |
Net investment income (loss) B | .22 | .25 | .17 | .13 | .24 |
Net realized and unrealized gain (loss) | .40 | (1.20) | .44 | 1.78 | (6.54) |
Total from investment operations | .62 | (.95) | .61 | 1.91 | (6.30) |
Distributions from net investment income | (.25) | (.22) | (.13) | (.11) | (.19) |
Distributions from net realized gain | - | (.03) | (.01) | - | (.62) |
Total distributions | (.25) | (.25) | (.13) G | (.11) | (.81) |
Redemption fees added to paid in capital B,F | - | - | - | - | - |
Net asset value, end of period | $ 7.40 | $ 7.03 | $ 8.23 | $ 7.75 | $ 5.95 |
Total Return A | 9.19% | (11.91)% | 7.95% | 33.09% | (51.34)% |
Ratios to Average Net Assets C,E | | | | | |
Expenses before reductions | 1.13% | 1.04% | 1.09% | 1.07% | 1.10% |
Expenses net of fee waivers, if any | 1.13% | 1.03% | 1.09% | 1.07% | 1.10% |
Expenses net of all reductions | 1.10% | 1.01% | 1.08% | 1.06% | 1.09% |
Net investment income (loss) | 3.16% | 3.11% | 2.23% | 2.12% | 2.37% |
Supplemental Data | | | | | |
Net assets, end of period (000 omitted) | $ 128,983 | $ 150,967 | $ 163,090 | $ 180,447 | $ 160,777 |
Portfolio turnover rate D | 74% | 83% | 43% | 46% | 68% |
A Total returns would have been lower if certain expenses had not been reduced during the applicable periods shown.
B Calculated based on average shares outstanding during the period.
C Fees and expenses of any underlying Fidelity Central Funds are not included in the Fund's expense ratio. The Fund indirectly bears its proportionate share of the expenses of any underlying Fidelity Central Funds.
D Amount does not include the portfolio activity of any underlying Fidelity Central Funds.
E Expense ratios reflect operating expenses of the class. Expenses before reductions do not reflect amounts reimbursed by the investment adviser or reductions from brokerage service arrangements or reductions from other expense offset arrangements and do not represent the amount paid by the class during periods when reimbursements or reductions occur. Expenses net of fee waivers reflect expenses after reimbursement by the investment adviser but prior to reductions from brokerage service arrangements or other expense offset arrangements. Expenses net of all reductions represent the net expenses paid by the class.
F Amount represents less than $.01 per share.
G Total distributions of $.13 per share is comprised of distributions from net investment income of $.129 and distributions from net realized gain of $.005 per share.
See accompanying notes which are an integral part of the financial statements.
Annual Report
Financial Highlights - Institutional Class
Years ended October 31, | 2012 | 2011 | 2010 | 2009 | 2008 |
Selected Per-Share Data | | | | | |
Net asset value, beginning of period | $ 7.04 | $ 8.24 | $ 7.76 | $ 5.96 | $ 13.07 |
Income from Investment Operations | | | | | |
Net investment income (loss) B | .22 | .25 | .18 | .14 | .25 |
Net realized and unrealized gain (loss) | .40 | (1.19) | .44 | 1.78 | (6.54) |
Total from investment operations | .62 | (.94) | .62 | 1.92 | (6.29) |
Distributions from net investment income | (.25) | (.22) | (.14) | (.12) | (.20) |
Distributions from net realized gain | - | (.03) | (.01) | - | (.62) |
Total distributions | (.25) | (.26) H | (.14) G | (.12) | (.82) |
Redemption fees added to paid in capital B,F | - | - | - | - | - |
Net asset value, end of period | $ 7.41 | $ 7.04 | $ 8.24 | $ 7.76 | $ 5.96 |
Total Return A | 9.22% | (11.83)% | 8.05% | 33.06% | (51.27)% |
Ratios to Average Net Assets C,E | | | | | |
Expenses before reductions | 1.10% | .98% | .98% | .93% | 1.02% |
Expenses net of fee waivers, if any | 1.10% | .98% | .98% | .93% | 1.02% |
Expenses net of all reductions | 1.07% | .96% | .97% | .92% | 1.01% |
Net investment income (loss) | 3.18% | 3.17% | 2.34% | 2.26% | 2.45% |
Supplemental Data | | | | | |
Net assets, end of period (000 omitted) | $ 372 | $ 473 | $ 519 | $ 814 | $ 1,052 |
Portfolio turnover rate D | 74% | 83% | 43% | 46% | 68% |
A Total returns would have been lower if certain expenses had not been reduced during the applicable periods shown.
B Calculated based on average shares outstanding during the period.
C Fees and expenses of any underlying Fidelity Central Funds are not included in the Fund's expense ratio. The Fund indirectly bears its proportionate share of the expenses of any underlying Fidelity Central Funds.
D Amount does not include the portfolio activity of any underlying Fidelity Central Funds.
E Expense ratios reflect operating expenses of the class. Expenses before reductions do not reflect amounts reimbursed by the investment adviser or reductions from brokerage service arrangements or reductions from other expense offset arrangements and do not represent the amount paid by the class during periods when reimbursements or reductions occur. Expenses net of fee waivers reflect expenses after reimbursement by the investment adviser but prior to reductions from brokerage service arrangements or other expense offset arrangements. Expenses net of all reductions represent the net expenses paid by the class.
F Amount represents less than $.01 per share.
G Total distributions of $.14 per share is comprised of distributions from net investment income of $.137 and distributions from net realized gain of $.005 per share.
H Total distributions of $.26 per share is comprised of distributions from net investment income of $.221 and distributions from net realized gain of $.034 per share.
See accompanying notes which are an integral part of the financial statements.
Annual Report
Notes to Financial Statements
For the period ended October 31, 2012
1. Organization.
Fidelity® International Value Fund (the Fund) is a fund of Fidelity Investment Trust (the Trust) and is authorized to issue an unlimited number of shares. The Trust is registered under the Investment Company Act of 1940, as amended (the 1940 Act), as an open-end management investment company organized as a Massachusetts business trust. The Fund offers Class A, Class T, Class C, International Value and Institutional Class shares, each of which, along with Class B shares, has equal rights as to assets and voting privileges. Effective after the close of business on September 1, 2010, Class B shares were closed to new accounts and additional purchases, except for exchanges and reinvestments. Each class has exclusive voting rights with respect to matters that affect that class. Class B shares will automatically convert to Class A shares after a holding period of seven years from the initial date of purchase. Investment income, realized and unrealized capital gains and losses, the common expenses of the Fund, and certain fund-level expense reductions, if any, are allocated on a pro-rata basis to each class based on the relative net assets of each class to the total net assets of the Fund. Each class differs with respect to transfer agent and distribution and service plan fees incurred. Certain expense reductions may also differ by class.
2. Investments in Fidelity Central Funds.
The Fund invests in Fidelity Central Funds, which are open-end investment companies available only to other investment companies and accounts managed by Fidelity Management & Research Company (FMR) and its affiliates. The Fund's Schedule of Investments lists each of the Fidelity Central Funds held as of period end, if any, as an investment of the Fund, but does not include the underlying holdings of each Fidelity Central Fund. As an Investing Fund, the Fund indirectly bears its proportionate share of the expenses of the underlying Fidelity Central Funds.
The Money Market Central Funds seek preservation of capital and current income and are managed by Fidelity Investments Money Management, Inc. (FIMM), an affiliate of FMR.
A complete unaudited list of holdings for each Fidelity Central Fund is available upon request or at the Securities and Exchange Commission (the SEC) web site at www.sec.gov. In addition, the financial statements of the Fidelity Central Funds, which are not covered by the Fund's Report of Independent Registered Public Accounting Firm, are available on the SEC web site or upon request.
Annual Report
Notes to Financial Statements - continued
3. Significant Accounting Policies.
The financial statements have been prepared in conformity with accounting principles generally accepted in the United States of America (GAAP), which require management to make certain estimates and assumptions at the date of the financial statements. Actual results could differ from those estimates. Subsequent events, if any, through the date that the financial statements were issued have been evaluated in the preparation of the financial statements. The following summarizes the significant accounting policies of the Fund:
Security Valuation. Investments are valued as of 4:00 p.m. Eastern time on the last calendar day of the period. In accordance with valuation policies and procedures approved by the Board of Trustees (the Board), the Fund attempts to obtain prices from one or more third party pricing vendors or brokers to value its investments. When current market prices, quotations or rates are not readily available or reliable, securities will be fair valued in good faith by the FMR Fair Value Committee (the Committee), in accordance with procedures adopted by the Fund's Board. Factors used in determining fair value vary by security type and may include market or security specific events. The frequency with which these procedures are used cannot be predicted and they may be utilized to a significant extent. The Committee oversees the Fund's valuation policies and procedures and is responsible for approving and reporting to the Board all fair value determinations.
The Fund categorizes the inputs to valuation techniques used to value its investments into a disclosure hierarchy consisting of three levels as shown below:
Level 1 - quoted prices in active markets for identical investments
Level 2 - other significant observable inputs (including quoted prices for similar investments, interest rates, prepayment speeds, etc.)
Level 3 - unobservable inputs (including the Fund's own assumptions based on the best information available)
Valuation techniques used to value the Fund's investments by major category are as follows:
Equity securities, including restricted securities, for which market quotations are readily available, are valued at the last reported sale price or official closing price as reported by a third party pricing vendor on the primary market or exchange on which they are traded and are categorized as Level 1 in the hierarchy. In the event there were no sales during the day or closing prices are not available, securities are valued at the last quoted bid price or may be valued using the last available price and are generally categorized as
Annual Report
3. Significant Accounting Policies - continued
Security Valuation - continued
Level 2 in the hierarchy. For foreign equity securities, when significant market or security specific events arise, comparisons to the valuation of American Depositary Receipts (ADRs), futures contracts, Exchange-Traded Funds (ETFs) and certain indexes as well as quoted prices for similar securities are used and are categorized as Level 2 in the hierarchy. Utilizing these techniques may result in transfers between Level 1 and Level 2.
Investments in open-end mutual funds, including the Fidelity Central Funds, are valued at their closing net asset value (NAV) each business day and are categorized as Level 1 in the hierarchy.
Changes in valuation techniques may result in transfers in or out of an assigned level within the disclosure hierarchy. The aggregate value of investments by input level, as of October 31, 2012, including information on transfers between Levels 1 and 2, is included at the end of the Fund's Schedule of Investments.
Foreign Currency Translation. The Fund may use foreign currency contracts to facilitate transactions in foreign-denominated securities. Gains and losses from these transactions may arise from changes in the value of the foreign currency or if the counterparties do not perform under the contracts' terms.
Foreign-denominated assets, including investment securities, and liabilities are translated into U.S. dollars at the exchange rates at period end. Purchases and sales of investment securities, income and dividends received and expenses denominated in foreign currencies are translated into U.S. dollars at the exchange rate in effect on the transaction date.
The effects of exchange rate fluctuations on investments are included with the net realized and unrealized gain (loss) on investment securities. Other foreign currency transactions resulting in realized and unrealized gain (loss) are disclosed separately.
Investment Transactions and Income. For financial reporting purposes, the Fund's investment holdings and NAV include trades executed through the end of the last business day of the period. The NAV per share for processing shareholder transactions is calculated as of the close of business of the New York Stock Exchange (NYSE), normally 4:00 p.m. Eastern time and includes trades executed through the end of the prior business day. Gains and losses on securities sold are determined on the basis of identified cost and may include proceeds received from litigation. Dividend income is recorded on the ex-dividend date, except for certain dividends from foreign securities where the ex-dividend date may have passed, which are recorded as soon as the Fund is informed of the ex-dividend date. Non-cash dividends included in dividend income, if any, are
Annual Report
Notes to Financial Statements - continued
3. Significant Accounting Policies - continued
Investment Transactions and Income - continued
recorded at the fair market value of the securities received. Interest income and distributions from the Fidelity Central Funds are accrued as earned. Investment income is recorded net of foreign taxes withheld where recovery of such taxes is uncertain.
Expenses. Expenses directly attributable to a fund are charged to that fund. Expenses attributable to more than one fund are allocated among the respective funds on the basis of relative net assets or other appropriate methods. Expense estimates are accrued in the period to which they relate and adjustments are made when actual amounts are known.
Income Tax Information and Distributions to Shareholders. Each year, the Fund intends to qualify as a regulated investment company under Subchapter M of the Internal Revenue Code, including distributing substantially all of its taxable income and realized gains. As a result, no provision for income taxes is required. As of October 31, 2012, the Fund did not have any unrecognized tax benefits in the financial statements; nor is the Fund aware of any tax positions for which it is reasonably possible that the total amounts of unrecognized tax benefits will significantly change in the next twelve months. The Fund files a U.S. federal tax return, in addition to state and local tax returns as required. A fund's federal income tax returns are subject to examination by the Internal Revenue Service (IRS) for a period of three fiscal years after they are filed. State and local tax returns may be subject to examination for an additional fiscal year depending on the jurisdiction. Foreign taxes are provided for based on the Fund's understanding of the tax rules and rates that exist in the foreign markets in which it invests.
Distributions are declared and recorded on the ex-dividend date. Income dividends and capital gain distributions are declared separately for each class. Income and capital gain distributions are determined in accordance with income tax regulations, which may differ from GAAP.
Capital accounts within the financial statements are adjusted for permanent book-tax differences. These adjustments have no impact on net assets or the results of operations. Temporary book-tax differences will reverse in a subsequent period.
Book-tax differences are primarily due to foreign currency transactions, passive foreign investment companies (PFIC), capital loss carryforwards and losses deferred due to wash sales.
Annual Report
3. Significant Accounting Policies - continued
Income Tax Information and Distributions to Shareholders - continued
The federal tax cost of investment securities and unrealized appreciation (depreciation) as of period end were as follows:
Gross unrealized appreciation | $ 11,923,750 |
Gross unrealized depreciation | (12,677,916) |
Net unrealized appreciation (depreciation) on securities and other investments | $ (754,166) |
| |
Tax Cost | $ 140,452,914 |
The tax-based components of distributable earnings as of period end were as follows:
Undistributed ordinary income | $ 4,576,774 |
Capital loss carryforward | $ (123,320,454) |
Net unrealized appreciation (depreciation) | $ (763,129) |
Capital loss carryforwards are only available to offset future capital gains of the Fund to the extent provided by regulations and may be limited. Under the Regulated Investment Company Modernization Act of 2010 (the Act), the Fund is permitted to carry forward capital losses incurred in taxable years beginning after December 22, 2010 for an unlimited period and such capital losses are required to be used prior to any losses that expire. Capital loss carryforwards were as follows:
Fiscal year of expiration | |
2016 | $ (17,089,067) |
2017 | (65,376,972) |
2018 | (3,571,319) |
2019 | (31,368,797) |
Total with expiration | (117,406,155) |
No expiration | |
Long-term | (5,914,299) |
Total capital loss carryforward | $ (123,320,454) |
The tax character of distributions paid was as follows:
| October 31, 2012 | October 31, 2011 |
Ordinary Income | $ 5,463,877 | $ 5,152,516 |
Annual Report
Notes to Financial Statements - continued
3. Significant Accounting Policies - continued
Short-Term Trading (Redemption) Fees. Shares held by investors in the Fund less than 30 days are subject to a redemption fee equal to 1.00% of the net asset value of shares redeemed. All redemption fees, which reduce the proceeds of the shareholder redemption, are retained by the Fund and accounted for as an addition to paid in capital.
New Accounting Pronouncement. In December 2011, the Financial Accounting Standards Board issued Accounting Standard Update No. 2011-11, Disclosures about Offsetting Assets and Liabilities. The update creates new disclosure requirements requiring entities to disclose both gross and net information for derivatives and other financial instruments that are either offset in the Statement of Assets and Liabilities or subject to an enforceable master netting arrangement or similar agreement. The disclosure requirements are effective for annual reporting periods beginning on or after January 1, 2013, and interim periods within those annual periods. Management is currently evaluating the impact of the update's adoption on the Fund's financial statement disclosures.
4. Purchases and Sales of Investments.
Purchases and sales of securities, other than short-term securities, aggregated $107,516,996 and $136,721,066, respectively.
5. Fees and Other Transactions with Affiliates.
Management Fee. FMR and its affiliates provide the Fund with investment management related services for which the Fund pays a monthly management fee. The management fee is the sum of an individual fund fee rate that is based on an annual rate of .45% of the Fund's average net assets and an annualized group fee rate that averaged .26% during the period. The group fee rate is based upon the average net assets of all the mutual funds advised by FMR. The group fee rate decreases as assets under management increase and increases as assets under management decrease. In addition, the management fee is subject to a performance adjustment (up to a maximum of ± .20% of the Fund's average net assets over a 36 month performance period). The upward or downward adjustment to the management fee is based on the relative investment performance of International Value as compared to an appropriate benchmark index. For the period, the total annual management fee rate, including the performance adjustment, was .67% of the Fund's average net assets.
Annual Report
5. Fees and Other Transactions with Affiliates - continued
Distribution and Service Plan Fees. In accordance with Rule 12b-1 of the 1940 Act, the Fund has adopted separate Distribution and Service Plans for each class of shares. Certain classes pay Fidelity Distributors Corporation (FDC), an affiliate of FMR, separate Distribution and Service Fees, each of which is based on an annual percentage of each class' average net assets. In addition, FDC may pay financial intermediaries for selling shares of the Fund and providing shareholder support services. For the period, the Distribution and Service Fee rates, total fees and amounts retained by FDC were as follows:
| Distribution
Fee | Service
Fee | Total Fees | Retained
by FDC |
Class A | -% | .25% | $ 11,016 | $ 291 |
Class T | .25% | .25% | 12,196 | 22 |
Class B | .75% | .25% | 8,001 | 6,009 |
Class C | .75% | .25% | 21,252 | 5,108 |
| | | $ 52,465 | $ 11,430 |
Sales Load. FDC may receive a front-end sales charge of up to 5.75% for selling Class A shares and 3.50% for selling Class T shares, some of which is paid to financial intermediaries for selling shares of the Fund. Depending on the holding period, FDC may receive contingent deferred sales charges levied on Class A, Class T, Class B, and Class C redemptions. The deferred sales charges range from 5.00% to 1.00% for Class B shares, 1.00% for Class C shares, 1.00% for certain purchases of Class A shares and .25% for certain purchases of Class T shares.
For the period, sales charge amounts retained by FDC were as follows:
| Retained
by FDC |
Class A | $ 1,851 |
Class T | 589 |
Class B* | 4,309 |
Class C* | 943 |
| $ 7,692 |
* When Class B and Class C shares are initially sold, FDC pays commissions from its own resources to financial intermediaries through which the sales are made.
Annual Report
Notes to Financial Statements - continued
5. Fees and Other Transactions with Affiliates - continued
Transfer Agent Fees. Fidelity Investments Institutional Operations Company, Inc. (FIIOC), an affiliate of FMR, is the transfer, dividend disbursing and shareholder servicing agent for each class of the Fund. FIIOC receives account fees and asset-based fees that vary according to the account size and type of account of the shareholders of the respective classes of the Fund. FIIOC pays for typesetting, printing and mailing of shareholder reports, except proxy statements. For the period, transfer agent fees for each class were as follows:
| Amount | % of
Average
Net Assets |
Class A | $ 13,342 | .30 |
Class T | 7,912 | .32 |
Class B | 2,419 | .30 |
Class C | 6,455 | .30 |
International Value | 324,523 | .24 |
Institutional Class | 811 | .21 |
| $ 355,462 | |
Accounting and Security Lending Fees. Fidelity Service Company, Inc. (FSC), an affiliate of FMR, maintains the Fund's accounting records. The accounting fee is based on the level of average net assets for each month. Under a separate contract, FSC administers the security lending program. The security lending fee is based on the number and duration of lending transactions.
Brokerage Commissions. The Fund placed a portion of its portfolio transactions with brokerage firms which are affiliates of the investment adviser. The commissions paid to these affiliated firms were $129 for the period.
6. Committed Line of Credit.
The Fund participates with other funds managed by FMR or an affiliate in a $4.25 billion credit facility (the "line of credit") to be utilized for temporary or emergency purposes to fund shareholder redemptions or for other short-term liquidity purposes. The Fund has agreed to pay commitment fees on its pro-rata portion of the line of credit, which amounted to $405 and is reflected in Miscellaneous expenses on the Statement of Operations. During the period, there were no borrowings on this line of credit.
Annual Report
7. Security Lending.
The Fund lends portfolio securities through a lending agent from time to time in order to earn additional income. For equity securities, a lending agent is used and may loan securities to certain qualified borrowers, including Fidelity Capital Markets (FCM), a broker-dealer affiliated with the Fund. On the settlement date of the loan, the Fund receives collateral (in the form of U.S. Treasury obligations, letters of credit and/or cash) against the loaned securities and maintains collateral in an amount not less than 100% of the market value of the loaned securities during the period of the loan. The market value of the loaned securities is determined at the close of business of the Fund and any additional required collateral is delivered to the Fund on the next business day. If the borrower defaults on its obligation to return the securities loaned because of insolvency or other reasons, a fund could experience delays and costs in recovering the securities loaned or in gaining access to the collateral. Any cash collateral received is invested in the Fidelity Securities Lending Cash Central Fund. The value of loaned securities and cash collateral at period end are disclosed on the Fund's Statement of Assets and Liabilities. At period end, there were no security loans outstanding with FCM. Security lending income represents the income earned on investing cash collateral, less rebates paid to borrowers and any lending agent fees associated with the loan, plus any premium payments received for lending certain types of securities. Security lending income is presented in the Statement of Operations as a component of income from Fidelity Central Funds. Total security lending income during the period amounted to $188,349, including $5 from securities loaned to FCM.
8. Expense Reductions.
FMR voluntarily agreed to reimburse each class to the extent annual operating expenses exceeded certain levels of average net assets as noted in the table below. Some expenses, for example interest expense, including commitment fees, are excluded from this reimbursement.
The following classes were in reimbursement during the period:
| Expense
Limitations | Reimbursement
from adviser |
Class T | 1.70% | $ 243 |
Many of the brokers with whom FMR places trades on behalf of the Fund provided services to the Fund in addition to trade execution. These services included payments of certain expenses on behalf of the Fund totaling $46,635 for the period.
Annual Report
Notes to Financial Statements - continued
9. Distributions to Shareholders.
Distributions to shareholders of each class were as follows:
Years ended October 31, | 2012 | 2011 |
From net investment income | | |
Class A | $ 143,989 | $ 109,917 |
Class T | 67,838 | 48,265 |
Class B | 19,758 | 18,831 |
Class C | 50,970 | 34,950 |
International Value | 5,163,324 | 4,218,039 |
Institutional Class | 17,998 | 11,933 |
Total | $ 5,463,877 | $ 4,441,935 |
From net realized gain | | |
Class A | $ - | $ 19,461 |
Class T | - | 9,435 |
Class B | - | 4,893 |
Class C | - | 8,796 |
International Value | - | 666,153 |
Institutional Class | - | 1,843 |
Total | $ - | $ 710,581 |
10. Share Transactions.
Transactions for each class of shares were as follows:
| Shares | Dollars |
Years ended October 31, | 2012 | 2011 | 2012 | 2011 |
Class A | | | | |
Shares sold | 186,877 | 297,051 | $ 1,294,428 | $ 2,472,449 |
Reinvestment of distributions | 19,578 | 14,168 | 128,823 | 113,424 |
Shares redeemed | (263,913) | (217,894) | (1,814,670) | (1,776,674) |
Net increase (decrease) | (57,458) | 93,325 | $ (391,419) | $ 809,199 |
Class T | | | | |
Shares sold | 87,833 | 184,684 | $ 599,355 | $ 1,564,957 |
Reinvestment of distributions | 10,069 | 7,104 | 66,355 | 56,884 |
Shares redeemed | (85,446) | (116,856) | (585,214) | (949,653) |
Net increase (decrease) | 12,456 | 74,932 | $ 80,496 | $ 672,188 |
Class B | | | | |
Shares sold | 2,850 | 10,615 | $ 19,157 | $ 84,177 |
Reinvestment of distributions | 2,474 | 2,474 | 16,400 | 19,918 |
Shares redeemed | (40,532) | (32,689) | (279,913) | (270,345) |
Net increase (decrease) | (35,208) | (19,600) | $ (244,356) | $ (166,250) |
Annual Report
10. Share Transactions - continued
| Shares | Dollars |
Years ended October 31, | 2012 | 2011 | 2012 | 2011 |
Class C | | | | |
Shares sold | 72,761 | 94,118 | $ 498,768 | $ 764,274 |
Reinvestment of distributions | 6,699 | 4,468 | 44,283 | 35,965 |
Shares redeemed | (75,717) | (56,323) | (522,498) | (453,389) |
Net increase (decrease) | 3,743 | 42,263 | $ 20,553 | $ 346,850 |
International Value | | | | |
Shares sold | 2,278,492 | 9,000,450 | $ 15,694,819 | $ 76,813,955 |
Reinvestment of distributions | 762,294 | 587,427 | 5,008,269 | 4,695,920 |
Shares redeemed | (7,089,505) | (7,927,908) | (48,008,194) | (64,758,392) |
Net increase (decrease) | (4,048,719) | 1,659,969 | $ (27,305,106) | $ 16,751,483 |
Institutional Class | | | | |
Shares sold | 18,483 | 19,868 | $ 132,098 | $ 168,608 |
Reinvestment of distributions | 1,234 | 395 | 8,117 | 3,160 |
Shares redeemed | (36,776) | (16,071) | (254,320) | (130,995) |
Net increase (decrease) | (17,059) | 4,192 | $ (114,105) | $ 40,773 |
11. Other.
The Fund's organizational documents provide former and current trustees and officers with a limited indemnification against liabilities arising in connection with the performance of their duties to the Fund. In the normal course of business, the Fund may also enter into contracts that provide general indemnifications. The Fund's maximum exposure under these arrangements is unknown as this would be dependent on future claims that may be made against the Fund. The risk of material loss from such claims is considered remote.
At the end of the period, Strategic Advisers International II Fund and VIP FundsManager 60% Portfolio were owners of record of approximately 21% and 16%, respectively, of the total outstanding shares of the Fund.
Mutual funds managed by FMR or its affiliates were owners of record, in the aggregate, of approximately 38% of the total outstanding shares of the Fund.
Annual Report
To the Trustees of Fidelity Investment Trust and Shareholders of Fidelity International Value Fund:
We have audited the accompanying statement of assets and liabilities of Fidelity International Value Fund (the Fund), a fund of Fidelity Investment Trust, including the schedule of investments, as of October 31, 2012, and the related statement of operations for the year then ended, the statement of changes in net assets for each of the two years in the period then ended, and the financial highlights for each of the five years in the period then ended. These financial statements and financial highlights are the responsibility of the Fund's management. Our responsibility is to express an opinion on these financial statements and financial highlights based on our audits.
We conducted our audits in accordance with the standards of the Public Company Accounting Oversight Board (United States). Those standards require that we plan and perform the audit to obtain reasonable assurance about whether the financial statements and financial highlights are free of material misstatement. The Fund is not required to have, nor were we engaged to perform, an audit of its internal control over financial reporting. Our audits included consideration of internal control over financial reporting as a basis for designing audit procedures that are appropriate in the circumstances, but not for the purpose of expressing an opinion on the effectiveness of the Fund's internal control over financial reporting. Accordingly, we express no such opinion. An audit also includes examining, on a test basis, evidence supporting the amounts and disclosures in the financial statements, assessing the accounting principles used and significant estimates made by management, as well as evaluating the overall financial statement presentation. Our procedures included confirmation of securities owned as of October 31, 2012, by correspondence with the custodians and brokers; where replies were not received from brokers, we performed other auditing procedures. We believe that our audits provide a reasonable basis for our opinion.
In our opinion, the financial statements and financial highlights referred to above present fairly, in all material respects, the financial position of Fidelity International Value Fund as of October 31, 2012, the results of its operations for the year then ended, the changes in its net assets for each of the two years in the period then ended, and the financial highlights for each of the five years in the period then ended, in conformity with accounting principles generally accepted in the United States of America.
DELOITTE & TOUCHE LLP
Boston, Massachusetts
December 14, 2012
Annual Report
The Trustees, Members of the Advisory Board, and executive officers of the trust and fund, as applicable, are listed below. The Board of Trustees governs the fund and is responsible for protecting the interests of shareholders. The Trustees are experienced executives who meet periodically throughout the year to oversee the fund's activities, review contractual arrangements with companies that provide services to the fund, oversee management of the risks associated with such activities and contractual arrangements, and review the fund's performance. Except for James C. Curvey, each of the Trustees oversees 236 funds advised by FMR or an affiliate. Mr. Curvey oversees 443 funds advised by FMR or an affiliate.
The Trustees hold office without limit in time except that (a) any Trustee may resign; (b) any Trustee may be removed by written instrument, signed by at least two-thirds of the number of Trustees prior to such removal; (c) any Trustee who requests to be retired or who has become incapacitated by illness or injury may be retired by written instrument signed by a majority of the other Trustees; and (d) any Trustee may be removed at any special meeting of shareholders by a two-thirds vote of the outstanding voting securities of the trust. Each Trustee who is not an interested person (as defined in the 1940 Act) (Independent Trustee), shall retire not later than the last day of the calendar year in which his or her 75th birthday occurs. The Independent Trustees may waive this mandatory retirement age policy with respect to individual Trustees. The executive officers and Advisory Board Members hold office without limit in time, except that any officer and Advisory Board Member may resign or may be removed by a vote of a majority of the Trustees at any regular meeting or any special meeting of the Trustees. Except as indicated, each individual has held the office shown or other offices in the same company for the past five years.
Experience, Skills, Attributes, and Qualifications of the Fund's Trustees. The Governance and Nominating Committee has adopted a statement of policy that describes the experience, qualifications, attributes, and skills that are necessary and desirable for potential Independent Trustee candidates (Statement of Policy). The Board believes that each Trustee satisfied at the time he or she was initially elected or appointed a Trustee, and continues to satisfy, the standards contemplated by the Statement of Policy. The Governance and Nominating Committee also engages professional search firms to help identify potential Independent Trustee candidates who have the experience, qualifications, attributes, and skills consistent with the Statement of Policy. From time to time, additional criteria based on the composition and skills of the current Independent Trustees, as well as experience or skills that may be appropriate in light of future changes to board composition, business conditions, and regulatory or other developments, have also been considered by the professional search firms and the Governance and Nominating Committee. In addition, the Board takes into account the Trustees' commitment and participation in Board and committee meetings, as well as their leadership of standing and ad hoc committees throughout their tenure.
In determining that a particular Trustee was and continues to be qualified to serve as a Trustee, the Board has considered a variety of criteria, none of which, in isolation, was controlling. The Board believes that, collectively, the Trustees have balanced and diverse experience, qualifications, attributes, and skills, which allow the Board to operate effectively in governing the fund and protecting the interests of shareholders. Information about the specific experience, skills, attributes, and qualifications of each Trustee, which in each case led to the Board's conclusion that the Trustee should serve (or continue to serve) as a trustee of the fund, is provided below.
Annual Report
Trustees and Officers - continued
Board Structure and Oversight Function. James C. Curvey is an interested person (as defined in the 1940 Act) and currently serves as Chairman. The Trustees have determined that an interested Chairman is appropriate and benefits shareholders because an interested Chairman has a personal and professional stake in the quality and continuity of services provided to the fund. Independent Trustees exercise their informed business judgment to appoint an individual of their choosing to serve as Chairman, regardless of whether the Trustee happens to be independent or a member of management. The Independent Trustees have determined that they can act independently and effectively without having an Independent Trustee serve as Chairman and that a key structural component for assuring that they are in a position to do so is for the Independent Trustees to constitute a substantial majority for the Board. The Independent Trustees also regularly meet in executive session. Ned C. Lautenbach serves as Chairman of the Independent Trustees and as such (i) acts as a liaison between the Independent Trustees and management with respect to matters important to the Independent Trustees and (ii) with management prepares agendas for Board meetings.
Fidelity funds are overseen by different Boards of Trustees. The fund's Board oversees Fidelity's equity and high income funds and another Board oversees Fidelity's investment-grade bond, money market, and asset allocation funds. The asset allocation funds may invest in Fidelity funds overseen by the fund's Board. The use of separate Boards, each with its own committee structure, allows the Trustees of each group of Fidelity funds to focus on the unique issues of the funds they oversee, including common research, investment, and operational issues. On occasion, the separate Boards establish joint committees to address issues of overlapping consequences for the Fidelity funds overseen by each Board.
The Trustees operate using a system of committees to facilitate the timely and efficient consideration of all matters of importance to the Trustees, the fund, and fund shareholders and to facilitate compliance with legal and regulatory requirements and oversight of the fund's activities and associated risks. The Board, acting through its committees, has charged FMR and its affiliates with (i) identifying events or circumstances the occurrence of which could have demonstrably adverse effects on the fund's business and/or reputation; (ii) implementing processes and controls to lessen the possibility that such events or circumstances occur or to mitigate the effects of such events or circumstances if they do occur; and (iii) creating and maintaining a system designed to evaluate continuously business and market conditions in order to facilitate the identification and implementation processes described in (i) and (ii) above. Because the day-to-day operations and activities of the fund are carried out by or through FMR, its affiliates and other service providers, the fund's exposure to risks is mitigated but not eliminated by the processes overseen by the Trustees. While each of the Board's committees has responsibility for overseeing different aspects of the fund's activities, oversight is exercised primarily through the Operations, Audit, and Compliance Committees. In addition, the Independent Trustees have worked with FMR to enhance the Board's oversight of investment and financial risks, legal and regulatory risks, technology risks, and operational risks, including the development of additional risk reporting to the Board. For example, a working group comprised of Independent Trustees and FMR has worked and continues to work to review the Fidelity funds' valuation-related activities, reporting and risk management. Appropriate personnel, including but not limited to the fund's Chief Compliance Officer (CCO), FMR's internal auditor, the independent accountants, the fund's Treasurer and portfolio management personnel, make periodic reports to the Board's committees, as appropriate, including an annual review of FMR's risk management program for the Fidelity funds. The responsibilities of each standing committee, including their oversight responsibilities, are described further under "Standing Committees of the Fund's Trustees."
Annual Report
The fund's Statement of Additional Information (SAI) includes more information about the Trustees. To request a free copy, call Fidelity at 1-877-208-0098.
Interested Trustees*:
Correspondence intended for each Trustee who is an interested person may be sent to Fidelity Investments, 82 Devonshire Street, Boston, Massachusetts 02109.
Name, Age; Principal Occupations and Other Relevant Experience+ |
James C. Curvey (77) |
| Year of Election or Appointment: 2007 Mr. Curvey is Trustee and Chairman of the Board of Trustees of certain Trusts. Mr. Curvey also serves as Trustee (2007-present) of other investment companies advised by FMR. Mr. Curvey is a Director of Fidelity Investments Money Management, Inc. (2009-present), Director of Fidelity Research & Analysis Co. (2009-present) and Director of FMR and FMR Co., Inc. (2007-present). Mr. Curvey is also Vice Chairman (2007-present) and Director of FMR LLC. In addition, Mr. Curvey serves as an Overseer for the Boston Symphony Orchestra and a member of the Trustees of Villanova University. Previously, Mr. Curvey was the Vice Chairman (2006-2007) and Director (2000-2007) of FMR Corp. |
Ronald P. O'Hanley (55) |
| Year of Election or Appointment: 2011 Mr. O'Hanley is Director of FMR Co., Inc. (2010-present), Director of Fidelity Investments Money Management, Inc. (2010-present), Director of Fidelity Research & Analysis Company (2010-present), President of Fidelity Asset Management and Corporate Services and a member of Fidelity's Executive Committee (2010-present). Previously, Mr. O'Hanley served as President and Chief Executive Officer of BNY Mellon Asset Management (2007-2010). Mr. O'Hanley also served as Vice Chairman of Bank New York Mellon Corp. and a member of that firm's Executive Committee. Prior to the 2007 merger of The Bank of New York and Mellon Financial Corporation, he was Vice Chairman of Mellon Financial Corporation and President and Chief Executive Officer of Mellon Asset Management. He joined Mellon in February 1997. Mr. O'Hanley currently serves as Chairman of the Boston Public Library Foundation Board of Directors and sits on the Board of Directors of Beth Israel Deaconess Medical Center, the Board of Trustees of the Marine Biological Laboratory and the Advisory Board of the Maxwell School of Citizenship and Public Administration at Syracuse University. Mr. O'Hanley also chairs the Council on Asset Management for the Financial Services Roundtable and is a member of the Board of Directors of Institutional Investor's U.S. Institute. |
* Trustees have been determined to be "Interested Trustees" by virtue of, among other things, their affiliation with the trust or various entities under common control with FMR.
+ The information above includes each Trustee's principal occupation during the last five years and other information relating to the experience, attributes, and skills relevant to each Trustee's qualifications to serve as a Trustee, which led to the conclusion that each Trustee should serve as a Trustee for the fund.
Annual Report
Independent Trustees:
Correspondence intended for each Independent Trustee (that is, the Trustees other than the Interested Trustees) may be sent to Fidelity Investments, P.O. Box 55235, Boston, Massachusetts 02205-5235.
Name, Age; Principal Occupations and Other Relevant Experience+ |
Dennis J. Dirks (64) |
| Year of Election or Appointment: 2005 Prior to his retirement in May 2003, Mr. Dirks was Chief Operating Officer and a member of the Board of The Depository Trust & Clearing Corporation (DTCC). He also served as President, Chief Operating Officer, and Board member of The Depository Trust Company (DTC) and President and Board member of the National Securities Clearing Corporation (NSCC). In addition, Mr. Dirks served as Chief Executive Officer and Board member of the Government Securities Clearing Corporation, Chief Executive Officer and Board member of the Mortgage-Backed Securities Clearing Corporation, as a Trustee and a member of the Finance Committee of Manhattan College (2005-2008), and as a Trustee and a member of the Finance Committee of AHRC of Nassau County (2006-2008). Mr. Dirks is a member of the Independent Directors Council (IDC) Governing Council (2010-present) and Board of Directors for The Brookville Center for Children's Services, Inc. (2009-present). |
Alan J. Lacy (59) |
| Year of Election or Appointment: 2008 Mr. Lacy serves as Senior Adviser (2007-present) of Oak Hill Capital Partners, L.P. (private equity). Mr. Lacy also served as Chief Executive Officer (2000-2005) and Vice Chairman (2005-2006) of Sears Holdings Corporation and Sears, Roebuck and Co. (retail). In addition, Mr. Lacy serves as a member of the Board of Directors of Dave & Buster's Entertainment, Inc. (restaurant and entertainment complexes, 2010-present), Earth Fare, Inc. (retail grocery, 2012-present), The Hillman Companies, Inc. (hardware wholesalers, 2010-present), and Bristol-Myers Squibb Company (global pharmaceuticals, 2008-present). Mr. Lacy is a member of the Board of Trustees of The National Parks Conservation Association (2006-present). Previously, Mr. Lacy served as Chairman of the Board of Trustees of the National Parks Conservation Association (2008-2011) and as a member of the Board of Directors for the Western Union Company (global money transfer, 2006-2011). |
Ned C. Lautenbach (68) |
| Year of Election or Appointment: 2000 Mr. Lautenbach is Chairman of the Independent Trustees of the Equity and High Income Funds (2006-present). Mr. Lautenbach currently serves as the Lead Director of the Eaton Corporation Board of Directors (diversified industrial, 1997-present). Mr. Lautenbach is Chairman of the Board of Directors of the Philharmonic Center for the Arts in Naples, Florida (2012-present) and a member of the Council on Foreign Relations (1994-present). Previously, Mr. Lautenbach was a Partner/Advisory Partner at Clayton, Dubilier & Rice, LLC (private equity investment, 1998-2010), as well as a Director of Sony Corporation (2006-2007). |
Joseph Mauriello (68) |
| Year of Election or Appointment: 2008 Prior to his retirement in January 2006, Mr. Mauriello served in numerous senior management positions including Deputy Chairman and Chief Operating Officer (2004-2005), and Vice Chairman of Financial Services (2002-2004) of KPMG LLP US (professional services, 1965-2005). Mr. Mauriello currently serves as a member of the Board of Directors of XL Group plc. (global insurance and re-insurance, 2006-present). Previously, Mr. Mauriello served as a Director of the Hamilton Funds of the Bank of New York (2006-2007) and of Arcadia Resources Inc. (health care services and products, 2007-2012). |
Robert W. Selander (62) |
| Year of Election or Appointment: 2011 Previously, Mr. Selander served as a Member of the Advisory Board of Fidelity's Equity and High Income Funds (2011), Executive Vice Chairman (2010), Chief Executive Officer (2009-2010), and President and Chief Executive Officer (1997-2009) of Mastercard, Inc. |
Cornelia M. Small (68) |
| Year of Election or Appointment: 2005 Ms. Small is a member of the Board of Directors (2009-present) and Chair of the Investment Committee (2010-present) of the Teagle Foundation. Ms. Small also serves on the Investment Committee of the Berkshire Taconic Community Foundation (2008-present). Previously, Ms. Small served as Chairperson (2002-2008) and a member of the Investment Committee and Chairperson (2008-2012) and a member of the Board of Trustees of Smith College. In addition, Ms. Small served as Chief Investment Officer, Director of Global Equity Investments, and a member of the Board of Directors of Scudder, Stevens & Clark and Scudder Kemper Investments. |
William S. Stavropoulos (73) |
| Year of Election or Appointment: 2001 Mr. Stavropoulos is Vice Chairman of the Independent Trustees of the Equity and High Income Funds (2006-present). Mr. Stavropoulos serves as President and Founder of the Michigan Baseball Foundation, the Great Lakes Loons (2007-present). Mr. Stavropoulos is Chairman Emeritus of the Board of Directors of The Dow Chemical Company, where he previously served in numerous senior management positions, including President, CEO (1995-2000; 2002-2004), Chairman of the Executive Committee (2000-2006), and as a member of the Board of Directors (1990-2006). Currently, Mr. Stavropoulos is a Director of Univar Inc. (global distributor of commodity and specialty chemicals, Chairman from 2010-May 2012 and Lead Director from May 2012-present), Teradata Corporation (data warehousing and technology solutions, 2008-present), Maersk Inc. (industrial conglomerate), and Tyco International, Ltd. (multinational manufacturing and services, 2007-present), and a member of the Advisory Board for Metalmark Capital LLC (private equity investment, 2005-present). Mr. Stavropoulos is an operating advisor to Clayton, Dubilier & Rice, LLC (private equity investment). In addition, Mr. Stavropoulos is a member of the University of Notre Dame Advisory Council for the College of Science, a Trustee of the Rollin L. Gerstacker Foundation, and a Director of the Naples Philharmonic Center for the Arts. Previously, Mr. Stavropoulos served as a Director of Chemical Financial Corporation (bank holding company, 1993-2012). |
David M. Thomas (63) |
| Year of Election or Appointment: 2008 Previously, Mr. Thomas served as Executive Chairman (2005-2006) and Chairman and Chief Executive Officer (2000-2005) of IMS Health, Inc. (pharmaceutical and healthcare information solutions), and a Director of Fortune Brands, Inc. (consumer products, 2000-2011). In addition, Mr. Thomas serves as Non-Executive Chairman of the Board of Directors of Fortune Brands Home and Security (home and security products, 2011-present), and as a member of the Board of Directors of Interpublic Group of Companies, Inc. (marketing communication, 2004-present). |
Michael E. Wiley (62) |
| Year of Election or Appointment: 2008 Mr. Wiley also serves as a Director of Asia Pacific Exploration Consolidated (international oil and gas exploration and production, 2008-present). Mr. Wiley serves as a Director of Tesoro Corporation (independent oil refiner and marketer, 2005-present), and a Director of Bill Barrett Corporation (exploration and production, 2005-present). In addition, Mr. Wiley also serves as a Director of Post Oak Bank (privately-held bank, 2004-present). Previously, Mr. Wiley served as a member of the Board of Trustees of the University of Tulsa (2000-2006; 2007-2010), as a Senior Energy Advisor of Katzenbach Partners, LLC (consulting, 2006-2007), as an Advisory Director of Riverstone Holdings (private investment), Chairman, President, and CEO of Baker Hughes, Inc. (oilfield services, 2000-2004), and as Director of Spinnaker Exploration Company (exploration and production, 2001-2005). |
+ The information above includes each Trustee's principal occupation during the last five years and other information relating to the experience, attributes, and skills relevant to each Trustee's qualifications to serve as a Trustee, which led to the conclusion that each Trustee should serve as a Trustee for the fund.
Advisory Board Members and Executive Officers:
Correspondence intended for David A. Rosow and Garnett A. Smith may be sent to Fidelity Investments, P.O. Box 55235, Boston, Massachusetts 02205-5235. Correspondence intended for each executive officer, Edward C. Johnson 3d, and Peter S. Lynch may be sent to Fidelity Investments, 82 Devonshire Street, Boston, Massachusetts 02109.
Name, Age; Principal Occupation |
Edward C. Johnson 3d (82) |
| Year of Election or Appointment: 2011 Member of the Advisory Board of Fidelity's Equity and High Income Funds. Mr. Johnson serves as Chief Executive Officer, Chairman, and a Director of FMR LLC, and also serves as Chairman and Director of FIL Limited. Previously, Mr. Johnson served as a Trustee and Chairman of the Board of certain Fidelity Trusts, Chairman and a Director of FMR, Chairman and a Director of FMR Co., Inc., and President of FMR LLC (2006-2007). |
Peter S. Lynch (68) |
| Year of Election or Appointment: 2003 Member of the Advisory Board of Fidelity's Equity and High Income Funds. Mr. Lynch is Vice Chairman and a Director of FMR and FMR Co., Inc. In addition, Mr. Lynch serves as a Trustee of Boston College and as the Chairman of the Inner-City Scholarship Fund. Previously, Mr. Lynch served on the Special Olympics International Board of Directors (1997-2006). |
David A. Rosow (70) |
| Year of Election or Appointment: 2012 Member of the Advisory Board of Fidelity's Equity and High Income Funds. Chairman and Chief Executive Officer of International Golf Group, Inc. (golf course development, 1989-present). Previously, Mr. Rosow served as Chairman and Chief Executive Officer of Rosow & Company, Inc. (private investment company, 1989-2011), a Lead Director of Hudson United Bancorp (2001-2006) and as a Director of TD Banknorth (1996-2006). In addition, Mr. Rosow is a member (2008-present) and President (2009-present) of the Town Council of Palm Beach, Florida. |
Garnett A. Smith (65) |
| Year of Election or Appointment: 2012 Member of the Advisory Board of Fidelity's Equity and High Income Funds. Prior to Mr. Smith's retirement, he served as Chairman and Chief Executive Officer of Inbrand Corp. (manufacturer of personal absorbent products, 1990-1997). He also served as President (1986-1990) of Inbrand Corp. Prior to his employment with Inbrand Corp., he was employed by a retail fabric chain and North Carolina National Bank. In addition, Mr. Smith is a board member of the Jackson Hole Land Trust (2009-present). |
Kenneth B. Robins (43) |
| Year of Election or Appointment: 2008 President and Treasurer of Fidelity's Equity and High Income Funds. Mr. Robins also serves as President and Treasurer (2010-present) and Assistant Treasurer (2009-present) of other Fidelity funds and is an employee of Fidelity Investments (2004-present). Previously, Mr. Robins served as Deputy Treasurer of the Fidelity funds (2005-2008) and Treasurer and Chief Financial Officer of The North Carolina Capital Management Trust: Cash and Term Portfolios (2006-2008). |
Bruce T. Herring (47) |
| Year of Election or Appointment: 2006 Vice President of certain Equity Funds. Mr. Herring also serves as President of Fidelity Research & Analysis Company (2010-present), Chief Investment Officer and Director of Fidelity Management & Research (U.K.) Inc. (2010-present) and Group Chief Investment Officer of FMR. Previously, Mr. Herring served as Vice President (2005-2006) and Senior Vice President (2006-2007) of Fidelity Management & Research Company, Vice President of FMR Co., Inc. (2001-2007) and as a portfolio manager for Fidelity U.S. Equity Funds. |
Brian B. Hogan (48) |
| Year of Election or Appointment: 2009 Vice President of Equity and High Income Funds. Mr. Hogan also serves as President of FMR's Equity Division (2009-present). Previously, Mr. Hogan served as Senior Vice President, Equity Research of FMR (2006-2009) and as a portfolio manager. |
Scott C. Goebel (44) |
| Year of Election or Appointment: 2008 Secretary and Chief Legal Officer (CLO) of the Fidelity funds. Mr. Goebel also serves as Secretary of Fidelity Investments Money Management, Inc. (FIMM) (2010-present) and Fidelity Research and Analysis Company (FRAC) (2010-present); Secretary and CLO of The North Carolina Capital Management Trust: Cash and Term Portfolios (2008-present); General Counsel, Secretary, and Senior Vice President of FMR (2008-present) and FMR Co., Inc. (2008-present); employed by FMR LLC or an affiliate (2001-present); Chief Legal Officer of Fidelity Management & Research (Hong Kong) Limited (2008-present) and Assistant Secretary of Fidelity Management & Research (Japan) Inc. (2008-present), and Fidelity Management & Research (U.K.) Inc. (2008-present). Previously, Mr. Goebel served as Assistant Secretary of FIMM (2008-2010), FRAC (2008-2010), and the Funds (2007-2008) and as Vice President and Secretary of Fidelity Distributors Corporation (FDC) (2005-2007). |
William C. Coffey (43) |
| Year of Election or Appointment: 2009 Assistant Secretary of Fidelity's Equity and High Income Funds. Mr. Coffey also serves as Senior Vice President and Deputy General Counsel of FMR LLC (2010-present), and is an employee of Fidelity Investments. Previously, Mr. Coffey served as Vice President and Associate General Counsel of FMR LLC (2005-2009). |
Elizabeth Paige Baumann (44) |
| Year of Election or Appointment: 2012 Anti-Money Laundering (AML) Officer of the Fidelity funds. Ms. Baumann also serves as AML Officer of The North Carolina Capital Management Trust: Cash and Term Portfolios (2012-present), Chief AML Officer of FMR LLC (2012-present), and is an employee of Fidelity Investments. Previously, Ms. Baumann served as Vice President and Deputy Anti-Money Laundering Officer (2007-2012). |
Christine Reynolds (54) |
| Year of Election or Appointment: 2008 Chief Financial Officer of the Fidelity funds. Ms. Reynolds became President of Fidelity Pricing and Cash Management Services (FPCMS) in August 2008. Ms. Reynolds served as Chief Operating Officer of FPCMS (2007-2008). Previously, Ms. Reynolds served as President, Treasurer, and Anti-Money Laundering officer of the Fidelity funds (2004-2007). |
Joseph A. Hanlon (44) |
| Year of Election or Appointment: 2012 Chief Compliance Officer of Fidelity's Equity and High Income Funds. Mr. Hanlon serves as Compliance Officer of FMR, FMR Co., Inc., Fidelity Investments Money Management, Inc. (FIMM), Fidelity Research and Analysis Company (FRAC), Fidelity Management & Research (Japan) Inc., Fidelity Management & Research (U.K.) Inc., Fidelity Management & Research (Hong Kong), and Strategic Advisers, Inc. (2009-present), as Senior Vice President of the Fidelity Asset Management Division (2009-present), and is an employee of Fidelity Investments. |
Joseph F. Zambello (55) |
| Year of Election or Appointment: 2011 Deputy Treasurer of the Fidelity funds. Mr. Zambello is an employee of Fidelity Investments. Previously, Mr. Zambello served as Vice President of FMR's Program Management Group (2009-2011) and Vice President of the Transfer Agent Oversight Group (2005-2009). |
Adrien E. Deberghes (45) |
| Year of Election or Appointment: 2008 Deputy Treasurer of Fidelity's Equity and High Income Funds. Mr. Deberghes also serves as Vice President (2011-present) and Assistant Treasurer (2010-present) of other Fidelity funds, and is an employee of Fidelity Investments (2008-present). Previously, Mr. Deberghes served as Senior Vice President of Mutual Fund Administration at State Street Corporation (2007-2008), Senior Director of Mutual Fund Administration at Investors Bank & Trust (2005-2007), and Director of Finance for Dunkin' Brands (2000-2005). |
Stephen Sadoski (41) |
| Year of Election or Appointment: 2012 Deputy Treasurer of Fidelity's Equity and High Income Funds. Mr. Sadoski also serves as Assistant Treasurer of other Fidelity funds (2012-present) and is an employee of Fidelity Investments (2012-present). Previously, Mr. Sadoski served as an assistant chief accountant in the Division of Investment Management of the Securities and Exchange Commission (SEC) (2009-2012) and as a senior manager at Deloitte & Touche (1997-2009). |
Stephanie J. Dorsey (43) |
| Year of Election or Appointment: 2010 Assistant Treasurer of Fidelity's Equity and High Income Funds. Ms. Dorsey also serves as Deputy Treasurer of other Fidelity funds (2008-present) and is an employee of Fidelity Investments (2008-present). Previously, Ms. Dorsey served as Treasurer (2004-2008) of the JPMorgan Mutual Funds and Vice President (2004-2008) of JPMorgan Chase Bank. |
John R. Hebble (54) |
| Year of Election or Appointment: 2009 Assistant Treasurer of Fidelity's Equity and High Income Funds. Mr. Hebble also serves as President (2011-present), Treasurer, and Chief Financial Officer of The North Carolina Capital Management Trust: Cash and Term Portfolios (2008-present), President and Treasurer of other Fidelity funds (2008-present) and is an employee of Fidelity Investments. |
Gary W. Ryan (54) |
| Year of Election or Appointment: 2005 Assistant Treasurer of the Fidelity funds. Mr. Ryan is an employee of Fidelity Investments. Previously, Mr. Ryan served as Vice President of Fund Reporting in Fidelity Pricing and Cash Management Services (FPCMS) (1999-2005). |
Jonathan Davis (44) |
| Year of Election or Appointment: 2010 Assistant Treasurer of the Fidelity funds. Mr. Davis is also Assistant Treasurer of Fidelity Rutland Square Trust II and Fidelity Commonwealth Trust II. Mr. Davis is an employee of Fidelity Investments. Previously, Mr. Davis served as Vice President and Associate General Counsel of FMR LLC (2003-2010). |
Annual Report
The Board of Trustees of Fidelity International Value Fund voted to pay to shareholders of record at the opening of business on record date, the following distributions per share derived from capital gains realized from sales of portfolio securities, and dividends derived from net investment income:
| Pay Date | Record Date | Dividends | Capital Gains |
Institutional Class | 12/10/12 | 12/07/12 | $0.229 | $0.042 |
Institutional Class designates 77% of the dividends distributed in December during the fiscal year as amounts which may be taken into account as a dividend for purposes of the maximum rate under section 1(h)(11) of the Internal Revenue Code.
The amounts per share which represent income derived from sources within, and taxes paid to, foreign countries or possessions of the United States are as follows:
| Pay Date | Income | Taxes |
Institutional Class | 12/05/11 | $0.221 | $0.0133 |
The fund will notify shareholders in January 2013 of amounts for use in preparing 2012 income tax returns.
Annual Report
Board Approval of Investment Advisory Contracts and Management Fees
Fidelity International Value Fund
Each year, the Board of Trustees, including the Independent Trustees (together, the Board), votes on the renewal of the management contract and sub-advisory agreements (together, the Advisory Contracts) for the fund. The Board, assisted by the advice of fund counsel and Independent Trustees' counsel, requests and considers a broad range of information relevant to the renewal of the Advisory Contracts throughout the year.
The Board meets regularly and, at each of its meetings, considers factors that are relevant to its annual consideration of the renewal of the fund's Advisory Contracts, including the services and support provided to the fund and its shareholders. The Board has established various standing committees, each composed of and chaired by Independent Trustees with varying backgrounds, to which the Board has assigned specific subject matter responsibilities in order to enhance effective decision-making by the Board. The Board, acting directly and through its Committees, requests and receives information concerning the annual consideration of the renewal of the fund's Advisory Contracts. The Board also meets as needed to consider matters specifically related to the Board's annual consideration of the renewal of Advisory Contracts. Members of the Board may also meet with trustees of other Fidelity funds through ad hoc joint committees to discuss certain matters relevant to the Fidelity funds.
At its July 2012 meeting, the Board of Trustees, including the Independent Trustees, unanimously determined to renew the fund's Advisory Contracts. In reaching its determination, the Board considered all factors it believed relevant, including (i) the nature, extent, and quality of the services to be provided to the fund and its shareholders (including the investment performance of the fund); (ii) the competitiveness of the fund's management fee and total expense ratio relative to peer funds; (iii) the total costs of the services to be provided by and the profits to be realized by Fidelity from its relationship with the fund; (iv) the extent to which economies of scale exist and would be realized as the fund grows; and (v) whether fee levels reflect these economies of scale, if any, for the benefit of fund shareholders.
In considering whether to renew the Advisory Contracts for the fund, the Board reached a determination, with the assistance of fund counsel and Independent Trustees' counsel and through the exercise of its business judgment, that the renewal of the Advisory Contracts is in the best interests of the fund and its shareholders and that the compensation payable under the Advisory Contracts is fair and reasonable. The Board's decision to renew the Advisory Contracts was not based on any single factor, but rather was based on a comprehensive consideration of all the information provided to the Board at its meetings throughout the year. The Board, in reaching its determination to renew the Advisory Contracts, is aware that shareholders in the fund have a broad range of investment choices available to them, including a wide choice among mutual funds offered by Fidelity's competitors, and that the fund's shareholders, who have the opportunity to review and weigh the disclosure provided by the fund in its prospectus and other public disclosures, have chosen to invest in this fund, managed by Fidelity.
Annual Report
Nature, Extent, and Quality of Services Provided. The Board considered the staffing within the investment adviser, FMR, and the sub-advisers (together, the Investment Advisers), including the backgrounds of the fund's investment personnel, and also considered the fund's investment objective, strategies, and related investment philosophy. The Independent Trustees also had discussions with senior management of Fidelity's investment operations and investment groups. The Board considered the structure of the portfolio manager compensation program and whether this structure provides appropriate incentives to act in the best interests of the fund.
Resources Dedicated to Investment Management and Support Services. The Board and the Fund Oversight and Research Committees reviewed the general qualifications and capabilities of the Investment Advisers' investment staff, including its size, education, experience, and resources, as well as the Investment Advisers' approach to recruiting, training, managing, and compensating investment personnel. The Board also noted that FMR has continued to increase the resources devoted to non-U.S. offices, including expansion of Fidelity's global investment organization. The Board noted that Fidelity's analysts have extensive resources, tools and capabilities that allow them to conduct sophisticated quantitative and fundamental analysis, as well as credit analysis of issuers, counterparties and guarantors. The Board also believes that Fidelity's investment professionals have sufficient access to global information and data so as to provide competitive investment results over time, and that those professionals also have access to sophisticated tools that permit them to assess portfolio construction and risk and performance attribution characteristics continuously, as well as to transmit new information and research conclusions rapidly around the world. Additionally, in its deliberations, the Board considered the Investment Advisers' trading and risk management capabilities and resources, which are an integral part of the investment management process.
Shareholder and Administrative Services. The Board considered (i) the nature, extent, quality, and cost of advisory, administrative, and shareholder services performed by the Investment Advisers and their affiliates under the Advisory Contracts and under separate agreements covering transfer agency, pricing and bookkeeping, and securities lending services for the fund; (ii) the nature and extent of the supervision of third party service providers, principally custodians and subcustodians; and (iii) the resources devoted to, and the record of compliance with, the fund's compliance policies and procedures. The Board also reviewed the allocation of fund brokerage, including allocations to brokers affiliated with the Investment Advisers, the use of brokerage commissions to pay fund expenses, and the use of "soft" commission dollars to pay for research services.
Annual Report
Board Approval of Investment Advisory Contracts and
Management Fees - continued
The Board noted that the growth of fund assets over time across the complex allows Fidelity to reinvest in the development of services designed to enhance the value or convenience of the Fidelity funds as investment vehicles. These services include 24-hour access to account information and market information through telephone representatives and over the Internet, investor education materials and asset allocation tools, and the expanded availability of Fidelity Investor Centers.
Investment in a Large Fund Family. The Board considered the benefits to shareholders of investing in a Fidelity fund, including the benefits of investing in a fund that is part of a large family of funds offering a variety of investment disciplines and providing a large variety of mutual fund investor services. The Board noted that Fidelity had taken, or had made recommendations that resulted in the Fidelity funds taking, a number of actions over the previous year that benefited particular funds, including (i) continuing to dedicate additional resources to investment research and support of the senior management team that oversees asset management; (ii) persisting in efforts to enhance Fidelity's research capabilities, in particular, international research; (iii) launching new funds and making other enhancements to meet client needs for global and income-oriented solutions; (iv) continuing to launch dedicated lower cost underlying funds to meet investment management's portfolio construction needs related to expanding underlying fund options, specifically for the Freedom Fund product lines; (v) adopting a "Stock Selector" sector neutral investment approach and employing a team of portfolio managers who are sector specialists to manage certain funds; (vi) rationalizing product lines and gaining increased efficiencies through the mergers of several funds into other funds; (vii) strengthening the Spartan Index Fund product line by adding new funds and/or new low-cost institutional share classes, restructuring fund expenses to accommodate new classes, and reducing investment minimums for certain classes of shares; (viii) modifying the eligibility criteria for Institutional Class shares to increase their appeal to government entities and charitable investors; and (ix) reducing certain transfer agent fee rates.
Investment Performance. The Board considered whether the fund has operated in accordance with its investment objective, as well as its record of compliance with its investment restrictions. It also reviewed the fund's absolute investment performance for each class, as well as the fund's relative investment performance for each class measured over multiple periods against (i) a broad-based securities market index, and (ii) a custom peer group of mutual funds deemed appropriate by Fidelity and reviewed by the Board. The following charts considered by the Board show, over the one-, three-, and five-year periods ended December 31, 2011, the cumulative total returns of Institutional Class (Class I) and Class B of the fund, the cumulative total returns of a broad-based securities market index ("benchmark"), and a range of cumulative total returns of a custom peer group of mutual funds defined by FMR based on categories assigned by Morningstar, Inc. The returns of Institutional Class (Class I) and Class B show the performance of the highest and lowest performing classes, respectively (based on five-year performance). The box within each chart shows the 25th percentile return (top of box) and the 75th percentile return (bottom of box) of the peer group. Returns shown above the box are in the first quartile and returns shown below the box are in the fourth quartile. The percentage beaten numbers noted below each chart correspond to the percentile box and represent the percentage of funds in the peer group whose performance was equal to or lower than that of the class indicated. The fund's custom peer group, defined by FMR, is a peer group that FMR believes provides a more meaningful performance comparison than the peer group assigned by Morningstar, Inc., which assigns mutual funds to categories based on their investment styles as measured by their underlying portfolio holdings.
Annual Report
Fidelity International Value Fund

The Board reviewed the fund's relative investment performance against its peer group and noted that the performance of Institutional Class (Class I) of the fund was in the fourth quartile for the one- and five-year periods and the third quartile for the three-year period. The Board also noted that the investment performance of the fund was lower than its benchmark for all the periods shown. The Board considered that the variations in performance among the fund's classes reflect the variations in class expenses, which result in lower performance for higher expense classes. The Board discussed with FMR actions to improve the fund's disappointing performance relative to its peer group and benchmark. The Board noted that this fund had underperformed in the past and discussed with FMR its disappointment with the continued underperformance of the fund. The Board noted that there was a portfolio management change for the fund in September 2011. The Board also reviewed the fund's performance since inception as well as performance in the current year. The Board will continue to closely monitor the performance of the fund in the coming year and discuss with FMR other appropriate actions to address the performance of the fund.
Annual Report
Board Approval of Investment Advisory Contracts and
Management Fees - continued
The Board also considered that the fund's management fee is subject to upward or downward adjustment depending upon whether, and to what extent, the fund's investment performance for the performance period exceeds, or is exceeded by, the record (over the same period) of a Board-approved performance adjustment index. The Board noted that the performance adjustment provides FMR with a strong economic incentive to seek to achieve superior performance for the fund's shareholders and helps to more closely align the interests of FMR and the fund's shareholders.
Based on its review, the Board concluded that the nature, extent, and quality of services provided to the fund under the Advisory Contracts should benefit the fund's shareholders.
Competitiveness of Management Fee and Total Expense Ratio. The Board considered the fund's management fee and total expense ratio compared to "mapped groups" of competitive funds and classes. Fidelity creates "mapped groups" by combining similar Lipper investment objective categories that have comparable management fee characteristics. Combining Lipper investment objective categories aids the Board's management fee and total expense ratio comparisons by broadening the competitive group used for comparison and by reducing the number of universes to which various Fidelity funds are compared.
Management Fee. The Board considered two proprietary management fee comparisons for the 12-month periods shown in the chart below. The group of Lipper funds used by the Board for management fee comparisons is referred to below as the "Total Mapped Group." The Total Mapped Group comparison focuses on a fund's standing relative to the total universe of comparable funds available to investors in terms of gross management fees before expense reimbursements or caps, and without giving effect to the fund's performance adjustment. "TMG %" represents the percentage of funds in the Total Mapped Group that had management fees that were lower than the fund's. For example, a TMG % of 17% means that 83% of the funds in the Total Mapped Group had higher management fees than the fund. The "Asset-Size Peer Group" (ASPG) comparison focuses on a fund's standing relative to non-Fidelity funds similar in size to the fund within the Total Mapped Group. The ASPG represents at least 15% of the funds in the Total Mapped Group with comparable asset size and management fee characteristics, subject to a minimum of 50 funds (or all funds in the Total Mapped Group if fewer than 50). Additional information, such as the ASPG quartile in which the fund's management fee ranked and the impact of the fund's performance adjustment, is also included in the chart and considered by the Board.
Annual Report
Fidelity International Value Fund

The Board noted that the fund's management fee ranked below the median of its Total Mapped Group and below the median of its ASPG for 2011. The Board also noted the effect of the fund's negative performance adjustment on the fund's management fee ranking. The Board noted that the performance adjustment for each year represents calculations for performance periods that differ from the periods shown in the performance charts above.
Based on its review, the Board concluded that the fund's management fee is fair and reasonable in light of the services that the fund receives and the other factors considered.
Total Expense Ratio. In its review of each class's total expense ratio, the Board considered the fund's management fee as well as other fund or class expenses, as applicable, such as transfer agent fees, pricing and bookkeeping fees, fund-paid 12b-1 fees, and custodial, legal, and audit fees. The Board also noted the effects of any waivers and reimbursements on fees and expenses, as well as the impact of the fund's performance adjustment. As part of its review, the Board also considered the current and historical total expense ratios of each class of the fund compared to competitive fund median expenses. Each class of the fund is compared to those funds and classes in the Total Mapped Group (used by the Board for management fee comparisons) that have a similar sales load structure.
The Board noted that the total expense ratio of each of Class A, Class B, Class C, Institutional Class, and the retail class ranked below its competitive median for 2011 and the total expense ratio of Class T ranked above its competitive median for 2011. The Board considered that various factors, including 12b-1 fees, positive or negative performance adjustments, and relatively higher other expenses in the case of small fund size, can affect total expense ratios. The Board noted that the total expense ratio of Class T was above the competitive median primarily because of higher 12b-1 fees on Class T. Class T has a higher 12b-1 fee, but a lower front-end sales charge, than traditionally priced front-end sales charge classes. The Board considered that Class T is primarily sold load-waived in the retirement plan market where its 0.50% 12b-1 fee is comparable to competing no-load, higher 12b-1 fee classes designed specifically for retirement plans. The Board noted that the fund offers multiple classes, each of which has a different sales load and 12b-1 fee structure, and that the multiple structures are intended to offer a range of pricing options for the intermediary market. The Board also noted that the total expense ratios of the classes vary primarily by the level of their 12b-1 fees, although differences in transfer agent fees may also cause expenses to vary from class to class.
Annual Report
Board Approval of Investment Advisory Contracts and
Management Fees - continued
Fees Charged to Other Fidelity Clients. The Board also considered Fidelity fee structures and other information with respect to clients of FMR and its affiliates, such as other mutual funds advised or subadvised by FMR or its affiliates, pension plan clients, and other institutional clients. The Board noted the findings of the 2010 ad hoc joint committee (created with the board of other Fidelity funds), which reviewed and compared Fidelity's institutional investment advisory business with its business of providing services to the Fidelity funds, including the differences in services provided, fees charged, and costs incurred, as well as competition in their respective marketplaces.
Based on its review of total expense ratios and fees charged to other Fidelity clients, the Board concluded that the total expense ratio of each class of the fund was reasonable, although Class T was above the median of the universe presented for comparison, in light of the services that the fund and its shareholders receive and the other factors considered.
Costs of the Services and Profitability. The Board considered the revenues earned and the expenses incurred by Fidelity in conducting the business of developing, marketing, distributing, managing, administering and servicing the fund and its shareholders. The Board also considered the level of Fidelity's profits in respect of all the Fidelity funds.
On an annual basis, FMR presents to the Board Fidelity's profitability for the fund. Fidelity calculates the profitability for each fund, as well as aggregate profitability for groups of Fidelity funds and all Fidelity funds, using a series of detailed revenue and cost allocation methodologies which originate with the books and records of Fidelity on which Fidelity's audited financial statements are based. The Audit Committee of the Board reviews any significant changes from the prior year's methodologies.
PricewaterhouseCoopers LLP (PwC), independent registered public accounting firm and auditor to Fidelity and certain Fidelity funds, has been engaged annually by the Board as part of the Board's assessment of Fidelity's profitability analysis. PwC's engagement includes the review and assessment of Fidelity's methodologies used in determining the revenues and expenses attributable to Fidelity's mutual fund business, and completion of agreed-upon procedures surrounding the mathematical accuracy of fund profitability and its conformity to allocation methodologies. After considering PwC's reports issued under the engagement and information provided by Fidelity, the Board concluded that while other allocation methods may also be reasonable, Fidelity's profitability methodologies are reasonable in all material respects.
Annual Report
The Board also reviewed Fidelity's non-fund businesses and fall-out benefits related to the mutual fund business as well as cases where Fidelity's affiliates may benefit from or be related to the fund's business.
The Board considered the costs of the services provided by and the profits realized by Fidelity in connection with the operation of the fund and was satisfied that the profitability was not excessive in the circumstances.
Economies of Scale. The Board considered whether there have been economies of scale in respect of the management of the Fidelity funds, whether the Fidelity funds (including the fund) have appropriately benefited from any such economies of scale, and whether there is potential for realization of any further economies of scale. The Board considered the extent to which the fund will benefit from economies of scale through increased services to the fund, through waivers or reimbursements, or through fee or expense reductions. The Board also noted that in 2009, it and the board of other Fidelity funds created an ad hoc committee (the Economies of Scale Committee) to analyze whether FMR attains economies of scale in respect of the management and servicing of the Fidelity funds, whether the Fidelity funds have appropriately benefited from such economies of scale, and whether there is potential for realization of any further economies of scale.
The Board recognized that the fund's management contract incorporates a "group fee" structure, which provides for lower group fee rates as total fund assets under FMR's management increase, and for higher group fee rates as total fund assets under FMR's management decrease. FMR calculates the group fee rates based on a tiered asset "breakpoint" schedule that varies based on asset class. The Board considered that the group fee is designed to deliver the benefits of economies of scale to fund shareholders when total Fidelity fund assets increase, even if assets of any particular fund are unchanged or have declined, because some portion of Fidelity's costs are attributable to services provided to all Fidelity funds, and all funds benefit if those costs can be allocated among more assets. The Board concluded that, given the group fee structure, fund shareholders will benefit from lower management fees as assets under FMR's management increase at the fund complex level, regardless of whether Fidelity achieves any such economies of scale.
Annual Report
Board Approval of Investment Advisory Contracts and
Management Fees - continued
The Board concluded, taking into account the analysis of the Economies of Scale Committee, that economies of scale, if any, are being appropriately shared between fund shareholders and Fidelity.
Additional Information Requested by the Board. In order to develop fully the factual basis for consideration of the Fidelity funds' Advisory Contracts, the Board requested and received additional information on certain topics, including (i) fund performance trends, actions to be taken by FMR to improve certain funds' overall performance, and Fidelity's long-term strategies for certain funds; (ii) the potential to further rationalize the Fidelity fund lineup with the possibility of achieving savings for the funds and Fidelity; (iii) Fidelity's compensation structure for portfolio managers and other key investment personnel; (iv) the amount of the investment that each portfolio manager has made in the Fidelity fund(s) that he or she manages; (v) the realization of fall-out benefits in certain Fidelity business units; (vi) Fidelity's group fee structures, the potential impact of regulatory changes on such structures, and the rationale for the individual fee rates of certain funds; (vii) fund profitability methodology, including Fidelity's cost allocation methodology, and the impact of certain factors on fund profitability results; (viii) trends regarding industry use of performance fee structures and the possibility of implementing performance fee structures for additional funds; and (ix) the impact of net redemptions from the Fidelity funds.
Based on its evaluation of all of the conclusions noted above, and after considering all factors it believed relevant, the Board ultimately concluded that the advisory fee structures are fair and reasonable, and that the fund's Advisory Contracts should be renewed.
Annual Report
Investment Adviser
Fidelity Management & Research Company
Boston, MA
Investment Sub-Advisers
FMR Co., Inc.
Fidelity Management & Research
(U.K.) Inc.
Fidelity Management & Research
(Hong Kong) Limited
Fidelity Management & Research
(Japan) Inc.
FIL Investment Advisors
FIL Investments (Japan) Limited
FIL Investment Advisors (U.K.) Ltd.
General Distributor
Fidelity Distributors Corporation
Smithfield, RI
Transfer and Service Agents
Fidelity Investments Institutional Operations Company, Inc.
Boston, MA
Fidelity Service Company, Inc.
Boston, MA
Custodian
The Northern Trust Company
Chicago, IL
(Fidelity Investment logo)(registered trademark)
AFIVI-UANN-1212
1.827488.106
Fidelity®
International Value
Fund
Annual Report
October 31, 2012
(Fidelity Cover Art)
Contents
Performance | (Click Here) | How the fund has done over time. |
Management's Discussion of Fund Performance | (Click Here) | The Portfolio Manager's review of fund performance and strategy. |
Shareholder Expense Example | (Click Here) | An example of shareholder expenses. |
Investment Changes | (Click Here) | A summary of major shifts in the fund's investments over the past six months. |
Investments | (Click Here) | A complete list of the fund's investments with their market values. |
Financial Statements | (Click Here) | Statements of assets and liabilities, operations, and changes in net assets, as well as financial highlights. |
Notes | (Click Here) | Notes to financial statements. |
Report of Independent Registered Public Accounting Firm | (Click Here) | |
Trustees and Officers | (Click Here) | |
Distributions | (Click Here) | |
Board Approval of Investment Advisory Contracts and Management Fees | (Click Here) | |
To view a fund's proxy voting guidelines and proxy voting record for the 12-month period ended June 30, visit http://www.fidelity.com/proxyvotingresults or visit the Securities and Exchange Commission's (SEC) web site at http://www.sec.gov. You may also call 1-800-544-8544 to request a free copy of the proxy voting guidelines.
Standard & Poor's, S&P and S&P 500 are registered service marks of The McGraw-Hill Companies, Inc. and have been licensed for use by Fidelity Distributors Corporation.
Other third party marks appearing herein are the property of their respective owners.
All other marks appearing herein are registered or unregistered trademarks or service marks of FMR LLC or an affiliated company. © 2012 FMR LLC. All rights reserved.
Annual Report
This report and the financial statements contained herein are submitted for the general information of the shareholders of the fund. This report is not authorized for distribution to prospective investors in the fund unless preceded or accompanied by an effective prospectus.
A fund files its complete schedule of portfolio holdings with the SEC for the first and third quarters of each fiscal year on Form N-Q. Forms N-Q are available on the SEC's web site at http://www.sec.gov. A fund's Forms N-Q may be reviewed and copied at the SEC's Public Reference Room in Washington, DC. Information regarding the operation of the SEC's Public Reference Room may be obtained by calling 1-800-SEC-0330. For a complete list of a fund's portfolio holdings, view the most recent holdings listing, semiannual report, or annual report on Fidelity's web site at http://www.fidelity.com, http://www.advisor.fidelity.com, or http://www.401k.com, as applicable.
NOT FDIC INSURED • MAY LOSE VALUE • NO BANK GUARANTEE
Neither the fund nor Fidelity Distributors Corporation is a bank.
Annual Report
Average annual total return reflects the change in the value of an investment, assuming reinvestment of the class' distributions from dividend income and capital gains (the profits earned upon the sale of securities that have grown in value, if any) and assuming a constant rate of performance each year. The $10,000 table and the fund's returns do not reflect the deduction of taxes that a shareholder would pay on fund distributions or the redemption of fund shares. During periods of reimbursement by Fidelity, a fund's total return will be greater than it would be had the reimbursement not occurred. How a fund did yesterday is no guarantee of how it will do tomorrow.
Average Annual Total Returns
Periods ended October 31, 2012 | Past 1
year | Past 5
years | Life of
fund A |
Fidelity® International Value Fund | 9.19% | -7.63% | -1.90% |
A From May 18, 2006
$10,000 Over Life of Fund
Let's say hypothetically that $10,000 was invested in Fidelity® International Value Fund, a class of the fund, on May 18, 2006, when the fund started. The chart shows how the value of your investment would have changed, and also shows how the MSCI® EAFE® Value Index performed over the same period.
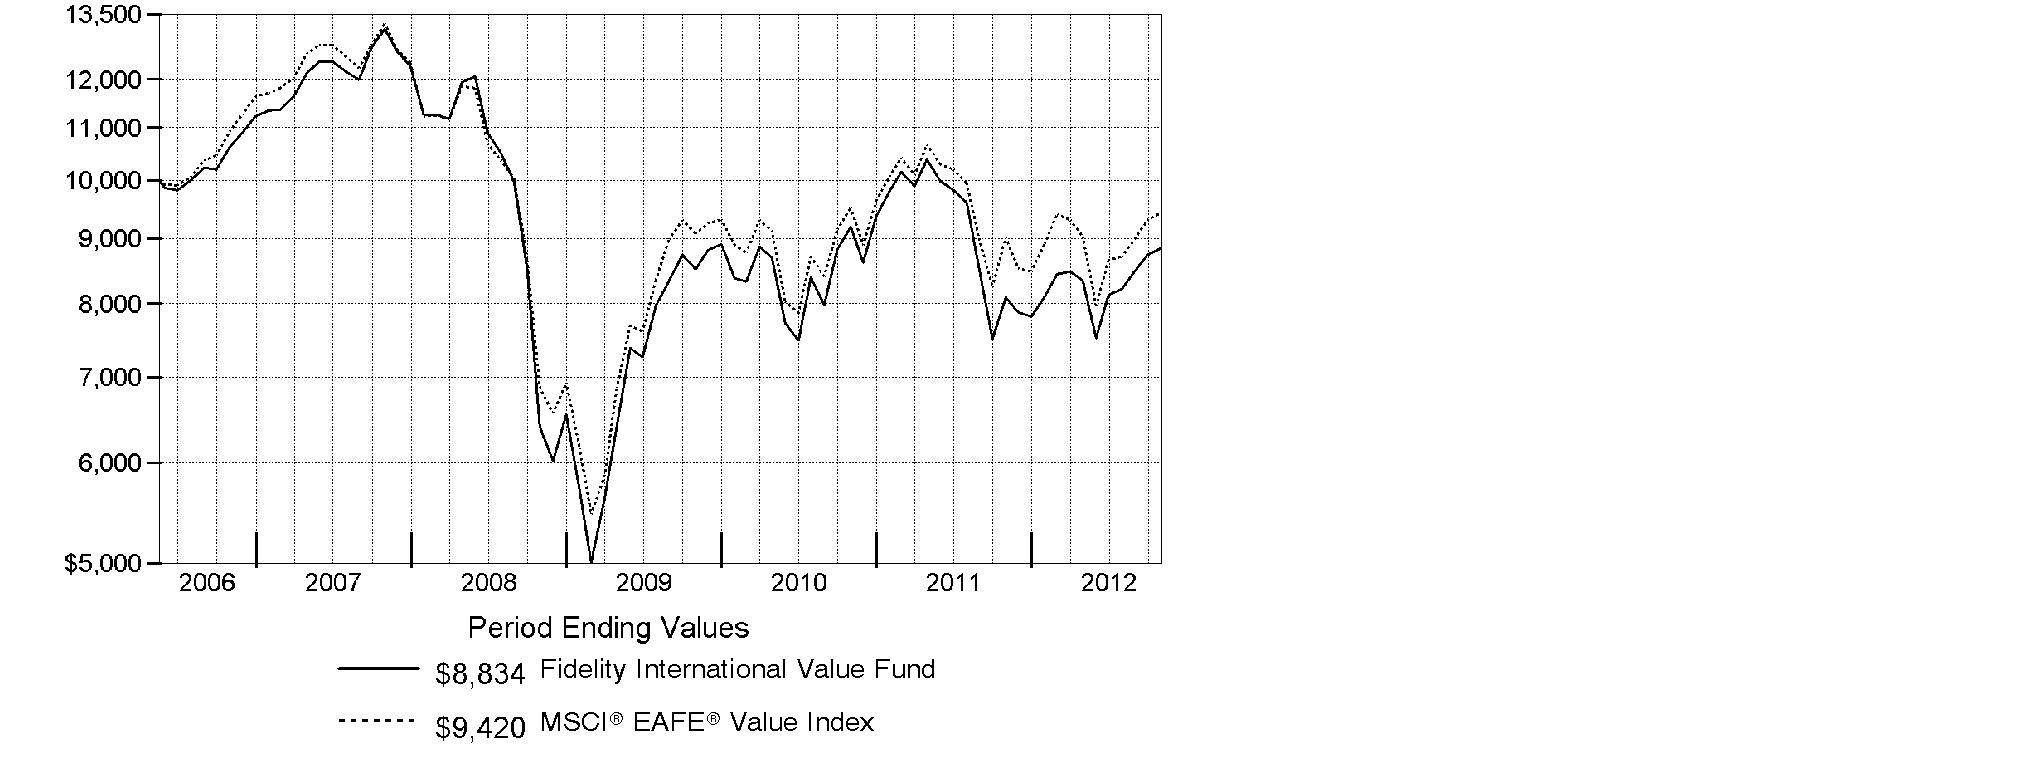
Annual Report
Market Recap: International stocks experienced pendulum-like swings during the 12 months ending October 31, 2012, finishing the period with a modest advance. The market faced periodic bouts of volatility this past year, as a number of macroeconomic concerns - including the eurozone debt crisis, the strength and pace of the U.S. economic recovery, and a slowdown in China's once-blistering growth - dominated headlines and weighed on investors. While a stronger U.S. dollar provided an additional head wind, foreign developed- and emerging-markets stocks still managed a gain for the 12 months, as the MSCI® ACWI® (All Country World Index) ex USA Index rose 4.11%, largely buttressed in the summertime by pledges of accommodative monetary action from eurozone officials, as well as signs that the U.S. housing market was on the mend. Within the index, Asia-Pacific ex Japan showed the most impressive gains, advancing roughly 11%. A number of core European components, most notably Germany (+11%), Switzerland (+10%) and the U.K. (+9%), benefited from optimism about the eurozone's ability to resolve its debt woes, which also helped the region outpace the index overall. Elsewhere, results from Canada (+3%) and the generally more volatile emerging markets (+2%) each fell short of the MSCI index, while Japan was among the few benchmark constituents to finish in the red, returning about -3%.
Comments from Alex Zavratsky, Portfolio Manager of Fidelity® International Value Fund: For the year, the fund's Retail Class shares rose 9.19%, easily outpacing the 4.64% gain of the benchmark MSCI® EAFE® Value Index. Investments in two pharmaceuticals firms - France's Sanofi and non-index Roche Holding of Switzerland - were standouts. Within this industry, I focused on companies where product patent cliffs were either behind them or were well understood so they could focus on future growth. Elsewhere, I avoided benchmark components Telefonica - Spain's telecom giant - and France Telecom, as I believed pressure on both companies' cash flow, too much debt, poor business fundamentals and unsustainable dividend yields would hamper each stock. That proved to be the right call. Similarly, I did not invest in Finnish mobile device maker Nokia. Given the strength of competitors Samsung Electronics and Apple, I believed Nokia, with its non-differentiated product, was at a technological and brand disadvantage. Individual detractors included Repsol, a Spain-based integrated oil and gas company that suffered because Argentina moved to nationalize the company's local unit. An untimely investment in Japanese electronics manufacturer Hitachi also hurt.
The views expressed above reflect those of the portfolio manager(s) only through the end of the period as stated on the cover of this report and do not necessarily represent the views of Fidelity or any other person in the Fidelity organization. Any such views are subject to change at any time based upon market or other conditions and Fidelity disclaims any responsibility to update such views. These views may not be relied on as investment advice and, because investment decisions for a Fidelity fund are based on numerous factors, may not be relied on as an indication of trading intent on behalf of any Fidelity fund.
Annual Report
Shareholder Expense Example
As a shareholder of the Fund, you incur two types of costs: (1) transaction costs, including sales charges (loads) on purchase payments or redemption proceeds, redemption fees and (2) ongoing costs, including management fees, distribution and/or service (12b-1) fees and other Fund expenses. This Example is intended to help you understand your ongoing costs (in dollars) of investing in the Fund and to compare these costs with the ongoing costs of investing in other mutual funds.
The Example is based on an investment of $1,000 invested at the beginning of the period and held for the entire period (May 1, 2012 to October 31, 2012).
Actual Expenses
The first line of the accompanying table for each class of the Fund provides information about actual account values and actual expenses. You may use the information in this line, together with the amount you invested, to estimate the expenses that you paid over the period. Simply divide your account value by $1,000.00 (for example, an $8,600 account value divided by $1,000.00 = 8.6), then multiply the result by the number in the first line for a class of the Fund under the heading entitled "Expenses Paid During Period" to estimate the expenses you paid on your account during this period. A small balance maintenance fee of $12.00 that is charged once a year may apply for certain accounts with a value of less than $2,000. This fee is not included in the table below. If it was, the estimate of expenses you paid during the period would be higher, and your ending account value lower, by this amount. In addition, the Fund, as a shareholder in the underlying Fidelity Central Funds, will indirectly bear its pro-rata share of the fees and expenses incurred by the underlying Fidelity Central Funds. These fees and expenses are not included in the Fund's annualized expense ratio used to calculate the expense estimate in the table below.
Hypothetical Example for Comparison Purposes
The second line of the accompanying table for each class of the Fund provides information about hypothetical account values and hypothetical expenses based on a Class' actual expense ratio and an assumed rate of return of 5% per year before expenses, which is not the Class' actual return. The hypothetical account values and expenses may not be used to estimate the actual ending account balance or expenses you paid for the period. You may use this information to compare the ongoing costs of investing in the Fund and other funds. To do so, compare this 5% hypothetical example with the 5% hypothetical examples that appear in the shareholder reports of the other funds. A small balance maintenance fee of $12.00 that is charged once a year may apply for certain accounts with a value of less than $2,000. This fee is not included in the table below. If it was, the estimate of expenses you paid during the period would be higher, and your ending account value lower, by this amount. In addition, the Fund, as a shareholder in the underlying Fidelity Central Funds, will indirectly bear its pro-rata share of the fees and expenses incurred by the underlying Fidelity Central Funds. These fees and expenses are not included in the Fund's annualized expense ratio used to calculate the expense estimate in the table below.
Please note that the expenses shown in the table are meant to highlight your ongoing costs only and do not reflect any transaction costs. Therefore, the second line of the table is useful in comparing ongoing costs only, and will not help you determine the relative total costs of owning different funds. In addition, if these transactional costs were included, your costs would have been higher.
Annual Report
| Annualized Expense Ratio | Beginning
Account Value
May 1, 2012 | Ending
Account Value
October 31, 2012 | Expenses Paid
During Period*
May 1, 2012 to October 31, 2012 |
Class A | 1.45% | | | |
Actual | | $ 1,000.00 | $ 1,057.20 | $ 7.50 |
HypotheticalA | | $ 1,000.00 | $ 1,017.85 | $ 7.35 |
Class T | 1.70% | | | |
Actual | | $ 1,000.00 | $ 1,055.80 | $ 8.78 |
HypotheticalA | | $ 1,000.00 | $ 1,016.59 | $ 8.62 |
Class B | 2.20% | | | |
Actual | | $ 1,000.00 | $ 1,054.20 | $ 11.36 |
HypotheticalA | | $ 1,000.00 | $ 1,014.08 | $ 11.14 |
Class C | 2.20% | | | |
Actual | | $ 1,000.00 | $ 1,054.30 | $ 11.36 |
HypotheticalA | | $ 1,000.00 | $ 1,014.08 | $ 11.14 |
International Value | 1.16% | | | |
Actual | | $ 1,000.00 | $ 1,060.20 | $ 6.01 |
HypotheticalA | | $ 1,000.00 | $ 1,019.30 | $ 5.89 |
Institutional Class | 1.13% | | | |
Actual | | $ 1,000.00 | $ 1,058.60 | $ 5.85 |
HypotheticalA | | $ 1,000.00 | $ 1,019.46 | $ 5.74 |
A 5% return per year before expenses
* Expenses are equal to each Class' annualized expense ratio, multiplied by the average account value over the period, multiplied by 184/366 (to reflect the one-half year period).
Annual Report
Investment Changes (Unaudited)
Geographic Diversification (% of fund's net assets) |
As of October 31, 2012 |
 | United Kingdom 26.3% | |
 | Japan 17.2% | |
 | Germany 10.3% | |
 | Switzerland 9.8% | |
 | France 9.8% | |
 | Australia 8.3% | |
 | Italy 3.3% | |
 | Netherlands 2.9% | |
 | Singapore 2.5% | |
| Other * 9.6% | |

* Includes short-term investments and net other assets (liabilities).
Percentages are based on country or territory of incorporation and are adjusted for the effect of futures contracts, if applicable. |
As of April 30, 2012 |
| United Kingdom 27.4% | |
| Japan 22.7% | |
| Germany 10.3% | |
| Switzerland 9.7% | |
| Australia 7.5% | |
| France 7.4% | |
| Netherlands 3.5% | |
| Italy 2.7% | |
| Spain 1.8% | |
| Other * 7.0% | |

* Includes short-term investments and net other assets (liabilities).
Percentages are based on country or territory of incorporation and are adjusted for the effect of futures contracts, if applicable. |
Asset Allocation |
| % of fund's
net assets | % of fund's net assets
6 months ago |
Stocks | 99.0 | 99.1 |
Short-Term Investments and Net Other Assets (Liabilities) | 1.0 | 0.9 |
Top Ten Stocks as of October 31, 2012 |
| % of fund's
net assets | % of fund's net assets
6 months ago |
Royal Dutch Shell PLC Class A sponsored ADR (United Kingdom, Oil, Gas & Consumable Fuels) | 4.6 | 5.1 |
Sanofi SA (France, Pharmaceuticals) | 3.5 | 3.2 |
Roche Holding AG (participation certificate) (Switzerland, Pharmaceuticals) | 3.0 | 3.8 |
Vodafone Group PLC (United Kingdom, Wireless Telecommunication Services) | 3.0 | 3.5 |
HSBC Holdings PLC sponsored ADR (United Kingdom, Commercial Banks) | 2.6 | 2.1 |
Commonwealth Bank of Australia (Australia, Commercial Banks) | 2.5 | 2.3 |
ENI SpA (Italy, Oil, Gas & Consumable Fuels) | 2.5 | 1.9 |
Australia & New Zealand Banking Group Ltd. (Australia, Commercial Banks) | 2.1 | 2.4 |
BHP Billiton PLC (United Kingdom, Metals & Mining) | 1.9 | 0.0 |
BNP Paribas SA (France, Commercial Banks) | 1.9 | 1.0 |
| 27.6 | |
Market Sectors as of October 31, 2012 |
| % of fund's
net assets | % of fund's net assets
6 months ago |
Financials | 32.5 | 26.7 |
Health Care | 11.9 | 13.2 |
Energy | 11.1 | 11.8 |
Consumer Discretionary | 8.6 | 9.0 |
Industrials | 7.7 | 7.5 |
Consumer Staples | 7.5 | 9.1 |
Telecommunication Services | 6.8 | 7.0 |
Utilities | 6.0 | 7.1 |
Materials | 5.6 | 5.0 |
Information Technology | 1.3 | 2.7 |
Annual Report
Investments October 31, 2012
Showing Percentage of Net Assets
Common Stocks - 97.7% |
| Shares | | Value |
Australia - 8.3% |
Australia & New Zealand Banking Group Ltd. | 110,422 | | $ 2,917,170 |
Commonwealth Bank of Australia | 57,527 | | 3,448,593 |
Origin Energy Ltd. | 46,320 | | 546,217 |
Sydney Airport unit | 236,028 | | 830,580 |
Telstra Corp. Ltd. | 279,594 | | 1,201,563 |
Transurban Group unit | 89,247 | | 563,269 |
Westfield Group unit | 136,805 | | 1,513,831 |
Woolworths Ltd. | 17,763 | | 542,288 |
TOTAL AUSTRALIA | | 11,563,511 |
Bailiwick of Jersey - 0.5% |
Wolseley PLC | 16,207 | | 708,513 |
Belgium - 0.2% |
KBC Groupe SA | 12,008 | | 281,867 |
Bermuda - 0.3% |
Cheung Kong Infrastructure Holdings Ltd. | 81,000 | | 474,500 |
Canada - 0.5% |
Suncor Energy, Inc. | 20,900 | | 701,445 |
Cayman Islands - 0.4% |
ENN Energy Holdings Ltd. | 148,000 | | 615,867 |
Finland - 0.7% |
Sampo OYJ (A Shares) | 33,034 | | 1,035,316 |
France - 9.8% |
Arkema SA | 9,139 | | 833,214 |
Atos Origin SA | 12,769 | | 857,483 |
BNP Paribas SA | 51,793 | | 2,605,373 |
Compagnie de St. Gobain | 20,100 | | 708,371 |
GDF Suez | 48,080 | | 1,103,356 |
Pernod Ricard SA | 6,700 | | 721,050 |
PPR SA | 3,642 | | 640,346 |
Sanofi SA | 55,722 | | 4,893,923 |
Schneider Electric SA | 7,500 | | 468,898 |
Unibail-Rodamco | 3,500 | | 788,675 |
TOTAL FRANCE | | 13,620,689 |
Germany - 9.0% |
Allianz AG | 19,369 | | 2,401,557 |
BASF AG | 9,769 | | 809,487 |
Bayer AG | 29,490 | | 2,568,235 |
Daimler AG (Germany) | 27,237 | | 1,271,799 |
Deutsche Post AG | 48,764 | | 966,727 |
Common Stocks - continued |
| Shares | | Value |
Germany - continued |
Fresenius SE & Co. KGaA | 7,100 | | $ 809,835 |
HeidelbergCement Finance AG | 13,393 | | 709,823 |
RWE AG | 28,200 | | 1,288,621 |
Siemens AG | 16,709 | | 1,683,582 |
TOTAL GERMANY | | 12,509,666 |
Hong Kong - 1.1% |
Cheung Kong Holdings Ltd. | 94,000 | | 1,388,765 |
Hysan Development Co. Ltd. | 35,000 | | 154,676 |
TOTAL HONG KONG | | 1,543,441 |
Italy - 3.3% |
ENI SpA | 148,500 | | 3,417,123 |
Fiat Industrial SpA | 37,600 | | 407,183 |
Saipem SpA | 16,432 | | 738,200 |
TOTAL ITALY | | 4,562,506 |
Japan - 17.2% |
Aeon Credit Service Co. Ltd. | 40,900 | | 867,902 |
Air Water, Inc. | 57,000 | | 714,017 |
Aozora Bank Ltd. | 160,000 | | 450,958 |
Astellas Pharma, Inc. | 33,100 | | 1,644,012 |
Chubu Electric Power Co., Inc. | 45,400 | | 468,047 |
Credit Saison Co. Ltd. | 29,800 | | 654,383 |
Denso Corp. | 29,700 | | 929,729 |
Hitachi Ltd. | 195,000 | | 1,033,258 |
Honda Motor Co. Ltd. | 60,900 | | 1,830,852 |
INPEX Corp. | 80 | | 455,969 |
Itochu Corp. | 74,300 | | 743,652 |
Japan Retail Fund Investment Corp. | 322 | | 586,885 |
Japan Tobacco, Inc. | 49,400 | | 1,365,106 |
JSR Corp. | 34,600 | | 592,920 |
Mitsubishi Corp. | 52,600 | | 938,933 |
Mitsubishi Estate Co. Ltd. | 56,000 | | 1,107,654 |
Nippon Telegraph & Telephone Corp. | 14,500 | | 663,058 |
ORIX Corp. | 7,800 | | 801,203 |
Santen Pharmaceutical Co. Ltd. | 16,100 | | 704,867 |
Seven & i Holdings Co., Ltd. | 61,300 | | 1,890,525 |
Seven Bank Ltd. | 237,800 | | 679,173 |
Softbank Corp. | 24,200 | | 766,045 |
Sumitomo Mitsui Financial Group, Inc. | 79,100 | | 2,417,059 |
Sumitomo Realty & Development Co. Ltd. | 24,000 | | 662,608 |
Common Stocks - continued |
| Shares | | Value |
Japan - continued |
Toyo Suisan Kaisha Ltd. | 21,000 | | $ 523,224 |
USS Co. Ltd. | 4,950 | | 520,237 |
TOTAL JAPAN | | 24,012,276 |
Netherlands - 2.9% |
ING Groep NV (Certificaten Van Aandelen) (a) | 185,100 | | 1,647,045 |
Koninklijke Philips Electronics NV | 44,813 | | 1,122,389 |
Unilever NV (Certificaten Van Aandelen) (Bearer) (d) | 33,231 | | 1,221,393 |
TOTAL NETHERLANDS | | 3,990,827 |
Norway - 1.1% |
Orkla ASA (A Shares) | 62,718 | | 496,129 |
Telenor ASA | 55,400 | | 1,089,285 |
TOTAL NORWAY | | 1,585,414 |
Singapore - 2.5% |
Ascendas Real Estate Investment Trust | 370,000 | | 715,855 |
ComfortDelgro Corp. Ltd. | 322,000 | | 446,122 |
Singapore Telecommunications Ltd. | 319,000 | | 842,089 |
United Overseas Bank Ltd. | 95,480 | | 1,430,087 |
TOTAL SINGAPORE | | 3,434,153 |
Spain - 2.1% |
Banco Bilbao Vizcaya Argentaria SA sponsored ADR | 235,732 | | 1,956,576 |
Repsol YPF SA | 51,674 | | 1,032,789 |
TOTAL SPAIN | | 2,989,365 |
Sweden - 1.0% |
Svenska Handelsbanken AB (A Shares) | 39,700 | | 1,359,864 |
Switzerland - 9.8% |
Nestle SA | 40,121 | | 2,546,066 |
Roche Holding AG (participation certificate) | 21,838 | | 4,199,706 |
Swisscom AG | 2,015 | | 837,113 |
Syngenta AG (Switzerland) | 3,805 | | 1,483,530 |
UBS AG (NY Shares) | 170,471 | | 2,560,474 |
Zurich Financial Services AG | 8,244 | | 2,031,567 |
TOTAL SWITZERLAND | | 13,658,456 |
United Kingdom - 26.3% |
Barclays PLC | 497,760 | | 1,840,585 |
BHP Billiton PLC | 81,621 | | 2,616,056 |
BP PLC sponsored ADR | 51,735 | | 2,218,914 |
British American Tobacco PLC (United Kingdom) | 20,547 | | 1,019,123 |
Common Stocks - continued |
| Shares | | Value |
United Kingdom - continued |
British Land Co. PLC | 103,823 | | $ 885,472 |
Bunzl PLC | 53,625 | | 887,008 |
Centrica PLC | 243,703 | | 1,274,607 |
Compass Group PLC | 114,100 | | 1,252,076 |
GlaxoSmithKline PLC sponsored ADR | 35,885 | | 1,611,237 |
HSBC Holdings PLC sponsored ADR | 74,201 | | 3,662,561 |
Imperial Tobacco Group PLC | 15,487 | | 584,816 |
Kingfisher PLC | 141,328 | | 660,257 |
Legal & General Group PLC | 561,996 | | 1,215,274 |
National Grid PLC | 167,609 | | 1,911,507 |
Next PLC | 11,500 | | 661,783 |
Prudential PLC | 82,740 | | 1,136,318 |
Reed Elsevier PLC | 129,874 | | 1,270,080 |
Royal Dutch Shell PLC Class A sponsored ADR | 92,447 | | 6,330,767 |
Scottish & Southern Energy PLC | 61,534 | | 1,437,871 |
Vodafone Group PLC sponsored ADR | 153,508 | | 4,178,488 |
TOTAL UNITED KINGDOM | | 36,654,800 |
United States of America - 0.7% |
Virgin Media, Inc. | 27,467 | | 902,454 |
TOTAL COMMON STOCKS (Cost $135,187,370) |
136,204,930
|
Nonconvertible Preferred Stocks - 1.3% |
| | | |
Germany - 1.3% |
ProSiebenSat.1 Media AG | 25,880 | | 721,204 |
Volkswagen AG | 5,327 | | 1,101,973 |
TOTAL NONCONVERTIBLE PREFERRED STOCKS (Cost $1,562,166) |
1,823,177
|
Money Market Funds - 1.2% |
| Shares | | Value |
Fidelity Cash Central Fund, 0.19% (b) | 918,421 | | $ 918,421 |
Fidelity Securities Lending Cash Central Fund, 0.19% (b)(c) | 752,220 | | 752,220 |
TOTAL MONEY MARKET FUNDS (Cost $1,670,641) |
1,670,641
|
TOTAL INVESTMENT PORTFOLIO - 100.2% (Cost $138,420,177) | 139,698,748 |
NET OTHER ASSETS (LIABILITIES) - (0.2)% | (220,612) |
NET ASSETS - 100% | $ 139,478,136 |
Legend |
(a) Non-income producing |
(b) Affiliated fund that is available only to investment companies and other accounts managed by Fidelity Investments. The rate quoted is the annualized seven-day yield of the fund at period end. A complete unaudited listing of the fund's holdings as of its most recent quarter end is available upon request. In addition, each Fidelity Central Fund's financial statements, which are not covered by the Fund's Report of Independent Registered Public Accounting Firm, are available on the SEC's website or upon request. |
(c) Investment made with cash collateral received from securities on loan. |
(d) Security or a portion of the security is on loan at period end. |
Affiliated Central Funds |
Information regarding fiscal year to date income earned by the Fund from investments in Fidelity Central Funds is as follows: |
Fund | Income earned |
Fidelity Cash Central Fund | $ 558 |
Fidelity Securities Lending Cash Central Fund | 188,349 |
Total | $ 188,907 |
Other Information |
Categorizations in the Schedule of Investments are based on country or territory of incorporation. |
The following is a summary of the inputs used, as of October 31, 2012, involving the Fund's assets and liabilities carried at fair value. The inputs or methodology used for valuing securities may not be an indication of the risk associated with investing in those securities. For more information on valuation inputs, and their aggregation into the levels used in the tables below, please refer to the Security Valuation section in the accompanying Notes to Financial Statements. |
Valuation Inputs at Reporting Date: |
Description | Total | Level 1 | Level 2 | Level 3 |
Investments in Securities: | | | | |
Equities: | | | | |
Consumer Discretionary | $ 11,762,790 | $ 9,931,938 | $ 1,830,852 | $ - |
Consumer Staples | 10,413,591 | 8,173,075 | 2,240,516 | - |
Energy | 15,441,424 | 12,024,301 | 3,417,123 | - |
Financials | 45,205,326 | 38,164,319 | 7,041,007 | - |
Health Care | 16,431,815 | 11,537,892 | 4,893,923 | - |
Industrials | 10,971,356 | 8,165,385 | 2,805,971 | - |
Information Technology | 1,890,741 | 1,890,741 | - | - |
Materials | 7,759,047 | 3,659,461 | 4,099,586 | - |
Telecommunication Services | 9,577,641 | 8,914,583 | 663,058 | - |
Utilities | 8,574,376 | 6,662,869 | 1,911,507 | - |
Money Market Funds | 1,670,641 | 1,670,641 | - | - |
Total Investments in Securities: | $ 139,698,748 | $ 110,795,205 | $ 28,903,543 | $ - |
The following is a summary of transfers between Level 1 and Level 2 for the period ended October 31, 2012. Transfers are assumed to have occurred at the beginning of the period, and are primarily attributable to the valuation techniques used for foreign equity securities, as discussed in the accompanying Notes to Financial Statements: |
Transfers | Total |
Level 1 to Level 2 | $ 0 |
Level 2 to Level 1 | $ 30,093,824 |
See accompanying notes which are an integral part of the financial statements.
Annual Report
Statement of Assets and Liabilities
| October 31, 2012 |
| | |
Assets | | |
Investment in securities, at value (including securities loaned of $730,981) - See accompanying schedule: Unaffiliated issuers (cost $136,749,536) | $ 138,028,107 | |
Fidelity Central Funds (cost $1,670,641) | 1,670,641 | |
Total Investments (cost $138,420,177) | | $ 139,698,748 |
Cash | | 25,252 |
Receivable for investments sold | | 490,430 |
Receivable for fund shares sold | | 141,722 |
Dividends receivable | | 555,670 |
Distributions receivable from Fidelity Central Funds | | 1,693 |
Other receivables | | 8,173 |
Total assets | | 140,921,688 |
| | |
Liabilities | | |
Payable to custodian bank | $ 1,519 | |
Payable for investments purchased | 329,190 | |
Payable for fund shares redeemed | 173,709 | |
Accrued management fee | 85,006 | |
Distribution and service plan fees payable | 4,529 | |
Other affiliated payables | 33,818 | |
Other payables and accrued expenses | 63,561 | |
Collateral on securities loaned, at value | 752,220 | |
Total liabilities | | 1,443,552 |
| | |
Net Assets | | $ 139,478,136 |
Net Assets consist of: | | |
Paid in capital | | $ 258,984,945 |
Undistributed net investment income | | 3,836,975 |
Accumulated undistributed net realized gain (loss) on investments and foreign currency transactions | | (124,613,392) |
Net unrealized appreciation (depreciation) on investments and assets and liabilities in foreign currencies | | 1,269,608 |
Net Assets | | $ 139,478,136 |
See accompanying notes which are an integral part of the financial statements.
Annual Report
Statement of Assets and Liabilities - continued
| October 31, 2012 |
| | |
Calculation of Maximum Offering Price
Class A:
Net Asset Value and redemption price per share
($4,490,817 ÷ 607,664 shares) | | $ 7.39 |
| | |
Maximum offering price per share (100/94.25 of $7.39) | | $ 7.84 |
Class T:
Net Asset Value and redemption price per share ($2,692,907 ÷ 364,932 shares) | | $ 7.38 |
| | |
Maximum offering price per share (100/96.50 of $7.38) | | $ 7.65 |
Class B:
Net Asset Value and offering price per share ($691,141 ÷ 93,508 shares)A | | $ 7.39 |
| | |
Class C:
Net Asset Value and offering price per share ($2,248,556 ÷ 304,873 shares)A | | $ 7.38 |
| | |
International Value:
Net Asset Value, offering price and redemption price per share ($128,983,126 ÷ 17,438,274 shares) | | $ 7.40 |
| | |
Institutional Class:
Net Asset Value, offering price and redemption price per share ($371,589 ÷ 50,137 shares) | | $ 7.41 |
A Redemption price per share is equal to net asset value less any applicable contingent deferred sales charge.
See accompanying notes which are an integral part of the financial statements.
Annual Report
Financial Statements - continued
Statement of Operations
| Year ended October 31, 2012 |
| | |
Investment Income | | |
Dividends | | $ 6,445,326 |
Income from Fidelity Central Funds | | 188,907 |
Income before foreign taxes withheld | | 6,634,233 |
Less foreign taxes withheld | | (488,192) |
Total income | | 6,146,041 |
| | |
Expenses | | |
Management fee
Basic fee | $ 1,023,931 | |
Performance adjustment | (61,752) | |
Transfer agent fees | 355,462 | |
Distribution and service plan fees | 52,465 | |
Accounting and security lending fees | 76,123 | |
Custodian fees and expenses | 102,964 | |
Independent trustees' compensation | 963 | |
Registration fees | 72,448 | |
Audit | 63,728 | |
Legal | 772 | |
Miscellaneous | 1,645 | |
Total expenses before reductions | 1,688,749 | |
Expense reductions | (46,878) | 1,641,871 |
Net investment income (loss) | | 4,504,170 |
Realized and Unrealized Gain (Loss) Net realized gain (loss) on: | | |
Investment securities: | | |
Unaffiliated issuers | (6,001,087) | |
Foreign currency transactions | (21,483) | |
Total net realized gain (loss) | | (6,022,570) |
Change in net unrealized appreciation (depreciation) on: Investment securities | 12,847,185 | |
Assets and liabilities in foreign currencies | (19,483) | |
Total change in net unrealized appreciation (depreciation) | | 12,827,702 |
Net gain (loss) | | 6,805,132 |
Net increase (decrease) in net assets resulting from operations | | $ 11,309,302 |
See accompanying notes which are an integral part of the financial statements.
Annual Report
Statement of Changes in Net Assets
| Year ended
October 31,
2012 | Year ended
October 31,
2011 |
Increase (Decrease) in Net Assets | | |
Operations | | |
Net investment income (loss) | $ 4,504,170 | $ 5,953,007 |
Net realized gain (loss) | (6,022,570) | (31,214,422) |
Change in net unrealized appreciation (depreciation) | 12,827,702 | (382,882) |
Net increase (decrease) in net assets resulting
from operations | 11,309,302 | (25,644,297) |
Distributions to shareholders from net investment income | (5,463,877) | (4,441,935) |
Distributions to shareholders from net realized gain | - | (710,581) |
Total distributions | (5,463,877) | (5,152,516) |
Share transactions - net increase (decrease) | (27,953,937) | 18,454,243 |
Redemption fees | 2,109 | 3,151 |
Total increase (decrease) in net assets | (22,106,403) | (12,339,419) |
| | |
Net Assets | | |
Beginning of period | 161,584,539 | 173,923,958 |
End of period (including undistributed net investment income of $3,836,975 and undistributed net investment income of $4,796,682, respectively) | $ 139,478,136 | $ 161,584,539 |
See accompanying notes which are an integral part of the financial statements.
Annual Report
Financial Highlights - Class A
Years ended October 31, | 2012 | 2011 | 2010 | 2009 | 2008 |
Selected Per-Share Data | | | | | |
Net asset value, beginning of period | $ 7.02 | $ 8.22 | $ 7.75 | $ 5.93 | $ 13.02 |
Income from Investment Operations | | | | | |
Net investment income (loss) C | .20 | .22 | .15 | .12 | .21 |
Net realized and unrealized gain (loss) | .39 | (1.19) | .44 | 1.78 | (6.53) |
Total from investment operations | .59 | (.97) | .59 | 1.90 | (6.32) |
Distributions from net investment income | (.22) | (.19) | (.11) | (.08) | (.15) |
Distributions from net realized gain | - | (.03) | (.01) | - | (.62) |
Total distributions | (.22) | (.23) H | (.12) | (.08) | (.77) |
Redemption fees added to paid in capital C,G | - | - | - | - | - |
Net asset value, end of period | $ 7.39 | $ 7.02 | $ 8.22 | $ 7.75 | $ 5.93 |
Total Return A,B | 8.82% | (12.19)% | 7.60% | 32.71% | (51.50)% |
Ratios to Average Net Assets D,F | | | | | |
Expenses before reductions | 1.44% | 1.36% | 1.40% | 1.34% | 1.42% |
Expenses net of fee waivers, if any | 1.44% | 1.36% | 1.40% | 1.34% | 1.42% |
Expenses net of all reductions | 1.41% | 1.34% | 1.38% | 1.32% | 1.41% |
Net investment income (loss) | 2.85% | 2.79% | 1.93% | 1.86% | 2.05% |
Supplemental Data | | | | | |
Net assets, end of period (000 omitted) | $ 4,491 | $ 4,668 | $ 4,699 | $ 4,456 | $ 2,854 |
Portfolio turnover rate E | 74% | 83% | 43% | 46% | 68% |
A Total returns would have been lower if certain expenses had not been reduced during the applicable periods shown.
B Total returns do not include the effect of the sales charges.
C Calculated based on average shares outstanding during the period.
D Fees and expenses of any underlying Fidelity Central Funds are not included in the Fund's expense ratio. The Fund indirectly bears its proportionate share of the expenses of any underlying Fidelity Central Funds.
E Amount does not include the portfolio activity of any underlying Fidelity Central Funds.
F Expense ratios reflect operating expenses of the class. Expenses before reductions do not reflect amounts reimbursed by the investment adviser or reductions from brokerage service arrangements or reductions from other expense offset arrangements and do not represent the amount paid by the class during periods when reimbursements or reductions occur. Expenses net of fee waivers reflect expenses after reimbursement by the investment adviser but prior to reductions from brokerage service arrangements or other expense offset arrangements. Expenses net of all reductions represent the net expenses paid by the class.
G Amount represents less than $.01 per share.
H Total distributions of $.23 per share is comprised of distributions from net investment income of $.191 and distributions from net realized gain of $.034 per share.
See accompanying notes which are an integral part of the financial statements.
Annual Report
Financial Highlights - Class T
Years ended October 31, | 2012 | 2011 | 2010 | 2009 | 2008 |
Selected Per-Share Data | | | | | |
Net asset value, beginning of period | $ 7.00 | $ 8.20 | $ 7.73 | $ 5.91 | $ 12.99 |
Income from Investment Operations | | | | | |
Net investment income (loss) C | .18 | .20 | .13 | .10 | .18 |
Net realized and unrealized gain (loss) | .40 | (1.19) | .44 | 1.77 | (6.50) |
Total from investment operations | .58 | (.99) | .57 | 1.87 | (6.32) |
Distributions from net investment income | (.20) | (.17) | (.09) | (.05) | (.14) |
Distributions from net realized gain | - | (.03) | (.01) | - | (.62) |
Total distributions | (.20) | (.21) H | (.10) | (.05) | (.76) |
Redemption fees added to paid in capital C,G | - | - | - | - | - |
Net asset value, end of period | $ 7.38 | $ 7.00 | $ 8.20 | $ 7.73 | $ 5.91 |
Total Return A,B | 8.60% | (12.42)% | 7.32% | 32.14% | (51.60)% |
Ratios to Average Net Assets D,F | | | | | |
Expenses before reductions | 1.71% | 1.63% | 1.67% | 1.60% | 1.67% |
Expenses net of fee waivers, if any | 1.70% | 1.62% | 1.67% | 1.60% | 1.67% |
Expenses net of all reductions | 1.67% | 1.60% | 1.65% | 1.59% | 1.66% |
Net investment income (loss) | 2.58% | 2.52% | 1.65% | 1.59% | 1.80% |
Supplemental Data | | | | | |
Net assets, end of period (000 omitted) | $ 2,693 | $ 2,468 | $ 2,276 | $ 2,395 | $ 2,087 |
Portfolio turnover rate E | 74% | 83% | 43% | 46% | 68% |
A Total returns would have been lower if certain expenses had not been reduced during the applicable periods shown.
B Total returns do not include the effect of the sales charges.
C Calculated based on average shares outstanding during the period.
D Fees and expenses of any underlying Fidelity Central Funds are not included in the Fund's expense ratio. The Fund indirectly bears its proportionate share of the expenses of any underlying Fidelity Central Funds.
E Amount does not include the portfolio activity of any underlying Fidelity Central Funds.
F Expense ratios reflect operating expenses of the class. Expenses before reductions do not reflect amounts reimbursed by the investment adviser or reductions from brokerage service arrangements or reductions from other expense offset arrangements and do not represent the amount paid by the class during periods when reimbursements or reductions occur. Expenses net of fee waivers reflect expenses after reimbursement by the investment adviser but prior to reductions from brokerage service arrangements or other expense offset arrangements. Expenses net of all reductions represent the net expenses paid by the class.
G Amount represents less than $.01 per share.
H Total distributions of $.21 per share is comprised of distributions from net investment income of $.173 and distributions from net realized gain of $.034 per share.
See accompanying notes which are an integral part of the financial statements.
Annual Report
Financial Highlights - Class B
Years ended October 31, | 2012 | 2011 | 2010 | 2009 | 2008 |
Selected Per-Share Data | | | | | |
Net asset value, beginning of period | $ 7.00 | $ 8.20 | $ 7.74 | $ 5.88 | $ 12.93 |
Income from Investment Operations | | | | | |
Net investment income (loss) C | .14 | .17 | .09 | .07 | .13 |
Net realized and unrealized gain (loss) | .41 | (1.20) | .44 | 1.79 | (6.48) |
Total from investment operations | .55 | (1.03) | .53 | 1.86 | (6.35) |
Distributions from net investment income | (.16) | (.13) | (.06) | - | (.08) |
Distributions from net realized gain | - | (.03) | (.01) | - | (.62) |
Total distributions | (.16) | (.17) H | (.07) | - | (.70) |
Redemption fees added to paid in capital C,G | - | - | - | - | - |
Net asset value, end of period | $ 7.39 | $ 7.00 | $ 8.20 | $ 7.74 | $ 5.88 |
Total Return A,B | 8.07% | (12.88)% | 6.82% | 31.63% | (51.85)% |
Ratios to Average Net Assets D,F | | | | | |
Expenses before reductions | 2.19% | 2.11% | 2.15% | 2.08% | 2.18% |
Expenses net of fee waivers, if any | 2.19% | 2.11% | 2.15% | 2.08% | 2.18% |
Expenses net of all reductions | 2.16% | 2.09% | 2.13% | 2.07% | 2.17% |
Net investment income (loss) | 2.09% | 2.04% | 1.18% | 1.11% | 1.29% |
Supplemental Data | | | | | |
Net assets, end of period (000 omitted) | $ 691 | $ 901 | $ 1,216 | $ 1,076 | $ 931 |
Portfolio turnover rate E | 74% | 83% | 43% | 46% | 68% |
A Total returns would have been lower if certain expenses had not been reduced during the applicable periods shown.
B Total returns do not include the effect of the contingent deferred sales charge.
C Calculated based on average shares outstanding during the period.
D Fees and expenses of any underlying Fidelity Central Funds are not included in the Fund's expense ratio. The Fund indirectly bears its proportionate share of the expenses of any underlying Fidelity Central Funds.
E Amount does not include the portfolio activity of any underlying Fidelity Central Funds.
F Expense ratios reflect operating expenses of the class. Expenses before reductions do not reflect amounts reimbursed by the investment adviser or reductions from brokerage service arrangements or reductions from other expense offset arrangements and do not represent the amount paid by the class during periods when reimbursements or reductions occur. Expenses net of fee waivers reflect expenses after reimbursement by the investment adviser but prior to reductions from brokerage service arrangements or other expense offset arrangements. Expenses net of all reductions represent the net expenses paid by the class.
G Amount represents less than $.01 per share.
H Total distributions of $.17 per share is comprised of distributions from net investment income of $.131 and distributions from net realized gain of $.034 per share.
See accompanying notes which are an integral part of the financial statements.
Annual Report
Financial Highlights - Class C
Years ended October 31, | 2012 | 2011 | 2010 | 2009 | 2008 |
Selected Per-Share Data | | | | | |
Net asset value, beginning of period | $ 7.00 | $ 8.20 | $ 7.73 | $ 5.88 | $ 12.92 |
Income from Investment Operations | | | | | |
Net investment income (loss) C | .14 | .16 | .09 | .07 | .13 |
Net realized and unrealized gain (loss) | .41 | (1.19) | .44 | 1.78 | (6.47) |
Total from investment operations | .55 | (1.03) | .53 | 1.85 | (6.34) |
Distributions from net investment income | (.17) | (.14) | (.05) | - | (.08) |
Distributions from net realized gain | - | (.03) | (.01) | - | (.62) |
Total distributions | (.17) | (.17) | (.06) | - | (.70) |
Redemption fees added to paid in capital C,G | - | - | - | - | - |
Net asset value, end of period | $ 7.38 | $ 7.00 | $ 8.20 | $ 7.73 | $ 5.88 |
Total Return A,B | 8.12% | (12.84)% | 6.84% | 31.46% | (51.80)% |
Ratios to Average Net Assets D,F | | | | | |
Expenses before reductions | 2.19% | 2.12% | 2.15% | 2.08% | 2.17% |
Expenses net of fee waivers, if any | 2.19% | 2.11% | 2.15% | 2.08% | 2.17% |
Expenses net of all reductions | 2.16% | 2.09% | 2.13% | 2.06% | 2.16% |
Net investment income (loss) | 2.09% | 2.04% | 1.18% | 1.12% | 1.30% |
Supplemental Data | | | | | |
Net assets, end of period (000 omitted) | $ 2,249 | $ 2,108 | $ 2,123 | $ 2,108 | $ 1,784 |
Portfolio turnover rate E | 74% | 83% | 43% | 46% | 68% |
A Total returns would have been lower if certain expenses had not been reduced during the applicable periods shown.
B Total returns do not include the effect of the contingent deferred sales charge.
C Calculated based on average shares outstanding during the period.
D Fees and expenses of any underlying Fidelity Central Funds are not included in the Fund's expense ratio. The Fund indirectly bears its proportionate share of the expenses of any underlying Fidelity Central Funds.
E Amount does not include the portfolio activity of any underlying Fidelity Central Funds.
F Expense ratios reflect operating expenses of the class. Expenses before reductions do not reflect amounts reimbursed by the investment adviser or reductions from brokerage service arrangements or reductions from other expense offset arrangements and do not represent the amount paid by the class during periods when reimbursements or reductions occur. Expenses net of fee waivers reflect expenses after reimbursement by the investment adviser but prior to reductions from brokerage service arrangements or other expense offset arrangements. Expenses net of all reductions represent the net expenses paid by the class.
G Amount represents less than $.01 per share.
See accompanying notes which are an integral part of the financial statements.
Annual Report
Financial Highlights - International Value
Years ended October 31, | 2012 | 2011 | 2010 | 2009 | 2008 |
Selected Per-Share Data | | | | | |
Net asset value, beginning of period | $ 7.03 | $ 8.23 | $ 7.75 | $ 5.95 | $ 13.06 |
Income from Investment Operations | | | | | |
Net investment income (loss) B | .22 | .25 | .17 | .13 | .24 |
Net realized and unrealized gain (loss) | .40 | (1.20) | .44 | 1.78 | (6.54) |
Total from investment operations | .62 | (.95) | .61 | 1.91 | (6.30) |
Distributions from net investment income | (.25) | (.22) | (.13) | (.11) | (.19) |
Distributions from net realized gain | - | (.03) | (.01) | - | (.62) |
Total distributions | (.25) | (.25) | (.13) G | (.11) | (.81) |
Redemption fees added to paid in capital B,F | - | - | - | - | - |
Net asset value, end of period | $ 7.40 | $ 7.03 | $ 8.23 | $ 7.75 | $ 5.95 |
Total Return A | 9.19% | (11.91)% | 7.95% | 33.09% | (51.34)% |
Ratios to Average Net Assets C,E | | | | | |
Expenses before reductions | 1.13% | 1.04% | 1.09% | 1.07% | 1.10% |
Expenses net of fee waivers, if any | 1.13% | 1.03% | 1.09% | 1.07% | 1.10% |
Expenses net of all reductions | 1.10% | 1.01% | 1.08% | 1.06% | 1.09% |
Net investment income (loss) | 3.16% | 3.11% | 2.23% | 2.12% | 2.37% |
Supplemental Data | | | | | |
Net assets, end of period (000 omitted) | $ 128,983 | $ 150,967 | $ 163,090 | $ 180,447 | $ 160,777 |
Portfolio turnover rate D | 74% | 83% | 43% | 46% | 68% |
A Total returns would have been lower if certain expenses had not been reduced during the applicable periods shown.
B Calculated based on average shares outstanding during the period.
C Fees and expenses of any underlying Fidelity Central Funds are not included in the Fund's expense ratio. The Fund indirectly bears its proportionate share of the expenses of any underlying Fidelity Central Funds.
D Amount does not include the portfolio activity of any underlying Fidelity Central Funds.
E Expense ratios reflect operating expenses of the class. Expenses before reductions do not reflect amounts reimbursed by the investment adviser or reductions from brokerage service arrangements or reductions from other expense offset arrangements and do not represent the amount paid by the class during periods when reimbursements or reductions occur. Expenses net of fee waivers reflect expenses after reimbursement by the investment adviser but prior to reductions from brokerage service arrangements or other expense offset arrangements. Expenses net of all reductions represent the net expenses paid by the class.
F Amount represents less than $.01 per share.
G Total distributions of $.13 per share is comprised of distributions from net investment income of $.129 and distributions from net realized gain of $.005 per share.
See accompanying notes which are an integral part of the financial statements.
Annual Report
Financial Highlights - Institutional Class
Years ended October 31, | 2012 | 2011 | 2010 | 2009 | 2008 |
Selected Per-Share Data | | | | | |
Net asset value, beginning of period | $ 7.04 | $ 8.24 | $ 7.76 | $ 5.96 | $ 13.07 |
Income from Investment Operations | | | | | |
Net investment income (loss) B | .22 | .25 | .18 | .14 | .25 |
Net realized and unrealized gain (loss) | .40 | (1.19) | .44 | 1.78 | (6.54) |
Total from investment operations | .62 | (.94) | .62 | 1.92 | (6.29) |
Distributions from net investment income | (.25) | (.22) | (.14) | (.12) | (.20) |
Distributions from net realized gain | - | (.03) | (.01) | - | (.62) |
Total distributions | (.25) | (.26) H | (.14) G | (.12) | (.82) |
Redemption fees added to paid in capital B,F | - | - | - | - | - |
Net asset value, end of period | $ 7.41 | $ 7.04 | $ 8.24 | $ 7.76 | $ 5.96 |
Total Return A | 9.22% | (11.83)% | 8.05% | 33.06% | (51.27)% |
Ratios to Average Net Assets C,E | | | | | |
Expenses before reductions | 1.10% | .98% | .98% | .93% | 1.02% |
Expenses net of fee waivers, if any | 1.10% | .98% | .98% | .93% | 1.02% |
Expenses net of all reductions | 1.07% | .96% | .97% | .92% | 1.01% |
Net investment income (loss) | 3.18% | 3.17% | 2.34% | 2.26% | 2.45% |
Supplemental Data | | | | | |
Net assets, end of period (000 omitted) | $ 372 | $ 473 | $ 519 | $ 814 | $ 1,052 |
Portfolio turnover rate D | 74% | 83% | 43% | 46% | 68% |
A Total returns would have been lower if certain expenses had not been reduced during the applicable periods shown.
B Calculated based on average shares outstanding during the period.
C Fees and expenses of any underlying Fidelity Central Funds are not included in the Fund's expense ratio. The Fund indirectly bears its proportionate share of the expenses of any underlying Fidelity Central Funds.
D Amount does not include the portfolio activity of any underlying Fidelity Central Funds.
E Expense ratios reflect operating expenses of the class. Expenses before reductions do not reflect amounts reimbursed by the investment adviser or reductions from brokerage service arrangements or reductions from other expense offset arrangements and do not represent the amount paid by the class during periods when reimbursements or reductions occur. Expenses net of fee waivers reflect expenses after reimbursement by the investment adviser but prior to reductions from brokerage service arrangements or other expense offset arrangements. Expenses net of all reductions represent the net expenses paid by the class.
F Amount represents less than $.01 per share.
G Total distributions of $.14 per share is comprised of distributions from net investment income of $.137 and distributions from net realized gain of $.005 per share.
H Total distributions of $.26 per share is comprised of distributions from net investment income of $.221 and distributions from net realized gain of $.034 per share.
See accompanying notes which are an integral part of the financial statements.
Annual Report
Notes to Financial Statements
For the period ended October 31, 2012
1. Organization.
Fidelity® International Value Fund (the Fund) is a fund of Fidelity Investment Trust (the Trust) and is authorized to issue an unlimited number of shares. The Trust is registered under the Investment Company Act of 1940, as amended (the 1940 Act), as an open-end management investment company organized as a Massachusetts business trust. The Fund offers Class A, Class T, Class C, International Value and Institutional Class shares, each of which, along with Class B shares, has equal rights as to assets and voting privileges. Effective after the close of business on September 1, 2010, Class B shares were closed to new accounts and additional purchases, except for exchanges and reinvestments. Each class has exclusive voting rights with respect to matters that affect that class. Class B shares will automatically convert to Class A shares after a holding period of seven years from the initial date of purchase. Investment income, realized and unrealized capital gains and losses, the common expenses of the Fund, and certain fund-level expense reductions, if any, are allocated on a pro-rata basis to each class based on the relative net assets of each class to the total net assets of the Fund. Each class differs with respect to transfer agent and distribution and service plan fees incurred. Certain expense reductions may also differ by class.
2. Investments in Fidelity Central Funds.
The Fund invests in Fidelity Central Funds, which are open-end investment companies available only to other investment companies and accounts managed by Fidelity Management & Research Company (FMR) and its affiliates. The Fund's Schedule of Investments lists each of the Fidelity Central Funds held as of period end, if any, as an investment of the Fund, but does not include the underlying holdings of each Fidelity Central Fund. As an Investing Fund, the Fund indirectly bears its proportionate share of the expenses of the underlying Fidelity Central Funds.
The Money Market Central Funds seek preservation of capital and current income and are managed by Fidelity Investments Money Management, Inc. (FIMM), an affiliate of FMR.
A complete unaudited list of holdings for each Fidelity Central Fund is available upon request or at the Securities and Exchange Commission (the SEC) web site at www.sec.gov. In addition, the financial statements of the Fidelity Central Funds, which are not covered by the Fund's Report of Independent Registered Public Accounting Firm, are available on the SEC web site or upon request.
Annual Report
3. Significant Accounting Policies.
The financial statements have been prepared in conformity with accounting principles generally accepted in the United States of America (GAAP), which require management to make certain estimates and assumptions at the date of the financial statements. Actual results could differ from those estimates. Subsequent events, if any, through the date that the financial statements were issued have been evaluated in the preparation of the financial statements. The following summarizes the significant accounting policies of the Fund:
Security Valuation. Investments are valued as of 4:00 p.m. Eastern time on the last calendar day of the period. In accordance with valuation policies and procedures approved by the Board of Trustees (the Board), the Fund attempts to obtain prices from one or more third party pricing vendors or brokers to value its investments. When current market prices, quotations or rates are not readily available or reliable, securities will be fair valued in good faith by the FMR Fair Value Committee (the Committee), in accordance with procedures adopted by the Fund's Board. Factors used in determining fair value vary by security type and may include market or security specific events. The frequency with which these procedures are used cannot be predicted and they may be utilized to a significant extent. The Committee oversees the Fund's valuation policies and procedures and is responsible for approving and reporting to the Board all fair value determinations.
The Fund categorizes the inputs to valuation techniques used to value its investments into a disclosure hierarchy consisting of three levels as shown below:
Level 1 - quoted prices in active markets for identical investments
Level 2 - other significant observable inputs (including quoted prices for similar investments, interest rates, prepayment speeds, etc.)
Level 3 - unobservable inputs (including the Fund's own assumptions based on the best information available)
Valuation techniques used to value the Fund's investments by major category are as follows:
Equity securities, including restricted securities, for which market quotations are readily available, are valued at the last reported sale price or official closing price as reported by a third party pricing vendor on the primary market or exchange on which they are traded and are categorized as Level 1 in the hierarchy. In the event there were no sales during the day or closing prices are not available, securities are valued at the last quoted bid price or may be valued using the last available price and are generally categorized as
Annual Report
Notes to Financial Statements - continued
3. Significant Accounting Policies - continued
Security Valuation - continued
Level 2 in the hierarchy. For foreign equity securities, when significant market or security specific events arise, comparisons to the valuation of American Depositary Receipts (ADRs), futures contracts, Exchange-Traded Funds (ETFs) and certain indexes as well as quoted prices for similar securities are used and are categorized as Level 2 in the hierarchy. Utilizing these techniques may result in transfers between Level 1 and Level 2.
Investments in open-end mutual funds, including the Fidelity Central Funds, are valued at their closing net asset value (NAV) each business day and are categorized as Level 1 in the hierarchy.
Changes in valuation techniques may result in transfers in or out of an assigned level within the disclosure hierarchy. The aggregate value of investments by input level, as of October 31, 2012, including information on transfers between Levels 1 and 2, is included at the end of the Fund's Schedule of Investments.
Foreign Currency Translation. The Fund may use foreign currency contracts to facilitate transactions in foreign-denominated securities. Gains and losses from these transactions may arise from changes in the value of the foreign currency or if the counterparties do not perform under the contracts' terms.
Foreign-denominated assets, including investment securities, and liabilities are translated into U.S. dollars at the exchange rates at period end. Purchases and sales of investment securities, income and dividends received and expenses denominated in foreign currencies are translated into U.S. dollars at the exchange rate in effect on the transaction date.
The effects of exchange rate fluctuations on investments are included with the net realized and unrealized gain (loss) on investment securities. Other foreign currency transactions resulting in realized and unrealized gain (loss) are disclosed separately.
Investment Transactions and Income. For financial reporting purposes, the Fund's investment holdings and NAV include trades executed through the end of the last business day of the period. The NAV per share for processing shareholder transactions is calculated as of the close of business of the New York Stock Exchange (NYSE), normally 4:00 p.m. Eastern time and includes trades executed through the end of the prior business day. Gains and losses on securities sold are determined on the basis of identified cost and may include proceeds received from litigation. Dividend income is recorded on the ex-dividend date, except for certain dividends from foreign securities where the ex-dividend date may have passed, which are recorded as soon as the Fund is informed of the ex-dividend date. Non-cash dividends included in dividend income, if any, are
Annual Report
3. Significant Accounting Policies - continued
Investment Transactions and Income - continued
recorded at the fair market value of the securities received. Interest income and distributions from the Fidelity Central Funds are accrued as earned. Investment income is recorded net of foreign taxes withheld where recovery of such taxes is uncertain.
Expenses. Expenses directly attributable to a fund are charged to that fund. Expenses attributable to more than one fund are allocated among the respective funds on the basis of relative net assets or other appropriate methods. Expense estimates are accrued in the period to which they relate and adjustments are made when actual amounts are known.
Income Tax Information and Distributions to Shareholders. Each year, the Fund intends to qualify as a regulated investment company under Subchapter M of the Internal Revenue Code, including distributing substantially all of its taxable income and realized gains. As a result, no provision for income taxes is required. As of October 31, 2012, the Fund did not have any unrecognized tax benefits in the financial statements; nor is the Fund aware of any tax positions for which it is reasonably possible that the total amounts of unrecognized tax benefits will significantly change in the next twelve months. The Fund files a U.S. federal tax return, in addition to state and local tax returns as required. A fund's federal income tax returns are subject to examination by the Internal Revenue Service (IRS) for a period of three fiscal years after they are filed. State and local tax returns may be subject to examination for an additional fiscal year depending on the jurisdiction. Foreign taxes are provided for based on the Fund's understanding of the tax rules and rates that exist in the foreign markets in which it invests.
Distributions are declared and recorded on the ex-dividend date. Income dividends and capital gain distributions are declared separately for each class. Income and capital gain distributions are determined in accordance with income tax regulations, which may differ from GAAP.
Capital accounts within the financial statements are adjusted for permanent book-tax differences. These adjustments have no impact on net assets or the results of operations. Temporary book-tax differences will reverse in a subsequent period.
Book-tax differences are primarily due to foreign currency transactions, passive foreign investment companies (PFIC), capital loss carryforwards and losses deferred due to wash sales.
Annual Report
Notes to Financial Statements - continued
3. Significant Accounting Policies - continued
Income Tax Information and Distributions to Shareholders - continued
The federal tax cost of investment securities and unrealized appreciation (depreciation) as of period end were as follows:
Gross unrealized appreciation | $ 11,923,750 |
Gross unrealized depreciation | (12,677,916) |
Net unrealized appreciation (depreciation) on securities and other investments | $ (754,166) |
| |
Tax Cost | $ 140,452,914 |
The tax-based components of distributable earnings as of period end were as follows:
Undistributed ordinary income | $ 4,576,774 |
Capital loss carryforward | $ (123,320,454) |
Net unrealized appreciation (depreciation) | $ (763,129) |
Capital loss carryforwards are only available to offset future capital gains of the Fund to the extent provided by regulations and may be limited. Under the Regulated Investment Company Modernization Act of 2010 (the Act), the Fund is permitted to carry forward capital losses incurred in taxable years beginning after December 22, 2010 for an unlimited period and such capital losses are required to be used prior to any losses that expire. Capital loss carryforwards were as follows:
Fiscal year of expiration | |
2016 | $ (17,089,067) |
2017 | (65,376,972) |
2018 | (3,571,319) |
2019 | (31,368,797) |
Total with expiration | (117,406,155) |
No expiration | |
Long-term | (5,914,299) |
Total capital loss carryforward | $ (123,320,454) |
The tax character of distributions paid was as follows:
| October 31, 2012 | October 31, 2011 |
Ordinary Income | $ 5,463,877 | $ 5,152,516 |
Annual Report
3. Significant Accounting Policies - continued
Short-Term Trading (Redemption) Fees. Shares held by investors in the Fund less than 30 days are subject to a redemption fee equal to 1.00% of the net asset value of shares redeemed. All redemption fees, which reduce the proceeds of the shareholder redemption, are retained by the Fund and accounted for as an addition to paid in capital.
New Accounting Pronouncement. In December 2011, the Financial Accounting Standards Board issued Accounting Standard Update No. 2011-11, Disclosures about Offsetting Assets and Liabilities. The update creates new disclosure requirements requiring entities to disclose both gross and net information for derivatives and other financial instruments that are either offset in the Statement of Assets and Liabilities or subject to an enforceable master netting arrangement or similar agreement. The disclosure requirements are effective for annual reporting periods beginning on or after January 1, 2013, and interim periods within those annual periods. Management is currently evaluating the impact of the update's adoption on the Fund's financial statement disclosures.
4. Purchases and Sales of Investments.
Purchases and sales of securities, other than short-term securities, aggregated $107,516,996 and $136,721,066, respectively.
5. Fees and Other Transactions with Affiliates.
Management Fee. FMR and its affiliates provide the Fund with investment management related services for which the Fund pays a monthly management fee. The management fee is the sum of an individual fund fee rate that is based on an annual rate of .45% of the Fund's average net assets and an annualized group fee rate that averaged .26% during the period. The group fee rate is based upon the average net assets of all the mutual funds advised by FMR. The group fee rate decreases as assets under management increase and increases as assets under management decrease. In addition, the management fee is subject to a performance adjustment (up to a maximum of ± .20% of the Fund's average net assets over a 36 month performance period). The upward or downward adjustment to the management fee is based on the relative investment performance of International Value as compared to an appropriate benchmark index. For the period, the total annual management fee rate, including the performance adjustment, was .67% of the Fund's average net assets.
Annual Report
Notes to Financial Statements - continued
5. Fees and Other Transactions with Affiliates - continued
Distribution and Service Plan Fees. In accordance with Rule 12b-1 of the 1940 Act, the Fund has adopted separate Distribution and Service Plans for each class of shares. Certain classes pay Fidelity Distributors Corporation (FDC), an affiliate of FMR, separate Distribution and Service Fees, each of which is based on an annual percentage of each class' average net assets. In addition, FDC may pay financial intermediaries for selling shares of the Fund and providing shareholder support services. For the period, the Distribution and Service Fee rates, total fees and amounts retained by FDC were as follows:
| Distribution
Fee | Service
Fee | Total Fees | Retained
by FDC |
Class A | -% | .25% | $ 11,016 | $ 291 |
Class T | .25% | .25% | 12,196 | 22 |
Class B | .75% | .25% | 8,001 | 6,009 |
Class C | .75% | .25% | 21,252 | 5,108 |
| | | $ 52,465 | $ 11,430 |
Sales Load. FDC may receive a front-end sales charge of up to 5.75% for selling Class A shares and 3.50% for selling Class T shares, some of which is paid to financial intermediaries for selling shares of the Fund. Depending on the holding period, FDC may receive contingent deferred sales charges levied on Class A, Class T, Class B, and Class C redemptions. The deferred sales charges range from 5.00% to 1.00% for Class B shares, 1.00% for Class C shares, 1.00% for certain purchases of Class A shares and .25% for certain purchases of Class T shares.
For the period, sales charge amounts retained by FDC were as follows:
| Retained
by FDC |
Class A | $ 1,851 |
Class T | 589 |
Class B* | 4,309 |
Class C* | 943 |
| $ 7,692 |
* When Class B and Class C shares are initially sold, FDC pays commissions from its own resources to financial intermediaries through which the sales are made.
Annual Report
5. Fees and Other Transactions with Affiliates - continued
Transfer Agent Fees. Fidelity Investments Institutional Operations Company, Inc. (FIIOC), an affiliate of FMR, is the transfer, dividend disbursing and shareholder servicing agent for each class of the Fund. FIIOC receives account fees and asset-based fees that vary according to the account size and type of account of the shareholders of the respective classes of the Fund. FIIOC pays for typesetting, printing and mailing of shareholder reports, except proxy statements. For the period, transfer agent fees for each class were as follows:
| Amount | % of
Average
Net Assets |
Class A | $ 13,342 | .30 |
Class T | 7,912 | .32 |
Class B | 2,419 | .30 |
Class C | 6,455 | .30 |
International Value | 324,523 | .24 |
Institutional Class | 811 | .21 |
| $ 355,462 | |
Accounting and Security Lending Fees. Fidelity Service Company, Inc. (FSC), an affiliate of FMR, maintains the Fund's accounting records. The accounting fee is based on the level of average net assets for each month. Under a separate contract, FSC administers the security lending program. The security lending fee is based on the number and duration of lending transactions.
Brokerage Commissions. The Fund placed a portion of its portfolio transactions with brokerage firms which are affiliates of the investment adviser. The commissions paid to these affiliated firms were $129 for the period.
6. Committed Line of Credit.
The Fund participates with other funds managed by FMR or an affiliate in a $4.25 billion credit facility (the "line of credit") to be utilized for temporary or emergency purposes to fund shareholder redemptions or for other short-term liquidity purposes. The Fund has agreed to pay commitment fees on its pro-rata portion of the line of credit, which amounted to $405 and is reflected in Miscellaneous expenses on the Statement of Operations. During the period, there were no borrowings on this line of credit.
Annual Report
Notes to Financial Statements - continued
7. Security Lending.
The Fund lends portfolio securities through a lending agent from time to time in order to earn additional income. For equity securities, a lending agent is used and may loan securities to certain qualified borrowers, including Fidelity Capital Markets (FCM), a broker-dealer affiliated with the Fund. On the settlement date of the loan, the Fund receives collateral (in the form of U.S. Treasury obligations, letters of credit and/or cash) against the loaned securities and maintains collateral in an amount not less than 100% of the market value of the loaned securities during the period of the loan. The market value of the loaned securities is determined at the close of business of the Fund and any additional required collateral is delivered to the Fund on the next business day. If the borrower defaults on its obligation to return the securities loaned because of insolvency or other reasons, a fund could experience delays and costs in recovering the securities loaned or in gaining access to the collateral. Any cash collateral received is invested in the Fidelity Securities Lending Cash Central Fund. The value of loaned securities and cash collateral at period end are disclosed on the Fund's Statement of Assets and Liabilities. At period end, there were no security loans outstanding with FCM. Security lending income represents the income earned on investing cash collateral, less rebates paid to borrowers and any lending agent fees associated with the loan, plus any premium payments received for lending certain types of securities. Security lending income is presented in the Statement of Operations as a component of income from Fidelity Central Funds. Total security lending income during the period amounted to $188,349, including $5 from securities loaned to FCM.
8. Expense Reductions.
FMR voluntarily agreed to reimburse each class to the extent annual operating expenses exceeded certain levels of average net assets as noted in the table below. Some expenses, for example interest expense, including commitment fees, are excluded from this reimbursement.
The following classes were in reimbursement during the period:
| Expense
Limitations | Reimbursement
from adviser |
Class T | 1.70% | $ 243 |
Many of the brokers with whom FMR places trades on behalf of the Fund provided services to the Fund in addition to trade execution. These services included payments of certain expenses on behalf of the Fund totaling $46,635 for the period.
Annual Report
9. Distributions to Shareholders.
Distributions to shareholders of each class were as follows:
Years ended October 31, | 2012 | 2011 |
From net investment income | | |
Class A | $ 143,989 | $ 109,917 |
Class T | 67,838 | 48,265 |
Class B | 19,758 | 18,831 |
Class C | 50,970 | 34,950 |
International Value | 5,163,324 | 4,218,039 |
Institutional Class | 17,998 | 11,933 |
Total | $ 5,463,877 | $ 4,441,935 |
From net realized gain | | |
Class A | $ - | $ 19,461 |
Class T | - | 9,435 |
Class B | - | 4,893 |
Class C | - | 8,796 |
International Value | - | 666,153 |
Institutional Class | - | 1,843 |
Total | $ - | $ 710,581 |
10. Share Transactions.
Transactions for each class of shares were as follows:
| Shares | Dollars |
Years ended October 31, | 2012 | 2011 | 2012 | 2011 |
Class A | | | | |
Shares sold | 186,877 | 297,051 | $ 1,294,428 | $ 2,472,449 |
Reinvestment of distributions | 19,578 | 14,168 | 128,823 | 113,424 |
Shares redeemed | (263,913) | (217,894) | (1,814,670) | (1,776,674) |
Net increase (decrease) | (57,458) | 93,325 | $ (391,419) | $ 809,199 |
Class T | | | | |
Shares sold | 87,833 | 184,684 | $ 599,355 | $ 1,564,957 |
Reinvestment of distributions | 10,069 | 7,104 | 66,355 | 56,884 |
Shares redeemed | (85,446) | (116,856) | (585,214) | (949,653) |
Net increase (decrease) | 12,456 | 74,932 | $ 80,496 | $ 672,188 |
Class B | | | | |
Shares sold | 2,850 | 10,615 | $ 19,157 | $ 84,177 |
Reinvestment of distributions | 2,474 | 2,474 | 16,400 | 19,918 |
Shares redeemed | (40,532) | (32,689) | (279,913) | (270,345) |
Net increase (decrease) | (35,208) | (19,600) | $ (244,356) | $ (166,250) |
Annual Report
Notes to Financial Statements - continued
10. Share Transactions - continued
| Shares | Dollars |
Years ended October 31, | 2012 | 2011 | 2012 | 2011 |
Class C | | | | |
Shares sold | 72,761 | 94,118 | $ 498,768 | $ 764,274 |
Reinvestment of distributions | 6,699 | 4,468 | 44,283 | 35,965 |
Shares redeemed | (75,717) | (56,323) | (522,498) | (453,389) |
Net increase (decrease) | 3,743 | 42,263 | $ 20,553 | $ 346,850 |
International Value | | | | |
Shares sold | 2,278,492 | 9,000,450 | $ 15,694,819 | $ 76,813,955 |
Reinvestment of distributions | 762,294 | 587,427 | 5,008,269 | 4,695,920 |
Shares redeemed | (7,089,505) | (7,927,908) | (48,008,194) | (64,758,392) |
Net increase (decrease) | (4,048,719) | 1,659,969 | $ (27,305,106) | $ 16,751,483 |
Institutional Class | | | | |
Shares sold | 18,483 | 19,868 | $ 132,098 | $ 168,608 |
Reinvestment of distributions | 1,234 | 395 | 8,117 | 3,160 |
Shares redeemed | (36,776) | (16,071) | (254,320) | (130,995) |
Net increase (decrease) | (17,059) | 4,192 | $ (114,105) | $ 40,773 |
11. Other.
The Fund's organizational documents provide former and current trustees and officers with a limited indemnification against liabilities arising in connection with the performance of their duties to the Fund. In the normal course of business, the Fund may also enter into contracts that provide general indemnifications. The Fund's maximum exposure under these arrangements is unknown as this would be dependent on future claims that may be made against the Fund. The risk of material loss from such claims is considered remote.
At the end of the period, Strategic Advisers International II Fund and VIP FundsManager 60% Portfolio were owners of record of approximately 21% and 16%, respectively, of the total outstanding shares of the Fund.
Mutual funds managed by FMR or its affiliates were owners of record, in the aggregate, of approximately 38% of the total outstanding shares of the Fund.
Annual Report
To the Trustees of Fidelity Investment Trust and Shareholders of Fidelity International Value Fund:
We have audited the accompanying statement of assets and liabilities of Fidelity International Value Fund (the Fund), a fund of Fidelity Investment Trust, including the schedule of investments, as of October 31, 2012, and the related statement of operations for the year then ended, the statement of changes in net assets for each of the two years in the period then ended, and the financial highlights for each of the five years in the period then ended. These financial statements and financial highlights are the responsibility of the Fund's management. Our responsibility is to express an opinion on these financial statements and financial highlights based on our audits.
We conducted our audits in accordance with the standards of the Public Company Accounting Oversight Board (United States). Those standards require that we plan and perform the audit to obtain reasonable assurance about whether the financial statements and financial highlights are free of material misstatement. The Fund is not required to have, nor were we engaged to perform, an audit of its internal control over financial reporting. Our audits included consideration of internal control over financial reporting as a basis for designing audit procedures that are appropriate in the circumstances, but not for the purpose of expressing an opinion on the effectiveness of the Fund's internal control over financial reporting. Accordingly, we express no such opinion. An audit also includes examining, on a test basis, evidence supporting the amounts and disclosures in the financial statements, assessing the accounting principles used and significant estimates made by management, as well as evaluating the overall financial statement presentation. Our procedures included confirmation of securities owned as of October 31, 2012, by correspondence with the custodians and brokers; where replies were not received from brokers, we performed other auditing procedures. We believe that our audits provide a reasonable basis for our opinion.
In our opinion, the financial statements and financial highlights referred to above present fairly, in all material respects, the financial position of Fidelity International Value Fund as of October 31, 2012, the results of its operations for the year then ended, the changes in its net assets for each of the two years in the period then ended, and the financial highlights for each of the five years in the period then ended, in conformity with accounting principles generally accepted in the United States of America.
DELOITTE & TOUCHE LLP
Boston, Massachusetts
December 14, 2012
Annual Report
The Trustees, Members of the Advisory Board, and executive officers of the trust and fund, as applicable, are listed below. The Board of Trustees governs the fund and is responsible for protecting the interests of shareholders. The Trustees are experienced executives who meet periodically throughout the year to oversee the fund's activities, review contractual arrangements with companies that provide services to the fund, oversee management of the risks associated with such activities and contractual arrangements, and review the fund's performance. Except for James C. Curvey, each of the Trustees oversees 236 funds advised by FMR or an affiliate. Mr. Curvey oversees 443 funds advised by FMR or an affiliate.
The Trustees hold office without limit in time except that (a) any Trustee may resign; (b) any Trustee may be removed by written instrument, signed by at least two-thirds of the number of Trustees prior to such removal; (c) any Trustee who requests to be retired or who has become incapacitated by illness or injury may be retired by written instrument signed by a majority of the other Trustees; and (d) any Trustee may be removed at any special meeting of shareholders by a two-thirds vote of the outstanding voting securities of the trust. Each Trustee who is not an interested person (as defined in the 1940 Act) (Independent Trustee), shall retire not later than the last day of the calendar year in which his or her 75th birthday occurs. The Independent Trustees may waive this mandatory retirement age policy with respect to individual Trustees. The executive officers and Advisory Board Members hold office without limit in time, except that any officer and Advisory Board Member may resign or may be removed by a vote of a majority of the Trustees at any regular meeting or any special meeting of the Trustees. Except as indicated, each individual has held the office shown or other offices in the same company for the past five years.
Experience, Skills, Attributes, and Qualifications of the Fund's Trustees. The Governance and Nominating Committee has adopted a statement of policy that describes the experience, qualifications, attributes, and skills that are necessary and desirable for potential Independent Trustee candidates (Statement of Policy). The Board believes that each Trustee satisfied at the time he or she was initially elected or appointed a Trustee, and continues to satisfy, the standards contemplated by the Statement of Policy. The Governance and Nominating Committee also engages professional search firms to help identify potential Independent Trustee candidates who have the experience, qualifications, attributes, and skills consistent with the Statement of Policy. From time to time, additional criteria based on the composition and skills of the current Independent Trustees, as well as experience or skills that may be appropriate in light of future changes to board composition, business conditions, and regulatory or other developments, have also been considered by the professional search firms and the Governance and Nominating Committee. In addition, the Board takes into account the Trustees' commitment and participation in Board and committee meetings, as well as their leadership of standing and ad hoc committees throughout their tenure.
In determining that a particular Trustee was and continues to be qualified to serve as a Trustee, the Board has considered a variety of criteria, none of which, in isolation, was controlling. The Board believes that, collectively, the Trustees have balanced and diverse experience, qualifications, attributes, and skills, which allow the Board to operate effectively in governing the fund and protecting the interests of shareholders. Information about the specific experience, skills, attributes, and qualifications of each Trustee, which in each case led to the Board's conclusion that the Trustee should serve (or continue to serve) as a trustee of the fund, is provided below.
Annual Report
Trustees and Officers - continued
Board Structure and Oversight Function. James C. Curvey is an interested person (as defined in the 1940 Act) and currently serves as Chairman. The Trustees have determined that an interested Chairman is appropriate and benefits shareholders because an interested Chairman has a personal and professional stake in the quality and continuity of services provided to the fund. Independent Trustees exercise their informed business judgment to appoint an individual of their choosing to serve as Chairman, regardless of whether the Trustee happens to be independent or a member of management. The Independent Trustees have determined that they can act independently and effectively without having an Independent Trustee serve as Chairman and that a key structural component for assuring that they are in a position to do so is for the Independent Trustees to constitute a substantial majority for the Board. The Independent Trustees also regularly meet in executive session. Ned C. Lautenbach serves as Chairman of the Independent Trustees and as such (i) acts as a liaison between the Independent Trustees and management with respect to matters important to the Independent Trustees and (ii) with management prepares agendas for Board meetings.
Fidelity funds are overseen by different Boards of Trustees. The fund's Board oversees Fidelity's equity and high income funds and another Board oversees Fidelity's investment-grade bond, money market, and asset allocation funds. The asset allocation funds may invest in Fidelity funds overseen by the fund's Board. The use of separate Boards, each with its own committee structure, allows the Trustees of each group of Fidelity funds to focus on the unique issues of the funds they oversee, including common research, investment, and operational issues. On occasion, the separate Boards establish joint committees to address issues of overlapping consequences for the Fidelity funds overseen by each Board.
The Trustees operate using a system of committees to facilitate the timely and efficient consideration of all matters of importance to the Trustees, the fund, and fund shareholders and to facilitate compliance with legal and regulatory requirements and oversight of the fund's activities and associated risks. The Board, acting through its committees, has charged FMR and its affiliates with (i) identifying events or circumstances the occurrence of which could have demonstrably adverse effects on the fund's business and/or reputation; (ii) implementing processes and controls to lessen the possibility that such events or circumstances occur or to mitigate the effects of such events or circumstances if they do occur; and (iii) creating and maintaining a system designed to evaluate continuously business and market conditions in order to facilitate the identification and implementation processes described in (i) and (ii) above. Because the day-to-day operations and activities of the fund are carried out by or through FMR, its affiliates and other service providers, the fund's exposure to risks is mitigated but not eliminated by the processes overseen by the Trustees. While each of the Board's committees has responsibility for overseeing different aspects of the fund's activities, oversight is exercised primarily through the Operations, Audit, and Compliance Committees. In addition, the Independent Trustees have worked with FMR to enhance the Board's oversight of investment and financial risks, legal and regulatory risks, technology risks, and operational risks, including the development of additional risk reporting to the Board. For example, a working group comprised of Independent Trustees and FMR has worked and continues to work to review the Fidelity funds' valuation-related activities, reporting and risk management. Appropriate personnel, including but not limited to the fund's Chief Compliance Officer (CCO), FMR's internal auditor, the independent accountants, the fund's Treasurer and portfolio management personnel, make periodic reports to the Board's committees, as appropriate, including an annual review of FMR's risk management program for the Fidelity funds. The responsibilities of each standing committee, including their oversight responsibilities, are described further under "Standing Committees of the Fund's Trustees."
Annual Report
The fund's Statement of Additional Information (SAI) includes more information about the Trustees. To request a free copy, call Fidelity at 1-800-544-8544.
Interested Trustees*:
Correspondence intended for each Trustee who is an interested person may be sent to Fidelity Investments, 82 Devonshire Street, Boston, Massachusetts 02109.
Name, Age; Principal Occupations and Other Relevant Experience+ |
James C. Curvey (77) |
| Year of Election or Appointment: 2007 Mr. Curvey is Trustee and Chairman of the Board of Trustees of certain Trusts. Mr. Curvey also serves as Trustee (2007-present) of other investment companies advised by FMR. Mr. Curvey is a Director of Fidelity Investments Money Management, Inc. (2009-present), Director of Fidelity Research & Analysis Co. (2009-present) and Director of FMR and FMR Co., Inc. (2007-present). Mr. Curvey is also Vice Chairman (2007-present) and Director of FMR LLC. In addition, Mr. Curvey serves as an Overseer for the Boston Symphony Orchestra and a member of the Trustees of Villanova University. Previously, Mr. Curvey was the Vice Chairman (2006-2007) and Director (2000-2007) of FMR Corp. |
Ronald P. O'Hanley (55) |
| Year of Election or Appointment: 2011 Mr. O'Hanley is Director of FMR Co., Inc. (2010-present), Director of Fidelity Investments Money Management, Inc. (2010-present), Director of Fidelity Research & Analysis Company (2010-present), President of Fidelity Asset Management and Corporate Services and a member of Fidelity's Executive Committee (2010-present). Previously, Mr. O'Hanley served as President and Chief Executive Officer of BNY Mellon Asset Management (2007-2010). Mr. O'Hanley also served as Vice Chairman of Bank New York Mellon Corp. and a member of that firm's Executive Committee. Prior to the 2007 merger of The Bank of New York and Mellon Financial Corporation, he was Vice Chairman of Mellon Financial Corporation and President and Chief Executive Officer of Mellon Asset Management. He joined Mellon in February 1997. Mr. O'Hanley currently serves as Chairman of the Boston Public Library Foundation Board of Directors and sits on the Board of Directors of Beth Israel Deaconess Medical Center, the Board of Trustees of the Marine Biological Laboratory and the Advisory Board of the Maxwell School of Citizenship and Public Administration at Syracuse University. Mr. O'Hanley also chairs the Council on Asset Management for the Financial Services Roundtable and is a member of the Board of Directors of Institutional Investor's U.S. Institute. |
* Trustees have been determined to be "Interested Trustees" by virtue of, among other things, their affiliation with the trust or various entities under common control with FMR.
+ The information above includes each Trustee's principal occupation during the last five years and other information relating to the experience, attributes, and skills relevant to each Trustee's qualifications to serve as a Trustee, which led to the conclusion that each Trustee should serve as a Trustee for the fund.
Annual Report
Independent Trustees:
Correspondence intended for each Independent Trustee (that is, the Trustees other than the Interested Trustees) may be sent to Fidelity Investments, P.O. Box 55235, Boston, Massachusetts 02205-5235.
Name, Age; Principal Occupations and Other Relevant Experience+ |
Dennis J. Dirks (64) |
| Year of Election or Appointment: 2005 Prior to his retirement in May 2003, Mr. Dirks was Chief Operating Officer and a member of the Board of The Depository Trust & Clearing Corporation (DTCC). He also served as President, Chief Operating Officer, and Board member of The Depository Trust Company (DTC) and President and Board member of the National Securities Clearing Corporation (NSCC). In addition, Mr. Dirks served as Chief Executive Officer and Board member of the Government Securities Clearing Corporation, Chief Executive Officer and Board member of the Mortgage-Backed Securities Clearing Corporation, as a Trustee and a member of the Finance Committee of Manhattan College (2005-2008), and as a Trustee and a member of the Finance Committee of AHRC of Nassau County (2006-2008). Mr. Dirks is a member of the Independent Directors Council (IDC) Governing Council (2010-present) and Board of Directors for The Brookville Center for Children's Services, Inc. (2009-present). |
Alan J. Lacy (59) |
| Year of Election or Appointment: 2008 Mr. Lacy serves as Senior Adviser (2007-present) of Oak Hill Capital Partners, L.P. (private equity). Mr. Lacy also served as Chief Executive Officer (2000-2005) and Vice Chairman (2005-2006) of Sears Holdings Corporation and Sears, Roebuck and Co. (retail). In addition, Mr. Lacy serves as a member of the Board of Directors of Dave & Buster's Entertainment, Inc. (restaurant and entertainment complexes, 2010-present), Earth Fare, Inc. (retail grocery, 2012-present), The Hillman Companies, Inc. (hardware wholesalers, 2010-present), and Bristol-Myers Squibb Company (global pharmaceuticals, 2008-present). Mr. Lacy is a member of the Board of Trustees of The National Parks Conservation Association (2006-present). Previously, Mr. Lacy served as Chairman of the Board of Trustees of the National Parks Conservation Association (2008-2011) and as a member of the Board of Directors for the Western Union Company (global money transfer, 2006-2011). |
Ned C. Lautenbach (68) |
| Year of Election or Appointment: 2000 Mr. Lautenbach is Chairman of the Independent Trustees of the Equity and High Income Funds (2006-present). Mr. Lautenbach currently serves as the Lead Director of the Eaton Corporation Board of Directors (diversified industrial, 1997-present). Mr. Lautenbach is Chairman of the Board of Directors of the Philharmonic Center for the Arts in Naples, Florida (2012-present) and a member of the Council on Foreign Relations (1994-present). Previously, Mr. Lautenbach was a Partner/Advisory Partner at Clayton, Dubilier & Rice, LLC (private equity investment, 1998-2010), as well as a Director of Sony Corporation (2006-2007). |
Joseph Mauriello (68) |
| Year of Election or Appointment: 2008 Prior to his retirement in January 2006, Mr. Mauriello served in numerous senior management positions including Deputy Chairman and Chief Operating Officer (2004-2005), and Vice Chairman of Financial Services (2002-2004) of KPMG LLP US (professional services, 1965-2005). Mr. Mauriello currently serves as a member of the Board of Directors of XL Group plc. (global insurance and re-insurance, 2006-present). Previously, Mr. Mauriello served as a Director of the Hamilton Funds of the Bank of New York (2006-2007) and of Arcadia Resources Inc. (health care services and products, 2007-2012). |
Robert W. Selander (62) |
| Year of Election or Appointment: 2011 Previously, Mr. Selander served as a Member of the Advisory Board of Fidelity's Equity and High Income Funds (2011), Executive Vice Chairman (2010), Chief Executive Officer (2009-2010), and President and Chief Executive Officer (1997-2009) of Mastercard, Inc. |
Cornelia M. Small (68) |
| Year of Election or Appointment: 2005 Ms. Small is a member of the Board of Directors (2009-present) and Chair of the Investment Committee (2010-present) of the Teagle Foundation. Ms. Small also serves on the Investment Committee of the Berkshire Taconic Community Foundation (2008-present). Previously, Ms. Small served as Chairperson (2002-2008) and a member of the Investment Committee and Chairperson (2008-2012) and a member of the Board of Trustees of Smith College. In addition, Ms. Small served as Chief Investment Officer, Director of Global Equity Investments, and a member of the Board of Directors of Scudder, Stevens & Clark and Scudder Kemper Investments. |
William S. Stavropoulos (73) |
| Year of Election or Appointment: 2001 Mr. Stavropoulos is Vice Chairman of the Independent Trustees of the Equity and High Income Funds (2006-present). Mr. Stavropoulos serves as President and Founder of the Michigan Baseball Foundation, the Great Lakes Loons (2007-present). Mr. Stavropoulos is Chairman Emeritus of the Board of Directors of The Dow Chemical Company, where he previously served in numerous senior management positions, including President, CEO (1995-2000; 2002-2004), Chairman of the Executive Committee (2000-2006), and as a member of the Board of Directors (1990-2006). Currently, Mr. Stavropoulos is a Director of Univar Inc. (global distributor of commodity and specialty chemicals, Chairman from 2010-May 2012 and Lead Director from May 2012-present), Teradata Corporation (data warehousing and technology solutions, 2008-present), Maersk Inc. (industrial conglomerate), and Tyco International, Ltd. (multinational manufacturing and services, 2007-present), and a member of the Advisory Board for Metalmark Capital LLC (private equity investment, 2005-present). Mr. Stavropoulos is an operating advisor to Clayton, Dubilier & Rice, LLC (private equity investment). In addition, Mr. Stavropoulos is a member of the University of Notre Dame Advisory Council for the College of Science, a Trustee of the Rollin L. Gerstacker Foundation, and a Director of the Naples Philharmonic Center for the Arts. Previously, Mr. Stavropoulos served as a Director of Chemical Financial Corporation (bank holding company, 1993-2012). |
David M. Thomas (63) |
| Year of Election or Appointment: 2008 Previously, Mr. Thomas served as Executive Chairman (2005-2006) and Chairman and Chief Executive Officer (2000-2005) of IMS Health, Inc. (pharmaceutical and healthcare information solutions), and a Director of Fortune Brands, Inc. (consumer products, 2000-2011). In addition, Mr. Thomas serves as Non-Executive Chairman of the Board of Directors of Fortune Brands Home and Security (home and security products, 2011-present), and as a member of the Board of Directors of Interpublic Group of Companies, Inc. (marketing communication, 2004-present). |
Michael E. Wiley (62) |
| Year of Election or Appointment: 2008 Mr. Wiley also serves as a Director of Asia Pacific Exploration Consolidated (international oil and gas exploration and production, 2008-present). Mr. Wiley serves as a Director of Tesoro Corporation (independent oil refiner and marketer, 2005-present), and a Director of Bill Barrett Corporation (exploration and production, 2005-present). In addition, Mr. Wiley also serves as a Director of Post Oak Bank (privately-held bank, 2004-present). Previously, Mr. Wiley served as a member of the Board of Trustees of the University of Tulsa (2000-2006; 2007-2010), as a Senior Energy Advisor of Katzenbach Partners, LLC (consulting, 2006-2007), as an Advisory Director of Riverstone Holdings (private investment), Chairman, President, and CEO of Baker Hughes, Inc. (oilfield services, 2000-2004), and as Director of Spinnaker Exploration Company (exploration and production, 2001-2005). |
+ The information above includes each Trustee's principal occupation during the last five years and other information relating to the experience, attributes, and skills relevant to each Trustee's qualifications to serve as a Trustee, which led to the conclusion that each Trustee should serve as a Trustee for the fund.
Advisory Board Members and Executive Officers:
Correspondence intended for David A. Rosow and Garnett A. Smith may be sent to Fidelity Investments, P.O. Box 55235, Boston, Massachusetts 02205-5235. Correspondence intended for each executive officer, Edward C. Johnson 3d, and Peter S. Lynch may be sent to Fidelity Investments, 82 Devonshire Street, Boston, Massachusetts 02109.
Name, Age; Principal Occupation |
Edward C. Johnson 3d (82) |
| Year of Election or Appointment: 2011 Member of the Advisory Board of Fidelity's Equity and High Income Funds. Mr. Johnson serves as Chief Executive Officer, Chairman, and a Director of FMR LLC, and also serves as Chairman and Director of FIL Limited. Previously, Mr. Johnson served as a Trustee and Chairman of the Board of certain Fidelity Trusts, Chairman and a Director of FMR, Chairman and a Director of FMR Co., Inc., and President of FMR LLC (2006-2007). |
Peter S. Lynch (68) |
| Year of Election or Appointment: 2003 Member of the Advisory Board of Fidelity's Equity and High Income Funds. Mr. Lynch is Vice Chairman and a Director of FMR and FMR Co., Inc. In addition, Mr. Lynch serves as a Trustee of Boston College and as the Chairman of the Inner-City Scholarship Fund. Previously, Mr. Lynch served on the Special Olympics International Board of Directors (1997-2006). |
David A. Rosow (70) |
| Year of Election or Appointment: 2012 Member of the Advisory Board of Fidelity's Equity and High Income Funds. Chairman and Chief Executive Officer of International Golf Group, Inc. (golf course development, 1989-present). Previously, Mr. Rosow served as Chairman and Chief Executive Officer of Rosow & Company, Inc. (private investment company, 1989-2011), a Lead Director of Hudson United Bancorp (2001-2006) and as a Director of TD Banknorth (1996-2006). In addition, Mr. Rosow is a member (2008-present) and President (2009-present) of the Town Council of Palm Beach, Florida. |
Garnett A. Smith (65) |
| Year of Election or Appointment: 2012 Member of the Advisory Board of Fidelity's Equity and High Income Funds. Prior to Mr. Smith's retirement, he served as Chairman and Chief Executive Officer of Inbrand Corp. (manufacturer of personal absorbent products, 1990-1997). He also served as President (1986-1990) of Inbrand Corp. Prior to his employment with Inbrand Corp., he was employed by a retail fabric chain and North Carolina National Bank. In addition, Mr. Smith is a board member of the Jackson Hole Land Trust (2009-present). |
Kenneth B. Robins (43) |
| Year of Election or Appointment: 2008 President and Treasurer of Fidelity's Equity and High Income Funds. Mr. Robins also serves as President and Treasurer (2010-present) and Assistant Treasurer (2009-present) of other Fidelity funds and is an employee of Fidelity Investments (2004-present). Previously, Mr. Robins served as Deputy Treasurer of the Fidelity funds (2005-2008) and Treasurer and Chief Financial Officer of The North Carolina Capital Management Trust: Cash and Term Portfolios (2006-2008). |
Bruce T. Herring (47) |
| Year of Election or Appointment: 2006 Vice President of certain Equity Funds. Mr. Herring also serves as President of Fidelity Research & Analysis Company (2010-present), Chief Investment Officer and Director of Fidelity Management & Research (U.K.) Inc. (2010-present) and Group Chief Investment Officer of FMR. Previously, Mr. Herring served as Vice President (2005-2006) and Senior Vice President (2006-2007) of Fidelity Management & Research Company, Vice President of FMR Co., Inc. (2001-2007) and as a portfolio manager for Fidelity U.S. Equity Funds. |
Brian B. Hogan (48) |
| Year of Election or Appointment: 2009 Vice President of Equity and High Income Funds. Mr. Hogan also serves as President of FMR's Equity Division (2009-present). Previously, Mr. Hogan served as Senior Vice President, Equity Research of FMR (2006-2009) and as a portfolio manager. |
Scott C. Goebel (44) |
| Year of Election or Appointment: 2008 Secretary and Chief Legal Officer (CLO) of the Fidelity funds. Mr. Goebel also serves as Secretary of Fidelity Investments Money Management, Inc. (FIMM) (2010-present) and Fidelity Research and Analysis Company (FRAC) (2010-present); Secretary and CLO of The North Carolina Capital Management Trust: Cash and Term Portfolios (2008-present); General Counsel, Secretary, and Senior Vice President of FMR (2008-present) and FMR Co., Inc. (2008-present); employed by FMR LLC or an affiliate (2001-present); Chief Legal Officer of Fidelity Management & Research (Hong Kong) Limited (2008-present) and Assistant Secretary of Fidelity Management & Research (Japan) Inc. (2008-present), and Fidelity Management & Research (U.K.) Inc. (2008-present). Previously, Mr. Goebel served as Assistant Secretary of FIMM (2008-2010), FRAC (2008-2010), and the Funds (2007-2008) and as Vice President and Secretary of Fidelity Distributors Corporation (FDC) (2005-2007). |
William C. Coffey (43) |
| Year of Election or Appointment: 2009 Assistant Secretary of Fidelity's Equity and High Income Funds. Mr. Coffey also serves as Senior Vice President and Deputy General Counsel of FMR LLC (2010-present), and is an employee of Fidelity Investments. Previously, Mr. Coffey served as Vice President and Associate General Counsel of FMR LLC (2005-2009). |
Elizabeth Paige Baumann (44) |
| Year of Election or Appointment: 2012 Anti-Money Laundering (AML) Officer of the Fidelity funds. Ms. Baumann also serves as AML Officer of The North Carolina Capital Management Trust: Cash and Term Portfolios (2012-present), Chief AML Officer of FMR LLC (2012-present), and is an employee of Fidelity Investments. Previously, Ms. Baumann served as Vice President and Deputy Anti-Money Laundering Officer (2007-2012). |
Christine Reynolds (54) |
| Year of Election or Appointment: 2008 Chief Financial Officer of the Fidelity funds. Ms. Reynolds became President of Fidelity Pricing and Cash Management Services (FPCMS) in August 2008. Ms. Reynolds served as Chief Operating Officer of FPCMS (2007-2008). Previously, Ms. Reynolds served as President, Treasurer, and Anti-Money Laundering officer of the Fidelity funds (2004-2007). |
Joseph A. Hanlon (44) |
| Year of Election or Appointment: 2012 Chief Compliance Officer of Fidelity's Equity and High Income Funds. Mr. Hanlon serves as Compliance Officer of FMR, FMR Co., Inc., Fidelity Investments Money Management, Inc. (FIMM), Fidelity Research and Analysis Company (FRAC), Fidelity Management & Research (Japan) Inc., Fidelity Management & Research (U.K.) Inc., Fidelity Management & Research (Hong Kong), and Strategic Advisers, Inc. (2009-present), as Senior Vice President of the Fidelity Asset Management Division (2009-present), and is an employee of Fidelity Investments. |
Joseph F. Zambello (55) |
| Year of Election or Appointment: 2011 Deputy Treasurer of the Fidelity funds. Mr. Zambello is an employee of Fidelity Investments. Previously, Mr. Zambello served as Vice President of FMR's Program Management Group (2009-2011) and Vice President of the Transfer Agent Oversight Group (2005-2009). |
Adrien E. Deberghes (45) |
| Year of Election or Appointment: 2008 Deputy Treasurer of Fidelity's Equity and High Income Funds. Mr. Deberghes also serves as Vice President (2011-present) and Assistant Treasurer (2010-present) of other Fidelity funds, and is an employee of Fidelity Investments (2008-present). Previously, Mr. Deberghes served as Senior Vice President of Mutual Fund Administration at State Street Corporation (2007-2008), Senior Director of Mutual Fund Administration at Investors Bank & Trust (2005-2007), and Director of Finance for Dunkin' Brands (2000-2005). |
Stephen Sadoski (41) |
| Year of Election or Appointment: 2012 Deputy Treasurer of Fidelity's Equity and High Income Funds. Mr. Sadoski also serves as Assistant Treasurer of other Fidelity funds (2012-present) and is an employee of Fidelity Investments (2012-present). Previously, Mr. Sadoski served as an assistant chief accountant in the Division of Investment Management of the Securities and Exchange Commission (SEC) (2009-2012) and as a senior manager at Deloitte & Touche (1997-2009). |
Stephanie J. Dorsey (43) |
| Year of Election or Appointment: 2010 Assistant Treasurer of Fidelity's Equity and High Income Funds. Ms. Dorsey also serves as Deputy Treasurer of other Fidelity funds (2008-present) and is an employee of Fidelity Investments (2008-present). Previously, Ms. Dorsey served as Treasurer (2004-2008) of the JPMorgan Mutual Funds and Vice President (2004-2008) of JPMorgan Chase Bank. |
John R. Hebble (54) |
| Year of Election or Appointment: 2009 Assistant Treasurer of Fidelity's Equity and High Income Funds. Mr. Hebble also serves as President (2011-present), Treasurer, and Chief Financial Officer of The North Carolina Capital Management Trust: Cash and Term Portfolios (2008-present), President and Treasurer of other Fidelity funds (2008-present) and is an employee of Fidelity Investments. |
Gary W. Ryan (54) |
| Year of Election or Appointment: 2005 Assistant Treasurer of the Fidelity funds. Mr. Ryan is an employee of Fidelity Investments. Previously, Mr. Ryan served as Vice President of Fund Reporting in Fidelity Pricing and Cash Management Services (FPCMS) (1999-2005). |
Jonathan Davis (44) |
| Year of Election or Appointment: 2010 Assistant Treasurer of the Fidelity funds. Mr. Davis is also Assistant Treasurer of Fidelity Rutland Square Trust II and Fidelity Commonwealth Trust II. Mr. Davis is an employee of Fidelity Investments. Previously, Mr. Davis served as Vice President and Associate General Counsel of FMR LLC (2003-2010). |
Annual Report
The Board of Trustees of Fidelity International Value Fund voted to pay on December 10, 2012, to shareholders of record at the opening of business on December 7, 2012, a distribution of $0.042 per share derived from capital gains realized from sales of portfolio securities and a dividend of $0.223 per share from net investment income.
The fund designates 78% of the dividends distributed in December 2011 during the fiscal year as amounts which may be taken into account as a dividend for the purposes of the maximum rate under section 1(h)(11) of the Internal Revenue Code.
The amounts per share which represent income derived from sources within, and taxes paid to, foreign countries or possessions of the United States are as follows:
| Pay Date | Income | Taxes |
International Value Fund | 12/05/2011 | $0.218 | $0.0133 |
The fund will notify shareholders in January 2013 of amounts for use in preparing 2012 income tax returns.
Annual Report
Board Approval of Investment Advisory Contracts and Management Fees
Fidelity International Value Fund
Each year, the Board of Trustees, including the Independent Trustees (together, the Board), votes on the renewal of the management contract and sub-advisory agreements (together, the Advisory Contracts) for the fund. The Board, assisted by the advice of fund counsel and Independent Trustees' counsel, requests and considers a broad range of information relevant to the renewal of the Advisory Contracts throughout the year.
The Board meets regularly and, at each of its meetings, considers factors that are relevant to its annual consideration of the renewal of the fund's Advisory Contracts, including the services and support provided to the fund and its shareholders. The Board has established various standing committees, each composed of and chaired by Independent Trustees with varying backgrounds, to which the Board has assigned specific subject matter responsibilities in order to enhance effective decision-making by the Board. The Board, acting directly and through its Committees, requests and receives information concerning the annual consideration of the renewal of the fund's Advisory Contracts. The Board also meets as needed to consider matters specifically related to the Board's annual consideration of the renewal of Advisory Contracts. Members of the Board may also meet with trustees of other Fidelity funds through ad hoc joint committees to discuss certain matters relevant to the Fidelity funds.
At its July 2012 meeting, the Board of Trustees, including the Independent Trustees, unanimously determined to renew the fund's Advisory Contracts. In reaching its determination, the Board considered all factors it believed relevant, including (i) the nature, extent, and quality of the services to be provided to the fund and its shareholders (including the investment performance of the fund); (ii) the competitiveness of the fund's management fee and total expense ratio relative to peer funds; (iii) the total costs of the services to be provided by and the profits to be realized by Fidelity from its relationship with the fund; (iv) the extent to which economies of scale exist and would be realized as the fund grows; and (v) whether fee levels reflect these economies of scale, if any, for the benefit of fund shareholders.
In considering whether to renew the Advisory Contracts for the fund, the Board reached a determination, with the assistance of fund counsel and Independent Trustees' counsel and through the exercise of its business judgment, that the renewal of the Advisory Contracts is in the best interests of the fund and its shareholders and that the compensation payable under the Advisory Contracts is fair and reasonable. The Board's decision to renew the Advisory Contracts was not based on any single factor, but rather was based on a comprehensive consideration of all the information provided to the Board at its meetings throughout the year. The Board, in reaching its determination to renew the Advisory Contracts, is aware that shareholders in the fund have a broad range of investment choices available to them, including a wide choice among mutual funds offered by Fidelity's competitors, and that the fund's shareholders, who have the opportunity to review and weigh the disclosure provided by the fund in its prospectus and other public disclosures, have chosen to invest in this fund, managed by Fidelity.
Annual Report
Nature, Extent, and Quality of Services Provided. The Board considered the staffing within the investment adviser, FMR, and the sub-advisers (together, the Investment Advisers), including the backgrounds of the fund's investment personnel, and also considered the fund's investment objective, strategies, and related investment philosophy. The Independent Trustees also had discussions with senior management of Fidelity's investment operations and investment groups. The Board considered the structure of the portfolio manager compensation program and whether this structure provides appropriate incentives to act in the best interests of the fund.
Resources Dedicated to Investment Management and Support Services. The Board and the Fund Oversight and Research Committees reviewed the general qualifications and capabilities of the Investment Advisers' investment staff, including its size, education, experience, and resources, as well as the Investment Advisers' approach to recruiting, training, managing, and compensating investment personnel. The Board also noted that FMR has continued to increase the resources devoted to non-U.S. offices, including expansion of Fidelity's global investment organization. The Board noted that Fidelity's analysts have extensive resources, tools and capabilities that allow them to conduct sophisticated quantitative and fundamental analysis, as well as credit analysis of issuers, counterparties and guarantors. The Board also believes that Fidelity's investment professionals have sufficient access to global information and data so as to provide competitive investment results over time, and that those professionals also have access to sophisticated tools that permit them to assess portfolio construction and risk and performance attribution characteristics continuously, as well as to transmit new information and research conclusions rapidly around the world. Additionally, in its deliberations, the Board considered the Investment Advisers' trading and risk management capabilities and resources, which are an integral part of the investment management process.
Shareholder and Administrative Services. The Board considered (i) the nature, extent, quality, and cost of advisory, administrative, and shareholder services performed by the Investment Advisers and their affiliates under the Advisory Contracts and under separate agreements covering transfer agency, pricing and bookkeeping, and securities lending services for the fund; (ii) the nature and extent of the supervision of third party service providers, principally custodians and subcustodians; and (iii) the resources devoted to, and the record of compliance with, the fund's compliance policies and procedures. The Board also reviewed the allocation of fund brokerage, including allocations to brokers affiliated with the Investment Advisers, the use of brokerage commissions to pay fund expenses, and the use of "soft" commission dollars to pay for research services.
Annual Report
Board Approval of Investment Advisory Contracts and
Management Fees - continued
The Board noted that the growth of fund assets over time across the complex allows Fidelity to reinvest in the development of services designed to enhance the value or convenience of the Fidelity funds as investment vehicles. These services include 24-hour access to account information and market information through telephone representatives and over the Internet, investor education materials and asset allocation tools, and the expanded availability of Fidelity Investor Centers.
Investment in a Large Fund Family. The Board considered the benefits to shareholders of investing in a Fidelity fund, including the benefits of investing in a fund that is part of a large family of funds offering a variety of investment disciplines and providing a large variety of mutual fund investor services. The Board noted that Fidelity had taken, or had made recommendations that resulted in the Fidelity funds taking, a number of actions over the previous year that benefited particular funds, including (i) continuing to dedicate additional resources to investment research and support of the senior management team that oversees asset management; (ii) persisting in efforts to enhance Fidelity's research capabilities, in particular, international research; (iii) launching new funds and making other enhancements to meet client needs for global and income-oriented solutions; (iv) continuing to launch dedicated lower cost underlying funds to meet investment management's portfolio construction needs related to expanding underlying fund options, specifically for the Freedom Fund product lines; (v) adopting a "Stock Selector" sector neutral investment approach and employing a team of portfolio managers who are sector specialists to manage certain funds; (vi) rationalizing product lines and gaining increased efficiencies through the mergers of several funds into other funds; (vii) strengthening the Spartan Index Fund product line by adding new funds and/or new low-cost institutional share classes, restructuring fund expenses to accommodate new classes, and reducing investment minimums for certain classes of shares; (viii) modifying the eligibility criteria for Institutional Class shares to increase their appeal to government entities and charitable investors; and (ix) reducing certain transfer agent fee rates.
Investment Performance. The Board considered whether the fund has operated in accordance with its investment objective, as well as its record of compliance with its investment restrictions. It also reviewed the fund's absolute investment performance for each class, as well as the fund's relative investment performance for each class measured over multiple periods against (i) a broad-based securities market index, and (ii) a custom peer group of mutual funds deemed appropriate by Fidelity and reviewed by the Board. The following charts considered by the Board show, over the one-, three-, and five-year periods ended December 31, 2011, the cumulative total returns of Institutional Class (Class I) and Class B of the fund, the cumulative total returns of a broad-based securities market index ("benchmark"), and a range of cumulative total returns of a custom peer group of mutual funds defined by FMR based on categories assigned by Morningstar, Inc. The returns of Institutional Class (Class I) and Class B show the performance of the highest and lowest performing classes, respectively (based on five-year performance). The box within each chart shows the 25th percentile return (top of box) and the 75th percentile return (bottom of box) of the peer group. Returns shown above the box are in the first quartile and returns shown below the box are in the fourth quartile. The percentage beaten numbers noted below each chart correspond to the percentile box and represent the percentage of funds in the peer group whose performance was equal to or lower than that of the class indicated. The fund's custom peer group, defined by FMR, is a peer group that FMR believes provides a more meaningful performance comparison than the peer group assigned by Morningstar, Inc., which assigns mutual funds to categories based on their investment styles as measured by their underlying portfolio holdings.
Annual Report
Fidelity International Value Fund

The Board reviewed the fund's relative investment performance against its peer group and noted that the performance of Institutional Class (Class I) of the fund was in the fourth quartile for the one- and five-year periods and the third quartile for the three-year period. The Board also noted that the investment performance of the fund was lower than its benchmark for all the periods shown. The Board considered that the variations in performance among the fund's classes reflect the variations in class expenses, which result in lower performance for higher expense classes. The Board discussed with FMR actions to improve the fund's disappointing performance relative to its peer group and benchmark. The Board noted that this fund had underperformed in the past and discussed with FMR its disappointment with the continued underperformance of the fund. The Board noted that there was a portfolio management change for the fund in September 2011. The Board also reviewed the fund's performance since inception as well as performance in the current year. The Board will continue to closely monitor the performance of the fund in the coming year and discuss with FMR other appropriate actions to address the performance of the fund.
Annual Report
Board Approval of Investment Advisory Contracts and
Management Fees - continued
The Board also considered that the fund's management fee is subject to upward or downward adjustment depending upon whether, and to what extent, the fund's investment performance for the performance period exceeds, or is exceeded by, the record (over the same period) of a Board-approved performance adjustment index. The Board noted that the performance adjustment provides FMR with a strong economic incentive to seek to achieve superior performance for the fund's shareholders and helps to more closely align the interests of FMR and the fund's shareholders.
Based on its review, the Board concluded that the nature, extent, and quality of services provided to the fund under the Advisory Contracts should benefit the fund's shareholders.
Competitiveness of Management Fee and Total Expense Ratio. The Board considered the fund's management fee and total expense ratio compared to "mapped groups" of competitive funds and classes. Fidelity creates "mapped groups" by combining similar Lipper investment objective categories that have comparable management fee characteristics. Combining Lipper investment objective categories aids the Board's management fee and total expense ratio comparisons by broadening the competitive group used for comparison and by reducing the number of universes to which various Fidelity funds are compared.
Management Fee. The Board considered two proprietary management fee comparisons for the 12-month periods shown in the chart below. The group of Lipper funds used by the Board for management fee comparisons is referred to below as the "Total Mapped Group." The Total Mapped Group comparison focuses on a fund's standing relative to the total universe of comparable funds available to investors in terms of gross management fees before expense reimbursements or caps, and without giving effect to the fund's performance adjustment. "TMG %" represents the percentage of funds in the Total Mapped Group that had management fees that were lower than the fund's. For example, a TMG % of 17% means that 83% of the funds in the Total Mapped Group had higher management fees than the fund. The "Asset-Size Peer Group" (ASPG) comparison focuses on a fund's standing relative to non-Fidelity funds similar in size to the fund within the Total Mapped Group. The ASPG represents at least 15% of the funds in the Total Mapped Group with comparable asset size and management fee characteristics, subject to a minimum of 50 funds (or all funds in the Total Mapped Group if fewer than 50). Additional information, such as the ASPG quartile in which the fund's management fee ranked and the impact of the fund's performance adjustment, is also included in the chart and considered by the Board.
Annual Report
Fidelity International Value Fund
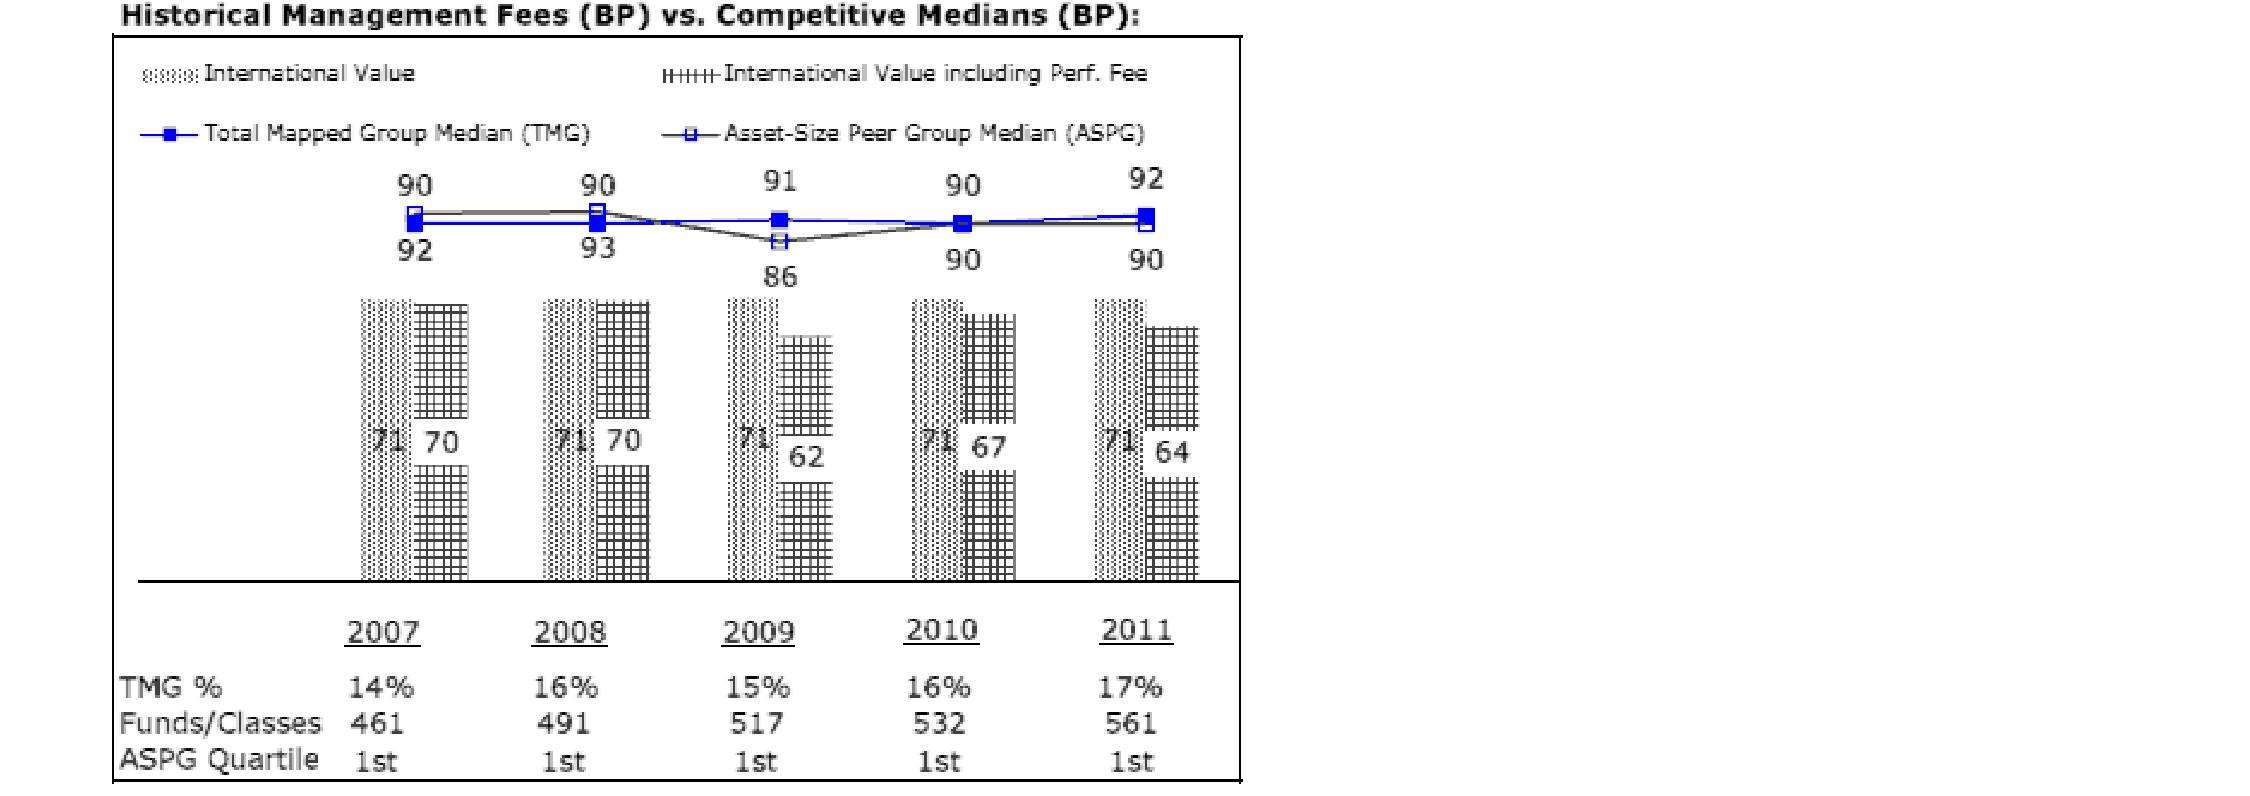
The Board noted that the fund's management fee ranked below the median of its Total Mapped Group and below the median of its ASPG for 2011. The Board also noted the effect of the fund's negative performance adjustment on the fund's management fee ranking. The Board noted that the performance adjustment for each year represents calculations for performance periods that differ from the periods shown in the performance charts above.
Based on its review, the Board concluded that the fund's management fee is fair and reasonable in light of the services that the fund receives and the other factors considered.
Total Expense Ratio. In its review of each class's total expense ratio, the Board considered the fund's management fee as well as other fund or class expenses, as applicable, such as transfer agent fees, pricing and bookkeeping fees, fund-paid 12b-1 fees, and custodial, legal, and audit fees. The Board also noted the effects of any waivers and reimbursements on fees and expenses, as well as the impact of the fund's performance adjustment. As part of its review, the Board also considered the current and historical total expense ratios of each class of the fund compared to competitive fund median expenses. Each class of the fund is compared to those funds and classes in the Total Mapped Group (used by the Board for management fee comparisons) that have a similar sales load structure.
The Board noted that the total expense ratio of each of Class A, Class B, Class C, Institutional Class, and the retail class ranked below its competitive median for 2011 and the total expense ratio of Class T ranked above its competitive median for 2011. The Board considered that various factors, including 12b-1 fees, positive or negative performance adjustments, and relatively higher other expenses in the case of small fund size, can affect total expense ratios. The Board noted that the total expense ratio of Class T was above the competitive median primarily because of higher 12b-1 fees on Class T. Class T has a higher 12b-1 fee, but a lower front-end sales charge, than traditionally priced front-end sales charge classes. The Board considered that Class T is primarily sold load-waived in the retirement plan market where its 0.50% 12b-1 fee is comparable to competing no-load, higher 12b-1 fee classes designed specifically for retirement plans. The Board noted that the fund offers multiple classes, each of which has a different sales load and 12b-1 fee structure, and that the multiple structures are intended to offer a range of pricing options for the intermediary market. The Board also noted that the total expense ratios of the classes vary primarily by the level of their 12b-1 fees, although differences in transfer agent fees may also cause expenses to vary from class to class.
Annual Report
Board Approval of Investment Advisory Contracts and
Management Fees - continued
Fees Charged to Other Fidelity Clients. The Board also considered Fidelity fee structures and other information with respect to clients of FMR and its affiliates, such as other mutual funds advised or subadvised by FMR or its affiliates, pension plan clients, and other institutional clients. The Board noted the findings of the 2010 ad hoc joint committee (created with the board of other Fidelity funds), which reviewed and compared Fidelity's institutional investment advisory business with its business of providing services to the Fidelity funds, including the differences in services provided, fees charged, and costs incurred, as well as competition in their respective marketplaces.
Based on its review of total expense ratios and fees charged to other Fidelity clients, the Board concluded that the total expense ratio of each class of the fund was reasonable, although Class T was above the median of the universe presented for comparison, in light of the services that the fund and its shareholders receive and the other factors considered.
Costs of the Services and Profitability. The Board considered the revenues earned and the expenses incurred by Fidelity in conducting the business of developing, marketing, distributing, managing, administering and servicing the fund and its shareholders. The Board also considered the level of Fidelity's profits in respect of all the Fidelity funds.
On an annual basis, FMR presents to the Board Fidelity's profitability for the fund. Fidelity calculates the profitability for each fund, as well as aggregate profitability for groups of Fidelity funds and all Fidelity funds, using a series of detailed revenue and cost allocation methodologies which originate with the books and records of Fidelity on which Fidelity's audited financial statements are based. The Audit Committee of the Board reviews any significant changes from the prior year's methodologies.
PricewaterhouseCoopers LLP (PwC), independent registered public accounting firm and auditor to Fidelity and certain Fidelity funds, has been engaged annually by the Board as part of the Board's assessment of Fidelity's profitability analysis. PwC's engagement includes the review and assessment of Fidelity's methodologies used in determining the revenues and expenses attributable to Fidelity's mutual fund business, and completion of agreed-upon procedures surrounding the mathematical accuracy of fund profitability and its conformity to allocation methodologies. After considering PwC's reports issued under the engagement and information provided by Fidelity, the Board concluded that while other allocation methods may also be reasonable, Fidelity's profitability methodologies are reasonable in all material respects.
Annual Report
The Board also reviewed Fidelity's non-fund businesses and fall-out benefits related to the mutual fund business as well as cases where Fidelity's affiliates may benefit from or be related to the fund's business.
The Board considered the costs of the services provided by and the profits realized by Fidelity in connection with the operation of the fund and was satisfied that the profitability was not excessive in the circumstances.
Economies of Scale. The Board considered whether there have been economies of scale in respect of the management of the Fidelity funds, whether the Fidelity funds (including the fund) have appropriately benefited from any such economies of scale, and whether there is potential for realization of any further economies of scale. The Board considered the extent to which the fund will benefit from economies of scale through increased services to the fund, through waivers or reimbursements, or through fee or expense reductions. The Board also noted that in 2009, it and the board of other Fidelity funds created an ad hoc committee (the Economies of Scale Committee) to analyze whether FMR attains economies of scale in respect of the management and servicing of the Fidelity funds, whether the Fidelity funds have appropriately benefited from such economies of scale, and whether there is potential for realization of any further economies of scale.
The Board recognized that the fund's management contract incorporates a "group fee" structure, which provides for lower group fee rates as total fund assets under FMR's management increase, and for higher group fee rates as total fund assets under FMR's management decrease. FMR calculates the group fee rates based on a tiered asset "breakpoint" schedule that varies based on asset class. The Board considered that the group fee is designed to deliver the benefits of economies of scale to fund shareholders when total Fidelity fund assets increase, even if assets of any particular fund are unchanged or have declined, because some portion of Fidelity's costs are attributable to services provided to all Fidelity funds, and all funds benefit if those costs can be allocated among more assets. The Board concluded that, given the group fee structure, fund shareholders will benefit from lower management fees as assets under FMR's management increase at the fund complex level, regardless of whether Fidelity achieves any such economies of scale.
Annual Report
Board Approval of Investment Advisory Contracts and
Management Fees - continued
The Board concluded, taking into account the analysis of the Economies of Scale Committee, that economies of scale, if any, are being appropriately shared between fund shareholders and Fidelity.
Additional Information Requested by the Board. In order to develop fully the factual basis for consideration of the Fidelity funds' Advisory Contracts, the Board requested and received additional information on certain topics, including (i) fund performance trends, actions to be taken by FMR to improve certain funds' overall performance, and Fidelity's long-term strategies for certain funds; (ii) the potential to further rationalize the Fidelity fund lineup with the possibility of achieving savings for the funds and Fidelity; (iii) Fidelity's compensation structure for portfolio managers and other key investment personnel; (iv) the amount of the investment that each portfolio manager has made in the Fidelity fund(s) that he or she manages; (v) the realization of fall-out benefits in certain Fidelity business units; (vi) Fidelity's group fee structures, the potential impact of regulatory changes on such structures, and the rationale for the individual fee rates of certain funds; (vii) fund profitability methodology, including Fidelity's cost allocation methodology, and the impact of certain factors on fund profitability results; (viii) trends regarding industry use of performance fee structures and the possibility of implementing performance fee structures for additional funds; and (ix) the impact of net redemptions from the Fidelity funds.
Based on its evaluation of all of the conclusions noted above, and after considering all factors it believed relevant, the Board ultimately concluded that the advisory fee structures are fair and reasonable, and that the fund's Advisory Contracts should be renewed.
Annual Report
Investment Adviser
Fidelity Management & Research Company
Boston, MA
Investment Sub-Advisers
FMR Co., Inc.
Fidelity Management & Research
(U.K.) Inc.
Fidelity Management & Research
(Hong Kong) Limited
Fidelity Management & Research
(Japan) Inc.
FIL Investment Advisors
FIL Investments (Japan) Limited
FIL Investment Advisors (U.K.) Ltd.
General Distributor
Fidelity Distributors Corporation
Smithfield, RI
Transfer and Service Agents
Fidelity Investments Institutional
Operations Company, Inc.
Boston, MA
Fidelity Service Company, Inc.
Boston, MA
Custodian
The Northern Trust Company
Chicago, Illinois
The Fidelity Telephone Connection
Mutual Fund 24-Hour Service
Exchanges/Redemptions
and Account Assistance 1-800-544-6666
Product Information 1-800-544-8888
Retirement Accounts 1-800-544-4774
(8 a.m. - 9 p.m.)
TDD Service 1-800-544-0118
for the deaf and hearing impaired
(9 a.m. - 9 p.m. Eastern time)
Fidelity Automated Service
Telephone (FAST®) (automated graphic)
1-800-544-5555
(automated graphic)
Automated line for quickest service
(Fidelity Investment logo)(registered trademark)
Corporate Headquarters
82 Devonshire St., Boston, MA 02109
www.fidelity.com
FIV-UANN-1212
1.827481.106
(Fidelity Investment logo)(registered trademark)
Fidelity Advisor®
International Discovery
Fund - Class A, Class T, Class B
and Class C
Annual Report
October 31, 2012
(Fidelity Cover Art)
Class A, Class T, Class B, and Class C are classes of Fidelity® International Discovery Fund
Contents
Performance | (Click Here) | How the fund has done over time. |
Management's Discussion of Fund Performance | (Click Here) | The Portfolio Manager's review of fund performance and strategy. |
Shareholder Expense Example | (Click Here) | An example of shareholder expenses. |
Investment Changes | (Click Here) | A summary of major shifts in the fund's investments over the past six months. |
Investments | (Click Here) | A complete list of the fund's investments with their market values. |
Financial Statements | (Click Here) | Statements of assets and liabilities, operations, and changes in net assets, as well as financial highlights. |
Notes | (Click Here) | Notes to financial statements. |
Report of Independent Registered Public Accounting Firm | (Click Here) | |
Trustees and Officers | (Click Here) | |
Distributions | (Click Here) | |
Board Approval of Investment Advisory Contracts and Management Fees | (Click Here) | |
To view a fund's proxy voting guidelines and proxy voting record for the 12-month period ended June 30, visit http://www.fidelity.com/proxyvotingresults or visit the Securities and Exchange Commission's (SEC) web site at http://www.sec.gov. You may also call 1-877-208-0098 to request a free copy of the proxy voting guidelines.
Standard & Poor's, S&P and S&P 500 are registered service marks of The McGraw-Hill Companies, Inc. and have been licensed for use by Fidelity Distributors Corporation.
Other third party marks appearing herein are the property of their respective owners.
All other marks appearing herein are registered or unregistered trademarks or service marks of FMR LLC or an affiliated company. © 2012 FMR LLC. All rights reserved.
Annual Report
This report and the financial statements contained herein are submitted for the general information of the shareholders of the fund. This report is not authorized for distribution to prospective investors in the fund unless preceded or accompanied by an effective prospectus.
A fund files its complete schedule of portfolio holdings with the SEC for the first and third quarters of each fiscal year on Form N-Q. Forms N-Q are available on the SEC's web site at http://www.sec.gov. A fund's Forms N-Q may be reviewed and copied at the SEC's Public Reference Room in Washington, DC. Information regarding the operation of the SEC's Public Reference Room may be obtained by calling 1-800-SEC-0330. For a complete list of a fund's portfolio holdings, view the most recent holdings listing, semiannual report, or annual report on Fidelity's web site at http://www.fidelity.com, http://www.advisor.fidelity.com, or http://www.401k.com, as applicable.
NOT FDIC INSURED • MAY LOSE VALUE • NO BANK GUARANTEE
Neither the fund nor Fidelity Distributors Corporation is a bank.
Annual Report
Average annual total return reflects the change in the value of an investment, assuming reinvestment of the class' distributions from dividend income and capital gains (the profits earned upon the sale of securities that have grown in value, if any) and assuming a constant rate of performance each year. The $10,000 table and the fund's returns do not reflect the deduction of taxes that a shareholder would pay on fund distributions or the redemption of fund shares. During periods of reimbursement by Fidelity, a fund's total return will be greater than it would be had the reimbursement not occurred. How a fund did yesterday is no guarantee of how it will do tomorrow.
Average Annual Total Returns
Periods ended October 31, 2012 | Past 1
year | Past 5
years | Past 10
years |
Class A (incl. 5.75% sales charge) A, E | 2.45% | -7.07% | 8.24% |
Class T (incl. 3.50% sales charge) B, E | 4.62% | -6.90% | 8.23% |
Class B (incl. contingent deferred sales charge) C, E | 2.85% | -7.06% | 8.25% |
Class C (incl. contingent deferred sales charge) D , E | 6.86% | -6.69% | 8.21% |
A Class A shares bear a 0.25% 12b-1 fee. The initial offering of Class A shares took place on Janu-ary 6, 2005. Returns prior to January 6, 2005 are those of Fidelity® International Discovery Fund, the original class of the fund, which has no 12b-1 fee. Had Class A shares' 12b-1 fee been reflected, returns prior to January 6, 2005 would have been lower.
B Class T shares bear a 0.50% 12b-1 fee. The initial offering of Class T shares took place on Janu-ary 6, 2005. Returns prior to January 6, 2005 are those of Fidelity International Discovery Fund, the original class of the fund, which has no 12b-1 fee. Had Class T shares' 12b-1 fee been reflected, returns prior to January 6, 2005 would have been lower.
C Class B shares bear a 1.00% 12b-1 fee. The initial offering of Class B shares took place on Janu-ary 6, 2005. Returns prior to January 6, 2005 are those of Fidelity International Discovery Fund, the original class of the fund, which has no 12b-1 fee. Had Class B shares' 12b-1 fee been reflected, returns prior to January 6, 2005 would have been lower. Class B shares' contingent deferred sales charges included in the past one year, past five year, and past 10 year total return figures are 5%, 2%, and 0% respectively.
D Class C shares bear a 1.00% 12b-1 fee. The initial offering of Class C shares took place on Janu-ary 6, 2005. Returns prior to January 6, 2005 are those of Fidelity International Discovery Fund, the original class of the fund, which has no 12b-1 fee. Had Class C shares' 12b-1 fee been reflected, returns prior to January 6, 2005 would have been lower. Class C shares' contingent deferred sales charges included in the past one year, past five year, and past 10 year total return figures are 1%, 0%, and 0% respectively.
E Prior to October 1, 2004, the fund operated under certain different investment policies. The fund's historical performance may not represent its current investment policies.
Annual Report
$10,000 Over 10 Years
Let's say hypothetically that $10,000 was invested in Fidelity Advisor® International Discovery Fund - Class A on October 31, 2002 and the current 5.75% sales charge was paid. The chart shows how the value of your investment would have changed, and also shows how the MSCI® EAFE® Index performed over the same period. The initial offering of Class A took place on January 6, 2005. See the previous page for additional information regarding the performance of Class A.
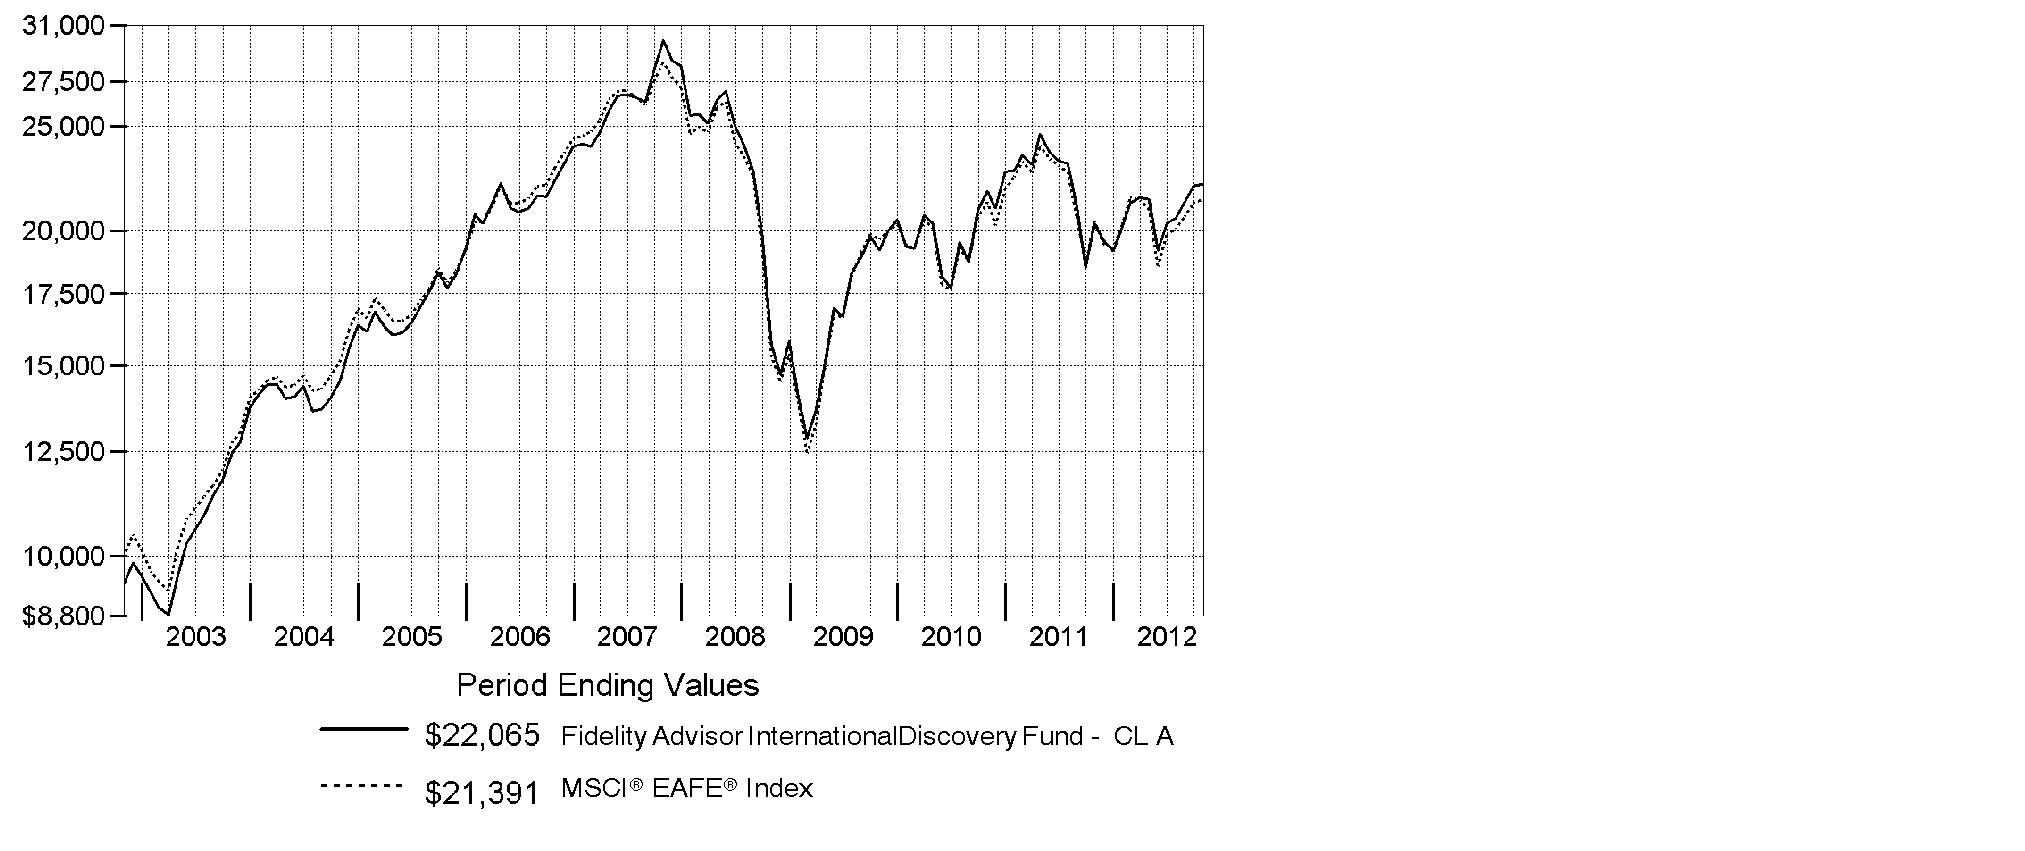
Annual Report
Market Recap: International stocks experienced pendulum-like swings during the 12 months ending October 31, 2012, finishing the period with a modest advance. The market faced periodic bouts of volatility this past year, as a number of macroeconomic concerns - including the eurozone debt crisis, the strength and pace of the U.S. economic recovery, and a slowdown in China's once-blistering growth - dominated headlines and weighed on investors. While a stronger U.S. dollar provided an additional head wind, foreign developed- and emerging-markets stocks still managed a gain for the 12 months, as the MSCI® ACWI® (All Country World Index) ex USA Index rose 4.11%, largely buttressed in the summertime by pledges of accommodative monetary action from eurozone officials, as well as signs that the U.S. housing market was on the mend. Within the index, Asia-Pacific ex Japan showed the most impressive gains, advancing roughly 11%. A number of core European components, most notably Germany (+11%), Switzerland (+10%) and the U.K. (+9%), benefited from optimism about the eurozone's ability to resolve its debt woes, which also helped the region outpace the index overall. Elsewhere, results from Canada (+3%) and the generally more volatile emerging markets (+2%) each fell short of the MSCI index, while Japan was among the few benchmark constituents to finish in the red, returning about -3%.
Comments from William Kennedy, Portfolio Manager of Fidelity Advisor® International Discovery Fund: For the year, the fund's Class A, Class T, Class B and Class C shares returned 8.70%, 8.41%, 7.85% and 7.86%, outpacing the 4.76% gain of the MSCI® EAFE® Index. Security selection drove relative performance, with particularly strong contributions from my choices within Europe ex U.K., Japan and emerging markets. Stock picks in consumer staples and information technology also helped. Top individual contributors included Netherlands-based digital security leader Gemalto, whose strong gain was fueled by the worldwide growth of mobile and cloud computing. Shares of Hong Kong's Techtronic Industries, whose products include Ryobi power tools and Hoover vacuums, moved sharply higher, due to resilience in the U.S., where it sells a lot of its goods. An investment in drugstore retailer Cosmos Pharmaceutical in Japan also helped, buoyed by expansion into new markets. By contrast, security selection in the U.K. detracted. The biggest individual disappointments were online retailers in Japan: Start Today and Rakuten. Both stocks declined as business slowed and competition increased. Techtronic, Cosmos and Start Today were not in the index, and Start Today was not held at period end.
The views expressed above reflect those of the portfolio manager(s) only through the end of the period as stated on the cover of this report and do not necessarily represent the views of Fidelity or any other person in the Fidelity organization. Any such views are subject to change at any time based upon market or other conditions and Fidelity disclaims any responsibility to update such views. These views may not be relied on as investment advice and, because investment decisions for a Fidelity fund are based on numerous factors, may not be relied on as an indication of trading intent on behalf of any Fidelity fund.
Annual Report
Shareholder Expense Example
As a shareholder of the Fund, you incur two types of costs: (1) transaction costs, including sales charges (loads) on purchase payments or redemption proceeds, redemption fees and (2) ongoing costs, including management fees, distribution and/or service (12b-1) fees and other Fund expenses. This Example is intended to help you understand your ongoing costs (in dollars) of investing in the Fund and to compare these costs with the ongoing costs of investing in other mutual funds.
The Example is based on an investment of $1,000 invested at the beginning of the period and held for the entire period (May 1, 2012 to October 31, 2012).
Actual Expenses
The first line of the accompanying table for each class of the Fund provides information about actual account values and actual expenses. You may use the information in this line, together with the amount you invested, to estimate the expenses that you paid over the period. Simply divide your account value by $1,000.00 (for example, an $8,600 account value divided by $1,000.00 = 8.6), then multiply the result by the number in the first line for a class of the Fund under the heading entitled "Expenses Paid During Period" to estimate the expenses you paid on your account during this period. A small balance maintenance fee of $12.00 that is charged once a year may apply for certain accounts with a value of less than $2,000. This fee is not included in the table below. If it was, the estimate of expenses you paid during the period would be higher, and your ending account value lower, by this amount. In addition, the Fund, as a shareholder in the underlying Fidelity Central Funds, will indirectly bear its pro-rata share of the fees and expenses incurred by the underlying Fidelity Central Funds. These fees and expenses are not included in the Fund's annualized expense ratio used to calculate the expense estimate in the table below.
Hypothetical Example for Comparison Purposes
The second line of the accompanying table for each class of the Fund provides information about hypothetical account values and hypothetical expenses based on a Class' actual expense ratio and an assumed rate of return of 5% per year before expenses, which is not the Class' actual return. The hypothetical account values and expenses may not be used to estimate the actual ending account balance or expenses you paid for the period. You may use this information to compare the ongoing costs of investing in the Fund and other funds. To do so, compare this 5% hypothetical example with the 5% hypothetical examples that appear in the shareholder reports of the other funds. A small balance maintenance fee of $12.00 that is charged once a year may apply for certain accounts with a value of less than $2,000. This fee is not included in the table below. If it was, the estimate of expenses you paid during the period would be higher, and your ending account value lower, by this amount. In addition, the Fund, as a shareholder in the underlying Fidelity Central Funds, will indirectly bear its pro-rata share of the fees and expenses incurred by the underlying Fidelity Central Funds. These fees and expenses are not included in the Fund's annualized expense ratio used to calculate the expense estimate in the table below.
Please note that the expenses shown in the table are meant to highlight your ongoing costs only and do not reflect any transaction costs. Therefore, the second line of the table is useful in comparing ongoing costs only, and will not help you determine the relative total costs of owning different funds. In addition, if these transactional costs were included, your costs would have been higher.
Annual Report
| Annualized
Expense Ratio | Beginning
Account Value
May 1, 2012 | Ending
Account Value
October 31, 2012 | Expenses Paid
During Period*
May 1, 2012
to October 31, 2012 |
Class A | 1.41% | | | |
Actual | | $ 1,000.00 | $ 1,033.30 | $ 7.21 |
HypotheticalA | | $ 1,000.00 | $ 1,018.05 | $ 7.15 |
Class T | 1.67% | | | |
Actual | | $ 1,000.00 | $ 1,031.90 | $ 8.53 |
HypotheticalA | | $ 1,000.00 | $ 1,016.74 | $ 8.47 |
Class B | 2.16% | | | |
Actual | | $ 1,000.00 | $ 1,029.30 | $ 11.02 |
HypotheticalA | | $ 1,000.00 | $ 1,014.28 | $ 10.94 |
Class C | 2.16% | | | |
Actual | | $ 1,000.00 | $ 1,029.60 | $ 11.02 |
HypotheticalA | | $ 1,000.00 | $ 1,014.28 | $ 10.94 |
International Discovery | 1.08% | | | |
Actual | | $ 1,000.00 | $ 1,035.00 | $ 5.52 |
HypotheticalA | | $ 1,000.00 | $ 1,019.71 | $ 5.48 |
Class K | .90% | | | |
Actual | | $ 1,000.00 | $ 1,035.70 | $ 4.61 |
HypotheticalA | | $ 1,000.00 | $ 1,020.61 | $ 4.57 |
Institutional Class | 1.07% | | | |
Actual | | $ 1,000.00 | $ 1,035.10 | $ 5.47 |
HypotheticalA | | $ 1,000.00 | $ 1,019.76 | $ 5.43 |
A 5% return per year before expenses
* Expenses are equal to each Class' annualized expense ratio, multiplied by the average account value over the period, multiplied by 184/366 (to reflect the one-half year period).
Annual Report
Investment Changes (Unaudited)
Geographic Diversification (% of fund's net assets) |
As of October 31, 2012 |
 | United Kingdom 21.2% | |
 | Japan 16.1% | |
 | France 8.5% | |
 | Germany 8.3% | |
 | United States of America 7.0% | |
 | Switzerland 5.3% | |
 | Netherlands 3.2% | |
 | Australia 3.0% | |
 | Italy 2.7% | |
| Other 24.7% | |

Percentages are based on country or territory of incorporation and are adjusted for the effect of futures contracts, if applicable. |
As of April 30, 2012 |
| United Kingdom 21.0% | |
| Japan 16.7% | |
| United States of America 6.7% | |
| France 6.2% | |
| Germany 5.4% | |
| Netherlands 4.7% | |
| Switzerland 4.5% | |
| Korea (South) 3.9% | |
| Australia 3.4% | |
| Other 27.5% | |

Percentages are based on country or territory of incorporation and are adjusted for the effect of futures contracts, if applicable. |
Asset Allocation |
| % of fund's
net assets | % of fund's net assets
6 months ago |
Stocks and Investment Companies | 96.7 | 97.5 |
Short-Term Investments and Net Other Assets (Liabilities) | 3.3 | 2.5 |
Top Ten Stocks as of October 31, 2012 |
| % of fund's
net assets | % of fund's net assets
6 months ago |
Royal Dutch Shell PLC Class B (United Kingdom) (United Kingdom, Oil, Gas & Consumable Fuels) | 2.6 | 2.7 |
ORIX Corp. (Japan, Diversified Financial Services) | 1.6 | 1.5 |
Anheuser-Busch InBev SA NV (Belgium, Beverages) | 1.6 | 1.3 |
Novo Nordisk A/S Series B (Denmark, Pharmaceuticals) | 1.6 | 1.4 |
BHP Billiton PLC (United Kingdom, Metals & Mining) | 1.5 | 1.3 |
Australia & New Zealand Banking Group Ltd. (Australia, Commercial Banks) | 1.5 | 1.3 |
Vodafone Group PLC (United Kingdom, Wireless Telecommunication Services) | 1.4 | 1.1 |
British American Tobacco PLC (United Kingdom) (United Kingdom, Tobacco) | 1.4 | 1.8 |
Diageo PLC (United Kingdom, Beverages) | 1.4 | 1.2 |
BNP Paribas SA (France, Commercial Banks) | 1.3 | 0.7 |
| 15.9 | |
Market Sectors as of October 31, 2012 |
| % of fund's
net assets | % of fund's net assets
6 months ago |
Financials | 23.0 | 18.9 |
Consumer Discretionary | 15.5 | 15.8 |
Industrials | 13.5 | 12.6 |
Information Technology | 10.4 | 12.7 |
Consumer Staples | 9.7 | 11.2 |
Health Care | 7.2 | 6.5 |
Materials | 6.4 | 7.5 |
Energy | 5.9 | 6.7 |
Telecommunication Services | 4.2 | 4.9 |
Utilities | 0.9 | 0.7 |
Annual Report
Investments October 31, 2012
Showing Percentage of Net Assets
Common Stocks - 95.5% |
| Shares | | Value (000s) |
Australia - 3.0% |
Australia & New Zealand Banking Group Ltd. | 4,818,449 | | $ 127,296 |
Commonwealth Bank of Australia | 1,009,530 | | 60,519 |
Ramsay Health Care Ltd. | 1,305,776 | | 32,206 |
Spark Infrastructure Group unit | 19,962,099 | | 35,020 |
TOTAL AUSTRALIA | | 255,041 |
Bailiwick of Jersey - 1.9% |
Experian PLC | 5,023,200 | | 86,736 |
Wolseley PLC | 1,576,864 | | 68,935 |
TOTAL BAILIWICK OF JERSEY | | 155,671 |
Belgium - 1.6% |
Anheuser-Busch InBev SA NV | 1,604,727 | | 134,205 |
Bermuda - 0.5% |
Cheung Kong Infrastructure Holdings Ltd. | 6,458,000 | | 37,831 |
Brazil - 1.2% |
Arezzo Industria e Comercio SA | 570,800 | | 10,188 |
Qualicorp SA (a) | 4,567,000 | | 46,861 |
Souza Cruz SA | 1,909,200 | | 24,910 |
Totvs SA | 1,077,500 | | 21,910 |
TOTAL BRAZIL | | 103,869 |
British Virgin Islands - 0.3% |
Gem Diamonds Ltd. (a) | 716,328 | | 1,951 |
Mail.ru Group Ltd. GDR (Reg. S) | 676,800 | | 22,571 |
TOTAL BRITISH VIRGIN ISLANDS | | 24,522 |
Canada - 0.5% |
Goldcorp, Inc. | 571,200 | | 25,822 |
InterOil Corp. (a)(d) | 204,400 | | 13,180 |
TOTAL CANADA | | 39,002 |
Cayman Islands - 0.4% |
Eurasia Drilling Co. Ltd. GDR (Reg. S) | 439,400 | | 15,203 |
Sands China Ltd. | 4,911,200 | | 18,472 |
TOTAL CAYMAN ISLANDS | | 33,675 |
Denmark - 1.9% |
Novo Nordisk A/S Series B | 819,389 | | 131,361 |
William Demant Holding A/S (a) | 337,100 | | 28,993 |
TOTAL DENMARK | | 160,354 |
Common Stocks - continued |
| Shares | | Value (000s) |
France - 8.5% |
Arkema SA | 341,370 | | $ 31,123 |
Atos Origin SA | 384,842 | | 25,843 |
AXA SA | 4,066,402 | | 64,645 |
BNP Paribas SA | 2,238,845 | | 112,622 |
Bureau Veritas SA | 535,700 | | 56,888 |
Credit Agricole SA (a) | 3,474,800 | | 26,158 |
Iliad SA | 339,150 | | 52,245 |
Lafarge SA (Bearer) | 458,700 | | 26,861 |
LVMH Moet Hennessy - Louis Vuitton SA | 428,223 | | 69,602 |
PPR SA | 398,700 | | 70,101 |
Sanofi SA | 953,011 | | 83,701 |
Schneider Electric SA | 1,208,000 | | 75,524 |
Technip SA | 192,300 | | 21,660 |
TOTAL FRANCE | | 716,973 |
Germany - 7.1% |
Aareal Bank AG (a) | 1,044,895 | | 22,414 |
Allianz AG | 385,690 | | 47,822 |
BASF AG | 979,717 | | 81,182 |
Bayerische Motoren Werke AG (BMW) | 959,142 | | 76,394 |
Brenntag AG | 288,900 | | 36,412 |
Fresenius Medical Care AG & Co. KGaA | 384,000 | | 26,981 |
Fresenius SE & Co. KGaA | 161,700 | | 18,444 |
GEA Group AG | 992,880 | | 31,002 |
Gerry Weber International AG (Bearer) | 320,600 | | 14,552 |
GSW Immobilien AG | 497,845 | | 20,484 |
HeidelbergCement Finance AG | 504,300 | | 26,728 |
MTU Aero Engines Holdings AG | 286,300 | | 24,039 |
SAP AG | 1,172,710 | | 85,518 |
Siemens AG | 442,361 | | 44,572 |
Wirecard AG | 1,592,900 | | 36,400 |
TOTAL GERMANY | | 592,944 |
Hong Kong - 1.9% |
AIA Group Ltd. | 15,454,400 | | 61,219 |
HKT Trust / HKT Ltd. unit | 23,518,000 | | 21,818 |
Techtronic Industries Co. Ltd. | 39,683,000 | | 75,576 |
TOTAL HONG KONG | | 158,613 |
India - 1.0% |
Apollo Hospitals Enterprise Ltd. | 442,506 | | 6,415 |
Common Stocks - continued |
| Shares | | Value (000s) |
India - continued |
Housing Development Finance Corp. Ltd. | 3,327,565 | | $ 47,147 |
Titan Industries Ltd. | 6,456,377 | | 31,115 |
TOTAL INDIA | | 84,677 |
Indonesia - 0.7% |
PT Media Nusantara Citra Tbk | 42,573,500 | | 12,522 |
PT Sarana Menara Nusantara Tbk (a) | 6,310,500 | | 12,811 |
PT Tower Bersama Infrastructure Tbk (a) | 55,223,500 | | 28,747 |
TOTAL INDONESIA | | 54,080 |
Ireland - 1.8% |
Accenture PLC Class A | 854,400 | | 57,595 |
James Hardie Industries NV CDI | 6,070,470 | | 58,162 |
Paddy Power PLC (Ireland) | 503,500 | | 37,160 |
TOTAL IRELAND | | 152,917 |
Israel - 0.4% |
Check Point Software Technologies Ltd. (a) | 743,300 | | 33,099 |
Italy - 2.7% |
ENI SpA | 2,799,900 | | 64,428 |
Fiat Industrial SpA | 3,323,832 | | 35,995 |
Prada SpA | 4,029,100 | | 32,856 |
Prysmian SpA | 1,518,800 | | 29,214 |
Saipem SpA | 1,502,203 | | 67,486 |
TOTAL ITALY | | 229,979 |
Japan - 16.1% |
ABC-Mart, Inc. | 1,177,300 | | 51,617 |
Aeon Credit Service Co. Ltd. | 2,050,800 | | 43,518 |
Aozora Bank Ltd. | 7,872,000 | | 22,187 |
Calbee, Inc. | 351,700 | | 32,293 |
Chiyoda Corp. | 2,780,000 | | 44,853 |
Cosmos Pharmaceutical Corp. | 419,800 | | 41,386 |
Credit Saison Co. Ltd. | 881,500 | | 19,357 |
Daito Trust Construction Co. Ltd. | 212,800 | | 21,485 |
Don Quijote Co. Ltd. | 1,818,400 | | 71,638 |
Fanuc Corp. | 290,400 | | 46,236 |
Fast Retailing Co. Ltd. | 210,800 | | 46,950 |
Hitachi Ltd. | 8,642,000 | | 45,792 |
Honda Motor Co. Ltd. | 1,472,400 | | 44,265 |
Japan Tobacco, Inc. | 2,815,200 | | 77,794 |
JS Group Corp. | 1,856,500 | | 41,046 |
Common Stocks - continued |
| Shares | | Value (000s) |
Japan - continued |
JSR Corp. | 2,283,400 | | $ 39,129 |
Kakaku.com, Inc. | 810,600 | | 27,771 |
Keyence Corp. | 304,060 | | 80,671 |
Mitsubishi Estate Co. Ltd. | 2,651,000 | | 52,436 |
Mitsubishi UFJ Financial Group, Inc. | 15,161,400 | | 68,590 |
Nintendo Co. Ltd. | 201,200 | | 25,909 |
ORIX Corp. | 1,321,050 | | 135,696 |
Park24 Co. Ltd. | 1,342,800 | | 23,078 |
Rakuten, Inc. | 7,986,500 | | 71,831 |
Seven Bank Ltd. | 12,837,900 | | 36,666 |
Ship Healthcare Holdings, Inc. | 534,800 | | 17,840 |
So-net M3, Inc. | 5,725 | | 11,001 |
Softbank Corp. | 775,300 | | 24,542 |
Suzuki Motor Corp. | 1,383,700 | | 31,338 |
Unicharm Corp. | 622,700 | | 33,697 |
USS Co. Ltd. | 196,050 | | 20,605 |
TOTAL JAPAN | | 1,351,217 |
Korea (South) - 2.5% |
Hyundai Motor Co. | 273,935 | | 56,404 |
Kia Motors Corp. | 285,255 | | 15,854 |
LG Household & Health Care Ltd. | 56,182 | | 33,029 |
NHN Corp. | 64,289 | | 14,888 |
Orion Corp. | 14,973 | | 14,062 |
Samsung Electronics Co. Ltd. | 64,872 | | 77,943 |
TOTAL KOREA (SOUTH) | | 212,180 |
Luxembourg - 0.6% |
Brait SA | 6,003,514 | | 23,611 |
Samsonite International SA | 12,773,700 | | 26,536 |
TOTAL LUXEMBOURG | | 50,147 |
Netherlands - 3.2% |
AEGON NV | 5,028,800 | | 28,124 |
ASML Holding NV | 1,002,900 | | 55,129 |
Gemalto NV | 609,781 | | 55,025 |
ING Groep NV (Certificaten Van Aandelen) (a) | 5,244,400 | | 46,665 |
LyondellBasell Industries NV Class A | 474,800 | | 25,350 |
Randstad Holding NV | 687,872 | | 22,455 |
Yandex NV (a) | 1,582,600 | | 36,843 |
TOTAL NETHERLANDS | | 269,591 |
Common Stocks - continued |
| Shares | | Value (000s) |
Norway - 1.1% |
DnB NOR ASA | 5,448,955 | | $ 68,049 |
Gjensidige Forsikring ASA | 1,761,200 | | 25,732 |
TOTAL NORWAY | | 93,781 |
Poland - 0.5% |
Eurocash SA | 3,593,990 | | 43,891 |
Qatar - 0.2% |
Commercial Bank of Qatar GDR (Reg. S) | 5,094,802 | | 20,122 |
Russia - 0.6% |
Mobile TeleSystems OJSC sponsored ADR | 2,888,700 | | 49,512 |
South Africa - 0.4% |
Shoprite Holdings Ltd. | 1,552,300 | | 31,921 |
Spain - 2.2% |
Amadeus IT Holding SA Class A | 1,011,100 | | 25,031 |
Banco Bilbao Vizcaya Argentaria SA | 6,088,557 | | 50,876 |
Grifols SA ADR | 1,151,000 | | 28,959 |
Inditex SA | 651,829 | | 83,169 |
TOTAL SPAIN | | 188,035 |
Sweden - 2.4% |
Atlas Copco AB (A Shares) | 2,847,300 | | 70,014 |
Intrum Justitia AB | 1,835,800 | | 26,570 |
Svenska Handelsbanken AB (A Shares) | 1,879,500 | | 64,379 |
Swedish Match Co. AB | 1,250,800 | | 42,618 |
TOTAL SWEDEN | | 203,581 |
Switzerland - 5.3% |
Adecco SA (Reg.) | 574,043 | | 27,762 |
Partners Group Holding AG | 230,056 | | 48,689 |
Roche Holding AG (participation certificate) | 394,417 | | 75,851 |
Schindler Holding AG (participation certificate) | 554,147 | | 73,010 |
SGS SA (Reg.) | 12,520 | | 26,511 |
Swatch Group AG (Bearer) | 36,702 | | 15,188 |
Syngenta AG (Switzerland) | 81,540 | | 31,792 |
UBS AG | 4,126,610 | | 61,914 |
Zurich Financial Services AG | 346,539 | | 85,398 |
TOTAL SWITZERLAND | | 446,115 |
Turkey - 0.1% |
Boyner Buyuk Magazacilik A/S (a)(e) | 4,683,100 | | 10,764 |
United Kingdom - 21.2% |
Aberdeen Asset Management PLC | 5,975,132 | | 31,289 |
Common Stocks - continued |
| Shares | | Value (000s) |
United Kingdom - continued |
Aggreko PLC | 1,385,300 | | $ 48,064 |
Anglo American PLC (United Kingdom) | 774,600 | | 23,788 |
Ashmore Group PLC | 3,169,400 | | 18,602 |
Barclays PLC | 12,279,312 | | 45,406 |
Bellway PLC | 972,300 | | 15,863 |
BG Group PLC | 4,571,872 | | 84,661 |
BHP Billiton PLC | 3,972,023 | | 127,308 |
British American Tobacco PLC (United Kingdom) | 2,438,600 | | 120,954 |
British Land Co. PLC | 5,756,734 | | 49,097 |
Diageo PLC | 4,065,857 | | 116,237 |
Domino's Pizza UK & IRL PLC | 2,378,100 | | 19,399 |
GlaxoSmithKline PLC | 2,658,600 | | 59,572 |
Hikma Pharmaceuticals PLC | 1,964,745 | | 23,447 |
HSBC Holdings PLC (United Kingdom) | 10,856,757 | | 107,040 |
Intertek Group PLC | 748,200 | | 34,037 |
Jazztel PLC (a) | 5,843,900 | | 38,706 |
Legal & General Group PLC | 36,980,100 | | 79,967 |
Lloyds Banking Group PLC (a) | 46,760,800 | | 30,792 |
London Stock Exchange Group PLC | 1,497,400 | | 23,572 |
Meggitt PLC | 6,792,200 | | 42,309 |
Next PLC | 514,144 | | 29,587 |
Ocado Group PLC (a)(d) | 14,388,400 | | 14,976 |
Persimmon PLC | 2,345,100 | | 30,086 |
Rolls-Royce Group PLC | 4,197,715 | | 57,884 |
Rolls-Royce Group PLC Class C | 319,026,340 | | 515 |
Rotork PLC | 717,800 | | 26,387 |
Royal Dutch Shell PLC Class B (United Kingdom) | 6,206,463 | | 219,543 |
SABMiller PLC | 1,096,800 | | 46,984 |
Standard Chartered PLC (United Kingdom) | 1,697,617 | | 40,093 |
Taylor Wimpey PLC | 21,518,200 | | 21,217 |
The Weir Group PLC | 747,600 | | 21,016 |
Ultra Electronics Holdings PLC | 614,667 | | 16,793 |
Vodafone Group PLC | 45,146,543 | | 122,602 |
TOTAL UNITED KINGDOM | | 1,787,793 |
United States of America - 3.7% |
Beam, Inc. | 387,400 | | 21,524 |
Citrix Systems, Inc. (a) | 303,600 | | 18,766 |
Cognizant Technology Solutions Corp. Class A (a) | 405,700 | | 27,040 |
Dollar General Corp. (a) | 378,800 | | 18,417 |
GNC Holdings, Inc. | 770,900 | | 29,811 |
MasterCard, Inc. Class A | 160,100 | | 73,795 |
Common Stocks - continued |
| Shares | | Value (000s) |
United States of America - continued |
Michael Kors Holdings Ltd. | 542,300 | | $ 29,658 |
Royal Gold, Inc. | 394,800 | | 34,774 |
Total System Services, Inc. | 1,094,700 | | 24,620 |
Watson Pharmaceuticals, Inc. (a) | 308,100 | | 26,481 |
Workday, Inc. | 102,600 | | 4,976 |
TOTAL UNITED STATES OF AMERICA | | 309,862 |
TOTAL COMMON STOCKS (Cost $7,245,196) |
8,035,964
|
Nonconvertible Preferred Stocks - 1.2% |
| | | |
Germany - 1.2% |
Volkswagen AG
(Cost $69,724) | 478,400 | |
98,964
|
Investment Companies - 0.0% |
| | | |
Cyprus - 0.0% |
Aisi Realty Public Ltd. (a)
(Cost $7,371) | 529,830 | |
628
|
Money Market Funds - 3.2% |
| | | |
Fidelity Cash Central Fund, 0.19% (b) | 250,136,921 | | 250,137 |
Fidelity Securities Lending Cash Central Fund, 0.19% (b)(c) | 24,238,785 | | 24,239 |
TOTAL MONEY MARKET FUNDS (Cost $274,376) |
274,376
|
TOTAL INVESTMENT PORTFOLIO - 99.9% (Cost $7,596,667) | | 8,409,932 |
NET OTHER ASSETS (LIABILITIES) - 0.1% | | 6,607 |
NET ASSETS - 100% | $ 8,416,539 |
Legend |
(a) Non-income producing |
(b) Affiliated fund that is available only to investment companies and other accounts managed by Fidelity Investments. The rate quoted is the annualized seven-day yield of the fund at period end. A complete unaudited listing of the fund's holdings as of its most recent quarter end is available upon request. In addition, each Fidelity Central Fund's financial statements, which are not covered by the Fund's Report of Independent Registered Public Accounting Firm, are available on the SEC's website or upon request. |
(c) Investment made with cash collateral received from securities on loan. |
(d) Security or a portion of the security is on loan at period end. |
(e) Affiliated company |
Affiliated Central Funds |
Information regarding fiscal year to date income earned by the Fund from investments in Fidelity Central Funds is as follows: |
Fund | Income earned
(Amounts in thousands) |
Fidelity Cash Central Fund | $ 136 |
Fidelity Securities Lending Cash Central Fund | 4,230 |
Total | $ 4,366 |
Other Affiliated Issuers |
An affiliated company is a company in which the Fund has ownership of at least 5% of the voting securities. Fiscal year to date transactions with companies which are or were affiliates are as follows: |
Affiliate
(Amounts in thousands) | Value, beginning of period | Purchases | Sales Proceeds | Dividend Income | Value,
end of
period |
Aisi Realty Public Ltd. | $ 240 | $ 469 | $ - | $ - | $ - |
Boyner Buyuk Magazacilik A/S | 10,096 | - | 1,569 | - | 10,764 |
China Kanghui Holdings sponsored ADR | 27,375 | - | 53,149 | - | - |
Total | $ 37,711 | $ 469 | $ 54,718 | $ - | $ 10,764 |
Other Information |
Categorizations in the Schedule of Investments are based on country or territory of incorporation. |
The following is a summary of the inputs used, as of October 31, 2012, involving the Fund's assets and liabilities carried at fair value. The inputs or methodology used for valuing securities may not be an indication of the risk associated with investing in those securities. For more information on valuation inputs, and their aggregation into the levels used in the table below, please refer to the Security Valuation section in the accompanying Notes to Financial Statements. |
Valuation Inputs at Reporting Date: |
Description
(Amounts in thousands) | Total | Level 1 | Level 2 | Level 3 |
Investments in Securities: | | | | |
Equities: | | | | |
Consumer Discretionary | $ 1,302,675 | $ 1,258,410 | $ 44,265 | $ - |
Consumer Staples | 815,505 | 444,109 | 371,396 | - |
Energy | 486,161 | 202,190 | 283,971 | - |
Financials | 1,939,678 | 1,500,271 | 439,407 | - |
Health Care | 618,113 | 316,498 | 301,615 | - |
Industrials | 1,137,857 | 1,093,285 | 44,572 | - |
Information Technology | 877,135 | 791,617 | 85,518 | - |
Materials | 533,970 | 374,870 | 159,100 | - |
Telecommunication Services | 350,983 | 228,381 | 122,602 | - |
Utilities | 72,851 | 72,851 | - | - |
Investment Companies | 628 | 628 | - | - |
Money Market Funds | 274,376 | 274,376 | - | - |
Total Investments in Securities: | $ 8,409,932 | $ 6,557,486 | $ 1,852,446 | $ - |
The following is a summary of transfers between Level 1 and Level 2 for the period ended October 31, 2012. Transfers are assumed to have occurred at the beginning of the period, and are primarily attributable to the valuation techniques used for foreign equity securities, as discussed in the accompanying Notes to Financial Statements: |
Transfers | Total (000s) |
Level 1 to Level 2 | $ 0 |
Level 2 to Level 1 | $ 1,546,324 |
See accompanying notes which are an integral part of the financial statements.
Annual Report
Statement of Assets and Liabilities
Amounts in thousands (except per-share amounts) | October 31, 2012 |
| | |
Assets | | |
Investment in securities, at value (including securities loaned of $22,961) - See accompanying schedule: Unaffiliated issuers (cost $7,310,529) | $ 8,124,792 | |
Fidelity Central Funds (cost $274,376) | 274,376 | |
Other affiliated issuers (cost $11,762) | 10,764 | |
Total Investments (cost $7,596,667) | | $ 8,409,932 |
Receivable for investments sold | | 58,219 |
Receivable for fund shares sold | | 9,069 |
Dividends receivable | | 15,860 |
Distributions receivable from Fidelity Central Funds | | 76 |
Other receivables | | 4,417 |
Total assets | | 8,497,573 |
| | |
Liabilities | | |
Payable for investments purchased | $ 8,942 | |
Payable for fund shares redeemed | 39,507 | |
Accrued management fee | 6,216 | |
Distribution and service plan fees payable | 113 | |
Other affiliated payables | 1,450 | |
Other payables and accrued expenses | 567 | |
Collateral on securities loaned, at value | 24,239 | |
Total liabilities | | 81,034 |
| | |
Net Assets | | $ 8,416,539 |
Net Assets consist of: | | |
Paid in capital | | $ 9,152,089 |
Undistributed net investment income | | 126,507 |
Accumulated undistributed net realized gain (loss) on investments and foreign currency transactions | | (1,674,222) |
Net unrealized appreciation (depreciation) on investments and assets and liabilities in foreign currencies | | 812,165 |
Net Assets | | $ 8,416,539 |
See accompanying notes which are an integral part of the financial statements.
Annual Report
Financial Statements - continued
Statement of Assets and Liabilities - continued
Amounts in thousands (except per-share amounts) | October 31, 2012 |
| | |
Calculation of Maximum Offering Price
Class A:
Net Asset Value and redemption price per share ($298,501 ÷ 9,429.0 shares) | | $ 31.66 |
| | |
Maximum offering price per share (100/94.25 of $31.66) | | $ 33.59 |
Class T:
Net Asset Value and redemption price per share ($45,884 ÷ 1,460.2 shares) | | $ 31.42 |
| | |
Maximum offering price per share (100/96.50 of $31.42) | | $ 32.56 |
Class B:
Net Asset Value and offering price per share ($7,536 ÷ 240.9 shares)A | | $ 31.28 |
| | |
Class C:
Net Asset Value and offering price per share ($29,746 ÷ 949.8 shares)A | | $ 31.32 |
| | |
International Discovery:
Net Asset Value, offering price and redemption price per share ($5,964,762 ÷ 186,908.1 shares) | | $ 31.91 |
| | |
Class K:
Net Asset Value, offering price and redemption price per share ($1,775,900 ÷ 55,719.4 shares) | | $ 31.87 |
| | |
Institutional Class:
Net Asset Value, offering price and redemption price per share ($294,210 ÷ 9,232.8 shares) | | $ 31.87 |
A Redemption price per share is equal to net asset value less any applicable contingent deferred sales charge.
See accompanying notes which are an integral part of the financial statements.
Annual Report
Statement of Operations
Amounts in thousands | Year ended October 31, 2012 |
| | |
Investment Income | | |
Dividends | | $ 229,743 |
Interest | | 19 |
Income from Fidelity Central Funds | | 4,366 |
Income before foreign taxes withheld | | 234,128 |
Less foreign taxes withheld | | (11,538) |
Total income | | 222,590 |
| | |
Expenses | | |
Management fee
Basic fee | $ 58,065 | |
Performance adjustment | 2,707 | |
Transfer agent fees | 16,195 | |
Distribution and service plan fees | 1,384 | |
Accounting and security lending fees | 1,720 | |
Custodian fees and expenses | 1,316 | |
Independent trustees' compensation | 54 | |
Registration fees | 181 | |
Audit | 114 | |
Legal | 42 | |
Interest | 5 | |
Miscellaneous | 95 | |
Total expenses before reductions | 81,878 | |
Expense reductions | (2,500) | 79,378 |
Net investment income (loss) | | 143,212 |
Realized and Unrealized Gain (Loss) Net realized gain (loss) on: | | |
Investment securities: | | |
Unaffiliated issuers | (217,363) | |
Other affiliated issuers | 11,560 | |
Foreign currency transactions | (1,776) | |
Total net realized gain (loss) | | (207,579) |
Change in net unrealized appreciation (depreciation) on: Investment securities (net of decrease in deferred foreign taxes of $1,062) | 763,571 | |
Assets and liabilities in foreign currencies | (1,430) | |
Total change in net unrealized appreciation (depreciation) | | 762,141 |
Net gain (loss) | | 554,562 |
Net increase (decrease) in net assets resulting from operations | | $ 697,774 |
See accompanying notes which are an integral part of the financial statements.
Annual Report
Financial Statements - continued
Statement of Changes in Net Assets
Amounts in thousands | Year ended
October 31,
2012 | Year ended
October 31,
2011 |
Increase (Decrease) in Net Assets | | |
Operations | | |
Net investment income (loss) | $ 143,212 | $ 161,608 |
Net realized gain (loss) | (207,579) | 501,938 |
Change in net unrealized appreciation (depreciation) | 762,141 | (1,247,522) |
Net increase (decrease) in net assets resulting
from operations | 697,774 | (583,976) |
Distributions to shareholders from net investment income | (118,968) | (149,936) |
Distributions to shareholders from net realized gain | - | (48,090) |
Total distributions | (118,968) | (198,026) |
Share transactions - net increase (decrease) | (915,362) | (537,341) |
Redemption fees | 128 | 160 |
Total increase (decrease) in net assets | (336,428) | (1,319,183) |
| | |
Net Assets | | |
Beginning of period | 8,752,967 | 10,072,150 |
End of period (including undistributed net investment income of $126,507 and undistributed net investment income of $102,433, respectively) | $ 8,416,539 | $ 8,752,967 |
See accompanying notes which are an integral part of the financial statements.
Annual Report
Financial Highlights - Class A
Years ended October 31, | 2012 | 2011 | 2010 | 2009 | 2008 |
Selected Per-Share Data | | | | | |
Net asset value, beginning of period | $ 29.43 | $ 32.07 | $ 28.57 | $ 23.68 | $ 47.34 |
Income from Investment Operations | | | | | |
Net investment income (loss) C | .41 | .42 | .31 | .31 | .46 |
Net realized and unrealized gain (loss) | 2.11 | (2.52) | 3.51 | 4.84 | (22.08) |
Total from investment operations | 2.52 | (2.10) | 3.82 | 5.15 | (21.62) |
Distributions from net investment income | (.29) | (.38) | (.28) | (.26) | (.37) |
Distributions from net realized gain | - | (.16) | (.04) | - | (1.67) |
Total distributions | (.29) | (.54) | (.32) | (.26) | (2.04) |
Redemption fees added to paid in capital C, G | - | - | - | - | - |
Net asset value, end of period | $ 31.66 | $ 29.43 | $ 32.07 | $ 28.57 | $ 23.68 |
Total Return A, B | 8.70% | (6.71)% | 13.43% | 22.14% | (47.65)% |
Ratios to Average Net Assets D, F | | | | | |
Expenses before reductions | 1.34% | 1.30% | 1.33% | 1.37% | 1.32% |
Expenses net of fee waivers, if any | 1.34% | 1.29% | 1.33% | 1.37% | 1.32% |
Expenses net of all reductions | 1.31% | 1.25% | 1.28% | 1.32% | 1.29% |
Net investment income (loss) | 1.41% | 1.31% | 1.06% | 1.28% | 1.27% |
Supplemental Data | | | | | |
Net assets, end of period (in millions) | $ 299 | $ 320 | $ 392 | $ 414 | $ 380 |
Portfolio turnover rate E | 68% | 75% | 82% | 98% | 79% |
A Total returns would have been lower if certain expenses had not been reduced during the applicable periods shown.
B Total returns do not include the effect of the sales charges.
C Calculated based on average shares outstanding during the period.
D Fees and expenses of any underlying Fidelity Central Funds are not included in the Fund's expense ratio. The Fund indirectly bears its proportionate share of the expenses of any underlying Fidelity Central Funds.
E Amount does not include the portfolio activity of any underlying Fidelity Central Funds.
F Expense ratios reflect operating expenses of the class. Expenses before reductions do not reflect amounts reimbursed by the investment adviser or reductions from brokerage service arrangements or reductions from other expense offset arrangements and do not represent the amount paid by the class during periods when reimbursements or reductions occur. Expenses net of fee waivers reflect expenses after reimbursement by the investment adviser but prior to reductions from brokerage service arrangements or other expense offset arrangements. Expenses net of all reductions represent the net expenses paid by the class.
G Amount represents less than $.01 per share.
See accompanying notes which are an integral part of the financial statements.
Annual Report
Financial Highlights - Class T
Years ended October 31, | 2012 | 2011 | 2010 | 2009 | 2008 |
Selected Per-Share Data | | | | | |
Net asset value, beginning of period | $ 29.18 | $ 31.81 | $ 28.35 | $ 23.49 | $ 47.06 |
Income from Investment Operations | | | | | |
Net investment income (loss) C | .34 | .34 | .23 | .24 | .33 |
Net realized and unrealized gain (loss) | 2.09 | (2.51) | 3.48 | 4.81 | (21.94) |
Total from investment operations | 2.43 | (2.17) | 3.71 | 5.05 | (21.61) |
Distributions from net investment income | (.19) | (.30) | (.21) | (.19) | (.29) |
Distributions from net realized gain | - | (.16) | (.04) | - | (1.67) |
Total distributions | (.19) | (.46) | (.25) | (.19) | (1.96) |
Redemption fees added to paid in capital C, G | - | - | - | - | - |
Net asset value, end of period | $ 31.42 | $ 29.18 | $ 31.81 | $ 28.35 | $ 23.49 |
Total Return A, B | 8.41% | (6.96)% | 13.14% | 21.79% | (47.84)% |
Ratios to Average Net Assets D, F | | | | | |
Expenses before reductions | 1.59% | 1.56% | 1.60% | 1.65% | 1.68% |
Expenses net of fee waivers, if any | 1.59% | 1.55% | 1.60% | 1.65% | 1.68% |
Expenses net of all reductions | 1.56% | 1.51% | 1.56% | 1.60% | 1.64% |
Net investment income (loss) | 1.16% | 1.05% | .79% | 1.00% | .91% |
Supplemental Data | | | | | |
Net assets, end of period (in millions) | $ 46 | $ 61 | $ 92 | $ 83 | $ 64 |
Portfolio turnover rate E | 68% | 75% | 82% | 98% | 79% |
A Total returns would have been lower if certain expenses had not been reduced during the applicable periods shown.
B Total returns do not include the effect of the sales charges.
C Calculated based on average shares outstanding during the period.
D Fees and expenses of any underlying Fidelity Central Funds are not included in the Fund's expense ratio. The Fund indirectly bears its proportionate share of the expenses of any underlying Fidelity Central Funds.
E Amount does not include the portfolio activity of any underlying Fidelity Central Funds.
F Expense ratios reflect operating expenses of the class. Expenses before reductions do not reflect amounts reimbursed by the investment adviser or reductions from brokerage service arrangements or reductions from other expense offset arrangements and do not represent the amount paid by the class during periods when reimbursements or reductions occur. Expenses net of fee waivers reflect expenses after reimbursement by the investment adviser but prior to reductions from brokerage service arrangements or other expense offset arrangements. Expenses net of all reductions represent the net expenses paid by the class.
G Amount represents less than $.01 per share.
See accompanying notes which are an integral part of the financial statements.
Annual Report
Financial Highlights - Class B
Years ended October 31, | 2012 | 2011 | 2010 | 2009 | 2008 |
Selected Per-Share Data | | | | | |
Net asset value, beginning of period | $ 29.02 | $ 31.60 | $ 28.18 | $ 23.25 | $ 46.70 |
Income from Investment Operations | | | | | |
Net investment income (loss) C | .19 | .17 | .08 | .12 | .15 |
Net realized and unrealized gain (loss) | 2.09 | (2.48) | 3.44 | 4.81 | (21.77) |
Total from investment operations | 2.28 | (2.31) | 3.52 | 4.93 | (21.62) |
Distributions from net investment income | (.02) | (.12) | (.06) | - | (.16) |
Distributions from net realized gain | - | (.16) | (.04) | - | (1.67) |
Total distributions | (.02) | (.27) H | (.10) | - | (1.83) |
Redemption fees added to paid in capital C, G | - | - | - | - | - |
Net asset value, end of period | $ 31.28 | $ 29.02 | $ 31.60 | $ 28.18 | $ 23.25 |
Total Return A, B | 7.85% | (7.39)% | 12.52% | 21.20% | (48.11)% |
Ratios to Average Net Assets D, F | | | | | |
Expenses before reductions | 2.09% | 2.06% | 2.12% | 2.16% | 2.19% |
Expenses net of fee waivers, if any | 2.09% | 2.06% | 2.12% | 2.16% | 2.19% |
Expenses net of all reductions | 2.06% | 2.02% | 2.08% | 2.11% | 2.15% |
Net investment income (loss) | .66% | .54% | .27% | .49% | .40% |
Supplemental Data | | | | | |
Net assets, end of period (in millions) | $ 8 | $ 10 | $ 14 | $ 16 | $ 15 |
Portfolio turnover rate E | 68% | 75% | 82% | 98% | 79% |
A Total returns would have been lower if certain expenses had not been reduced during the applicable periods shown.
B Total returns do not include the effect of the contingent deferred sales charge.
C Calculated based on average shares outstanding during the period.
D Fees and expenses of any underlying Fidelity Central Funds are not included in the Fund's expense ratio. The Fund indirectly bears its proportionate share of the expenses of any underlying Fidelity Central Funds.
E Amount does not include the portfolio activity of any underlying Fidelity Central Funds.
F Expense ratios reflect operating expenses of the class. Expenses before reductions do not reflect amounts reimbursed by the investment adviser or reductions from brokerage service arrangements or reductions from other expense offset arrangements and do not represent the amount paid by the class during periods when reimbursements or reductions occur. Expenses net of fee waivers reflect expenses after reimbursement by the investment adviser but prior to reductions from brokerage service arrangements or other expense offset arrangements. Expenses net of all reductions represent the net expenses paid by the class.
G Amount represents less than $.01 per share.
H Total distributions of $.27 per share is comprised of distributions from net investment income of $.115 and distributions from net realized gain of $.155 per share.
See accompanying notes which are an integral part of the financial statements.
Annual Report
Financial Highlights - Class C
Years ended October 31, | 2012 | 2011 | 2010 | 2009 | 2008 |
Selected Per-Share Data | | | | | |
Net asset value, beginning of period | $ 29.08 | $ 31.68 | $ 28.23 | $ 23.31 | $ 46.82 |
Income from Investment Operations | | | | | |
Net investment income (loss) C | .19 | .18 | .09 | .12 | .15 |
Net realized and unrealized gain (loss) | 2.09 | (2.49) | 3.45 | 4.82 | (21.82) |
Total from investment operations | 2.28 | (2.31) | 3.54 | 4.94 | (21.67) |
Distributions from net investment income | (.04) | (.14) | (.05) | (.02) | (.17) |
Distributions from net realized gain | - | (.16) | (.04) | - | (1.67) |
Total distributions | (.04) | (.29) H | (.09) | (.02) | (1.84) |
Redemption fees added to paid in capital C, G | - | - | - | - | - |
Net asset value, end of period | $ 31.32 | $ 29.08 | $ 31.68 | $ 28.23 | $ 23.31 |
Total Return A, B | 7.86% | (7.37)% | 12.54% | 21.22% | (48.10)% |
Ratios to Average Net Assets D, F | | | | | |
Expenses before reductions | 2.09% | 2.05% | 2.09% | 2.14% | 2.17% |
Expenses net of fee waivers, if any | 2.09% | 2.04% | 2.09% | 2.14% | 2.17% |
Expenses net of all reductions | 2.06% | 2.00% | 2.05% | 2.09% | 2.13% |
Net investment income (loss) | .66% | .56% | .30% | .51% | .42% |
Supplemental Data | | | | | |
Net assets, end of period (in millions) | $ 30 | $ 33 | $ 44 | $ 43 | $ 36 |
Portfolio turnover rate E | 68% | 75% | 82% | 98% | 79% |
A Total returns would have been lower if certain expenses had not been reduced during the applicable periods shown.
B Total returns do not include the effect of the contingent deferred sales charge.
C Calculated based on average shares outstanding during the period.
D Fees and expenses of any underlying Fidelity Central Funds are not included in the Fund's expense ratio. The Fund indirectly bears its proportionate share of the expenses of any underlying Fidelity Central Funds.
E Amount does not include the portfolio activity of any underlying Fidelity Central Funds.
F Expense ratios reflect operating expenses of the class. Expenses before reductions do not reflect amounts reimbursed by the investment adviser or reductions from brokerage service arrangements or reductions from other expense offset arrangements and do not represent the amount paid by the class during periods when reimbursements or reductions occur. Expenses net of fee waivers reflect expenses after reimbursement by the investment adviser but prior to reductions from brokerage service arrangements or other expense offset arrangements. Expenses net of all reductions represent the net expenses paid by the class.
G Amount represents less than $.01 per share.
H Total distributions of $.29 per share is comprised of distributions from net investment income of $.137 and distributions from net realized gain of $.155 per share.
See accompanying notes which are an integral part of the financial statements.
Annual Report
Financial Highlights - International Discovery
Years ended October 31, | 2012 | 2011 | 2010 | 2009 | 2008 |
Selected Per-Share Data | | | | | |
Net asset value, beginning of period | $ 29.69 | $ 32.34 | $ 28.79 | $ 23.88 | $ 47.68 |
Income from Investment Operations | | | | | |
Net investment income (loss) B | .51 | .53 | .40 | .37 | .57 |
Net realized and unrealized gain (loss) | 2.12 | (2.54) | 3.54 | 4.88 | (22.29) |
Total from investment operations | 2.63 | (2.01) | 3.94 | 5.25 | (21.72) |
Distributions from net investment income | (.41) | (.48) | (.35) | (.34) | (.41) |
Distributions from net realized gain | - | (.16) | (.04) | - | (1.67) |
Total distributions | (.41) | (.64) | (.39) | (.34) | (2.08) |
Redemption fees added to paid in capital B,F | - | - | - | - | - |
Net asset value, end of period | $ 31.91 | $ 29.69 | $ 32.34 | $ 28.79 | $ 23.88 |
Total Return A | 9.03% | (6.39)% | 13.76% | 22.47% | (47.55)% |
Ratios to Average Net Assets C, E | | | | | |
Expenses before reductions | 1.01% | .97% | 1.05% | 1.12% | 1.09% |
Expenses net of fee waivers, if any | 1.01% | .96% | 1.05% | 1.12% | 1.09% |
Expenses net of all reductions | .98% | .92% | 1.00% | 1.07% | 1.05% |
Net investment income (loss) | 1.73% | 1.64% | 1.35% | 1.53% | 1.51% |
Supplemental Data | | | | | |
Net assets, end of period (in millions) | $ 5,965 | $ 6,806 | $ 8,133 | $ 8,114 | $ 6,999 |
Portfolio turnover rate D | 68% | 75% | 82% | 98% | 79% |
A Total returns would have been lower if certain expenses had not been reduced during the applicable periods shown.
B Calculated based on average shares outstanding during the period.
C Fees and expenses of any underlying Fidelity Central Funds are not included in the Fund's expense ratio. The Fund indirectly bears its proportionate share of the expenses of any underlying Fidelity Central Funds.
D Amount does not include the portfolio activity of any underlying Fidelity Central Funds.
E Expense ratios reflect operating expenses of the class. Expenses before reductions do not reflect amounts reimbursed by the investment adviser or reductions from brokerage service arrangements or reductions from other expense offset arrangements and do not represent the amount paid by the class during periods when reimbursements or reductions occur. Expenses net of fee waivers reflect expenses after reimbursement by the investment adviser but prior to reductions from brokerage service arrangements or other expense offset arrangements. Expenses net of all reductions represent the net expenses paid by the class.
F Amount represents less than $.01 per share.
See accompanying notes which are an integral part of the financial statements.
Annual Report
Financial Highlights - Class K
Years ended October 31, | 2012 | 2011 | 2010 | 2009 | 2008 G |
Selected Per-Share Data | | | | | |
Net asset value, beginning of period | $ 29.66 | $ 32.32 | $ 28.78 | $ 23.90 | $ 40.32 |
Income from Investment Operations | | | | | |
Net investment income (loss) D | .57 | .58 | .46 | .44 | .10 |
Net realized and unrealized gain (loss) | 2.11 | (2.54) | 3.53 | 4.86 | (16.52) |
Total from investment operations | 2.68 | (1.96) | 3.99 | 5.30 | (16.42) |
Distributions from net investment income | (.47) | (.55) | (.41) | (.42) | - |
Distributions from net realized gain | - | (.16) | (.04) | - | - |
Total distributions | (.47) | (.70) J | (.45) | (.42) | - |
Redemption fees added to paid in capital D, I | - | - | - | - | - |
Net asset value, end of period | $ 31.87 | $ 29.66 | $ 32.32 | $ 28.78 | $ 23.90 |
Total Return B, C | 9.24% | (6.24)% | 13.96% | 22.80% | (40.72)% |
Ratios to Average Net Assets E, H | | | | | |
Expenses before reductions | .83% | .80% | .84% | .88% | .93% A |
Expenses net of fee waivers, if any | .83% | .79% | .84% | .88% | .93% A |
Expenses net of all reductions | .80% | .75% | .79% | .83% | .89% A |
Net investment income (loss) | 1.91% | 1.81% | 1.55% | 1.77% | .83% A |
Supplemental Data | | | | | |
Net assets, end of period (in millions) | $ 1,776 | $ 1,245 | $ 1,078 | $ 674 | $ 145 |
Portfolio turnover rate F | 68% | 75% | 82% | 98% | 79% |
A Annualized
B Total returns for periods of less than one year are not annualized.
C Total returns would have been lower if certain expenses had not been reduced during the applicable periods shown.
D Calculated based on average shares outstanding during the period.
E Fees and expenses of any underlying Fidelity Central Funds are not included in the Fund's expense ratio. The Fund indirectly bears its proportionate share of the expenses of any underlying Fidelity Central Funds.
F Amount does not include the portfolio activity of any underlying Fidelity Central Funds.
G For the period May 9, 2008 (commencement of sale of shares) to October 31, 2008.
H Expense ratios reflect operating expenses of the class. Expenses before reductions do not reflect amounts reimbursed by the investment adviser or reductions from brokerage service arrangements or reductions from other expense offset arrangements and do not represent the amount paid by the class during periods when reimbursements or reductions occur. Expense ratios before reductions for start-up periods may not be representative of longer-term operating periods. Expenses net of fee waivers reflect expenses after reimbursement by the investment adviser but prior to reductions from brokerage service arrangements or other expense offset arrangements. Expenses net of all reductions represent the net expenses paid by the class.
I Amount represents less than $.01 per share.
J Total distributions of $.70 per share is comprised of distributions from net investment income of $.548 and distributions from net realized gain of $.155 per share.
See accompanying notes which are an integral part of the financial statements.
Annual Report
Financial Highlights - Institutional Class
Years ended October 31, | 2012 | 2011 | 2010 | 2009 | 2008 |
Selected Per-Share Data | | | | | |
Net asset value, beginning of period | $ 29.65 | $ 32.31 | $ 28.77 | $ 23.91 | $ 47.73 |
Income from Investment Operations | | | | | |
Net investment income (loss) B | .52 | .54 | .41 | .39 | .53 |
Net realized and unrealized gain (loss) | 2.11 | (2.55) | 3.55 | 4.86 | (22.24) |
Total from investment operations | 2.63 | (2.01) | 3.96 | 5.25 | (21.71) |
Distributions from net investment income | (.41) | (.50) | (.38) | (.39) | (.44) |
Distributions from net realized gain | - | (.16) | (.04) | - | (1.67) |
Total distributions | (.41) | (.65) G | (.42) | (.39) | (2.11) |
Redemption fees added to paid in capital B, F | - | - | - | - | - |
Net asset value, end of period | $ 31.87 | $ 29.65 | $ 32.31 | $ 28.77 | $ 23.91 |
Total Return A | 9.07% | (6.39)% | 13.84% | 22.52% | (47.51)% |
Ratios to Average Net Assets C, E | | | | | |
Expenses before reductions | 1.00% | .95% | .99% | 1.05% | 1.05% |
Expenses net of fee waivers, if any | 1.00% | .94% | .99% | 1.05% | 1.05% |
Expenses net of all reductions | .97% | .90% | .95% | 1.00% | 1.01% |
Net investment income (loss) | 1.75% | 1.66% | 1.40% | 1.60% | 1.54% |
Supplemental Data | | | | | |
Net assets, end of period (in millions) | $ 294 | $ 278 | $ 319 | $ 267 | $ 159 |
Portfolio turnover rate D | 68% | 75% | 82% | 98% | 79% |
A Total returns would have been lower if certain expenses had not been reduced during the applicable periods shown.
B Calculated based on average shares outstanding during the period.
C Fees and expenses of any underlying Fidelity Central Funds are not included in the Fund's expense ratio. The Fund indirectly bears its proportionate share of the expenses of any underlying Fidelity Central Funds.
D Amount does not include the portfolio activity of any underlying Fidelity Central Funds.
E Expense ratios reflect operating expenses of the class. Expenses before reductions do not reflect amounts reimbursed by the investment adviser or reductions from brokerage service arrangements or reductions from other expense offset arrangements and do not represent the amount paid by the class during periods when reimbursements or reductions occur. Expenses net of fee waivers reflect expenses after reimbursement by the investment adviser but prior to reductions from brokerage service arrangements or other expense offset arrangements. Expenses net of all reductions represent the net expenses paid by the class.
F Amount represents less than $.01 per share.
G Total distributions of $.65 per share is comprised of distributions from net investment income of $.497 and distributions from net realized gain of $.155 per share.
See accompanying notes which are an integral part of the financial statements.
Annual Report
Notes to Financial Statements
For the period ended October 31, 2012
(Amounts in thousands except percentages)
1. Organization.
Fidelity International Discovery Fund (the Fund) is a fund of Fidelity Investment Trust (the Trust) and is authorized to issue an unlimited number of shares. The Trust is registered under the Investment Company Act of 1940, as amended (the 1940 Act), as an open-end management investment company organized as a Massachusetts business trust. The Fund offers Class A, Class T, Class C, International Discovery, Class K, and Institutional Class shares, each of which, along with Class B shares, has equal rights as to assets and voting privileges. Effective after the close of business on September 1, 2010, Class B shares were closed to new accounts and additional purchases, except for exchanges and reinvestments. Each class has exclusive voting rights with respect to matters that affect that class. Class B shares will automatically convert to Class A shares after a holding period of seven years from the initial date of purchase. Investment income, realized and unrealized capital gains and losses, the common expenses of the Fund, and certain fund-level expense reductions, if any, are allocated on a pro-rata basis to each class based on the relative net assets of each class to the total net assets of the Fund. Each class differs with respect to transfer agent and distribution and service plan fees incurred. Certain expense reductions may also differ by class.
2. Investments in Fidelity Central Funds.
The Fund invests in Fidelity Central Funds, which are open-end investment companies available only to other investment companies and accounts managed by Fidelity Management & Research Company (FMR) and its affiliates. The Fund's Schedule of Investments lists each of the Fidelity Central Funds held as of period end, if any, as an investment of the Fund, but does not include the underlying holdings of each Fidelity Central Fund. As an Investing Fund, the Fund indirectly bears its proportionate share of the expenses of the underlying Fidelity Central Funds.
The Money Market Central Funds seek preservation of capital and current income and are managed by Fidelity Investments Money Management, Inc. (FIMM), an affiliate of FMR.
A complete unaudited list of holdings for each Fidelity Central Fund is available upon request or at the Securities and Exchange Commission (the SEC) web site at www.sec.gov. In addition, the financial statements of the Fidelity Central Funds, which are not covered by the Fund's Report of Independent Registered Public Accounting Firm, are available on the SEC web site or upon request.
Annual Report
3. Significant Accounting Policies.
The financial statements have been prepared in conformity with accounting principles generally accepted in the United States of America (GAAP), which require management to make certain estimates and assumptions at the date of the financial statements. Actual results could differ from those estimates. Subsequent events, if any, through the date that the financial statements were issued have been evaluated in the preparation of the financial statements. The following summarizes the significant accounting policies of the Fund:
Security Valuation. Investments are valued as of 4:00 p.m. Eastern time on the last calendar day of the period. In accordance with valuation policies and procedures approved by the Board of Trustees (the Board), the Fund attempts to obtain prices from one or more third party pricing vendors or brokers to value its investments. When current market prices, quotations or rates are not readily available or reliable, securities will be fair valued in good faith by the FMR Fair Value Committee (the Committee), in accordance with procedures adopted by the Fund's Board. Factors used in determining fair value vary by security type and may include market or security specific events. The frequency with which these procedures are used cannot be predicted and they may be utilized to a significant extent. The Committee oversees the Fund's valuation policies and procedures and is responsible for approving and reporting to the Board all fair value determinations.
The Fund categorizes the inputs to valuation techniques used to value its investments into a disclosure hierarchy consisting of three levels as shown below:
Level 1 - quoted prices in active markets for identical investments
Level 2 - other significant observable inputs (including quoted prices for similar investments, interest rates, prepayment speeds, etc.)
Level 3 - unobservable inputs (including the Fund's own assumptions based on the best information available)
Valuation techniques used to value the Fund's investments by major category are as follows:
Equity securities, including restricted securities, for which market quotations are readily available, are valued at the last reported sale price or official closing price as reported by a third party pricing vendor on the primary market or exchange on which they are traded and are categorized as Level 1 in the hierarchy. In the event there were no sales during the day or closing prices are not available, securities are valued at the last quoted bid price or may be valued using the last available price and are generally categorized as Level 2 in the hierarchy. For foreign equity securities, when significant market or security specific events arise, comparisons to the valuation of American Depositary Receipts
Annual Report
Notes to Financial Statements - continued
(Amounts in thousands except percentages)
3. Significant Accounting Policies - continued
Security Valuation - continued
(ADRs), futures contracts, Exchange-Traded Funds (ETFs) and certain indexes as well as quoted prices for similar securities are used and are categorized as Level 2 in the hierarchy. Utilizing these techniques may result in transfers between Level 1 and Level 2.
Investments in open-end mutual funds, including the Fidelity Central Funds, are valued at their closing net asset value (NAV) each business day and are categorized as Level 1 in the hierarchy.
Changes in valuation techniques may result in transfers in or out of an assigned level within the disclosure hierarchy. The aggregate value of investments by input level, as of October 31, 2012, including information on transfers between Levels 1 and 2, is included at the end of the Fund's Schedule of Investments.
Foreign Currency Translation. The Fund may use foreign currency contracts to facilitate transactions in foreign-denominated securities. Gains and losses from these transactions may arise from changes in the value of the foreign currency or if the counterparties do not perform under the contracts' terms.
Foreign-denominated assets, including investment securities, and liabilities are translated into U.S. dollars at the exchange rates at period end. Purchases and sales of investment securities, income and dividends received and expenses denominated in foreign currencies are translated into U.S. dollars at the exchange rate in effect on the transaction date.
The effects of exchange rate fluctuations on investments are included with the net realized and unrealized gain (loss) on investment securities. Other foreign currency transactions resulting in realized and unrealized gain (loss) are disclosed separately.
Investment Transactions and Income. For financial reporting purposes, the Fund's investment holdings and NAV include trades executed through the end of the last business day of the period. The NAV per share for processing shareholder transactions is calculated as of the close of business of the New York Stock Exchange (NYSE), normally 4:00 p.m. Eastern time and includes trades executed through the end of the prior business day. Gains and losses on securities sold are determined on the basis of identified cost and may include proceeds received from litigation. Dividend income is recorded on the ex-dividend date, except for certain dividends from foreign securities where the ex-dividend date may have passed, which are recorded as soon as the Fund is informed of the ex-dividend date. Non-cash dividends included in dividend income, if any, are recorded at the fair market value of the securities received. Distributions received on securities that represent a return of capital or capital gain are recorded as a reduction of cost of investments and/or as a realized gain. The Fund estimates the components of
Annual Report
3. Significant Accounting Policies - continued
Investment Transactions and Income - continued
distributions received that may be considered return of capital distributions or capital gain distributions. Interest income and distributions from the Fidelity Central Funds are accrued as earned. Interest income includes coupon interest and amortization of premium and accretion of discount on debt securities. Investment income is recorded net of foreign taxes withheld where recovery of such taxes is uncertain.
Expenses. Expenses directly attributable to a fund are charged to that fund. Expenses attributable to more than one fund are allocated among the respective funds on the basis of relative net assets or other appropriate methods. Expense estimates are accrued in the period to which they relate and adjustments are made when actual amounts are known.
Deferred Trustee Compensation. Under a Deferred Compensation Plan (the Plan), independent Trustees may elect to defer receipt of a portion of their annual compensation. Deferred amounts are invested in a cross-section of Fidelity funds, are marked-to-market and remain in the Fund until distributed in accordance with the Plan. The investment of deferred amounts and the offsetting payable to the Trustees are included in the accompanying Statement of Assets and Liabilities.
Income Tax Information and Distributions to Shareholders. Each year, the Fund intends to qualify as a regulated investment company under Subchapter M of the Internal Revenue Code, including distributing substantially all of its taxable income and realized gains. As a result, no provision for income taxes is required. As of October 31, 2012, the Fund did not have any unrecognized tax benefits in the financial statements; nor is the Fund aware of any tax positions for which it is reasonably possible that the total amounts of unrecognized tax benefits will significantly change in the next twelve months. The Fund files a U.S. federal tax return, in addition to state and local tax returns as required. A fund's federal income tax returns are subject to examination by the Internal Revenue Service (IRS) for a period of three fiscal years after they are filed. State and local tax returns may be subject to examination for an additional fiscal year depending on the jurisdiction. Foreign taxes are provided for based on the Fund's understanding of the tax rules and rates that exist in the foreign markets in which it invests.
Distributions are declared and recorded on the ex-dividend date. Income dividends and capital gain distributions are declared separately for each class. Income and capital gain distributions are determined in accordance with income tax regulations, which may differ from GAAP.
Annual Report
Notes to Financial Statements - continued
(Amounts in thousands except percentages)
3. Significant Accounting Policies - continued
Income Tax Information and Distributions to Shareholders - continued
Capital accounts within the financial statements are adjusted for permanent book-tax differences. These adjustments have no impact on net assets or the results of operations. Temporary book-tax differences will reverse in a subsequent period.
Book-tax differences are primarily due to foreign currency transactions, certain foreign taxes, passive foreign investment companies (PFIC), deferred trustees compensation, capital loss carryforwards and losses deferred due to wash sales.
The federal tax cost of investment securities and unrealized appreciation (depreciation) as of period end were as follows:
Gross unrealized appreciation | $ 1,161,331 |
Gross unrealized depreciation | (475,922) |
Net unrealized appreciation (depreciation) on securities and other investments | $ 685,409 |
| |
Tax Cost | $ 7,724,523 |
The tax-based components of distributable earnings as of period end were as follows:
Undistributed ordinary income | $ 134,442 |
Capital loss carryforward | $ (1,554,149) |
Net unrealized appreciation (depreciation) | $ 684,309 |
Capital loss carryforwards are only available to offset future capital gains of the Fund to the extent provided by regulations and may be limited. Under the Regulated Investment Company Modernization Act of 2010 (the Act), the Fund is permitted to carry forward capital losses incurred in taxable years beginning after December 22, 2010 for an unlimited period and such capital losses are required to be used prior to any losses that expire. Capital loss carryforwards were as follows:
Fiscal year of expiration | |
2017 | $ (1,350,018) |
No expiration | |
Short-term | $ (204,131) |
Total capital loss carryforward | $ (1,554,149) |
The tax character of distributions paid was as follows:
| October 31, 2012 | | October 31, 2011 |
Ordinary Income | $ 118,968 | | $ 198,026 |
Annual Report
3. Significant Accounting Policies - continued
Short-Term Trading (Redemption) Fees. Shares held by investors in the Fund less than 30 days are subject to a redemption fee equal to 1.00% of the net asset value of shares redeemed. All redemption fees, which reduce the proceeds of the shareholder redemption, are retained by the Fund and accounted for as an addition to paid in capital.
New Accounting Pronouncement. In December 2011, the Financial Accounting Standards Board issued Accounting Standard Update No. 2011-11, Disclosures about Offsetting Assets and Liabilities. The update creates new disclosure requirements requiring entities to disclose both gross and net information for derivatives and other financial instruments that are either offset in the Statement of Assets and Liabilities or subject to an enforceable master netting arrangement or similar agreement. The disclosure requirements are effective for annual reporting periods beginning on or after January 1, 2013, and interim periods within those annual periods. Management is currently evaluating the impact of the update's adoption on the Fund's financial statement disclosures.
4. Purchases and Sales of Investments.
Purchases and sales of securities, other than short-term securities, aggregated $5,561,781 and $6,703,146, respectively.
5. Fees and Other Transactions with Affiliates.
Management Fee. FMR and its affiliates provide the Fund with investment management related services for which the Fund pays a monthly management fee. The management fee is the sum of an individual fund fee rate that is based on an annual rate of .45% of the Fund's average net assets and an annualized group fee rate that averaged .26% during the period. The group fee rate is based upon the average net assets of all the mutual funds advised by FMR. The group fee rate decreases as assets under management increase and increases as assets under management decrease. In addition, the management fee is subject to a performance adjustment (up to a maximum of ± .20% of the Fund's average net assets over a 36 month performance period). The upward or downward adjustment to the management fee is based on the relative investment performance of International Discovery as compared to an appropriate benchmark index. For the period, the total annual management fee rate, including the performance adjustment, was .74% of the Fund's average net assets.
Distribution and Service Plan Fees. In accordance with Rule 12b-1 of the 1940 Act, the Fund has adopted separate Distribution and Service Plans for each class of shares. Certain classes pay Fidelity Distributors Corporation (FDC), an affiliate of FMR, separate Distribution and Service Fees, each of which is based on an annual percentage of
Annual Report
Notes to Financial Statements - continued
(Amounts in thousands except percentages)
5. Fees and Other Transactions with Affiliates - continued
Distribution and Service Plan Fees - continued
each class' average net assets. In addition, FDC may pay financial intermediaries for selling shares of the Fund and providing shareholder support services. For the period, the Distribution and Service Fee rates, total fees and amounts retained by FDC were as follows:
| Distribution
Fee | Service
Fee | Total Fees | Retained
by FDC |
Class A | -% | .25% | $ 733 | $ 11 |
Class T | .25% | .25% | 262 | 1 |
Class B | .75% | .25% | 86 | 64 |
Class C | .75% | .25% | 303 | 21 |
| | | $ 1,384 | $ 97 |
Sales Load. FDC may receive a front-end sales charge of up to 5.75% for selling Class A shares and 3.50% for selling Class T shares, some of which is paid to financial intermediaries for selling shares of the Fund. Depending on the holding period, FDC may receive contingent deferred sales charges levied on Class A, Class T, Class B, and Class C redemptions. The deferred sales charges range from 5.00% to 1.00% for Class B shares, 1.00% for Class C shares, 1.00% for certain purchases of Class A shares and .25% for certain purchases of Class T shares.
For the period, sales charge amounts retained by FDC were as follows:
| Retained
by FDC |
Class A | $ 45 |
Class T | 6 |
Class B* | 18 |
Class C* | 1 |
| $ 70 |
* When Class B and Class C shares are initially sold, FDC pays commissions from its own resources to financial intermediaries through which the sales are made.
Annual Report
5. Fees and Other Transactions with Affiliates - continued
Transfer Agent Fees. Fidelity Investments Institutional Operations Company, Inc. (FIIOC), an affiliate of FMR, is the transfer, dividend disbursing and shareholder servicing agent for each class of the Fund. FIIOC receives account fees and asset-based fees that vary according to the account size and type of account of the shareholders of the respective classes of the Fund, except for Class K. FIIOC receives an asset-based fee of Class K's average net assets. FIIOC receives no fees for providing transfer agency services to Class F. FIIOC pays for typesetting, printing and mailing of shareholder reports, except proxy statements. For the period, transfer agent fees for each class were as follows:
| Amount | % of
Average
Net Assets |
Class A | $ 891 | .30 |
Class T | 159 | .30 |
Class B | 26 | .30 |
Class C | 91 | .30 |
International Discovery | 13,666 | .23 |
Class K | 764 | .05 |
Institutional Class | 598 | .21 |
| $ 16,195 | |
Accounting and Security Lending Fees. Fidelity Service Company, Inc. (FSC), an affiliate of FMR, maintains the Fund's accounting records. The accounting fee is based on the level of average net assets for each month. Under a separate contract, FSC administers the security lending program. The security lending fee is based on the number and duration of lending transactions.
Brokerage Commissions. The Fund placed a portion of its portfolio transactions with brokerage firms which are affiliates of the investment adviser. The commissions paid to these affiliated firms were $13 for the period.
Interfund Lending Program. Pursuant to an Exemptive Order issued by the SEC, the Fund, along with other registered investment companies having management contracts with FMR, may participate in an interfund lending program. This program provides an alternative credit facility allowing the funds to borrow from, or lend money to, other participating affiliated funds. At period end, there were no interfund loans outstanding. The Fund's activity in this program during the period for which loans were outstanding was as follows:
Borrower or Lender | Average Loan
Balance | Weighted Average Interest Rate | Interest Expense |
Borrower | $ 17,873 | .34% | $ 5 |
Annual Report
Notes to Financial Statements - continued
(Amounts in thousands except percentages)
6. Committed Line of Credit.
The Fund participates with other funds managed by FMR or an affiliate in a $4.25 billion credit facility (the "line of credit") to be utilized for temporary or emergency purposes to fund shareholder redemptions or for other short-term liquidity purposes. The Fund has agreed to pay commitment fees on its pro-rata portion of the line of credit, which amounted to $23 and is reflected in Miscellaneous expenses on the Statement of Operations. During the period, there were no borrowings on this line of credit.
7. Security Lending.
The Fund lends portfolio securities through a lending agent from time to time in order to earn additional income. For equity securities, a lending agent is used and may loan securities to certain qualified borrowers, including Fidelity Capital Markets (FCM), a broker-dealer affiliated with the Fund. On the settlement date of the loan, the Fund receives collateral (in the form of U.S. Treasury obligations, letters of credit and/or cash) against the loaned securities and maintains collateral in an amount not less than 100% of the market value of the loaned securities during the period of the loan. The market value of the loaned securities is determined at the close of business of the Fund and any additional required collateral is delivered to the Fund on the next business day. If the borrower defaults on its obligation to return the securities loaned because of insolvency or other reasons, a fund could experience delays and costs in recovering the securities loaned or in gaining access to the collateral. Any cash collateral received is invested in the Fidelity Securities Lending Cash Central Fund. The value of loaned securities and cash collateral at period end are disclosed on the Fund's Statement of Assets and Liabilities. At period end, there were no security loans outstanding with FCM. Security lending income represents the income earned on investing cash collateral, less rebates paid to borrowers and any lending agent fees associated with the loan, plus any premium payments received for lending certain types of securities. Security lending income is presented in the Statement of Operations as a component of income from Fidelity Central Funds. Total security lending income during the period amounted to $4,230, including $18 from securities loaned to FCM.
8. Expense Reductions.
Many of the brokers with whom FMR places trades on behalf of the Fund provided services to the Fund in addition to trade execution. These services included payments of certain expenses on behalf of the Fund totaling $2,500 for the period.
Annual Report
9. Distributions to Shareholders.
Distributions to shareholders of each class were as follows:
Years ended October 31, | 2012 | 2011 |
From net investment income | | |
Class A | $ 3,123 | $ 4,617 |
Class T | 388 | 859 |
Class B | 6 | 51 |
Class C | 44 | 184 |
International Discovery | 90,633 | 121,061 |
Class K | 20,917 | 18,291 |
Institutional Class | 3,857 | 4,873 |
Total | $ 118,968 | $ 149,936 |
From net realized gain | | |
Class A | $ - | $ 1,880 |
Class T | - | 439 |
Class B | - | 69 |
Class C | - | 209 |
International Discovery | - | 38,831 |
Class K | - | 5,143 |
Institutional Class | - | 1,519 |
Total | $ - | $ 48,090 |
10. Share Transactions.
Transactions for each class of shares were as follows:
| Shares | Dollars |
Years ended October 31, | 2012 | 2011 | 2012 | 2011 |
Class A | | | | |
Shares sold | 1,927 | 2,821 | $ 56,732 | $ 91,649 |
Reinvestment of distributions | 101 | 173 | 2,828 | 5,606 |
Shares redeemed | (3,468) | (4,335) | (100,935) | (139,721) |
Net increase (decrease) | (1,440) | (1,341) | $ (41,375) | $ (42,466) |
Class T | | | | |
Shares sold | 220 | 443 | $ 6,409 | $ 14,328 |
Reinvestment of distributions | 13 | 38 | 369 | 1,235 |
Shares redeemed | (860) | (1,286) | (25,207) | (41,028) |
Net increase (decrease) | (627) | (805) | $ (18,429) | $ (25,465) |
Class B | | | | |
Shares sold | 3 | 21 | $ 87 | $ 671 |
Reinvestment of distributions | - | 3 | 5 | 111 |
Shares redeemed | (113) | (130) | (3,297) | (4,124) |
Net increase (decrease) | (110) | (106) | $ (3,205) | $ (3,342) |
Annual Report
Notes to Financial Statements - continued
(Amounts in thousands except percentages)
10. Share Transactions - continued
| Shares | Dollars |
Years ended October 31, | 2012 | 2011 | 2012 | 2011 |
Class C | | | | |
Shares sold | 212 | 183 | $ 6,111 | $ 5,847 |
Reinvestment of distributions | 1 | 11 | 39 | 344 |
Shares redeemed | (395) | (437) | (11,440) | (13,875) |
Net increase (decrease) | (182) | (243) | $ (5,290) | $ (7,684) |
International Discovery | | | | |
Shares sold | 20,324 | 32,543 | $ 608,478 | $ 1,052,266 |
Reinvestment of distributions | 3,081 | 4,718 | 86,858 | 153,551 |
Shares redeemed | (65,748) | (59,489) | (1,937,202) | (1,934,353) |
Net increase (decrease) | (42,343) | (22,228) | $ (1,241,866) | $ (728,536) |
Class K | | | | |
Shares sold | 26,836 | 18,148 | $ 788,860 | $ 593,408 |
Reinvestment of distributions | 744 | 722 | 20,917 | 23,434 |
Shares redeemed | (13,817) | (10,275) | (410,022) | (330,258) |
Net increase (decrease) | 13,763 | 8,595 | $ 399,755 | $ 286,584 |
Institutional Class | | | | |
Shares sold | 2,049 | 2,364 | $ 59,460 | $ 75,348 |
Reinvestment of distributions | 53 | 69 | 1,502 | 2,254 |
Shares redeemed | (2,256) | (2,923) | (65,914) | (94,034) |
Net increase (decrease) | (154) | (490) | $ (4,952) | $ (16,432) |
11. Other.
The Fund's organizational documents provide former and current trustees and officers with a limited indemnification against liabilities arising in connection with the performance of their duties to the Fund. In the normal course of business, the Fund may also enter into contracts that provide general indemnifications. The Fund's maximum exposure under these arrangements is unknown as this would be dependent on future claims that may be made against the Fund. The risk of material loss from such claims is considered remote.
Annual Report
To the Trustees of Fidelity Investment Trust and the Shareholders of Fidelity International Discovery Fund:
In our opinion, the accompanying statement of assets and liabilities, including the schedule of investments, and the related statements of operations and of changes in net assets and the financial highlights present fairly, in all material respects, the financial position of Fidelity International Discovery Fund (a fund of Fidelity Investment Trust) at October 31, 2012, the results of its operations for the year then ended, the changes in its net assets for each of the two years in the period then ended and the financial highlights for each of the periods indicated, in conformity with accounting principles generally accepted in the United States of America. These financial statements and financial highlights (hereafter referred to as "financial statements") are the responsibility of the Fidelity International Discovery Fund's management. Our responsibility is to express an opinion on these financial statements based on our audits. We conducted our audits of these financial statements in accordance with the standards of the Public Company Accounting Oversight Board (United States). Those standards require that we plan and perform the audit to obtain reasonable assurance about whether the financial statements are free of material misstatement. An audit includes examining, on a test basis, evidence supporting the amounts and disclosures in the financial statements, assessing the accounting principles used and significant estimates made by management, and evaluating the overall financial statement presentation. We believe that our audits, which included confirmation of securities at October 31, 2012 by correspondence with the custodian and brokers, provide a reasonable basis for our opinion.
PricewaterhouseCoopers LLP
Boston, Massachusetts
December 14, 2012
Annual Report
The Trustees, Members of the Advisory Board, and executive officers of the trust and fund, as applicable, are listed below. The Board of Trustees governs the fund and is responsible for protecting the interests of shareholders. The Trustees are experienced executives who meet periodically throughout the year to oversee the fund's activities, review contractual arrangements with companies that provide services to the fund, oversee management of the risks associated with such activities and contractual arrangements, and review the fund's performance. Except for James C. Curvey, each of the Trustees oversees 236 funds advised by FMR or an affiliate. Mr. Curvey oversees 443 funds advised by FMR or an affiliate.
The Trustees hold office without limit in time except that (a) any Trustee may resign; (b) any Trustee may be removed by written instrument, signed by at least two-thirds of the number of Trustees prior to such removal; (c) any Trustee who requests to be retired or who has become incapacitated by illness or injury may be retired by written instrument signed by a majority of the other Trustees; and (d) any Trustee may be removed at any special meeting of shareholders by a two-thirds vote of the outstanding voting securities of the trust. Each Trustee who is not an interested person (as defined in the 1940 Act) (Independent Trustee), shall retire not later than the last day of the calendar year in which his or her 75th birthday occurs. The Independent Trustees may waive this mandatory retirement age policy with respect to individual Trustees. The executive officers and Advisory Board Members hold office without limit in time, except that any officer and Advisory Board Member may resign or may be removed by a vote of a majority of the Trustees at any regular meeting or any special meeting of the Trustees. Except as indicated, each individual has held the office shown or other offices in the same company for the past five years.
Experience, Skills, Attributes, and Qualifications of the Fund's Trustees. The Governance and Nominating Committee has adopted a statement of policy that describes the experience, qualifications, attributes, and skills that are necessary and desirable for potential Independent Trustee candidates (Statement of Policy). The Board believes that each Trustee satisfied at the time he or she was initially elected or appointed a Trustee, and continues to satisfy, the standards contemplated by the Statement of Policy. The Governance and Nominating Committee also engages professional search firms to help identify potential Independent Trustee candidates who have the experience, qualifications, attributes, and skills consistent with the Statement of Policy. From time to time, additional criteria based on the composition and skills of the current Independent Trustees, as well as experience or skills that may be appropriate in light of future changes to board composition, business conditions, and regulatory or other developments, have also been considered by the professional search firms and the Governance and Nominating Committee. In addition, the Board takes into account the Trustees' commitment and participation in Board and committee meetings, as well as their leadership of standing and ad hoc committees throughout their tenure.
In determining that a particular Trustee was and continues to be qualified to serve as a Trustee, the Board has considered a variety of criteria, none of which, in isolation, was controlling. The Board believes that, collectively, the Trustees have balanced and diverse experience, qualifications, attributes, and skills, which allow the Board to operate effectively in governing the fund and protecting the interests of shareholders. Information about the specific experience, skills, attributes, and qualifications of each Trustee, which in each case led to the Board's conclusion that the Trustee should serve (or continue to serve) as a trustee of the fund, is provided below.
Annual Report
Trustees and Officers - continued
Board Structure and Oversight Function. James C. Curvey is an interested person (as defined in the 1940 Act) and currently serves as Chairman. The Trustees have determined that an interested Chairman is appropriate and benefits shareholders because an interested Chairman has a personal and professional stake in the quality and continuity of services provided to the fund. Independent Trustees exercise their informed business judgment to appoint an individual of their choosing to serve as Chairman, regardless of whether the Trustee happens to be independent or a member of management. The Independent Trustees have determined that they can act independently and effectively without having an Independent Trustee serve as Chairman and that a key structural component for assuring that they are in a position to do so is for the Independent Trustees to constitute a substantial majority for the Board. The Independent Trustees also regularly meet in executive session. Ned C. Lautenbach serves as Chairman of the Independent Trustees and as such (i) acts as a liaison between the Independent Trustees and management with respect to matters important to the Independent Trustees and (ii) with management prepares agendas for Board meetings.
Fidelity funds are overseen by different Boards of Trustees. The fund's Board oversees Fidelity's equity and high income funds and another Board oversees Fidelity's investment-grade bond, money market, and asset allocation funds. The asset allocation funds may invest in Fidelity funds overseen by the fund's Board. The use of separate Boards, each with its own committee structure, allows the Trustees of each group of Fidelity funds to focus on the unique issues of the funds they oversee, including common research, investment, and operational issues. On occasion, the separate Boards establish joint committees to address issues of overlapping consequences for the Fidelity funds overseen by each Board.
The Trustees operate using a system of committees to facilitate the timely and efficient consideration of all matters of importance to the Trustees, the fund, and fund shareholders and to facilitate compliance with legal and regulatory requirements and oversight of the fund's activities and associated risks. The Board, acting through its committees, has charged FMR and its affiliates with (i) identifying events or circumstances the occurrence of which could have demonstrably adverse effects on the fund's business and/or reputation; (ii) implementing processes and controls to lessen the possibility that such events or circumstances occur or to mitigate the effects of such events or circumstances if they do occur; and (iii) creating and maintaining a system designed to evaluate continuously business and market conditions in order to facilitate the identification and implementation processes described in (i) and (ii) above. Because the day-to-day operations and activities of the fund are carried out by or through FMR, its affiliates and other service providers, the fund's exposure to risks is mitigated but not eliminated by the processes overseen by the Trustees. While each of the Board's committees has responsibility for overseeing different aspects of the fund's activities, oversight is exercised primarily through the Operations, Audit, and Compliance Committees. In addition, the Independent Trustees have worked with FMR to enhance the Board's oversight of investment and financial risks, legal and regulatory risks, technology risks, and operational risks, including the development of additional risk reporting to the Board. For example, a working group comprised of Independent Trustees and FMR has worked and continues to work to review the Fidelity funds' valuation-related activities, reporting and risk management. Appropriate personnel, including but not limited to the fund's Chief Compliance Officer (CCO), FMR's internal auditor, the independent accountants, the fund's Treasurer and portfolio management personnel, make periodic reports to the Board's committees, as appropriate, including an annual review of FMR's risk management program for the Fidelity funds. The responsibilities of each standing committee, including their oversight responsibilities, are described further under "Standing Committees of the Fund's Trustees."
Annual Report
The fund's Statement of Additional Information (SAI) includes more information about the Trustees. To request a free copy, call Fidelity at 1-800-208-0098.
Interested Trustees*:
Correspondence intended for each Trustee who is an interested person may be sent to Fidelity Investments, 82 Devonshire Street, Boston, Massachusetts 02109.
Name, Age; Principal Occupations and Other Relevant Experience+ |
James C. Curvey (77) |
| Year of Election or Appointment: 2007 Mr. Curvey is Trustee and Chairman of the Board of Trustees of certain Trusts. Mr. Curvey also serves as Trustee (2007-present) of other investment companies advised by FMR. Mr. Curvey is a Director of Fidelity Investments Money Management, Inc. (2009-present), Director of Fidelity Research & Analysis Co. (2009-present) and Director of FMR and FMR Co., Inc. (2007-present). Mr. Curvey is also Vice Chairman (2007-present) and Director of FMR LLC. In addition, Mr. Curvey serves as an Overseer for the Boston Symphony Orchestra and a member of the Trustees of Villanova University. Previously, Mr. Curvey was the Vice Chairman (2006-2007) and Director (2000-2007) of FMR Corp. |
Ronald P. O'Hanley (55) |
| Year of Election or Appointment: 2011 Mr. O'Hanley is Director of FMR Co., Inc. (2010-present), Director of Fidelity Investments Money Management, Inc. (2010-present), Director of Fidelity Research & Analysis Company (2010-present), President of Fidelity Asset Management and Corporate Services and a member of Fidelity's Executive Committee (2010-present). Previously, Mr. O'Hanley served as President and Chief Executive Officer of BNY Mellon Asset Management (2007-2010). Mr. O'Hanley also served as Vice Chairman of Bank New York Mellon Corp. and a member of that firm's Executive Committee. Prior to the 2007 merger of The Bank of New York and Mellon Financial Corporation, he was Vice Chairman of Mellon Financial Corporation and President and Chief Executive Officer of Mellon Asset Management. He joined Mellon in February 1997. Mr. O'Hanley currently serves as Chairman of the Boston Public Library Foundation Board of Directors and sits on the Board of Directors of Beth Israel Deaconess Medical Center, the Board of Trustees of the Marine Biological Laboratory and the Advisory Board of the Maxwell School of Citizenship and Public Administration at Syracuse University. Mr. O'Hanley also chairs the Council on Asset Management for the Financial Services Roundtable and is a member of the Board of Directors of Institutional Investor's U.S. Institute. |
* Trustees have been determined to be "Interested Trustees" by virtue of, among other things, their affiliation with the trust or various entities under common control with FMR.
+ The information above includes each Trustee's principal occupation during the last five years and other information relating to the experience, attributes, and skills relevant to each Trustee's qualifications to serve as a Trustee, which led to the conclusion that each Trustee should serve as a Trustee for the fund.
Annual Report
Independent Trustees:
Correspondence intended for each Independent Trustee (that is, the Trustees other than the Interested Trustees) may be sent to Fidelity Investments, P.O. Box 55235, Boston, Massachusetts 02205-5235.
Name, Age; Principal Occupations and Other Relevant Experience+ |
Dennis J. Dirks (64) |
| Year of Election or Appointment: 2005 Prior to his retirement in May 2003, Mr. Dirks was Chief Operating Officer and a member of the Board of The Depository Trust & Clearing Corporation (DTCC). He also served as President, Chief Operating Officer, and Board member of The Depository Trust Company (DTC) and President and Board member of the National Securities Clearing Corporation (NSCC). In addition, Mr. Dirks served as Chief Executive Officer and Board member of the Government Securities Clearing Corporation, Chief Executive Officer and Board member of the Mortgage-Backed Securities Clearing Corporation, as a Trustee and a member of the Finance Committee of Manhattan College (2005-2008), and as a Trustee and a member of the Finance Committee of AHRC of Nassau County (2006-2008). Mr. Dirks is a member of the Independent Directors Council (IDC) Governing Council (2010-present) and Board of Directors for The Brookville Center for Children's Services, Inc. (2009-present). |
Alan J. Lacy (59) |
| Year of Election or Appointment: 2008 Mr. Lacy serves as Senior Adviser (2007-present) of Oak Hill Capital Partners, L.P. (private equity). Mr. Lacy also served as Chief Executive Officer (2000-2005) and Vice Chairman (2005-2006) of Sears Holdings Corporation and Sears, Roebuck and Co. (retail). In addition, Mr. Lacy serves as a member of the Board of Directors of Dave & Buster's Entertainment, Inc. (restaurant and entertainment complexes, 2010-present), Earth Fare, Inc. (retail grocery, 2012-present), The Hillman Companies, Inc. (hardware wholesalers, 2010-present), and Bristol-Myers Squibb Company (global pharmaceuticals, 2008-present). Mr. Lacy is a member of the Board of Trustees of The National Parks Conservation Association (2006-present). Previously, Mr. Lacy served as Chairman of the Board of Trustees of the National Parks Conservation Association (2008-2011) and as a member of the Board of Directors for the Western Union Company (global money transfer, 2006-2011). |
Ned C. Lautenbach (68) |
| Year of Election or Appointment: 2000 Mr. Lautenbach is Chairman of the Independent Trustees of the Equity and High Income Funds (2006-present). Mr. Lautenbach currently serves as the Lead Director of the Eaton Corporation Board of Directors (diversified industrial, 1997-present). Mr. Lautenbach is Chairman of the Board of Directors of the Philharmonic Center for the Arts in Naples, Florida (2012-present) and a member of the Council on Foreign Relations (1994-present). Previously, Mr. Lautenbach was a Partner/Advisory Partner at Clayton, Dubilier & Rice, LLC (private equity investment, 1998-2010), as well as a Director of Sony Corporation (2006-2007). |
Joseph Mauriello (68) |
| Year of Election or Appointment: 2008 Prior to his retirement in January 2006, Mr. Mauriello served in numerous senior management positions including Deputy Chairman and Chief Operating Officer (2004-2005), and Vice Chairman of Financial Services (2002-2004) of KPMG LLP US (professional services, 1965-2005). Mr. Mauriello currently serves as a member of the Board of Directors of XL Group plc. (global insurance and re-insurance, 2006-present). Previously, Mr. Mauriello served as a Director of the Hamilton Funds of the Bank of New York (2006-2007) and of Arcadia Resources Inc. (health care services and products, 2007-2012). |
Robert W. Selander (62) |
| Year of Election or Appointment: 2011 Previously, Mr. Selander served as a Member of the Advisory Board of Fidelity's Equity and High Income Funds (2011), Executive Vice Chairman (2010), Chief Executive Officer (2009-2010), and President and Chief Executive Officer (1997-2009) of Mastercard, Inc. |
Cornelia M. Small (68) |
| Year of Election or Appointment: 2005 Ms. Small is a member of the Board of Directors (2009-present) and Chair of the Investment Committee (2010-present) of the Teagle Foundation. Ms. Small also serves on the Investment Committee of the Berkshire Taconic Community Foundation (2008-present). Previously, Ms. Small served as Chairperson (2002-2008) and a member of the Investment Committee and Chairperson (2008-2012) and a member of the Board of Trustees of Smith College. In addition, Ms. Small served as Chief Investment Officer, Director of Global Equity Investments, and a member of the Board of Directors of Scudder, Stevens & Clark and Scudder Kemper Investments. |
William S. Stavropoulos (73) |
| Year of Election or Appointment: 2001 Mr. Stavropoulos is Vice Chairman of the Independent Trustees of the Equity and High Income Funds (2006-present). Mr. Stavropoulos serves as President and Founder of the Michigan Baseball Foundation, the Great Lakes Loons (2007-present). Mr. Stavropoulos is Chairman Emeritus of the Board of Directors of The Dow Chemical Company, where he previously served in numerous senior management positions, including President, CEO (1995-2000; 2002-2004), Chairman of the Executive Committee (2000-2006), and as a member of the Board of Directors (1990-2006). Currently, Mr. Stavropoulos is a Director of Univar Inc. (global distributor of commodity and specialty chemicals, Chairman from 2010-May 2012 and Lead Director from May 2012-present), Teradata Corporation (data warehousing and technology solutions, 2008-present), Maersk Inc. (industrial conglomerate), and Tyco International, Ltd. (multinational manufacturing and services, 2007-present), and a member of the Advisory Board for Metalmark Capital LLC (private equity investment, 2005-present). Mr. Stavropoulos is an operating advisor to Clayton, Dubilier & Rice, LLC (private equity investment). In addition, Mr. Stavropoulos is a member of the University of Notre Dame Advisory Council for the College of Science, a Trustee of the Rollin L. Gerstacker Foundation, and a Director of the Naples Philharmonic Center for the Arts. Previously, Mr. Stavropoulos served as a Director of Chemical Financial Corporation (bank holding company, 1993-2012). |
David M. Thomas (63) |
| Year of Election or Appointment: 2008 Previously, Mr. Thomas served as Executive Chairman (2005-2006) and Chairman and Chief Executive Officer (2000-2005) of IMS Health, Inc. (pharmaceutical and healthcare information solutions), and a Director of Fortune Brands, Inc. (consumer products, 2000-2011). In addition, Mr. Thomas serves as Non-Executive Chairman of the Board of Directors of Fortune Brands Home and Security (home and security products, 2011-present), and as a member of the Board of Directors of Interpublic Group of Companies, Inc. (marketing communication, 2004-present). |
Michael E. Wiley (62) |
| Year of Election or Appointment: 2008 Mr. Wiley also serves as a Director of Asia Pacific Exploration Consolidated (international oil and gas exploration and production, 2008-present). Mr. Wiley serves as a Director of Tesoro Corporation (independent oil refiner and marketer, 2005-present), and a Director of Bill Barrett Corporation (exploration and production, 2005-present). In addition, Mr. Wiley also serves as a Director of Post Oak Bank (privately-held bank, 2004-present). Previously, Mr. Wiley served as a member of the Board of Trustees of the University of Tulsa (2000-2006; 2007-2010), as a Senior Energy Advisor of Katzenbach Partners, LLC (consulting, 2006-2007), as an Advisory Director of Riverstone Holdings (private investment), Chairman, President, and CEO of Baker Hughes, Inc. (oilfield services, 2000-2004), and as Director of Spinnaker Exploration Company (exploration and production, 2001-2005). |
+ The information above includes each Trustee's principal occupation during the last five years and other information relating to the experience, attributes, and skills relevant to each Trustee's qualifications to serve as a Trustee, which led to the conclusion that each Trustee should serve as a Trustee for the fund.
Advisory Board Members and Executive Officers:
Correspondence intended for David A. Rosow and Garnett A. Smith may be sent to Fidelity Investments, P.O. Box 55235, Boston, Massachusetts 02205-5235. Correspondence intended for each executive officer, Edward C. Johnson 3d, and Peter S. Lynch may be sent to Fidelity Investments, 82 Devonshire Street, Boston, Massachusetts 02109.
Name, Age; Principal Occupation |
Edward C. Johnson 3d (82) |
| Year of Election or Appointment: 2011 Member of the Advisory Board of Fidelity's Equity and High Income Funds. Mr. Johnson serves as Chief Executive Officer, Chairman, and a Director of FMR LLC, and also serves as Chairman and Director of FIL Limited. Previously, Mr. Johnson served as a Trustee and Chairman of the Board of certain Fidelity Trusts, Chairman and a Director of FMR, Chairman and a Director of FMR Co., Inc., and President of FMR LLC (2006-2007). |
Peter S. Lynch (68) |
| Year of Election or Appointment: 2003 Member of the Advisory Board of Fidelity's Equity and High Income Funds. Mr. Lynch is Vice Chairman and a Director of FMR and FMR Co., Inc. In addition, Mr. Lynch serves as a Trustee of Boston College and as the Chairman of the Inner-City Scholarship Fund. Previously, Mr. Lynch served on the Special Olympics International Board of Directors (1997-2006). |
David A. Rosow (70) |
| Year of Election or Appointment: 2012 Member of the Advisory Board of Fidelity's Equity and High Income Funds. Chairman and Chief Executive Officer of International Golf Group, Inc. (golf course development, 1989-present). Previously, Mr. Rosow served as Chairman and Chief Executive Officer of Rosow & Company, Inc. (private investment company, 1989-2011), a Lead Director of Hudson United Bancorp (2001-2006) and as a Director of TD Banknorth (1996-2006). In addition, Mr. Rosow is a member (2008-present) and President (2009-present) of the Town Council of Palm Beach, Florida. |
Garnett A. Smith (65) |
| Year of Election or Appointment: 2012 Member of the Advisory Board of Fidelity's Equity and High Income Funds. Prior to Mr. Smith's retirement, he served as Chairman and Chief Executive Officer of Inbrand Corp. (manufacturer of personal absorbent products, 1990-1997). He also served as President (1986-1990) of Inbrand Corp. Prior to his employment with Inbrand Corp., he was employed by a retail fabric chain and North Carolina National Bank. In addition, Mr. Smith is a board member of the Jackson Hole Land Trust (2009-present). |
Kenneth B. Robins (43) |
| Year of Election or Appointment: 2008 President and Treasurer of Fidelity's Equity and High Income Funds. Mr. Robins also serves as President and Treasurer (2010-present) and Assistant Treasurer (2009-present) of other Fidelity funds and is an employee of Fidelity Investments (2004-present). Previously, Mr. Robins served as Deputy Treasurer of the Fidelity funds (2005-2008) and Treasurer and Chief Financial Officer of The North Carolina Capital Management Trust: Cash and Term Portfolios (2006-2008). |
Bruce T. Herring (47) |
| Year of Election or Appointment: 2006 Vice President of certain Equity Funds. Mr. Herring also serves as President of Fidelity Research & Analysis Company (2010-present), Chief Investment Officer and Director of Fidelity Management & Research (U.K.) Inc. (2010-present) and Group Chief Investment Officer of FMR. Previously, Mr. Herring served as Vice President (2005-2006) and Senior Vice President (2006-2007) of Fidelity Management & Research Company, Vice President of FMR Co., Inc. (2001-2007) and as a portfolio manager for Fidelity U.S. Equity Funds. |
Brian B. Hogan (48) |
| Year of Election or Appointment: 2009 Vice President of Equity and High Income Funds. Mr. Hogan also serves as President of FMR's Equity Division (2009-present). Previously, Mr. Hogan served as Senior Vice President, Equity Research of FMR (2006-2009) and as a portfolio manager. |
Scott C. Goebel (44) |
| Year of Election or Appointment: 2008 Secretary and Chief Legal Officer (CLO) of the Fidelity funds. Mr. Goebel also serves as Secretary of Fidelity Investments Money Management, Inc. (FIMM) (2010-present) and Fidelity Research and Analysis Company (FRAC) (2010-present); Secretary and CLO of The North Carolina Capital Management Trust: Cash and Term Portfolios (2008-present); General Counsel, Secretary, and Senior Vice President of FMR (2008-present) and FMR Co., Inc. (2008-present); employed by FMR LLC or an affiliate (2001-present); Chief Legal Officer of Fidelity Management & Research (Hong Kong) Limited (2008-present) and Assistant Secretary of Fidelity Management & Research (Japan) Inc. (2008-present), and Fidelity Management & Research (U.K.) Inc. (2008-present). Previously, Mr. Goebel served as Assistant Secretary of FIMM (2008-2010), FRAC (2008-2010), and the Funds (2007-2008) and as Vice President and Secretary of Fidelity Distributors Corporation (FDC) (2005-2007). |
William C. Coffey (43) |
| Year of Election or Appointment: 2009 Assistant Secretary of Fidelity's Equity and High Income Funds. Mr. Coffey also serves as Senior Vice President and Deputy General Counsel of FMR LLC (2010-present), and is an employee of Fidelity Investments. Previously, Mr. Coffey served as Vice President and Associate General Counsel of FMR LLC (2005-2009). |
Elizabeth Paige Baumann (44) |
| Year of Election or Appointment: 2012 Anti-Money Laundering (AML) Officer of the Fidelity funds. Ms. Baumann also serves as AML Officer of The North Carolina Capital Management Trust: Cash and Term Portfolios (2012-present), Chief AML Officer of FMR LLC (2012-present), and is an employee of Fidelity Investments. Previously, Ms. Baumann served as Vice President and Deputy Anti-Money Laundering Officer (2007-2012). |
Christine Reynolds (54) |
| Year of Election or Appointment: 2008 Chief Financial Officer of the Fidelity funds. Ms. Reynolds became President of Fidelity Pricing and Cash Management Services (FPCMS) in August 2008. Ms. Reynolds served as Chief Operating Officer of FPCMS (2007-2008). Previously, Ms. Reynolds served as President, Treasurer, and Anti-Money Laundering officer of the Fidelity funds (2004-2007). |
Joseph A. Hanlon (44) |
| Year of Election or Appointment: 2012 Chief Compliance Officer of Fidelity's Equity and High Income Funds. Mr. Hanlon serves as Compliance Officer of FMR, FMR Co., Inc., Fidelity Investments Money Management, Inc. (FIMM), Fidelity Research and Analysis Company (FRAC), Fidelity Management & Research (Japan) Inc., Fidelity Management & Research (U.K.) Inc., Fidelity Management & Research (Hong Kong), and Strategic Advisers, Inc. (2009-present), as Senior Vice President of the Fidelity Asset Management Division (2009-present), and is an employee of Fidelity Investments. |
Joseph F. Zambello (55) |
| Year of Election or Appointment: 2011 Deputy Treasurer of the Fidelity funds. Mr. Zambello is an employee of Fidelity Investments. Previously, Mr. Zambello served as Vice President of FMR's Program Management Group (2009-2011) and Vice President of the Transfer Agent Oversight Group (2005-2009). |
Adrien E. Deberghes (45) |
| Year of Election or Appointment: 2008 Deputy Treasurer of Fidelity's Equity and High Income Funds. Mr. Deberghes also serves as Vice President (2011-present) and Assistant Treasurer (2010-present) of other Fidelity funds, and is an employee of Fidelity Investments (2008-present). Previously, Mr. Deberghes served as Senior Vice President of Mutual Fund Administration at State Street Corporation (2007-2008), Senior Director of Mutual Fund Administration at Investors Bank & Trust (2005-2007), and Director of Finance for Dunkin' Brands (2000-2005). |
Stephen Sadoski (41) |
| Year of Election or Appointment: 2012 Deputy Treasurer of Fidelity's Equity and High Income Funds. Mr. Sadoski also serves as Assistant Treasurer of other Fidelity funds (2012-present) and is an employee of Fidelity Investments (2012-present). Previously, Mr. Sadoski served as an assistant chief accountant in the Division of Investment Management of the Securities and Exchange Commission (SEC) (2009-2012) and as a senior manager at Deloitte & Touche (1997-2009). |
Stephanie J. Dorsey (43) |
| Year of Election or Appointment: 2010 Assistant Treasurer of Fidelity's Equity and High Income Funds. Ms. Dorsey also serves as Deputy Treasurer of other Fidelity funds (2008-present) and is an employee of Fidelity Investments (2008-present). Previously, Ms. Dorsey served as Treasurer (2004-2008) of the JPMorgan Mutual Funds and Vice President (2004-2008) of JPMorgan Chase Bank. |
John R. Hebble (54) |
| Year of Election or Appointment: 2009 Assistant Treasurer of Fidelity's Equity and High Income Funds. Mr. Hebble also serves as President (2011-present), Treasurer, and Chief Financial Officer of The North Carolina Capital Management Trust: Cash and Term Portfolios (2008-present), President and Treasurer of other Fidelity funds (2008-present) and is an employee of Fidelity Investments. |
Gary W. Ryan (54) |
| Year of Election or Appointment: 2005 Assistant Treasurer of the Fidelity funds. Mr. Ryan is an employee of Fidelity Investments. Previously, Mr. Ryan served as Vice President of Fund Reporting in Fidelity Pricing and Cash Management Services (FPCMS) (1999-2005). |
Jonathan Davis (44) |
| Year of Election or Appointment: 2010 Assistant Treasurer of the Fidelity funds. Mr. Davis is also Assistant Treasurer of Fidelity Rutland Square Trust II and Fidelity Commonwealth Trust II. Mr. Davis is an employee of Fidelity Investments. Previously, Mr. Davis served as Vice President and Associate General Counsel of FMR LLC (2003-2010). |
Annual Report
The Board of Trustees of Fidelity Advisor International Discovery Fund voted to pay to shareholders of record at the opening of business on record date, the following distributions per share derived from capital gains realized from sales of portfolio securities, and dividends derived from net investment income:
| Pay Date | Record Date | Dividends | Capital Gains |
Class A | 12/10/12 | 12/07/12 | $0.446 | $0.032 |
Class T | 12/10/12 | 12/07/12 | $0.340 | $0.032 |
Class B | 12/10/12 | 12/07/12 | $0.149 | $0.032 |
Class C | 12/10/12 | 12/07/12 | $0.200 | $0.032 |
Class A designates 1%; Class T designates 2%; Class B designates 7%; and Class C designates 5%; of the dividends distributed during the fiscal year as qualifying for the dividends-received deduction for corporate shareholder.
Class A, Class T, Class B , and Class C designates 100% of dividends distributed during the fiscal year as amounts which may be taken into account as a dividend for purposes of the maximum rate under section 1(h)(11) of the Internal Revenue Code.
The amounts per share which represent income derived from sources within, and taxes paid to, foreign countries or possessions of the United States are as follows:
| Pay Date | Income | Taxes |
Class A | 12/05/11 | $0.327 | $0.0345 |
Class T | 12/05/11 | $0.225 | $0.0345 |
Class B | 12/05/11 | $0.051 | $0.0345 |
Class C | 12/05/11 | $0.074 | $0.0345 |
The fund will notify shareholders in January 2013 of amounts for use in preparing 2012 income tax returns.
Annual Report
Board Approval of Investment Advisory Contracts and Management Fees
Fidelity International Discovery Fund
Each year, the Board of Trustees, including the Independent Trustees (together, the Board), votes on the renewal of the management contract and sub-advisory agreements (together, the Advisory Contracts) for the fund. The Board, assisted by the advice of fund counsel and Independent Trustees' counsel, requests and considers a broad range of information relevant to the renewal of the Advisory Contracts throughout the year.
The Board meets regularly and, at each of its meetings, considers factors that are relevant to its annual consideration of the renewal of the fund's Advisory Contracts, including the services and support provided to the fund and its shareholders. The Board has established various standing committees, each composed of and chaired by Independent Trustees with varying backgrounds, to which the Board has assigned specific subject matter responsibilities in order to enhance effective decision-making by the Board. The Board, acting directly and through its Committees, requests and receives information concerning the annual consideration of the renewal of the fund's Advisory Contracts. The Board also meets as needed to consider matters specifically related to the Board's annual consideration of the renewal of Advisory Contracts. Members of the Board may also meet with trustees of other Fidelity funds through ad hoc joint committees to discuss certain matters relevant to the Fidelity funds.
At its July 2012 meeting, the Board of Trustees, including the Independent Trustees, unanimously determined to renew the fund's Advisory Contracts. In reaching its determination, the Board considered all factors it believed relevant, including (i) the nature, extent, and quality of the services to be provided to the fund and its shareholders (including the investment performance of the fund); (ii) the competitiveness of the fund's management fee and total expense ratio relative to peer funds; (iii) the total costs of the services to be provided by and the profits to be realized by Fidelity from its relationship with the fund; (iv) the extent to which economies of scale exist and would be realized as the fund grows; and (v) whether fee levels reflect these economies of scale, if any, for the benefit of fund shareholders.
In considering whether to renew the Advisory Contracts for the fund, the Board reached a determination, with the assistance of fund counsel and Independent Trustees' counsel and through the exercise of its business judgment, that the renewal of the Advisory Contracts is in the best interests of the fund and its shareholders and that the compensation payable under the Advisory Contracts is fair and reasonable. The Board's decision to renew the Advisory Contracts was not based on any single factor, but rather was based on a comprehensive consideration of all the information provided to the Board at its meetings throughout the year. The Board, in reaching its determination to renew the Advisory Contracts, is aware that shareholders in the fund have a broad range of investment choices available to them, including a wide choice among mutual funds offered by Fidelity's competitors, and that the fund's shareholders, who have the opportunity to review and weigh the disclosure provided by the fund in its prospectus and other public disclosures, have chosen to invest in this fund, managed by Fidelity.
Annual Report
Nature, Extent, and Quality of Services Provided. The Board considered the staffing within the investment adviser, FMR, and the sub-advisers (together, the Investment Advisers), including the backgrounds of the fund's investment personnel, and also considered the fund's investment objective, strategies, and related investment philosophy. The Independent Trustees also had discussions with senior management of Fidelity's investment operations and investment groups. The Board considered the structure of the portfolio manager compensation program and whether this structure provides appropriate incentives to act in the best interests of the fund.
Resources Dedicated to Investment Management and Support Services. The Board and the Fund Oversight and Research Committees reviewed the general qualifications and capabilities of the Investment Advisers' investment staff, including its size, education, experience, and resources, as well as the Investment Advisers' approach to recruiting, training, managing, and compensating investment personnel. The Board also noted that FMR has continued to increase the resources devoted to non-U.S. offices, including expansion of Fidelity's global investment organization. The Board noted that Fidelity's analysts have extensive resources, tools and capabilities that allow them to conduct sophisticated quantitative and fundamental analysis, as well as credit analysis of issuers, counterparties and guarantors. The Board also believes that Fidelity's investment professionals have sufficient access to global information and data so as to provide competitive investment results over time, and that those professionals also have access to sophisticated tools that permit them to assess portfolio construction and risk and performance attribution characteristics continuously, as well as to transmit new information and research conclusions rapidly around the world. Additionally, in its deliberations, the Board considered the Investment Advisers' trading and risk management capabilities and resources, which are an integral part of the investment management process.
Shareholder and Administrative Services. The Board considered (i) the nature, extent, quality, and cost of advisory, administrative, and shareholder services performed by the Investment Advisers and their affiliates under the Advisory Contracts and under separate agreements covering transfer agency, pricing and bookkeeping, and securities lending services for the fund; (ii) the nature and extent of the supervision of third party service providers, principally custodians and subcustodians; and (iii) the resources devoted to, and the record of compliance with, the fund's compliance policies and procedures. The Board also reviewed the allocation of fund brokerage, including allocations to brokers affiliated with the Investment Advisers, the use of brokerage commissions to pay fund expenses, and the use of "soft" commission dollars to pay for research services.
Annual Report
Board Approval of Investment Advisory Contracts and
Management Fees - continued
The Board noted that the growth of fund assets over time across the complex allows Fidelity to reinvest in the development of services designed to enhance the value or convenience of the Fidelity funds as investment vehicles. These services include 24-hour access to account information and market information through telephone representatives and over the Internet, investor education materials and asset allocation tools, and the expanded availability of Fidelity Investor Centers.
Investment in a Large Fund Family. The Board considered the benefits to shareholders of investing in a Fidelity fund, including the benefits of investing in a fund that is part of a large family of funds offering a variety of investment disciplines and providing a large variety of mutual fund investor services. The Board noted that Fidelity had taken, or had made recommendations that resulted in the Fidelity funds taking, a number of actions over the previous year that benefited particular funds, including (i) continuing to dedicate additional resources to investment research and support of the senior management team that oversees asset management; (ii) persisting in efforts to enhance Fidelity's research capabilities, in particular, international research; (iii) launching new funds and making other enhancements to meet client needs for global and income-oriented solutions; (iv) continuing to launch dedicated lower cost underlying funds to meet investment management's portfolio construction needs related to expanding underlying fund options, specifically for the Freedom Fund product lines; (v) adopting a "Stock Selector" sector neutral investment approach and employing a team of portfolio managers who are sector specialists to manage certain funds; (vi) rationalizing product lines and gaining increased efficiencies through the mergers of several funds into other funds; (vii) strengthening the Spartan Index Fund product line by adding new funds and/or new low-cost institutional share classes, restructuring fund expenses to accommodate new classes, and reducing investment minimums for certain classes of shares; (viii) modifying the eligibility criteria for Institutional Class shares to increase their appeal to government entities and charitable investors; and (ix) reducing certain transfer agent fee rates.
Investment Performance. The Board considered whether the fund has operated in accordance with its investment objective, as well as its record of compliance with its investment restrictions. It also reviewed the fund's absolute investment performance for each class, as well as the fund's relative investment performance for each class measured over multiple periods against (i) a broad-based securities market index, and (ii) a peer group of mutual funds deemed appropriate by Fidelity and reviewed by the Board. The following charts considered by the Board show, over the one-, three-, and five-year periods ended December 31, 2011, the cumulative total returns of Institutional Class (Class I) and Class B of the fund, the cumulative total returns of a broad-based securities market index ("benchmark"), and a range of cumulative total returns of a peer group of mutual funds identified by Morningstar, Inc. as having an investment style similar to that of the fund based on underlying portfolio holdings. The returns of Institutional Class (Class I) and Class B show the performance of the highest and lowest performing classes, respectively (based on five-year performance). The box within each chart shows the 25th percentile return (top of box) and the 75th percentile return (bottom of box) of the peer group. Returns shown above the box are in the first quartile and returns shown below the box are in the fourth quartile. The percentage beaten numbers noted below each chart correspond to the percentile box and represent the percentage of funds in the peer group whose performance was equal to or lower than that of the class indicated.
Annual Report
Fidelity International Discovery Fund

The Board reviewed the fund's relative investment performance against its peer group and noted that the performance of Institutional Class (Class I) of the fund was in the third quartile for the one- and three-year periods and the second quartile for the five-year period. The Board also noted that the investment performance of the fund was lower than its benchmark for the one- and three-year periods, although the five-year cumulative total return of Institutional Class (Class I) compared favorably to its benchmark. The Board considered that the variations in performance among the fund's classes reflect the variations in class expenses, which result in lower performance for higher expense classes. The Board discussed with FMR actions to improve the fund's disappointing performance relative to its peer group and benchmark. The Board also reviewed the fund's performance since inception as well as performance in the current year. The Board will continue to closely monitor the performance of the fund in the coming year and discuss with FMR other appropriate actions to address the performance of the fund.
The Board also considered that the fund's management fee is subject to upward or downward adjustment depending upon whether, and to what extent, the fund's investment performance for the performance period exceeds, or is exceeded by, the record (over the same period) of a Board-approved performance adjustment index. The Board noted that the performance adjustment provides FMR with a strong economic incentive to seek to achieve superior performance for the fund's shareholders and helps to more closely align the interests of FMR and the fund's shareholders.
Annual Report
Board Approval of Investment Advisory Contracts and
Management Fees - continued
Based on its review, the Board concluded that the nature, extent, and quality of services provided to the fund under the Advisory Contracts should benefit the fund's shareholders.
Competitiveness of Management Fee and Total Expense Ratio. The Board considered the fund's management fee and total expense ratio compared to "mapped groups" of competitive funds and classes. Fidelity creates "mapped groups" by combining similar Lipper investment objective categories that have comparable management fee characteristics. Combining Lipper investment objective categories aids the Board's management fee and total expense ratio comparisons by broadening the competitive group used for comparison and by reducing the number of universes to which various Fidelity funds are compared.
Management Fee. The Board considered two proprietary management fee comparisons for the 12-month periods shown in the chart below. The group of Lipper funds used by the Board for management fee comparisons is referred to below as the "Total Mapped Group." The Total Mapped Group comparison focuses on a fund's standing relative to the total universe of comparable funds available to investors in terms of gross management fees before expense reimbursements or caps, and without giving effect to the fund's performance adjustment. "TMG %" represents the percentage of funds in the Total Mapped Group that had management fees that were lower than the fund's. For example, a TMG % of 17% means that 83% of the funds in the Total Mapped Group had higher management fees than the fund. The "Asset-Size Peer Group" (ASPG) comparison focuses on a fund's standing relative to non-Fidelity funds similar in size to the fund within the Total Mapped Group. The ASPG represents at least 15% of the funds in the Total Mapped Group with comparable asset size and management fee characteristics, subject to a minimum of 50 funds (or all funds in the Total Mapped Group if fewer than 50). Additional information, such as the ASPG quartile in which the fund's management fee ranked and the impact of the fund's performance adjustment, is also included in the chart and considered by the Board.
Annual Report
Fidelity International Discovery Fund

The Board noted that the fund's management fee ranked below the median of its Total Mapped Group and below the median of its ASPG for 2011. The Board also noted the effect of the fund's negative performance adjustment on the fund's management fee ranking. The Board noted that the performance adjustment for each year represents calculations for performance periods that differ from the periods shown in the performance charts above.
Based on its review, the Board concluded that the fund's management fee is fair and reasonable in light of the services that the fund receives and the other factors considered.
Total Expense Ratio. In its review of each class's total expense ratio, the Board considered the fund's management fee as well as other fund or class expenses, as applicable, such as transfer agent fees, pricing and bookkeeping fees, fund-paid 12b-1 fees, and custodial, legal, and audit fees. The Board also noted the effects of any waivers and reimbursements on fees and expenses, as well as the impact of the fund's performance adjustment. As part of its review, the Board also considered the current and historical total expense ratios of each class of the fund compared to competitive fund median expenses. Each class of the fund is compared to those funds and classes in the Total Mapped Group (used by the Board for management fee comparisons) that have a similar sales load structure.
The Board noted that the total expense ratio of each of Class A, Class B, Class C, Institutional Class, the retail class, and Class K ranked below its competitive median for 2011 and the total expense ratio of Class T ranked above its competitive median for 2011. The Board considered that various factors, including 12b-1 fees, positive or negative performance adjustments, and relatively higher other expenses in the case of small fund size, can affect total expense ratios. The Board noted that the total expense ratio of Class T was above the competitive median primarily because of higher 12b-1 fees on Class T. Class T has a higher 12b-1 fee, but a lower front-end sales charge, than traditionally priced front-end sales charge classes. The Board considered that Class T is primarily sold load-waived in the retirement plan market where its 0.50% 12b-1 fee is comparable to competing no-load, higher 12b-1 fee classes designed specifically for retirement plans. The Board noted that the fund offers multiple classes, each of which has a different sales load and 12b-1 fee structure, and that the multiple structures are intended to offer a range of pricing options for the intermediary market. The Board also noted that the total expense ratios of the classes vary primarily by the level of their 12b-1 fees, although differences in transfer agent fees may also cause expenses to vary from class to class.
Annual Report
Board Approval of Investment Advisory Contracts and
Management Fees - continued
Fees Charged to Other Fidelity Clients. The Board also considered Fidelity fee structures and other information with respect to clients of FMR and its affiliates, such as other mutual funds advised or subadvised by FMR or its affiliates, pension plan clients, and other institutional clients. The Board noted the findings of the 2010 ad hoc joint committee (created with the board of other Fidelity funds), which reviewed and compared Fidelity's institutional investment advisory business with its business of providing services to the Fidelity funds, including the differences in services provided, fees charged, and costs incurred, as well as competition in their respective marketplaces.
Based on its review of total expense ratios and fees charged to other Fidelity clients, the Board concluded that the total expense ratio of each class of the fund was reasonable, although Class T was above the median of the universe presented for comparison, in light of the services that the fund and its shareholders receive and the other factors considered.
Costs of the Services and Profitability. The Board considered the revenues earned and the expenses incurred by Fidelity in conducting the business of developing, marketing, distributing, managing, administering and servicing the fund and its shareholders. The Board also considered the level of Fidelity's profits in respect of all the Fidelity funds.
On an annual basis, FMR presents to the Board Fidelity's profitability for the fund. Fidelity calculates the profitability for each fund, as well as aggregate profitability for groups of Fidelity funds and all Fidelity funds, using a series of detailed revenue and cost allocation methodologies which originate with the books and records of Fidelity on which Fidelity's audited financial statements are based. The Audit Committee of the Board reviews any significant changes from the prior year's methodologies.
PricewaterhouseCoopers LLP (PwC), independent registered public accounting firm and auditor to Fidelity and certain Fidelity funds, has been engaged annually by the Board as part of the Board's assessment of Fidelity's profitability analysis. PwC's engagement includes the review and assessment of Fidelity's methodologies used in determining the revenues and expenses attributable to Fidelity's mutual fund business, and completion of agreed-upon procedures surrounding the mathematical accuracy of fund profitability and its conformity to allocation methodologies. After considering PwC's reports issued under the engagement and information provided by Fidelity, the Board concluded that while other allocation methods may also be reasonable, Fidelity's profitability methodologies are reasonable in all material respects.
Annual Report
The Board also reviewed Fidelity's non-fund businesses and fall-out benefits related to the mutual fund business as well as cases where Fidelity's affiliates may benefit from or be related to the fund's business.
The Board considered the costs of the services provided by and the profits realized by Fidelity in connection with the operation of the fund and was satisfied that the profitability was not excessive in the circumstances.
Economies of Scale. The Board considered whether there have been economies of scale in respect of the management of the Fidelity funds, whether the Fidelity funds (including the fund) have appropriately benefited from any such economies of scale, and whether there is potential for realization of any further economies of scale. The Board considered the extent to which the fund will benefit from economies of scale through increased services to the fund, through waivers or reimbursements, or through fee or expense reductions. The Board also noted that in 2009, it and the board of other Fidelity funds created an ad hoc committee (the Economies of Scale Committee) to analyze whether FMR attains economies of scale in respect of the management and servicing of the Fidelity funds, whether the Fidelity funds have appropriately benefited from such economies of scale, and whether there is potential for realization of any further economies of scale.
The Board recognized that the fund's management contract incorporates a "group fee" structure, which provides for lower group fee rates as total fund assets under FMR's management increase, and for higher group fee rates as total fund assets under FMR's management decrease. FMR calculates the group fee rates based on a tiered asset "breakpoint" schedule that varies based on asset class. The Board considered that the group fee is designed to deliver the benefits of economies of scale to fund shareholders when total Fidelity fund assets increase, even if assets of any particular fund are unchanged or have declined, because some portion of Fidelity's costs are attributable to services provided to all Fidelity funds, and all funds benefit if those costs can be allocated among more assets. The Board concluded that, given the group fee structure, fund shareholders will benefit from lower management fees as assets under FMR's management increase at the fund complex level, regardless of whether Fidelity achieves any such economies of scale.
Annual Report
Board Approval of Investment Advisory Contracts and
Management Fees - continued
The Board concluded, taking into account the analysis of the Economies of Scale Committee, that economies of scale, if any, are being appropriately shared between fund shareholders and Fidelity.
Additional Information Requested by the Board. In order to develop fully the factual basis for consideration of the Fidelity funds' Advisory Contracts, the Board requested and received additional information on certain topics, including (i) fund performance trends, actions to be taken by FMR to improve certain funds' overall performance, and Fidelity's long-term strategies for certain funds; (ii) the potential to further rationalize the Fidelity fund lineup with the possibility of achieving savings for the funds and Fidelity; (iii) Fidelity's compensation structure for portfolio managers and other key investment personnel; (iv) the amount of the investment that each portfolio manager has made in the Fidelity fund(s) that he or she manages; (v) the realization of fall-out benefits in certain Fidelity business units; (vi) Fidelity's group fee structures, the potential impact of regulatory changes on such structures, and the rationale for the individual fee rates of certain funds; (vii) fund profitability methodology, including Fidelity's cost allocation methodology, and the impact of certain factors on fund profitability results; (viii) trends regarding industry use of performance fee structures and the possibility of implementing performance fee structures for additional funds; and (ix) the impact of net redemptions from the Fidelity funds.
Based on its evaluation of all of the conclusions noted above, and after considering all factors it believed relevant, the Board ultimately concluded that the advisory fee structures are fair and reasonable, and that the fund's Advisory Contracts should be renewed.
Annual Report
Investment Adviser
Fidelity Management & Research Company
Boston, MA
Investment Sub-Advisers
FMR Co., Inc.
Fidelity Management & Research
(U.K.) Inc.
FIL Investment Advisors
FIL Investments (Japan) Limited
FIL Investment Advisors (U.K.) Limited
Fidelity Management & Research
(Hong Kong) Limited
Fidelity Management & Research
(Japan) Inc.
General Distributor
Fidelity Distributors Corporation
Smithfield, RI
Transfer and Service Agents
Fidelity Investments Institutional Operations Company, Inc.
Boston, MA
Fidelity Service Company, Inc.
Boston, MA
Custodian
The Northern Trust Company
Chicago, IL
(Fidelity Investment logo)(registered trademark)
AID-UANN-1212
1.806656.107
(Fidelity Investment logo)(registered trademark)
Fidelity Advisor®
International Discovery
Fund - Institutional Class
Annual Report
October 31, 2012
(Fidelity Cover Art)
Institutional Class is
a class of Fidelity®
International Discovery Fund
Contents
Performance | (Click Here) | How the fund has done over time. |
Management's Discussion of Fund Performance | (Click Here) | The Portfolio Manager's review of fund performance and strategy. |
Shareholder Expense Example | (Click Here) | An example of shareholder expenses. |
Investment Changes | (Click Here) | A summary of major shifts in the fund's investments over the past six months. |
Investments | (Click Here) | A complete list of the fund's investments with their market values. |
Financial Statements | (Click Here) | Statements of assets and liabilities, operations, and changes in net assets, as well as financial highlights. |
Notes | (Click Here) | Notes to financial statements. |
Report of Independent Registered Public Accounting Firm | (Click Here) | |
Trustees and Officers | (Click Here) | |
Distributions | (Click Here) | |
Board Approval of Investment Advisory Contracts and Management Fees | (Click Here) | |
To view a fund's proxy voting guidelines and proxy voting record for the 12-month period ended June 30, visit http://www.fidelity.com/proxyvotingresults or visit the Securities and Exchange Commission's (SEC) web site at http://www.sec.gov. You may also call 1-877-208-0098 to request a free copy of the proxy voting guidelines.
Standard & Poor's, S&P and S&P 500 are registered service marks of The McGraw-Hill Companies, Inc. and have been licensed for use by Fidelity Distributors Corporation.
Other third party marks appearing herein are the property of their respective owners.
All other marks appearing herein are registered or unregistered trademarks or service marks of FMR LLC or an affiliated company. © 2012 FMR LLC. All rights reserved.
Annual Report
This report and the financial statements contained herein are submitted for the general information of the shareholders of the fund. This report is not authorized for distribution to prospective investors in the fund unless preceded or accompanied by an effective prospectus.
A fund files its complete schedule of portfolio holdings with the SEC for the first and third quarters of each fiscal year on Form N-Q. Forms N-Q are available on the SEC's web site at http://www.sec.gov. A fund's Forms N-Q may be reviewed and copied at the SEC's Public Reference Room in Washington, DC. Information regarding the operation of the SEC's Public Reference Room may be obtained by calling 1-800-SEC-0330. For a complete list of a fund's portfolio holdings, view the fund's most recent holdings listing, semiannual report, or annual report on Fidelity's web site at http://www.fidelity.com, http://www.advisor.fidelity.com, or http://www.401k.com, as applicable.
NOT FDIC INSURED • MAY LOSE VALUE • NO BANK GUARANTEE
Neither the fund nor Fidelity Distributors Corporation is a bank.
Annual Report
Average annual total return reflects the change in the value of an investment, assuming reinvestment of the class' distributions from dividend income and capital gains (the profits earned upon the sale of securities that have grown in value, if any) and assuming a constant rate of performance each year. The $10,000 table and the fund's returns do not reflect the deduction of taxes that a shareholder would pay on fund distributions or the redemption of fund shares. During periods of reimbursement by Fidelity, a fund's total return will be greater than it would be had the reimbursement not occurred. How a fund did yesterday is no guarantee of how it will do tomorrow.
Average Annual Total Returns
Periods ended October 31, 2012 | Past 1
year | Past 5
years | Past 10
years |
Institutional Class A, B | 9.07% | -5.65% | 9.17% |
A The initial offering of Institutional Class shares took place on January 6, 2005. Returns prior to January 6, 2005 are those of Fidelity® International Discovery Fund, the original class of the fund.
B Prior to October 1, 2004, the fund operated under certain different investment policies. The fund's historical performance may not represent its current investment policies.
$10,000 Over 10 Years
Let's say hypothetically that $10,000 was invested in Fidelity Advisor® International Discovery Fund - Institutional Class on October 31, 2002. The chart shows how the value of your investment would have changed, and also shows how the MSCI® EAFE® Index performed over the same period. The initial offering of Institutional Class took place on January 6, 2005. See above for additional information regarding the performance of Institutional Class.
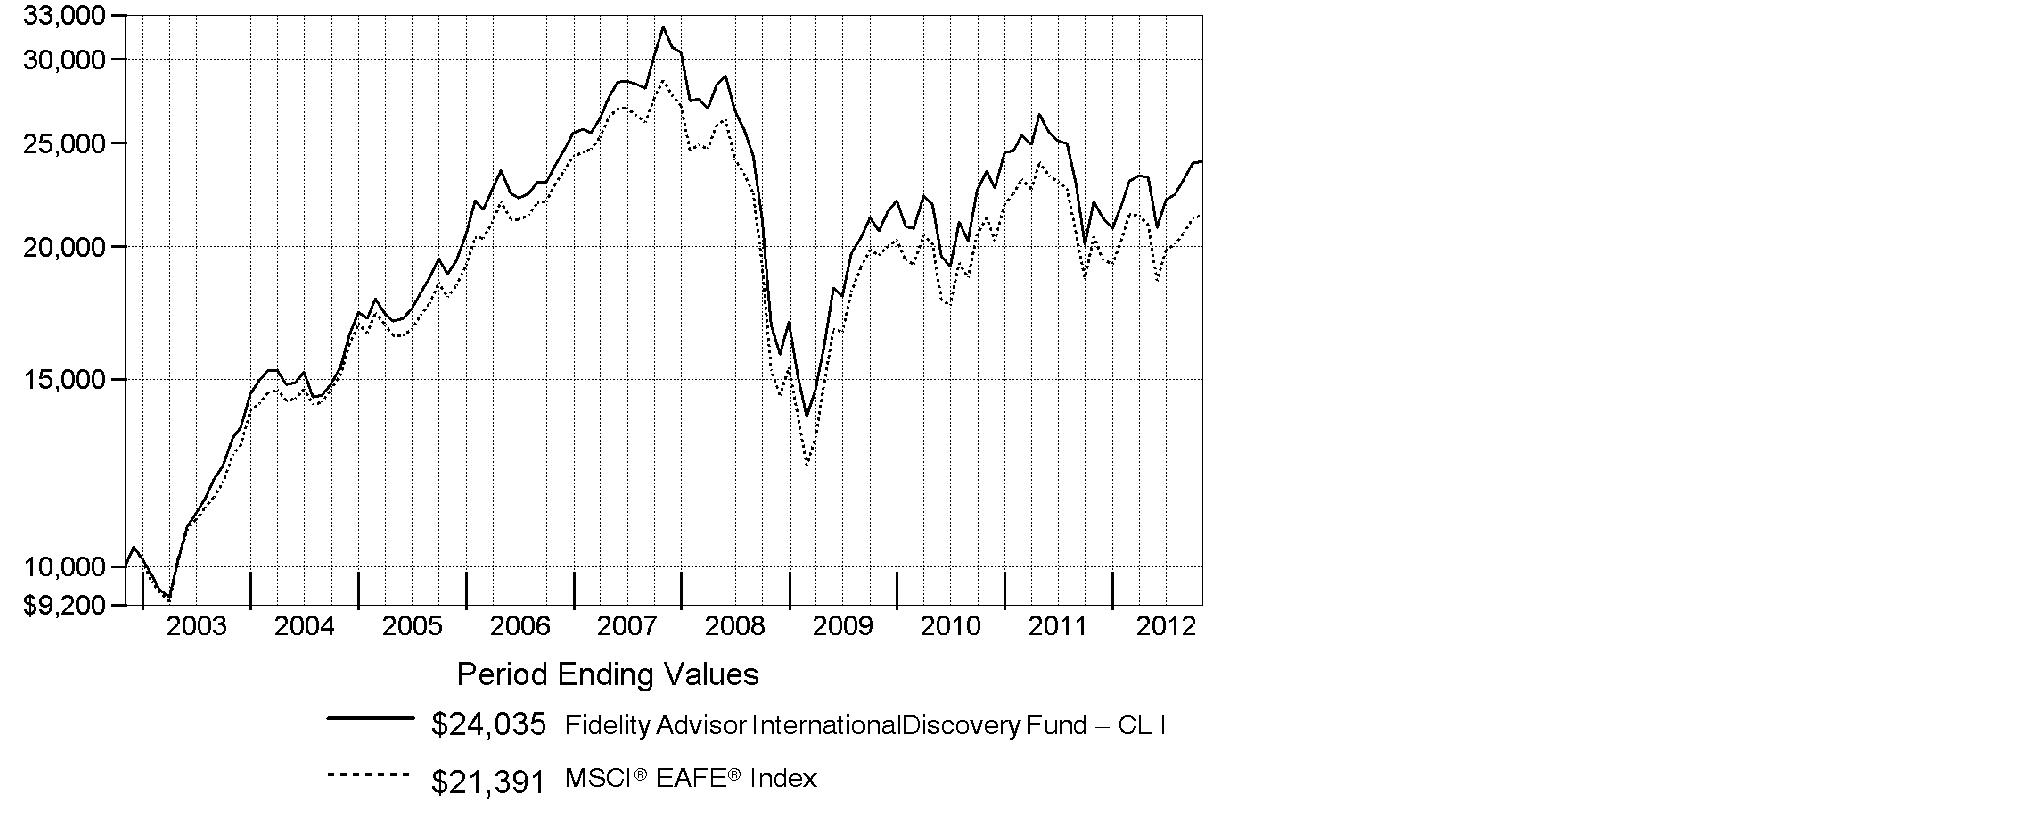
Annual Report
Market Recap: International stocks experienced pendulum-like swings during the 12 months ending October 31, 2012, finishing the period with a modest advance. The market faced periodic bouts of volatility this past year, as a number of macroeconomic concerns - including the eurozone debt crisis, the strength and pace of the U.S. economic recovery, and a slowdown in China's once-blistering growth - dominated headlines and weighed on investors. While a stronger U.S. dollar provided an additional head wind, foreign developed- and emerging-markets stocks still managed a gain for the 12 months, as the MSCI® ACWI® (All Country World Index) ex USA Index rose 4.11%, largely buttressed in the summertime by pledges of accommodative monetary action from eurozone officials, as well as signs that the U.S. housing market was on the mend. Within the index, Asia-Pacific ex Japan showed the most impressive gains, advancing roughly 11%. A number of core European components, most notably Germany (+11%), Switzerland (+10%) and the U.K. (+9%), benefited from optimism about the eurozone's ability to resolve its debt woes, which also helped the region outpace the index overall. Elsewhere, results from Canada (+3%) and the generally more volatile emerging markets (+2%) each fell short of the MSCI index, while Japan was among the few benchmark constituents to finish in the red, returning about -3%.
Comments from William Kennedy, Portfolio Manager of Fidelity Advisor® International Discovery Fund: For the year, the fund's Institutional Class shares returned 9.07%, outpacing the 4.76% gain of the MSCI® EAFE® Index. Security selection drove relative performance, with particularly strong contributions from my choices within Europe ex U.K., Japan and emerging markets. Stock picks in consumer staples and information technology also helped. Top individual contributors included Netherlands-based digital security leader Gemalto, whose strong gain was fueled by the worldwide growth of mobile and cloud computing. Shares of Hong Kong's Techtronic Industries, whose products include Ryobi power tools and Hoover vacuums, moved sharply higher, due to resilience in the U.S., where it sells a lot of its goods. An investment in drugstore retailer Cosmos Pharmaceutical in Japan also helped, buoyed by expansion into new markets. By contrast, security selection in the U.K. detracted. The biggest individual disappointments were online retailers in Japan: Start Today and Rakuten. Both stocks declined as business slowed and competition increased. Techtronic, Cosmos and Start Today were not in the index, and Start Today was not held at period end.
The views expressed above reflect those of the portfolio manager(s) only through the end of the period as stated on the cover of this report and do not necessarily represent the views of Fidelity or any other person in the Fidelity organization. Any such views are subject to change at any time based upon market or other conditions and Fidelity disclaims any responsibility to update such views. These views may not be relied on as investment advice and, because investment decisions for a Fidelity fund are based on numerous factors, may not be relied on as an indication of trading intent on behalf of any Fidelity fund.
Annual Report
Shareholder Expense Example
As a shareholder of the Fund, you incur two types of costs: (1) transaction costs, including sales charges (loads) on purchase payments or redemption proceeds, redemption fees and (2) ongoing costs, including management fees, distribution and/or service (12b-1) fees and other Fund expenses. This Example is intended to help you understand your ongoing costs (in dollars) of investing in the Fund and to compare these costs with the ongoing costs of investing in other mutual funds.
The Example is based on an investment of $1,000 invested at the beginning of the period and held for the entire period (May 1, 2012 to October 31, 2012).
Actual Expenses
The first line of the accompanying table for each class of the Fund provides information about actual account values and actual expenses. You may use the information in this line, together with the amount you invested, to estimate the expenses that you paid over the period. Simply divide your account value by $1,000.00 (for example, an $8,600 account value divided by $1,000.00 = 8.6), then multiply the result by the number in the first line for a class of the Fund under the heading entitled "Expenses Paid During Period" to estimate the expenses you paid on your account during this period. A small balance maintenance fee of $12.00 that is charged once a year may apply for certain accounts with a value of less than $2,000. This fee is not included in the table below. If it was, the estimate of expenses you paid during the period would be higher, and your ending account value lower, by this amount. In addition, the Fund, as a shareholder in the underlying Fidelity Central Funds, will indirectly bear its pro-rata share of the fees and expenses incurred by the underlying Fidelity Central Funds. These fees and expenses are not included in the Fund's annualized expense ratio used to calculate the expense estimate in the table below.
Hypothetical Example for Comparison Purposes
The second line of the accompanying table for each class of the Fund provides information about hypothetical account values and hypothetical expenses based on a Class' actual expense ratio and an assumed rate of return of 5% per year before expenses, which is not the Class' actual return. The hypothetical account values and expenses may not be used to estimate the actual ending account balance or expenses you paid for the period. You may use this information to compare the ongoing costs of investing in the Fund and other funds. To do so, compare this 5% hypothetical example with the 5% hypothetical examples that appear in the shareholder reports of the other funds. A small balance maintenance fee of $12.00 that is charged once a year may apply for certain accounts with a value of less than $2,000. This fee is not included in the table below. If it was, the estimate of expenses you paid during the period would be higher, and your ending account value lower, by this amount. In addition, the Fund, as a shareholder in the underlying Fidelity Central Funds, will indirectly bear its pro-rata share of the fees and expenses incurred by the underlying Fidelity Central Funds. These fees and expenses are not included in the Fund's annualized expense ratio used to calculate the expense estimate in the table below.
Please note that the expenses shown in the table are meant to highlight your ongoing costs only and do not reflect any transaction costs. Therefore, the second line of the table is useful in comparing ongoing costs only, and will not help you determine the relative total costs of owning different funds. In addition, if these transactional costs were included, your costs would have been higher.
Annual Report
| Annualized
Expense Ratio | Beginning
Account Value
May 1, 2012 | Ending
Account Value
October 31, 2012 | Expenses Paid
During Period*
May 1, 2012
to October 31, 2012 |
Class A | 1.41% | | | |
Actual | | $ 1,000.00 | $ 1,033.30 | $ 7.21 |
HypotheticalA | | $ 1,000.00 | $ 1,018.05 | $ 7.15 |
Class T | 1.67% | | | |
Actual | | $ 1,000.00 | $ 1,031.90 | $ 8.53 |
HypotheticalA | | $ 1,000.00 | $ 1,016.74 | $ 8.47 |
Class B | 2.16% | | | |
Actual | | $ 1,000.00 | $ 1,029.30 | $ 11.02 |
HypotheticalA | | $ 1,000.00 | $ 1,014.28 | $ 10.94 |
Class C | 2.16% | | | |
Actual | | $ 1,000.00 | $ 1,029.60 | $ 11.02 |
HypotheticalA | | $ 1,000.00 | $ 1,014.28 | $ 10.94 |
International Discovery | 1.08% | | | |
Actual | | $ 1,000.00 | $ 1,035.00 | $ 5.52 |
HypotheticalA | | $ 1,000.00 | $ 1,019.71 | $ 5.48 |
Class K | .90% | | | |
Actual | | $ 1,000.00 | $ 1,035.70 | $ 4.61 |
HypotheticalA | | $ 1,000.00 | $ 1,020.61 | $ 4.57 |
Institutional Class | 1.07% | | | |
Actual | | $ 1,000.00 | $ 1,035.10 | $ 5.47 |
HypotheticalA | | $ 1,000.00 | $ 1,019.76 | $ 5.43 |
A 5% return per year before expenses
* Expenses are equal to each Class' annualized expense ratio, multiplied by the average account value over the period, multiplied by 184/366 (to reflect the one-half year period).
Annual Report
Investment Changes (Unaudited)
Geographic Diversification (% of fund's net assets) |
As of October 31, 2012 |
 | United Kingdom 21.2% | |
 | Japan 16.1% | |
 | France 8.5% | |
 | Germany 8.3% | |
 | United States of America 7.0% | |
 | Switzerland 5.3% | |
 | Netherlands 3.2% | |
 | Australia 3.0% | |
 | Italy 2.7% | |
| Other 24.7% | |

Percentages are based on country or territory of incorporation and are adjusted for the effect of futures contracts, if applicable. |
As of April 30, 2012 |
| United Kingdom 21.0% | |
| Japan 16.7% | |
| United States of America 6.7% | |
| France 6.2% | |
| Germany 5.4% | |
| Netherlands 4.7% | |
| Switzerland 4.5% | |
| Korea (South) 3.9% | |
| Australia 3.4% | |
| Other 27.5% | |

Percentages are based on country or territory of incorporation and are adjusted for the effect of futures contracts, if applicable. |
Asset Allocation |
| % of fund's
net assets | % of fund's net assets
6 months ago |
Stocks and Investment Companies | 96.7 | 97.5 |
Short-Term Investments and Net Other Assets (Liabilities) | 3.3 | 2.5 |
Top Ten Stocks as of October 31, 2012 |
| % of fund's
net assets | % of fund's net assets
6 months ago |
Royal Dutch Shell PLC Class B (United Kingdom) (United Kingdom, Oil, Gas & Consumable Fuels) | 2.6 | 2.7 |
ORIX Corp. (Japan, Diversified Financial Services) | 1.6 | 1.5 |
Anheuser-Busch InBev SA NV (Belgium, Beverages) | 1.6 | 1.3 |
Novo Nordisk A/S Series B (Denmark, Pharmaceuticals) | 1.6 | 1.4 |
BHP Billiton PLC (United Kingdom, Metals & Mining) | 1.5 | 1.3 |
Australia & New Zealand Banking Group Ltd. (Australia, Commercial Banks) | 1.5 | 1.3 |
Vodafone Group PLC (United Kingdom, Wireless Telecommunication Services) | 1.4 | 1.1 |
British American Tobacco PLC (United Kingdom) (United Kingdom, Tobacco) | 1.4 | 1.8 |
Diageo PLC (United Kingdom, Beverages) | 1.4 | 1.2 |
BNP Paribas SA (France, Commercial Banks) | 1.3 | 0.7 |
| 15.9 | |
Market Sectors as of October 31, 2012 |
| % of fund's
net assets | % of fund's net assets
6 months ago |
Financials | 23.0 | 18.9 |
Consumer Discretionary | 15.5 | 15.8 |
Industrials | 13.5 | 12.6 |
Information Technology | 10.4 | 12.7 |
Consumer Staples | 9.7 | 11.2 |
Health Care | 7.2 | 6.5 |
Materials | 6.4 | 7.5 |
Energy | 5.9 | 6.7 |
Telecommunication Services | 4.2 | 4.9 |
Utilities | 0.9 | 0.7 |
Annual Report
Investments October 31, 2012
Showing Percentage of Net Assets
Common Stocks - 95.5% |
| Shares | | Value (000s) |
Australia - 3.0% |
Australia & New Zealand Banking Group Ltd. | 4,818,449 | | $ 127,296 |
Commonwealth Bank of Australia | 1,009,530 | | 60,519 |
Ramsay Health Care Ltd. | 1,305,776 | | 32,206 |
Spark Infrastructure Group unit | 19,962,099 | | 35,020 |
TOTAL AUSTRALIA | | 255,041 |
Bailiwick of Jersey - 1.9% |
Experian PLC | 5,023,200 | | 86,736 |
Wolseley PLC | 1,576,864 | | 68,935 |
TOTAL BAILIWICK OF JERSEY | | 155,671 |
Belgium - 1.6% |
Anheuser-Busch InBev SA NV | 1,604,727 | | 134,205 |
Bermuda - 0.5% |
Cheung Kong Infrastructure Holdings Ltd. | 6,458,000 | | 37,831 |
Brazil - 1.2% |
Arezzo Industria e Comercio SA | 570,800 | | 10,188 |
Qualicorp SA (a) | 4,567,000 | | 46,861 |
Souza Cruz SA | 1,909,200 | | 24,910 |
Totvs SA | 1,077,500 | | 21,910 |
TOTAL BRAZIL | | 103,869 |
British Virgin Islands - 0.3% |
Gem Diamonds Ltd. (a) | 716,328 | | 1,951 |
Mail.ru Group Ltd. GDR (Reg. S) | 676,800 | | 22,571 |
TOTAL BRITISH VIRGIN ISLANDS | | 24,522 |
Canada - 0.5% |
Goldcorp, Inc. | 571,200 | | 25,822 |
InterOil Corp. (a)(d) | 204,400 | | 13,180 |
TOTAL CANADA | | 39,002 |
Cayman Islands - 0.4% |
Eurasia Drilling Co. Ltd. GDR (Reg. S) | 439,400 | | 15,203 |
Sands China Ltd. | 4,911,200 | | 18,472 |
TOTAL CAYMAN ISLANDS | | 33,675 |
Denmark - 1.9% |
Novo Nordisk A/S Series B | 819,389 | | 131,361 |
William Demant Holding A/S (a) | 337,100 | | 28,993 |
TOTAL DENMARK | | 160,354 |
Common Stocks - continued |
| Shares | | Value (000s) |
France - 8.5% |
Arkema SA | 341,370 | | $ 31,123 |
Atos Origin SA | 384,842 | | 25,843 |
AXA SA | 4,066,402 | | 64,645 |
BNP Paribas SA | 2,238,845 | | 112,622 |
Bureau Veritas SA | 535,700 | | 56,888 |
Credit Agricole SA (a) | 3,474,800 | | 26,158 |
Iliad SA | 339,150 | | 52,245 |
Lafarge SA (Bearer) | 458,700 | | 26,861 |
LVMH Moet Hennessy - Louis Vuitton SA | 428,223 | | 69,602 |
PPR SA | 398,700 | | 70,101 |
Sanofi SA | 953,011 | | 83,701 |
Schneider Electric SA | 1,208,000 | | 75,524 |
Technip SA | 192,300 | | 21,660 |
TOTAL FRANCE | | 716,973 |
Germany - 7.1% |
Aareal Bank AG (a) | 1,044,895 | | 22,414 |
Allianz AG | 385,690 | | 47,822 |
BASF AG | 979,717 | | 81,182 |
Bayerische Motoren Werke AG (BMW) | 959,142 | | 76,394 |
Brenntag AG | 288,900 | | 36,412 |
Fresenius Medical Care AG & Co. KGaA | 384,000 | | 26,981 |
Fresenius SE & Co. KGaA | 161,700 | | 18,444 |
GEA Group AG | 992,880 | | 31,002 |
Gerry Weber International AG (Bearer) | 320,600 | | 14,552 |
GSW Immobilien AG | 497,845 | | 20,484 |
HeidelbergCement Finance AG | 504,300 | | 26,728 |
MTU Aero Engines Holdings AG | 286,300 | | 24,039 |
SAP AG | 1,172,710 | | 85,518 |
Siemens AG | 442,361 | | 44,572 |
Wirecard AG | 1,592,900 | | 36,400 |
TOTAL GERMANY | | 592,944 |
Hong Kong - 1.9% |
AIA Group Ltd. | 15,454,400 | | 61,219 |
HKT Trust / HKT Ltd. unit | 23,518,000 | | 21,818 |
Techtronic Industries Co. Ltd. | 39,683,000 | | 75,576 |
TOTAL HONG KONG | | 158,613 |
India - 1.0% |
Apollo Hospitals Enterprise Ltd. | 442,506 | | 6,415 |
Common Stocks - continued |
| Shares | | Value (000s) |
India - continued |
Housing Development Finance Corp. Ltd. | 3,327,565 | | $ 47,147 |
Titan Industries Ltd. | 6,456,377 | | 31,115 |
TOTAL INDIA | | 84,677 |
Indonesia - 0.7% |
PT Media Nusantara Citra Tbk | 42,573,500 | | 12,522 |
PT Sarana Menara Nusantara Tbk (a) | 6,310,500 | | 12,811 |
PT Tower Bersama Infrastructure Tbk (a) | 55,223,500 | | 28,747 |
TOTAL INDONESIA | | 54,080 |
Ireland - 1.8% |
Accenture PLC Class A | 854,400 | | 57,595 |
James Hardie Industries NV CDI | 6,070,470 | | 58,162 |
Paddy Power PLC (Ireland) | 503,500 | | 37,160 |
TOTAL IRELAND | | 152,917 |
Israel - 0.4% |
Check Point Software Technologies Ltd. (a) | 743,300 | | 33,099 |
Italy - 2.7% |
ENI SpA | 2,799,900 | | 64,428 |
Fiat Industrial SpA | 3,323,832 | | 35,995 |
Prada SpA | 4,029,100 | | 32,856 |
Prysmian SpA | 1,518,800 | | 29,214 |
Saipem SpA | 1,502,203 | | 67,486 |
TOTAL ITALY | | 229,979 |
Japan - 16.1% |
ABC-Mart, Inc. | 1,177,300 | | 51,617 |
Aeon Credit Service Co. Ltd. | 2,050,800 | | 43,518 |
Aozora Bank Ltd. | 7,872,000 | | 22,187 |
Calbee, Inc. | 351,700 | | 32,293 |
Chiyoda Corp. | 2,780,000 | | 44,853 |
Cosmos Pharmaceutical Corp. | 419,800 | | 41,386 |
Credit Saison Co. Ltd. | 881,500 | | 19,357 |
Daito Trust Construction Co. Ltd. | 212,800 | | 21,485 |
Don Quijote Co. Ltd. | 1,818,400 | | 71,638 |
Fanuc Corp. | 290,400 | | 46,236 |
Fast Retailing Co. Ltd. | 210,800 | | 46,950 |
Hitachi Ltd. | 8,642,000 | | 45,792 |
Honda Motor Co. Ltd. | 1,472,400 | | 44,265 |
Japan Tobacco, Inc. | 2,815,200 | | 77,794 |
JS Group Corp. | 1,856,500 | | 41,046 |
Common Stocks - continued |
| Shares | | Value (000s) |
Japan - continued |
JSR Corp. | 2,283,400 | | $ 39,129 |
Kakaku.com, Inc. | 810,600 | | 27,771 |
Keyence Corp. | 304,060 | | 80,671 |
Mitsubishi Estate Co. Ltd. | 2,651,000 | | 52,436 |
Mitsubishi UFJ Financial Group, Inc. | 15,161,400 | | 68,590 |
Nintendo Co. Ltd. | 201,200 | | 25,909 |
ORIX Corp. | 1,321,050 | | 135,696 |
Park24 Co. Ltd. | 1,342,800 | | 23,078 |
Rakuten, Inc. | 7,986,500 | | 71,831 |
Seven Bank Ltd. | 12,837,900 | | 36,666 |
Ship Healthcare Holdings, Inc. | 534,800 | | 17,840 |
So-net M3, Inc. | 5,725 | | 11,001 |
Softbank Corp. | 775,300 | | 24,542 |
Suzuki Motor Corp. | 1,383,700 | | 31,338 |
Unicharm Corp. | 622,700 | | 33,697 |
USS Co. Ltd. | 196,050 | | 20,605 |
TOTAL JAPAN | | 1,351,217 |
Korea (South) - 2.5% |
Hyundai Motor Co. | 273,935 | | 56,404 |
Kia Motors Corp. | 285,255 | | 15,854 |
LG Household & Health Care Ltd. | 56,182 | | 33,029 |
NHN Corp. | 64,289 | | 14,888 |
Orion Corp. | 14,973 | | 14,062 |
Samsung Electronics Co. Ltd. | 64,872 | | 77,943 |
TOTAL KOREA (SOUTH) | | 212,180 |
Luxembourg - 0.6% |
Brait SA | 6,003,514 | | 23,611 |
Samsonite International SA | 12,773,700 | | 26,536 |
TOTAL LUXEMBOURG | | 50,147 |
Netherlands - 3.2% |
AEGON NV | 5,028,800 | | 28,124 |
ASML Holding NV | 1,002,900 | | 55,129 |
Gemalto NV | 609,781 | | 55,025 |
ING Groep NV (Certificaten Van Aandelen) (a) | 5,244,400 | | 46,665 |
LyondellBasell Industries NV Class A | 474,800 | | 25,350 |
Randstad Holding NV | 687,872 | | 22,455 |
Yandex NV (a) | 1,582,600 | | 36,843 |
TOTAL NETHERLANDS | | 269,591 |
Common Stocks - continued |
| Shares | | Value (000s) |
Norway - 1.1% |
DnB NOR ASA | 5,448,955 | | $ 68,049 |
Gjensidige Forsikring ASA | 1,761,200 | | 25,732 |
TOTAL NORWAY | | 93,781 |
Poland - 0.5% |
Eurocash SA | 3,593,990 | | 43,891 |
Qatar - 0.2% |
Commercial Bank of Qatar GDR (Reg. S) | 5,094,802 | | 20,122 |
Russia - 0.6% |
Mobile TeleSystems OJSC sponsored ADR | 2,888,700 | | 49,512 |
South Africa - 0.4% |
Shoprite Holdings Ltd. | 1,552,300 | | 31,921 |
Spain - 2.2% |
Amadeus IT Holding SA Class A | 1,011,100 | | 25,031 |
Banco Bilbao Vizcaya Argentaria SA | 6,088,557 | | 50,876 |
Grifols SA ADR | 1,151,000 | | 28,959 |
Inditex SA | 651,829 | | 83,169 |
TOTAL SPAIN | | 188,035 |
Sweden - 2.4% |
Atlas Copco AB (A Shares) | 2,847,300 | | 70,014 |
Intrum Justitia AB | 1,835,800 | | 26,570 |
Svenska Handelsbanken AB (A Shares) | 1,879,500 | | 64,379 |
Swedish Match Co. AB | 1,250,800 | | 42,618 |
TOTAL SWEDEN | | 203,581 |
Switzerland - 5.3% |
Adecco SA (Reg.) | 574,043 | | 27,762 |
Partners Group Holding AG | 230,056 | | 48,689 |
Roche Holding AG (participation certificate) | 394,417 | | 75,851 |
Schindler Holding AG (participation certificate) | 554,147 | | 73,010 |
SGS SA (Reg.) | 12,520 | | 26,511 |
Swatch Group AG (Bearer) | 36,702 | | 15,188 |
Syngenta AG (Switzerland) | 81,540 | | 31,792 |
UBS AG | 4,126,610 | | 61,914 |
Zurich Financial Services AG | 346,539 | | 85,398 |
TOTAL SWITZERLAND | | 446,115 |
Turkey - 0.1% |
Boyner Buyuk Magazacilik A/S (a)(e) | 4,683,100 | | 10,764 |
United Kingdom - 21.2% |
Aberdeen Asset Management PLC | 5,975,132 | | 31,289 |
Common Stocks - continued |
| Shares | | Value (000s) |
United Kingdom - continued |
Aggreko PLC | 1,385,300 | | $ 48,064 |
Anglo American PLC (United Kingdom) | 774,600 | | 23,788 |
Ashmore Group PLC | 3,169,400 | | 18,602 |
Barclays PLC | 12,279,312 | | 45,406 |
Bellway PLC | 972,300 | | 15,863 |
BG Group PLC | 4,571,872 | | 84,661 |
BHP Billiton PLC | 3,972,023 | | 127,308 |
British American Tobacco PLC (United Kingdom) | 2,438,600 | | 120,954 |
British Land Co. PLC | 5,756,734 | | 49,097 |
Diageo PLC | 4,065,857 | | 116,237 |
Domino's Pizza UK & IRL PLC | 2,378,100 | | 19,399 |
GlaxoSmithKline PLC | 2,658,600 | | 59,572 |
Hikma Pharmaceuticals PLC | 1,964,745 | | 23,447 |
HSBC Holdings PLC (United Kingdom) | 10,856,757 | | 107,040 |
Intertek Group PLC | 748,200 | | 34,037 |
Jazztel PLC (a) | 5,843,900 | | 38,706 |
Legal & General Group PLC | 36,980,100 | | 79,967 |
Lloyds Banking Group PLC (a) | 46,760,800 | | 30,792 |
London Stock Exchange Group PLC | 1,497,400 | | 23,572 |
Meggitt PLC | 6,792,200 | | 42,309 |
Next PLC | 514,144 | | 29,587 |
Ocado Group PLC (a)(d) | 14,388,400 | | 14,976 |
Persimmon PLC | 2,345,100 | | 30,086 |
Rolls-Royce Group PLC | 4,197,715 | | 57,884 |
Rolls-Royce Group PLC Class C | 319,026,340 | | 515 |
Rotork PLC | 717,800 | | 26,387 |
Royal Dutch Shell PLC Class B (United Kingdom) | 6,206,463 | | 219,543 |
SABMiller PLC | 1,096,800 | | 46,984 |
Standard Chartered PLC (United Kingdom) | 1,697,617 | | 40,093 |
Taylor Wimpey PLC | 21,518,200 | | 21,217 |
The Weir Group PLC | 747,600 | | 21,016 |
Ultra Electronics Holdings PLC | 614,667 | | 16,793 |
Vodafone Group PLC | 45,146,543 | | 122,602 |
TOTAL UNITED KINGDOM | | 1,787,793 |
United States of America - 3.7% |
Beam, Inc. | 387,400 | | 21,524 |
Citrix Systems, Inc. (a) | 303,600 | | 18,766 |
Cognizant Technology Solutions Corp. Class A (a) | 405,700 | | 27,040 |
Dollar General Corp. (a) | 378,800 | | 18,417 |
GNC Holdings, Inc. | 770,900 | | 29,811 |
MasterCard, Inc. Class A | 160,100 | | 73,795 |
Common Stocks - continued |
| Shares | | Value (000s) |
United States of America - continued |
Michael Kors Holdings Ltd. | 542,300 | | $ 29,658 |
Royal Gold, Inc. | 394,800 | | 34,774 |
Total System Services, Inc. | 1,094,700 | | 24,620 |
Watson Pharmaceuticals, Inc. (a) | 308,100 | | 26,481 |
Workday, Inc. | 102,600 | | 4,976 |
TOTAL UNITED STATES OF AMERICA | | 309,862 |
TOTAL COMMON STOCKS (Cost $7,245,196) |
8,035,964
|
Nonconvertible Preferred Stocks - 1.2% |
| | | |
Germany - 1.2% |
Volkswagen AG
(Cost $69,724) | 478,400 | |
98,964
|
Investment Companies - 0.0% |
| | | |
Cyprus - 0.0% |
Aisi Realty Public Ltd. (a)
(Cost $7,371) | 529,830 | |
628
|
Money Market Funds - 3.2% |
| | | |
Fidelity Cash Central Fund, 0.19% (b) | 250,136,921 | | 250,137 |
Fidelity Securities Lending Cash Central Fund, 0.19% (b)(c) | 24,238,785 | | 24,239 |
TOTAL MONEY MARKET FUNDS (Cost $274,376) |
274,376
|
TOTAL INVESTMENT PORTFOLIO - 99.9% (Cost $7,596,667) | | 8,409,932 |
NET OTHER ASSETS (LIABILITIES) - 0.1% | | 6,607 |
NET ASSETS - 100% | $ 8,416,539 |
Legend |
(a) Non-income producing |
(b) Affiliated fund that is available only to investment companies and other accounts managed by Fidelity Investments. The rate quoted is the annualized seven-day yield of the fund at period end. A complete unaudited listing of the fund's holdings as of its most recent quarter end is available upon request. In addition, each Fidelity Central Fund's financial statements, which are not covered by the Fund's Report of Independent Registered Public Accounting Firm, are available on the SEC's website or upon request. |
(c) Investment made with cash collateral received from securities on loan. |
(d) Security or a portion of the security is on loan at period end. |
(e) Affiliated company |
Affiliated Central Funds |
Information regarding fiscal year to date income earned by the Fund from investments in Fidelity Central Funds is as follows: |
Fund | Income earned
(Amounts in thousands) |
Fidelity Cash Central Fund | $ 136 |
Fidelity Securities Lending Cash Central Fund | 4,230 |
Total | $ 4,366 |
Other Affiliated Issuers |
An affiliated company is a company in which the Fund has ownership of at least 5% of the voting securities. Fiscal year to date transactions with companies which are or were affiliates are as follows: |
Affiliate
(Amounts in thousands) | Value, beginning of period | Purchases | Sales Proceeds | Dividend Income | Value,
end of
period |
Aisi Realty Public Ltd. | $ 240 | $ 469 | $ - | $ - | $ - |
Boyner Buyuk Magazacilik A/S | 10,096 | - | 1,569 | - | 10,764 |
China Kanghui Holdings sponsored ADR | 27,375 | - | 53,149 | - | - |
Total | $ 37,711 | $ 469 | $ 54,718 | $ - | $ 10,764 |
Other Information |
Categorizations in the Schedule of Investments are based on country or territory of incorporation. |
The following is a summary of the inputs used, as of October 31, 2012, involving the Fund's assets and liabilities carried at fair value. The inputs or methodology used for valuing securities may not be an indication of the risk associated with investing in those securities. For more information on valuation inputs, and their aggregation into the levels used in the table below, please refer to the Security Valuation section in the accompanying Notes to Financial Statements. |
Valuation Inputs at Reporting Date: |
Description
(Amounts in thousands) | Total | Level 1 | Level 2 | Level 3 |
Investments in Securities: | | | | |
Equities: | | | | |
Consumer Discretionary | $ 1,302,675 | $ 1,258,410 | $ 44,265 | $ - |
Consumer Staples | 815,505 | 444,109 | 371,396 | - |
Energy | 486,161 | 202,190 | 283,971 | - |
Financials | 1,939,678 | 1,500,271 | 439,407 | - |
Health Care | 618,113 | 316,498 | 301,615 | - |
Industrials | 1,137,857 | 1,093,285 | 44,572 | - |
Information Technology | 877,135 | 791,617 | 85,518 | - |
Materials | 533,970 | 374,870 | 159,100 | - |
Telecommunication Services | 350,983 | 228,381 | 122,602 | - |
Utilities | 72,851 | 72,851 | - | - |
Investment Companies | 628 | 628 | - | - |
Money Market Funds | 274,376 | 274,376 | - | - |
Total Investments in Securities: | $ 8,409,932 | $ 6,557,486 | $ 1,852,446 | $ - |
The following is a summary of transfers between Level 1 and Level 2 for the period ended October 31, 2012. Transfers are assumed to have occurred at the beginning of the period, and are primarily attributable to the valuation techniques used for foreign equity securities, as discussed in the accompanying Notes to Financial Statements: |
Transfers | Total (000s) |
Level 1 to Level 2 | $ 0 |
Level 2 to Level 1 | $ 1,546,324 |
See accompanying notes which are an integral part of the financial statements.
Annual Report
Statement of Assets and Liabilities
Amounts in thousands (except per-share amounts) | October 31, 2012 |
| | |
Assets | | |
Investment in securities, at value (including securities loaned of $22,961) - See accompanying schedule: Unaffiliated issuers (cost $7,310,529) | $ 8,124,792 | |
Fidelity Central Funds (cost $274,376) | 274,376 | |
Other affiliated issuers (cost $11,762) | 10,764 | |
Total Investments (cost $7,596,667) | | $ 8,409,932 |
Receivable for investments sold | | 58,219 |
Receivable for fund shares sold | | 9,069 |
Dividends receivable | | 15,860 |
Distributions receivable from Fidelity Central Funds | | 76 |
Other receivables | | 4,417 |
Total assets | | 8,497,573 |
| | |
Liabilities | | |
Payable for investments purchased | $ 8,942 | |
Payable for fund shares redeemed | 39,507 | |
Accrued management fee | 6,216 | |
Distribution and service plan fees payable | 113 | |
Other affiliated payables | 1,450 | |
Other payables and accrued expenses | 567 | |
Collateral on securities loaned, at value | 24,239 | |
Total liabilities | | 81,034 |
| | |
Net Assets | | $ 8,416,539 |
Net Assets consist of: | | |
Paid in capital | | $ 9,152,089 |
Undistributed net investment income | | 126,507 |
Accumulated undistributed net realized gain (loss) on investments and foreign currency transactions | | (1,674,222) |
Net unrealized appreciation (depreciation) on investments and assets and liabilities in foreign currencies | | 812,165 |
Net Assets | | $ 8,416,539 |
See accompanying notes which are an integral part of the financial statements.
Annual Report
Financial Statements - continued
Statement of Assets and Liabilities - continued
Amounts in thousands (except per-share amounts) | October 31, 2012 |
| | |
Calculation of Maximum Offering Price
Class A:
Net Asset Value and redemption price per share ($298,501 ÷ 9,429.0 shares) | | $ 31.66 |
| | |
Maximum offering price per share (100/94.25 of $31.66) | | $ 33.59 |
Class T:
Net Asset Value and redemption price per share ($45,884 ÷ 1,460.2 shares) | | $ 31.42 |
| | |
Maximum offering price per share (100/96.50 of $31.42) | | $ 32.56 |
Class B:
Net Asset Value and offering price per share ($7,536 ÷ 240.9 shares)A | | $ 31.28 |
| | |
Class C:
Net Asset Value and offering price per share ($29,746 ÷ 949.8 shares)A | | $ 31.32 |
| | |
International Discovery:
Net Asset Value, offering price and redemption price per share ($5,964,762 ÷ 186,908.1 shares) | | $ 31.91 |
| | |
Class K:
Net Asset Value, offering price and redemption price per share ($1,775,900 ÷ 55,719.4 shares) | | $ 31.87 |
| | |
Institutional Class:
Net Asset Value, offering price and redemption price per share ($294,210 ÷ 9,232.8 shares) | | $ 31.87 |
A Redemption price per share is equal to net asset value less any applicable contingent deferred sales charge.
See accompanying notes which are an integral part of the financial statements.
Annual Report
Statement of Operations
Amounts in thousands | Year ended October 31, 2012 |
| | |
Investment Income | | |
Dividends | | $ 229,743 |
Interest | | 19 |
Income from Fidelity Central Funds | | 4,366 |
Income before foreign taxes withheld | | 234,128 |
Less foreign taxes withheld | | (11,538) |
Total income | | 222,590 |
| | |
Expenses | | |
Management fee
Basic fee | $ 58,065 | |
Performance adjustment | 2,707 | |
Transfer agent fees | 16,195 | |
Distribution and service plan fees | 1,384 | |
Accounting and security lending fees | 1,720 | |
Custodian fees and expenses | 1,316 | |
Independent trustees' compensation | 54 | |
Registration fees | 181 | |
Audit | 114 | |
Legal | 42 | |
Interest | 5 | |
Miscellaneous | 95 | |
Total expenses before reductions | 81,878 | |
Expense reductions | (2,500) | 79,378 |
Net investment income (loss) | | 143,212 |
Realized and Unrealized Gain (Loss) Net realized gain (loss) on: | | |
Investment securities: | | |
Unaffiliated issuers | (217,363) | |
Other affiliated issuers | 11,560 | |
Foreign currency transactions | (1,776) | |
Total net realized gain (loss) | | (207,579) |
Change in net unrealized appreciation (depreciation) on: Investment securities (net of decrease in deferred foreign taxes of $1,062) | 763,571 | |
Assets and liabilities in foreign currencies | (1,430) | |
Total change in net unrealized appreciation (depreciation) | | 762,141 |
Net gain (loss) | | 554,562 |
Net increase (decrease) in net assets resulting from operations | | $ 697,774 |
See accompanying notes which are an integral part of the financial statements.
Annual Report
Financial Statements - continued
Statement of Changes in Net Assets
Amounts in thousands | Year ended
October 31,
2012 | Year ended
October 31,
2011 |
Increase (Decrease) in Net Assets | | |
Operations | | |
Net investment income (loss) | $ 143,212 | $ 161,608 |
Net realized gain (loss) | (207,579) | 501,938 |
Change in net unrealized appreciation (depreciation) | 762,141 | (1,247,522) |
Net increase (decrease) in net assets resulting
from operations | 697,774 | (583,976) |
Distributions to shareholders from net investment income | (118,968) | (149,936) |
Distributions to shareholders from net realized gain | - | (48,090) |
Total distributions | (118,968) | (198,026) |
Share transactions - net increase (decrease) | (915,362) | (537,341) |
Redemption fees | 128 | 160 |
Total increase (decrease) in net assets | (336,428) | (1,319,183) |
| | |
Net Assets | | |
Beginning of period | 8,752,967 | 10,072,150 |
End of period (including undistributed net investment income of $126,507 and undistributed net investment income of $102,433, respectively) | $ 8,416,539 | $ 8,752,967 |
See accompanying notes which are an integral part of the financial statements.
Annual Report
Financial Highlights - Class A
Years ended October 31, | 2012 | 2011 | 2010 | 2009 | 2008 |
Selected Per-Share Data | | | | | |
Net asset value, beginning of period | $ 29.43 | $ 32.07 | $ 28.57 | $ 23.68 | $ 47.34 |
Income from Investment Operations | | | | | |
Net investment income (loss) C | .41 | .42 | .31 | .31 | .46 |
Net realized and unrealized gain (loss) | 2.11 | (2.52) | 3.51 | 4.84 | (22.08) |
Total from investment operations | 2.52 | (2.10) | 3.82 | 5.15 | (21.62) |
Distributions from net investment income | (.29) | (.38) | (.28) | (.26) | (.37) |
Distributions from net realized gain | - | (.16) | (.04) | - | (1.67) |
Total distributions | (.29) | (.54) | (.32) | (.26) | (2.04) |
Redemption fees added to paid in capital C, G | - | - | - | - | - |
Net asset value, end of period | $ 31.66 | $ 29.43 | $ 32.07 | $ 28.57 | $ 23.68 |
Total Return A, B | 8.70% | (6.71)% | 13.43% | 22.14% | (47.65)% |
Ratios to Average Net Assets D, F | | | | | |
Expenses before reductions | 1.34% | 1.30% | 1.33% | 1.37% | 1.32% |
Expenses net of fee waivers, if any | 1.34% | 1.29% | 1.33% | 1.37% | 1.32% |
Expenses net of all reductions | 1.31% | 1.25% | 1.28% | 1.32% | 1.29% |
Net investment income (loss) | 1.41% | 1.31% | 1.06% | 1.28% | 1.27% |
Supplemental Data | | | | | |
Net assets, end of period (in millions) | $ 299 | $ 320 | $ 392 | $ 414 | $ 380 |
Portfolio turnover rate E | 68% | 75% | 82% | 98% | 79% |
A Total returns would have been lower if certain expenses had not been reduced during the applicable periods shown.
B Total returns do not include the effect of the sales charges.
C Calculated based on average shares outstanding during the period.
D Fees and expenses of any underlying Fidelity Central Funds are not included in the Fund's expense ratio. The Fund indirectly bears its proportionate share of the expenses of any underlying Fidelity Central Funds.
E Amount does not include the portfolio activity of any underlying Fidelity Central Funds.
F Expense ratios reflect operating expenses of the class. Expenses before reductions do not reflect amounts reimbursed by the investment adviser or reductions from brokerage service arrangements or reductions from other expense offset arrangements and do not represent the amount paid by the class during periods when reimbursements or reductions occur. Expenses net of fee waivers reflect expenses after reimbursement by the investment adviser but prior to reductions from brokerage service arrangements or other expense offset arrangements. Expenses net of all reductions represent the net expenses paid by the class.
G Amount represents less than $.01 per share.
See accompanying notes which are an integral part of the financial statements.
Annual Report
Financial Highlights - Class T
Years ended October 31, | 2012 | 2011 | 2010 | 2009 | 2008 |
Selected Per-Share Data | | | | | |
Net asset value, beginning of period | $ 29.18 | $ 31.81 | $ 28.35 | $ 23.49 | $ 47.06 |
Income from Investment Operations | | | | | |
Net investment income (loss) C | .34 | .34 | .23 | .24 | .33 |
Net realized and unrealized gain (loss) | 2.09 | (2.51) | 3.48 | 4.81 | (21.94) |
Total from investment operations | 2.43 | (2.17) | 3.71 | 5.05 | (21.61) |
Distributions from net investment income | (.19) | (.30) | (.21) | (.19) | (.29) |
Distributions from net realized gain | - | (.16) | (.04) | - | (1.67) |
Total distributions | (.19) | (.46) | (.25) | (.19) | (1.96) |
Redemption fees added to paid in capital C, G | - | - | - | - | - |
Net asset value, end of period | $ 31.42 | $ 29.18 | $ 31.81 | $ 28.35 | $ 23.49 |
Total Return A, B | 8.41% | (6.96)% | 13.14% | 21.79% | (47.84)% |
Ratios to Average Net Assets D, F | | | | | |
Expenses before reductions | 1.59% | 1.56% | 1.60% | 1.65% | 1.68% |
Expenses net of fee waivers, if any | 1.59% | 1.55% | 1.60% | 1.65% | 1.68% |
Expenses net of all reductions | 1.56% | 1.51% | 1.56% | 1.60% | 1.64% |
Net investment income (loss) | 1.16% | 1.05% | .79% | 1.00% | .91% |
Supplemental Data | | | | | |
Net assets, end of period (in millions) | $ 46 | $ 61 | $ 92 | $ 83 | $ 64 |
Portfolio turnover rate E | 68% | 75% | 82% | 98% | 79% |
A Total returns would have been lower if certain expenses had not been reduced during the applicable periods shown.
B Total returns do not include the effect of the sales charges.
C Calculated based on average shares outstanding during the period.
D Fees and expenses of any underlying Fidelity Central Funds are not included in the Fund's expense ratio. The Fund indirectly bears its proportionate share of the expenses of any underlying Fidelity Central Funds.
E Amount does not include the portfolio activity of any underlying Fidelity Central Funds.
F Expense ratios reflect operating expenses of the class. Expenses before reductions do not reflect amounts reimbursed by the investment adviser or reductions from brokerage service arrangements or reductions from other expense offset arrangements and do not represent the amount paid by the class during periods when reimbursements or reductions occur. Expenses net of fee waivers reflect expenses after reimbursement by the investment adviser but prior to reductions from brokerage service arrangements or other expense offset arrangements. Expenses net of all reductions represent the net expenses paid by the class.
G Amount represents less than $.01 per share.
See accompanying notes which are an integral part of the financial statements.
Annual Report
Financial Highlights - Class B
Years ended October 31, | 2012 | 2011 | 2010 | 2009 | 2008 |
Selected Per-Share Data | | | | | |
Net asset value, beginning of period | $ 29.02 | $ 31.60 | $ 28.18 | $ 23.25 | $ 46.70 |
Income from Investment Operations | | | | | |
Net investment income (loss) C | .19 | .17 | .08 | .12 | .15 |
Net realized and unrealized gain (loss) | 2.09 | (2.48) | 3.44 | 4.81 | (21.77) |
Total from investment operations | 2.28 | (2.31) | 3.52 | 4.93 | (21.62) |
Distributions from net investment income | (.02) | (.12) | (.06) | - | (.16) |
Distributions from net realized gain | - | (.16) | (.04) | - | (1.67) |
Total distributions | (.02) | (.27) H | (.10) | - | (1.83) |
Redemption fees added to paid in capital C, G | - | - | - | - | - |
Net asset value, end of period | $ 31.28 | $ 29.02 | $ 31.60 | $ 28.18 | $ 23.25 |
Total Return A, B | 7.85% | (7.39)% | 12.52% | 21.20% | (48.11)% |
Ratios to Average Net Assets D, F | | | | | |
Expenses before reductions | 2.09% | 2.06% | 2.12% | 2.16% | 2.19% |
Expenses net of fee waivers, if any | 2.09% | 2.06% | 2.12% | 2.16% | 2.19% |
Expenses net of all reductions | 2.06% | 2.02% | 2.08% | 2.11% | 2.15% |
Net investment income (loss) | .66% | .54% | .27% | .49% | .40% |
Supplemental Data | | | | | |
Net assets, end of period (in millions) | $ 8 | $ 10 | $ 14 | $ 16 | $ 15 |
Portfolio turnover rate E | 68% | 75% | 82% | 98% | 79% |
A Total returns would have been lower if certain expenses had not been reduced during the applicable periods shown.
B Total returns do not include the effect of the contingent deferred sales charge.
C Calculated based on average shares outstanding during the period.
D Fees and expenses of any underlying Fidelity Central Funds are not included in the Fund's expense ratio. The Fund indirectly bears its proportionate share of the expenses of any underlying Fidelity Central Funds.
E Amount does not include the portfolio activity of any underlying Fidelity Central Funds.
F Expense ratios reflect operating expenses of the class. Expenses before reductions do not reflect amounts reimbursed by the investment adviser or reductions from brokerage service arrangements or reductions from other expense offset arrangements and do not represent the amount paid by the class during periods when reimbursements or reductions occur. Expenses net of fee waivers reflect expenses after reimbursement by the investment adviser but prior to reductions from brokerage service arrangements or other expense offset arrangements. Expenses net of all reductions represent the net expenses paid by the class.
G Amount represents less than $.01 per share.
H Total distributions of $.27 per share is comprised of distributions from net investment income of $.115 and distributions from net realized gain of $.155 per share.
See accompanying notes which are an integral part of the financial statements.
Annual Report
Financial Highlights - Class C
Years ended October 31, | 2012 | 2011 | 2010 | 2009 | 2008 |
Selected Per-Share Data | | | | | |
Net asset value, beginning of period | $ 29.08 | $ 31.68 | $ 28.23 | $ 23.31 | $ 46.82 |
Income from Investment Operations | | | | | |
Net investment income (loss) C | .19 | .18 | .09 | .12 | .15 |
Net realized and unrealized gain (loss) | 2.09 | (2.49) | 3.45 | 4.82 | (21.82) |
Total from investment operations | 2.28 | (2.31) | 3.54 | 4.94 | (21.67) |
Distributions from net investment income | (.04) | (.14) | (.05) | (.02) | (.17) |
Distributions from net realized gain | - | (.16) | (.04) | - | (1.67) |
Total distributions | (.04) | (.29) H | (.09) | (.02) | (1.84) |
Redemption fees added to paid in capital C, G | - | - | - | - | - |
Net asset value, end of period | $ 31.32 | $ 29.08 | $ 31.68 | $ 28.23 | $ 23.31 |
Total Return A, B | 7.86% | (7.37)% | 12.54% | 21.22% | (48.10)% |
Ratios to Average Net Assets D, F | | | | | |
Expenses before reductions | 2.09% | 2.05% | 2.09% | 2.14% | 2.17% |
Expenses net of fee waivers, if any | 2.09% | 2.04% | 2.09% | 2.14% | 2.17% |
Expenses net of all reductions | 2.06% | 2.00% | 2.05% | 2.09% | 2.13% |
Net investment income (loss) | .66% | .56% | .30% | .51% | .42% |
Supplemental Data | | | | | |
Net assets, end of period (in millions) | $ 30 | $ 33 | $ 44 | $ 43 | $ 36 |
Portfolio turnover rate E | 68% | 75% | 82% | 98% | 79% |
A Total returns would have been lower if certain expenses had not been reduced during the applicable periods shown.
B Total returns do not include the effect of the contingent deferred sales charge.
C Calculated based on average shares outstanding during the period.
D Fees and expenses of any underlying Fidelity Central Funds are not included in the Fund's expense ratio. The Fund indirectly bears its proportionate share of the expenses of any underlying Fidelity Central Funds.
E Amount does not include the portfolio activity of any underlying Fidelity Central Funds.
F Expense ratios reflect operating expenses of the class. Expenses before reductions do not reflect amounts reimbursed by the investment adviser or reductions from brokerage service arrangements or reductions from other expense offset arrangements and do not represent the amount paid by the class during periods when reimbursements or reductions occur. Expenses net of fee waivers reflect expenses after reimbursement by the investment adviser but prior to reductions from brokerage service arrangements or other expense offset arrangements. Expenses net of all reductions represent the net expenses paid by the class.
G Amount represents less than $.01 per share.
H Total distributions of $.29 per share is comprised of distributions from net investment income of $.137 and distributions from net realized gain of $.155 per share.
See accompanying notes which are an integral part of the financial statements.
Annual Report
Financial Highlights - International Discovery
Years ended October 31, | 2012 | 2011 | 2010 | 2009 | 2008 |
Selected Per-Share Data | | | | | |
Net asset value, beginning of period | $ 29.69 | $ 32.34 | $ 28.79 | $ 23.88 | $ 47.68 |
Income from Investment Operations | | | | | |
Net investment income (loss) B | .51 | .53 | .40 | .37 | .57 |
Net realized and unrealized gain (loss) | 2.12 | (2.54) | 3.54 | 4.88 | (22.29) |
Total from investment operations | 2.63 | (2.01) | 3.94 | 5.25 | (21.72) |
Distributions from net investment income | (.41) | (.48) | (.35) | (.34) | (.41) |
Distributions from net realized gain | - | (.16) | (.04) | - | (1.67) |
Total distributions | (.41) | (.64) | (.39) | (.34) | (2.08) |
Redemption fees added to paid in capital B,F | - | - | - | - | - |
Net asset value, end of period | $ 31.91 | $ 29.69 | $ 32.34 | $ 28.79 | $ 23.88 |
Total Return A | 9.03% | (6.39)% | 13.76% | 22.47% | (47.55)% |
Ratios to Average Net Assets C, E | | | | | |
Expenses before reductions | 1.01% | .97% | 1.05% | 1.12% | 1.09% |
Expenses net of fee waivers, if any | 1.01% | .96% | 1.05% | 1.12% | 1.09% |
Expenses net of all reductions | .98% | .92% | 1.00% | 1.07% | 1.05% |
Net investment income (loss) | 1.73% | 1.64% | 1.35% | 1.53% | 1.51% |
Supplemental Data | | | | | |
Net assets, end of period (in millions) | $ 5,965 | $ 6,806 | $ 8,133 | $ 8,114 | $ 6,999 |
Portfolio turnover rate D | 68% | 75% | 82% | 98% | 79% |
A Total returns would have been lower if certain expenses had not been reduced during the applicable periods shown.
B Calculated based on average shares outstanding during the period.
C Fees and expenses of any underlying Fidelity Central Funds are not included in the Fund's expense ratio. The Fund indirectly bears its proportionate share of the expenses of any underlying Fidelity Central Funds.
D Amount does not include the portfolio activity of any underlying Fidelity Central Funds.
E Expense ratios reflect operating expenses of the class. Expenses before reductions do not reflect amounts reimbursed by the investment adviser or reductions from brokerage service arrangements or reductions from other expense offset arrangements and do not represent the amount paid by the class during periods when reimbursements or reductions occur. Expenses net of fee waivers reflect expenses after reimbursement by the investment adviser but prior to reductions from brokerage service arrangements or other expense offset arrangements. Expenses net of all reductions represent the net expenses paid by the class.
F Amount represents less than $.01 per share.
See accompanying notes which are an integral part of the financial statements.
Annual Report
Financial Highlights - Class K
Years ended October 31, | 2012 | 2011 | 2010 | 2009 | 2008 G |
Selected Per-Share Data | | | | | |
Net asset value, beginning of period | $ 29.66 | $ 32.32 | $ 28.78 | $ 23.90 | $ 40.32 |
Income from Investment Operations | | | | | |
Net investment income (loss) D | .57 | .58 | .46 | .44 | .10 |
Net realized and unrealized gain (loss) | 2.11 | (2.54) | 3.53 | 4.86 | (16.52) |
Total from investment operations | 2.68 | (1.96) | 3.99 | 5.30 | (16.42) |
Distributions from net investment income | (.47) | (.55) | (.41) | (.42) | - |
Distributions from net realized gain | - | (.16) | (.04) | - | - |
Total distributions | (.47) | (.70) J | (.45) | (.42) | - |
Redemption fees added to paid in capital D, I | - | - | - | - | - |
Net asset value, end of period | $ 31.87 | $ 29.66 | $ 32.32 | $ 28.78 | $ 23.90 |
Total Return B, C | 9.24% | (6.24)% | 13.96% | 22.80% | (40.72)% |
Ratios to Average Net Assets E, H | | | | | |
Expenses before reductions | .83% | .80% | .84% | .88% | .93% A |
Expenses net of fee waivers, if any | .83% | .79% | .84% | .88% | .93% A |
Expenses net of all reductions | .80% | .75% | .79% | .83% | .89% A |
Net investment income (loss) | 1.91% | 1.81% | 1.55% | 1.77% | .83% A |
Supplemental Data | | | | | |
Net assets, end of period (in millions) | $ 1,776 | $ 1,245 | $ 1,078 | $ 674 | $ 145 |
Portfolio turnover rate F | 68% | 75% | 82% | 98% | 79% |
A Annualized
B Total returns for periods of less than one year are not annualized.
C Total returns would have been lower if certain expenses had not been reduced during the applicable periods shown.
D Calculated based on average shares outstanding during the period.
E Fees and expenses of any underlying Fidelity Central Funds are not included in the Fund's expense ratio. The Fund indirectly bears its proportionate share of the expenses of any underlying Fidelity Central Funds.
F Amount does not include the portfolio activity of any underlying Fidelity Central Funds.
G For the period May 9, 2008 (commencement of sale of shares) to October 31, 2008.
H Expense ratios reflect operating expenses of the class. Expenses before reductions do not reflect amounts reimbursed by the investment adviser or reductions from brokerage service arrangements or reductions from other expense offset arrangements and do not represent the amount paid by the class during periods when reimbursements or reductions occur. Expense ratios before reductions for start-up periods may not be representative of longer-term operating periods. Expenses net of fee waivers reflect expenses after reimbursement by the investment adviser but prior to reductions from brokerage service arrangements or other expense offset arrangements. Expenses net of all reductions represent the net expenses paid by the class.
I Amount represents less than $.01 per share.
J Total distributions of $.70 per share is comprised of distributions from net investment income of $.548 and distributions from net realized gain of $.155 per share.
See accompanying notes which are an integral part of the financial statements.
Annual Report
Financial Highlights - Institutional Class
Years ended October 31, | 2012 | 2011 | 2010 | 2009 | 2008 |
Selected Per-Share Data | | | | | |
Net asset value, beginning of period | $ 29.65 | $ 32.31 | $ 28.77 | $ 23.91 | $ 47.73 |
Income from Investment Operations | | | | | |
Net investment income (loss) B | .52 | .54 | .41 | .39 | .53 |
Net realized and unrealized gain (loss) | 2.11 | (2.55) | 3.55 | 4.86 | (22.24) |
Total from investment operations | 2.63 | (2.01) | 3.96 | 5.25 | (21.71) |
Distributions from net investment income | (.41) | (.50) | (.38) | (.39) | (.44) |
Distributions from net realized gain | - | (.16) | (.04) | - | (1.67) |
Total distributions | (.41) | (.65) G | (.42) | (.39) | (2.11) |
Redemption fees added to paid in capital B, F | - | - | - | - | - |
Net asset value, end of period | $ 31.87 | $ 29.65 | $ 32.31 | $ 28.77 | $ 23.91 |
Total Return A | 9.07% | (6.39)% | 13.84% | 22.52% | (47.51)% |
Ratios to Average Net Assets C, E | | | | | |
Expenses before reductions | 1.00% | .95% | .99% | 1.05% | 1.05% |
Expenses net of fee waivers, if any | 1.00% | .94% | .99% | 1.05% | 1.05% |
Expenses net of all reductions | .97% | .90% | .95% | 1.00% | 1.01% |
Net investment income (loss) | 1.75% | 1.66% | 1.40% | 1.60% | 1.54% |
Supplemental Data | | | | | |
Net assets, end of period (in millions) | $ 294 | $ 278 | $ 319 | $ 267 | $ 159 |
Portfolio turnover rate D | 68% | 75% | 82% | 98% | 79% |
A Total returns would have been lower if certain expenses had not been reduced during the applicable periods shown.
B Calculated based on average shares outstanding during the period.
C Fees and expenses of any underlying Fidelity Central Funds are not included in the Fund's expense ratio. The Fund indirectly bears its proportionate share of the expenses of any underlying Fidelity Central Funds.
D Amount does not include the portfolio activity of any underlying Fidelity Central Funds.
E Expense ratios reflect operating expenses of the class. Expenses before reductions do not reflect amounts reimbursed by the investment adviser or reductions from brokerage service arrangements or reductions from other expense offset arrangements and do not represent the amount paid by the class during periods when reimbursements or reductions occur. Expenses net of fee waivers reflect expenses after reimbursement by the investment adviser but prior to reductions from brokerage service arrangements or other expense offset arrangements. Expenses net of all reductions represent the net expenses paid by the class.
F Amount represents less than $.01 per share.
G Total distributions of $.65 per share is comprised of distributions from net investment income of $.497 and distributions from net realized gain of $.155 per share.
See accompanying notes which are an integral part of the financial statements.
Annual Report
Notes to Financial Statements
For the period ended October 31, 2012
(Amounts in thousands except percentages)
1. Organization.
Fidelity International Discovery Fund (the Fund) is a fund of Fidelity Investment Trust (the Trust) and is authorized to issue an unlimited number of shares. The Trust is registered under the Investment Company Act of 1940, as amended (the 1940 Act), as an open-end management investment company organized as a Massachusetts business trust. The Fund offers Class A, Class T, Class C, International Discovery, Class K, and Institutional Class shares, each of which, along with Class B shares, has equal rights as to assets and voting privileges. Effective after the close of business on September 1, 2010, Class B shares were closed to new accounts and additional purchases, except for exchanges and reinvestments. Each class has exclusive voting rights with respect to matters that affect that class. Class B shares will automatically convert to Class A shares after a holding period of seven years from the initial date of purchase. Investment income, realized and unrealized capital gains and losses, the common expenses of the Fund, and certain fund-level expense reductions, if any, are allocated on a pro-rata basis to each class based on the relative net assets of each class to the total net assets of the Fund. Each class differs with respect to transfer agent and distribution and service plan fees incurred. Certain expense reductions may also differ by class.
2. Investments in Fidelity Central Funds.
The Fund invests in Fidelity Central Funds, which are open-end investment companies available only to other investment companies and accounts managed by Fidelity Management & Research Company (FMR) and its affiliates. The Fund's Schedule of Investments lists each of the Fidelity Central Funds held as of period end, if any, as an investment of the Fund, but does not include the underlying holdings of each Fidelity Central Fund. As an Investing Fund, the Fund indirectly bears its proportionate share of the expenses of the underlying Fidelity Central Funds.
The Money Market Central Funds seek preservation of capital and current income and are managed by Fidelity Investments Money Management, Inc. (FIMM), an affiliate of FMR.
A complete unaudited list of holdings for each Fidelity Central Fund is available upon request or at the Securities and Exchange Commission (the SEC) web site at www.sec.gov. In addition, the financial statements of the Fidelity Central Funds, which are not covered by the Fund's Report of Independent Registered Public Accounting Firm, are available on the SEC web site or upon request.
Annual Report
3. Significant Accounting Policies.
The financial statements have been prepared in conformity with accounting principles generally accepted in the United States of America (GAAP), which require management to make certain estimates and assumptions at the date of the financial statements. Actual results could differ from those estimates. Subsequent events, if any, through the date that the financial statements were issued have been evaluated in the preparation of the financial statements. The following summarizes the significant accounting policies of the Fund:
Security Valuation. Investments are valued as of 4:00 p.m. Eastern time on the last calendar day of the period. In accordance with valuation policies and procedures approved by the Board of Trustees (the Board), the Fund attempts to obtain prices from one or more third party pricing vendors or brokers to value its investments. When current market prices, quotations or rates are not readily available or reliable, securities will be fair valued in good faith by the FMR Fair Value Committee (the Committee), in accordance with procedures adopted by the Fund's Board. Factors used in determining fair value vary by security type and may include market or security specific events. The frequency with which these procedures are used cannot be predicted and they may be utilized to a significant extent. The Committee oversees the Fund's valuation policies and procedures and is responsible for approving and reporting to the Board all fair value determinations.
The Fund categorizes the inputs to valuation techniques used to value its investments into a disclosure hierarchy consisting of three levels as shown below:
Level 1 - quoted prices in active markets for identical investments
Level 2 - other significant observable inputs (including quoted prices for similar investments, interest rates, prepayment speeds, etc.)
Level 3 - unobservable inputs (including the Fund's own assumptions based on the best information available)
Valuation techniques used to value the Fund's investments by major category are as follows:
Equity securities, including restricted securities, for which market quotations are readily available, are valued at the last reported sale price or official closing price as reported by a third party pricing vendor on the primary market or exchange on which they are traded and are categorized as Level 1 in the hierarchy. In the event there were no sales during the day or closing prices are not available, securities are valued at the last quoted bid price or may be valued using the last available price and are generally categorized as Level 2 in the hierarchy. For foreign equity securities, when significant market or security specific events arise, comparisons to the valuation of American Depositary Receipts
Annual Report
Notes to Financial Statements - continued
(Amounts in thousands except percentages)
3. Significant Accounting Policies - continued
Security Valuation - continued
(ADRs), futures contracts, Exchange-Traded Funds (ETFs) and certain indexes as well as quoted prices for similar securities are used and are categorized as Level 2 in the hierarchy. Utilizing these techniques may result in transfers between Level 1 and Level 2.
Investments in open-end mutual funds, including the Fidelity Central Funds, are valued at their closing net asset value (NAV) each business day and are categorized as Level 1 in the hierarchy.
Changes in valuation techniques may result in transfers in or out of an assigned level within the disclosure hierarchy. The aggregate value of investments by input level, as of October 31, 2012, including information on transfers between Levels 1 and 2, is included at the end of the Fund's Schedule of Investments.
Foreign Currency Translation. The Fund may use foreign currency contracts to facilitate transactions in foreign-denominated securities. Gains and losses from these transactions may arise from changes in the value of the foreign currency or if the counterparties do not perform under the contracts' terms.
Foreign-denominated assets, including investment securities, and liabilities are translated into U.S. dollars at the exchange rates at period end. Purchases and sales of investment securities, income and dividends received and expenses denominated in foreign currencies are translated into U.S. dollars at the exchange rate in effect on the transaction date.
The effects of exchange rate fluctuations on investments are included with the net realized and unrealized gain (loss) on investment securities. Other foreign currency transactions resulting in realized and unrealized gain (loss) are disclosed separately.
Investment Transactions and Income. For financial reporting purposes, the Fund's investment holdings and NAV include trades executed through the end of the last business day of the period. The NAV per share for processing shareholder transactions is calculated as of the close of business of the New York Stock Exchange (NYSE), normally 4:00 p.m. Eastern time and includes trades executed through the end of the prior business day. Gains and losses on securities sold are determined on the basis of identified cost and may include proceeds received from litigation. Dividend income is recorded on the ex-dividend date, except for certain dividends from foreign securities where the ex-dividend date may have passed, which are recorded as soon as the Fund is informed of the ex-dividend date. Non-cash dividends included in dividend income, if any, are recorded at the fair market value of the securities received. Distributions received on securities that represent a return of capital or capital gain are recorded as a reduction of cost of investments and/or as a realized gain. The Fund estimates the components of
Annual Report
3. Significant Accounting Policies - continued
Investment Transactions and Income - continued
distributions received that may be considered return of capital distributions or capital gain distributions. Interest income and distributions from the Fidelity Central Funds are accrued as earned. Interest income includes coupon interest and amortization of premium and accretion of discount on debt securities. Investment income is recorded net of foreign taxes withheld where recovery of such taxes is uncertain.
Expenses. Expenses directly attributable to a fund are charged to that fund. Expenses attributable to more than one fund are allocated among the respective funds on the basis of relative net assets or other appropriate methods. Expense estimates are accrued in the period to which they relate and adjustments are made when actual amounts are known.
Deferred Trustee Compensation. Under a Deferred Compensation Plan (the Plan), independent Trustees may elect to defer receipt of a portion of their annual compensation. Deferred amounts are invested in a cross-section of Fidelity funds, are marked-to-market and remain in the Fund until distributed in accordance with the Plan. The investment of deferred amounts and the offsetting payable to the Trustees are included in the accompanying Statement of Assets and Liabilities.
Income Tax Information and Distributions to Shareholders. Each year, the Fund intends to qualify as a regulated investment company under Subchapter M of the Internal Revenue Code, including distributing substantially all of its taxable income and realized gains. As a result, no provision for income taxes is required. As of October 31, 2012, the Fund did not have any unrecognized tax benefits in the financial statements; nor is the Fund aware of any tax positions for which it is reasonably possible that the total amounts of unrecognized tax benefits will significantly change in the next twelve months. The Fund files a U.S. federal tax return, in addition to state and local tax returns as required. A fund's federal income tax returns are subject to examination by the Internal Revenue Service (IRS) for a period of three fiscal years after they are filed. State and local tax returns may be subject to examination for an additional fiscal year depending on the jurisdiction. Foreign taxes are provided for based on the Fund's understanding of the tax rules and rates that exist in the foreign markets in which it invests.
Distributions are declared and recorded on the ex-dividend date. Income dividends and capital gain distributions are declared separately for each class. Income and capital gain distributions are determined in accordance with income tax regulations, which may differ from GAAP.
Annual Report
Notes to Financial Statements - continued
(Amounts in thousands except percentages)
3. Significant Accounting Policies - continued
Income Tax Information and Distributions to Shareholders - continued
Capital accounts within the financial statements are adjusted for permanent book-tax differences. These adjustments have no impact on net assets or the results of operations. Temporary book-tax differences will reverse in a subsequent period.
Book-tax differences are primarily due to foreign currency transactions, certain foreign taxes, passive foreign investment companies (PFIC), deferred trustees compensation, capital loss carryforwards and losses deferred due to wash sales.
The federal tax cost of investment securities and unrealized appreciation (depreciation) as of period end were as follows:
Gross unrealized appreciation | $ 1,161,331 |
Gross unrealized depreciation | (475,922) |
Net unrealized appreciation (depreciation) on securities and other investments | $ 685,409 |
| |
Tax Cost | $ 7,724,523 |
The tax-based components of distributable earnings as of period end were as follows:
Undistributed ordinary income | $ 134,442 |
Capital loss carryforward | $ (1,554,149) |
Net unrealized appreciation (depreciation) | $ 684,309 |
Capital loss carryforwards are only available to offset future capital gains of the Fund to the extent provided by regulations and may be limited. Under the Regulated Investment Company Modernization Act of 2010 (the Act), the Fund is permitted to carry forward capital losses incurred in taxable years beginning after December 22, 2010 for an unlimited period and such capital losses are required to be used prior to any losses that expire. Capital loss carryforwards were as follows:
Fiscal year of expiration | |
2017 | $ (1,350,018) |
No expiration | |
Short-term | $ (204,131) |
Total capital loss carryforward | $ (1,554,149) |
The tax character of distributions paid was as follows:
| October 31, 2012 | | October 31, 2011 |
Ordinary Income | $ 118,968 | | $ 198,026 |
Annual Report
3. Significant Accounting Policies - continued
Short-Term Trading (Redemption) Fees. Shares held by investors in the Fund less than 30 days are subject to a redemption fee equal to 1.00% of the net asset value of shares redeemed. All redemption fees, which reduce the proceeds of the shareholder redemption, are retained by the Fund and accounted for as an addition to paid in capital.
New Accounting Pronouncement. In December 2011, the Financial Accounting Standards Board issued Accounting Standard Update No. 2011-11, Disclosures about Offsetting Assets and Liabilities. The update creates new disclosure requirements requiring entities to disclose both gross and net information for derivatives and other financial instruments that are either offset in the Statement of Assets and Liabilities or subject to an enforceable master netting arrangement or similar agreement. The disclosure requirements are effective for annual reporting periods beginning on or after January 1, 2013, and interim periods within those annual periods. Management is currently evaluating the impact of the update's adoption on the Fund's financial statement disclosures.
4. Purchases and Sales of Investments.
Purchases and sales of securities, other than short-term securities, aggregated $5,561,781 and $6,703,146, respectively.
5. Fees and Other Transactions with Affiliates.
Management Fee. FMR and its affiliates provide the Fund with investment management related services for which the Fund pays a monthly management fee. The management fee is the sum of an individual fund fee rate that is based on an annual rate of .45% of the Fund's average net assets and an annualized group fee rate that averaged .26% during the period. The group fee rate is based upon the average net assets of all the mutual funds advised by FMR. The group fee rate decreases as assets under management increase and increases as assets under management decrease. In addition, the management fee is subject to a performance adjustment (up to a maximum of ± .20% of the Fund's average net assets over a 36 month performance period). The upward or downward adjustment to the management fee is based on the relative investment performance of International Discovery as compared to an appropriate benchmark index. For the period, the total annual management fee rate, including the performance adjustment, was .74% of the Fund's average net assets.
Distribution and Service Plan Fees. In accordance with Rule 12b-1 of the 1940 Act, the Fund has adopted separate Distribution and Service Plans for each class of shares. Certain classes pay Fidelity Distributors Corporation (FDC), an affiliate of FMR, separate Distribution and Service Fees, each of which is based on an annual percentage of
Annual Report
Notes to Financial Statements - continued
(Amounts in thousands except percentages)
5. Fees and Other Transactions with Affiliates - continued
Distribution and Service Plan Fees - continued
each class' average net assets. In addition, FDC may pay financial intermediaries for selling shares of the Fund and providing shareholder support services. For the period, the Distribution and Service Fee rates, total fees and amounts retained by FDC were as follows:
| Distribution
Fee | Service
Fee | Total Fees | Retained
by FDC |
Class A | -% | .25% | $ 733 | $ 11 |
Class T | .25% | .25% | 262 | 1 |
Class B | .75% | .25% | 86 | 64 |
Class C | .75% | .25% | 303 | 21 |
| | | $ 1,384 | $ 97 |
Sales Load. FDC may receive a front-end sales charge of up to 5.75% for selling Class A shares and 3.50% for selling Class T shares, some of which is paid to financial intermediaries for selling shares of the Fund. Depending on the holding period, FDC may receive contingent deferred sales charges levied on Class A, Class T, Class B, and Class C redemptions. The deferred sales charges range from 5.00% to 1.00% for Class B shares, 1.00% for Class C shares, 1.00% for certain purchases of Class A shares and .25% for certain purchases of Class T shares.
For the period, sales charge amounts retained by FDC were as follows:
| Retained
by FDC |
Class A | $ 45 |
Class T | 6 |
Class B* | 18 |
Class C* | 1 |
| $ 70 |
* When Class B and Class C shares are initially sold, FDC pays commissions from its own resources to financial intermediaries through which the sales are made.
Annual Report
5. Fees and Other Transactions with Affiliates - continued
Transfer Agent Fees. Fidelity Investments Institutional Operations Company, Inc. (FIIOC), an affiliate of FMR, is the transfer, dividend disbursing and shareholder servicing agent for each class of the Fund. FIIOC receives account fees and asset-based fees that vary according to the account size and type of account of the shareholders of the respective classes of the Fund, except for Class K. FIIOC receives an asset-based fee of Class K's average net assets. FIIOC receives no fees for providing transfer agency services to Class F. FIIOC pays for typesetting, printing and mailing of shareholder reports, except proxy statements. For the period, transfer agent fees for each class were as follows:
| Amount | % of
Average
Net Assets |
Class A | $ 891 | .30 |
Class T | 159 | .30 |
Class B | 26 | .30 |
Class C | 91 | .30 |
International Discovery | 13,666 | .23 |
Class K | 764 | .05 |
Institutional Class | 598 | .21 |
| $ 16,195 | |
Accounting and Security Lending Fees. Fidelity Service Company, Inc. (FSC), an affiliate of FMR, maintains the Fund's accounting records. The accounting fee is based on the level of average net assets for each month. Under a separate contract, FSC administers the security lending program. The security lending fee is based on the number and duration of lending transactions.
Brokerage Commissions. The Fund placed a portion of its portfolio transactions with brokerage firms which are affiliates of the investment adviser. The commissions paid to these affiliated firms were $13 for the period.
Interfund Lending Program. Pursuant to an Exemptive Order issued by the SEC, the Fund, along with other registered investment companies having management contracts with FMR, may participate in an interfund lending program. This program provides an alternative credit facility allowing the funds to borrow from, or lend money to, other participating affiliated funds. At period end, there were no interfund loans outstanding. The Fund's activity in this program during the period for which loans were outstanding was as follows:
Borrower or Lender | Average Loan
Balance | Weighted Average Interest Rate | Interest Expense |
Borrower | $ 17,873 | .34% | $ 5 |
Annual Report
Notes to Financial Statements - continued
(Amounts in thousands except percentages)
6. Committed Line of Credit.
The Fund participates with other funds managed by FMR or an affiliate in a $4.25 billion credit facility (the "line of credit") to be utilized for temporary or emergency purposes to fund shareholder redemptions or for other short-term liquidity purposes. The Fund has agreed to pay commitment fees on its pro-rata portion of the line of credit, which amounted to $23 and is reflected in Miscellaneous expenses on the Statement of Operations. During the period, there were no borrowings on this line of credit.
7. Security Lending.
The Fund lends portfolio securities through a lending agent from time to time in order to earn additional income. For equity securities, a lending agent is used and may loan securities to certain qualified borrowers, including Fidelity Capital Markets (FCM), a broker-dealer affiliated with the Fund. On the settlement date of the loan, the Fund receives collateral (in the form of U.S. Treasury obligations, letters of credit and/or cash) against the loaned securities and maintains collateral in an amount not less than 100% of the market value of the loaned securities during the period of the loan. The market value of the loaned securities is determined at the close of business of the Fund and any additional required collateral is delivered to the Fund on the next business day. If the borrower defaults on its obligation to return the securities loaned because of insolvency or other reasons, a fund could experience delays and costs in recovering the securities loaned or in gaining access to the collateral. Any cash collateral received is invested in the Fidelity Securities Lending Cash Central Fund. The value of loaned securities and cash collateral at period end are disclosed on the Fund's Statement of Assets and Liabilities. At period end, there were no security loans outstanding with FCM. Security lending income represents the income earned on investing cash collateral, less rebates paid to borrowers and any lending agent fees associated with the loan, plus any premium payments received for lending certain types of securities. Security lending income is presented in the Statement of Operations as a component of income from Fidelity Central Funds. Total security lending income during the period amounted to $4,230, including $18 from securities loaned to FCM.
8. Expense Reductions.
Many of the brokers with whom FMR places trades on behalf of the Fund provided services to the Fund in addition to trade execution. These services included payments of certain expenses on behalf of the Fund totaling $2,500 for the period.
Annual Report
9. Distributions to Shareholders.
Distributions to shareholders of each class were as follows:
Years ended October 31, | 2012 | 2011 |
From net investment income | | |
Class A | $ 3,123 | $ 4,617 |
Class T | 388 | 859 |
Class B | 6 | 51 |
Class C | 44 | 184 |
International Discovery | 90,633 | 121,061 |
Class K | 20,917 | 18,291 |
Institutional Class | 3,857 | 4,873 |
Total | $ 118,968 | $ 149,936 |
From net realized gain | | |
Class A | $ - | $ 1,880 |
Class T | - | 439 |
Class B | - | 69 |
Class C | - | 209 |
International Discovery | - | 38,831 |
Class K | - | 5,143 |
Institutional Class | - | 1,519 |
Total | $ - | $ 48,090 |
10. Share Transactions.
Transactions for each class of shares were as follows:
| Shares | Dollars |
Years ended October 31, | 2012 | 2011 | 2012 | 2011 |
Class A | | | | |
Shares sold | 1,927 | 2,821 | $ 56,732 | $ 91,649 |
Reinvestment of distributions | 101 | 173 | 2,828 | 5,606 |
Shares redeemed | (3,468) | (4,335) | (100,935) | (139,721) |
Net increase (decrease) | (1,440) | (1,341) | $ (41,375) | $ (42,466) |
Class T | | | | |
Shares sold | 220 | 443 | $ 6,409 | $ 14,328 |
Reinvestment of distributions | 13 | 38 | 369 | 1,235 |
Shares redeemed | (860) | (1,286) | (25,207) | (41,028) |
Net increase (decrease) | (627) | (805) | $ (18,429) | $ (25,465) |
Class B | | | | |
Shares sold | 3 | 21 | $ 87 | $ 671 |
Reinvestment of distributions | - | 3 | 5 | 111 |
Shares redeemed | (113) | (130) | (3,297) | (4,124) |
Net increase (decrease) | (110) | (106) | $ (3,205) | $ (3,342) |
Annual Report
Notes to Financial Statements - continued
(Amounts in thousands except percentages)
10. Share Transactions - continued
| Shares | Dollars |
Years ended October 31, | 2012 | 2011 | 2012 | 2011 |
Class C | | | | |
Shares sold | 212 | 183 | $ 6,111 | $ 5,847 |
Reinvestment of distributions | 1 | 11 | 39 | 344 |
Shares redeemed | (395) | (437) | (11,440) | (13,875) |
Net increase (decrease) | (182) | (243) | $ (5,290) | $ (7,684) |
International Discovery | | | | |
Shares sold | 20,324 | 32,543 | $ 608,478 | $ 1,052,266 |
Reinvestment of distributions | 3,081 | 4,718 | 86,858 | 153,551 |
Shares redeemed | (65,748) | (59,489) | (1,937,202) | (1,934,353) |
Net increase (decrease) | (42,343) | (22,228) | $ (1,241,866) | $ (728,536) |
Class K | | | | |
Shares sold | 26,836 | 18,148 | $ 788,860 | $ 593,408 |
Reinvestment of distributions | 744 | 722 | 20,917 | 23,434 |
Shares redeemed | (13,817) | (10,275) | (410,022) | (330,258) |
Net increase (decrease) | 13,763 | 8,595 | $ 399,755 | $ 286,584 |
Institutional Class | | | | |
Shares sold | 2,049 | 2,364 | $ 59,460 | $ 75,348 |
Reinvestment of distributions | 53 | 69 | 1,502 | 2,254 |
Shares redeemed | (2,256) | (2,923) | (65,914) | (94,034) |
Net increase (decrease) | (154) | (490) | $ (4,952) | $ (16,432) |
11. Other.
The Fund's organizational documents provide former and current trustees and officers with a limited indemnification against liabilities arising in connection with the performance of their duties to the Fund. In the normal course of business, the Fund may also enter into contracts that provide general indemnifications. The Fund's maximum exposure under these arrangements is unknown as this would be dependent on future claims that may be made against the Fund. The risk of material loss from such claims is considered remote.
Annual Report
To the Trustees of Fidelity Investment Trust and the Shareholders of Fidelity International Discovery Fund:
In our opinion, the accompanying statement of assets and liabilities, including the schedule of investments, and the related statements of operations and of changes in net assets and the financial highlights present fairly, in all material respects, the financial position of Fidelity International Discovery Fund (a fund of Fidelity Investment Trust) at October 31, 2012, the results of its operations for the year then ended, the changes in its net assets for each of the two years in the period then ended and the financial highlights for each of the periods indicated, in conformity with accounting principles generally accepted in the United States of America. These financial statements and financial highlights (hereafter referred to as "financial statements") are the responsibility of the Fidelity International Discovery Fund's management. Our responsibility is to express an opinion on these financial statements based on our audits. We conducted our audits of these financial statements in accordance with the standards of the Public Company Accounting Oversight Board (United States). Those standards require that we plan and perform the audit to obtain reasonable assurance about whether the financial statements are free of material misstatement. An audit includes examining, on a test basis, evidence supporting the amounts and disclosures in the financial statements, assessing the accounting principles used and significant estimates made by management, and evaluating the overall financial statement presentation. We believe that our audits, which included confirmation of securities at October 31, 2012 by correspondence with the custodian and brokers, provide a reasonable basis for our opinion.
PricewaterhouseCoopers LLP
Boston, Massachusetts
December 14, 2012
Annual Report
The Trustees, Members of the Advisory Board, and executive officers of the trust and fund, as applicable, are listed below. The Board of Trustees governs the fund and is responsible for protecting the interests of shareholders. The Trustees are experienced executives who meet periodically throughout the year to oversee the fund's activities, review contractual arrangements with companies that provide services to the fund, oversee management of the risks associated with such activities and contractual arrangements, and review the fund's performance. Except for James C. Curvey, each of the Trustees oversees 236 funds advised by FMR or an affiliate. Mr. Curvey oversees 443 funds advised by FMR or an affiliate.
The Trustees hold office without limit in time except that (a) any Trustee may resign; (b) any Trustee may be removed by written instrument, signed by at least two-thirds of the number of Trustees prior to such removal; (c) any Trustee who requests to be retired or who has become incapacitated by illness or injury may be retired by written instrument signed by a majority of the other Trustees; and (d) any Trustee may be removed at any special meeting of shareholders by a two-thirds vote of the outstanding voting securities of the trust. Each Trustee who is not an interested person (as defined in the 1940 Act) (Independent Trustee), shall retire not later than the last day of the calendar year in which his or her 75th birthday occurs. The Independent Trustees may waive this mandatory retirement age policy with respect to individual Trustees. The executive officers and Advisory Board Members hold office without limit in time, except that any officer and Advisory Board Member may resign or may be removed by a vote of a majority of the Trustees at any regular meeting or any special meeting of the Trustees. Except as indicated, each individual has held the office shown or other offices in the same company for the past five years.
Experience, Skills, Attributes, and Qualifications of the Fund's Trustees. The Governance and Nominating Committee has adopted a statement of policy that describes the experience, qualifications, attributes, and skills that are necessary and desirable for potential Independent Trustee candidates (Statement of Policy). The Board believes that each Trustee satisfied at the time he or she was initially elected or appointed a Trustee, and continues to satisfy, the standards contemplated by the Statement of Policy. The Governance and Nominating Committee also engages professional search firms to help identify potential Independent Trustee candidates who have the experience, qualifications, attributes, and skills consistent with the Statement of Policy. From time to time, additional criteria based on the composition and skills of the current Independent Trustees, as well as experience or skills that may be appropriate in light of future changes to board composition, business conditions, and regulatory or other developments, have also been considered by the professional search firms and the Governance and Nominating Committee. In addition, the Board takes into account the Trustees' commitment and participation in Board and committee meetings, as well as their leadership of standing and ad hoc committees throughout their tenure.
In determining that a particular Trustee was and continues to be qualified to serve as a Trustee, the Board has considered a variety of criteria, none of which, in isolation, was controlling. The Board believes that, collectively, the Trustees have balanced and diverse experience, qualifications, attributes, and skills, which allow the Board to operate effectively in governing the fund and protecting the interests of shareholders. Information about the specific experience, skills, attributes, and qualifications of each Trustee, which in each case led to the Board's conclusion that the Trustee should serve (or continue to serve) as a trustee of the fund, is provided below.
Annual Report
Trustees and Officers - continued
Board Structure and Oversight Function. James C. Curvey is an interested person (as defined in the 1940 Act) and currently serves as Chairman. The Trustees have determined that an interested Chairman is appropriate and benefits shareholders because an interested Chairman has a personal and professional stake in the quality and continuity of services provided to the fund. Independent Trustees exercise their informed business judgment to appoint an individual of their choosing to serve as Chairman, regardless of whether the Trustee happens to be independent or a member of management. The Independent Trustees have determined that they can act independently and effectively without having an Independent Trustee serve as Chairman and that a key structural component for assuring that they are in a position to do so is for the Independent Trustees to constitute a substantial majority for the Board. The Independent Trustees also regularly meet in executive session. Ned C. Lautenbach serves as Chairman of the Independent Trustees and as such (i) acts as a liaison between the Independent Trustees and management with respect to matters important to the Independent Trustees and (ii) with management prepares agendas for Board meetings.
Fidelity funds are overseen by different Boards of Trustees. The fund's Board oversees Fidelity's equity and high income funds and another Board oversees Fidelity's investment-grade bond, money market, and asset allocation funds. The asset allocation funds may invest in Fidelity funds overseen by the fund's Board. The use of separate Boards, each with its own committee structure, allows the Trustees of each group of Fidelity funds to focus on the unique issues of the funds they oversee, including common research, investment, and operational issues. On occasion, the separate Boards establish joint committees to address issues of overlapping consequences for the Fidelity funds overseen by each Board.
The Trustees operate using a system of committees to facilitate the timely and efficient consideration of all matters of importance to the Trustees, the fund, and fund shareholders and to facilitate compliance with legal and regulatory requirements and oversight of the fund's activities and associated risks. The Board, acting through its committees, has charged FMR and its affiliates with (i) identifying events or circumstances the occurrence of which could have demonstrably adverse effects on the fund's business and/or reputation; (ii) implementing processes and controls to lessen the possibility that such events or circumstances occur or to mitigate the effects of such events or circumstances if they do occur; and (iii) creating and maintaining a system designed to evaluate continuously business and market conditions in order to facilitate the identification and implementation processes described in (i) and (ii) above. Because the day-to-day operations and activities of the fund are carried out by or through FMR, its affiliates and other service providers, the fund's exposure to risks is mitigated but not eliminated by the processes overseen by the Trustees. While each of the Board's committees has responsibility for overseeing different aspects of the fund's activities, oversight is exercised primarily through the Operations, Audit, and Compliance Committees. In addition, the Independent Trustees have worked with FMR to enhance the Board's oversight of investment and financial risks, legal and regulatory risks, technology risks, and operational risks, including the development of additional risk reporting to the Board. For example, a working group comprised of Independent Trustees and FMR has worked and continues to work to review the Fidelity funds' valuation-related activities, reporting and risk management. Appropriate personnel, including but not limited to the fund's Chief Compliance Officer (CCO), FMR's internal auditor, the independent accountants, the fund's Treasurer and portfolio management personnel, make periodic reports to the Board's committees, as appropriate, including an annual review of FMR's risk management program for the Fidelity funds. The responsibilities of each standing committee, including their oversight responsibilities, are described further under "Standing Committees of the Fund's Trustees."
Annual Report
The fund's Statement of Additional Information (SAI) includes more information about the Trustees. To request a free copy, call Fidelity at 1-800-208-0098.
Interested Trustees*:
Correspondence intended for each Trustee who is an interested person may be sent to Fidelity Investments, 82 Devonshire Street, Boston, Massachusetts 02109.
Name, Age; Principal Occupations and Other Relevant Experience+ |
James C. Curvey (77) |
| Year of Election or Appointment: 2007 Mr. Curvey is Trustee and Chairman of the Board of Trustees of certain Trusts. Mr. Curvey also serves as Trustee (2007-present) of other investment companies advised by FMR. Mr. Curvey is a Director of Fidelity Investments Money Management, Inc. (2009-present), Director of Fidelity Research & Analysis Co. (2009-present) and Director of FMR and FMR Co., Inc. (2007-present). Mr. Curvey is also Vice Chairman (2007-present) and Director of FMR LLC. In addition, Mr. Curvey serves as an Overseer for the Boston Symphony Orchestra and a member of the Trustees of Villanova University. Previously, Mr. Curvey was the Vice Chairman (2006-2007) and Director (2000-2007) of FMR Corp. |
Ronald P. O'Hanley (55) |
| Year of Election or Appointment: 2011 Mr. O'Hanley is Director of FMR Co., Inc. (2010-present), Director of Fidelity Investments Money Management, Inc. (2010-present), Director of Fidelity Research & Analysis Company (2010-present), President of Fidelity Asset Management and Corporate Services and a member of Fidelity's Executive Committee (2010-present). Previously, Mr. O'Hanley served as President and Chief Executive Officer of BNY Mellon Asset Management (2007-2010). Mr. O'Hanley also served as Vice Chairman of Bank New York Mellon Corp. and a member of that firm's Executive Committee. Prior to the 2007 merger of The Bank of New York and Mellon Financial Corporation, he was Vice Chairman of Mellon Financial Corporation and President and Chief Executive Officer of Mellon Asset Management. He joined Mellon in February 1997. Mr. O'Hanley currently serves as Chairman of the Boston Public Library Foundation Board of Directors and sits on the Board of Directors of Beth Israel Deaconess Medical Center, the Board of Trustees of the Marine Biological Laboratory and the Advisory Board of the Maxwell School of Citizenship and Public Administration at Syracuse University. Mr. O'Hanley also chairs the Council on Asset Management for the Financial Services Roundtable and is a member of the Board of Directors of Institutional Investor's U.S. Institute. |
* Trustees have been determined to be "Interested Trustees" by virtue of, among other things, their affiliation with the trust or various entities under common control with FMR.
+ The information above includes each Trustee's principal occupation during the last five years and other information relating to the experience, attributes, and skills relevant to each Trustee's qualifications to serve as a Trustee, which led to the conclusion that each Trustee should serve as a Trustee for the fund.
Annual Report
Independent Trustees:
Correspondence intended for each Independent Trustee (that is, the Trustees other than the Interested Trustees) may be sent to Fidelity Investments, P.O. Box 55235, Boston, Massachusetts 02205-5235.
Name, Age; Principal Occupations and Other Relevant Experience+ |
Dennis J. Dirks (64) |
| Year of Election or Appointment: 2005 Prior to his retirement in May 2003, Mr. Dirks was Chief Operating Officer and a member of the Board of The Depository Trust & Clearing Corporation (DTCC). He also served as President, Chief Operating Officer, and Board member of The Depository Trust Company (DTC) and President and Board member of the National Securities Clearing Corporation (NSCC). In addition, Mr. Dirks served as Chief Executive Officer and Board member of the Government Securities Clearing Corporation, Chief Executive Officer and Board member of the Mortgage-Backed Securities Clearing Corporation, as a Trustee and a member of the Finance Committee of Manhattan College (2005-2008), and as a Trustee and a member of the Finance Committee of AHRC of Nassau County (2006-2008). Mr. Dirks is a member of the Independent Directors Council (IDC) Governing Council (2010-present) and Board of Directors for The Brookville Center for Children's Services, Inc. (2009-present). |
Alan J. Lacy (59) |
| Year of Election or Appointment: 2008 Mr. Lacy serves as Senior Adviser (2007-present) of Oak Hill Capital Partners, L.P. (private equity). Mr. Lacy also served as Chief Executive Officer (2000-2005) and Vice Chairman (2005-2006) of Sears Holdings Corporation and Sears, Roebuck and Co. (retail). In addition, Mr. Lacy serves as a member of the Board of Directors of Dave & Buster's Entertainment, Inc. (restaurant and entertainment complexes, 2010-present), Earth Fare, Inc. (retail grocery, 2012-present), The Hillman Companies, Inc. (hardware wholesalers, 2010-present), and Bristol-Myers Squibb Company (global pharmaceuticals, 2008-present). Mr. Lacy is a member of the Board of Trustees of The National Parks Conservation Association (2006-present). Previously, Mr. Lacy served as Chairman of the Board of Trustees of the National Parks Conservation Association (2008-2011) and as a member of the Board of Directors for the Western Union Company (global money transfer, 2006-2011). |
Ned C. Lautenbach (68) |
| Year of Election or Appointment: 2000 Mr. Lautenbach is Chairman of the Independent Trustees of the Equity and High Income Funds (2006-present). Mr. Lautenbach currently serves as the Lead Director of the Eaton Corporation Board of Directors (diversified industrial, 1997-present). Mr. Lautenbach is Chairman of the Board of Directors of the Philharmonic Center for the Arts in Naples, Florida (2012-present) and a member of the Council on Foreign Relations (1994-present). Previously, Mr. Lautenbach was a Partner/Advisory Partner at Clayton, Dubilier & Rice, LLC (private equity investment, 1998-2010), as well as a Director of Sony Corporation (2006-2007). |
Joseph Mauriello (68) |
| Year of Election or Appointment: 2008 Prior to his retirement in January 2006, Mr. Mauriello served in numerous senior management positions including Deputy Chairman and Chief Operating Officer (2004-2005), and Vice Chairman of Financial Services (2002-2004) of KPMG LLP US (professional services, 1965-2005). Mr. Mauriello currently serves as a member of the Board of Directors of XL Group plc. (global insurance and re-insurance, 2006-present). Previously, Mr. Mauriello served as a Director of the Hamilton Funds of the Bank of New York (2006-2007) and of Arcadia Resources Inc. (health care services and products, 2007-2012). |
Robert W. Selander (62) |
| Year of Election or Appointment: 2011 Previously, Mr. Selander served as a Member of the Advisory Board of Fidelity's Equity and High Income Funds (2011), Executive Vice Chairman (2010), Chief Executive Officer (2009-2010), and President and Chief Executive Officer (1997-2009) of Mastercard, Inc. |
Cornelia M. Small (68) |
| Year of Election or Appointment: 2005 Ms. Small is a member of the Board of Directors (2009-present) and Chair of the Investment Committee (2010-present) of the Teagle Foundation. Ms. Small also serves on the Investment Committee of the Berkshire Taconic Community Foundation (2008-present). Previously, Ms. Small served as Chairperson (2002-2008) and a member of the Investment Committee and Chairperson (2008-2012) and a member of the Board of Trustees of Smith College. In addition, Ms. Small served as Chief Investment Officer, Director of Global Equity Investments, and a member of the Board of Directors of Scudder, Stevens & Clark and Scudder Kemper Investments. |
William S. Stavropoulos (73) |
| Year of Election or Appointment: 2001 Mr. Stavropoulos is Vice Chairman of the Independent Trustees of the Equity and High Income Funds (2006-present). Mr. Stavropoulos serves as President and Founder of the Michigan Baseball Foundation, the Great Lakes Loons (2007-present). Mr. Stavropoulos is Chairman Emeritus of the Board of Directors of The Dow Chemical Company, where he previously served in numerous senior management positions, including President, CEO (1995-2000; 2002-2004), Chairman of the Executive Committee (2000-2006), and as a member of the Board of Directors (1990-2006). Currently, Mr. Stavropoulos is a Director of Univar Inc. (global distributor of commodity and specialty chemicals, Chairman from 2010-May 2012 and Lead Director from May 2012-present), Teradata Corporation (data warehousing and technology solutions, 2008-present), Maersk Inc. (industrial conglomerate), and Tyco International, Ltd. (multinational manufacturing and services, 2007-present), and a member of the Advisory Board for Metalmark Capital LLC (private equity investment, 2005-present). Mr. Stavropoulos is an operating advisor to Clayton, Dubilier & Rice, LLC (private equity investment). In addition, Mr. Stavropoulos is a member of the University of Notre Dame Advisory Council for the College of Science, a Trustee of the Rollin L. Gerstacker Foundation, and a Director of the Naples Philharmonic Center for the Arts. Previously, Mr. Stavropoulos served as a Director of Chemical Financial Corporation (bank holding company, 1993-2012). |
David M. Thomas (63) |
| Year of Election or Appointment: 2008 Previously, Mr. Thomas served as Executive Chairman (2005-2006) and Chairman and Chief Executive Officer (2000-2005) of IMS Health, Inc. (pharmaceutical and healthcare information solutions), and a Director of Fortune Brands, Inc. (consumer products, 2000-2011). In addition, Mr. Thomas serves as Non-Executive Chairman of the Board of Directors of Fortune Brands Home and Security (home and security products, 2011-present), and as a member of the Board of Directors of Interpublic Group of Companies, Inc. (marketing communication, 2004-present). |
Michael E. Wiley (62) |
| Year of Election or Appointment: 2008 Mr. Wiley also serves as a Director of Asia Pacific Exploration Consolidated (international oil and gas exploration and production, 2008-present). Mr. Wiley serves as a Director of Tesoro Corporation (independent oil refiner and marketer, 2005-present), and a Director of Bill Barrett Corporation (exploration and production, 2005-present). In addition, Mr. Wiley also serves as a Director of Post Oak Bank (privately-held bank, 2004-present). Previously, Mr. Wiley served as a member of the Board of Trustees of the University of Tulsa (2000-2006; 2007-2010), as a Senior Energy Advisor of Katzenbach Partners, LLC (consulting, 2006-2007), as an Advisory Director of Riverstone Holdings (private investment), Chairman, President, and CEO of Baker Hughes, Inc. (oilfield services, 2000-2004), and as Director of Spinnaker Exploration Company (exploration and production, 2001-2005). |
+ The information above includes each Trustee's principal occupation during the last five years and other information relating to the experience, attributes, and skills relevant to each Trustee's qualifications to serve as a Trustee, which led to the conclusion that each Trustee should serve as a Trustee for the fund.
Advisory Board Members and Executive Officers:
Correspondence intended for David A. Rosow and Garnett A. Smith may be sent to Fidelity Investments, P.O. Box 55235, Boston, Massachusetts 02205-5235. Correspondence intended for each executive officer, Edward C. Johnson 3d, and Peter S. Lynch may be sent to Fidelity Investments, 82 Devonshire Street, Boston, Massachusetts 02109.
Name, Age; Principal Occupation |
Edward C. Johnson 3d (82) |
| Year of Election or Appointment: 2011 Member of the Advisory Board of Fidelity's Equity and High Income Funds. Mr. Johnson serves as Chief Executive Officer, Chairman, and a Director of FMR LLC, and also serves as Chairman and Director of FIL Limited. Previously, Mr. Johnson served as a Trustee and Chairman of the Board of certain Fidelity Trusts, Chairman and a Director of FMR, Chairman and a Director of FMR Co., Inc., and President of FMR LLC (2006-2007). |
Peter S. Lynch (68) |
| Year of Election or Appointment: 2003 Member of the Advisory Board of Fidelity's Equity and High Income Funds. Mr. Lynch is Vice Chairman and a Director of FMR and FMR Co., Inc. In addition, Mr. Lynch serves as a Trustee of Boston College and as the Chairman of the Inner-City Scholarship Fund. Previously, Mr. Lynch served on the Special Olympics International Board of Directors (1997-2006). |
David A. Rosow (70) |
| Year of Election or Appointment: 2012 Member of the Advisory Board of Fidelity's Equity and High Income Funds. Chairman and Chief Executive Officer of International Golf Group, Inc. (golf course development, 1989-present). Previously, Mr. Rosow served as Chairman and Chief Executive Officer of Rosow & Company, Inc. (private investment company, 1989-2011), a Lead Director of Hudson United Bancorp (2001-2006) and as a Director of TD Banknorth (1996-2006). In addition, Mr. Rosow is a member (2008-present) and President (2009-present) of the Town Council of Palm Beach, Florida. |
Garnett A. Smith (65) |
| Year of Election or Appointment: 2012 Member of the Advisory Board of Fidelity's Equity and High Income Funds. Prior to Mr. Smith's retirement, he served as Chairman and Chief Executive Officer of Inbrand Corp. (manufacturer of personal absorbent products, 1990-1997). He also served as President (1986-1990) of Inbrand Corp. Prior to his employment with Inbrand Corp., he was employed by a retail fabric chain and North Carolina National Bank. In addition, Mr. Smith is a board member of the Jackson Hole Land Trust (2009-present). |
Kenneth B. Robins (43) |
| Year of Election or Appointment: 2008 President and Treasurer of Fidelity's Equity and High Income Funds. Mr. Robins also serves as President and Treasurer (2010-present) and Assistant Treasurer (2009-present) of other Fidelity funds and is an employee of Fidelity Investments (2004-present). Previously, Mr. Robins served as Deputy Treasurer of the Fidelity funds (2005-2008) and Treasurer and Chief Financial Officer of The North Carolina Capital Management Trust: Cash and Term Portfolios (2006-2008). |
Bruce T. Herring (47) |
| Year of Election or Appointment: 2006 Vice President of certain Equity Funds. Mr. Herring also serves as President of Fidelity Research & Analysis Company (2010-present), Chief Investment Officer and Director of Fidelity Management & Research (U.K.) Inc. (2010-present) and Group Chief Investment Officer of FMR. Previously, Mr. Herring served as Vice President (2005-2006) and Senior Vice President (2006-2007) of Fidelity Management & Research Company, Vice President of FMR Co., Inc. (2001-2007) and as a portfolio manager for Fidelity U.S. Equity Funds. |
Brian B. Hogan (48) |
| Year of Election or Appointment: 2009 Vice President of Equity and High Income Funds. Mr. Hogan also serves as President of FMR's Equity Division (2009-present). Previously, Mr. Hogan served as Senior Vice President, Equity Research of FMR (2006-2009) and as a portfolio manager. |
Scott C. Goebel (44) |
| Year of Election or Appointment: 2008 Secretary and Chief Legal Officer (CLO) of the Fidelity funds. Mr. Goebel also serves as Secretary of Fidelity Investments Money Management, Inc. (FIMM) (2010-present) and Fidelity Research and Analysis Company (FRAC) (2010-present); Secretary and CLO of The North Carolina Capital Management Trust: Cash and Term Portfolios (2008-present); General Counsel, Secretary, and Senior Vice President of FMR (2008-present) and FMR Co., Inc. (2008-present); employed by FMR LLC or an affiliate (2001-present); Chief Legal Officer of Fidelity Management & Research (Hong Kong) Limited (2008-present) and Assistant Secretary of Fidelity Management & Research (Japan) Inc. (2008-present), and Fidelity Management & Research (U.K.) Inc. (2008-present). Previously, Mr. Goebel served as Assistant Secretary of FIMM (2008-2010), FRAC (2008-2010), and the Funds (2007-2008) and as Vice President and Secretary of Fidelity Distributors Corporation (FDC) (2005-2007). |
William C. Coffey (43) |
| Year of Election or Appointment: 2009 Assistant Secretary of Fidelity's Equity and High Income Funds. Mr. Coffey also serves as Senior Vice President and Deputy General Counsel of FMR LLC (2010-present), and is an employee of Fidelity Investments. Previously, Mr. Coffey served as Vice President and Associate General Counsel of FMR LLC (2005-2009). |
Elizabeth Paige Baumann (44) |
| Year of Election or Appointment: 2012 Anti-Money Laundering (AML) Officer of the Fidelity funds. Ms. Baumann also serves as AML Officer of The North Carolina Capital Management Trust: Cash and Term Portfolios (2012-present), Chief AML Officer of FMR LLC (2012-present), and is an employee of Fidelity Investments. Previously, Ms. Baumann served as Vice President and Deputy Anti-Money Laundering Officer (2007-2012). |
Christine Reynolds (54) |
| Year of Election or Appointment: 2008 Chief Financial Officer of the Fidelity funds. Ms. Reynolds became President of Fidelity Pricing and Cash Management Services (FPCMS) in August 2008. Ms. Reynolds served as Chief Operating Officer of FPCMS (2007-2008). Previously, Ms. Reynolds served as President, Treasurer, and Anti-Money Laundering officer of the Fidelity funds (2004-2007). |
Joseph A. Hanlon (44) |
| Year of Election or Appointment: 2012 Chief Compliance Officer of Fidelity's Equity and High Income Funds. Mr. Hanlon serves as Compliance Officer of FMR, FMR Co., Inc., Fidelity Investments Money Management, Inc. (FIMM), Fidelity Research and Analysis Company (FRAC), Fidelity Management & Research (Japan) Inc., Fidelity Management & Research (U.K.) Inc., Fidelity Management & Research (Hong Kong), and Strategic Advisers, Inc. (2009-present), as Senior Vice President of the Fidelity Asset Management Division (2009-present), and is an employee of Fidelity Investments. |
Joseph F. Zambello (55) |
| Year of Election or Appointment: 2011 Deputy Treasurer of the Fidelity funds. Mr. Zambello is an employee of Fidelity Investments. Previously, Mr. Zambello served as Vice President of FMR's Program Management Group (2009-2011) and Vice President of the Transfer Agent Oversight Group (2005-2009). |
Adrien E. Deberghes (45) |
| Year of Election or Appointment: 2008 Deputy Treasurer of Fidelity's Equity and High Income Funds. Mr. Deberghes also serves as Vice President (2011-present) and Assistant Treasurer (2010-present) of other Fidelity funds, and is an employee of Fidelity Investments (2008-present). Previously, Mr. Deberghes served as Senior Vice President of Mutual Fund Administration at State Street Corporation (2007-2008), Senior Director of Mutual Fund Administration at Investors Bank & Trust (2005-2007), and Director of Finance for Dunkin' Brands (2000-2005). |
Stephen Sadoski (41) |
| Year of Election or Appointment: 2012 Deputy Treasurer of Fidelity's Equity and High Income Funds. Mr. Sadoski also serves as Assistant Treasurer of other Fidelity funds (2012-present) and is an employee of Fidelity Investments (2012-present). Previously, Mr. Sadoski served as an assistant chief accountant in the Division of Investment Management of the Securities and Exchange Commission (SEC) (2009-2012) and as a senior manager at Deloitte & Touche (1997-2009). |
Stephanie J. Dorsey (43) |
| Year of Election or Appointment: 2010 Assistant Treasurer of Fidelity's Equity and High Income Funds. Ms. Dorsey also serves as Deputy Treasurer of other Fidelity funds (2008-present) and is an employee of Fidelity Investments (2008-present). Previously, Ms. Dorsey served as Treasurer (2004-2008) of the JPMorgan Mutual Funds and Vice President (2004-2008) of JPMorgan Chase Bank. |
John R. Hebble (54) |
| Year of Election or Appointment: 2009 Assistant Treasurer of Fidelity's Equity and High Income Funds. Mr. Hebble also serves as President (2011-present), Treasurer, and Chief Financial Officer of The North Carolina Capital Management Trust: Cash and Term Portfolios (2008-present), President and Treasurer of other Fidelity funds (2008-present) and is an employee of Fidelity Investments. |
Gary W. Ryan (54) |
| Year of Election or Appointment: 2005 Assistant Treasurer of the Fidelity funds. Mr. Ryan is an employee of Fidelity Investments. Previously, Mr. Ryan served as Vice President of Fund Reporting in Fidelity Pricing and Cash Management Services (FPCMS) (1999-2005). |
Jonathan Davis (44) |
| Year of Election or Appointment: 2010 Assistant Treasurer of the Fidelity funds. Mr. Davis is also Assistant Treasurer of Fidelity Rutland Square Trust II and Fidelity Commonwealth Trust II. Mr. Davis is an employee of Fidelity Investments. Previously, Mr. Davis served as Vice President and Associate General Counsel of FMR LLC (2003-2010). |
Annual Report
The Board of Trustees of Fidelity Advisor International Discovery Fund voted to pay to shareholders of record at the opening of business on record date, the following distributions per share derived from capital gains realized from sales of portfolio securities, and dividends derived from net investment income:
| Pay Date | Record Date | Dividends | Capital Gains |
Institutional Class | 12/10/12 | 12/07/12 | $0.555 | $0.032 |
Institutional Class designates 1% of the dividends distributed during the fiscal year as qualifying for the dividends-received deduction for corporate shareholders
Institutional Class designates 100% of the dividends distributed during the fiscal year as amounts which may be taken into account as a dividend for the purposes of the maximum rate under section 1(h)(11) of the Internal Revenue Code.
The amounts per share which represent income derived from sources within, and taxes paid to, foreign countries or possessions of the United States are as follows:
| Pay Date | Income | Taxes |
Institutional Class | 12/05/11 | $0.449 | $0.0345 |
The fund will notify shareholders in January 2013 of amounts for use in preparing 2012 income tax returns.
Annual Report
Board Approval of Investment Advisory Contracts and Management Fees
Fidelity International Discovery Fund
Each year, the Board of Trustees, including the Independent Trustees (together, the Board), votes on the renewal of the management contract and sub-advisory agreements (together, the Advisory Contracts) for the fund. The Board, assisted by the advice of fund counsel and Independent Trustees' counsel, requests and considers a broad range of information relevant to the renewal of the Advisory Contracts throughout the year.
The Board meets regularly and, at each of its meetings, considers factors that are relevant to its annual consideration of the renewal of the fund's Advisory Contracts, including the services and support provided to the fund and its shareholders. The Board has established various standing committees, each composed of and chaired by Independent Trustees with varying backgrounds, to which the Board has assigned specific subject matter responsibilities in order to enhance effective decision-making by the Board. The Board, acting directly and through its Committees, requests and receives information concerning the annual consideration of the renewal of the fund's Advisory Contracts. The Board also meets as needed to consider matters specifically related to the Board's annual consideration of the renewal of Advisory Contracts. Members of the Board may also meet with trustees of other Fidelity funds through ad hoc joint committees to discuss certain matters relevant to the Fidelity funds.
At its July 2012 meeting, the Board of Trustees, including the Independent Trustees, unanimously determined to renew the fund's Advisory Contracts. In reaching its determination, the Board considered all factors it believed relevant, including (i) the nature, extent, and quality of the services to be provided to the fund and its shareholders (including the investment performance of the fund); (ii) the competitiveness of the fund's management fee and total expense ratio relative to peer funds; (iii) the total costs of the services to be provided by and the profits to be realized by Fidelity from its relationship with the fund; (iv) the extent to which economies of scale exist and would be realized as the fund grows; and (v) whether fee levels reflect these economies of scale, if any, for the benefit of fund shareholders.
In considering whether to renew the Advisory Contracts for the fund, the Board reached a determination, with the assistance of fund counsel and Independent Trustees' counsel and through the exercise of its business judgment, that the renewal of the Advisory Contracts is in the best interests of the fund and its shareholders and that the compensation payable under the Advisory Contracts is fair and reasonable. The Board's decision to renew the Advisory Contracts was not based on any single factor, but rather was based on a comprehensive consideration of all the information provided to the Board at its meetings throughout the year. The Board, in reaching its determination to renew the Advisory Contracts, is aware that shareholders in the fund have a broad range of investment choices available to them, including a wide choice among mutual funds offered by Fidelity's competitors, and that the fund's shareholders, who have the opportunity to review and weigh the disclosure provided by the fund in its prospectus and other public disclosures, have chosen to invest in this fund, managed by Fidelity.
Annual Report
Nature, Extent, and Quality of Services Provided. The Board considered the staffing within the investment adviser, FMR, and the sub-advisers (together, the Investment Advisers), including the backgrounds of the fund's investment personnel, and also considered the fund's investment objective, strategies, and related investment philosophy. The Independent Trustees also had discussions with senior management of Fidelity's investment operations and investment groups. The Board considered the structure of the portfolio manager compensation program and whether this structure provides appropriate incentives to act in the best interests of the fund.
Resources Dedicated to Investment Management and Support Services. The Board and the Fund Oversight and Research Committees reviewed the general qualifications and capabilities of the Investment Advisers' investment staff, including its size, education, experience, and resources, as well as the Investment Advisers' approach to recruiting, training, managing, and compensating investment personnel. The Board also noted that FMR has continued to increase the resources devoted to non-U.S. offices, including expansion of Fidelity's global investment organization. The Board noted that Fidelity's analysts have extensive resources, tools and capabilities that allow them to conduct sophisticated quantitative and fundamental analysis, as well as credit analysis of issuers, counterparties and guarantors. The Board also believes that Fidelity's investment professionals have sufficient access to global information and data so as to provide competitive investment results over time, and that those professionals also have access to sophisticated tools that permit them to assess portfolio construction and risk and performance attribution characteristics continuously, as well as to transmit new information and research conclusions rapidly around the world. Additionally, in its deliberations, the Board considered the Investment Advisers' trading and risk management capabilities and resources, which are an integral part of the investment management process.
Shareholder and Administrative Services. The Board considered (i) the nature, extent, quality, and cost of advisory, administrative, and shareholder services performed by the Investment Advisers and their affiliates under the Advisory Contracts and under separate agreements covering transfer agency, pricing and bookkeeping, and securities lending services for the fund; (ii) the nature and extent of the supervision of third party service providers, principally custodians and subcustodians; and (iii) the resources devoted to, and the record of compliance with, the fund's compliance policies and procedures. The Board also reviewed the allocation of fund brokerage, including allocations to brokers affiliated with the Investment Advisers, the use of brokerage commissions to pay fund expenses, and the use of "soft" commission dollars to pay for research services.
Annual Report
Board Approval of Investment Advisory Contracts and
Management Fees - continued
The Board noted that the growth of fund assets over time across the complex allows Fidelity to reinvest in the development of services designed to enhance the value or convenience of the Fidelity funds as investment vehicles. These services include 24-hour access to account information and market information through telephone representatives and over the Internet, investor education materials and asset allocation tools, and the expanded availability of Fidelity Investor Centers.
Investment in a Large Fund Family. The Board considered the benefits to shareholders of investing in a Fidelity fund, including the benefits of investing in a fund that is part of a large family of funds offering a variety of investment disciplines and providing a large variety of mutual fund investor services. The Board noted that Fidelity had taken, or had made recommendations that resulted in the Fidelity funds taking, a number of actions over the previous year that benefited particular funds, including (i) continuing to dedicate additional resources to investment research and support of the senior management team that oversees asset management; (ii) persisting in efforts to enhance Fidelity's research capabilities, in particular, international research; (iii) launching new funds and making other enhancements to meet client needs for global and income-oriented solutions; (iv) continuing to launch dedicated lower cost underlying funds to meet investment management's portfolio construction needs related to expanding underlying fund options, specifically for the Freedom Fund product lines; (v) adopting a "Stock Selector" sector neutral investment approach and employing a team of portfolio managers who are sector specialists to manage certain funds; (vi) rationalizing product lines and gaining increased efficiencies through the mergers of several funds into other funds; (vii) strengthening the Spartan Index Fund product line by adding new funds and/or new low-cost institutional share classes, restructuring fund expenses to accommodate new classes, and reducing investment minimums for certain classes of shares; (viii) modifying the eligibility criteria for Institutional Class shares to increase their appeal to government entities and charitable investors; and (ix) reducing certain transfer agent fee rates.
Investment Performance. The Board considered whether the fund has operated in accordance with its investment objective, as well as its record of compliance with its investment restrictions. It also reviewed the fund's absolute investment performance for each class, as well as the fund's relative investment performance for each class measured over multiple periods against (i) a broad-based securities market index, and (ii) a peer group of mutual funds deemed appropriate by Fidelity and reviewed by the Board. The following charts considered by the Board show, over the one-, three-, and five-year periods ended December 31, 2011, the cumulative total returns of Institutional Class (Class I) and Class B of the fund, the cumulative total returns of a broad-based securities market index ("benchmark"), and a range of cumulative total returns of a peer group of mutual funds identified by Morningstar, Inc. as having an investment style similar to that of the fund based on underlying portfolio holdings. The returns of Institutional Class (Class I) and Class B show the performance of the highest and lowest performing classes, respectively (based on five-year performance). The box within each chart shows the 25th percentile return (top of box) and the 75th percentile return (bottom of box) of the peer group. Returns shown above the box are in the first quartile and returns shown below the box are in the fourth quartile. The percentage beaten numbers noted below each chart correspond to the percentile box and represent the percentage of funds in the peer group whose performance was equal to or lower than that of the class indicated.
Annual Report
Fidelity International Discovery Fund

The Board reviewed the fund's relative investment performance against its peer group and noted that the performance of Institutional Class (Class I) of the fund was in the third quartile for the one- and three-year periods and the second quartile for the five-year period. The Board also noted that the investment performance of the fund was lower than its benchmark for the one- and three-year periods, although the five-year cumulative total return of Institutional Class (Class I) compared favorably to its benchmark. The Board considered that the variations in performance among the fund's classes reflect the variations in class expenses, which result in lower performance for higher expense classes. The Board discussed with FMR actions to improve the fund's disappointing performance relative to its peer group and benchmark. The Board also reviewed the fund's performance since inception as well as performance in the current year. The Board will continue to closely monitor the performance of the fund in the coming year and discuss with FMR other appropriate actions to address the performance of the fund.
The Board also considered that the fund's management fee is subject to upward or downward adjustment depending upon whether, and to what extent, the fund's investment performance for the performance period exceeds, or is exceeded by, the record (over the same period) of a Board-approved performance adjustment index. The Board noted that the performance adjustment provides FMR with a strong economic incentive to seek to achieve superior performance for the fund's shareholders and helps to more closely align the interests of FMR and the fund's shareholders.
Annual Report
Board Approval of Investment Advisory Contracts and
Management Fees - continued
Based on its review, the Board concluded that the nature, extent, and quality of services provided to the fund under the Advisory Contracts should benefit the fund's shareholders.
Competitiveness of Management Fee and Total Expense Ratio. The Board considered the fund's management fee and total expense ratio compared to "mapped groups" of competitive funds and classes. Fidelity creates "mapped groups" by combining similar Lipper investment objective categories that have comparable management fee characteristics. Combining Lipper investment objective categories aids the Board's management fee and total expense ratio comparisons by broadening the competitive group used for comparison and by reducing the number of universes to which various Fidelity funds are compared.
Management Fee. The Board considered two proprietary management fee comparisons for the 12-month periods shown in the chart below. The group of Lipper funds used by the Board for management fee comparisons is referred to below as the "Total Mapped Group." The Total Mapped Group comparison focuses on a fund's standing relative to the total universe of comparable funds available to investors in terms of gross management fees before expense reimbursements or caps, and without giving effect to the fund's performance adjustment. "TMG %" represents the percentage of funds in the Total Mapped Group that had management fees that were lower than the fund's. For example, a TMG % of 17% means that 83% of the funds in the Total Mapped Group had higher management fees than the fund. The "Asset-Size Peer Group" (ASPG) comparison focuses on a fund's standing relative to non-Fidelity funds similar in size to the fund within the Total Mapped Group. The ASPG represents at least 15% of the funds in the Total Mapped Group with comparable asset size and management fee characteristics, subject to a minimum of 50 funds (or all funds in the Total Mapped Group if fewer than 50). Additional information, such as the ASPG quartile in which the fund's management fee ranked and the impact of the fund's performance adjustment, is also included in the chart and considered by the Board.
Annual Report
Fidelity International Discovery Fund
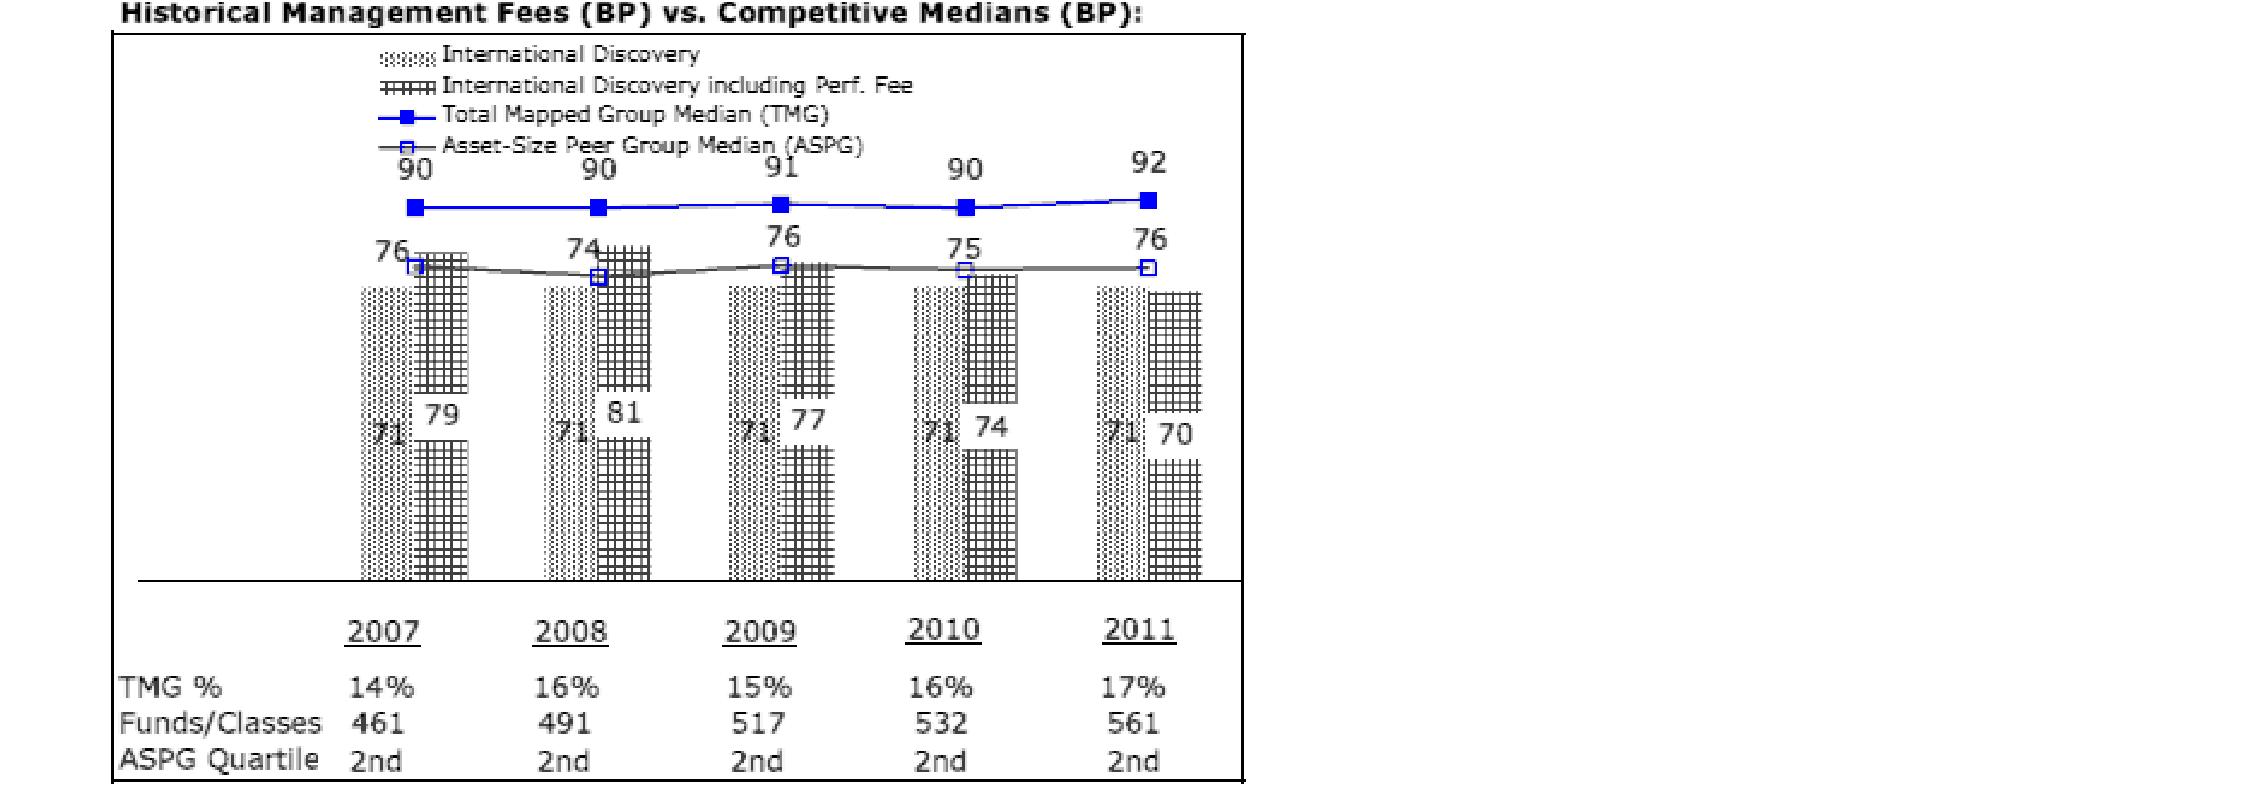
The Board noted that the fund's management fee ranked below the median of its Total Mapped Group and below the median of its ASPG for 2011. The Board also noted the effect of the fund's negative performance adjustment on the fund's management fee ranking. The Board noted that the performance adjustment for each year represents calculations for performance periods that differ from the periods shown in the performance charts above.
Based on its review, the Board concluded that the fund's management fee is fair and reasonable in light of the services that the fund receives and the other factors considered.
Total Expense Ratio. In its review of each class's total expense ratio, the Board considered the fund's management fee as well as other fund or class expenses, as applicable, such as transfer agent fees, pricing and bookkeeping fees, fund-paid 12b-1 fees, and custodial, legal, and audit fees. The Board also noted the effects of any waivers and reimbursements on fees and expenses, as well as the impact of the fund's performance adjustment. As part of its review, the Board also considered the current and historical total expense ratios of each class of the fund compared to competitive fund median expenses. Each class of the fund is compared to those funds and classes in the Total Mapped Group (used by the Board for management fee comparisons) that have a similar sales load structure.
The Board noted that the total expense ratio of each of Class A, Class B, Class C, Institutional Class, the retail class, and Class K ranked below its competitive median for 2011 and the total expense ratio of Class T ranked above its competitive median for 2011. The Board considered that various factors, including 12b-1 fees, positive or negative performance adjustments, and relatively higher other expenses in the case of small fund size, can affect total expense ratios. The Board noted that the total expense ratio of Class T was above the competitive median primarily because of higher 12b-1 fees on Class T. Class T has a higher 12b-1 fee, but a lower front-end sales charge, than traditionally priced front-end sales charge classes. The Board considered that Class T is primarily sold load-waived in the retirement plan market where its 0.50% 12b-1 fee is comparable to competing no-load, higher 12b-1 fee classes designed specifically for retirement plans. The Board noted that the fund offers multiple classes, each of which has a different sales load and 12b-1 fee structure, and that the multiple structures are intended to offer a range of pricing options for the intermediary market. The Board also noted that the total expense ratios of the classes vary primarily by the level of their 12b-1 fees, although differences in transfer agent fees may also cause expenses to vary from class to class.
Annual Report
Board Approval of Investment Advisory Contracts and
Management Fees - continued
Fees Charged to Other Fidelity Clients. The Board also considered Fidelity fee structures and other information with respect to clients of FMR and its affiliates, such as other mutual funds advised or subadvised by FMR or its affiliates, pension plan clients, and other institutional clients. The Board noted the findings of the 2010 ad hoc joint committee (created with the board of other Fidelity funds), which reviewed and compared Fidelity's institutional investment advisory business with its business of providing services to the Fidelity funds, including the differences in services provided, fees charged, and costs incurred, as well as competition in their respective marketplaces.
Based on its review of total expense ratios and fees charged to other Fidelity clients, the Board concluded that the total expense ratio of each class of the fund was reasonable, although Class T was above the median of the universe presented for comparison, in light of the services that the fund and its shareholders receive and the other factors considered.
Costs of the Services and Profitability. The Board considered the revenues earned and the expenses incurred by Fidelity in conducting the business of developing, marketing, distributing, managing, administering and servicing the fund and its shareholders. The Board also considered the level of Fidelity's profits in respect of all the Fidelity funds.
On an annual basis, FMR presents to the Board Fidelity's profitability for the fund. Fidelity calculates the profitability for each fund, as well as aggregate profitability for groups of Fidelity funds and all Fidelity funds, using a series of detailed revenue and cost allocation methodologies which originate with the books and records of Fidelity on which Fidelity's audited financial statements are based. The Audit Committee of the Board reviews any significant changes from the prior year's methodologies.
PricewaterhouseCoopers LLP (PwC), independent registered public accounting firm and auditor to Fidelity and certain Fidelity funds, has been engaged annually by the Board as part of the Board's assessment of Fidelity's profitability analysis. PwC's engagement includes the review and assessment of Fidelity's methodologies used in determining the revenues and expenses attributable to Fidelity's mutual fund business, and completion of agreed-upon procedures surrounding the mathematical accuracy of fund profitability and its conformity to allocation methodologies. After considering PwC's reports issued under the engagement and information provided by Fidelity, the Board concluded that while other allocation methods may also be reasonable, Fidelity's profitability methodologies are reasonable in all material respects.
Annual Report
The Board also reviewed Fidelity's non-fund businesses and fall-out benefits related to the mutual fund business as well as cases where Fidelity's affiliates may benefit from or be related to the fund's business.
The Board considered the costs of the services provided by and the profits realized by Fidelity in connection with the operation of the fund and was satisfied that the profitability was not excessive in the circumstances.
Economies of Scale. The Board considered whether there have been economies of scale in respect of the management of the Fidelity funds, whether the Fidelity funds (including the fund) have appropriately benefited from any such economies of scale, and whether there is potential for realization of any further economies of scale. The Board considered the extent to which the fund will benefit from economies of scale through increased services to the fund, through waivers or reimbursements, or through fee or expense reductions. The Board also noted that in 2009, it and the board of other Fidelity funds created an ad hoc committee (the Economies of Scale Committee) to analyze whether FMR attains economies of scale in respect of the management and servicing of the Fidelity funds, whether the Fidelity funds have appropriately benefited from such economies of scale, and whether there is potential for realization of any further economies of scale.
The Board recognized that the fund's management contract incorporates a "group fee" structure, which provides for lower group fee rates as total fund assets under FMR's management increase, and for higher group fee rates as total fund assets under FMR's management decrease. FMR calculates the group fee rates based on a tiered asset "breakpoint" schedule that varies based on asset class. The Board considered that the group fee is designed to deliver the benefits of economies of scale to fund shareholders when total Fidelity fund assets increase, even if assets of any particular fund are unchanged or have declined, because some portion of Fidelity's costs are attributable to services provided to all Fidelity funds, and all funds benefit if those costs can be allocated among more assets. The Board concluded that, given the group fee structure, fund shareholders will benefit from lower management fees as assets under FMR's management increase at the fund complex level, regardless of whether Fidelity achieves any such economies of scale.
Annual Report
Board Approval of Investment Advisory Contracts and
Management Fees - continued
The Board concluded, taking into account the analysis of the Economies of Scale Committee, that economies of scale, if any, are being appropriately shared between fund shareholders and Fidelity.
Additional Information Requested by the Board. In order to develop fully the factual basis for consideration of the Fidelity funds' Advisory Contracts, the Board requested and received additional information on certain topics, including (i) fund performance trends, actions to be taken by FMR to improve certain funds' overall performance, and Fidelity's long-term strategies for certain funds; (ii) the potential to further rationalize the Fidelity fund lineup with the possibility of achieving savings for the funds and Fidelity; (iii) Fidelity's compensation structure for portfolio managers and other key investment personnel; (iv) the amount of the investment that each portfolio manager has made in the Fidelity fund(s) that he or she manages; (v) the realization of fall-out benefits in certain Fidelity business units; (vi) Fidelity's group fee structures, the potential impact of regulatory changes on such structures, and the rationale for the individual fee rates of certain funds; (vii) fund profitability methodology, including Fidelity's cost allocation methodology, and the impact of certain factors on fund profitability results; (viii) trends regarding industry use of performance fee structures and the possibility of implementing performance fee structures for additional funds; and (ix) the impact of net redemptions from the Fidelity funds.
Based on its evaluation of all of the conclusions noted above, and after considering all factors it believed relevant, the Board ultimately concluded that the advisory fee structures are fair and reasonable, and that the fund's Advisory Contracts should be renewed.
Annual Report
Investment Adviser
Fidelity Management & Research Company
Boston, MA
Investment Sub-Advisers
FMR Co., Inc.
Fidelity Management & Research
(U.K.) Inc.
FIL Investment Advisors
FIL Investments (Japan) Limited
FIL Investment Advisors (U.K.) Limited
Fidelity Management & Research
(Hong Kong) Limited
Fidelity Management & Research
(Japan) Inc.
General Distributor
Fidelity Distributors Corporation
Smithfield, RI
Transfer and Service Agents
Fidelity Investments Institutional Operations Company, Inc.
Boston, MA
Fidelity Service Company, Inc.
Boston, MA
Custodian
The Northern Trust Company
Chicago, IL
(Fidelity Investment logo)(registered trademark)
AIDI-UANN-1212
1.806657.107
Fidelity®
International Discovery
Fund -
Class K
Annual Report
October 31, 2012
(Fidelity Cover Art)
Contents
Performance | (Click Here) | How the fund has done over time. |
Management's Discussion of Fund Performance | (Click Here) | The Portfolio Manager's review of fund performance and strategy. |
Shareholder Expense Example | (Click Here) | An example of shareholder expenses. |
Investment Changes | (Click Here) | A summary of major shifts in the fund's investments over the past six months. |
Investments | (Click Here) | A complete list of the fund's investments with their market values. |
Financial Statements | (Click Here) | Statements of assets and liabilities, operations, and changes in net assets, as well as financial highlights. |
Notes | (Click Here) | Notes to the financial statements. |
Report of Independent Registered Public Accounting Firm | (Click Here) | |
Trustees and Officers | (Click Here) | |
Distributions | (Click Here) | |
Board Approval of Investment Advisory Contracts and Management Fees | (Click Here) | |
To view a fund's proxy voting guidelines and proxy voting record for the 12-month period ended June 30, visit http://www.fidelity.com/proxyvotingresults or visit the Securities and Exchange Commission's (SEC) web site at http://www.sec.gov. You may also call 1-800-835-5092 to request a free copy of the proxy voting guidelines.
Standard & Poor's, S&P and S&P 500 are registered service marks of The McGraw-Hill Companies, Inc. and have been licensed for use by Fidelity Distributors Corporation.
Other third party marks appearing herein are the property of their respective owners.
All other marks appearing herein are registered or unregistered trademarks or service marks of FMR LLC or an affiliated company. © 2012 FMR LLC. All rights reserved.
Annual Report
This report and the financial statements contained herein are submitted for the general information of the shareholders of the fund. This report is not authorized for distribution to prospective investors in the fund unless preceded or accompanied by an effective prospectus.
A fund files its complete schedule of portfolio holdings with the SEC for the first and third quarters of each fiscal year on Form N-Q. Forms N-Q are available on the SEC's web site at http://www.sec.gov. A fund's Forms N-Q may be reviewed and copied at the SEC's Public Reference Room in Washington, DC. Information regarding the operation of the SEC's Public Reference Room may be obtained by calling 1-800-SEC-0330. For a complete list of a fund's portfolio holdings, view the most recent holdings listing, semiannual report, or annual report on Fidelity's web site at http://www.fidelity.com, http://www.advisor.fidelity.com, or http://www.401k.com, as applicable.
NOT FDIC INSURED • MAY LOSE VALUE • NO BANK GUARANTEE
Neither the fund nor Fidelity Distributors Corporation is a bank.
Annual Report
Average annual total return reflects the change in the value of an investment, assuming reinvestment of the class' distributions from dividend income and capital gains (the profits earned upon the sale of securities that have grown in value, if any) and assuming a constant rate of performance each year. The $10,000 table and the fund's returns do not reflect the deduction of taxes that a shareholder would pay on fund distributions or the redemption of fund shares. During periods of reimbursement by Fidelity, a fund's total return will be greater than it would be had the reimbursement not occurred. How a fund did yesterday is no guarantee of how it will do tomorrow.
Average Annual Total Returns
Periods ended October 31, 2012 | Past 1
year | Past 5
years | Past 10
years |
Class KA,B | 9.24% | -5.53% | 9.21% |
A The initial offering of Class K shares took place on May 9, 2008. Returns prior to May 9, 2008 are those of Fidelity® International Discovery Fund, the original class of the fund.
B Prior to October 1, 2004, the fund operated under certain different investment policies. The fund's historical performances may not represent its current investment policies.
$10,000 Over 10 Years
Let's say hypothetically that $10,000 was invested in Fidelity® International Discovery Fund - Class K on October 31, 2002. The chart shows how the value of your investment would have changed, and also shows how the MSCI® EAFE ® Index performed over the same period. The initial offering of Class K took place on May 9, 2008. See above for additional information regarding the performance of Class K.
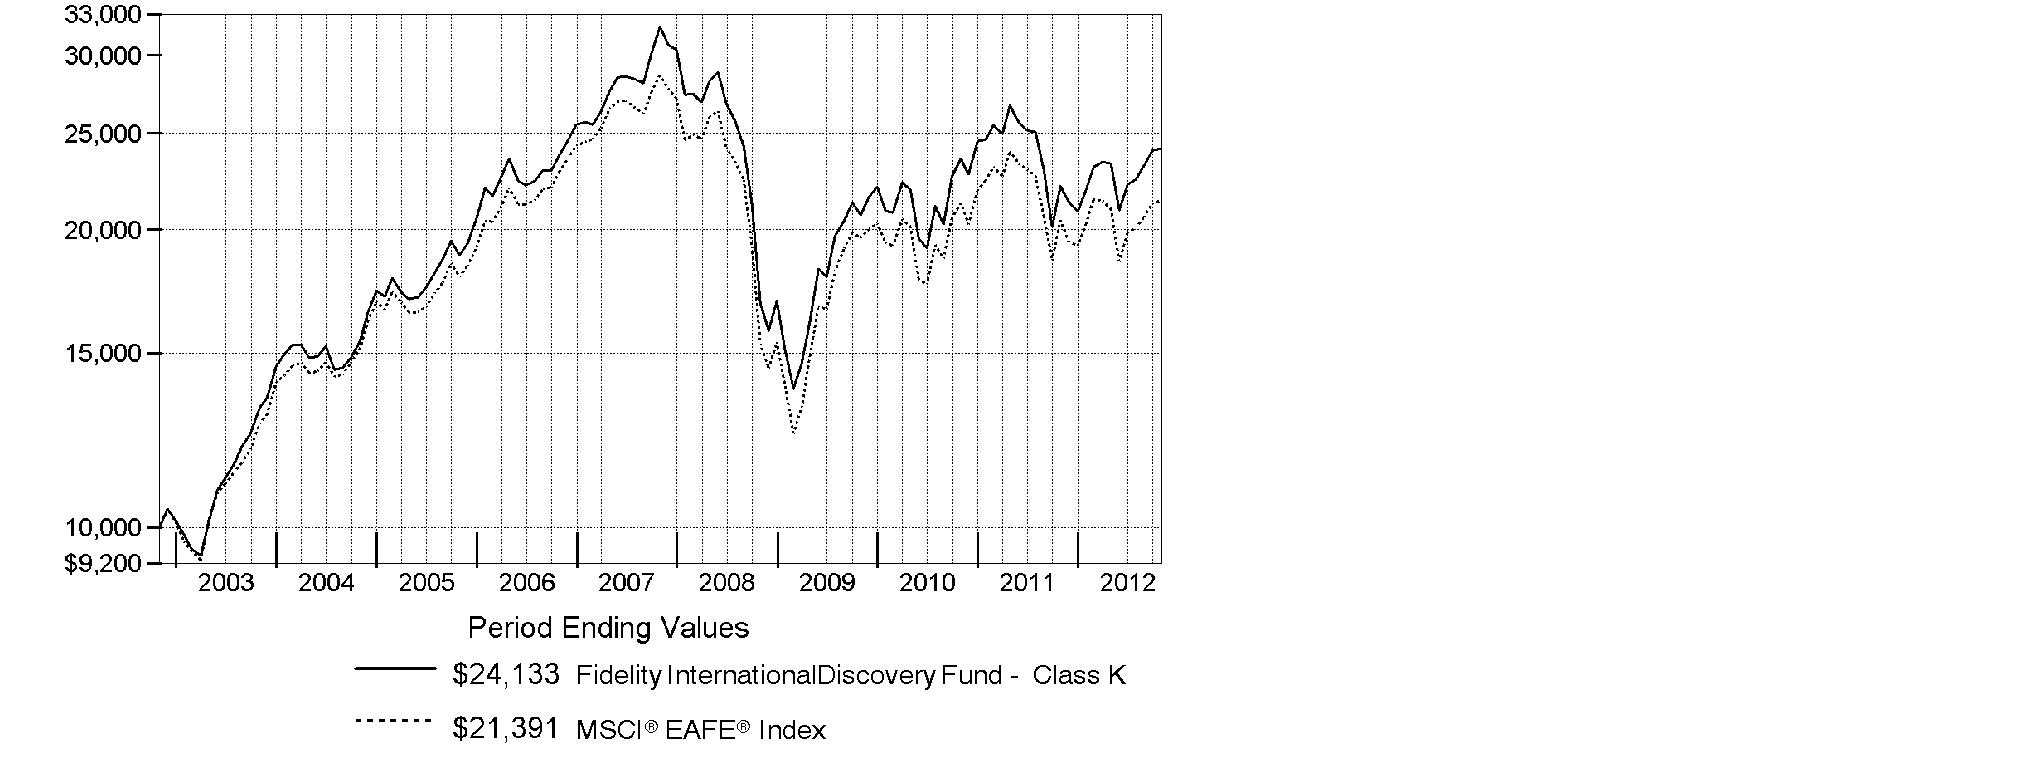
Annual Report
Market Recap: International stocks experienced pendulum-like swings during the 12 months ending October 31, 2012, finishing the period with a modest advance. The market faced periodic bouts of volatility this past year, as a number of macroeconomic concerns - including the eurozone debt crisis, the strength and pace of the U.S. economic recovery, and a slowdown in China's once-blistering growth - dominated headlines and weighed on investors. While a stronger U.S. dollar provided an additional head wind, foreign developed- and emerging-markets stocks still managed a gain for the 12 months, as the MSCI® ACWI® (All Country World Index) ex USA Index rose 4.11%, largely buttressed in the summertime by pledges of accommodative monetary action from eurozone officials, as well as signs that the U.S. housing market was on the mend. Within the index, Asia-Pacific ex Japan showed the most impressive gains, advancing roughly 11%. A number of core European components, most notably Germany (+11%), Switzerland (+10%) and the U.K. (+9%), benefited from optimism about the eurozone's ability to resolve its debt woes, which also helped the region outpace the index overall. Elsewhere, results from Canada (+3%) and the generally more volatile emerging markets (+2%) each fell short of the MSCI index, while Japan was among the few benchmark constituents to finish in the red, returning about -3%.
Comments from William Kennedy, Portfolio Manager of Fidelity® International Discovery Fund: For the year, the fund's Class K shares returned 9.24%, outpacing the 4.76% gain of the MSCI® EAFE® Index. Security selection drove relative performance, with particularly strong contributions my choices within from Europe ex U.K., Japan and emerging markets. Stock picks in consumer staples and information technology also helped. Top individual contributors included Netherlands-based digital security leader Gemalto, whose strong gain was fueled by the worldwide growth of mobile and cloud computing. Shares of Hong Kong's Techtronic Industries, whose products include Ryobi power tools and Hoover vacuums, moved sharply higher, due to resilience in the U.S., where it sells a lot of its goods. An investment in drugstore retailer Cosmos Pharmaceutical in Japan also helped, buoyed by expansion into new markets. By contrast, security selection in the U.K. detracted. The biggest individual disappointments were online retailers in Japan: Start Today and Rakuten. Both stocks declined as business slowed and competition increased. Techtronic, Cosmos and Start Today were not in the index, and Start Today was not held at period end.
The views expressed above reflect those of the portfolio manager(s) only through the end of the period as stated on the cover of this report and do not necessarily represent the views of Fidelity or any other person in the Fidelity organization. Any such views are subject to change at any time based upon market or other conditions and Fidelity disclaims any responsibility to update such views. These views may not be relied on as investment advice and, because investment decisions for a Fidelity fund are based on numerous factors, may not be relied on as an indication of trading intent on behalf of any Fidelity fund.
Annual Report
Shareholder Expense Example
As a shareholder of the Fund, you incur two types of costs: (1) transaction costs, including sales charges (loads) on purchase payments or redemption proceeds, redemption fees and (2) ongoing costs, including management fees, distribution and/or service (12b-1) fees and other Fund expenses. This Example is intended to help you understand your ongoing costs (in dollars) of investing in the Fund and to compare these costs with the ongoing costs of investing in other mutual funds.
The Example is based on an investment of $1,000 invested at the beginning of the period and held for the entire period (May 1, 2012 to October 31, 2012).
Actual Expenses
The first line of the accompanying table for each class of the Fund provides information about actual account values and actual expenses. You may use the information in this line, together with the amount you invested, to estimate the expenses that you paid over the period. Simply divide your account value by $1,000.00 (for example, an $8,600 account value divided by $1,000.00 = 8.6), then multiply the result by the number in the first line for a class of the Fund under the heading entitled "Expenses Paid During Period" to estimate the expenses you paid on your account during this period. A small balance maintenance fee of $12.00 that is charged once a year may apply for certain accounts with a value of less than $2,000. This fee is not included in the table below. If it was, the estimate of expenses you paid during the period would be higher, and your ending account value lower, by this amount. In addition, the Fund, as a shareholder in the underlying Fidelity Central Funds, will indirectly bear its pro-rata share of the fees and expenses incurred by the underlying Fidelity Central Funds. These fees and expenses are not included in the Fund's annualized expense ratio used to calculate the expense estimate in the table below.
Hypothetical Example for Comparison Purposes
The second line of the accompanying table for each class of the Fund provides information about hypothetical account values and hypothetical expenses based on a Class' actual expense ratio and an assumed rate of return of 5% per year before expenses, which is not the Class' actual return. The hypothetical account values and expenses may not be used to estimate the actual ending account balance or expenses you paid for the period. You may use this information to compare the ongoing costs of investing in the Fund and other funds. To do so, compare this 5% hypothetical example with the 5% hypothetical examples that appear in the shareholder reports of the other funds. A small balance maintenance fee of $12.00 that is charged once a year may apply for certain accounts with a value of less than $2,000. This fee is not included in the table below. If it was, the estimate of expenses you paid during the period would be higher, and your ending account value lower, by this amount. In addition, the Fund, as a shareholder in the underlying Fidelity Central Funds, will indirectly bear its pro-rata share of the fees and expenses incurred by the underlying Fidelity Central Funds. These fees and expenses are not included in the Fund's annualized expense ratio used to calculate the expense estimate in the table below.
Please note that the expenses shown in the table are meant to highlight your ongoing costs only and do not reflect any transaction costs. Therefore, the second line of the table is useful in comparing ongoing costs only, and will not help you determine the relative total costs of owning different funds. In addition, if these transactional costs were included, your costs would have been higher.
Annual Report
| Annualized
Expense Ratio | Beginning
Account Value
May 1, 2012 | Ending
Account Value
October 31, 2012 | Expenses Paid
During Period*
May 1, 2012
to October 31, 2012 |
Class A | 1.41% | | | |
Actual | | $ 1,000.00 | $ 1,033.30 | $ 7.21 |
HypotheticalA | | $ 1,000.00 | $ 1,018.05 | $ 7.15 |
Class T | 1.67% | | | |
Actual | | $ 1,000.00 | $ 1,031.90 | $ 8.53 |
HypotheticalA | | $ 1,000.00 | $ 1,016.74 | $ 8.47 |
Class B | 2.16% | | | |
Actual | | $ 1,000.00 | $ 1,029.30 | $ 11.02 |
HypotheticalA | | $ 1,000.00 | $ 1,014.28 | $ 10.94 |
Class C | 2.16% | | | |
Actual | | $ 1,000.00 | $ 1,029.60 | $ 11.02 |
HypotheticalA | | $ 1,000.00 | $ 1,014.28 | $ 10.94 |
International Discovery | 1.08% | | | |
Actual | | $ 1,000.00 | $ 1,035.00 | $ 5.52 |
HypotheticalA | | $ 1,000.00 | $ 1,019.71 | $ 5.48 |
Class K | .90% | | | |
Actual | | $ 1,000.00 | $ 1,035.70 | $ 4.61 |
HypotheticalA | | $ 1,000.00 | $ 1,020.61 | $ 4.57 |
Institutional Class | 1.07% | | | |
Actual | | $ 1,000.00 | $ 1,035.10 | $ 5.47 |
HypotheticalA | | $ 1,000.00 | $ 1,019.76 | $ 5.43 |
A 5% return per year before expenses
* Expenses are equal to each Class' annualized expense ratio, multiplied by the average account value over the period, multiplied by 184/366 (to reflect the one-half year period).
Annual Report
Investment Changes (Unaudited)
Geographic Diversification (% of fund's net assets) |
As of October 31, 2012 |
 | United Kingdom 21.2% | |
 | Japan 16.1% | |
 | France 8.5% | |
 | Germany 8.3% | |
 | United States of America 7.0% | |
 | Switzerland 5.3% | |
 | Netherlands 3.2% | |
 | Australia 3.0% | |
 | Italy 2.7% | |
| Other 24.7% | |

Percentages are based on country or territory of incorporation and are adjusted for the effect of futures contracts, if applicable. |
As of April 30, 2012 |
| United Kingdom 21.0% | |
| Japan 16.7% | |
| United States of America 6.7% | |
| France 6.2% | |
| Germany 5.4% | |
| Netherlands 4.7% | |
| Switzerland 4.5% | |
| Korea (South) 3.9% | |
| Australia 3.4% | |
| Other 27.5% | |

Percentages are based on country or territory of incorporation and are adjusted for the effect of futures contracts, if applicable. |
Asset Allocation |
| % of fund's
net assets | % of fund's net assets
6 months ago |
Stocks and Investment Companies | 96.7 | 97.5 |
Short-Term Investments and Net Other Assets (Liabilities) | 3.3 | 2.5 |
Top Ten Stocks as of October 31, 2012 |
| % of fund's
net assets | % of fund's net assets
6 months ago |
Royal Dutch Shell PLC Class B (United Kingdom) (United Kingdom, Oil, Gas & Consumable Fuels) | 2.6 | 2.7 |
ORIX Corp. (Japan, Diversified Financial Services) | 1.6 | 1.5 |
Anheuser-Busch InBev SA NV (Belgium, Beverages) | 1.6 | 1.3 |
Novo Nordisk A/S Series B (Denmark, Pharmaceuticals) | 1.6 | 1.4 |
BHP Billiton PLC (United Kingdom, Metals & Mining) | 1.5 | 1.3 |
Australia & New Zealand Banking Group Ltd. (Australia, Commercial Banks) | 1.5 | 1.3 |
Vodafone Group PLC (United Kingdom, Wireless Telecommunication Services) | 1.4 | 1.1 |
British American Tobacco PLC (United Kingdom) (United Kingdom, Tobacco) | 1.4 | 1.8 |
Diageo PLC (United Kingdom, Beverages) | 1.4 | 1.2 |
BNP Paribas SA (France, Commercial Banks) | 1.3 | 0.7 |
| 15.9 | |
Market Sectors as of October 31, 2012 |
| % of fund's
net assets | % of fund's net assets
6 months ago |
Financials | 23.0 | 18.9 |
Consumer Discretionary | 15.5 | 15.8 |
Industrials | 13.5 | 12.6 |
Information Technology | 10.4 | 12.7 |
Consumer Staples | 9.7 | 11.2 |
Health Care | 7.2 | 6.5 |
Materials | 6.4 | 7.5 |
Energy | 5.9 | 6.7 |
Telecommunication Services | 4.2 | 4.9 |
Utilities | 0.9 | 0.7 |
Annual Report
Investments October 31, 2012
Showing Percentage of Net Assets
Common Stocks - 95.5% |
| Shares | | Value (000s) |
Australia - 3.0% |
Australia & New Zealand Banking Group Ltd. | 4,818,449 | | $ 127,296 |
Commonwealth Bank of Australia | 1,009,530 | | 60,519 |
Ramsay Health Care Ltd. | 1,305,776 | | 32,206 |
Spark Infrastructure Group unit | 19,962,099 | | 35,020 |
TOTAL AUSTRALIA | | 255,041 |
Bailiwick of Jersey - 1.9% |
Experian PLC | 5,023,200 | | 86,736 |
Wolseley PLC | 1,576,864 | | 68,935 |
TOTAL BAILIWICK OF JERSEY | | 155,671 |
Belgium - 1.6% |
Anheuser-Busch InBev SA NV | 1,604,727 | | 134,205 |
Bermuda - 0.5% |
Cheung Kong Infrastructure Holdings Ltd. | 6,458,000 | | 37,831 |
Brazil - 1.2% |
Arezzo Industria e Comercio SA | 570,800 | | 10,188 |
Qualicorp SA (a) | 4,567,000 | | 46,861 |
Souza Cruz SA | 1,909,200 | | 24,910 |
Totvs SA | 1,077,500 | | 21,910 |
TOTAL BRAZIL | | 103,869 |
British Virgin Islands - 0.3% |
Gem Diamonds Ltd. (a) | 716,328 | | 1,951 |
Mail.ru Group Ltd. GDR (Reg. S) | 676,800 | | 22,571 |
TOTAL BRITISH VIRGIN ISLANDS | | 24,522 |
Canada - 0.5% |
Goldcorp, Inc. | 571,200 | | 25,822 |
InterOil Corp. (a)(d) | 204,400 | | 13,180 |
TOTAL CANADA | | 39,002 |
Cayman Islands - 0.4% |
Eurasia Drilling Co. Ltd. GDR (Reg. S) | 439,400 | | 15,203 |
Sands China Ltd. | 4,911,200 | | 18,472 |
TOTAL CAYMAN ISLANDS | | 33,675 |
Denmark - 1.9% |
Novo Nordisk A/S Series B | 819,389 | | 131,361 |
William Demant Holding A/S (a) | 337,100 | | 28,993 |
TOTAL DENMARK | | 160,354 |
Common Stocks - continued |
| Shares | | Value (000s) |
France - 8.5% |
Arkema SA | 341,370 | | $ 31,123 |
Atos Origin SA | 384,842 | | 25,843 |
AXA SA | 4,066,402 | | 64,645 |
BNP Paribas SA | 2,238,845 | | 112,622 |
Bureau Veritas SA | 535,700 | | 56,888 |
Credit Agricole SA (a) | 3,474,800 | | 26,158 |
Iliad SA | 339,150 | | 52,245 |
Lafarge SA (Bearer) | 458,700 | | 26,861 |
LVMH Moet Hennessy - Louis Vuitton SA | 428,223 | | 69,602 |
PPR SA | 398,700 | | 70,101 |
Sanofi SA | 953,011 | | 83,701 |
Schneider Electric SA | 1,208,000 | | 75,524 |
Technip SA | 192,300 | | 21,660 |
TOTAL FRANCE | | 716,973 |
Germany - 7.1% |
Aareal Bank AG (a) | 1,044,895 | | 22,414 |
Allianz AG | 385,690 | | 47,822 |
BASF AG | 979,717 | | 81,182 |
Bayerische Motoren Werke AG (BMW) | 959,142 | | 76,394 |
Brenntag AG | 288,900 | | 36,412 |
Fresenius Medical Care AG & Co. KGaA | 384,000 | | 26,981 |
Fresenius SE & Co. KGaA | 161,700 | | 18,444 |
GEA Group AG | 992,880 | | 31,002 |
Gerry Weber International AG (Bearer) | 320,600 | | 14,552 |
GSW Immobilien AG | 497,845 | | 20,484 |
HeidelbergCement Finance AG | 504,300 | | 26,728 |
MTU Aero Engines Holdings AG | 286,300 | | 24,039 |
SAP AG | 1,172,710 | | 85,518 |
Siemens AG | 442,361 | | 44,572 |
Wirecard AG | 1,592,900 | | 36,400 |
TOTAL GERMANY | | 592,944 |
Hong Kong - 1.9% |
AIA Group Ltd. | 15,454,400 | | 61,219 |
HKT Trust / HKT Ltd. unit | 23,518,000 | | 21,818 |
Techtronic Industries Co. Ltd. | 39,683,000 | | 75,576 |
TOTAL HONG KONG | | 158,613 |
India - 1.0% |
Apollo Hospitals Enterprise Ltd. | 442,506 | | 6,415 |
Common Stocks - continued |
| Shares | | Value (000s) |
India - continued |
Housing Development Finance Corp. Ltd. | 3,327,565 | | $ 47,147 |
Titan Industries Ltd. | 6,456,377 | | 31,115 |
TOTAL INDIA | | 84,677 |
Indonesia - 0.7% |
PT Media Nusantara Citra Tbk | 42,573,500 | | 12,522 |
PT Sarana Menara Nusantara Tbk (a) | 6,310,500 | | 12,811 |
PT Tower Bersama Infrastructure Tbk (a) | 55,223,500 | | 28,747 |
TOTAL INDONESIA | | 54,080 |
Ireland - 1.8% |
Accenture PLC Class A | 854,400 | | 57,595 |
James Hardie Industries NV CDI | 6,070,470 | | 58,162 |
Paddy Power PLC (Ireland) | 503,500 | | 37,160 |
TOTAL IRELAND | | 152,917 |
Israel - 0.4% |
Check Point Software Technologies Ltd. (a) | 743,300 | | 33,099 |
Italy - 2.7% |
ENI SpA | 2,799,900 | | 64,428 |
Fiat Industrial SpA | 3,323,832 | | 35,995 |
Prada SpA | 4,029,100 | | 32,856 |
Prysmian SpA | 1,518,800 | | 29,214 |
Saipem SpA | 1,502,203 | | 67,486 |
TOTAL ITALY | | 229,979 |
Japan - 16.1% |
ABC-Mart, Inc. | 1,177,300 | | 51,617 |
Aeon Credit Service Co. Ltd. | 2,050,800 | | 43,518 |
Aozora Bank Ltd. | 7,872,000 | | 22,187 |
Calbee, Inc. | 351,700 | | 32,293 |
Chiyoda Corp. | 2,780,000 | | 44,853 |
Cosmos Pharmaceutical Corp. | 419,800 | | 41,386 |
Credit Saison Co. Ltd. | 881,500 | | 19,357 |
Daito Trust Construction Co. Ltd. | 212,800 | | 21,485 |
Don Quijote Co. Ltd. | 1,818,400 | | 71,638 |
Fanuc Corp. | 290,400 | | 46,236 |
Fast Retailing Co. Ltd. | 210,800 | | 46,950 |
Hitachi Ltd. | 8,642,000 | | 45,792 |
Honda Motor Co. Ltd. | 1,472,400 | | 44,265 |
Japan Tobacco, Inc. | 2,815,200 | | 77,794 |
JS Group Corp. | 1,856,500 | | 41,046 |
Common Stocks - continued |
| Shares | | Value (000s) |
Japan - continued |
JSR Corp. | 2,283,400 | | $ 39,129 |
Kakaku.com, Inc. | 810,600 | | 27,771 |
Keyence Corp. | 304,060 | | 80,671 |
Mitsubishi Estate Co. Ltd. | 2,651,000 | | 52,436 |
Mitsubishi UFJ Financial Group, Inc. | 15,161,400 | | 68,590 |
Nintendo Co. Ltd. | 201,200 | | 25,909 |
ORIX Corp. | 1,321,050 | | 135,696 |
Park24 Co. Ltd. | 1,342,800 | | 23,078 |
Rakuten, Inc. | 7,986,500 | | 71,831 |
Seven Bank Ltd. | 12,837,900 | | 36,666 |
Ship Healthcare Holdings, Inc. | 534,800 | | 17,840 |
So-net M3, Inc. | 5,725 | | 11,001 |
Softbank Corp. | 775,300 | | 24,542 |
Suzuki Motor Corp. | 1,383,700 | | 31,338 |
Unicharm Corp. | 622,700 | | 33,697 |
USS Co. Ltd. | 196,050 | | 20,605 |
TOTAL JAPAN | | 1,351,217 |
Korea (South) - 2.5% |
Hyundai Motor Co. | 273,935 | | 56,404 |
Kia Motors Corp. | 285,255 | | 15,854 |
LG Household & Health Care Ltd. | 56,182 | | 33,029 |
NHN Corp. | 64,289 | | 14,888 |
Orion Corp. | 14,973 | | 14,062 |
Samsung Electronics Co. Ltd. | 64,872 | | 77,943 |
TOTAL KOREA (SOUTH) | | 212,180 |
Luxembourg - 0.6% |
Brait SA | 6,003,514 | | 23,611 |
Samsonite International SA | 12,773,700 | | 26,536 |
TOTAL LUXEMBOURG | | 50,147 |
Netherlands - 3.2% |
AEGON NV | 5,028,800 | | 28,124 |
ASML Holding NV | 1,002,900 | | 55,129 |
Gemalto NV | 609,781 | | 55,025 |
ING Groep NV (Certificaten Van Aandelen) (a) | 5,244,400 | | 46,665 |
LyondellBasell Industries NV Class A | 474,800 | | 25,350 |
Randstad Holding NV | 687,872 | | 22,455 |
Yandex NV (a) | 1,582,600 | | 36,843 |
TOTAL NETHERLANDS | | 269,591 |
Common Stocks - continued |
| Shares | | Value (000s) |
Norway - 1.1% |
DnB NOR ASA | 5,448,955 | | $ 68,049 |
Gjensidige Forsikring ASA | 1,761,200 | | 25,732 |
TOTAL NORWAY | | 93,781 |
Poland - 0.5% |
Eurocash SA | 3,593,990 | | 43,891 |
Qatar - 0.2% |
Commercial Bank of Qatar GDR (Reg. S) | 5,094,802 | | 20,122 |
Russia - 0.6% |
Mobile TeleSystems OJSC sponsored ADR | 2,888,700 | | 49,512 |
South Africa - 0.4% |
Shoprite Holdings Ltd. | 1,552,300 | | 31,921 |
Spain - 2.2% |
Amadeus IT Holding SA Class A | 1,011,100 | | 25,031 |
Banco Bilbao Vizcaya Argentaria SA | 6,088,557 | | 50,876 |
Grifols SA ADR | 1,151,000 | | 28,959 |
Inditex SA | 651,829 | | 83,169 |
TOTAL SPAIN | | 188,035 |
Sweden - 2.4% |
Atlas Copco AB (A Shares) | 2,847,300 | | 70,014 |
Intrum Justitia AB | 1,835,800 | | 26,570 |
Svenska Handelsbanken AB (A Shares) | 1,879,500 | | 64,379 |
Swedish Match Co. AB | 1,250,800 | | 42,618 |
TOTAL SWEDEN | | 203,581 |
Switzerland - 5.3% |
Adecco SA (Reg.) | 574,043 | | 27,762 |
Partners Group Holding AG | 230,056 | | 48,689 |
Roche Holding AG (participation certificate) | 394,417 | | 75,851 |
Schindler Holding AG (participation certificate) | 554,147 | | 73,010 |
SGS SA (Reg.) | 12,520 | | 26,511 |
Swatch Group AG (Bearer) | 36,702 | | 15,188 |
Syngenta AG (Switzerland) | 81,540 | | 31,792 |
UBS AG | 4,126,610 | | 61,914 |
Zurich Financial Services AG | 346,539 | | 85,398 |
TOTAL SWITZERLAND | | 446,115 |
Turkey - 0.1% |
Boyner Buyuk Magazacilik A/S (a)(e) | 4,683,100 | | 10,764 |
United Kingdom - 21.2% |
Aberdeen Asset Management PLC | 5,975,132 | | 31,289 |
Common Stocks - continued |
| Shares | | Value (000s) |
United Kingdom - continued |
Aggreko PLC | 1,385,300 | | $ 48,064 |
Anglo American PLC (United Kingdom) | 774,600 | | 23,788 |
Ashmore Group PLC | 3,169,400 | | 18,602 |
Barclays PLC | 12,279,312 | | 45,406 |
Bellway PLC | 972,300 | | 15,863 |
BG Group PLC | 4,571,872 | | 84,661 |
BHP Billiton PLC | 3,972,023 | | 127,308 |
British American Tobacco PLC (United Kingdom) | 2,438,600 | | 120,954 |
British Land Co. PLC | 5,756,734 | | 49,097 |
Diageo PLC | 4,065,857 | | 116,237 |
Domino's Pizza UK & IRL PLC | 2,378,100 | | 19,399 |
GlaxoSmithKline PLC | 2,658,600 | | 59,572 |
Hikma Pharmaceuticals PLC | 1,964,745 | | 23,447 |
HSBC Holdings PLC (United Kingdom) | 10,856,757 | | 107,040 |
Intertek Group PLC | 748,200 | | 34,037 |
Jazztel PLC (a) | 5,843,900 | | 38,706 |
Legal & General Group PLC | 36,980,100 | | 79,967 |
Lloyds Banking Group PLC (a) | 46,760,800 | | 30,792 |
London Stock Exchange Group PLC | 1,497,400 | | 23,572 |
Meggitt PLC | 6,792,200 | | 42,309 |
Next PLC | 514,144 | | 29,587 |
Ocado Group PLC (a)(d) | 14,388,400 | | 14,976 |
Persimmon PLC | 2,345,100 | | 30,086 |
Rolls-Royce Group PLC | 4,197,715 | | 57,884 |
Rolls-Royce Group PLC Class C | 319,026,340 | | 515 |
Rotork PLC | 717,800 | | 26,387 |
Royal Dutch Shell PLC Class B (United Kingdom) | 6,206,463 | | 219,543 |
SABMiller PLC | 1,096,800 | | 46,984 |
Standard Chartered PLC (United Kingdom) | 1,697,617 | | 40,093 |
Taylor Wimpey PLC | 21,518,200 | | 21,217 |
The Weir Group PLC | 747,600 | | 21,016 |
Ultra Electronics Holdings PLC | 614,667 | | 16,793 |
Vodafone Group PLC | 45,146,543 | | 122,602 |
TOTAL UNITED KINGDOM | | 1,787,793 |
United States of America - 3.7% |
Beam, Inc. | 387,400 | | 21,524 |
Citrix Systems, Inc. (a) | 303,600 | | 18,766 |
Cognizant Technology Solutions Corp. Class A (a) | 405,700 | | 27,040 |
Dollar General Corp. (a) | 378,800 | | 18,417 |
GNC Holdings, Inc. | 770,900 | | 29,811 |
MasterCard, Inc. Class A | 160,100 | | 73,795 |
Common Stocks - continued |
| Shares | | Value (000s) |
United States of America - continued |
Michael Kors Holdings Ltd. | 542,300 | | $ 29,658 |
Royal Gold, Inc. | 394,800 | | 34,774 |
Total System Services, Inc. | 1,094,700 | | 24,620 |
Watson Pharmaceuticals, Inc. (a) | 308,100 | | 26,481 |
Workday, Inc. | 102,600 | | 4,976 |
TOTAL UNITED STATES OF AMERICA | | 309,862 |
TOTAL COMMON STOCKS (Cost $7,245,196) |
8,035,964
|
Nonconvertible Preferred Stocks - 1.2% |
| | | |
Germany - 1.2% |
Volkswagen AG
(Cost $69,724) | 478,400 | |
98,964
|
Investment Companies - 0.0% |
| | | |
Cyprus - 0.0% |
Aisi Realty Public Ltd. (a)
(Cost $7,371) | 529,830 | |
628
|
Money Market Funds - 3.2% |
| | | |
Fidelity Cash Central Fund, 0.19% (b) | 250,136,921 | | 250,137 |
Fidelity Securities Lending Cash Central Fund, 0.19% (b)(c) | 24,238,785 | | 24,239 |
TOTAL MONEY MARKET FUNDS (Cost $274,376) |
274,376
|
TOTAL INVESTMENT PORTFOLIO - 99.9% (Cost $7,596,667) | | 8,409,932 |
NET OTHER ASSETS (LIABILITIES) - 0.1% | | 6,607 |
NET ASSETS - 100% | $ 8,416,539 |
Legend |
(a) Non-income producing |
(b) Affiliated fund that is available only to investment companies and other accounts managed by Fidelity Investments. The rate quoted is the annualized seven-day yield of the fund at period end. A complete unaudited listing of the fund's holdings as of its most recent quarter end is available upon request. In addition, each Fidelity Central Fund's financial statements, which are not covered by the Fund's Report of Independent Registered Public Accounting Firm, are available on the SEC's website or upon request. |
(c) Investment made with cash collateral received from securities on loan. |
(d) Security or a portion of the security is on loan at period end. |
(e) Affiliated company |
Affiliated Central Funds |
Information regarding fiscal year to date income earned by the Fund from investments in Fidelity Central Funds is as follows: |
Fund | Income earned
(Amounts in thousands) |
Fidelity Cash Central Fund | $ 136 |
Fidelity Securities Lending Cash Central Fund | 4,230 |
Total | $ 4,366 |
Other Affiliated Issuers |
An affiliated company is a company in which the Fund has ownership of at least 5% of the voting securities. Fiscal year to date transactions with companies which are or were affiliates are as follows: |
Affiliate
(Amounts in thousands) | Value, beginning of period | Purchases | Sales Proceeds | Dividend Income | Value,
end of
period |
Aisi Realty Public Ltd. | $ 240 | $ 469 | $ - | $ - | $ - |
Boyner Buyuk Magazacilik A/S | 10,096 | - | 1,569 | - | 10,764 |
China Kanghui Holdings sponsored ADR | 27,375 | - | 53,149 | - | - |
Total | $ 37,711 | $ 469 | $ 54,718 | $ - | $ 10,764 |
Other Information |
Categorizations in the Schedule of Investments are based on country or territory of incorporation. |
The following is a summary of the inputs used, as of October 31, 2012, involving the Fund's assets and liabilities carried at fair value. The inputs or methodology used for valuing securities may not be an indication of the risk associated with investing in those securities. For more information on valuation inputs, and their aggregation into the levels used in the table below, please refer to the Security Valuation section in the accompanying Notes to Financial Statements. |
Valuation Inputs at Reporting Date: |
Description
(Amounts in thousands) | Total | Level 1 | Level 2 | Level 3 |
Investments in Securities: | | | | |
Equities: | | | | |
Consumer Discretionary | $ 1,302,675 | $ 1,258,410 | $ 44,265 | $ - |
Consumer Staples | 815,505 | 444,109 | 371,396 | - |
Energy | 486,161 | 202,190 | 283,971 | - |
Financials | 1,939,678 | 1,500,271 | 439,407 | - |
Health Care | 618,113 | 316,498 | 301,615 | - |
Industrials | 1,137,857 | 1,093,285 | 44,572 | - |
Information Technology | 877,135 | 791,617 | 85,518 | - |
Materials | 533,970 | 374,870 | 159,100 | - |
Telecommunication Services | 350,983 | 228,381 | 122,602 | - |
Utilities | 72,851 | 72,851 | - | - |
Investment Companies | 628 | 628 | - | - |
Money Market Funds | 274,376 | 274,376 | - | - |
Total Investments in Securities: | $ 8,409,932 | $ 6,557,486 | $ 1,852,446 | $ - |
The following is a summary of transfers between Level 1 and Level 2 for the period ended October 31, 2012. Transfers are assumed to have occurred at the beginning of the period, and are primarily attributable to the valuation techniques used for foreign equity securities, as discussed in the accompanying Notes to Financial Statements: |
Transfers | Total (000s) |
Level 1 to Level 2 | $ 0 |
Level 2 to Level 1 | $ 1,546,324 |
See accompanying notes which are an integral part of the financial statements.
Annual Report
Statement of Assets and Liabilities
Amounts in thousands (except per-share amounts) | October 31, 2012 |
| | |
Assets | | |
Investment in securities, at value (including securities loaned of $22,961) - See accompanying schedule: Unaffiliated issuers (cost $7,310,529) | $ 8,124,792 | |
Fidelity Central Funds (cost $274,376) | 274,376 | |
Other affiliated issuers (cost $11,762) | 10,764 | |
Total Investments (cost $7,596,667) | | $ 8,409,932 |
Receivable for investments sold | | 58,219 |
Receivable for fund shares sold | | 9,069 |
Dividends receivable | | 15,860 |
Distributions receivable from Fidelity Central Funds | | 76 |
Other receivables | | 4,417 |
Total assets | | 8,497,573 |
| | |
Liabilities | | |
Payable for investments purchased | $ 8,942 | |
Payable for fund shares redeemed | 39,507 | |
Accrued management fee | 6,216 | |
Distribution and service plan fees payable | 113 | |
Other affiliated payables | 1,450 | |
Other payables and accrued expenses | 567 | |
Collateral on securities loaned, at value | 24,239 | |
Total liabilities | | 81,034 |
| | |
Net Assets | | $ 8,416,539 |
Net Assets consist of: | | |
Paid in capital | | $ 9,152,089 |
Undistributed net investment income | | 126,507 |
Accumulated undistributed net realized gain (loss) on investments and foreign currency transactions | | (1,674,222) |
Net unrealized appreciation (depreciation) on investments and assets and liabilities in foreign currencies | | 812,165 |
Net Assets | | $ 8,416,539 |
See accompanying notes which are an integral part of the financial statements.
Annual Report
Financial Statements - continued
Statement of Assets and Liabilities - continued
Amounts in thousands (except per-share amounts) | October 31, 2012 |
| | |
Calculation of Maximum Offering Price
Class A:
Net Asset Value and redemption price per share ($298,501 ÷ 9,429.0 shares) | | $ 31.66 |
| | |
Maximum offering price per share (100/94.25 of $31.66) | | $ 33.59 |
Class T:
Net Asset Value and redemption price per share ($45,884 ÷ 1,460.2 shares) | | $ 31.42 |
| | |
Maximum offering price per share (100/96.50 of $31.42) | | $ 32.56 |
Class B:
Net Asset Value and offering price per share ($7,536 ÷ 240.9 shares)A | | $ 31.28 |
| | |
Class C:
Net Asset Value and offering price per share ($29,746 ÷ 949.8 shares)A | | $ 31.32 |
| | |
International Discovery:
Net Asset Value, offering price and redemption price per share ($5,964,762 ÷ 186,908.1 shares) | | $ 31.91 |
| | |
Class K:
Net Asset Value, offering price and redemption price per share ($1,775,900 ÷ 55,719.4 shares) | | $ 31.87 |
| | |
Institutional Class:
Net Asset Value, offering price and redemption price per share ($294,210 ÷ 9,232.8 shares) | | $ 31.87 |
A Redemption price per share is equal to net asset value less any applicable contingent deferred sales charge.
See accompanying notes which are an integral part of the financial statements.
Annual Report
Statement of Operations
Amounts in thousands | Year ended October 31, 2012 |
| | |
Investment Income | | |
Dividends | | $ 229,743 |
Interest | | 19 |
Income from Fidelity Central Funds | | 4,366 |
Income before foreign taxes withheld | | 234,128 |
Less foreign taxes withheld | | (11,538) |
Total income | | 222,590 |
| | |
Expenses | | |
Management fee
Basic fee | $ 58,065 | |
Performance adjustment | 2,707 | |
Transfer agent fees | 16,195 | |
Distribution and service plan fees | 1,384 | |
Accounting and security lending fees | 1,720 | |
Custodian fees and expenses | 1,316 | |
Independent trustees' compensation | 54 | |
Registration fees | 181 | |
Audit | 114 | |
Legal | 42 | |
Interest | 5 | |
Miscellaneous | 95 | |
Total expenses before reductions | 81,878 | |
Expense reductions | (2,500) | 79,378 |
Net investment income (loss) | | 143,212 |
Realized and Unrealized Gain (Loss) Net realized gain (loss) on: | | |
Investment securities: | | |
Unaffiliated issuers | (217,363) | |
Other affiliated issuers | 11,560 | |
Foreign currency transactions | (1,776) | |
Total net realized gain (loss) | | (207,579) |
Change in net unrealized appreciation (depreciation) on: Investment securities (net of decrease in deferred foreign taxes of $1,062) | 763,571 | |
Assets and liabilities in foreign currencies | (1,430) | |
Total change in net unrealized appreciation (depreciation) | | 762,141 |
Net gain (loss) | | 554,562 |
Net increase (decrease) in net assets resulting from operations | | $ 697,774 |
See accompanying notes which are an integral part of the financial statements.
Annual Report
Financial Statements - continued
Statement of Changes in Net Assets
Amounts in thousands | Year ended
October 31,
2012 | Year ended
October 31,
2011 |
Increase (Decrease) in Net Assets | | |
Operations | | |
Net investment income (loss) | $ 143,212 | $ 161,608 |
Net realized gain (loss) | (207,579) | 501,938 |
Change in net unrealized appreciation (depreciation) | 762,141 | (1,247,522) |
Net increase (decrease) in net assets resulting
from operations | 697,774 | (583,976) |
Distributions to shareholders from net investment income | (118,968) | (149,936) |
Distributions to shareholders from net realized gain | - | (48,090) |
Total distributions | (118,968) | (198,026) |
Share transactions - net increase (decrease) | (915,362) | (537,341) |
Redemption fees | 128 | 160 |
Total increase (decrease) in net assets | (336,428) | (1,319,183) |
| | |
Net Assets | | |
Beginning of period | 8,752,967 | 10,072,150 |
End of period (including undistributed net investment income of $126,507 and undistributed net investment income of $102,433, respectively) | $ 8,416,539 | $ 8,752,967 |
See accompanying notes which are an integral part of the financial statements.
Annual Report
Financial Highlights - Class A
Years ended October 31, | 2012 | 2011 | 2010 | 2009 | 2008 |
Selected Per-Share Data | | | | | |
Net asset value, beginning of period | $ 29.43 | $ 32.07 | $ 28.57 | $ 23.68 | $ 47.34 |
Income from Investment Operations | | | | | |
Net investment income (loss) C | .41 | .42 | .31 | .31 | .46 |
Net realized and unrealized gain (loss) | 2.11 | (2.52) | 3.51 | 4.84 | (22.08) |
Total from investment operations | 2.52 | (2.10) | 3.82 | 5.15 | (21.62) |
Distributions from net investment income | (.29) | (.38) | (.28) | (.26) | (.37) |
Distributions from net realized gain | - | (.16) | (.04) | - | (1.67) |
Total distributions | (.29) | (.54) | (.32) | (.26) | (2.04) |
Redemption fees added to paid in capital C, G | - | - | - | - | - |
Net asset value, end of period | $ 31.66 | $ 29.43 | $ 32.07 | $ 28.57 | $ 23.68 |
Total Return A, B | 8.70% | (6.71)% | 13.43% | 22.14% | (47.65)% |
Ratios to Average Net Assets D, F | | | | | |
Expenses before reductions | 1.34% | 1.30% | 1.33% | 1.37% | 1.32% |
Expenses net of fee waivers, if any | 1.34% | 1.29% | 1.33% | 1.37% | 1.32% |
Expenses net of all reductions | 1.31% | 1.25% | 1.28% | 1.32% | 1.29% |
Net investment income (loss) | 1.41% | 1.31% | 1.06% | 1.28% | 1.27% |
Supplemental Data | | | | | |
Net assets, end of period (in millions) | $ 299 | $ 320 | $ 392 | $ 414 | $ 380 |
Portfolio turnover rate E | 68% | 75% | 82% | 98% | 79% |
A Total returns would have been lower if certain expenses had not been reduced during the applicable periods shown.
B Total returns do not include the effect of the sales charges.
C Calculated based on average shares outstanding during the period.
D Fees and expenses of any underlying Fidelity Central Funds are not included in the Fund's expense ratio. The Fund indirectly bears its proportionate share of the expenses of any underlying Fidelity Central Funds.
E Amount does not include the portfolio activity of any underlying Fidelity Central Funds.
F Expense ratios reflect operating expenses of the class. Expenses before reductions do not reflect amounts reimbursed by the investment adviser or reductions from brokerage service arrangements or reductions from other expense offset arrangements and do not represent the amount paid by the class during periods when reimbursements or reductions occur. Expenses net of fee waivers reflect expenses after reimbursement by the investment adviser but prior to reductions from brokerage service arrangements or other expense offset arrangements. Expenses net of all reductions represent the net expenses paid by the class.
G Amount represents less than $.01 per share.
See accompanying notes which are an integral part of the financial statements.
Annual Report
Financial Highlights - Class T
Years ended October 31, | 2012 | 2011 | 2010 | 2009 | 2008 |
Selected Per-Share Data | | | | | |
Net asset value, beginning of period | $ 29.18 | $ 31.81 | $ 28.35 | $ 23.49 | $ 47.06 |
Income from Investment Operations | | | | | |
Net investment income (loss) C | .34 | .34 | .23 | .24 | .33 |
Net realized and unrealized gain (loss) | 2.09 | (2.51) | 3.48 | 4.81 | (21.94) |
Total from investment operations | 2.43 | (2.17) | 3.71 | 5.05 | (21.61) |
Distributions from net investment income | (.19) | (.30) | (.21) | (.19) | (.29) |
Distributions from net realized gain | - | (.16) | (.04) | - | (1.67) |
Total distributions | (.19) | (.46) | (.25) | (.19) | (1.96) |
Redemption fees added to paid in capital C, G | - | - | - | - | - |
Net asset value, end of period | $ 31.42 | $ 29.18 | $ 31.81 | $ 28.35 | $ 23.49 |
Total Return A, B | 8.41% | (6.96)% | 13.14% | 21.79% | (47.84)% |
Ratios to Average Net Assets D, F | | | | | |
Expenses before reductions | 1.59% | 1.56% | 1.60% | 1.65% | 1.68% |
Expenses net of fee waivers, if any | 1.59% | 1.55% | 1.60% | 1.65% | 1.68% |
Expenses net of all reductions | 1.56% | 1.51% | 1.56% | 1.60% | 1.64% |
Net investment income (loss) | 1.16% | 1.05% | .79% | 1.00% | .91% |
Supplemental Data | | | | | |
Net assets, end of period (in millions) | $ 46 | $ 61 | $ 92 | $ 83 | $ 64 |
Portfolio turnover rate E | 68% | 75% | 82% | 98% | 79% |
A Total returns would have been lower if certain expenses had not been reduced during the applicable periods shown.
B Total returns do not include the effect of the sales charges.
C Calculated based on average shares outstanding during the period.
D Fees and expenses of any underlying Fidelity Central Funds are not included in the Fund's expense ratio. The Fund indirectly bears its proportionate share of the expenses of any underlying Fidelity Central Funds.
E Amount does not include the portfolio activity of any underlying Fidelity Central Funds.
F Expense ratios reflect operating expenses of the class. Expenses before reductions do not reflect amounts reimbursed by the investment adviser or reductions from brokerage service arrangements or reductions from other expense offset arrangements and do not represent the amount paid by the class during periods when reimbursements or reductions occur. Expenses net of fee waivers reflect expenses after reimbursement by the investment adviser but prior to reductions from brokerage service arrangements or other expense offset arrangements. Expenses net of all reductions represent the net expenses paid by the class.
G Amount represents less than $.01 per share.
See accompanying notes which are an integral part of the financial statements.
Annual Report
Financial Highlights - Class B
Years ended October 31, | 2012 | 2011 | 2010 | 2009 | 2008 |
Selected Per-Share Data | | | | | |
Net asset value, beginning of period | $ 29.02 | $ 31.60 | $ 28.18 | $ 23.25 | $ 46.70 |
Income from Investment Operations | | | | | |
Net investment income (loss) C | .19 | .17 | .08 | .12 | .15 |
Net realized and unrealized gain (loss) | 2.09 | (2.48) | 3.44 | 4.81 | (21.77) |
Total from investment operations | 2.28 | (2.31) | 3.52 | 4.93 | (21.62) |
Distributions from net investment income | (.02) | (.12) | (.06) | - | (.16) |
Distributions from net realized gain | - | (.16) | (.04) | - | (1.67) |
Total distributions | (.02) | (.27) H | (.10) | - | (1.83) |
Redemption fees added to paid in capital C, G | - | - | - | - | - |
Net asset value, end of period | $ 31.28 | $ 29.02 | $ 31.60 | $ 28.18 | $ 23.25 |
Total Return A, B | 7.85% | (7.39)% | 12.52% | 21.20% | (48.11)% |
Ratios to Average Net Assets D, F | | | | | |
Expenses before reductions | 2.09% | 2.06% | 2.12% | 2.16% | 2.19% |
Expenses net of fee waivers, if any | 2.09% | 2.06% | 2.12% | 2.16% | 2.19% |
Expenses net of all reductions | 2.06% | 2.02% | 2.08% | 2.11% | 2.15% |
Net investment income (loss) | .66% | .54% | .27% | .49% | .40% |
Supplemental Data | | | | | |
Net assets, end of period (in millions) | $ 8 | $ 10 | $ 14 | $ 16 | $ 15 |
Portfolio turnover rate E | 68% | 75% | 82% | 98% | 79% |
A Total returns would have been lower if certain expenses had not been reduced during the applicable periods shown.
B Total returns do not include the effect of the contingent deferred sales charge.
C Calculated based on average shares outstanding during the period.
D Fees and expenses of any underlying Fidelity Central Funds are not included in the Fund's expense ratio. The Fund indirectly bears its proportionate share of the expenses of any underlying Fidelity Central Funds.
E Amount does not include the portfolio activity of any underlying Fidelity Central Funds.
F Expense ratios reflect operating expenses of the class. Expenses before reductions do not reflect amounts reimbursed by the investment adviser or reductions from brokerage service arrangements or reductions from other expense offset arrangements and do not represent the amount paid by the class during periods when reimbursements or reductions occur. Expenses net of fee waivers reflect expenses after reimbursement by the investment adviser but prior to reductions from brokerage service arrangements or other expense offset arrangements. Expenses net of all reductions represent the net expenses paid by the class.
G Amount represents less than $.01 per share.
H Total distributions of $.27 per share is comprised of distributions from net investment income of $.115 and distributions from net realized gain of $.155 per share.
See accompanying notes which are an integral part of the financial statements.
Annual Report
Financial Highlights - Class C
Years ended October 31, | 2012 | 2011 | 2010 | 2009 | 2008 |
Selected Per-Share Data | | | | | |
Net asset value, beginning of period | $ 29.08 | $ 31.68 | $ 28.23 | $ 23.31 | $ 46.82 |
Income from Investment Operations | | | | | |
Net investment income (loss) C | .19 | .18 | .09 | .12 | .15 |
Net realized and unrealized gain (loss) | 2.09 | (2.49) | 3.45 | 4.82 | (21.82) |
Total from investment operations | 2.28 | (2.31) | 3.54 | 4.94 | (21.67) |
Distributions from net investment income | (.04) | (.14) | (.05) | (.02) | (.17) |
Distributions from net realized gain | - | (.16) | (.04) | - | (1.67) |
Total distributions | (.04) | (.29) H | (.09) | (.02) | (1.84) |
Redemption fees added to paid in capital C, G | - | - | - | - | - |
Net asset value, end of period | $ 31.32 | $ 29.08 | $ 31.68 | $ 28.23 | $ 23.31 |
Total Return A, B | 7.86% | (7.37)% | 12.54% | 21.22% | (48.10)% |
Ratios to Average Net Assets D, F | | | | | |
Expenses before reductions | 2.09% | 2.05% | 2.09% | 2.14% | 2.17% |
Expenses net of fee waivers, if any | 2.09% | 2.04% | 2.09% | 2.14% | 2.17% |
Expenses net of all reductions | 2.06% | 2.00% | 2.05% | 2.09% | 2.13% |
Net investment income (loss) | .66% | .56% | .30% | .51% | .42% |
Supplemental Data | | | | | |
Net assets, end of period (in millions) | $ 30 | $ 33 | $ 44 | $ 43 | $ 36 |
Portfolio turnover rate E | 68% | 75% | 82% | 98% | 79% |
A Total returns would have been lower if certain expenses had not been reduced during the applicable periods shown.
B Total returns do not include the effect of the contingent deferred sales charge.
C Calculated based on average shares outstanding during the period.
D Fees and expenses of any underlying Fidelity Central Funds are not included in the Fund's expense ratio. The Fund indirectly bears its proportionate share of the expenses of any underlying Fidelity Central Funds.
E Amount does not include the portfolio activity of any underlying Fidelity Central Funds.
F Expense ratios reflect operating expenses of the class. Expenses before reductions do not reflect amounts reimbursed by the investment adviser or reductions from brokerage service arrangements or reductions from other expense offset arrangements and do not represent the amount paid by the class during periods when reimbursements or reductions occur. Expenses net of fee waivers reflect expenses after reimbursement by the investment adviser but prior to reductions from brokerage service arrangements or other expense offset arrangements. Expenses net of all reductions represent the net expenses paid by the class.
G Amount represents less than $.01 per share.
H Total distributions of $.29 per share is comprised of distributions from net investment income of $.137 and distributions from net realized gain of $.155 per share.
See accompanying notes which are an integral part of the financial statements.
Annual Report
Financial Highlights - International Discovery
Years ended October 31, | 2012 | 2011 | 2010 | 2009 | 2008 |
Selected Per-Share Data | | | | | |
Net asset value, beginning of period | $ 29.69 | $ 32.34 | $ 28.79 | $ 23.88 | $ 47.68 |
Income from Investment Operations | | | | | |
Net investment income (loss) B | .51 | .53 | .40 | .37 | .57 |
Net realized and unrealized gain (loss) | 2.12 | (2.54) | 3.54 | 4.88 | (22.29) |
Total from investment operations | 2.63 | (2.01) | 3.94 | 5.25 | (21.72) |
Distributions from net investment income | (.41) | (.48) | (.35) | (.34) | (.41) |
Distributions from net realized gain | - | (.16) | (.04) | - | (1.67) |
Total distributions | (.41) | (.64) | (.39) | (.34) | (2.08) |
Redemption fees added to paid in capital B,F | - | - | - | - | - |
Net asset value, end of period | $ 31.91 | $ 29.69 | $ 32.34 | $ 28.79 | $ 23.88 |
Total Return A | 9.03% | (6.39)% | 13.76% | 22.47% | (47.55)% |
Ratios to Average Net Assets C, E | | | | | |
Expenses before reductions | 1.01% | .97% | 1.05% | 1.12% | 1.09% |
Expenses net of fee waivers, if any | 1.01% | .96% | 1.05% | 1.12% | 1.09% |
Expenses net of all reductions | .98% | .92% | 1.00% | 1.07% | 1.05% |
Net investment income (loss) | 1.73% | 1.64% | 1.35% | 1.53% | 1.51% |
Supplemental Data | | | | | |
Net assets, end of period (in millions) | $ 5,965 | $ 6,806 | $ 8,133 | $ 8,114 | $ 6,999 |
Portfolio turnover rate D | 68% | 75% | 82% | 98% | 79% |
A Total returns would have been lower if certain expenses had not been reduced during the applicable periods shown.
B Calculated based on average shares outstanding during the period.
C Fees and expenses of any underlying Fidelity Central Funds are not included in the Fund's expense ratio. The Fund indirectly bears its proportionate share of the expenses of any underlying Fidelity Central Funds.
D Amount does not include the portfolio activity of any underlying Fidelity Central Funds.
E Expense ratios reflect operating expenses of the class. Expenses before reductions do not reflect amounts reimbursed by the investment adviser or reductions from brokerage service arrangements or reductions from other expense offset arrangements and do not represent the amount paid by the class during periods when reimbursements or reductions occur. Expenses net of fee waivers reflect expenses after reimbursement by the investment adviser but prior to reductions from brokerage service arrangements or other expense offset arrangements. Expenses net of all reductions represent the net expenses paid by the class.
F Amount represents less than $.01 per share.
See accompanying notes which are an integral part of the financial statements.
Annual Report
Financial Highlights - Class K
Years ended October 31, | 2012 | 2011 | 2010 | 2009 | 2008 G |
Selected Per-Share Data | | | | | |
Net asset value, beginning of period | $ 29.66 | $ 32.32 | $ 28.78 | $ 23.90 | $ 40.32 |
Income from Investment Operations | | | | | |
Net investment income (loss) D | .57 | .58 | .46 | .44 | .10 |
Net realized and unrealized gain (loss) | 2.11 | (2.54) | 3.53 | 4.86 | (16.52) |
Total from investment operations | 2.68 | (1.96) | 3.99 | 5.30 | (16.42) |
Distributions from net investment income | (.47) | (.55) | (.41) | (.42) | - |
Distributions from net realized gain | - | (.16) | (.04) | - | - |
Total distributions | (.47) | (.70) J | (.45) | (.42) | - |
Redemption fees added to paid in capital D, I | - | - | - | - | - |
Net asset value, end of period | $ 31.87 | $ 29.66 | $ 32.32 | $ 28.78 | $ 23.90 |
Total Return B, C | 9.24% | (6.24)% | 13.96% | 22.80% | (40.72)% |
Ratios to Average Net Assets E, H | | | | | |
Expenses before reductions | .83% | .80% | .84% | .88% | .93% A |
Expenses net of fee waivers, if any | .83% | .79% | .84% | .88% | .93% A |
Expenses net of all reductions | .80% | .75% | .79% | .83% | .89% A |
Net investment income (loss) | 1.91% | 1.81% | 1.55% | 1.77% | .83% A |
Supplemental Data | | | | | |
Net assets, end of period (in millions) | $ 1,776 | $ 1,245 | $ 1,078 | $ 674 | $ 145 |
Portfolio turnover rate F | 68% | 75% | 82% | 98% | 79% |
A Annualized
B Total returns for periods of less than one year are not annualized.
C Total returns would have been lower if certain expenses had not been reduced during the applicable periods shown.
D Calculated based on average shares outstanding during the period.
E Fees and expenses of any underlying Fidelity Central Funds are not included in the Fund's expense ratio. The Fund indirectly bears its proportionate share of the expenses of any underlying Fidelity Central Funds.
F Amount does not include the portfolio activity of any underlying Fidelity Central Funds.
G For the period May 9, 2008 (commencement of sale of shares) to October 31, 2008.
H Expense ratios reflect operating expenses of the class. Expenses before reductions do not reflect amounts reimbursed by the investment adviser or reductions from brokerage service arrangements or reductions from other expense offset arrangements and do not represent the amount paid by the class during periods when reimbursements or reductions occur. Expense ratios before reductions for start-up periods may not be representative of longer-term operating periods. Expenses net of fee waivers reflect expenses after reimbursement by the investment adviser but prior to reductions from brokerage service arrangements or other expense offset arrangements. Expenses net of all reductions represent the net expenses paid by the class.
I Amount represents less than $.01 per share.
J Total distributions of $.70 per share is comprised of distributions from net investment income of $.548 and distributions from net realized gain of $.155 per share.
See accompanying notes which are an integral part of the financial statements.
Annual Report
Financial Highlights - Institutional Class
Years ended October 31, | 2012 | 2011 | 2010 | 2009 | 2008 |
Selected Per-Share Data | | | | | |
Net asset value, beginning of period | $ 29.65 | $ 32.31 | $ 28.77 | $ 23.91 | $ 47.73 |
Income from Investment Operations | | | | | |
Net investment income (loss) B | .52 | .54 | .41 | .39 | .53 |
Net realized and unrealized gain (loss) | 2.11 | (2.55) | 3.55 | 4.86 | (22.24) |
Total from investment operations | 2.63 | (2.01) | 3.96 | 5.25 | (21.71) |
Distributions from net investment income | (.41) | (.50) | (.38) | (.39) | (.44) |
Distributions from net realized gain | - | (.16) | (.04) | - | (1.67) |
Total distributions | (.41) | (.65) G | (.42) | (.39) | (2.11) |
Redemption fees added to paid in capital B, F | - | - | - | - | - |
Net asset value, end of period | $ 31.87 | $ 29.65 | $ 32.31 | $ 28.77 | $ 23.91 |
Total Return A | 9.07% | (6.39)% | 13.84% | 22.52% | (47.51)% |
Ratios to Average Net Assets C, E | | | | | |
Expenses before reductions | 1.00% | .95% | .99% | 1.05% | 1.05% |
Expenses net of fee waivers, if any | 1.00% | .94% | .99% | 1.05% | 1.05% |
Expenses net of all reductions | .97% | .90% | .95% | 1.00% | 1.01% |
Net investment income (loss) | 1.75% | 1.66% | 1.40% | 1.60% | 1.54% |
Supplemental Data | | | | | |
Net assets, end of period (in millions) | $ 294 | $ 278 | $ 319 | $ 267 | $ 159 |
Portfolio turnover rate D | 68% | 75% | 82% | 98% | 79% |
A Total returns would have been lower if certain expenses had not been reduced during the applicable periods shown.
B Calculated based on average shares outstanding during the period.
C Fees and expenses of any underlying Fidelity Central Funds are not included in the Fund's expense ratio. The Fund indirectly bears its proportionate share of the expenses of any underlying Fidelity Central Funds.
D Amount does not include the portfolio activity of any underlying Fidelity Central Funds.
E Expense ratios reflect operating expenses of the class. Expenses before reductions do not reflect amounts reimbursed by the investment adviser or reductions from brokerage service arrangements or reductions from other expense offset arrangements and do not represent the amount paid by the class during periods when reimbursements or reductions occur. Expenses net of fee waivers reflect expenses after reimbursement by the investment adviser but prior to reductions from brokerage service arrangements or other expense offset arrangements. Expenses net of all reductions represent the net expenses paid by the class.
F Amount represents less than $.01 per share.
G Total distributions of $.65 per share is comprised of distributions from net investment income of $.497 and distributions from net realized gain of $.155 per share.
See accompanying notes which are an integral part of the financial statements.
Annual Report
Notes to Financial Statements
For the period ended October 31, 2012
(Amounts in thousands except percentages)
1. Organization.
Fidelity International Discovery Fund (the Fund) is a fund of Fidelity Investment Trust (the Trust) and is authorized to issue an unlimited number of shares. The Trust is registered under the Investment Company Act of 1940, as amended (the 1940 Act), as an open-end management investment company organized as a Massachusetts business trust. The Fund offers Class A, Class T, Class C, International Discovery, Class K, and Institutional Class shares, each of which, along with Class B shares, has equal rights as to assets and voting privileges. Effective after the close of business on September 1, 2010, Class B shares were closed to new accounts and additional purchases, except for exchanges and reinvestments. Each class has exclusive voting rights with respect to matters that affect that class. Class B shares will automatically convert to Class A shares after a holding period of seven years from the initial date of purchase. Investment income, realized and unrealized capital gains and losses, the common expenses of the Fund, and certain fund-level expense reductions, if any, are allocated on a pro-rata basis to each class based on the relative net assets of each class to the total net assets of the Fund. Each class differs with respect to transfer agent and distribution and service plan fees incurred. Certain expense reductions may also differ by class.
2. Investments in Fidelity Central Funds.
The Fund invests in Fidelity Central Funds, which are open-end investment companies available only to other investment companies and accounts managed by Fidelity Management & Research Company (FMR) and its affiliates. The Fund's Schedule of Investments lists each of the Fidelity Central Funds held as of period end, if any, as an investment of the Fund, but does not include the underlying holdings of each Fidelity Central Fund. As an Investing Fund, the Fund indirectly bears its proportionate share of the expenses of the underlying Fidelity Central Funds.
The Money Market Central Funds seek preservation of capital and current income and are managed by Fidelity Investments Money Management, Inc. (FIMM), an affiliate of FMR.
A complete unaudited list of holdings for each Fidelity Central Fund is available upon request or at the Securities and Exchange Commission (the SEC) web site at www.sec.gov. In addition, the financial statements of the Fidelity Central Funds, which are not covered by the Fund's Report of Independent Registered Public Accounting Firm, are available on the SEC web site or upon request.
Annual Report
3. Significant Accounting Policies.
The financial statements have been prepared in conformity with accounting principles generally accepted in the United States of America (GAAP), which require management to make certain estimates and assumptions at the date of the financial statements. Actual results could differ from those estimates. Subsequent events, if any, through the date that the financial statements were issued have been evaluated in the preparation of the financial statements. The following summarizes the significant accounting policies of the Fund:
Security Valuation. Investments are valued as of 4:00 p.m. Eastern time on the last calendar day of the period. In accordance with valuation policies and procedures approved by the Board of Trustees (the Board), the Fund attempts to obtain prices from one or more third party pricing vendors or brokers to value its investments. When current market prices, quotations or rates are not readily available or reliable, securities will be fair valued in good faith by the FMR Fair Value Committee (the Committee), in accordance with procedures adopted by the Fund's Board. Factors used in determining fair value vary by security type and may include market or security specific events. The frequency with which these procedures are used cannot be predicted and they may be utilized to a significant extent. The Committee oversees the Fund's valuation policies and procedures and is responsible for approving and reporting to the Board all fair value determinations.
The Fund categorizes the inputs to valuation techniques used to value its investments into a disclosure hierarchy consisting of three levels as shown below:
Level 1 - quoted prices in active markets for identical investments
Level 2 - other significant observable inputs (including quoted prices for similar investments, interest rates, prepayment speeds, etc.)
Level 3 - unobservable inputs (including the Fund's own assumptions based on the best information available)
Valuation techniques used to value the Fund's investments by major category are as follows:
Equity securities, including restricted securities, for which market quotations are readily available, are valued at the last reported sale price or official closing price as reported by a third party pricing vendor on the primary market or exchange on which they are traded and are categorized as Level 1 in the hierarchy. In the event there were no sales during the day or closing prices are not available, securities are valued at the last quoted bid price or may be valued using the last available price and are generally categorized as Level 2 in the hierarchy. For foreign equity securities, when significant market or security specific events arise, comparisons to the valuation of American Depositary Receipts
Annual Report
Notes to Financial Statements - continued
(Amounts in thousands except percentages)
3. Significant Accounting Policies - continued
Security Valuation - continued
(ADRs), futures contracts, Exchange-Traded Funds (ETFs) and certain indexes as well as quoted prices for similar securities are used and are categorized as Level 2 in the hierarchy. Utilizing these techniques may result in transfers between Level 1 and Level 2.
Investments in open-end mutual funds, including the Fidelity Central Funds, are valued at their closing net asset value (NAV) each business day and are categorized as Level 1 in the hierarchy.
Changes in valuation techniques may result in transfers in or out of an assigned level within the disclosure hierarchy. The aggregate value of investments by input level, as of October 31, 2012, including information on transfers between Levels 1 and 2, is included at the end of the Fund's Schedule of Investments.
Foreign Currency Translation. The Fund may use foreign currency contracts to facilitate transactions in foreign-denominated securities. Gains and losses from these transactions may arise from changes in the value of the foreign currency or if the counterparties do not perform under the contracts' terms.
Foreign-denominated assets, including investment securities, and liabilities are translated into U.S. dollars at the exchange rates at period end. Purchases and sales of investment securities, income and dividends received and expenses denominated in foreign currencies are translated into U.S. dollars at the exchange rate in effect on the transaction date.
The effects of exchange rate fluctuations on investments are included with the net realized and unrealized gain (loss) on investment securities. Other foreign currency transactions resulting in realized and unrealized gain (loss) are disclosed separately.
Investment Transactions and Income. For financial reporting purposes, the Fund's investment holdings and NAV include trades executed through the end of the last business day of the period. The NAV per share for processing shareholder transactions is calculated as of the close of business of the New York Stock Exchange (NYSE), normally 4:00 p.m. Eastern time and includes trades executed through the end of the prior business day. Gains and losses on securities sold are determined on the basis of identified cost and may include proceeds received from litigation. Dividend income is recorded on the ex-dividend date, except for certain dividends from foreign securities where the ex-dividend date may have passed, which are recorded as soon as the Fund is informed of the ex-dividend date. Non-cash dividends included in dividend income, if any, are recorded at the fair market value of the securities received. Distributions received on securities that represent a return of capital or capital gain are recorded as a reduction of cost of investments and/or as a realized gain. The Fund estimates the components of
Annual Report
3. Significant Accounting Policies - continued
Investment Transactions and Income - continued
distributions received that may be considered return of capital distributions or capital gain distributions. Interest income and distributions from the Fidelity Central Funds are accrued as earned. Interest income includes coupon interest and amortization of premium and accretion of discount on debt securities. Investment income is recorded net of foreign taxes withheld where recovery of such taxes is uncertain.
Expenses. Expenses directly attributable to a fund are charged to that fund. Expenses attributable to more than one fund are allocated among the respective funds on the basis of relative net assets or other appropriate methods. Expense estimates are accrued in the period to which they relate and adjustments are made when actual amounts are known.
Deferred Trustee Compensation. Under a Deferred Compensation Plan (the Plan), independent Trustees may elect to defer receipt of a portion of their annual compensation. Deferred amounts are invested in a cross-section of Fidelity funds, are marked-to-market and remain in the Fund until distributed in accordance with the Plan. The investment of deferred amounts and the offsetting payable to the Trustees are included in the accompanying Statement of Assets and Liabilities.
Income Tax Information and Distributions to Shareholders. Each year, the Fund intends to qualify as a regulated investment company under Subchapter M of the Internal Revenue Code, including distributing substantially all of its taxable income and realized gains. As a result, no provision for income taxes is required. As of October 31, 2012, the Fund did not have any unrecognized tax benefits in the financial statements; nor is the Fund aware of any tax positions for which it is reasonably possible that the total amounts of unrecognized tax benefits will significantly change in the next twelve months. The Fund files a U.S. federal tax return, in addition to state and local tax returns as required. A fund's federal income tax returns are subject to examination by the Internal Revenue Service (IRS) for a period of three fiscal years after they are filed. State and local tax returns may be subject to examination for an additional fiscal year depending on the jurisdiction. Foreign taxes are provided for based on the Fund's understanding of the tax rules and rates that exist in the foreign markets in which it invests.
Distributions are declared and recorded on the ex-dividend date. Income dividends and capital gain distributions are declared separately for each class. Income and capital gain distributions are determined in accordance with income tax regulations, which may differ from GAAP.
Annual Report
Notes to Financial Statements - continued
(Amounts in thousands except percentages)
3. Significant Accounting Policies - continued
Income Tax Information and Distributions to Shareholders - continued
Capital accounts within the financial statements are adjusted for permanent book-tax differences. These adjustments have no impact on net assets or the results of operations. Temporary book-tax differences will reverse in a subsequent period.
Book-tax differences are primarily due to foreign currency transactions, certain foreign taxes, passive foreign investment companies (PFIC), deferred trustees compensation, capital loss carryforwards and losses deferred due to wash sales.
The federal tax cost of investment securities and unrealized appreciation (depreciation) as of period end were as follows:
Gross unrealized appreciation | $ 1,161,331 |
Gross unrealized depreciation | (475,922) |
Net unrealized appreciation (depreciation) on securities and other investments | $ 685,409 |
| |
Tax Cost | $ 7,724,523 |
The tax-based components of distributable earnings as of period end were as follows:
Undistributed ordinary income | $ 134,442 |
Capital loss carryforward | $ (1,554,149) |
Net unrealized appreciation (depreciation) | $ 684,309 |
Capital loss carryforwards are only available to offset future capital gains of the Fund to the extent provided by regulations and may be limited. Under the Regulated Investment Company Modernization Act of 2010 (the Act), the Fund is permitted to carry forward capital losses incurred in taxable years beginning after December 22, 2010 for an unlimited period and such capital losses are required to be used prior to any losses that expire. Capital loss carryforwards were as follows:
Fiscal year of expiration | |
2017 | $ (1,350,018) |
No expiration | |
Short-term | $ (204,131) |
Total capital loss carryforward | $ (1,554,149) |
The tax character of distributions paid was as follows:
| October 31, 2012 | | October 31, 2011 |
Ordinary Income | $ 118,968 | | $ 198,026 |
Annual Report
3. Significant Accounting Policies - continued
Short-Term Trading (Redemption) Fees. Shares held by investors in the Fund less than 30 days are subject to a redemption fee equal to 1.00% of the net asset value of shares redeemed. All redemption fees, which reduce the proceeds of the shareholder redemption, are retained by the Fund and accounted for as an addition to paid in capital.
New Accounting Pronouncement. In December 2011, the Financial Accounting Standards Board issued Accounting Standard Update No. 2011-11, Disclosures about Offsetting Assets and Liabilities. The update creates new disclosure requirements requiring entities to disclose both gross and net information for derivatives and other financial instruments that are either offset in the Statement of Assets and Liabilities or subject to an enforceable master netting arrangement or similar agreement. The disclosure requirements are effective for annual reporting periods beginning on or after January 1, 2013, and interim periods within those annual periods. Management is currently evaluating the impact of the update's adoption on the Fund's financial statement disclosures.
4. Purchases and Sales of Investments.
Purchases and sales of securities, other than short-term securities, aggregated $5,561,781 and $6,703,146, respectively.
5. Fees and Other Transactions with Affiliates.
Management Fee. FMR and its affiliates provide the Fund with investment management related services for which the Fund pays a monthly management fee. The management fee is the sum of an individual fund fee rate that is based on an annual rate of .45% of the Fund's average net assets and an annualized group fee rate that averaged .26% during the period. The group fee rate is based upon the average net assets of all the mutual funds advised by FMR. The group fee rate decreases as assets under management increase and increases as assets under management decrease. In addition, the management fee is subject to a performance adjustment (up to a maximum of ± .20% of the Fund's average net assets over a 36 month performance period). The upward or downward adjustment to the management fee is based on the relative investment performance of International Discovery as compared to an appropriate benchmark index. For the period, the total annual management fee rate, including the performance adjustment, was .74% of the Fund's average net assets.
Distribution and Service Plan Fees. In accordance with Rule 12b-1 of the 1940 Act, the Fund has adopted separate Distribution and Service Plans for each class of shares. Certain classes pay Fidelity Distributors Corporation (FDC), an affiliate of FMR, separate Distribution and Service Fees, each of which is based on an annual percentage of
Annual Report
Notes to Financial Statements - continued
(Amounts in thousands except percentages)
5. Fees and Other Transactions with Affiliates - continued
Distribution and Service Plan Fees - continued
each class' average net assets. In addition, FDC may pay financial intermediaries for selling shares of the Fund and providing shareholder support services. For the period, the Distribution and Service Fee rates, total fees and amounts retained by FDC were as follows:
| Distribution
Fee | Service
Fee | Total Fees | Retained
by FDC |
Class A | -% | .25% | $ 733 | $ 11 |
Class T | .25% | .25% | 262 | 1 |
Class B | .75% | .25% | 86 | 64 |
Class C | .75% | .25% | 303 | 21 |
| | | $ 1,384 | $ 97 |
Sales Load. FDC may receive a front-end sales charge of up to 5.75% for selling Class A shares and 3.50% for selling Class T shares, some of which is paid to financial intermediaries for selling shares of the Fund. Depending on the holding period, FDC may receive contingent deferred sales charges levied on Class A, Class T, Class B, and Class C redemptions. The deferred sales charges range from 5.00% to 1.00% for Class B shares, 1.00% for Class C shares, 1.00% for certain purchases of Class A shares and .25% for certain purchases of Class T shares.
For the period, sales charge amounts retained by FDC were as follows:
| Retained
by FDC |
Class A | $ 45 |
Class T | 6 |
Class B* | 18 |
Class C* | 1 |
| $ 70 |
* When Class B and Class C shares are initially sold, FDC pays commissions from its own resources to financial intermediaries through which the sales are made.
Annual Report
5. Fees and Other Transactions with Affiliates - continued
Transfer Agent Fees. Fidelity Investments Institutional Operations Company, Inc. (FIIOC), an affiliate of FMR, is the transfer, dividend disbursing and shareholder servicing agent for each class of the Fund. FIIOC receives account fees and asset-based fees that vary according to the account size and type of account of the shareholders of the respective classes of the Fund, except for Class K. FIIOC receives an asset-based fee of Class K's average net assets. FIIOC receives no fees for providing transfer agency services to Class F. FIIOC pays for typesetting, printing and mailing of shareholder reports, except proxy statements. For the period, transfer agent fees for each class were as follows:
| Amount | % of
Average
Net Assets |
Class A | $ 891 | .30 |
Class T | 159 | .30 |
Class B | 26 | .30 |
Class C | 91 | .30 |
International Discovery | 13,666 | .23 |
Class K | 764 | .05 |
Institutional Class | 598 | .21 |
| $ 16,195 | |
Accounting and Security Lending Fees. Fidelity Service Company, Inc. (FSC), an affiliate of FMR, maintains the Fund's accounting records. The accounting fee is based on the level of average net assets for each month. Under a separate contract, FSC administers the security lending program. The security lending fee is based on the number and duration of lending transactions.
Brokerage Commissions. The Fund placed a portion of its portfolio transactions with brokerage firms which are affiliates of the investment adviser. The commissions paid to these affiliated firms were $13 for the period.
Interfund Lending Program. Pursuant to an Exemptive Order issued by the SEC, the Fund, along with other registered investment companies having management contracts with FMR, may participate in an interfund lending program. This program provides an alternative credit facility allowing the funds to borrow from, or lend money to, other participating affiliated funds. At period end, there were no interfund loans outstanding. The Fund's activity in this program during the period for which loans were outstanding was as follows:
Borrower or Lender | Average Loan
Balance | Weighted Average Interest Rate | Interest Expense |
Borrower | $ 17,873 | .34% | $ 5 |
Annual Report
Notes to Financial Statements - continued
(Amounts in thousands except percentages)
6. Committed Line of Credit.
The Fund participates with other funds managed by FMR or an affiliate in a $4.25 billion credit facility (the "line of credit") to be utilized for temporary or emergency purposes to fund shareholder redemptions or for other short-term liquidity purposes. The Fund has agreed to pay commitment fees on its pro-rata portion of the line of credit, which amounted to $23 and is reflected in Miscellaneous expenses on the Statement of Operations. During the period, there were no borrowings on this line of credit.
7. Security Lending.
The Fund lends portfolio securities through a lending agent from time to time in order to earn additional income. For equity securities, a lending agent is used and may loan securities to certain qualified borrowers, including Fidelity Capital Markets (FCM), a broker-dealer affiliated with the Fund. On the settlement date of the loan, the Fund receives collateral (in the form of U.S. Treasury obligations, letters of credit and/or cash) against the loaned securities and maintains collateral in an amount not less than 100% of the market value of the loaned securities during the period of the loan. The market value of the loaned securities is determined at the close of business of the Fund and any additional required collateral is delivered to the Fund on the next business day. If the borrower defaults on its obligation to return the securities loaned because of insolvency or other reasons, a fund could experience delays and costs in recovering the securities loaned or in gaining access to the collateral. Any cash collateral received is invested in the Fidelity Securities Lending Cash Central Fund. The value of loaned securities and cash collateral at period end are disclosed on the Fund's Statement of Assets and Liabilities. At period end, there were no security loans outstanding with FCM. Security lending income represents the income earned on investing cash collateral, less rebates paid to borrowers and any lending agent fees associated with the loan, plus any premium payments received for lending certain types of securities. Security lending income is presented in the Statement of Operations as a component of income from Fidelity Central Funds. Total security lending income during the period amounted to $4,230, including $18 from securities loaned to FCM.
8. Expense Reductions.
Many of the brokers with whom FMR places trades on behalf of the Fund provided services to the Fund in addition to trade execution. These services included payments of certain expenses on behalf of the Fund totaling $2,500 for the period.
Annual Report
9. Distributions to Shareholders.
Distributions to shareholders of each class were as follows:
Years ended October 31, | 2012 | 2011 |
From net investment income | | |
Class A | $ 3,123 | $ 4,617 |
Class T | 388 | 859 |
Class B | 6 | 51 |
Class C | 44 | 184 |
International Discovery | 90,633 | 121,061 |
Class K | 20,917 | 18,291 |
Institutional Class | 3,857 | 4,873 |
Total | $ 118,968 | $ 149,936 |
From net realized gain | | |
Class A | $ - | $ 1,880 |
Class T | - | 439 |
Class B | - | 69 |
Class C | - | 209 |
International Discovery | - | 38,831 |
Class K | - | 5,143 |
Institutional Class | - | 1,519 |
Total | $ - | $ 48,090 |
10. Share Transactions.
Transactions for each class of shares were as follows:
| Shares | Dollars |
Years ended October 31, | 2012 | 2011 | 2012 | 2011 |
Class A | | | | |
Shares sold | 1,927 | 2,821 | $ 56,732 | $ 91,649 |
Reinvestment of distributions | 101 | 173 | 2,828 | 5,606 |
Shares redeemed | (3,468) | (4,335) | (100,935) | (139,721) |
Net increase (decrease) | (1,440) | (1,341) | $ (41,375) | $ (42,466) |
Class T | | | | |
Shares sold | 220 | 443 | $ 6,409 | $ 14,328 |
Reinvestment of distributions | 13 | 38 | 369 | 1,235 |
Shares redeemed | (860) | (1,286) | (25,207) | (41,028) |
Net increase (decrease) | (627) | (805) | $ (18,429) | $ (25,465) |
Class B | | | | |
Shares sold | 3 | 21 | $ 87 | $ 671 |
Reinvestment of distributions | - | 3 | 5 | 111 |
Shares redeemed | (113) | (130) | (3,297) | (4,124) |
Net increase (decrease) | (110) | (106) | $ (3,205) | $ (3,342) |
Annual Report
Notes to Financial Statements - continued
(Amounts in thousands except percentages)
10. Share Transactions - continued
| Shares | Dollars |
Years ended October 31, | 2012 | 2011 | 2012 | 2011 |
Class C | | | | |
Shares sold | 212 | 183 | $ 6,111 | $ 5,847 |
Reinvestment of distributions | 1 | 11 | 39 | 344 |
Shares redeemed | (395) | (437) | (11,440) | (13,875) |
Net increase (decrease) | (182) | (243) | $ (5,290) | $ (7,684) |
International Discovery | | | | |
Shares sold | 20,324 | 32,543 | $ 608,478 | $ 1,052,266 |
Reinvestment of distributions | 3,081 | 4,718 | 86,858 | 153,551 |
Shares redeemed | (65,748) | (59,489) | (1,937,202) | (1,934,353) |
Net increase (decrease) | (42,343) | (22,228) | $ (1,241,866) | $ (728,536) |
Class K | | | | |
Shares sold | 26,836 | 18,148 | $ 788,860 | $ 593,408 |
Reinvestment of distributions | 744 | 722 | 20,917 | 23,434 |
Shares redeemed | (13,817) | (10,275) | (410,022) | (330,258) |
Net increase (decrease) | 13,763 | 8,595 | $ 399,755 | $ 286,584 |
Institutional Class | | | | |
Shares sold | 2,049 | 2,364 | $ 59,460 | $ 75,348 |
Reinvestment of distributions | 53 | 69 | 1,502 | 2,254 |
Shares redeemed | (2,256) | (2,923) | (65,914) | (94,034) |
Net increase (decrease) | (154) | (490) | $ (4,952) | $ (16,432) |
11. Other.
The Fund's organizational documents provide former and current trustees and officers with a limited indemnification against liabilities arising in connection with the performance of their duties to the Fund. In the normal course of business, the Fund may also enter into contracts that provide general indemnifications. The Fund's maximum exposure under these arrangements is unknown as this would be dependent on future claims that may be made against the Fund. The risk of material loss from such claims is considered remote.
Annual Report
To the Trustees of Fidelity Investment Trust and the Shareholders of Fidelity International Discovery Fund:
In our opinion, the accompanying statement of assets and liabilities, including the schedule of investments, and the related statements of operations and of changes in net assets and the financial highlights present fairly, in all material respects, the financial position of Fidelity International Discovery Fund (a fund of Fidelity Investment Trust) at October 31, 2012, the results of its operations for the year then ended, the changes in its net assets for each of the two years in the period then ended and the financial highlights for each of the periods indicated, in conformity with accounting principles generally accepted in the United States of America. These financial statements and financial highlights (hereafter referred to as "financial statements") are the responsibility of the Fidelity International Discovery Fund's management. Our responsibility is to express an opinion on these financial statements based on our audits. We conducted our audits of these financial statements in accordance with the standards of the Public Company Accounting Oversight Board (United States). Those standards require that we plan and perform the audit to obtain reasonable assurance about whether the financial statements are free of material misstatement. An audit includes examining, on a test basis, evidence supporting the amounts and disclosures in the financial statements, assessing the accounting principles used and significant estimates made by management, and evaluating the overall financial statement presentation. We believe that our audits, which included confirmation of securities at October 31, 2012 by correspondence with the custodian and brokers, provide a reasonable basis for our opinion.
PricewaterhouseCoopers LLP
Boston, Massachusetts
December 14, 2012
Annual Report
The Trustees, Members of the Advisory Board, and executive officers of the trust and fund, as applicable, are listed below. The Board of Trustees governs the fund and is responsible for protecting the interests of shareholders. The Trustees are experienced executives who meet periodically throughout the year to oversee the fund's activities, review contractual arrangements with companies that provide services to the fund, oversee management of the risks associated with such activities and contractual arrangements, and review the fund's performance. Except for James C. Curvey, each of the Trustees oversees 236 funds advised by FMR or an affiliate. Mr. Curvey oversees 443 funds advised by FMR or an affiliate.
The Trustees hold office without limit in time except that (a) any Trustee may resign; (b) any Trustee may be removed by written instrument, signed by at least two-thirds of the number of Trustees prior to such removal; (c) any Trustee who requests to be retired or who has become incapacitated by illness or injury may be retired by written instrument signed by a majority of the other Trustees; and (d) any Trustee may be removed at any special meeting of shareholders by a two-thirds vote of the outstanding voting securities of the trust. Each Trustee who is not an interested person (as defined in the 1940 Act) (Independent Trustee), shall retire not later than the last day of the calendar year in which his or her 75th birthday occurs. The Independent Trustees may waive this mandatory retirement age policy with respect to individual Trustees. The executive officers and Advisory Board Members hold office without limit in time, except that any officer and Advisory Board Member may resign or may be removed by a vote of a majority of the Trustees at any regular meeting or any special meeting of the Trustees. Except as indicated, each individual has held the office shown or other offices in the same company for the past five years.
Experience, Skills, Attributes, and Qualifications of the Fund's Trustees. The Governance and Nominating Committee has adopted a statement of policy that describes the experience, qualifications, attributes, and skills that are necessary and desirable for potential Independent Trustee candidates (Statement of Policy). The Board believes that each Trustee satisfied at the time he or she was initially elected or appointed a Trustee, and continues to satisfy, the standards contemplated by the Statement of Policy. The Governance and Nominating Committee also engages professional search firms to help identify potential Independent Trustee candidates who have the experience, qualifications, attributes, and skills consistent with the Statement of Policy. From time to time, additional criteria based on the composition and skills of the current Independent Trustees, as well as experience or skills that may be appropriate in light of future changes to board composition, business conditions, and regulatory or other developments, have also been considered by the professional search firms and the Governance and Nominating Committee. In addition, the Board takes into account the Trustees' commitment and participation in Board and committee meetings, as well as their leadership of standing and ad hoc committees throughout their tenure.
In determining that a particular Trustee was and continues to be qualified to serve as a Trustee, the Board has considered a variety of criteria, none of which, in isolation, was controlling. The Board believes that, collectively, the Trustees have balanced and diverse experience, qualifications, attributes, and skills, which allow the Board to operate effectively in governing the fund and protecting the interests of shareholders. Information about the specific experience, skills, attributes, and qualifications of each Trustee, which in each case led to the Board's conclusion that the Trustee should serve (or continue to serve) as a trustee of the fund, is provided below.
Annual Report
Trustees and Officers - continued
Board Structure and Oversight Function. James C. Curvey is an interested person (as defined in the 1940 Act) and currently serves as Chairman. The Trustees have determined that an interested Chairman is appropriate and benefits shareholders because an interested Chairman has a personal and professional stake in the quality and continuity of services provided to the fund. Independent Trustees exercise their informed business judgment to appoint an individual of their choosing to serve as Chairman, regardless of whether the Trustee happens to be independent or a member of management. The Independent Trustees have determined that they can act independently and effectively without having an Independent Trustee serve as Chairman and that a key structural component for assuring that they are in a position to do so is for the Independent Trustees to constitute a substantial majority for the Board. The Independent Trustees also regularly meet in executive session. Ned C. Lautenbach serves as Chairman of the Independent Trustees and as such (i) acts as a liaison between the Independent Trustees and management with respect to matters important to the Independent Trustees and (ii) with management prepares agendas for Board meetings.
Fidelity funds are overseen by different Boards of Trustees. The fund's Board oversees Fidelity's equity and high income funds and another Board oversees Fidelity's investment-grade bond, money market, and asset allocation funds. The asset allocation funds may invest in Fidelity funds overseen by the fund's Board. The use of separate Boards, each with its own committee structure, allows the Trustees of each group of Fidelity funds to focus on the unique issues of the funds they oversee, including common research, investment, and operational issues. On occasion, the separate Boards establish joint committees to address issues of overlapping consequences for the Fidelity funds overseen by each Board.
The Trustees operate using a system of committees to facilitate the timely and efficient consideration of all matters of importance to the Trustees, the fund, and fund shareholders and to facilitate compliance with legal and regulatory requirements and oversight of the fund's activities and associated risks. The Board, acting through its committees, has charged FMR and its affiliates with (i) identifying events or circumstances the occurrence of which could have demonstrably adverse effects on the fund's business and/or reputation; (ii) implementing processes and controls to lessen the possibility that such events or circumstances occur or to mitigate the effects of such events or circumstances if they do occur; and (iii) creating and maintaining a system designed to evaluate continuously business and market conditions in order to facilitate the identification and implementation processes described in (i) and (ii) above. Because the day-to-day operations and activities of the fund are carried out by or through FMR, its affiliates and other service providers, the fund's exposure to risks is mitigated but not eliminated by the processes overseen by the Trustees. While each of the Board's committees has responsibility for overseeing different aspects of the fund's activities, oversight is exercised primarily through the Operations, Audit, and Compliance Committees. In addition, the Independent Trustees have worked with FMR to enhance the Board's oversight of investment and financial risks, legal and regulatory risks, technology risks, and operational risks, including the development of additional risk reporting to the Board. For example, a working group comprised of Independent Trustees and FMR has worked and continues to work to review the Fidelity funds' valuation-related activities, reporting and risk management. Appropriate personnel, including but not limited to the fund's Chief Compliance Officer (CCO), FMR's internal auditor, the independent accountants, the fund's Treasurer and portfolio management personnel, make periodic reports to the Board's committees, as appropriate, including an annual review of FMR's risk management program for the Fidelity funds. The responsibilities of each standing committee, including their oversight responsibilities, are described further under "Standing Committees of the Fund's Trustees."
Annual Report
The fund's Statement of Additional Information (SAI) includes more information about the Trustees. To request a free copy, call Fidelity at 1-800-835-5092.
Interested Trustees*:
Correspondence intended for each Trustee who is an interested person may be sent to Fidelity Investments, 82 Devonshire Street, Boston, Massachusetts 02109.
Name, Age; Principal Occupations and Other Relevant Experience+ |
James C. Curvey (77) |
| Year of Election or Appointment: 2007 Mr. Curvey is Trustee and Chairman of the Board of Trustees of certain Trusts. Mr. Curvey also serves as Trustee (2007-present) of other investment companies advised by FMR. Mr. Curvey is a Director of Fidelity Investments Money Management, Inc. (2009-present), Director of Fidelity Research & Analysis Co. (2009-present) and Director of FMR and FMR Co., Inc. (2007-present). Mr. Curvey is also Vice Chairman (2007-present) and Director of FMR LLC. In addition, Mr. Curvey serves as an Overseer for the Boston Symphony Orchestra and a member of the Trustees of Villanova University. Previously, Mr. Curvey was the Vice Chairman (2006-2007) and Director (2000-2007) of FMR Corp. |
Ronald P. O'Hanley (55) |
| Year of Election or Appointment: 2011 Mr. O'Hanley is Director of FMR Co., Inc. (2010-present), Director of Fidelity Investments Money Management, Inc. (2010-present), Director of Fidelity Research & Analysis Company (2010-present), President of Fidelity Asset Management and Corporate Services and a member of Fidelity's Executive Committee (2010-present). Previously, Mr. O'Hanley served as President and Chief Executive Officer of BNY Mellon Asset Management (2007-2010). Mr. O'Hanley also served as Vice Chairman of Bank New York Mellon Corp. and a member of that firm's Executive Committee. Prior to the 2007 merger of The Bank of New York and Mellon Financial Corporation, he was Vice Chairman of Mellon Financial Corporation and President and Chief Executive Officer of Mellon Asset Management. He joined Mellon in February 1997. Mr. O'Hanley currently serves as Chairman of the Boston Public Library Foundation Board of Directors and sits on the Board of Directors of Beth Israel Deaconess Medical Center, the Board of Trustees of the Marine Biological Laboratory and the Advisory Board of the Maxwell School of Citizenship and Public Administration at Syracuse University. Mr. O'Hanley also chairs the Council on Asset Management for the Financial Services Roundtable and is a member of the Board of Directors of Institutional Investor's U.S. Institute. |
* Trustees have been determined to be "Interested Trustees" by virtue of, among other things, their affiliation with the trust or various entities under common control with FMR.
+ The information above includes each Trustee's principal occupation during the last five years and other information relating to the experience, attributes, and skills relevant to each Trustee's qualifications to serve as a Trustee, which led to the conclusion that each Trustee should serve as a Trustee for the fund.
Annual Report
Independent Trustees:
Correspondence intended for each Independent Trustee (that is, the Trustees other than the Interested Trustees) may be sent to Fidelity Investments, P.O. Box 55235, Boston, Massachusetts 02205-5235.
Name, Age; Principal Occupations and Other Relevant Experience+ |
Dennis J. Dirks (64) |
| Year of Election or Appointment: 2005 Prior to his retirement in May 2003, Mr. Dirks was Chief Operating Officer and a member of the Board of The Depository Trust & Clearing Corporation (DTCC). He also served as President, Chief Operating Officer, and Board member of The Depository Trust Company (DTC) and President and Board member of the National Securities Clearing Corporation (NSCC). In addition, Mr. Dirks served as Chief Executive Officer and Board member of the Government Securities Clearing Corporation, Chief Executive Officer and Board member of the Mortgage-Backed Securities Clearing Corporation, as a Trustee and a member of the Finance Committee of Manhattan College (2005-2008), and as a Trustee and a member of the Finance Committee of AHRC of Nassau County (2006-2008). Mr. Dirks is a member of the Independent Directors Council (IDC) Governing Council (2010-present) and Board of Directors for The Brookville Center for Children's Services, Inc. (2009-present). |
Alan J. Lacy (59) |
| Year of Election or Appointment: 2008 Mr. Lacy serves as Senior Adviser (2007-present) of Oak Hill Capital Partners, L.P. (private equity). Mr. Lacy also served as Chief Executive Officer (2000-2005) and Vice Chairman (2005-2006) of Sears Holdings Corporation and Sears, Roebuck and Co. (retail). In addition, Mr. Lacy serves as a member of the Board of Directors of Dave & Buster's Entertainment, Inc. (restaurant and entertainment complexes, 2010-present), Earth Fare, Inc. (retail grocery, 2012-present), The Hillman Companies, Inc. (hardware wholesalers, 2010-present), and Bristol-Myers Squibb Company (global pharmaceuticals, 2008-present). Mr. Lacy is a member of the Board of Trustees of The National Parks Conservation Association (2006-present). Previously, Mr. Lacy served as Chairman of the Board of Trustees of the National Parks Conservation Association (2008-2011) and as a member of the Board of Directors for the Western Union Company (global money transfer, 2006-2011). |
Ned C. Lautenbach (68) |
| Year of Election or Appointment: 2000 Mr. Lautenbach is Chairman of the Independent Trustees of the Equity and High Income Funds (2006-present). Mr. Lautenbach currently serves as the Lead Director of the Eaton Corporation Board of Directors (diversified industrial, 1997-present). Mr. Lautenbach is Chairman of the Board of Directors of the Philharmonic Center for the Arts in Naples, Florida (2012-present) and a member of the Council on Foreign Relations (1994-present). Previously, Mr. Lautenbach was a Partner/Advisory Partner at Clayton, Dubilier & Rice, LLC (private equity investment, 1998-2010), as well as a Director of Sony Corporation (2006-2007). |
Joseph Mauriello (68) |
| Year of Election or Appointment: 2008 Prior to his retirement in January 2006, Mr. Mauriello served in numerous senior management positions including Deputy Chairman and Chief Operating Officer (2004-2005), and Vice Chairman of Financial Services (2002-2004) of KPMG LLP US (professional services, 1965-2005). Mr. Mauriello currently serves as a member of the Board of Directors of XL Group plc. (global insurance and re-insurance, 2006-present). Previously, Mr. Mauriello served as a Director of the Hamilton Funds of the Bank of New York (2006-2007) and of Arcadia Resources Inc. (health care services and products, 2007-2012). |
Robert W. Selander (62) |
| Year of Election or Appointment: 2011 Previously, Mr. Selander served as a Member of the Advisory Board of Fidelity's Equity and High Income Funds (2011), Executive Vice Chairman (2010), Chief Executive Officer (2009-2010), and President and Chief Executive Officer (1997-2009) of Mastercard, Inc. |
Cornelia M. Small (68) |
| Year of Election or Appointment: 2005 Ms. Small is a member of the Board of Directors (2009-present) and Chair of the Investment Committee (2010-present) of the Teagle Foundation. Ms. Small also serves on the Investment Committee of the Berkshire Taconic Community Foundation (2008-present). Previously, Ms. Small served as Chairperson (2002-2008) and a member of the Investment Committee and Chairperson (2008-2012) and a member of the Board of Trustees of Smith College. In addition, Ms. Small served as Chief Investment Officer, Director of Global Equity Investments, and a member of the Board of Directors of Scudder, Stevens & Clark and Scudder Kemper Investments. |
William S. Stavropoulos (73) |
| Year of Election or Appointment: 2001 Mr. Stavropoulos is Vice Chairman of the Independent Trustees of the Equity and High Income Funds (2006-present). Mr. Stavropoulos serves as President and Founder of the Michigan Baseball Foundation, the Great Lakes Loons (2007-present). Mr. Stavropoulos is Chairman Emeritus of the Board of Directors of The Dow Chemical Company, where he previously served in numerous senior management positions, including President, CEO (1995-2000; 2002-2004), Chairman of the Executive Committee (2000-2006), and as a member of the Board of Directors (1990-2006). Currently, Mr. Stavropoulos is a Director of Univar Inc. (global distributor of commodity and specialty chemicals, Chairman from 2010-May 2012 and Lead Director from May 2012-present), Teradata Corporation (data warehousing and technology solutions, 2008-present), Maersk Inc. (industrial conglomerate), and Tyco International, Ltd. (multinational manufacturing and services, 2007-present), and a member of the Advisory Board for Metalmark Capital LLC (private equity investment, 2005-present). Mr. Stavropoulos is an operating advisor to Clayton, Dubilier & Rice, LLC (private equity investment). In addition, Mr. Stavropoulos is a member of the University of Notre Dame Advisory Council for the College of Science, a Trustee of the Rollin L. Gerstacker Foundation, and a Director of the Naples Philharmonic Center for the Arts. Previously, Mr. Stavropoulos served as a Director of Chemical Financial Corporation (bank holding company, 1993-2012). |
David M. Thomas (63) |
| Year of Election or Appointment: 2008 Previously, Mr. Thomas served as Executive Chairman (2005-2006) and Chairman and Chief Executive Officer (2000-2005) of IMS Health, Inc. (pharmaceutical and healthcare information solutions), and a Director of Fortune Brands, Inc. (consumer products, 2000-2011). In addition, Mr. Thomas serves as Non-Executive Chairman of the Board of Directors of Fortune Brands Home and Security (home and security products, 2011-present), and as a member of the Board of Directors of Interpublic Group of Companies, Inc. (marketing communication, 2004-present). |
Michael E. Wiley (62) |
| Year of Election or Appointment: 2008 Mr. Wiley also serves as a Director of Asia Pacific Exploration Consolidated (international oil and gas exploration and production, 2008-present). Mr. Wiley serves as a Director of Tesoro Corporation (independent oil refiner and marketer, 2005-present), and a Director of Bill Barrett Corporation (exploration and production, 2005-present). In addition, Mr. Wiley also serves as a Director of Post Oak Bank (privately-held bank, 2004-present). Previously, Mr. Wiley served as a member of the Board of Trustees of the University of Tulsa (2000-2006; 2007-2010), as a Senior Energy Advisor of Katzenbach Partners, LLC (consulting, 2006-2007), as an Advisory Director of Riverstone Holdings (private investment), Chairman, President, and CEO of Baker Hughes, Inc. (oilfield services, 2000-2004), and as Director of Spinnaker Exploration Company (exploration and production, 2001-2005). |
+ The information above includes each Trustee's principal occupation during the last five years and other information relating to the experience, attributes, and skills relevant to each Trustee's qualifications to serve as a Trustee, which led to the conclusion that each Trustee should serve as a Trustee for the fund.
Advisory Board Members and Executive Officers:
Correspondence intended for David A. Rosow and Garnett A. Smith may be sent to Fidelity Investments, P.O. Box 55235, Boston, Massachusetts 02205-5235. Correspondence intended for each executive officer, Edward C. Johnson 3d, and Peter S. Lynch may be sent to Fidelity Investments, 82 Devonshire Street, Boston, Massachusetts 02109.
Name, Age; Principal Occupation |
Edward C. Johnson 3d (82) |
| Year of Election or Appointment: 2011 Member of the Advisory Board of Fidelity's Equity and High Income Funds. Mr. Johnson serves as Chief Executive Officer, Chairman, and a Director of FMR LLC, and also serves as Chairman and Director of FIL Limited. Previously, Mr. Johnson served as a Trustee and Chairman of the Board of certain Fidelity Trusts, Chairman and a Director of FMR, Chairman and a Director of FMR Co., Inc., and President of FMR LLC (2006-2007). |
Peter S. Lynch (68) |
| Year of Election or Appointment: 2003 Member of the Advisory Board of Fidelity's Equity and High Income Funds. Mr. Lynch is Vice Chairman and a Director of FMR and FMR Co., Inc. In addition, Mr. Lynch serves as a Trustee of Boston College and as the Chairman of the Inner-City Scholarship Fund. Previously, Mr. Lynch served on the Special Olympics International Board of Directors (1997-2006). |
David A. Rosow (70) |
| Year of Election or Appointment: 2012 Member of the Advisory Board of Fidelity's Equity and High Income Funds. Chairman and Chief Executive Officer of International Golf Group, Inc. (golf course development, 1989-present). Previously, Mr. Rosow served as Chairman and Chief Executive Officer of Rosow & Company, Inc. (private investment company, 1989-2011), a Lead Director of Hudson United Bancorp (2001-2006) and as a Director of TD Banknorth (1996-2006). In addition, Mr. Rosow is a member (2008-present) and President (2009-present) of the Town Council of Palm Beach, Florida. |
Garnett A. Smith (65) |
| Year of Election or Appointment: 2012 Member of the Advisory Board of Fidelity's Equity and High Income Funds. Prior to Mr. Smith's retirement, he served as Chairman and Chief Executive Officer of Inbrand Corp. (manufacturer of personal absorbent products, 1990-1997). He also served as President (1986-1990) of Inbrand Corp. Prior to his employment with Inbrand Corp., he was employed by a retail fabric chain and North Carolina National Bank. In addition, Mr. Smith is a board member of the Jackson Hole Land Trust (2009-present). |
Kenneth B. Robins (43) |
| Year of Election or Appointment: 2008 President and Treasurer of Fidelity's Equity and High Income Funds. Mr. Robins also serves as President and Treasurer (2010-present) and Assistant Treasurer (2009-present) of other Fidelity funds and is an employee of Fidelity Investments (2004-present). Previously, Mr. Robins served as Deputy Treasurer of the Fidelity funds (2005-2008) and Treasurer and Chief Financial Officer of The North Carolina Capital Management Trust: Cash and Term Portfolios (2006-2008). |
Bruce T. Herring (47) |
| Year of Election or Appointment: 2006 Vice President of certain Equity Funds. Mr. Herring also serves as President of Fidelity Research & Analysis Company (2010-present), Chief Investment Officer and Director of Fidelity Management & Research (U.K.) Inc. (2010-present) and Group Chief Investment Officer of FMR. Previously, Mr. Herring served as Vice President (2005-2006) and Senior Vice President (2006-2007) of Fidelity Management & Research Company, Vice President of FMR Co., Inc. (2001-2007) and as a portfolio manager for Fidelity U.S. Equity Funds. |
Brian B. Hogan (48) |
| Year of Election or Appointment: 2009 Vice President of Equity and High Income Funds. Mr. Hogan also serves as President of FMR's Equity Division (2009-present). Previously, Mr. Hogan served as Senior Vice President, Equity Research of FMR (2006-2009) and as a portfolio manager. |
Scott C. Goebel (44) |
| Year of Election or Appointment: 2008 Secretary and Chief Legal Officer (CLO) of the Fidelity funds. Mr. Goebel also serves as Secretary of Fidelity Investments Money Management, Inc. (FIMM) (2010-present) and Fidelity Research and Analysis Company (FRAC) (2010-present); Secretary and CLO of The North Carolina Capital Management Trust: Cash and Term Portfolios (2008-present); General Counsel, Secretary, and Senior Vice President of FMR (2008-present) and FMR Co., Inc. (2008-present); employed by FMR LLC or an affiliate (2001-present); Chief Legal Officer of Fidelity Management & Research (Hong Kong) Limited (2008-present) and Assistant Secretary of Fidelity Management & Research (Japan) Inc. (2008-present), and Fidelity Management & Research (U.K.) Inc. (2008-present). Previously, Mr. Goebel served as Assistant Secretary of FIMM (2008-2010), FRAC (2008-2010), and the Funds (2007-2008) and as Vice President and Secretary of Fidelity Distributors Corporation (FDC) (2005-2007). |
William C. Coffey (43) |
| Year of Election or Appointment: 2009 Assistant Secretary of Fidelity's Equity and High Income Funds. Mr. Coffey also serves as Senior Vice President and Deputy General Counsel of FMR LLC (2010-present), and is an employee of Fidelity Investments. Previously, Mr. Coffey served as Vice President and Associate General Counsel of FMR LLC (2005-2009). |
Elizabeth Paige Baumann (44) |
| Year of Election or Appointment: 2012 Anti-Money Laundering (AML) Officer of the Fidelity funds. Ms. Baumann also serves as AML Officer of The North Carolina Capital Management Trust: Cash and Term Portfolios (2012-present), Chief AML Officer of FMR LLC (2012-present), and is an employee of Fidelity Investments. Previously, Ms. Baumann served as Vice President and Deputy Anti-Money Laundering Officer (2007-2012). |
Christine Reynolds (54) |
| Year of Election or Appointment: 2008 Chief Financial Officer of the Fidelity funds. Ms. Reynolds became President of Fidelity Pricing and Cash Management Services (FPCMS) in August 2008. Ms. Reynolds served as Chief Operating Officer of FPCMS (2007-2008). Previously, Ms. Reynolds served as President, Treasurer, and Anti-Money Laundering officer of the Fidelity funds (2004-2007). |
Joseph A. Hanlon (44) |
| Year of Election or Appointment: 2012 Chief Compliance Officer of Fidelity's Equity and High Income Funds. Mr. Hanlon serves as Compliance Officer of FMR, FMR Co., Inc., Fidelity Investments Money Management, Inc. (FIMM), Fidelity Research and Analysis Company (FRAC), Fidelity Management & Research (Japan) Inc., Fidelity Management & Research (U.K.) Inc., Fidelity Management & Research (Hong Kong), and Strategic Advisers, Inc. (2009-present), as Senior Vice President of the Fidelity Asset Management Division (2009-present), and is an employee of Fidelity Investments. |
Joseph F. Zambello (55) |
| Year of Election or Appointment: 2011 Deputy Treasurer of the Fidelity funds. Mr. Zambello is an employee of Fidelity Investments. Previously, Mr. Zambello served as Vice President of FMR's Program Management Group (2009-2011) and Vice President of the Transfer Agent Oversight Group (2005-2009). |
Adrien E. Deberghes (45) |
| Year of Election or Appointment: 2008 Deputy Treasurer of Fidelity's Equity and High Income Funds. Mr. Deberghes also serves as Vice President (2011-present) and Assistant Treasurer (2010-present) of other Fidelity funds, and is an employee of Fidelity Investments (2008-present). Previously, Mr. Deberghes served as Senior Vice President of Mutual Fund Administration at State Street Corporation (2007-2008), Senior Director of Mutual Fund Administration at Investors Bank & Trust (2005-2007), and Director of Finance for Dunkin' Brands (2000-2005). |
Stephen Sadoski (41) |
| Year of Election or Appointment: 2012 Deputy Treasurer of Fidelity's Equity and High Income Funds. Mr. Sadoski also serves as Assistant Treasurer of other Fidelity funds (2012-present) and is an employee of Fidelity Investments (2012-present). Previously, Mr. Sadoski served as an assistant chief accountant in the Division of Investment Management of the Securities and Exchange Commission (SEC) (2009-2012) and as a senior manager at Deloitte & Touche (1997-2009). |
Stephanie J. Dorsey (43) |
| Year of Election or Appointment: 2010 Assistant Treasurer of Fidelity's Equity and High Income Funds. Ms. Dorsey also serves as Deputy Treasurer of other Fidelity funds (2008-present) and is an employee of Fidelity Investments (2008-present). Previously, Ms. Dorsey served as Treasurer (2004-2008) of the JPMorgan Mutual Funds and Vice President (2004-2008) of JPMorgan Chase Bank. |
John R. Hebble (54) |
| Year of Election or Appointment: 2009 Assistant Treasurer of Fidelity's Equity and High Income Funds. Mr. Hebble also serves as President (2011-present), Treasurer, and Chief Financial Officer of The North Carolina Capital Management Trust: Cash and Term Portfolios (2008-present), President and Treasurer of other Fidelity funds (2008-present) and is an employee of Fidelity Investments. |
Gary W. Ryan (54) |
| Year of Election or Appointment: 2005 Assistant Treasurer of the Fidelity funds. Mr. Ryan is an employee of Fidelity Investments. Previously, Mr. Ryan served as Vice President of Fund Reporting in Fidelity Pricing and Cash Management Services (FPCMS) (1999-2005). |
Jonathan Davis (44) |
| Year of Election or Appointment: 2010 Assistant Treasurer of the Fidelity funds. Mr. Davis is also Assistant Treasurer of Fidelity Rutland Square Trust II and Fidelity Commonwealth Trust II. Mr. Davis is an employee of Fidelity Investments. Previously, Mr. Davis served as Vice President and Associate General Counsel of FMR LLC (2003-2010). |
Annual Report
The Board of Trustees of Fidelity International Discovery Fund voted to pay to shareholders of record at the opening of business on record date, the following distributions per share derived from capital gains realized from sales of portfolio securities, and dividends derived from net investment income:
| Pay Date | Record Date | Dividends | Capital Gains |
Class K | 12/10/12 | 12/07/12 | $0.607 | $0.032 |
Class K designates 1% of the dividends distributed during the fiscal year as qualifying for the dividends-received deduction for corporate shareholders.
Class K designates 100% of the dividends distributed during the fiscal year as amounts which may be taken into account as a dividend for the purposes of the maximum rate under section 1(h)(11) of the Internal Revenue Code.
The amounts per share which represent income derived from sources within, and taxes paid to, foreign countries or possessions of the United States are as follows:
| Pay Date | Income | Taxes |
Class K | 12/05/11 | $0.501 | $0.0345 |
The fund will notify shareholders in January 2013 of amounts for use in preparing 2012 income tax returns.
Annual Report
Board Approval of Investment Advisory Contracts and Management Fees
Fidelity International Discovery Fund
Each year, the Board of Trustees, including the Independent Trustees (together, the Board), votes on the renewal of the management contract and sub-advisory agreements (together, the Advisory Contracts) for the fund. The Board, assisted by the advice of fund counsel and Independent Trustees' counsel, requests and considers a broad range of information relevant to the renewal of the Advisory Contracts throughout the year.
The Board meets regularly and, at each of its meetings, considers factors that are relevant to its annual consideration of the renewal of the fund's Advisory Contracts, including the services and support provided to the fund and its shareholders. The Board has established various standing committees, each composed of and chaired by Independent Trustees with varying backgrounds, to which the Board has assigned specific subject matter responsibilities in order to enhance effective decision-making by the Board. The Board, acting directly and through its Committees, requests and receives information concerning the annual consideration of the renewal of the fund's Advisory Contracts. The Board also meets as needed to consider matters specifically related to the Board's annual consideration of the renewal of Advisory Contracts. Members of the Board may also meet with trustees of other Fidelity funds through ad hoc joint committees to discuss certain matters relevant to the Fidelity funds.
At its July 2012 meeting, the Board of Trustees, including the Independent Trustees, unanimously determined to renew the fund's Advisory Contracts. In reaching its determination, the Board considered all factors it believed relevant, including (i) the nature, extent, and quality of the services to be provided to the fund and its shareholders (including the investment performance of the fund); (ii) the competitiveness of the fund's management fee and total expense ratio relative to peer funds; (iii) the total costs of the services to be provided by and the profits to be realized by Fidelity from its relationship with the fund; (iv) the extent to which economies of scale exist and would be realized as the fund grows; and (v) whether fee levels reflect these economies of scale, if any, for the benefit of fund shareholders.
In considering whether to renew the Advisory Contracts for the fund, the Board reached a determination, with the assistance of fund counsel and Independent Trustees' counsel and through the exercise of its business judgment, that the renewal of the Advisory Contracts is in the best interests of the fund and its shareholders and that the compensation payable under the Advisory Contracts is fair and reasonable. The Board's decision to renew the Advisory Contracts was not based on any single factor, but rather was based on a comprehensive consideration of all the information provided to the Board at its meetings throughout the year. The Board, in reaching its determination to renew the Advisory Contracts, is aware that shareholders in the fund have a broad range of investment choices available to them, including a wide choice among mutual funds offered by Fidelity's competitors, and that the fund's shareholders, who have the opportunity to review and weigh the disclosure provided by the fund in its prospectus and other public disclosures, have chosen to invest in this fund, managed by Fidelity.
Annual Report
Nature, Extent, and Quality of Services Provided. The Board considered the staffing within the investment adviser, FMR, and the sub-advisers (together, the Investment Advisers), including the backgrounds of the fund's investment personnel, and also considered the fund's investment objective, strategies, and related investment philosophy. The Independent Trustees also had discussions with senior management of Fidelity's investment operations and investment groups. The Board considered the structure of the portfolio manager compensation program and whether this structure provides appropriate incentives to act in the best interests of the fund.
Resources Dedicated to Investment Management and Support Services. The Board and the Fund Oversight and Research Committees reviewed the general qualifications and capabilities of the Investment Advisers' investment staff, including its size, education, experience, and resources, as well as the Investment Advisers' approach to recruiting, training, managing, and compensating investment personnel. The Board also noted that FMR has continued to increase the resources devoted to non-U.S. offices, including expansion of Fidelity's global investment organization. The Board noted that Fidelity's analysts have extensive resources, tools and capabilities that allow them to conduct sophisticated quantitative and fundamental analysis, as well as credit analysis of issuers, counterparties and guarantors. The Board also believes that Fidelity's investment professionals have sufficient access to global information and data so as to provide competitive investment results over time, and that those professionals also have access to sophisticated tools that permit them to assess portfolio construction and risk and performance attribution characteristics continuously, as well as to transmit new information and research conclusions rapidly around the world. Additionally, in its deliberations, the Board considered the Investment Advisers' trading and risk management capabilities and resources, which are an integral part of the investment management process.
Shareholder and Administrative Services. The Board considered (i) the nature, extent, quality, and cost of advisory, administrative, and shareholder services performed by the Investment Advisers and their affiliates under the Advisory Contracts and under separate agreements covering transfer agency, pricing and bookkeeping, and securities lending services for the fund; (ii) the nature and extent of the supervision of third party service providers, principally custodians and subcustodians; and (iii) the resources devoted to, and the record of compliance with, the fund's compliance policies and procedures. The Board also reviewed the allocation of fund brokerage, including allocations to brokers affiliated with the Investment Advisers, the use of brokerage commissions to pay fund expenses, and the use of "soft" commission dollars to pay for research services.
Annual Report
Board Approval of Investment Advisory Contracts and
Management Fees - continued
The Board noted that the growth of fund assets over time across the complex allows Fidelity to reinvest in the development of services designed to enhance the value or convenience of the Fidelity funds as investment vehicles. These services include 24-hour access to account information and market information through telephone representatives and over the Internet, investor education materials and asset allocation tools, and the expanded availability of Fidelity Investor Centers.
Investment in a Large Fund Family. The Board considered the benefits to shareholders of investing in a Fidelity fund, including the benefits of investing in a fund that is part of a large family of funds offering a variety of investment disciplines and providing a large variety of mutual fund investor services. The Board noted that Fidelity had taken, or had made recommendations that resulted in the Fidelity funds taking, a number of actions over the previous year that benefited particular funds, including (i) continuing to dedicate additional resources to investment research and support of the senior management team that oversees asset management; (ii) persisting in efforts to enhance Fidelity's research capabilities, in particular, international research; (iii) launching new funds and making other enhancements to meet client needs for global and income-oriented solutions; (iv) continuing to launch dedicated lower cost underlying funds to meet investment management's portfolio construction needs related to expanding underlying fund options, specifically for the Freedom Fund product lines; (v) adopting a "Stock Selector" sector neutral investment approach and employing a team of portfolio managers who are sector specialists to manage certain funds; (vi) rationalizing product lines and gaining increased efficiencies through the mergers of several funds into other funds; (vii) strengthening the Spartan Index Fund product line by adding new funds and/or new low-cost institutional share classes, restructuring fund expenses to accommodate new classes, and reducing investment minimums for certain classes of shares; (viii) modifying the eligibility criteria for Institutional Class shares to increase their appeal to government entities and charitable investors; and (ix) reducing certain transfer agent fee rates.
Investment Performance. The Board considered whether the fund has operated in accordance with its investment objective, as well as its record of compliance with its investment restrictions. It also reviewed the fund's absolute investment performance for each class, as well as the fund's relative investment performance for each class measured over multiple periods against (i) a broad-based securities market index, and (ii) a peer group of mutual funds deemed appropriate by Fidelity and reviewed by the Board. The following charts considered by the Board show, over the one-, three-, and five-year periods ended December 31, 2011, the cumulative total returns of Institutional Class (Class I) and Class B of the fund, the cumulative total returns of a broad-based securities market index ("benchmark"), and a range of cumulative total returns of a peer group of mutual funds identified by Morningstar, Inc. as having an investment style similar to that of the fund based on underlying portfolio holdings. The returns of Institutional Class (Class I) and Class B show the performance of the highest and lowest performing classes, respectively (based on five-year performance). The box within each chart shows the 25th percentile return (top of box) and the 75th percentile return (bottom of box) of the peer group. Returns shown above the box are in the first quartile and returns shown below the box are in the fourth quartile. The percentage beaten numbers noted below each chart correspond to the percentile box and represent the percentage of funds in the peer group whose performance was equal to or lower than that of the class indicated.
Annual Report
Fidelity International Discovery Fund

The Board reviewed the fund's relative investment performance against its peer group and noted that the performance of Institutional Class (Class I) of the fund was in the third quartile for the one- and three-year periods and the second quartile for the five-year period. The Board also noted that the investment performance of the fund was lower than its benchmark for the one- and three-year periods, although the five-year cumulative total return of Institutional Class (Class I) compared favorably to its benchmark. The Board considered that the variations in performance among the fund's classes reflect the variations in class expenses, which result in lower performance for higher expense classes. The Board discussed with FMR actions to improve the fund's disappointing performance relative to its peer group and benchmark. The Board also reviewed the fund's performance since inception as well as performance in the current year. The Board will continue to closely monitor the performance of the fund in the coming year and discuss with FMR other appropriate actions to address the performance of the fund.
The Board also considered that the fund's management fee is subject to upward or downward adjustment depending upon whether, and to what extent, the fund's investment performance for the performance period exceeds, or is exceeded by, the record (over the same period) of a Board-approved performance adjustment index. The Board noted that the performance adjustment provides FMR with a strong economic incentive to seek to achieve superior performance for the fund's shareholders and helps to more closely align the interests of FMR and the fund's shareholders.
Annual Report
Board Approval of Investment Advisory Contracts and
Management Fees - continued
Based on its review, the Board concluded that the nature, extent, and quality of services provided to the fund under the Advisory Contracts should benefit the fund's shareholders.
Competitiveness of Management Fee and Total Expense Ratio. The Board considered the fund's management fee and total expense ratio compared to "mapped groups" of competitive funds and classes. Fidelity creates "mapped groups" by combining similar Lipper investment objective categories that have comparable management fee characteristics. Combining Lipper investment objective categories aids the Board's management fee and total expense ratio comparisons by broadening the competitive group used for comparison and by reducing the number of universes to which various Fidelity funds are compared.
Management Fee. The Board considered two proprietary management fee comparisons for the 12-month periods shown in the chart below. The group of Lipper funds used by the Board for management fee comparisons is referred to below as the "Total Mapped Group." The Total Mapped Group comparison focuses on a fund's standing relative to the total universe of comparable funds available to investors in terms of gross management fees before expense reimbursements or caps, and without giving effect to the fund's performance adjustment. "TMG %" represents the percentage of funds in the Total Mapped Group that had management fees that were lower than the fund's. For example, a TMG % of 17% means that 83% of the funds in the Total Mapped Group had higher management fees than the fund. The "Asset-Size Peer Group" (ASPG) comparison focuses on a fund's standing relative to non-Fidelity funds similar in size to the fund within the Total Mapped Group. The ASPG represents at least 15% of the funds in the Total Mapped Group with comparable asset size and management fee characteristics, subject to a minimum of 50 funds (or all funds in the Total Mapped Group if fewer than 50). Additional information, such as the ASPG quartile in which the fund's management fee ranked and the impact of the fund's performance adjustment, is also included in the chart and considered by the Board.
Annual Report
Fidelity International Discovery Fund

The Board noted that the fund's management fee ranked below the median of its Total Mapped Group and below the median of its ASPG for 2011. The Board also noted the effect of the fund's negative performance adjustment on the fund's management fee ranking. The Board noted that the performance adjustment for each year represents calculations for performance periods that differ from the periods shown in the performance charts above.
Based on its review, the Board concluded that the fund's management fee is fair and reasonable in light of the services that the fund receives and the other factors considered.
Total Expense Ratio. In its review of each class's total expense ratio, the Board considered the fund's management fee as well as other fund or class expenses, as applicable, such as transfer agent fees, pricing and bookkeeping fees, fund-paid 12b-1 fees, and custodial, legal, and audit fees. The Board also noted the effects of any waivers and reimbursements on fees and expenses, as well as the impact of the fund's performance adjustment. As part of its review, the Board also considered the current and historical total expense ratios of each class of the fund compared to competitive fund median expenses. Each class of the fund is compared to those funds and classes in the Total Mapped Group (used by the Board for management fee comparisons) that have a similar sales load structure.
The Board noted that the total expense ratio of each of Class A, Class B, Class C, Institutional Class, the retail class, and Class K ranked below its competitive median for 2011 and the total expense ratio of Class T ranked above its competitive median for 2011. The Board considered that various factors, including 12b-1 fees, positive or negative performance adjustments, and relatively higher other expenses in the case of small fund size, can affect total expense ratios. The Board noted that the total expense ratio of Class T was above the competitive median primarily because of higher 12b-1 fees on Class T. Class T has a higher 12b-1 fee, but a lower front-end sales charge, than traditionally priced front-end sales charge classes. The Board considered that Class T is primarily sold load-waived in the retirement plan market where its 0.50% 12b-1 fee is comparable to competing no-load, higher 12b-1 fee classes designed specifically for retirement plans. The Board noted that the fund offers multiple classes, each of which has a different sales load and 12b-1 fee structure, and that the multiple structures are intended to offer a range of pricing options for the intermediary market. The Board also noted that the total expense ratios of the classes vary primarily by the level of their 12b-1 fees, although differences in transfer agent fees may also cause expenses to vary from class to class.
Annual Report
Board Approval of Investment Advisory Contracts and
Management Fees - continued
Fees Charged to Other Fidelity Clients. The Board also considered Fidelity fee structures and other information with respect to clients of FMR and its affiliates, such as other mutual funds advised or subadvised by FMR or its affiliates, pension plan clients, and other institutional clients. The Board noted the findings of the 2010 ad hoc joint committee (created with the board of other Fidelity funds), which reviewed and compared Fidelity's institutional investment advisory business with its business of providing services to the Fidelity funds, including the differences in services provided, fees charged, and costs incurred, as well as competition in their respective marketplaces.
Based on its review of total expense ratios and fees charged to other Fidelity clients, the Board concluded that the total expense ratio of each class of the fund was reasonable, although Class T was above the median of the universe presented for comparison, in light of the services that the fund and its shareholders receive and the other factors considered.
Costs of the Services and Profitability. The Board considered the revenues earned and the expenses incurred by Fidelity in conducting the business of developing, marketing, distributing, managing, administering and servicing the fund and its shareholders. The Board also considered the level of Fidelity's profits in respect of all the Fidelity funds.
On an annual basis, FMR presents to the Board Fidelity's profitability for the fund. Fidelity calculates the profitability for each fund, as well as aggregate profitability for groups of Fidelity funds and all Fidelity funds, using a series of detailed revenue and cost allocation methodologies which originate with the books and records of Fidelity on which Fidelity's audited financial statements are based. The Audit Committee of the Board reviews any significant changes from the prior year's methodologies.
PricewaterhouseCoopers LLP (PwC), independent registered public accounting firm and auditor to Fidelity and certain Fidelity funds, has been engaged annually by the Board as part of the Board's assessment of Fidelity's profitability analysis. PwC's engagement includes the review and assessment of Fidelity's methodologies used in determining the revenues and expenses attributable to Fidelity's mutual fund business, and completion of agreed-upon procedures surrounding the mathematical accuracy of fund profitability and its conformity to allocation methodologies. After considering PwC's reports issued under the engagement and information provided by Fidelity, the Board concluded that while other allocation methods may also be reasonable, Fidelity's profitability methodologies are reasonable in all material respects.
Annual Report
The Board also reviewed Fidelity's non-fund businesses and fall-out benefits related to the mutual fund business as well as cases where Fidelity's affiliates may benefit from or be related to the fund's business.
The Board considered the costs of the services provided by and the profits realized by Fidelity in connection with the operation of the fund and was satisfied that the profitability was not excessive in the circumstances.
Economies of Scale. The Board considered whether there have been economies of scale in respect of the management of the Fidelity funds, whether the Fidelity funds (including the fund) have appropriately benefited from any such economies of scale, and whether there is potential for realization of any further economies of scale. The Board considered the extent to which the fund will benefit from economies of scale through increased services to the fund, through waivers or reimbursements, or through fee or expense reductions. The Board also noted that in 2009, it and the board of other Fidelity funds created an ad hoc committee (the Economies of Scale Committee) to analyze whether FMR attains economies of scale in respect of the management and servicing of the Fidelity funds, whether the Fidelity funds have appropriately benefited from such economies of scale, and whether there is potential for realization of any further economies of scale.
The Board recognized that the fund's management contract incorporates a "group fee" structure, which provides for lower group fee rates as total fund assets under FMR's management increase, and for higher group fee rates as total fund assets under FMR's management decrease. FMR calculates the group fee rates based on a tiered asset "breakpoint" schedule that varies based on asset class. The Board considered that the group fee is designed to deliver the benefits of economies of scale to fund shareholders when total Fidelity fund assets increase, even if assets of any particular fund are unchanged or have declined, because some portion of Fidelity's costs are attributable to services provided to all Fidelity funds, and all funds benefit if those costs can be allocated among more assets. The Board concluded that, given the group fee structure, fund shareholders will benefit from lower management fees as assets under FMR's management increase at the fund complex level, regardless of whether Fidelity achieves any such economies of scale.
Annual Report
Board Approval of Investment Advisory Contracts and
Management Fees - continued
The Board concluded, taking into account the analysis of the Economies of Scale Committee, that economies of scale, if any, are being appropriately shared between fund shareholders and Fidelity.
Additional Information Requested by the Board. In order to develop fully the factual basis for consideration of the Fidelity funds' Advisory Contracts, the Board requested and received additional information on certain topics, including (i) fund performance trends, actions to be taken by FMR to improve certain funds' overall performance, and Fidelity's long-term strategies for certain funds; (ii) the potential to further rationalize the Fidelity fund lineup with the possibility of achieving savings for the funds and Fidelity; (iii) Fidelity's compensation structure for portfolio managers and other key investment personnel; (iv) the amount of the investment that each portfolio manager has made in the Fidelity fund(s) that he or she manages; (v) the realization of fall-out benefits in certain Fidelity business units; (vi) Fidelity's group fee structures, the potential impact of regulatory changes on such structures, and the rationale for the individual fee rates of certain funds; (vii) fund profitability methodology, including Fidelity's cost allocation methodology, and the impact of certain factors on fund profitability results; (viii) trends regarding industry use of performance fee structures and the possibility of implementing performance fee structures for additional funds; and (ix) the impact of net redemptions from the Fidelity funds.
Based on its evaluation of all of the conclusions noted above, and after considering all factors it believed relevant, the Board ultimately concluded that the advisory fee structures are fair and reasonable, and that the fund's Advisory Contracts should be renewed.
Annual Report
Investment Adviser
Fidelity Management & Research Company
Boston, MA
Investment Sub-Advisers
FMR Co., Inc.
Fidelity Management & Research
(U.K.) Inc.
FIL Investments (Japan) Limited
FIL Investment Advisors
FIL Investment Advisors
(U.K.) Limited
Fidelity Management & Research
(Hong Kong) Limited
Fidelity Management & Research
(Japan) Inc.
General Distributor
Fidelity Distributors Corporation
Smithfield, RI
Transfer and Service Agents
Fidelity Investments Institutional
Operations Company, Inc.
Boston, MA
Fidelity Service Company, Inc.
Boston, MA
Custodian
(Fidelity Investment logo)(registered trademark)
Corporate Headquarters
82 Devonshire St., Boston, MA 02109
www.fidelity.com
The Northern Trust Company
Chicago, IL
IGI-K-UANN-1212
1.863305.104
Fidelity®
International Discovery
Fund
Annual Report
October 31, 2012
(Fidelity Cover Art)
Contents
Performance | (Click Here) | How the fund has done over time. |
Management's Discussion of Fund Performance | (Click Here) | The Portfolio Manager's review of fund performance and strategy. |
Shareholder Expense Example | (Click Here) | An example of shareholder expenses. |
Investment Changes | (Click Here) | A summary of major shifts in the fund's investments over the past six months. |
Investments | (Click Here) | A complete list of the fund's investments with their market values. |
Financial Statements | (Click Here) | Statements of assets and liabilities, operations, and changes in net assets, as well as financial highlights. |
Notes | (Click Here) | Notes to the financial statements. |
Report of Independent Registered Public Accounting Firm | (Click Here) | |
Trustees and Officers | (Click Here) | |
Distributions | (Click Here) | |
Board Approval of Investment Advisory Contracts and Management Fees | (Click Here) | |
To view a fund's proxy voting guidelines and proxy voting record for the 12-month period ended June 30, visit http://www.fidelity.com/proxyvotingresults or visit the Securities and Exchange Commission's (SEC) web site at http://www.sec.gov. You may also call 1-800-544-8544 to request a free copy of the proxy voting guidelines.
Standard & Poor's, S&P and S&P 500 are registered service marks of The McGraw-Hill Companies, Inc. and have been licensed for use by Fidelity Distributors Corporation.
Other third party marks appearing herein are the property of their respective owners.
All other marks appearing herein are registered or unregistered trademarks or service marks of FMR LLC or an affiliated company. © 2012 FMR LLC. All rights reserved.
Annual Report
This report and the financial statements contained herein are submitted for the general information of the shareholders of the fund. This report is not authorized for distribution to prospective investors in the fund unless preceded or accompanied by an effective prospectus.
A fund files its complete schedule of portfolio holdings with the SEC for the first and third quarters of each fiscal year on Form N-Q. Forms N-Q are available on the SEC's web site at http://www.sec.gov. A fund's Forms N-Q may be reviewed and copied at the SEC's Public Reference Room in Washington, DC. Information regarding the operation of the SEC's Public Reference Room may be obtained by calling 1-800-SEC-0330. For a complete list of a fund's portfolio holdings, view the most recent holdings listing, semiannual report, or annual report on Fidelity's web site at http://www.fidelity.com, http://www.advisor.fidelity.com, or http://www.401k.com, as applicable.
NOT FDIC INSURED • MAY LOSE VALUE • NO BANK GUARANTEE
Neither the fund nor Fidelity Distributors Corporation is a bank.
Annual Report
Average annual total return reflects the change in the value of an investment, assuming reinvestment of the class' distributions from dividend income and capital gains (the profits earned upon the sale of securities that have grown in value, if any) and assuming a constant rate of performance each year. The $10,000 table and the fund's returns do not reflect the deduction of taxes that a shareholder would pay on fund distributions or the redemption of fund shares. During periods of reimbursement by Fidelity, a fund's total return will be greater than it would be had the reimbursement not occurred. How a fund did yesterday is no guarantee of how it will do tomorrow.
Average Annual Total Returns
Periods ended October 31, 2012 | Past 1
year | Past 5
years | Past 10
years |
Fidelity® International Discovery Fund A | 9.03% | -5.70% | 9.11% |
A Prior to October 1, 2004, Fidelity International Discovery Fund operated under certain different investment policies. The fund's historical performance may not represent its current investment policies.
$10,000 Over 10 Years
Let's say hypothetically that $10,000 was invested in Fidelity® International Discovery Fund, a class of the fund, on October 31, 2002. The chart shows how the value of your investment would have changed, and also shows how the MSCI® EAFE ® Index performed over the same period.
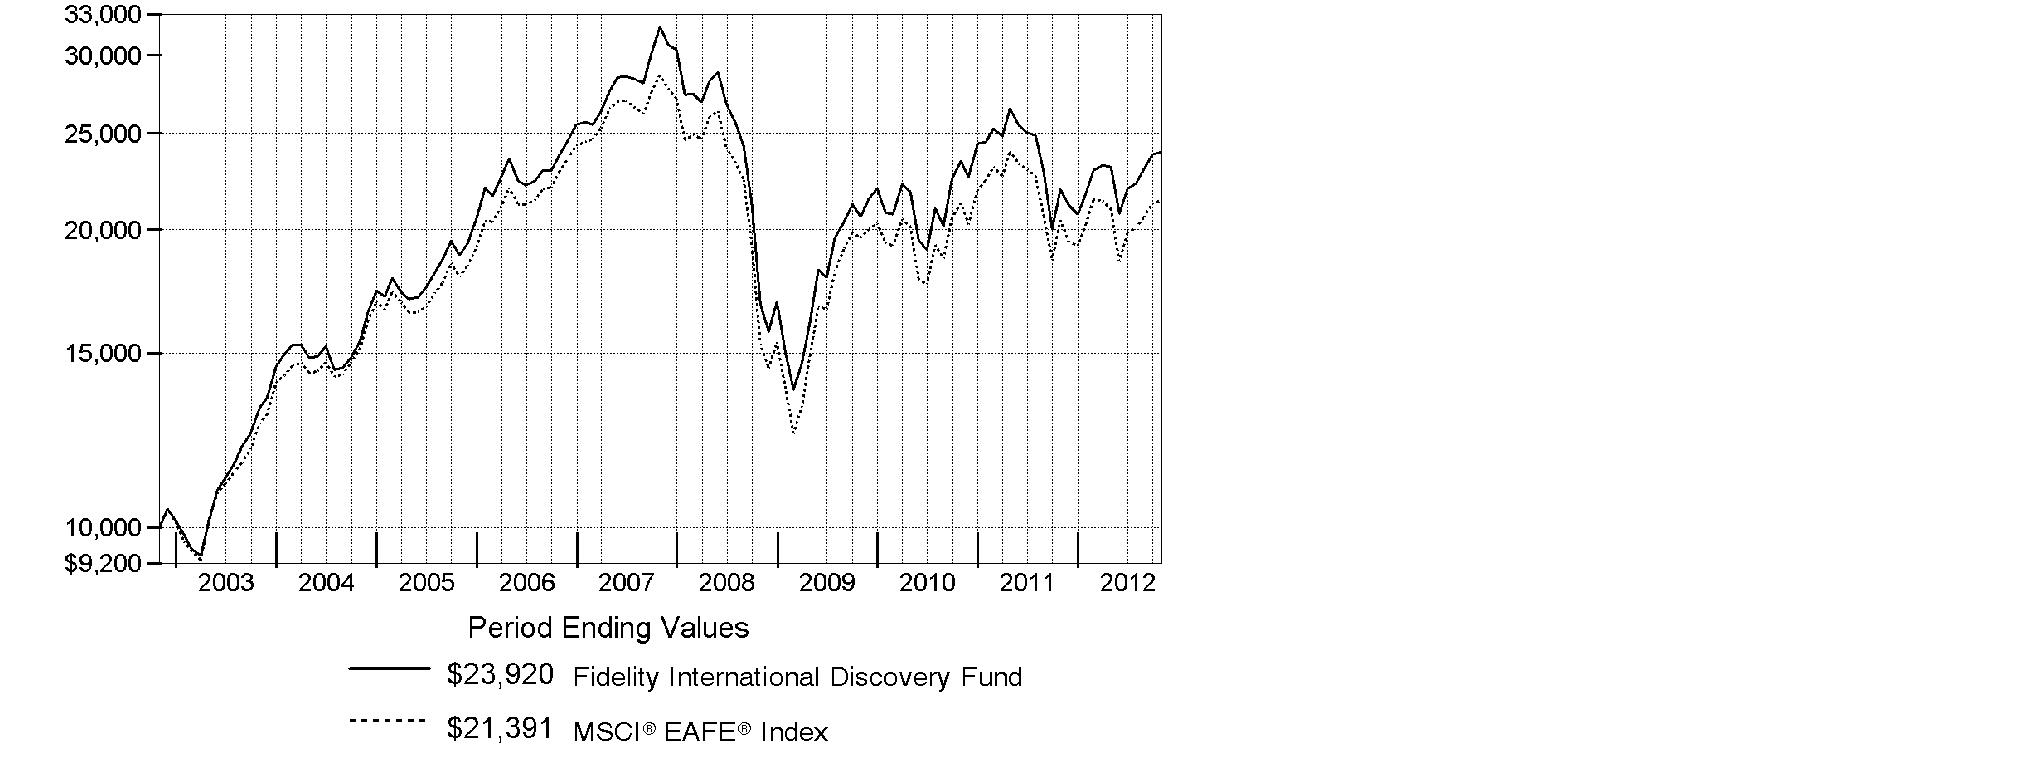
Annual Report
Market Recap: International stocks experienced pendulum-like swings during the 12 months ending October 31, 2012, finishing the period with a modest advance. The market faced periodic bouts of volatility this past year, as a number of macroeconomic concerns - including the eurozone debt crisis, the strength and pace of the U.S. economic recovery, and a slowdown in China's once-blistering growth - dominated headlines and weighed on investors. While a stronger U.S. dollar provided an additional head wind, foreign developed- and emerging-markets stocks still managed a gain for the 12 months, as the MSCI® ACWI® (All Country World Index) ex USA Index rose 4.11%, largely buttressed in the summertime by pledges of accommodative monetary action from eurozone officials, as well as signs that the U.S. housing market was on the mend. Within the index, Asia-Pacific ex Japan showed the most impressive gains, advancing roughly 11%. A number of core European components, most notably Germany (+11%), Switzerland (+10%) and the U.K. (+9%), benefited from optimism about the eurozone's ability to resolve its debt woes, which also helped the region outpace the index overall. Elsewhere, results from Canada (+3%) and the generally more volatile emerging markets (+2%) each fell short of the MSCI index, while Japan was among the few benchmark constituents to finish in the red, returning about -3%.
Comments from William Kennedy, Portfolio Manager of Fidelity® International Discovery Fund: For the year, the fund's Retail Class shares returned 9.03%, outpacing the 4.76% gain of the MSCI® EAFE® Index. Security selection drove relative performance, with particularly strong contributions from my choices within Europe ex U.K., Japan and emerging markets. Stock picks in consumer staples and information technology also helped. Top individual contributors included Netherlands-based digital security leader Gemalto, whose strong gain was fueled by the worldwide growth of mobile and cloud computing. Shares of Hong Kong's Techtronic Industries, whose products include Ryobi power tools and Hoover vacuums, moved sharply higher, due to resilience in the U.S., where it sells a lot of its goods. An investment in drugstore retailer Cosmos Pharmaceutical in Japan also helped, buoyed by expansion into new markets. By contrast, security selection in the U.K. detracted. The biggest individual disappointments were online retailers in Japan: Start Today and Rakuten. Both stocks declined as business slowed and competition increased. Techtronic, Cosmos and Start Today were not in the index, and Start Today was not held at period end.
The views expressed above reflect those of the portfolio manager(s) only through the end of the period as stated on the cover of this report and do not necessarily represent the views of Fidelity or any other person in the Fidelity organization. Any such views are subject to change at any time based upon market or other conditions and Fidelity disclaims any responsibility to update such views. These views may not be relied on as investment advice and, because investment decisions for a Fidelity fund are based on numerous factors, may not be relied on as an indication of trading intent on behalf of any Fidelity fund.
Annual Report
Shareholder Expense Example
As a shareholder of the Fund, you incur two types of costs: (1) transaction costs, including sales charges (loads) on purchase payments or redemption proceeds, redemption fees and (2) ongoing costs, including management fees, distribution and/or service (12b-1) fees and other Fund expenses. This Example is intended to help you understand your ongoing costs (in dollars) of investing in the Fund and to compare these costs with the ongoing costs of investing in other mutual funds.
The Example is based on an investment of $1,000 invested at the beginning of the period and held for the entire period (May 1, 2012 to October 31, 2012).
Actual Expenses
The first line of the accompanying table for each class of the Fund provides information about actual account values and actual expenses. You may use the information in this line, together with the amount you invested, to estimate the expenses that you paid over the period. Simply divide your account value by $1,000.00 (for example, an $8,600 account value divided by $1,000.00 = 8.6), then multiply the result by the number in the first line for a class of the Fund under the heading entitled "Expenses Paid During Period" to estimate the expenses you paid on your account during this period. A small balance maintenance fee of $12.00 that is charged once a year may apply for certain accounts with a value of less than $2,000. This fee is not included in the table below. If it was, the estimate of expenses you paid during the period would be higher, and your ending account value lower, by this amount. In addition, the Fund, as a shareholder in the underlying Fidelity Central Funds, will indirectly bear its pro-rata share of the fees and expenses incurred by the underlying Fidelity Central Funds. These fees and expenses are not included in the Fund's annualized expense ratio used to calculate the expense estimate in the table below.
Hypothetical Example for Comparison Purposes
The second line of the accompanying table for each class of the Fund provides information about hypothetical account values and hypothetical expenses based on a Class' actual expense ratio and an assumed rate of return of 5% per year before expenses, which is not the Class' actual return. The hypothetical account values and expenses may not be used to estimate the actual ending account balance or expenses you paid for the period. You may use this information to compare the ongoing costs of investing in the Fund and other funds. To do so, compare this 5% hypothetical example with the 5% hypothetical examples that appear in the shareholder reports of the other funds. A small balance maintenance fee of $12.00 that is charged once a year may apply for certain accounts with a value of less than $2,000. This fee is not included in the table below. If it was, the estimate of expenses you paid during the period would be higher, and your ending account value lower, by this amount. In addition, the Fund, as a shareholder in the underlying Fidelity Central Funds, will indirectly bear its pro-rata share of the fees and expenses incurred by the underlying Fidelity Central Funds. These fees and expenses are not included in the Fund's annualized expense ratio used to calculate the expense estimate in the table below.
Please note that the expenses shown in the table are meant to highlight your ongoing costs only and do not reflect any transaction costs. Therefore, the second line of the table is useful in comparing ongoing costs only, and will not help you determine the relative total costs of owning different funds. In addition, if these transactional costs were included, your costs would have been higher.
Annual Report
| Annualized
Expense Ratio | Beginning
Account Value
May 1, 2012 | Ending
Account Value
October 31, 2012 | Expenses Paid
During Period*
May 1, 2012
to October 31, 2012 |
Class A | 1.41% | | | |
Actual | | $ 1,000.00 | $ 1,033.30 | $ 7.21 |
HypotheticalA | | $ 1,000.00 | $ 1,018.05 | $ 7.15 |
Class T | 1.67% | | | |
Actual | | $ 1,000.00 | $ 1,031.90 | $ 8.53 |
HypotheticalA | | $ 1,000.00 | $ 1,016.74 | $ 8.47 |
Class B | 2.16% | | | |
Actual | | $ 1,000.00 | $ 1,029.30 | $ 11.02 |
HypotheticalA | | $ 1,000.00 | $ 1,014.28 | $ 10.94 |
Class C | 2.16% | | | |
Actual | | $ 1,000.00 | $ 1,029.60 | $ 11.02 |
HypotheticalA | | $ 1,000.00 | $ 1,014.28 | $ 10.94 |
International Discovery | 1.08% | | | |
Actual | | $ 1,000.00 | $ 1,035.00 | $ 5.52 |
HypotheticalA | | $ 1,000.00 | $ 1,019.71 | $ 5.48 |
Class K | .90% | | | |
Actual | | $ 1,000.00 | $ 1,035.70 | $ 4.61 |
HypotheticalA | | $ 1,000.00 | $ 1,020.61 | $ 4.57 |
Institutional Class | 1.07% | | | |
Actual | | $ 1,000.00 | $ 1,035.10 | $ 5.47 |
HypotheticalA | | $ 1,000.00 | $ 1,019.76 | $ 5.43 |
A 5% return per year before expenses
* Expenses are equal to each Class' annualized expense ratio, multiplied by the average account value over the period, multiplied by 184/366 (to reflect the one-half year period).
Annual Report
Investment Changes (Unaudited)
Geographic Diversification (% of fund's net assets) |
As of October 31, 2012 |
 | United Kingdom 21.2% | |
 | Japan 16.1% | |
 | France 8.5% | |
 | Germany 8.3% | |
 | United States of America 7.0% | |
 | Switzerland 5.3% | |
 | Netherlands 3.2% | |
 | Australia 3.0% | |
 | Italy 2.7% | |
| Other 24.7% | |

Percentages are based on country or territory of incorporation and are adjusted for the effect of futures contracts, if applicable. |
As of April 30, 2012 |
| United Kingdom 21.0% | |
| Japan 16.7% | |
| United States of America 6.7% | |
| France 6.2% | |
| Germany 5.4% | |
| Netherlands 4.7% | |
| Switzerland 4.5% | |
| Korea (South) 3.9% | |
| Australia 3.4% | |
| Other 27.5% | |

Percentages are based on country or territory of incorporation and are adjusted for the effect of futures contracts, if applicable. |
Asset Allocation |
| % of fund's
net assets | % of fund's net assets
6 months ago |
Stocks and Investment Companies | 96.7 | 97.5 |
Short-Term Investments and Net Other Assets (Liabilities) | 3.3 | 2.5 |
Top Ten Stocks as of October 31, 2012 |
| % of fund's
net assets | % of fund's net assets
6 months ago |
Royal Dutch Shell PLC Class B (United Kingdom) (United Kingdom, Oil, Gas & Consumable Fuels) | 2.6 | 2.7 |
ORIX Corp. (Japan, Diversified Financial Services) | 1.6 | 1.5 |
Anheuser-Busch InBev SA NV (Belgium, Beverages) | 1.6 | 1.3 |
Novo Nordisk A/S Series B (Denmark, Pharmaceuticals) | 1.6 | 1.4 |
BHP Billiton PLC (United Kingdom, Metals & Mining) | 1.5 | 1.3 |
Australia & New Zealand Banking Group Ltd. (Australia, Commercial Banks) | 1.5 | 1.3 |
Vodafone Group PLC (United Kingdom, Wireless Telecommunication Services) | 1.4 | 1.1 |
British American Tobacco PLC (United Kingdom) (United Kingdom, Tobacco) | 1.4 | 1.8 |
Diageo PLC (United Kingdom, Beverages) | 1.4 | 1.2 |
BNP Paribas SA (France, Commercial Banks) | 1.3 | 0.7 |
| 15.9 | |
Market Sectors as of October 31, 2012 |
| % of fund's
net assets | % of fund's net assets
6 months ago |
Financials | 23.0 | 18.9 |
Consumer Discretionary | 15.5 | 15.8 |
Industrials | 13.5 | 12.6 |
Information Technology | 10.4 | 12.7 |
Consumer Staples | 9.7 | 11.2 |
Health Care | 7.2 | 6.5 |
Materials | 6.4 | 7.5 |
Energy | 5.9 | 6.7 |
Telecommunication Services | 4.2 | 4.9 |
Utilities | 0.9 | 0.7 |
Annual Report
Investments October 31, 2012
Showing Percentage of Net Assets
Common Stocks - 95.5% |
| Shares | | Value (000s) |
Australia - 3.0% |
Australia & New Zealand Banking Group Ltd. | 4,818,449 | | $ 127,296 |
Commonwealth Bank of Australia | 1,009,530 | | 60,519 |
Ramsay Health Care Ltd. | 1,305,776 | | 32,206 |
Spark Infrastructure Group unit | 19,962,099 | | 35,020 |
TOTAL AUSTRALIA | | 255,041 |
Bailiwick of Jersey - 1.9% |
Experian PLC | 5,023,200 | | 86,736 |
Wolseley PLC | 1,576,864 | | 68,935 |
TOTAL BAILIWICK OF JERSEY | | 155,671 |
Belgium - 1.6% |
Anheuser-Busch InBev SA NV | 1,604,727 | | 134,205 |
Bermuda - 0.5% |
Cheung Kong Infrastructure Holdings Ltd. | 6,458,000 | | 37,831 |
Brazil - 1.2% |
Arezzo Industria e Comercio SA | 570,800 | | 10,188 |
Qualicorp SA (a) | 4,567,000 | | 46,861 |
Souza Cruz SA | 1,909,200 | | 24,910 |
Totvs SA | 1,077,500 | | 21,910 |
TOTAL BRAZIL | | 103,869 |
British Virgin Islands - 0.3% |
Gem Diamonds Ltd. (a) | 716,328 | | 1,951 |
Mail.ru Group Ltd. GDR (Reg. S) | 676,800 | | 22,571 |
TOTAL BRITISH VIRGIN ISLANDS | | 24,522 |
Canada - 0.5% |
Goldcorp, Inc. | 571,200 | | 25,822 |
InterOil Corp. (a)(d) | 204,400 | | 13,180 |
TOTAL CANADA | | 39,002 |
Cayman Islands - 0.4% |
Eurasia Drilling Co. Ltd. GDR (Reg. S) | 439,400 | | 15,203 |
Sands China Ltd. | 4,911,200 | | 18,472 |
TOTAL CAYMAN ISLANDS | | 33,675 |
Denmark - 1.9% |
Novo Nordisk A/S Series B | 819,389 | | 131,361 |
William Demant Holding A/S (a) | 337,100 | | 28,993 |
TOTAL DENMARK | | 160,354 |
Common Stocks - continued |
| Shares | | Value (000s) |
France - 8.5% |
Arkema SA | 341,370 | | $ 31,123 |
Atos Origin SA | 384,842 | | 25,843 |
AXA SA | 4,066,402 | | 64,645 |
BNP Paribas SA | 2,238,845 | | 112,622 |
Bureau Veritas SA | 535,700 | | 56,888 |
Credit Agricole SA (a) | 3,474,800 | | 26,158 |
Iliad SA | 339,150 | | 52,245 |
Lafarge SA (Bearer) | 458,700 | | 26,861 |
LVMH Moet Hennessy - Louis Vuitton SA | 428,223 | | 69,602 |
PPR SA | 398,700 | | 70,101 |
Sanofi SA | 953,011 | | 83,701 |
Schneider Electric SA | 1,208,000 | | 75,524 |
Technip SA | 192,300 | | 21,660 |
TOTAL FRANCE | | 716,973 |
Germany - 7.1% |
Aareal Bank AG (a) | 1,044,895 | | 22,414 |
Allianz AG | 385,690 | | 47,822 |
BASF AG | 979,717 | | 81,182 |
Bayerische Motoren Werke AG (BMW) | 959,142 | | 76,394 |
Brenntag AG | 288,900 | | 36,412 |
Fresenius Medical Care AG & Co. KGaA | 384,000 | | 26,981 |
Fresenius SE & Co. KGaA | 161,700 | | 18,444 |
GEA Group AG | 992,880 | | 31,002 |
Gerry Weber International AG (Bearer) | 320,600 | | 14,552 |
GSW Immobilien AG | 497,845 | | 20,484 |
HeidelbergCement Finance AG | 504,300 | | 26,728 |
MTU Aero Engines Holdings AG | 286,300 | | 24,039 |
SAP AG | 1,172,710 | | 85,518 |
Siemens AG | 442,361 | | 44,572 |
Wirecard AG | 1,592,900 | | 36,400 |
TOTAL GERMANY | | 592,944 |
Hong Kong - 1.9% |
AIA Group Ltd. | 15,454,400 | | 61,219 |
HKT Trust / HKT Ltd. unit | 23,518,000 | | 21,818 |
Techtronic Industries Co. Ltd. | 39,683,000 | | 75,576 |
TOTAL HONG KONG | | 158,613 |
India - 1.0% |
Apollo Hospitals Enterprise Ltd. | 442,506 | | 6,415 |
Common Stocks - continued |
| Shares | | Value (000s) |
India - continued |
Housing Development Finance Corp. Ltd. | 3,327,565 | | $ 47,147 |
Titan Industries Ltd. | 6,456,377 | | 31,115 |
TOTAL INDIA | | 84,677 |
Indonesia - 0.7% |
PT Media Nusantara Citra Tbk | 42,573,500 | | 12,522 |
PT Sarana Menara Nusantara Tbk (a) | 6,310,500 | | 12,811 |
PT Tower Bersama Infrastructure Tbk (a) | 55,223,500 | | 28,747 |
TOTAL INDONESIA | | 54,080 |
Ireland - 1.8% |
Accenture PLC Class A | 854,400 | | 57,595 |
James Hardie Industries NV CDI | 6,070,470 | | 58,162 |
Paddy Power PLC (Ireland) | 503,500 | | 37,160 |
TOTAL IRELAND | | 152,917 |
Israel - 0.4% |
Check Point Software Technologies Ltd. (a) | 743,300 | | 33,099 |
Italy - 2.7% |
ENI SpA | 2,799,900 | | 64,428 |
Fiat Industrial SpA | 3,323,832 | | 35,995 |
Prada SpA | 4,029,100 | | 32,856 |
Prysmian SpA | 1,518,800 | | 29,214 |
Saipem SpA | 1,502,203 | | 67,486 |
TOTAL ITALY | | 229,979 |
Japan - 16.1% |
ABC-Mart, Inc. | 1,177,300 | | 51,617 |
Aeon Credit Service Co. Ltd. | 2,050,800 | | 43,518 |
Aozora Bank Ltd. | 7,872,000 | | 22,187 |
Calbee, Inc. | 351,700 | | 32,293 |
Chiyoda Corp. | 2,780,000 | | 44,853 |
Cosmos Pharmaceutical Corp. | 419,800 | | 41,386 |
Credit Saison Co. Ltd. | 881,500 | | 19,357 |
Daito Trust Construction Co. Ltd. | 212,800 | | 21,485 |
Don Quijote Co. Ltd. | 1,818,400 | | 71,638 |
Fanuc Corp. | 290,400 | | 46,236 |
Fast Retailing Co. Ltd. | 210,800 | | 46,950 |
Hitachi Ltd. | 8,642,000 | | 45,792 |
Honda Motor Co. Ltd. | 1,472,400 | | 44,265 |
Japan Tobacco, Inc. | 2,815,200 | | 77,794 |
JS Group Corp. | 1,856,500 | | 41,046 |
Common Stocks - continued |
| Shares | | Value (000s) |
Japan - continued |
JSR Corp. | 2,283,400 | | $ 39,129 |
Kakaku.com, Inc. | 810,600 | | 27,771 |
Keyence Corp. | 304,060 | | 80,671 |
Mitsubishi Estate Co. Ltd. | 2,651,000 | | 52,436 |
Mitsubishi UFJ Financial Group, Inc. | 15,161,400 | | 68,590 |
Nintendo Co. Ltd. | 201,200 | | 25,909 |
ORIX Corp. | 1,321,050 | | 135,696 |
Park24 Co. Ltd. | 1,342,800 | | 23,078 |
Rakuten, Inc. | 7,986,500 | | 71,831 |
Seven Bank Ltd. | 12,837,900 | | 36,666 |
Ship Healthcare Holdings, Inc. | 534,800 | | 17,840 |
So-net M3, Inc. | 5,725 | | 11,001 |
Softbank Corp. | 775,300 | | 24,542 |
Suzuki Motor Corp. | 1,383,700 | | 31,338 |
Unicharm Corp. | 622,700 | | 33,697 |
USS Co. Ltd. | 196,050 | | 20,605 |
TOTAL JAPAN | | 1,351,217 |
Korea (South) - 2.5% |
Hyundai Motor Co. | 273,935 | | 56,404 |
Kia Motors Corp. | 285,255 | | 15,854 |
LG Household & Health Care Ltd. | 56,182 | | 33,029 |
NHN Corp. | 64,289 | | 14,888 |
Orion Corp. | 14,973 | | 14,062 |
Samsung Electronics Co. Ltd. | 64,872 | | 77,943 |
TOTAL KOREA (SOUTH) | | 212,180 |
Luxembourg - 0.6% |
Brait SA | 6,003,514 | | 23,611 |
Samsonite International SA | 12,773,700 | | 26,536 |
TOTAL LUXEMBOURG | | 50,147 |
Netherlands - 3.2% |
AEGON NV | 5,028,800 | | 28,124 |
ASML Holding NV | 1,002,900 | | 55,129 |
Gemalto NV | 609,781 | | 55,025 |
ING Groep NV (Certificaten Van Aandelen) (a) | 5,244,400 | | 46,665 |
LyondellBasell Industries NV Class A | 474,800 | | 25,350 |
Randstad Holding NV | 687,872 | | 22,455 |
Yandex NV (a) | 1,582,600 | | 36,843 |
TOTAL NETHERLANDS | | 269,591 |
Common Stocks - continued |
| Shares | | Value (000s) |
Norway - 1.1% |
DnB NOR ASA | 5,448,955 | | $ 68,049 |
Gjensidige Forsikring ASA | 1,761,200 | | 25,732 |
TOTAL NORWAY | | 93,781 |
Poland - 0.5% |
Eurocash SA | 3,593,990 | | 43,891 |
Qatar - 0.2% |
Commercial Bank of Qatar GDR (Reg. S) | 5,094,802 | | 20,122 |
Russia - 0.6% |
Mobile TeleSystems OJSC sponsored ADR | 2,888,700 | | 49,512 |
South Africa - 0.4% |
Shoprite Holdings Ltd. | 1,552,300 | | 31,921 |
Spain - 2.2% |
Amadeus IT Holding SA Class A | 1,011,100 | | 25,031 |
Banco Bilbao Vizcaya Argentaria SA | 6,088,557 | | 50,876 |
Grifols SA ADR | 1,151,000 | | 28,959 |
Inditex SA | 651,829 | | 83,169 |
TOTAL SPAIN | | 188,035 |
Sweden - 2.4% |
Atlas Copco AB (A Shares) | 2,847,300 | | 70,014 |
Intrum Justitia AB | 1,835,800 | | 26,570 |
Svenska Handelsbanken AB (A Shares) | 1,879,500 | | 64,379 |
Swedish Match Co. AB | 1,250,800 | | 42,618 |
TOTAL SWEDEN | | 203,581 |
Switzerland - 5.3% |
Adecco SA (Reg.) | 574,043 | | 27,762 |
Partners Group Holding AG | 230,056 | | 48,689 |
Roche Holding AG (participation certificate) | 394,417 | | 75,851 |
Schindler Holding AG (participation certificate) | 554,147 | | 73,010 |
SGS SA (Reg.) | 12,520 | | 26,511 |
Swatch Group AG (Bearer) | 36,702 | | 15,188 |
Syngenta AG (Switzerland) | 81,540 | | 31,792 |
UBS AG | 4,126,610 | | 61,914 |
Zurich Financial Services AG | 346,539 | | 85,398 |
TOTAL SWITZERLAND | | 446,115 |
Turkey - 0.1% |
Boyner Buyuk Magazacilik A/S (a)(e) | 4,683,100 | | 10,764 |
United Kingdom - 21.2% |
Aberdeen Asset Management PLC | 5,975,132 | | 31,289 |
Common Stocks - continued |
| Shares | | Value (000s) |
United Kingdom - continued |
Aggreko PLC | 1,385,300 | | $ 48,064 |
Anglo American PLC (United Kingdom) | 774,600 | | 23,788 |
Ashmore Group PLC | 3,169,400 | | 18,602 |
Barclays PLC | 12,279,312 | | 45,406 |
Bellway PLC | 972,300 | | 15,863 |
BG Group PLC | 4,571,872 | | 84,661 |
BHP Billiton PLC | 3,972,023 | | 127,308 |
British American Tobacco PLC (United Kingdom) | 2,438,600 | | 120,954 |
British Land Co. PLC | 5,756,734 | | 49,097 |
Diageo PLC | 4,065,857 | | 116,237 |
Domino's Pizza UK & IRL PLC | 2,378,100 | | 19,399 |
GlaxoSmithKline PLC | 2,658,600 | | 59,572 |
Hikma Pharmaceuticals PLC | 1,964,745 | | 23,447 |
HSBC Holdings PLC (United Kingdom) | 10,856,757 | | 107,040 |
Intertek Group PLC | 748,200 | | 34,037 |
Jazztel PLC (a) | 5,843,900 | | 38,706 |
Legal & General Group PLC | 36,980,100 | | 79,967 |
Lloyds Banking Group PLC (a) | 46,760,800 | | 30,792 |
London Stock Exchange Group PLC | 1,497,400 | | 23,572 |
Meggitt PLC | 6,792,200 | | 42,309 |
Next PLC | 514,144 | | 29,587 |
Ocado Group PLC (a)(d) | 14,388,400 | | 14,976 |
Persimmon PLC | 2,345,100 | | 30,086 |
Rolls-Royce Group PLC | 4,197,715 | | 57,884 |
Rolls-Royce Group PLC Class C | 319,026,340 | | 515 |
Rotork PLC | 717,800 | | 26,387 |
Royal Dutch Shell PLC Class B (United Kingdom) | 6,206,463 | | 219,543 |
SABMiller PLC | 1,096,800 | | 46,984 |
Standard Chartered PLC (United Kingdom) | 1,697,617 | | 40,093 |
Taylor Wimpey PLC | 21,518,200 | | 21,217 |
The Weir Group PLC | 747,600 | | 21,016 |
Ultra Electronics Holdings PLC | 614,667 | | 16,793 |
Vodafone Group PLC | 45,146,543 | | 122,602 |
TOTAL UNITED KINGDOM | | 1,787,793 |
United States of America - 3.7% |
Beam, Inc. | 387,400 | | 21,524 |
Citrix Systems, Inc. (a) | 303,600 | | 18,766 |
Cognizant Technology Solutions Corp. Class A (a) | 405,700 | | 27,040 |
Dollar General Corp. (a) | 378,800 | | 18,417 |
GNC Holdings, Inc. | 770,900 | | 29,811 |
MasterCard, Inc. Class A | 160,100 | | 73,795 |
Common Stocks - continued |
| Shares | | Value (000s) |
United States of America - continued |
Michael Kors Holdings Ltd. | 542,300 | | $ 29,658 |
Royal Gold, Inc. | 394,800 | | 34,774 |
Total System Services, Inc. | 1,094,700 | | 24,620 |
Watson Pharmaceuticals, Inc. (a) | 308,100 | | 26,481 |
Workday, Inc. | 102,600 | | 4,976 |
TOTAL UNITED STATES OF AMERICA | | 309,862 |
TOTAL COMMON STOCKS (Cost $7,245,196) |
8,035,964
|
Nonconvertible Preferred Stocks - 1.2% |
| | | |
Germany - 1.2% |
Volkswagen AG
(Cost $69,724) | 478,400 | |
98,964
|
Investment Companies - 0.0% |
| | | |
Cyprus - 0.0% |
Aisi Realty Public Ltd. (a)
(Cost $7,371) | 529,830 | |
628
|
Money Market Funds - 3.2% |
| | | |
Fidelity Cash Central Fund, 0.19% (b) | 250,136,921 | | 250,137 |
Fidelity Securities Lending Cash Central Fund, 0.19% (b)(c) | 24,238,785 | | 24,239 |
TOTAL MONEY MARKET FUNDS (Cost $274,376) |
274,376
|
TOTAL INVESTMENT PORTFOLIO - 99.9% (Cost $7,596,667) | | 8,409,932 |
NET OTHER ASSETS (LIABILITIES) - 0.1% | | 6,607 |
NET ASSETS - 100% | $ 8,416,539 |
Legend |
(a) Non-income producing |
(b) Affiliated fund that is available only to investment companies and other accounts managed by Fidelity Investments. The rate quoted is the annualized seven-day yield of the fund at period end. A complete unaudited listing of the fund's holdings as of its most recent quarter end is available upon request. In addition, each Fidelity Central Fund's financial statements, which are not covered by the Fund's Report of Independent Registered Public Accounting Firm, are available on the SEC's website or upon request. |
(c) Investment made with cash collateral received from securities on loan. |
(d) Security or a portion of the security is on loan at period end. |
(e) Affiliated company |
Affiliated Central Funds |
Information regarding fiscal year to date income earned by the Fund from investments in Fidelity Central Funds is as follows: |
Fund | Income earned
(Amounts in thousands) |
Fidelity Cash Central Fund | $ 136 |
Fidelity Securities Lending Cash Central Fund | 4,230 |
Total | $ 4,366 |
Other Affiliated Issuers |
An affiliated company is a company in which the Fund has ownership of at least 5% of the voting securities. Fiscal year to date transactions with companies which are or were affiliates are as follows: |
Affiliate
(Amounts in thousands) | Value, beginning of period | Purchases | Sales Proceeds | Dividend Income | Value,
end of
period |
Aisi Realty Public Ltd. | $ 240 | $ 469 | $ - | $ - | $ - |
Boyner Buyuk Magazacilik A/S | 10,096 | - | 1,569 | - | 10,764 |
China Kanghui Holdings sponsored ADR | 27,375 | - | 53,149 | - | - |
Total | $ 37,711 | $ 469 | $ 54,718 | $ - | $ 10,764 |
Other Information |
Categorizations in the Schedule of Investments are based on country or territory of incorporation. |
The following is a summary of the inputs used, as of October 31, 2012, involving the Fund's assets and liabilities carried at fair value. The inputs or methodology used for valuing securities may not be an indication of the risk associated with investing in those securities. For more information on valuation inputs, and their aggregation into the levels used in the table below, please refer to the Security Valuation section in the accompanying Notes to Financial Statements. |
Valuation Inputs at Reporting Date: |
Description
(Amounts in thousands) | Total | Level 1 | Level 2 | Level 3 |
Investments in Securities: | | | | |
Equities: | | | | |
Consumer Discretionary | $ 1,302,675 | $ 1,258,410 | $ 44,265 | $ - |
Consumer Staples | 815,505 | 444,109 | 371,396 | - |
Energy | 486,161 | 202,190 | 283,971 | - |
Financials | 1,939,678 | 1,500,271 | 439,407 | - |
Health Care | 618,113 | 316,498 | 301,615 | - |
Industrials | 1,137,857 | 1,093,285 | 44,572 | - |
Information Technology | 877,135 | 791,617 | 85,518 | - |
Materials | 533,970 | 374,870 | 159,100 | - |
Telecommunication Services | 350,983 | 228,381 | 122,602 | - |
Utilities | 72,851 | 72,851 | - | - |
Investment Companies | 628 | 628 | - | - |
Money Market Funds | 274,376 | 274,376 | - | - |
Total Investments in Securities: | $ 8,409,932 | $ 6,557,486 | $ 1,852,446 | $ - |
The following is a summary of transfers between Level 1 and Level 2 for the period ended October 31, 2012. Transfers are assumed to have occurred at the beginning of the period, and are primarily attributable to the valuation techniques used for foreign equity securities, as discussed in the accompanying Notes to Financial Statements: |
Transfers | Total (000s) |
Level 1 to Level 2 | $ 0 |
Level 2 to Level 1 | $ 1,546,324 |
See accompanying notes which are an integral part of the financial statements.
Annual Report
Statement of Assets and Liabilities
Amounts in thousands (except per-share amounts) | October 31, 2012 |
| | |
Assets | | |
Investment in securities, at value (including securities loaned of $22,961) - See accompanying schedule: Unaffiliated issuers (cost $7,310,529) | $ 8,124,792 | |
Fidelity Central Funds (cost $274,376) | 274,376 | |
Other affiliated issuers (cost $11,762) | 10,764 | |
Total Investments (cost $7,596,667) | | $ 8,409,932 |
Receivable for investments sold | | 58,219 |
Receivable for fund shares sold | | 9,069 |
Dividends receivable | | 15,860 |
Distributions receivable from Fidelity Central Funds | | 76 |
Other receivables | | 4,417 |
Total assets | | 8,497,573 |
| | |
Liabilities | | |
Payable for investments purchased | $ 8,942 | |
Payable for fund shares redeemed | 39,507 | |
Accrued management fee | 6,216 | |
Distribution and service plan fees payable | 113 | |
Other affiliated payables | 1,450 | |
Other payables and accrued expenses | 567 | |
Collateral on securities loaned, at value | 24,239 | |
Total liabilities | | 81,034 |
| | |
Net Assets | | $ 8,416,539 |
Net Assets consist of: | | |
Paid in capital | | $ 9,152,089 |
Undistributed net investment income | | 126,507 |
Accumulated undistributed net realized gain (loss) on investments and foreign currency transactions | | (1,674,222) |
Net unrealized appreciation (depreciation) on investments and assets and liabilities in foreign currencies | | 812,165 |
Net Assets | | $ 8,416,539 |
See accompanying notes which are an integral part of the financial statements.
Annual Report
Financial Statements - continued
Statement of Assets and Liabilities - continued
Amounts in thousands (except per-share amounts) | October 31, 2012 |
| | |
Calculation of Maximum Offering Price
Class A:
Net Asset Value and redemption price per share ($298,501 ÷ 9,429.0 shares) | | $ 31.66 |
| | |
Maximum offering price per share (100/94.25 of $31.66) | | $ 33.59 |
Class T:
Net Asset Value and redemption price per share ($45,884 ÷ 1,460.2 shares) | | $ 31.42 |
| | |
Maximum offering price per share (100/96.50 of $31.42) | | $ 32.56 |
Class B:
Net Asset Value and offering price per share ($7,536 ÷ 240.9 shares)A | | $ 31.28 |
| | |
Class C:
Net Asset Value and offering price per share ($29,746 ÷ 949.8 shares)A | | $ 31.32 |
| | |
International Discovery:
Net Asset Value, offering price and redemption price per share ($5,964,762 ÷ 186,908.1 shares) | | $ 31.91 |
| | |
Class K:
Net Asset Value, offering price and redemption price per share ($1,775,900 ÷ 55,719.4 shares) | | $ 31.87 |
| | |
Institutional Class:
Net Asset Value, offering price and redemption price per share ($294,210 ÷ 9,232.8 shares) | | $ 31.87 |
A Redemption price per share is equal to net asset value less any applicable contingent deferred sales charge.
See accompanying notes which are an integral part of the financial statements.
Annual Report
Statement of Operations
Amounts in thousands | Year ended October 31, 2012 |
| | |
Investment Income | | |
Dividends | | $ 229,743 |
Interest | | 19 |
Income from Fidelity Central Funds | | 4,366 |
Income before foreign taxes withheld | | 234,128 |
Less foreign taxes withheld | | (11,538) |
Total income | | 222,590 |
| | |
Expenses | | |
Management fee
Basic fee | $ 58,065 | |
Performance adjustment | 2,707 | |
Transfer agent fees | 16,195 | |
Distribution and service plan fees | 1,384 | |
Accounting and security lending fees | 1,720 | |
Custodian fees and expenses | 1,316 | |
Independent trustees' compensation | 54 | |
Registration fees | 181 | |
Audit | 114 | |
Legal | 42 | |
Interest | 5 | |
Miscellaneous | 95 | |
Total expenses before reductions | 81,878 | |
Expense reductions | (2,500) | 79,378 |
Net investment income (loss) | | 143,212 |
Realized and Unrealized Gain (Loss) Net realized gain (loss) on: | | |
Investment securities: | | |
Unaffiliated issuers | (217,363) | |
Other affiliated issuers | 11,560 | |
Foreign currency transactions | (1,776) | |
Total net realized gain (loss) | | (207,579) |
Change in net unrealized appreciation (depreciation) on: Investment securities (net of decrease in deferred foreign taxes of $1,062) | 763,571 | |
Assets and liabilities in foreign currencies | (1,430) | |
Total change in net unrealized appreciation (depreciation) | | 762,141 |
Net gain (loss) | | 554,562 |
Net increase (decrease) in net assets resulting from operations | | $ 697,774 |
See accompanying notes which are an integral part of the financial statements.
Annual Report
Financial Statements - continued
Statement of Changes in Net Assets
Amounts in thousands | Year ended
October 31,
2012 | Year ended
October 31,
2011 |
Increase (Decrease) in Net Assets | | |
Operations | | |
Net investment income (loss) | $ 143,212 | $ 161,608 |
Net realized gain (loss) | (207,579) | 501,938 |
Change in net unrealized appreciation (depreciation) | 762,141 | (1,247,522) |
Net increase (decrease) in net assets resulting
from operations | 697,774 | (583,976) |
Distributions to shareholders from net investment income | (118,968) | (149,936) |
Distributions to shareholders from net realized gain | - | (48,090) |
Total distributions | (118,968) | (198,026) |
Share transactions - net increase (decrease) | (915,362) | (537,341) |
Redemption fees | 128 | 160 |
Total increase (decrease) in net assets | (336,428) | (1,319,183) |
| | |
Net Assets | | |
Beginning of period | 8,752,967 | 10,072,150 |
End of period (including undistributed net investment income of $126,507 and undistributed net investment income of $102,433, respectively) | $ 8,416,539 | $ 8,752,967 |
See accompanying notes which are an integral part of the financial statements.
Annual Report
Financial Highlights - Class A
Years ended October 31, | 2012 | 2011 | 2010 | 2009 | 2008 |
Selected Per-Share Data | | | | | |
Net asset value, beginning of period | $ 29.43 | $ 32.07 | $ 28.57 | $ 23.68 | $ 47.34 |
Income from Investment Operations | | | | | |
Net investment income (loss) C | .41 | .42 | .31 | .31 | .46 |
Net realized and unrealized gain (loss) | 2.11 | (2.52) | 3.51 | 4.84 | (22.08) |
Total from investment operations | 2.52 | (2.10) | 3.82 | 5.15 | (21.62) |
Distributions from net investment income | (.29) | (.38) | (.28) | (.26) | (.37) |
Distributions from net realized gain | - | (.16) | (.04) | - | (1.67) |
Total distributions | (.29) | (.54) | (.32) | (.26) | (2.04) |
Redemption fees added to paid in capital C, G | - | - | - | - | - |
Net asset value, end of period | $ 31.66 | $ 29.43 | $ 32.07 | $ 28.57 | $ 23.68 |
Total Return A, B | 8.70% | (6.71)% | 13.43% | 22.14% | (47.65)% |
Ratios to Average Net Assets D, F | | | | | |
Expenses before reductions | 1.34% | 1.30% | 1.33% | 1.37% | 1.32% |
Expenses net of fee waivers, if any | 1.34% | 1.29% | 1.33% | 1.37% | 1.32% |
Expenses net of all reductions | 1.31% | 1.25% | 1.28% | 1.32% | 1.29% |
Net investment income (loss) | 1.41% | 1.31% | 1.06% | 1.28% | 1.27% |
Supplemental Data | | | | | |
Net assets, end of period (in millions) | $ 299 | $ 320 | $ 392 | $ 414 | $ 380 |
Portfolio turnover rate E | 68% | 75% | 82% | 98% | 79% |
A Total returns would have been lower if certain expenses had not been reduced during the applicable periods shown.
B Total returns do not include the effect of the sales charges.
C Calculated based on average shares outstanding during the period.
D Fees and expenses of any underlying Fidelity Central Funds are not included in the Fund's expense ratio. The Fund indirectly bears its proportionate share of the expenses of any underlying Fidelity Central Funds.
E Amount does not include the portfolio activity of any underlying Fidelity Central Funds.
F Expense ratios reflect operating expenses of the class. Expenses before reductions do not reflect amounts reimbursed by the investment adviser or reductions from brokerage service arrangements or reductions from other expense offset arrangements and do not represent the amount paid by the class during periods when reimbursements or reductions occur. Expenses net of fee waivers reflect expenses after reimbursement by the investment adviser but prior to reductions from brokerage service arrangements or other expense offset arrangements. Expenses net of all reductions represent the net expenses paid by the class.
G Amount represents less than $.01 per share.
See accompanying notes which are an integral part of the financial statements.
Annual Report
Financial Highlights - Class T
Years ended October 31, | 2012 | 2011 | 2010 | 2009 | 2008 |
Selected Per-Share Data | | | | | |
Net asset value, beginning of period | $ 29.18 | $ 31.81 | $ 28.35 | $ 23.49 | $ 47.06 |
Income from Investment Operations | | | | | |
Net investment income (loss) C | .34 | .34 | .23 | .24 | .33 |
Net realized and unrealized gain (loss) | 2.09 | (2.51) | 3.48 | 4.81 | (21.94) |
Total from investment operations | 2.43 | (2.17) | 3.71 | 5.05 | (21.61) |
Distributions from net investment income | (.19) | (.30) | (.21) | (.19) | (.29) |
Distributions from net realized gain | - | (.16) | (.04) | - | (1.67) |
Total distributions | (.19) | (.46) | (.25) | (.19) | (1.96) |
Redemption fees added to paid in capital C, G | - | - | - | - | - |
Net asset value, end of period | $ 31.42 | $ 29.18 | $ 31.81 | $ 28.35 | $ 23.49 |
Total Return A, B | 8.41% | (6.96)% | 13.14% | 21.79% | (47.84)% |
Ratios to Average Net Assets D, F | | | | | |
Expenses before reductions | 1.59% | 1.56% | 1.60% | 1.65% | 1.68% |
Expenses net of fee waivers, if any | 1.59% | 1.55% | 1.60% | 1.65% | 1.68% |
Expenses net of all reductions | 1.56% | 1.51% | 1.56% | 1.60% | 1.64% |
Net investment income (loss) | 1.16% | 1.05% | .79% | 1.00% | .91% |
Supplemental Data | | | | | |
Net assets, end of period (in millions) | $ 46 | $ 61 | $ 92 | $ 83 | $ 64 |
Portfolio turnover rate E | 68% | 75% | 82% | 98% | 79% |
A Total returns would have been lower if certain expenses had not been reduced during the applicable periods shown.
B Total returns do not include the effect of the sales charges.
C Calculated based on average shares outstanding during the period.
D Fees and expenses of any underlying Fidelity Central Funds are not included in the Fund's expense ratio. The Fund indirectly bears its proportionate share of the expenses of any underlying Fidelity Central Funds.
E Amount does not include the portfolio activity of any underlying Fidelity Central Funds.
F Expense ratios reflect operating expenses of the class. Expenses before reductions do not reflect amounts reimbursed by the investment adviser or reductions from brokerage service arrangements or reductions from other expense offset arrangements and do not represent the amount paid by the class during periods when reimbursements or reductions occur. Expenses net of fee waivers reflect expenses after reimbursement by the investment adviser but prior to reductions from brokerage service arrangements or other expense offset arrangements. Expenses net of all reductions represent the net expenses paid by the class.
G Amount represents less than $.01 per share.
See accompanying notes which are an integral part of the financial statements.
Annual Report
Financial Highlights - Class B
Years ended October 31, | 2012 | 2011 | 2010 | 2009 | 2008 |
Selected Per-Share Data | | | | | |
Net asset value, beginning of period | $ 29.02 | $ 31.60 | $ 28.18 | $ 23.25 | $ 46.70 |
Income from Investment Operations | | | | | |
Net investment income (loss) C | .19 | .17 | .08 | .12 | .15 |
Net realized and unrealized gain (loss) | 2.09 | (2.48) | 3.44 | 4.81 | (21.77) |
Total from investment operations | 2.28 | (2.31) | 3.52 | 4.93 | (21.62) |
Distributions from net investment income | (.02) | (.12) | (.06) | - | (.16) |
Distributions from net realized gain | - | (.16) | (.04) | - | (1.67) |
Total distributions | (.02) | (.27) H | (.10) | - | (1.83) |
Redemption fees added to paid in capital C, G | - | - | - | - | - |
Net asset value, end of period | $ 31.28 | $ 29.02 | $ 31.60 | $ 28.18 | $ 23.25 |
Total Return A, B | 7.85% | (7.39)% | 12.52% | 21.20% | (48.11)% |
Ratios to Average Net Assets D, F | | | | | |
Expenses before reductions | 2.09% | 2.06% | 2.12% | 2.16% | 2.19% |
Expenses net of fee waivers, if any | 2.09% | 2.06% | 2.12% | 2.16% | 2.19% |
Expenses net of all reductions | 2.06% | 2.02% | 2.08% | 2.11% | 2.15% |
Net investment income (loss) | .66% | .54% | .27% | .49% | .40% |
Supplemental Data | | | | | |
Net assets, end of period (in millions) | $ 8 | $ 10 | $ 14 | $ 16 | $ 15 |
Portfolio turnover rate E | 68% | 75% | 82% | 98% | 79% |
A Total returns would have been lower if certain expenses had not been reduced during the applicable periods shown.
B Total returns do not include the effect of the contingent deferred sales charge.
C Calculated based on average shares outstanding during the period.
D Fees and expenses of any underlying Fidelity Central Funds are not included in the Fund's expense ratio. The Fund indirectly bears its proportionate share of the expenses of any underlying Fidelity Central Funds.
E Amount does not include the portfolio activity of any underlying Fidelity Central Funds.
F Expense ratios reflect operating expenses of the class. Expenses before reductions do not reflect amounts reimbursed by the investment adviser or reductions from brokerage service arrangements or reductions from other expense offset arrangements and do not represent the amount paid by the class during periods when reimbursements or reductions occur. Expenses net of fee waivers reflect expenses after reimbursement by the investment adviser but prior to reductions from brokerage service arrangements or other expense offset arrangements. Expenses net of all reductions represent the net expenses paid by the class.
G Amount represents less than $.01 per share.
H Total distributions of $.27 per share is comprised of distributions from net investment income of $.115 and distributions from net realized gain of $.155 per share.
See accompanying notes which are an integral part of the financial statements.
Annual Report
Financial Highlights - Class C
Years ended October 31, | 2012 | 2011 | 2010 | 2009 | 2008 |
Selected Per-Share Data | | | | | |
Net asset value, beginning of period | $ 29.08 | $ 31.68 | $ 28.23 | $ 23.31 | $ 46.82 |
Income from Investment Operations | | | | | |
Net investment income (loss) C | .19 | .18 | .09 | .12 | .15 |
Net realized and unrealized gain (loss) | 2.09 | (2.49) | 3.45 | 4.82 | (21.82) |
Total from investment operations | 2.28 | (2.31) | 3.54 | 4.94 | (21.67) |
Distributions from net investment income | (.04) | (.14) | (.05) | (.02) | (.17) |
Distributions from net realized gain | - | (.16) | (.04) | - | (1.67) |
Total distributions | (.04) | (.29) H | (.09) | (.02) | (1.84) |
Redemption fees added to paid in capital C, G | - | - | - | - | - |
Net asset value, end of period | $ 31.32 | $ 29.08 | $ 31.68 | $ 28.23 | $ 23.31 |
Total Return A, B | 7.86% | (7.37)% | 12.54% | 21.22% | (48.10)% |
Ratios to Average Net Assets D, F | | | | | |
Expenses before reductions | 2.09% | 2.05% | 2.09% | 2.14% | 2.17% |
Expenses net of fee waivers, if any | 2.09% | 2.04% | 2.09% | 2.14% | 2.17% |
Expenses net of all reductions | 2.06% | 2.00% | 2.05% | 2.09% | 2.13% |
Net investment income (loss) | .66% | .56% | .30% | .51% | .42% |
Supplemental Data | | | | | |
Net assets, end of period (in millions) | $ 30 | $ 33 | $ 44 | $ 43 | $ 36 |
Portfolio turnover rate E | 68% | 75% | 82% | 98% | 79% |
A Total returns would have been lower if certain expenses had not been reduced during the applicable periods shown.
B Total returns do not include the effect of the contingent deferred sales charge.
C Calculated based on average shares outstanding during the period.
D Fees and expenses of any underlying Fidelity Central Funds are not included in the Fund's expense ratio. The Fund indirectly bears its proportionate share of the expenses of any underlying Fidelity Central Funds.
E Amount does not include the portfolio activity of any underlying Fidelity Central Funds.
F Expense ratios reflect operating expenses of the class. Expenses before reductions do not reflect amounts reimbursed by the investment adviser or reductions from brokerage service arrangements or reductions from other expense offset arrangements and do not represent the amount paid by the class during periods when reimbursements or reductions occur. Expenses net of fee waivers reflect expenses after reimbursement by the investment adviser but prior to reductions from brokerage service arrangements or other expense offset arrangements. Expenses net of all reductions represent the net expenses paid by the class.
G Amount represents less than $.01 per share.
H Total distributions of $.29 per share is comprised of distributions from net investment income of $.137 and distributions from net realized gain of $.155 per share.
See accompanying notes which are an integral part of the financial statements.
Annual Report
Financial Highlights - International Discovery
Years ended October 31, | 2012 | 2011 | 2010 | 2009 | 2008 |
Selected Per-Share Data | | | | | |
Net asset value, beginning of period | $ 29.69 | $ 32.34 | $ 28.79 | $ 23.88 | $ 47.68 |
Income from Investment Operations | | | | | |
Net investment income (loss) B | .51 | .53 | .40 | .37 | .57 |
Net realized and unrealized gain (loss) | 2.12 | (2.54) | 3.54 | 4.88 | (22.29) |
Total from investment operations | 2.63 | (2.01) | 3.94 | 5.25 | (21.72) |
Distributions from net investment income | (.41) | (.48) | (.35) | (.34) | (.41) |
Distributions from net realized gain | - | (.16) | (.04) | - | (1.67) |
Total distributions | (.41) | (.64) | (.39) | (.34) | (2.08) |
Redemption fees added to paid in capital B,F | - | - | - | - | - |
Net asset value, end of period | $ 31.91 | $ 29.69 | $ 32.34 | $ 28.79 | $ 23.88 |
Total Return A | 9.03% | (6.39)% | 13.76% | 22.47% | (47.55)% |
Ratios to Average Net Assets C, E | | | | | |
Expenses before reductions | 1.01% | .97% | 1.05% | 1.12% | 1.09% |
Expenses net of fee waivers, if any | 1.01% | .96% | 1.05% | 1.12% | 1.09% |
Expenses net of all reductions | .98% | .92% | 1.00% | 1.07% | 1.05% |
Net investment income (loss) | 1.73% | 1.64% | 1.35% | 1.53% | 1.51% |
Supplemental Data | | | | | |
Net assets, end of period (in millions) | $ 5,965 | $ 6,806 | $ 8,133 | $ 8,114 | $ 6,999 |
Portfolio turnover rate D | 68% | 75% | 82% | 98% | 79% |
A Total returns would have been lower if certain expenses had not been reduced during the applicable periods shown.
B Calculated based on average shares outstanding during the period.
C Fees and expenses of any underlying Fidelity Central Funds are not included in the Fund's expense ratio. The Fund indirectly bears its proportionate share of the expenses of any underlying Fidelity Central Funds.
D Amount does not include the portfolio activity of any underlying Fidelity Central Funds.
E Expense ratios reflect operating expenses of the class. Expenses before reductions do not reflect amounts reimbursed by the investment adviser or reductions from brokerage service arrangements or reductions from other expense offset arrangements and do not represent the amount paid by the class during periods when reimbursements or reductions occur. Expenses net of fee waivers reflect expenses after reimbursement by the investment adviser but prior to reductions from brokerage service arrangements or other expense offset arrangements. Expenses net of all reductions represent the net expenses paid by the class.
F Amount represents less than $.01 per share.
See accompanying notes which are an integral part of the financial statements.
Annual Report
Financial Highlights - Class K
Years ended October 31, | 2012 | 2011 | 2010 | 2009 | 2008 G |
Selected Per-Share Data | | | | | |
Net asset value, beginning of period | $ 29.66 | $ 32.32 | $ 28.78 | $ 23.90 | $ 40.32 |
Income from Investment Operations | | | | | |
Net investment income (loss) D | .57 | .58 | .46 | .44 | .10 |
Net realized and unrealized gain (loss) | 2.11 | (2.54) | 3.53 | 4.86 | (16.52) |
Total from investment operations | 2.68 | (1.96) | 3.99 | 5.30 | (16.42) |
Distributions from net investment income | (.47) | (.55) | (.41) | (.42) | - |
Distributions from net realized gain | - | (.16) | (.04) | - | - |
Total distributions | (.47) | (.70) J | (.45) | (.42) | - |
Redemption fees added to paid in capital D, I | - | - | - | - | - |
Net asset value, end of period | $ 31.87 | $ 29.66 | $ 32.32 | $ 28.78 | $ 23.90 |
Total Return B, C | 9.24% | (6.24)% | 13.96% | 22.80% | (40.72)% |
Ratios to Average Net Assets E, H | | | | | |
Expenses before reductions | .83% | .80% | .84% | .88% | .93% A |
Expenses net of fee waivers, if any | .83% | .79% | .84% | .88% | .93% A |
Expenses net of all reductions | .80% | .75% | .79% | .83% | .89% A |
Net investment income (loss) | 1.91% | 1.81% | 1.55% | 1.77% | .83% A |
Supplemental Data | | | | | |
Net assets, end of period (in millions) | $ 1,776 | $ 1,245 | $ 1,078 | $ 674 | $ 145 |
Portfolio turnover rate F | 68% | 75% | 82% | 98% | 79% |
A Annualized
B Total returns for periods of less than one year are not annualized.
C Total returns would have been lower if certain expenses had not been reduced during the applicable periods shown.
D Calculated based on average shares outstanding during the period.
E Fees and expenses of any underlying Fidelity Central Funds are not included in the Fund's expense ratio. The Fund indirectly bears its proportionate share of the expenses of any underlying Fidelity Central Funds.
F Amount does not include the portfolio activity of any underlying Fidelity Central Funds.
G For the period May 9, 2008 (commencement of sale of shares) to October 31, 2008.
H Expense ratios reflect operating expenses of the class. Expenses before reductions do not reflect amounts reimbursed by the investment adviser or reductions from brokerage service arrangements or reductions from other expense offset arrangements and do not represent the amount paid by the class during periods when reimbursements or reductions occur. Expense ratios before reductions for start-up periods may not be representative of longer-term operating periods. Expenses net of fee waivers reflect expenses after reimbursement by the investment adviser but prior to reductions from brokerage service arrangements or other expense offset arrangements. Expenses net of all reductions represent the net expenses paid by the class.
I Amount represents less than $.01 per share.
J Total distributions of $.70 per share is comprised of distributions from net investment income of $.548 and distributions from net realized gain of $.155 per share.
See accompanying notes which are an integral part of the financial statements.
Annual Report
Financial Highlights - Institutional Class
Years ended October 31, | 2012 | 2011 | 2010 | 2009 | 2008 |
Selected Per-Share Data | | | | | |
Net asset value, beginning of period | $ 29.65 | $ 32.31 | $ 28.77 | $ 23.91 | $ 47.73 |
Income from Investment Operations | | | | | |
Net investment income (loss) B | .52 | .54 | .41 | .39 | .53 |
Net realized and unrealized gain (loss) | 2.11 | (2.55) | 3.55 | 4.86 | (22.24) |
Total from investment operations | 2.63 | (2.01) | 3.96 | 5.25 | (21.71) |
Distributions from net investment income | (.41) | (.50) | (.38) | (.39) | (.44) |
Distributions from net realized gain | - | (.16) | (.04) | - | (1.67) |
Total distributions | (.41) | (.65) G | (.42) | (.39) | (2.11) |
Redemption fees added to paid in capital B, F | - | - | - | - | - |
Net asset value, end of period | $ 31.87 | $ 29.65 | $ 32.31 | $ 28.77 | $ 23.91 |
Total Return A | 9.07% | (6.39)% | 13.84% | 22.52% | (47.51)% |
Ratios to Average Net Assets C, E | | | | | |
Expenses before reductions | 1.00% | .95% | .99% | 1.05% | 1.05% |
Expenses net of fee waivers, if any | 1.00% | .94% | .99% | 1.05% | 1.05% |
Expenses net of all reductions | .97% | .90% | .95% | 1.00% | 1.01% |
Net investment income (loss) | 1.75% | 1.66% | 1.40% | 1.60% | 1.54% |
Supplemental Data | | | | | |
Net assets, end of period (in millions) | $ 294 | $ 278 | $ 319 | $ 267 | $ 159 |
Portfolio turnover rate D | 68% | 75% | 82% | 98% | 79% |
A Total returns would have been lower if certain expenses had not been reduced during the applicable periods shown.
B Calculated based on average shares outstanding during the period.
C Fees and expenses of any underlying Fidelity Central Funds are not included in the Fund's expense ratio. The Fund indirectly bears its proportionate share of the expenses of any underlying Fidelity Central Funds.
D Amount does not include the portfolio activity of any underlying Fidelity Central Funds.
E Expense ratios reflect operating expenses of the class. Expenses before reductions do not reflect amounts reimbursed by the investment adviser or reductions from brokerage service arrangements or reductions from other expense offset arrangements and do not represent the amount paid by the class during periods when reimbursements or reductions occur. Expenses net of fee waivers reflect expenses after reimbursement by the investment adviser but prior to reductions from brokerage service arrangements or other expense offset arrangements. Expenses net of all reductions represent the net expenses paid by the class.
F Amount represents less than $.01 per share.
G Total distributions of $.65 per share is comprised of distributions from net investment income of $.497 and distributions from net realized gain of $.155 per share.
See accompanying notes which are an integral part of the financial statements.
Annual Report
Notes to Financial Statements
For the period ended October 31, 2012
(Amounts in thousands except percentages)
1. Organization.
Fidelity International Discovery Fund (the Fund) is a fund of Fidelity Investment Trust (the Trust) and is authorized to issue an unlimited number of shares. The Trust is registered under the Investment Company Act of 1940, as amended (the 1940 Act), as an open-end management investment company organized as a Massachusetts business trust. The Fund offers Class A, Class T, Class C, International Discovery, Class K, and Institutional Class shares, each of which, along with Class B shares, has equal rights as to assets and voting privileges. Effective after the close of business on September 1, 2010, Class B shares were closed to new accounts and additional purchases, except for exchanges and reinvestments. Each class has exclusive voting rights with respect to matters that affect that class. Class B shares will automatically convert to Class A shares after a holding period of seven years from the initial date of purchase. Investment income, realized and unrealized capital gains and losses, the common expenses of the Fund, and certain fund-level expense reductions, if any, are allocated on a pro-rata basis to each class based on the relative net assets of each class to the total net assets of the Fund. Each class differs with respect to transfer agent and distribution and service plan fees incurred. Certain expense reductions may also differ by class.
2. Investments in Fidelity Central Funds.
The Fund invests in Fidelity Central Funds, which are open-end investment companies available only to other investment companies and accounts managed by Fidelity Management & Research Company (FMR) and its affiliates. The Fund's Schedule of Investments lists each of the Fidelity Central Funds held as of period end, if any, as an investment of the Fund, but does not include the underlying holdings of each Fidelity Central Fund. As an Investing Fund, the Fund indirectly bears its proportionate share of the expenses of the underlying Fidelity Central Funds.
The Money Market Central Funds seek preservation of capital and current income and are managed by Fidelity Investments Money Management, Inc. (FIMM), an affiliate of FMR.
A complete unaudited list of holdings for each Fidelity Central Fund is available upon request or at the Securities and Exchange Commission (the SEC) web site at www.sec.gov. In addition, the financial statements of the Fidelity Central Funds, which are not covered by the Fund's Report of Independent Registered Public Accounting Firm, are available on the SEC web site or upon request.
Annual Report
3. Significant Accounting Policies.
The financial statements have been prepared in conformity with accounting principles generally accepted in the United States of America (GAAP), which require management to make certain estimates and assumptions at the date of the financial statements. Actual results could differ from those estimates. Subsequent events, if any, through the date that the financial statements were issued have been evaluated in the preparation of the financial statements. The following summarizes the significant accounting policies of the Fund:
Security Valuation. Investments are valued as of 4:00 p.m. Eastern time on the last calendar day of the period. In accordance with valuation policies and procedures approved by the Board of Trustees (the Board), the Fund attempts to obtain prices from one or more third party pricing vendors or brokers to value its investments. When current market prices, quotations or rates are not readily available or reliable, securities will be fair valued in good faith by the FMR Fair Value Committee (the Committee), in accordance with procedures adopted by the Fund's Board. Factors used in determining fair value vary by security type and may include market or security specific events. The frequency with which these procedures are used cannot be predicted and they may be utilized to a significant extent. The Committee oversees the Fund's valuation policies and procedures and is responsible for approving and reporting to the Board all fair value determinations.
The Fund categorizes the inputs to valuation techniques used to value its investments into a disclosure hierarchy consisting of three levels as shown below:
Level 1 - quoted prices in active markets for identical investments
Level 2 - other significant observable inputs (including quoted prices for similar investments, interest rates, prepayment speeds, etc.)
Level 3 - unobservable inputs (including the Fund's own assumptions based on the best information available)
Valuation techniques used to value the Fund's investments by major category are as follows:
Equity securities, including restricted securities, for which market quotations are readily available, are valued at the last reported sale price or official closing price as reported by a third party pricing vendor on the primary market or exchange on which they are traded and are categorized as Level 1 in the hierarchy. In the event there were no sales during the day or closing prices are not available, securities are valued at the last quoted bid price or may be valued using the last available price and are generally categorized as Level 2 in the hierarchy. For foreign equity securities, when significant market or security specific events arise, comparisons to the valuation of American Depositary Receipts
Annual Report
Notes to Financial Statements - continued
(Amounts in thousands except percentages)
3. Significant Accounting Policies - continued
Security Valuation - continued
(ADRs), futures contracts, Exchange-Traded Funds (ETFs) and certain indexes as well as quoted prices for similar securities are used and are categorized as Level 2 in the hierarchy. Utilizing these techniques may result in transfers between Level 1 and Level 2.
Investments in open-end mutual funds, including the Fidelity Central Funds, are valued at their closing net asset value (NAV) each business day and are categorized as Level 1 in the hierarchy.
Changes in valuation techniques may result in transfers in or out of an assigned level within the disclosure hierarchy. The aggregate value of investments by input level, as of October 31, 2012, including information on transfers between Levels 1 and 2, is included at the end of the Fund's Schedule of Investments.
Foreign Currency Translation. The Fund may use foreign currency contracts to facilitate transactions in foreign-denominated securities. Gains and losses from these transactions may arise from changes in the value of the foreign currency or if the counterparties do not perform under the contracts' terms.
Foreign-denominated assets, including investment securities, and liabilities are translated into U.S. dollars at the exchange rates at period end. Purchases and sales of investment securities, income and dividends received and expenses denominated in foreign currencies are translated into U.S. dollars at the exchange rate in effect on the transaction date.
The effects of exchange rate fluctuations on investments are included with the net realized and unrealized gain (loss) on investment securities. Other foreign currency transactions resulting in realized and unrealized gain (loss) are disclosed separately.
Investment Transactions and Income. For financial reporting purposes, the Fund's investment holdings and NAV include trades executed through the end of the last business day of the period. The NAV per share for processing shareholder transactions is calculated as of the close of business of the New York Stock Exchange (NYSE), normally 4:00 p.m. Eastern time and includes trades executed through the end of the prior business day. Gains and losses on securities sold are determined on the basis of identified cost and may include proceeds received from litigation. Dividend income is recorded on the ex-dividend date, except for certain dividends from foreign securities where the ex-dividend date may have passed, which are recorded as soon as the Fund is informed of the ex-dividend date. Non-cash dividends included in dividend income, if any, are recorded at the fair market value of the securities received. Distributions received on securities that represent a return of capital or capital gain are recorded as a reduction of cost of investments and/or as a realized gain. The Fund estimates the components of
Annual Report
3. Significant Accounting Policies - continued
Investment Transactions and Income - continued
distributions received that may be considered return of capital distributions or capital gain distributions. Interest income and distributions from the Fidelity Central Funds are accrued as earned. Interest income includes coupon interest and amortization of premium and accretion of discount on debt securities. Investment income is recorded net of foreign taxes withheld where recovery of such taxes is uncertain.
Expenses. Expenses directly attributable to a fund are charged to that fund. Expenses attributable to more than one fund are allocated among the respective funds on the basis of relative net assets or other appropriate methods. Expense estimates are accrued in the period to which they relate and adjustments are made when actual amounts are known.
Deferred Trustee Compensation. Under a Deferred Compensation Plan (the Plan), independent Trustees may elect to defer receipt of a portion of their annual compensation. Deferred amounts are invested in a cross-section of Fidelity funds, are marked-to-market and remain in the Fund until distributed in accordance with the Plan. The investment of deferred amounts and the offsetting payable to the Trustees are included in the accompanying Statement of Assets and Liabilities.
Income Tax Information and Distributions to Shareholders. Each year, the Fund intends to qualify as a regulated investment company under Subchapter M of the Internal Revenue Code, including distributing substantially all of its taxable income and realized gains. As a result, no provision for income taxes is required. As of October 31, 2012, the Fund did not have any unrecognized tax benefits in the financial statements; nor is the Fund aware of any tax positions for which it is reasonably possible that the total amounts of unrecognized tax benefits will significantly change in the next twelve months. The Fund files a U.S. federal tax return, in addition to state and local tax returns as required. A fund's federal income tax returns are subject to examination by the Internal Revenue Service (IRS) for a period of three fiscal years after they are filed. State and local tax returns may be subject to examination for an additional fiscal year depending on the jurisdiction. Foreign taxes are provided for based on the Fund's understanding of the tax rules and rates that exist in the foreign markets in which it invests.
Distributions are declared and recorded on the ex-dividend date. Income dividends and capital gain distributions are declared separately for each class. Income and capital gain distributions are determined in accordance with income tax regulations, which may differ from GAAP.
Annual Report
Notes to Financial Statements - continued
(Amounts in thousands except percentages)
3. Significant Accounting Policies - continued
Income Tax Information and Distributions to Shareholders - continued
Capital accounts within the financial statements are adjusted for permanent book-tax differences. These adjustments have no impact on net assets or the results of operations. Temporary book-tax differences will reverse in a subsequent period.
Book-tax differences are primarily due to foreign currency transactions, certain foreign taxes, passive foreign investment companies (PFIC), deferred trustees compensation, capital loss carryforwards and losses deferred due to wash sales.
The federal tax cost of investment securities and unrealized appreciation (depreciation) as of period end were as follows:
Gross unrealized appreciation | $ 1,161,331 |
Gross unrealized depreciation | (475,922) |
Net unrealized appreciation (depreciation) on securities and other investments | $ 685,409 |
| |
Tax Cost | $ 7,724,523 |
The tax-based components of distributable earnings as of period end were as follows:
Undistributed ordinary income | $ 134,442 |
Capital loss carryforward | $ (1,554,149) |
Net unrealized appreciation (depreciation) | $ 684,309 |
Capital loss carryforwards are only available to offset future capital gains of the Fund to the extent provided by regulations and may be limited. Under the Regulated Investment Company Modernization Act of 2010 (the Act), the Fund is permitted to carry forward capital losses incurred in taxable years beginning after December 22, 2010 for an unlimited period and such capital losses are required to be used prior to any losses that expire. Capital loss carryforwards were as follows:
Fiscal year of expiration | |
2017 | $ (1,350,018) |
No expiration | |
Short-term | $ (204,131) |
Total capital loss carryforward | $ (1,554,149) |
The tax character of distributions paid was as follows:
| October 31, 2012 | | October 31, 2011 |
Ordinary Income | $ 118,968 | | $ 198,026 |
Annual Report
3. Significant Accounting Policies - continued
Short-Term Trading (Redemption) Fees. Shares held by investors in the Fund less than 30 days are subject to a redemption fee equal to 1.00% of the net asset value of shares redeemed. All redemption fees, which reduce the proceeds of the shareholder redemption, are retained by the Fund and accounted for as an addition to paid in capital.
New Accounting Pronouncement. In December 2011, the Financial Accounting Standards Board issued Accounting Standard Update No. 2011-11, Disclosures about Offsetting Assets and Liabilities. The update creates new disclosure requirements requiring entities to disclose both gross and net information for derivatives and other financial instruments that are either offset in the Statement of Assets and Liabilities or subject to an enforceable master netting arrangement or similar agreement. The disclosure requirements are effective for annual reporting periods beginning on or after January 1, 2013, and interim periods within those annual periods. Management is currently evaluating the impact of the update's adoption on the Fund's financial statement disclosures.
4. Purchases and Sales of Investments.
Purchases and sales of securities, other than short-term securities, aggregated $5,561,781 and $6,703,146, respectively.
5. Fees and Other Transactions with Affiliates.
Management Fee. FMR and its affiliates provide the Fund with investment management related services for which the Fund pays a monthly management fee. The management fee is the sum of an individual fund fee rate that is based on an annual rate of .45% of the Fund's average net assets and an annualized group fee rate that averaged .26% during the period. The group fee rate is based upon the average net assets of all the mutual funds advised by FMR. The group fee rate decreases as assets under management increase and increases as assets under management decrease. In addition, the management fee is subject to a performance adjustment (up to a maximum of ± .20% of the Fund's average net assets over a 36 month performance period). The upward or downward adjustment to the management fee is based on the relative investment performance of International Discovery as compared to an appropriate benchmark index. For the period, the total annual management fee rate, including the performance adjustment, was .74% of the Fund's average net assets.
Distribution and Service Plan Fees. In accordance with Rule 12b-1 of the 1940 Act, the Fund has adopted separate Distribution and Service Plans for each class of shares. Certain classes pay Fidelity Distributors Corporation (FDC), an affiliate of FMR, separate Distribution and Service Fees, each of which is based on an annual percentage of
Annual Report
Notes to Financial Statements - continued
(Amounts in thousands except percentages)
5. Fees and Other Transactions with Affiliates - continued
Distribution and Service Plan Fees - continued
each class' average net assets. In addition, FDC may pay financial intermediaries for selling shares of the Fund and providing shareholder support services. For the period, the Distribution and Service Fee rates, total fees and amounts retained by FDC were as follows:
| Distribution
Fee | Service
Fee | Total Fees | Retained
by FDC |
Class A | -% | .25% | $ 733 | $ 11 |
Class T | .25% | .25% | 262 | 1 |
Class B | .75% | .25% | 86 | 64 |
Class C | .75% | .25% | 303 | 21 |
| | | $ 1,384 | $ 97 |
Sales Load. FDC may receive a front-end sales charge of up to 5.75% for selling Class A shares and 3.50% for selling Class T shares, some of which is paid to financial intermediaries for selling shares of the Fund. Depending on the holding period, FDC may receive contingent deferred sales charges levied on Class A, Class T, Class B, and Class C redemptions. The deferred sales charges range from 5.00% to 1.00% for Class B shares, 1.00% for Class C shares, 1.00% for certain purchases of Class A shares and .25% for certain purchases of Class T shares.
For the period, sales charge amounts retained by FDC were as follows:
| Retained
by FDC |
Class A | $ 45 |
Class T | 6 |
Class B* | 18 |
Class C* | 1 |
| $ 70 |
* When Class B and Class C shares are initially sold, FDC pays commissions from its own resources to financial intermediaries through which the sales are made.
Annual Report
5. Fees and Other Transactions with Affiliates - continued
Transfer Agent Fees. Fidelity Investments Institutional Operations Company, Inc. (FIIOC), an affiliate of FMR, is the transfer, dividend disbursing and shareholder servicing agent for each class of the Fund. FIIOC receives account fees and asset-based fees that vary according to the account size and type of account of the shareholders of the respective classes of the Fund, except for Class K. FIIOC receives an asset-based fee of Class K's average net assets. FIIOC receives no fees for providing transfer agency services to Class F. FIIOC pays for typesetting, printing and mailing of shareholder reports, except proxy statements. For the period, transfer agent fees for each class were as follows:
| Amount | % of
Average
Net Assets |
Class A | $ 891 | .30 |
Class T | 159 | .30 |
Class B | 26 | .30 |
Class C | 91 | .30 |
International Discovery | 13,666 | .23 |
Class K | 764 | .05 |
Institutional Class | 598 | .21 |
| $ 16,195 | |
Accounting and Security Lending Fees. Fidelity Service Company, Inc. (FSC), an affiliate of FMR, maintains the Fund's accounting records. The accounting fee is based on the level of average net assets for each month. Under a separate contract, FSC administers the security lending program. The security lending fee is based on the number and duration of lending transactions.
Brokerage Commissions. The Fund placed a portion of its portfolio transactions with brokerage firms which are affiliates of the investment adviser. The commissions paid to these affiliated firms were $13 for the period.
Interfund Lending Program. Pursuant to an Exemptive Order issued by the SEC, the Fund, along with other registered investment companies having management contracts with FMR, may participate in an interfund lending program. This program provides an alternative credit facility allowing the funds to borrow from, or lend money to, other participating affiliated funds. At period end, there were no interfund loans outstanding. The Fund's activity in this program during the period for which loans were outstanding was as follows:
Borrower or Lender | Average Loan
Balance | Weighted Average Interest Rate | Interest Expense |
Borrower | $ 17,873 | .34% | $ 5 |
Annual Report
Notes to Financial Statements - continued
(Amounts in thousands except percentages)
6. Committed Line of Credit.
The Fund participates with other funds managed by FMR or an affiliate in a $4.25 billion credit facility (the "line of credit") to be utilized for temporary or emergency purposes to fund shareholder redemptions or for other short-term liquidity purposes. The Fund has agreed to pay commitment fees on its pro-rata portion of the line of credit, which amounted to $23 and is reflected in Miscellaneous expenses on the Statement of Operations. During the period, there were no borrowings on this line of credit.
7. Security Lending.
The Fund lends portfolio securities through a lending agent from time to time in order to earn additional income. For equity securities, a lending agent is used and may loan securities to certain qualified borrowers, including Fidelity Capital Markets (FCM), a broker-dealer affiliated with the Fund. On the settlement date of the loan, the Fund receives collateral (in the form of U.S. Treasury obligations, letters of credit and/or cash) against the loaned securities and maintains collateral in an amount not less than 100% of the market value of the loaned securities during the period of the loan. The market value of the loaned securities is determined at the close of business of the Fund and any additional required collateral is delivered to the Fund on the next business day. If the borrower defaults on its obligation to return the securities loaned because of insolvency or other reasons, a fund could experience delays and costs in recovering the securities loaned or in gaining access to the collateral. Any cash collateral received is invested in the Fidelity Securities Lending Cash Central Fund. The value of loaned securities and cash collateral at period end are disclosed on the Fund's Statement of Assets and Liabilities. At period end, there were no security loans outstanding with FCM. Security lending income represents the income earned on investing cash collateral, less rebates paid to borrowers and any lending agent fees associated with the loan, plus any premium payments received for lending certain types of securities. Security lending income is presented in the Statement of Operations as a component of income from Fidelity Central Funds. Total security lending income during the period amounted to $4,230, including $18 from securities loaned to FCM.
8. Expense Reductions.
Many of the brokers with whom FMR places trades on behalf of the Fund provided services to the Fund in addition to trade execution. These services included payments of certain expenses on behalf of the Fund totaling $2,500 for the period.
Annual Report
9. Distributions to Shareholders.
Distributions to shareholders of each class were as follows:
Years ended October 31, | 2012 | 2011 |
From net investment income | | |
Class A | $ 3,123 | $ 4,617 |
Class T | 388 | 859 |
Class B | 6 | 51 |
Class C | 44 | 184 |
International Discovery | 90,633 | 121,061 |
Class K | 20,917 | 18,291 |
Institutional Class | 3,857 | 4,873 |
Total | $ 118,968 | $ 149,936 |
From net realized gain | | |
Class A | $ - | $ 1,880 |
Class T | - | 439 |
Class B | - | 69 |
Class C | - | 209 |
International Discovery | - | 38,831 |
Class K | - | 5,143 |
Institutional Class | - | 1,519 |
Total | $ - | $ 48,090 |
10. Share Transactions.
Transactions for each class of shares were as follows:
| Shares | Dollars |
Years ended October 31, | 2012 | 2011 | 2012 | 2011 |
Class A | | | | |
Shares sold | 1,927 | 2,821 | $ 56,732 | $ 91,649 |
Reinvestment of distributions | 101 | 173 | 2,828 | 5,606 |
Shares redeemed | (3,468) | (4,335) | (100,935) | (139,721) |
Net increase (decrease) | (1,440) | (1,341) | $ (41,375) | $ (42,466) |
Class T | | | | |
Shares sold | 220 | 443 | $ 6,409 | $ 14,328 |
Reinvestment of distributions | 13 | 38 | 369 | 1,235 |
Shares redeemed | (860) | (1,286) | (25,207) | (41,028) |
Net increase (decrease) | (627) | (805) | $ (18,429) | $ (25,465) |
Class B | | | | |
Shares sold | 3 | 21 | $ 87 | $ 671 |
Reinvestment of distributions | - | 3 | 5 | 111 |
Shares redeemed | (113) | (130) | (3,297) | (4,124) |
Net increase (decrease) | (110) | (106) | $ (3,205) | $ (3,342) |
Annual Report
Notes to Financial Statements - continued
(Amounts in thousands except percentages)
10. Share Transactions - continued
| Shares | Dollars |
Years ended October 31, | 2012 | 2011 | 2012 | 2011 |
Class C | | | | |
Shares sold | 212 | 183 | $ 6,111 | $ 5,847 |
Reinvestment of distributions | 1 | 11 | 39 | 344 |
Shares redeemed | (395) | (437) | (11,440) | (13,875) |
Net increase (decrease) | (182) | (243) | $ (5,290) | $ (7,684) |
International Discovery | | | | |
Shares sold | 20,324 | 32,543 | $ 608,478 | $ 1,052,266 |
Reinvestment of distributions | 3,081 | 4,718 | 86,858 | 153,551 |
Shares redeemed | (65,748) | (59,489) | (1,937,202) | (1,934,353) |
Net increase (decrease) | (42,343) | (22,228) | $ (1,241,866) | $ (728,536) |
Class K | | | | |
Shares sold | 26,836 | 18,148 | $ 788,860 | $ 593,408 |
Reinvestment of distributions | 744 | 722 | 20,917 | 23,434 |
Shares redeemed | (13,817) | (10,275) | (410,022) | (330,258) |
Net increase (decrease) | 13,763 | 8,595 | $ 399,755 | $ 286,584 |
Institutional Class | | | | |
Shares sold | 2,049 | 2,364 | $ 59,460 | $ 75,348 |
Reinvestment of distributions | 53 | 69 | 1,502 | 2,254 |
Shares redeemed | (2,256) | (2,923) | (65,914) | (94,034) |
Net increase (decrease) | (154) | (490) | $ (4,952) | $ (16,432) |
11. Other.
The Fund's organizational documents provide former and current trustees and officers with a limited indemnification against liabilities arising in connection with the performance of their duties to the Fund. In the normal course of business, the Fund may also enter into contracts that provide general indemnifications. The Fund's maximum exposure under these arrangements is unknown as this would be dependent on future claims that may be made against the Fund. The risk of material loss from such claims is considered remote.
Annual Report
To the Trustees of Fidelity Investment Trust and the Shareholders of Fidelity International Discovery Fund:
In our opinion, the accompanying statement of assets and liabilities, including the schedule of investments, and the related statements of operations and of changes in net assets and the financial highlights present fairly, in all material respects, the financial position of Fidelity International Discovery Fund (a fund of Fidelity Investment Trust) at October 31, 2012, the results of its operations for the year then ended, the changes in its net assets for each of the two years in the period then ended and the financial highlights for each of the periods indicated, in conformity with accounting principles generally accepted in the United States of America. These financial statements and financial highlights (hereafter referred to as "financial statements") are the responsibility of the Fidelity International Discovery Fund's management. Our responsibility is to express an opinion on these financial statements based on our audits. We conducted our audits of these financial statements in accordance with the standards of the Public Company Accounting Oversight Board (United States). Those standards require that we plan and perform the audit to obtain reasonable assurance about whether the financial statements are free of material misstatement. An audit includes examining, on a test basis, evidence supporting the amounts and disclosures in the financial statements, assessing the accounting principles used and significant estimates made by management, and evaluating the overall financial statement presentation. We believe that our audits, which included confirmation of securities at October 31, 2012 by correspondence with the custodian and brokers, provide a reasonable basis for our opinion.
PricewaterhouseCoopers LLP
Boston, Massachusetts
December 14, 2012
Annual Report
The Trustees, Members of the Advisory Board, and executive officers of the trust and fund, as applicable, are listed below. The Board of Trustees governs the fund and is responsible for protecting the interests of shareholders. The Trustees are experienced executives who meet periodically throughout the year to oversee the fund's activities, review contractual arrangements with companies that provide services to the fund, oversee management of the risks associated with such activities and contractual arrangements, and review the fund's performance. Except for James C. Curvey, each of the Trustees oversees 236 funds advised by FMR or an affiliate. Mr. Curvey oversees 443 funds advised by FMR or an affiliate.
The Trustees hold office without limit in time except that (a) any Trustee may resign; (b) any Trustee may be removed by written instrument, signed by at least two-thirds of the number of Trustees prior to such removal; (c) any Trustee who requests to be retired or who has become incapacitated by illness or injury may be retired by written instrument signed by a majority of the other Trustees; and (d) any Trustee may be removed at any special meeting of shareholders by a two-thirds vote of the outstanding voting securities of the trust. Each Trustee who is not an interested person (as defined in the 1940 Act) (Independent Trustee), shall retire not later than the last day of the calendar year in which his or her 75th birthday occurs. The Independent Trustees may waive this mandatory retirement age policy with respect to individual Trustees. The executive officers and Advisory Board Members hold office without limit in time, except that any officer and Advisory Board Member may resign or may be removed by a vote of a majority of the Trustees at any regular meeting or any special meeting of the Trustees. Except as indicated, each individual has held the office shown or other offices in the same company for the past five years.
Experience, Skills, Attributes, and Qualifications of the Fund's Trustees. The Governance and Nominating Committee has adopted a statement of policy that describes the experience, qualifications, attributes, and skills that are necessary and desirable for potential Independent Trustee candidates (Statement of Policy). The Board believes that each Trustee satisfied at the time he or she was initially elected or appointed a Trustee, and continues to satisfy, the standards contemplated by the Statement of Policy. The Governance and Nominating Committee also engages professional search firms to help identify potential Independent Trustee candidates who have the experience, qualifications, attributes, and skills consistent with the Statement of Policy. From time to time, additional criteria based on the composition and skills of the current Independent Trustees, as well as experience or skills that may be appropriate in light of future changes to board composition, business conditions, and regulatory or other developments, have also been considered by the professional search firms and the Governance and Nominating Committee. In addition, the Board takes into account the Trustees' commitment and participation in Board and committee meetings, as well as their leadership of standing and ad hoc committees throughout their tenure.
In determining that a particular Trustee was and continues to be qualified to serve as a Trustee, the Board has considered a variety of criteria, none of which, in isolation, was controlling. The Board believes that, collectively, the Trustees have balanced and diverse experience, qualifications, attributes, and skills, which allow the Board to operate effectively in governing the fund and protecting the interests of shareholders. Information about the specific experience, skills, attributes, and qualifications of each Trustee, which in each case led to the Board's conclusion that the Trustee should serve (or continue to serve) as a trustee of the fund, is provided below.
Annual Report
Trustees and Officers - continued
Board Structure and Oversight Function. James C. Curvey is an interested person (as defined in the 1940 Act) and currently serves as Chairman. The Trustees have determined that an interested Chairman is appropriate and benefits shareholders because an interested Chairman has a personal and professional stake in the quality and continuity of services provided to the fund. Independent Trustees exercise their informed business judgment to appoint an individual of their choosing to serve as Chairman, regardless of whether the Trustee happens to be independent or a member of management. The Independent Trustees have determined that they can act independently and effectively without having an Independent Trustee serve as Chairman and that a key structural component for assuring that they are in a position to do so is for the Independent Trustees to constitute a substantial majority for the Board. The Independent Trustees also regularly meet in executive session. Ned C. Lautenbach serves as Chairman of the Independent Trustees and as such (i) acts as a liaison between the Independent Trustees and management with respect to matters important to the Independent Trustees and (ii) with management prepares agendas for Board meetings.
Fidelity funds are overseen by different Boards of Trustees. The fund's Board oversees Fidelity's equity and high income funds and another Board oversees Fidelity's investment-grade bond, money market, and asset allocation funds. The asset allocation funds may invest in Fidelity funds overseen by the fund's Board. The use of separate Boards, each with its own committee structure, allows the Trustees of each group of Fidelity funds to focus on the unique issues of the funds they oversee, including common research, investment, and operational issues. On occasion, the separate Boards establish joint committees to address issues of overlapping consequences for the Fidelity funds overseen by each Board.
The Trustees operate using a system of committees to facilitate the timely and efficient consideration of all matters of importance to the Trustees, the fund, and fund shareholders and to facilitate compliance with legal and regulatory requirements and oversight of the fund's activities and associated risks. The Board, acting through its committees, has charged FMR and its affiliates with (i) identifying events or circumstances the occurrence of which could have demonstrably adverse effects on the fund's business and/or reputation; (ii) implementing processes and controls to lessen the possibility that such events or circumstances occur or to mitigate the effects of such events or circumstances if they do occur; and (iii) creating and maintaining a system designed to evaluate continuously business and market conditions in order to facilitate the identification and implementation processes described in (i) and (ii) above. Because the day-to-day operations and activities of the fund are carried out by or through FMR, its affiliates and other service providers, the fund's exposure to risks is mitigated but not eliminated by the processes overseen by the Trustees. While each of the Board's committees has responsibility for overseeing different aspects of the fund's activities, oversight is exercised primarily through the Operations, Audit, and Compliance Committees. In addition, the Independent Trustees have worked with FMR to enhance the Board's oversight of investment and financial risks, legal and regulatory risks, technology risks, and operational risks, including the development of additional risk reporting to the Board. For example, a working group comprised of Independent Trustees and FMR has worked and continues to work to review the Fidelity funds' valuation-related activities, reporting and risk management. Appropriate personnel, including but not limited to the fund's Chief Compliance Officer (CCO), FMR's internal auditor, the independent accountants, the fund's Treasurer and portfolio management personnel, make periodic reports to the Board's committees, as appropriate, including an annual review of FMR's risk management program for the Fidelity funds. The responsibilities of each standing committee, including their oversight responsibilities, are described further under "Standing Committees of the Fund's Trustees."
Annual Report
The fund's Statement of Additional Information (SAI) includes more information about the Trustees. To request a free copy, call Fidelity at 1-800-544-8544.
Interested Trustees*:
Correspondence intended for each Trustee who is an interested person may be sent to Fidelity Investments, 82 Devonshire Street, Boston, Massachusetts 02109.
Name, Age; Principal Occupations and Other Relevant Experience+ |
James C. Curvey (77) |
| Year of Election or Appointment: 2007 Mr. Curvey is Trustee and Chairman of the Board of Trustees of certain Trusts. Mr. Curvey also serves as Trustee (2007-present) of other investment companies advised by FMR. Mr. Curvey is a Director of Fidelity Investments Money Management, Inc. (2009-present), Director of Fidelity Research & Analysis Co. (2009-present) and Director of FMR and FMR Co., Inc. (2007-present). Mr. Curvey is also Vice Chairman (2007-present) and Director of FMR LLC. In addition, Mr. Curvey serves as an Overseer for the Boston Symphony Orchestra and a member of the Trustees of Villanova University. Previously, Mr. Curvey was the Vice Chairman (2006-2007) and Director (2000-2007) of FMR Corp. |
Ronald P. O'Hanley (55) |
| Year of Election or Appointment: 2011 Mr. O'Hanley is Director of FMR Co., Inc. (2010-present), Director of Fidelity Investments Money Management, Inc. (2010-present), Director of Fidelity Research & Analysis Company (2010-present), President of Fidelity Asset Management and Corporate Services and a member of Fidelity's Executive Committee (2010-present). Previously, Mr. O'Hanley served as President and Chief Executive Officer of BNY Mellon Asset Management (2007-2010). Mr. O'Hanley also served as Vice Chairman of Bank New York Mellon Corp. and a member of that firm's Executive Committee. Prior to the 2007 merger of The Bank of New York and Mellon Financial Corporation, he was Vice Chairman of Mellon Financial Corporation and President and Chief Executive Officer of Mellon Asset Management. He joined Mellon in February 1997. Mr. O'Hanley currently serves as Chairman of the Boston Public Library Foundation Board of Directors and sits on the Board of Directors of Beth Israel Deaconess Medical Center, the Board of Trustees of the Marine Biological Laboratory and the Advisory Board of the Maxwell School of Citizenship and Public Administration at Syracuse University. Mr. O'Hanley also chairs the Council on Asset Management for the Financial Services Roundtable and is a member of the Board of Directors of Institutional Investor's U.S. Institute. |
* Trustees have been determined to be "Interested Trustees" by virtue of, among other things, their affiliation with the trust or various entities under common control with FMR.
+ The information above includes each Trustee's principal occupation during the last five years and other information relating to the experience, attributes, and skills relevant to each Trustee's qualifications to serve as a Trustee, which led to the conclusion that each Trustee should serve as a Trustee for the fund.
Annual Report
Independent Trustees:
Correspondence intended for each Independent Trustee (that is, the Trustees other than the Interested Trustees) may be sent to Fidelity Investments, P.O. Box 55235, Boston, Massachusetts 02205-5235.
Name, Age; Principal Occupations and Other Relevant Experience+ |
Dennis J. Dirks (64) |
| Year of Election or Appointment: 2005 Prior to his retirement in May 2003, Mr. Dirks was Chief Operating Officer and a member of the Board of The Depository Trust & Clearing Corporation (DTCC). He also served as President, Chief Operating Officer, and Board member of The Depository Trust Company (DTC) and President and Board member of the National Securities Clearing Corporation (NSCC). In addition, Mr. Dirks served as Chief Executive Officer and Board member of the Government Securities Clearing Corporation, Chief Executive Officer and Board member of the Mortgage-Backed Securities Clearing Corporation, as a Trustee and a member of the Finance Committee of Manhattan College (2005-2008), and as a Trustee and a member of the Finance Committee of AHRC of Nassau County (2006-2008). Mr. Dirks is a member of the Independent Directors Council (IDC) Governing Council (2010-present) and Board of Directors for The Brookville Center for Children's Services, Inc. (2009-present). |
Alan J. Lacy (59) |
| Year of Election or Appointment: 2008 Mr. Lacy serves as Senior Adviser (2007-present) of Oak Hill Capital Partners, L.P. (private equity). Mr. Lacy also served as Chief Executive Officer (2000-2005) and Vice Chairman (2005-2006) of Sears Holdings Corporation and Sears, Roebuck and Co. (retail). In addition, Mr. Lacy serves as a member of the Board of Directors of Dave & Buster's Entertainment, Inc. (restaurant and entertainment complexes, 2010-present), Earth Fare, Inc. (retail grocery, 2012-present), The Hillman Companies, Inc. (hardware wholesalers, 2010-present), and Bristol-Myers Squibb Company (global pharmaceuticals, 2008-present). Mr. Lacy is a member of the Board of Trustees of The National Parks Conservation Association (2006-present). Previously, Mr. Lacy served as Chairman of the Board of Trustees of the National Parks Conservation Association (2008-2011) and as a member of the Board of Directors for the Western Union Company (global money transfer, 2006-2011). |
Ned C. Lautenbach (68) |
| Year of Election or Appointment: 2000 Mr. Lautenbach is Chairman of the Independent Trustees of the Equity and High Income Funds (2006-present). Mr. Lautenbach currently serves as the Lead Director of the Eaton Corporation Board of Directors (diversified industrial, 1997-present). Mr. Lautenbach is Chairman of the Board of Directors of the Philharmonic Center for the Arts in Naples, Florida (2012-present) and a member of the Council on Foreign Relations (1994-present). Previously, Mr. Lautenbach was a Partner/Advisory Partner at Clayton, Dubilier & Rice, LLC (private equity investment, 1998-2010), as well as a Director of Sony Corporation (2006-2007). |
Joseph Mauriello (68) |
| Year of Election or Appointment: 2008 Prior to his retirement in January 2006, Mr. Mauriello served in numerous senior management positions including Deputy Chairman and Chief Operating Officer (2004-2005), and Vice Chairman of Financial Services (2002-2004) of KPMG LLP US (professional services, 1965-2005). Mr. Mauriello currently serves as a member of the Board of Directors of XL Group plc. (global insurance and re-insurance, 2006-present). Previously, Mr. Mauriello served as a Director of the Hamilton Funds of the Bank of New York (2006-2007) and of Arcadia Resources Inc. (health care services and products, 2007-2012). |
Robert W. Selander (62) |
| Year of Election or Appointment: 2011 Previously, Mr. Selander served as a Member of the Advisory Board of Fidelity's Equity and High Income Funds (2011), Executive Vice Chairman (2010), Chief Executive Officer (2009-2010), and President and Chief Executive Officer (1997-2009) of Mastercard, Inc. |
Cornelia M. Small (68) |
| Year of Election or Appointment: 2005 Ms. Small is a member of the Board of Directors (2009-present) and Chair of the Investment Committee (2010-present) of the Teagle Foundation. Ms. Small also serves on the Investment Committee of the Berkshire Taconic Community Foundation (2008-present). Previously, Ms. Small served as Chairperson (2002-2008) and a member of the Investment Committee and Chairperson (2008-2012) and a member of the Board of Trustees of Smith College. In addition, Ms. Small served as Chief Investment Officer, Director of Global Equity Investments, and a member of the Board of Directors of Scudder, Stevens & Clark and Scudder Kemper Investments. |
William S. Stavropoulos (73) |
| Year of Election or Appointment: 2001 Mr. Stavropoulos is Vice Chairman of the Independent Trustees of the Equity and High Income Funds (2006-present). Mr. Stavropoulos serves as President and Founder of the Michigan Baseball Foundation, the Great Lakes Loons (2007-present). Mr. Stavropoulos is Chairman Emeritus of the Board of Directors of The Dow Chemical Company, where he previously served in numerous senior management positions, including President, CEO (1995-2000; 2002-2004), Chairman of the Executive Committee (2000-2006), and as a member of the Board of Directors (1990-2006). Currently, Mr. Stavropoulos is a Director of Univar Inc. (global distributor of commodity and specialty chemicals, Chairman from 2010-May 2012 and Lead Director from May 2012-present), Teradata Corporation (data warehousing and technology solutions, 2008-present), Maersk Inc. (industrial conglomerate), and Tyco International, Ltd. (multinational manufacturing and services, 2007-present), and a member of the Advisory Board for Metalmark Capital LLC (private equity investment, 2005-present). Mr. Stavropoulos is an operating advisor to Clayton, Dubilier & Rice, LLC (private equity investment). In addition, Mr. Stavropoulos is a member of the University of Notre Dame Advisory Council for the College of Science, a Trustee of the Rollin L. Gerstacker Foundation, and a Director of the Naples Philharmonic Center for the Arts. Previously, Mr. Stavropoulos served as a Director of Chemical Financial Corporation (bank holding company, 1993-2012). |
David M. Thomas (63) |
| Year of Election or Appointment: 2008 Previously, Mr. Thomas served as Executive Chairman (2005-2006) and Chairman and Chief Executive Officer (2000-2005) of IMS Health, Inc. (pharmaceutical and healthcare information solutions), and a Director of Fortune Brands, Inc. (consumer products, 2000-2011). In addition, Mr. Thomas serves as Non-Executive Chairman of the Board of Directors of Fortune Brands Home and Security (home and security products, 2011-present), and as a member of the Board of Directors of Interpublic Group of Companies, Inc. (marketing communication, 2004-present). |
Michael E. Wiley (62) |
| Year of Election or Appointment: 2008 Mr. Wiley also serves as a Director of Asia Pacific Exploration Consolidated (international oil and gas exploration and production, 2008-present). Mr. Wiley serves as a Director of Tesoro Corporation (independent oil refiner and marketer, 2005-present), and a Director of Bill Barrett Corporation (exploration and production, 2005-present). In addition, Mr. Wiley also serves as a Director of Post Oak Bank (privately-held bank, 2004-present). Previously, Mr. Wiley served as a member of the Board of Trustees of the University of Tulsa (2000-2006; 2007-2010), as a Senior Energy Advisor of Katzenbach Partners, LLC (consulting, 2006-2007), as an Advisory Director of Riverstone Holdings (private investment), Chairman, President, and CEO of Baker Hughes, Inc. (oilfield services, 2000-2004), and as Director of Spinnaker Exploration Company (exploration and production, 2001-2005). |
+ The information above includes each Trustee's principal occupation during the last five years and other information relating to the experience, attributes, and skills relevant to each Trustee's qualifications to serve as a Trustee, which led to the conclusion that each Trustee should serve as a Trustee for the fund.
Advisory Board Members and Executive Officers:
Correspondence intended for David A. Rosow and Garnett A. Smith may be sent to Fidelity Investments, P.O. Box 55235, Boston, Massachusetts 02205-5235. Correspondence intended for each executive officer, Edward C. Johnson 3d, and Peter S. Lynch may be sent to Fidelity Investments, 82 Devonshire Street, Boston, Massachusetts 02109.
Name, Age; Principal Occupation |
Edward C. Johnson 3d (82) |
| Year of Election or Appointment: 2011 Member of the Advisory Board of Fidelity's Equity and High Income Funds. Mr. Johnson serves as Chief Executive Officer, Chairman, and a Director of FMR LLC, and also serves as Chairman and Director of FIL Limited. Previously, Mr. Johnson served as a Trustee and Chairman of the Board of certain Fidelity Trusts, Chairman and a Director of FMR, Chairman and a Director of FMR Co., Inc., and President of FMR LLC (2006-2007). |
Peter S. Lynch (68) |
| Year of Election or Appointment: 2003 Member of the Advisory Board of Fidelity's Equity and High Income Funds. Mr. Lynch is Vice Chairman and a Director of FMR and FMR Co., Inc. In addition, Mr. Lynch serves as a Trustee of Boston College and as the Chairman of the Inner-City Scholarship Fund. Previously, Mr. Lynch served on the Special Olympics International Board of Directors (1997-2006). |
David A. Rosow (70) |
| Year of Election or Appointment: 2012 Member of the Advisory Board of Fidelity's Equity and High Income Funds. Chairman and Chief Executive Officer of International Golf Group, Inc. (golf course development, 1989-present). Previously, Mr. Rosow served as Chairman and Chief Executive Officer of Rosow & Company, Inc. (private investment company, 1989-2011), a Lead Director of Hudson United Bancorp (2001-2006) and as a Director of TD Banknorth (1996-2006). In addition, Mr. Rosow is a member (2008-present) and President (2009-present) of the Town Council of Palm Beach, Florida. |
Garnett A. Smith (65) |
| Year of Election or Appointment: 2012 Member of the Advisory Board of Fidelity's Equity and High Income Funds. Prior to Mr. Smith's retirement, he served as Chairman and Chief Executive Officer of Inbrand Corp. (manufacturer of personal absorbent products, 1990-1997). He also served as President (1986-1990) of Inbrand Corp. Prior to his employment with Inbrand Corp., he was employed by a retail fabric chain and North Carolina National Bank. In addition, Mr. Smith is a board member of the Jackson Hole Land Trust (2009-present). |
Kenneth B. Robins (43) |
| Year of Election or Appointment: 2008 President and Treasurer of Fidelity's Equity and High Income Funds. Mr. Robins also serves as President and Treasurer (2010-present) and Assistant Treasurer (2009-present) of other Fidelity funds and is an employee of Fidelity Investments (2004-present). Previously, Mr. Robins served as Deputy Treasurer of the Fidelity funds (2005-2008) and Treasurer and Chief Financial Officer of The North Carolina Capital Management Trust: Cash and Term Portfolios (2006-2008). |
Bruce T. Herring (47) |
| Year of Election or Appointment: 2006 Vice President of certain Equity Funds. Mr. Herring also serves as President of Fidelity Research & Analysis Company (2010-present), Chief Investment Officer and Director of Fidelity Management & Research (U.K.) Inc. (2010-present) and Group Chief Investment Officer of FMR. Previously, Mr. Herring served as Vice President (2005-2006) and Senior Vice President (2006-2007) of Fidelity Management & Research Company, Vice President of FMR Co., Inc. (2001-2007) and as a portfolio manager for Fidelity U.S. Equity Funds. |
Brian B. Hogan (48) |
| Year of Election or Appointment: 2009 Vice President of Equity and High Income Funds. Mr. Hogan also serves as President of FMR's Equity Division (2009-present). Previously, Mr. Hogan served as Senior Vice President, Equity Research of FMR (2006-2009) and as a portfolio manager. |
Scott C. Goebel (44) |
| Year of Election or Appointment: 2008 Secretary and Chief Legal Officer (CLO) of the Fidelity funds. Mr. Goebel also serves as Secretary of Fidelity Investments Money Management, Inc. (FIMM) (2010-present) and Fidelity Research and Analysis Company (FRAC) (2010-present); Secretary and CLO of The North Carolina Capital Management Trust: Cash and Term Portfolios (2008-present); General Counsel, Secretary, and Senior Vice President of FMR (2008-present) and FMR Co., Inc. (2008-present); employed by FMR LLC or an affiliate (2001-present); Chief Legal Officer of Fidelity Management & Research (Hong Kong) Limited (2008-present) and Assistant Secretary of Fidelity Management & Research (Japan) Inc. (2008-present), and Fidelity Management & Research (U.K.) Inc. (2008-present). Previously, Mr. Goebel served as Assistant Secretary of FIMM (2008-2010), FRAC (2008-2010), and the Funds (2007-2008) and as Vice President and Secretary of Fidelity Distributors Corporation (FDC) (2005-2007). |
William C. Coffey (43) |
| Year of Election or Appointment: 2009 Assistant Secretary of Fidelity's Equity and High Income Funds. Mr. Coffey also serves as Senior Vice President and Deputy General Counsel of FMR LLC (2010-present), and is an employee of Fidelity Investments. Previously, Mr. Coffey served as Vice President and Associate General Counsel of FMR LLC (2005-2009). |
Elizabeth Paige Baumann (44) |
| Year of Election or Appointment: 2012 Anti-Money Laundering (AML) Officer of the Fidelity funds. Ms. Baumann also serves as AML Officer of The North Carolina Capital Management Trust: Cash and Term Portfolios (2012-present), Chief AML Officer of FMR LLC (2012-present), and is an employee of Fidelity Investments. Previously, Ms. Baumann served as Vice President and Deputy Anti-Money Laundering Officer (2007-2012). |
Christine Reynolds (54) |
| Year of Election or Appointment: 2008 Chief Financial Officer of the Fidelity funds. Ms. Reynolds became President of Fidelity Pricing and Cash Management Services (FPCMS) in August 2008. Ms. Reynolds served as Chief Operating Officer of FPCMS (2007-2008). Previously, Ms. Reynolds served as President, Treasurer, and Anti-Money Laundering officer of the Fidelity funds (2004-2007). |
Joseph A. Hanlon (44) |
| Year of Election or Appointment: 2012 Chief Compliance Officer of Fidelity's Equity and High Income Funds. Mr. Hanlon serves as Compliance Officer of FMR, FMR Co., Inc., Fidelity Investments Money Management, Inc. (FIMM), Fidelity Research and Analysis Company (FRAC), Fidelity Management & Research (Japan) Inc., Fidelity Management & Research (U.K.) Inc., Fidelity Management & Research (Hong Kong), and Strategic Advisers, Inc. (2009-present), as Senior Vice President of the Fidelity Asset Management Division (2009-present), and is an employee of Fidelity Investments. |
Joseph F. Zambello (55) |
| Year of Election or Appointment: 2011 Deputy Treasurer of the Fidelity funds. Mr. Zambello is an employee of Fidelity Investments. Previously, Mr. Zambello served as Vice President of FMR's Program Management Group (2009-2011) and Vice President of the Transfer Agent Oversight Group (2005-2009). |
Adrien E. Deberghes (45) |
| Year of Election or Appointment: 2008 Deputy Treasurer of Fidelity's Equity and High Income Funds. Mr. Deberghes also serves as Vice President (2011-present) and Assistant Treasurer (2010-present) of other Fidelity funds, and is an employee of Fidelity Investments (2008-present). Previously, Mr. Deberghes served as Senior Vice President of Mutual Fund Administration at State Street Corporation (2007-2008), Senior Director of Mutual Fund Administration at Investors Bank & Trust (2005-2007), and Director of Finance for Dunkin' Brands (2000-2005). |
Stephen Sadoski (41) |
| Year of Election or Appointment: 2012 Deputy Treasurer of Fidelity's Equity and High Income Funds. Mr. Sadoski also serves as Assistant Treasurer of other Fidelity funds (2012-present) and is an employee of Fidelity Investments (2012-present). Previously, Mr. Sadoski served as an assistant chief accountant in the Division of Investment Management of the Securities and Exchange Commission (SEC) (2009-2012) and as a senior manager at Deloitte & Touche (1997-2009). |
Stephanie J. Dorsey (43) |
| Year of Election or Appointment: 2010 Assistant Treasurer of Fidelity's Equity and High Income Funds. Ms. Dorsey also serves as Deputy Treasurer of other Fidelity funds (2008-present) and is an employee of Fidelity Investments (2008-present). Previously, Ms. Dorsey served as Treasurer (2004-2008) of the JPMorgan Mutual Funds and Vice President (2004-2008) of JPMorgan Chase Bank. |
John R. Hebble (54) |
| Year of Election or Appointment: 2009 Assistant Treasurer of Fidelity's Equity and High Income Funds. Mr. Hebble also serves as President (2011-present), Treasurer, and Chief Financial Officer of The North Carolina Capital Management Trust: Cash and Term Portfolios (2008-present), President and Treasurer of other Fidelity funds (2008-present) and is an employee of Fidelity Investments. |
Gary W. Ryan (54) |
| Year of Election or Appointment: 2005 Assistant Treasurer of the Fidelity funds. Mr. Ryan is an employee of Fidelity Investments. Previously, Mr. Ryan served as Vice President of Fund Reporting in Fidelity Pricing and Cash Management Services (FPCMS) (1999-2005). |
Jonathan Davis (44) |
| Year of Election or Appointment: 2010 Assistant Treasurer of the Fidelity funds. Mr. Davis is also Assistant Treasurer of Fidelity Rutland Square Trust II and Fidelity Commonwealth Trust II. Mr. Davis is an employee of Fidelity Investments. Previously, Mr. Davis served as Vice President and Associate General Counsel of FMR LLC (2003-2010). |
Annual Report
The Board of Trustees of Fidelity International Discovery Fund voted to pay to shareholders of record at the opening of business on record date, the following distributions per share derived from capital gains realized from sales of portfolio securities, and dividends derived from net investment income:
| Pay Date | Record Date | Dividends | Capital Gains |
International Discovery Fund | 12/10/12 | 12/07/12 | $0.549 | $0.032 |
International Discovery Fund designates 1% of the dividend distributed during the fiscal year as qualifying for the dividends-received deduction for corporate shareholders.
International Discovery Fund designates 100% of the dividend distributed during the fiscal year as amounts which may be taken into account as a dividend for the purposes of the maximum rate under section 1(h)(11) of the Internal Revenue Code.
The amounts per share which represent income derived from sources within, and taxes paid to, foreign countries or possessions of the United States are as follows:
| Pay Date | Income | Taxes |
International Discovery Fund | 12/05/11 | $0.440 | $0.0345 |
The fund will notify shareholders in January 2013 of amounts for use in preparing 2012 income tax returns.
Annual Report
Board Approval of Investment Advisory Contracts and Management Fees
Fidelity International Discovery Fund
Each year, the Board of Trustees, including the Independent Trustees (together, the Board), votes on the renewal of the management contract and sub-advisory agreements (together, the Advisory Contracts) for the fund. The Board, assisted by the advice of fund counsel and Independent Trustees' counsel, requests and considers a broad range of information relevant to the renewal of the Advisory Contracts throughout the year.
The Board meets regularly and, at each of its meetings, considers factors that are relevant to its annual consideration of the renewal of the fund's Advisory Contracts, including the services and support provided to the fund and its shareholders. The Board has established various standing committees, each composed of and chaired by Independent Trustees with varying backgrounds, to which the Board has assigned specific subject matter responsibilities in order to enhance effective decision-making by the Board. The Board, acting directly and through its Committees, requests and receives information concerning the annual consideration of the renewal of the fund's Advisory Contracts. The Board also meets as needed to consider matters specifically related to the Board's annual consideration of the renewal of Advisory Contracts. Members of the Board may also meet with trustees of other Fidelity funds through ad hoc joint committees to discuss certain matters relevant to the Fidelity funds.
At its July 2012 meeting, the Board of Trustees, including the Independent Trustees, unanimously determined to renew the fund's Advisory Contracts. In reaching its determination, the Board considered all factors it believed relevant, including (i) the nature, extent, and quality of the services to be provided to the fund and its shareholders (including the investment performance of the fund); (ii) the competitiveness of the fund's management fee and total expense ratio relative to peer funds; (iii) the total costs of the services to be provided by and the profits to be realized by Fidelity from its relationship with the fund; (iv) the extent to which economies of scale exist and would be realized as the fund grows; and (v) whether fee levels reflect these economies of scale, if any, for the benefit of fund shareholders.
In considering whether to renew the Advisory Contracts for the fund, the Board reached a determination, with the assistance of fund counsel and Independent Trustees' counsel and through the exercise of its business judgment, that the renewal of the Advisory Contracts is in the best interests of the fund and its shareholders and that the compensation payable under the Advisory Contracts is fair and reasonable. The Board's decision to renew the Advisory Contracts was not based on any single factor, but rather was based on a comprehensive consideration of all the information provided to the Board at its meetings throughout the year. The Board, in reaching its determination to renew the Advisory Contracts, is aware that shareholders in the fund have a broad range of investment choices available to them, including a wide choice among mutual funds offered by Fidelity's competitors, and that the fund's shareholders, who have the opportunity to review and weigh the disclosure provided by the fund in its prospectus and other public disclosures, have chosen to invest in this fund, managed by Fidelity.
Annual Report
Nature, Extent, and Quality of Services Provided. The Board considered the staffing within the investment adviser, FMR, and the sub-advisers (together, the Investment Advisers), including the backgrounds of the fund's investment personnel, and also considered the fund's investment objective, strategies, and related investment philosophy. The Independent Trustees also had discussions with senior management of Fidelity's investment operations and investment groups. The Board considered the structure of the portfolio manager compensation program and whether this structure provides appropriate incentives to act in the best interests of the fund.
Resources Dedicated to Investment Management and Support Services. The Board and the Fund Oversight and Research Committees reviewed the general qualifications and capabilities of the Investment Advisers' investment staff, including its size, education, experience, and resources, as well as the Investment Advisers' approach to recruiting, training, managing, and compensating investment personnel. The Board also noted that FMR has continued to increase the resources devoted to non-U.S. offices, including expansion of Fidelity's global investment organization. The Board noted that Fidelity's analysts have extensive resources, tools and capabilities that allow them to conduct sophisticated quantitative and fundamental analysis, as well as credit analysis of issuers, counterparties and guarantors. The Board also believes that Fidelity's investment professionals have sufficient access to global information and data so as to provide competitive investment results over time, and that those professionals also have access to sophisticated tools that permit them to assess portfolio construction and risk and performance attribution characteristics continuously, as well as to transmit new information and research conclusions rapidly around the world. Additionally, in its deliberations, the Board considered the Investment Advisers' trading and risk management capabilities and resources, which are an integral part of the investment management process.
Shareholder and Administrative Services. The Board considered (i) the nature, extent, quality, and cost of advisory, administrative, and shareholder services performed by the Investment Advisers and their affiliates under the Advisory Contracts and under separate agreements covering transfer agency, pricing and bookkeeping, and securities lending services for the fund; (ii) the nature and extent of the supervision of third party service providers, principally custodians and subcustodians; and (iii) the resources devoted to, and the record of compliance with, the fund's compliance policies and procedures. The Board also reviewed the allocation of fund brokerage, including allocations to brokers affiliated with the Investment Advisers, the use of brokerage commissions to pay fund expenses, and the use of "soft" commission dollars to pay for research services.
Annual Report
Board Approval of Investment Advisory Contracts and
Management Fees - continued
The Board noted that the growth of fund assets over time across the complex allows Fidelity to reinvest in the development of services designed to enhance the value or convenience of the Fidelity funds as investment vehicles. These services include 24-hour access to account information and market information through telephone representatives and over the Internet, investor education materials and asset allocation tools, and the expanded availability of Fidelity Investor Centers.
Investment in a Large Fund Family. The Board considered the benefits to shareholders of investing in a Fidelity fund, including the benefits of investing in a fund that is part of a large family of funds offering a variety of investment disciplines and providing a large variety of mutual fund investor services. The Board noted that Fidelity had taken, or had made recommendations that resulted in the Fidelity funds taking, a number of actions over the previous year that benefited particular funds, including (i) continuing to dedicate additional resources to investment research and support of the senior management team that oversees asset management; (ii) persisting in efforts to enhance Fidelity's research capabilities, in particular, international research; (iii) launching new funds and making other enhancements to meet client needs for global and income-oriented solutions; (iv) continuing to launch dedicated lower cost underlying funds to meet investment management's portfolio construction needs related to expanding underlying fund options, specifically for the Freedom Fund product lines; (v) adopting a "Stock Selector" sector neutral investment approach and employing a team of portfolio managers who are sector specialists to manage certain funds; (vi) rationalizing product lines and gaining increased efficiencies through the mergers of several funds into other funds; (vii) strengthening the Spartan Index Fund product line by adding new funds and/or new low-cost institutional share classes, restructuring fund expenses to accommodate new classes, and reducing investment minimums for certain classes of shares; (viii) modifying the eligibility criteria for Institutional Class shares to increase their appeal to government entities and charitable investors; and (ix) reducing certain transfer agent fee rates.
Investment Performance. The Board considered whether the fund has operated in accordance with its investment objective, as well as its record of compliance with its investment restrictions. It also reviewed the fund's absolute investment performance for each class, as well as the fund's relative investment performance for each class measured over multiple periods against (i) a broad-based securities market index, and (ii) a peer group of mutual funds deemed appropriate by Fidelity and reviewed by the Board. The following charts considered by the Board show, over the one-, three-, and five-year periods ended December 31, 2011, the cumulative total returns of Institutional Class (Class I) and Class B of the fund, the cumulative total returns of a broad-based securities market index ("benchmark"), and a range of cumulative total returns of a peer group of mutual funds identified by Morningstar, Inc. as having an investment style similar to that of the fund based on underlying portfolio holdings. The returns of Institutional Class (Class I) and Class B show the performance of the highest and lowest performing classes, respectively (based on five-year performance). The box within each chart shows the 25th percentile return (top of box) and the 75th percentile return (bottom of box) of the peer group. Returns shown above the box are in the first quartile and returns shown below the box are in the fourth quartile. The percentage beaten numbers noted below each chart correspond to the percentile box and represent the percentage of funds in the peer group whose performance was equal to or lower than that of the class indicated.
Annual Report
Fidelity International Discovery Fund

The Board reviewed the fund's relative investment performance against its peer group and noted that the performance of Institutional Class (Class I) of the fund was in the third quartile for the one- and three-year periods and the second quartile for the five-year period. The Board also noted that the investment performance of the fund was lower than its benchmark for the one- and three-year periods, although the five-year cumulative total return of Institutional Class (Class I) compared favorably to its benchmark. The Board considered that the variations in performance among the fund's classes reflect the variations in class expenses, which result in lower performance for higher expense classes. The Board discussed with FMR actions to improve the fund's disappointing performance relative to its peer group and benchmark. The Board also reviewed the fund's performance since inception as well as performance in the current year. The Board will continue to closely monitor the performance of the fund in the coming year and discuss with FMR other appropriate actions to address the performance of the fund.
The Board also considered that the fund's management fee is subject to upward or downward adjustment depending upon whether, and to what extent, the fund's investment performance for the performance period exceeds, or is exceeded by, the record (over the same period) of a Board-approved performance adjustment index. The Board noted that the performance adjustment provides FMR with a strong economic incentive to seek to achieve superior performance for the fund's shareholders and helps to more closely align the interests of FMR and the fund's shareholders.
Annual Report
Board Approval of Investment Advisory Contracts and
Management Fees - continued
Based on its review, the Board concluded that the nature, extent, and quality of services provided to the fund under the Advisory Contracts should benefit the fund's shareholders.
Competitiveness of Management Fee and Total Expense Ratio. The Board considered the fund's management fee and total expense ratio compared to "mapped groups" of competitive funds and classes. Fidelity creates "mapped groups" by combining similar Lipper investment objective categories that have comparable management fee characteristics. Combining Lipper investment objective categories aids the Board's management fee and total expense ratio comparisons by broadening the competitive group used for comparison and by reducing the number of universes to which various Fidelity funds are compared.
Management Fee. The Board considered two proprietary management fee comparisons for the 12-month periods shown in the chart below. The group of Lipper funds used by the Board for management fee comparisons is referred to below as the "Total Mapped Group." The Total Mapped Group comparison focuses on a fund's standing relative to the total universe of comparable funds available to investors in terms of gross management fees before expense reimbursements or caps, and without giving effect to the fund's performance adjustment. "TMG %" represents the percentage of funds in the Total Mapped Group that had management fees that were lower than the fund's. For example, a TMG % of 17% means that 83% of the funds in the Total Mapped Group had higher management fees than the fund. The "Asset-Size Peer Group" (ASPG) comparison focuses on a fund's standing relative to non-Fidelity funds similar in size to the fund within the Total Mapped Group. The ASPG represents at least 15% of the funds in the Total Mapped Group with comparable asset size and management fee characteristics, subject to a minimum of 50 funds (or all funds in the Total Mapped Group if fewer than 50). Additional information, such as the ASPG quartile in which the fund's management fee ranked and the impact of the fund's performance adjustment, is also included in the chart and considered by the Board.
Annual Report
Fidelity International Discovery Fund

The Board noted that the fund's management fee ranked below the median of its Total Mapped Group and below the median of its ASPG for 2011. The Board also noted the effect of the fund's negative performance adjustment on the fund's management fee ranking. The Board noted that the performance adjustment for each year represents calculations for performance periods that differ from the periods shown in the performance charts above.
Based on its review, the Board concluded that the fund's management fee is fair and reasonable in light of the services that the fund receives and the other factors considered.
Total Expense Ratio. In its review of each class's total expense ratio, the Board considered the fund's management fee as well as other fund or class expenses, as applicable, such as transfer agent fees, pricing and bookkeeping fees, fund-paid 12b-1 fees, and custodial, legal, and audit fees. The Board also noted the effects of any waivers and reimbursements on fees and expenses, as well as the impact of the fund's performance adjustment. As part of its review, the Board also considered the current and historical total expense ratios of each class of the fund compared to competitive fund median expenses. Each class of the fund is compared to those funds and classes in the Total Mapped Group (used by the Board for management fee comparisons) that have a similar sales load structure.
The Board noted that the total expense ratio of each of Class A, Class B, Class C, Institutional Class, the retail class, and Class K ranked below its competitive median for 2011 and the total expense ratio of Class T ranked above its competitive median for 2011. The Board considered that various factors, including 12b-1 fees, positive or negative performance adjustments, and relatively higher other expenses in the case of small fund size, can affect total expense ratios. The Board noted that the total expense ratio of Class T was above the competitive median primarily because of higher 12b-1 fees on Class T. Class T has a higher 12b-1 fee, but a lower front-end sales charge, than traditionally priced front-end sales charge classes. The Board considered that Class T is primarily sold load-waived in the retirement plan market where its 0.50% 12b-1 fee is comparable to competing no-load, higher 12b-1 fee classes designed specifically for retirement plans. The Board noted that the fund offers multiple classes, each of which has a different sales load and 12b-1 fee structure, and that the multiple structures are intended to offer a range of pricing options for the intermediary market. The Board also noted that the total expense ratios of the classes vary primarily by the level of their 12b-1 fees, although differences in transfer agent fees may also cause expenses to vary from class to class.
Annual Report
Board Approval of Investment Advisory Contracts and
Management Fees - continued
Fees Charged to Other Fidelity Clients. The Board also considered Fidelity fee structures and other information with respect to clients of FMR and its affiliates, such as other mutual funds advised or subadvised by FMR or its affiliates, pension plan clients, and other institutional clients. The Board noted the findings of the 2010 ad hoc joint committee (created with the board of other Fidelity funds), which reviewed and compared Fidelity's institutional investment advisory business with its business of providing services to the Fidelity funds, including the differences in services provided, fees charged, and costs incurred, as well as competition in their respective marketplaces.
Based on its review of total expense ratios and fees charged to other Fidelity clients, the Board concluded that the total expense ratio of each class of the fund was reasonable, although Class T was above the median of the universe presented for comparison, in light of the services that the fund and its shareholders receive and the other factors considered.
Costs of the Services and Profitability. The Board considered the revenues earned and the expenses incurred by Fidelity in conducting the business of developing, marketing, distributing, managing, administering and servicing the fund and its shareholders. The Board also considered the level of Fidelity's profits in respect of all the Fidelity funds.
On an annual basis, FMR presents to the Board Fidelity's profitability for the fund. Fidelity calculates the profitability for each fund, as well as aggregate profitability for groups of Fidelity funds and all Fidelity funds, using a series of detailed revenue and cost allocation methodologies which originate with the books and records of Fidelity on which Fidelity's audited financial statements are based. The Audit Committee of the Board reviews any significant changes from the prior year's methodologies.
PricewaterhouseCoopers LLP (PwC), independent registered public accounting firm and auditor to Fidelity and certain Fidelity funds, has been engaged annually by the Board as part of the Board's assessment of Fidelity's profitability analysis. PwC's engagement includes the review and assessment of Fidelity's methodologies used in determining the revenues and expenses attributable to Fidelity's mutual fund business, and completion of agreed-upon procedures surrounding the mathematical accuracy of fund profitability and its conformity to allocation methodologies. After considering PwC's reports issued under the engagement and information provided by Fidelity, the Board concluded that while other allocation methods may also be reasonable, Fidelity's profitability methodologies are reasonable in all material respects.
Annual Report
The Board also reviewed Fidelity's non-fund businesses and fall-out benefits related to the mutual fund business as well as cases where Fidelity's affiliates may benefit from or be related to the fund's business.
The Board considered the costs of the services provided by and the profits realized by Fidelity in connection with the operation of the fund and was satisfied that the profitability was not excessive in the circumstances.
Economies of Scale. The Board considered whether there have been economies of scale in respect of the management of the Fidelity funds, whether the Fidelity funds (including the fund) have appropriately benefited from any such economies of scale, and whether there is potential for realization of any further economies of scale. The Board considered the extent to which the fund will benefit from economies of scale through increased services to the fund, through waivers or reimbursements, or through fee or expense reductions. The Board also noted that in 2009, it and the board of other Fidelity funds created an ad hoc committee (the Economies of Scale Committee) to analyze whether FMR attains economies of scale in respect of the management and servicing of the Fidelity funds, whether the Fidelity funds have appropriately benefited from such economies of scale, and whether there is potential for realization of any further economies of scale.
The Board recognized that the fund's management contract incorporates a "group fee" structure, which provides for lower group fee rates as total fund assets under FMR's management increase, and for higher group fee rates as total fund assets under FMR's management decrease. FMR calculates the group fee rates based on a tiered asset "breakpoint" schedule that varies based on asset class. The Board considered that the group fee is designed to deliver the benefits of economies of scale to fund shareholders when total Fidelity fund assets increase, even if assets of any particular fund are unchanged or have declined, because some portion of Fidelity's costs are attributable to services provided to all Fidelity funds, and all funds benefit if those costs can be allocated among more assets. The Board concluded that, given the group fee structure, fund shareholders will benefit from lower management fees as assets under FMR's management increase at the fund complex level, regardless of whether Fidelity achieves any such economies of scale.
Annual Report
Board Approval of Investment Advisory Contracts and
Management Fees - continued
The Board concluded, taking into account the analysis of the Economies of Scale Committee, that economies of scale, if any, are being appropriately shared between fund shareholders and Fidelity.
Additional Information Requested by the Board. In order to develop fully the factual basis for consideration of the Fidelity funds' Advisory Contracts, the Board requested and received additional information on certain topics, including (i) fund performance trends, actions to be taken by FMR to improve certain funds' overall performance, and Fidelity's long-term strategies for certain funds; (ii) the potential to further rationalize the Fidelity fund lineup with the possibility of achieving savings for the funds and Fidelity; (iii) Fidelity's compensation structure for portfolio managers and other key investment personnel; (iv) the amount of the investment that each portfolio manager has made in the Fidelity fund(s) that he or she manages; (v) the realization of fall-out benefits in certain Fidelity business units; (vi) Fidelity's group fee structures, the potential impact of regulatory changes on such structures, and the rationale for the individual fee rates of certain funds; (vii) fund profitability methodology, including Fidelity's cost allocation methodology, and the impact of certain factors on fund profitability results; (viii) trends regarding industry use of performance fee structures and the possibility of implementing performance fee structures for additional funds; and (ix) the impact of net redemptions from the Fidelity funds.
Based on its evaluation of all of the conclusions noted above, and after considering all factors it believed relevant, the Board ultimately concluded that the advisory fee structures are fair and reasonable, and that the fund's Advisory Contracts should be renewed.
Annual Report
Investment Adviser
Fidelity Management & Research Company
Boston, MA
Investment Sub-Advisers
FMR Co., Inc.
Fidelity Management & Research
(U.K.) Inc.
FIL Investment Advisors
FIL Investments (Japan) Limited
FIL Investment Advisors (U.K.) Limited
Fidelity Management & Research
(Hong Kong) Limited
Fidelity Management & Research
(Japan) Inc.
General Distributor
Fidelity Distributors Corporation
Smithfield, RI
Transfer and Service Agents
Fidelity Investments Institutional
Operations Company, Inc.
Boston, MA
Fidelity Service Company, Inc.
Boston, MA
Custodian
The Northern Trust Company
Chicago, IL
The Fidelity Telephone Connection
Mutual Fund 24-Hour Service
Exchanges/Redemptions
and Account Assistance 1-800-544-6666
Product Information 1-800-544-8888
Retirement Accounts 1-800-544-4774
(8 a.m. - 9 p.m.)
TDD Service 1-800-544-0118
for the deaf and hearing impaired
(9 a.m. - 9 p.m. Eastern time)
Fidelity Automated Service
Telephone (FAST®) (automated graphic)
1-800-544-5555
(automated graphic)
Automated line for quickest service
(Fidelity Investment logo)(registered trademark)
Corporate Headquarters
82 Devonshire St., Boston, MA 02109
www.fidelity.com
IGI-UANN-1212
1.807257.108
(Fidelity Investment logo)(registered trademark)
Fidelity Advisor®
International Growth
Fund - Class A, Class T, Class B
and Class C
Annual Report
October 31, 2012
(Fidelity Cover Art)
Class A, Class T,
Class B, and Class C are
classes of Fidelity®
International Growth Fund
Contents
Performance | (Click Here) | How the fund has done over time. |
Management's Discussion of Fund Performance | (Click Here) | The Portfolio Manager's review of fund performance and strategy. |
Shareholder Expense Example | (Click Here) | An example of shareholder expenses. |
Investment Changes | (Click Here) | A summary of major shifts in the fund's investments over the past six months. |
Investments | (Click Here) | A complete list of the fund's investments with their market values. |
Financial Statements | (Click Here) | Statements of assets and liabilities, operations, and changes in net assets, as well as financial highlights. |
Notes | (Click Here) | Notes to financial statements. |
Report of Independent Registered Public Accounting Firm | (Click Here) | |
Trustees and Officers | (Click Here) | |
Distributions | (Click Here) | |
Board Approval of Investment Advisory Contracts and Management Fees | (Click Here) | |
To view a fund's proxy voting guidelines and proxy voting record for the 12-month period ended June 30, visit http://www.fidelity.com/proxyvotingresults or visit the Securities and Exchange Commission's (SEC) web site at http://www.sec.gov. You may also call 1-877-208-0098 to request a free copy of the proxy voting guidelines.
Standard & Poor's, S&P and S&P 500 are registered service marks of The McGraw-Hill Companies, Inc. and have been licensed for use by Fidelity Distributors Corporation.
Other third party marks appearing herein are the property of their respective owners.
All other marks appearing herein are registered or unregistered trademarks or service marks of FMR LLC or an affiliated company. © 2012 FMR LLC. All rights reserved.
Annual Report
This report and the financial statements contained herein are submitted for the general information of the shareholders of the fund. This report is not authorized for distribution to prospective investors in the fund unless preceded or accompanied by an effective prospectus.
A fund files its complete schedule of portfolio holdings with the SEC for the first and third quarters of each fiscal year on Form N-Q. Forms N-Q are available on the SEC's web site at http://www.sec.gov. A fund's Forms N-Q may be reviewed and copied at the SEC's Public Reference Room in Washington, DC. Information regarding the operation of the SEC's Public Reference Room may be obtained by calling 1-800-SEC-0330. For a complete list of a fund's portfolio holdings, view the most recent holdings listing, semiannual report, or annual report on Fidelity's web site at http://www.fidelity.com, http://www.advisor.fidelity.com, or http://www.401k.com, as applicable.
NOT FDIC INSURED • MAY LOSE VALUE • NO BANK GUARANTEE
Neither the fund nor Fidelity Distributors Corporation is a bank.
Annual Report
Average annual total return reflects the change in the value of an investment, assuming reinvestment of the class' distributions from dividend income and capital gains (the profits earned upon the sale of securities that have grown in value, if any) and assuming a constant rate of performance each year. The $10,000 table and the fund's returns do not reflect the deduction of taxes that a shareholder would pay on fund distributions or the redemption of fund shares. During periods of reimbursement by Fidelity, a fund's total return will be greater than it would be had the reimbursement not occurred. How a fund did yesterday is no guarantee of how it will do tomorrow.
Average Annual Total Returns
Periods ended October 31, 2012 | Past 1
year | Life of
fund A |
Class A (incl. 5.75% sales charge) | 4.71% | -2.74% |
Class T (incl. 3.50% sales charge) | 6.94% | -2.53% |
Class B (incl. contingent deferred sales charge) B | 5.17% | -2.71% |
Class C (incl. contingent deferred sales charge) C | 9.27% | -2.32% |
A From November 1, 2007.
B Class B shares' contingent deferred sales charge included in the past one year and life of fund total return figures are 5% and 2%, respectively.
C Class C shares' contingent deferred sales charge included in the past one year and life of fund total return figures are 1% and 0%, respectively.
Annual Report
$10,000 Over Life of Fund
Let's say hypothetically that $10,000 was invested in Fidelity Advisor® International Growth Fund - Class A on November 1, 2007, when the fund started, and the current 5.75% sales charge was paid. The chart shows how the value of your investment would have changed, and also shows how the MSCI® EAFE® Growth Index performed over the same period.
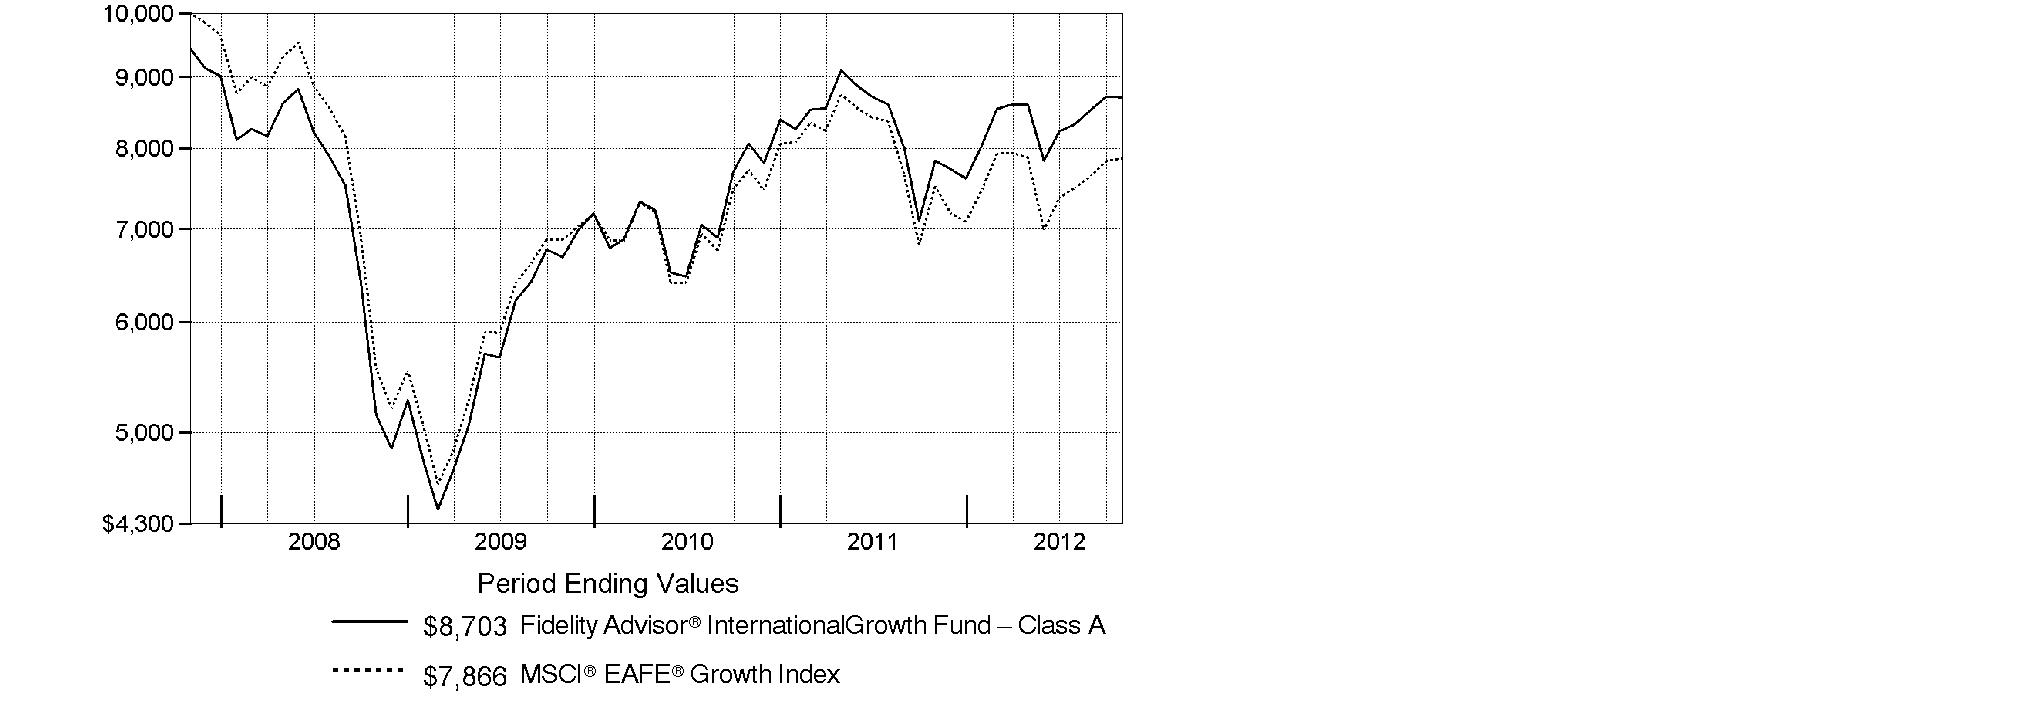
Annual Report
Market Recap: International stocks experienced pendulum-like swings during the 12 months ending October 31, 2012, finishing the period with a modest advance. The market faced periodic bouts of volatility this past year, as a number of macroeconomic concerns - including the eurozone debt crisis, the strength and pace of the U.S. economic recovery, and a slowdown in China's once-blistering growth - dominated headlines and weighed on investors. While a stronger U.S. dollar provided an additional head wind, foreign developed- and emerging-markets stocks still managed a gain for the 12 months, as the MSCI® ACWI® (All Country World Index) ex USA Index rose 4.11%, largely buttressed in the summertime by pledges of accommodative monetary action from eurozone officials, as well as signs that the U.S. housing market was on the mend. Within the index, Asia-Pacific ex Japan showed the most impressive gains, advancing roughly 11%. A number of core European components, most notably Germany (+11%), Switzerland (+10%) and the U.K. (+9%), benefited from optimism about the eurozone's ability to resolve its debt woes, which also helped the region outpace the index overall. Elsewhere, results from Canada (+3%) and the generally more volatile emerging markets (+2%) each fell short of the MSCI index, while Japan was among the few benchmark constituents to finish in the red, returning about -3%.
Comments from Jed Weiss, Portfolio Manager of Fidelity Advisor® International Growth Fund: For the year, the fund's Class A, Class T, Class B and Class C shares returned 11.10%, 10.82%, 10.17% and 10.27%, respectively (excluding sales charges), easily outpacing the 4.77% advance of the MSCI® EAFE® Growth Index. Following the fund's bottom-up stock selection strategy, portfolio positioning in Japan and Europe was especially helpful. An out-of-benchmark allocation to globally oriented U.S.-based stocks also contributed, while stock picking in Canada was modestly negative. In sector terms, security selection was very strong in information technology, materials, industrials, consumer discretionary and health care, while my picks in only two groups - energy and telecommunication services - had a negative impact. The top individual contributor was Belgian brewer Anheuser-Busch InBev, while in health care, Australian biotechnology company CSL and Denmark's Novo Nordisk also added value. U.S.-based credit card networks MasterCard and Visa, neither of which is in the index, were additional contributors. In contrast, not owning Diageo, a strong-performing U.K.-based spirits company and benchmark component, hurt. Other notable detractors were U.K. natural gas producer BG Group and Bharti Airtel, an Indian telecommunication services provider and non-index stock that I sold before period end.
The views expressed above reflect those of the portfolio manager(s) only through the end of the period as stated on the cover of this report and do not necessarily represent the views of Fidelity or any other person in the Fidelity organization. Any such views are subject to change at any time based upon market or other conditions and Fidelity disclaims any responsibility to update such views. These views may not be relied on as investment advice and, because investment decisions for a Fidelity fund are based on numerous factors, may not be relied on as an indication of trading intent on behalf of any Fidelity fund.
Annual Report
Shareholder Expense Example
As a shareholder of the Fund, you incur two types of costs: (1) transaction costs, including sales charges (loads) on purchase payments or redemption proceeds, redemption fees and (2) ongoing costs, including management fees, distribution and/or service (12b-1) fees and other Fund expenses. This Example is intended to help you understand your ongoing costs (in dollars) of investing in the Fund and to compare these costs with the ongoing costs of investing in other mutual funds.
The Example is based on an investment of $1,000 invested at the beginning of the period and held for the entire period (May 1, 2012 to October 31, 2012).
Actual Expenses
The first line of the accompanying table for each class of the Fund provides information about actual account values and actual expenses. You may use the information in this line, together with the amount you invested, to estimate the expenses that you paid over the period. Simply divide your account value by $1,000.00 (for example, an $8,600 account value divided by $1,000.00 = 8.6), then multiply the result by the number in the first line for a class of the Fund under the heading entitled "Expenses Paid During Period" to estimate the expenses you paid on your account during this period. A small balance maintenance fee of $12.00 that is charged once a year may apply for certain accounts with a value of less than $2,000. This fee is not included in the table below. If it was, the estimate of expenses you paid during the period would be higher, and your ending account value lower, by this amount. In addition, the Fund, as a shareholder in the underlying Fidelity Central Funds, will indirectly bear its pro-rata share of the fees and expenses incurred by the underlying Fidelity Central Funds. These fees and expenses are not included in the Fund's annualized expense ratio used to calculate the expense estimate in the table below.
Hypothetical Example for Comparison Purposes
The second line of the accompanying table for each class of the Fund provides information about hypothetical account values and hypothetical expenses based on a Class' actual expense ratio and an assumed rate of return of 5% per year before expenses, which is not the Class' actual return. The hypothetical account values and expenses may not be used to estimate the actual ending account balance or expenses you paid for the period. You may use this information to compare the ongoing costs of investing in the Fund and other funds. To do so, compare this 5% hypothetical example with the 5% hypothetical examples that appear in the shareholder reports of the other funds. A small balance maintenance fee of $12.00 that is charged once a year may apply for certain accounts with a value of less than $2,000. This fee is not included in the table below. If it was, the estimate of expenses you paid during the period would be higher, and your ending account value lower, by this amount. In addition, the Fund, as a shareholder in the underlying Fidelity Central Funds, will indirectly bear its pro-rata share of the fees and expenses incurred by the underlying Fidelity Central Funds. These fees and expenses are not included in the Fund's annualized expense ratio used to calculate the expense estimate in the table below.
Please note that the expenses shown in the table are meant to highlight your ongoing costs only and do not reflect any transaction costs. Therefore, the second line of the table is useful in comparing ongoing costs only, and will not help you determine the relative total costs of owning different funds. In addition, if these transactional costs were included, your costs would have been higher.
Annual Report
| Annualized
Expense Ratio | Beginning
Account Value
May 1, 2012 | Ending
Account Value
October 31, 2012 | Expenses Paid
During Period*
May 1, 2012
to October 31, 2012 |
Class A | 1.45% | | | |
Actual | | $ 1,000.00 | $ 1,012.50 | $ 7.34 |
HypotheticalA | | $ 1,000.00 | $ 1,017.85 | $ 7.35 |
Class T | 1.70% | | | |
Actual | | $ 1,000.00 | $ 1,011.40 | $ 8.60 |
HypotheticalA | | $ 1,000.00 | $ 1,016.59 | $ 8.62 |
Class B | 2.20% | | | |
Actual | | $ 1,000.00 | $ 1,007.90 | $ 11.10 |
HypotheticalA | | $ 1,000.00 | $ 1,014.08 | $ 11.14 |
Class C | 2.20% | | | |
Actual | | $ 1,000.00 | $ 1,009.10 | $ 11.11 |
HypotheticalA | | $ 1,000.00 | $ 1,014.08 | $ 11.14 |
International Growth | 1.20% | | | |
Actual | | $ 1,000.00 | $ 1,013.60 | $ 6.07 |
HypotheticalA | | $ 1,000.00 | $ 1,019.10 | $ 6.09 |
Institutional Class | 1.20% | | | |
Actual | | $ 1,000.00 | $ 1,013.60 | $ 6.07 |
HypotheticalA | | $ 1,000.00 | $ 1,019.10 | $ 6.09 |
A 5% return per year before expenses
* Expenses are equal to each Class' annualized expense ratio, multiplied by the average account value over the period, multiplied by 184/366 (to reflect the one-half year period).
Annual Report
Investment Changes (Unaudited)
Geographic Diversification (% of fund's net assets) |
As of October 31, 2012 |
 | United Kingdom 18.9% | |
 | United States of America 18.2% | |
 | Japan 10.9% | |
 | Switzerland 9.1% | |
 | Australia 5.4% | |
 | Belgium 4.6% | |
 | France 3.6% | |
 | Sweden 3.5% | |
 | Denmark 3.1% | |
| Other 22.7% | |

Percentages are based on country or territory of incorporation and are adjusted for the effect of futures contracts, if applicable. |
As of April 30, 2012 |
| United Kingdom 18.3% | |
| United States of America 18.1% | |
| Japan 10.6% | |
| Switzerland 9.5% | |
| Belgium 4.2% | |
| Australia 4.0% | |
| Germany 3.8% | |
| Denmark 3.3% | |
| France 3.3% | |
| Other 24.9% | |

Percentages are based on country or territory of incorporation and are adjusted for the effect of futures contracts, if applicable. |
Asset Allocation |
| % of fund's
net assets | % of fund's net assets
6 months ago |
Stocks | 98.1 | 97.4 |
Short-Term Investments and Net Other Assets (Liabilities) | 1.9 | 2.6 |
Top Ten Stocks as of October 31, 2012 |
| % of fund's
net assets | % of fund's net assets
6 months ago |
Nestle SA (Switzerland, Food Products) | 5.0 | 5.0 |
Anheuser-Busch InBev SA NV (Belgium, Beverages) | 3.6 | 3.3 |
Novo Nordisk A/S Series B sponsored ADR (Denmark, Pharmaceuticals) | 2.7 | 2.5 |
GlaxoSmithKline PLC sponsored ADR (United Kingdom, Pharmaceuticals) | 2.5 | 1.7 |
Linde AG (Germany, Chemicals) | 2.4 | 2.4 |
BG Group PLC (United Kingdom, Oil, Gas & Consumable Fuels) | 2.4 | 2.9 |
Roche Holding AG (participation certificate) (Switzerland, Pharmaceuticals) | 2.3 | 2.0 |
Philip Morris International, Inc. (United States of America, Tobacco) | 2.0 | 1.8 |
Standard Chartered PLC (United Kingdom) (United Kingdom, Commercial Banks) | 2.0 | 1.9 |
CSL Ltd. (Australia, Biotechnology) | 1.9 | 1.5 |
| 26.8 | |
Market Sectors as of October 31, 2012 |
| % of fund's
net assets | % of fund's net assets
6 months ago |
Consumer Staples | 24.2 | 22.4 |
Industrials | 14.5 | 13.4 |
Consumer Discretionary | 14.5 | 15.2 |
Materials | 12.4 | 13.2 |
Health Care | 11.4 | 9.5 |
Information Technology | 8.4 | 7.5 |
Financials | 7.2 | 10.9 |
Energy | 5.5 | 4.9 |
Telecommunication Services | 0.0 | 0.4 |
Annual Report
Investments October 31, 2012
Showing Percentage of Net Assets
Common Stocks - 98.1% |
| Shares | | Value |
Australia - 5.4% |
Coca-Cola Amatil Ltd. | 147,671 | | $ 2,061,749 |
CSL Ltd. | 74,105 | | 3,653,923 |
Newcrest Mining Ltd. | 45,609 | | 1,251,313 |
Sydney Airport unit | 179,470 | | 631,553 |
Woodside Petroleum Ltd. | 40,108 | | 1,432,213 |
WorleyParsons Ltd. | 50,089 | | 1,282,714 |
TOTAL AUSTRALIA | | 10,313,465 |
Austria - 1.1% |
Andritz AG | 36,600 | | 2,204,495 |
Bailiwick of Jersey - 1.1% |
Informa PLC | 86,364 | | 557,758 |
Randgold Resources Ltd. sponsored ADR | 12,335 | | 1,475,143 |
TOTAL BAILIWICK OF JERSEY | | 2,032,901 |
Belgium - 4.6% |
Anheuser-Busch InBev SA NV | 82,391 | | 6,890,455 |
Umicore SA | 38,731 | | 1,987,716 |
TOTAL BELGIUM | | 8,878,171 |
Bermuda - 0.8% |
Lazard Ltd. Class A | 20,292 | | 597,802 |
Li & Fung Ltd. | 519,000 | | 870,575 |
TOTAL BERMUDA | | 1,468,377 |
Brazil - 1.1% |
Arezzo Industria e Comercio SA | 27,400 | | 489,033 |
Iguatemi Empresa de Shopping Centers SA | 49,200 | | 624,977 |
Multiplan Empreendimentos Imobiliarios SA | 33,800 | | 990,177 |
TOTAL BRAZIL | | 2,104,187 |
Canada - 1.8% |
Agnico-Eagle Mines Ltd. (Canada) | 13,300 | | 750,926 |
Fairfax Financial Holdings Ltd. (sub. vtg.) | 1,300 | | 482,266 |
First Quantum Minerals Ltd. | 22,400 | | 503,509 |
Goldcorp, Inc. | 29,006 | | 1,311,260 |
Open Text Corp. (a) | 8,600 | | 462,226 |
TOTAL CANADA | | 3,510,187 |
Common Stocks - continued |
| Shares | | Value |
Cayman Islands - 1.7% |
Baidu.com, Inc. sponsored ADR (a) | 8,080 | | $ 861,490 |
Sands China Ltd. | 655,600 | | 2,465,886 |
TOTAL CAYMAN ISLANDS | | 3,327,376 |
Denmark - 3.1% |
Novo Nordisk A/S Series B sponsored ADR | 32,400 | | 5,193,396 |
William Demant Holding A/S (a) | 9,700 | | 834,267 |
TOTAL DENMARK | | 6,027,663 |
Finland - 1.5% |
Nokian Tyres PLC | 58,508 | | 2,426,725 |
Outotec Oyj | 9,000 | | 438,267 |
TOTAL FINLAND | | 2,864,992 |
France - 3.6% |
Alstom SA | 47,499 | | 1,622,260 |
Danone SA | 46,652 | | 2,867,694 |
Remy Cointreau SA | 8,587 | | 890,626 |
Safran SA | 39,100 | | 1,555,606 |
TOTAL FRANCE | | 6,936,186 |
Germany - 3.0% |
Linde AG | 27,941 | | 4,698,991 |
Siemens AG sponsored ADR (d) | 11,200 | | 1,130,192 |
TOTAL GERMANY | | 5,829,183 |
Ireland - 1.8% |
CRH PLC sponsored ADR | 68,700 | | 1,281,255 |
Elan Corp. PLC sponsored ADR (a) | 65,784 | | 710,467 |
James Hardie Industries NV sponsored ADR (d) | 32,000 | | 1,538,880 |
TOTAL IRELAND | | 3,530,602 |
Israel - 0.2% |
Azrieli Group | 19,200 | | 428,628 |
Italy - 0.9% |
Fiat Industrial SpA | 115,401 | | 1,249,716 |
Interpump Group SpA | 75,351 | | 572,324 |
TOTAL ITALY | | 1,822,040 |
Japan - 10.9% |
Autobacs Seven Co. Ltd. | 19,900 | | 816,391 |
Denso Corp. | 85,000 | | 2,660,842 |
Fanuc Corp. | 17,000 | | 2,706,627 |
Common Stocks - continued |
| Shares | | Value |
Japan - continued |
Fast Retailing Co. Ltd. | 8,200 | | $ 1,826,331 |
Japan Tobacco, Inc. | 27,700 | | 765,454 |
JS Group Corp. | 34,900 | | 771,621 |
Keyence Corp. | 10,062 | | 2,669,587 |
Kobayashi Pharmaceutical Co. Ltd. | 16,400 | | 865,915 |
Mitsui Fudosan Co. Ltd. | 55,000 | | 1,111,299 |
Nintendo Co. Ltd. | 8,000 | | 1,030,189 |
Osaka Securities Exchange Co. Ltd. | 10 | | 37,267 |
SHO-BOND Holdings Co. Ltd. | 15,600 | | 471,537 |
SMC Corp. | 5,500 | | 866,717 |
Unicharm Corp. | 24,900 | | 1,347,463 |
USS Co. Ltd. | 20,580 | | 2,162,924 |
Yamato Kogyo Co. Ltd. | 32,700 | | 917,959 |
TOTAL JAPAN | | 21,028,123 |
Netherlands - 2.2% |
ASML Holding NV | 61,400 | | 3,375,158 |
D.E. Master Blenders 1753 NV (a) | 66,459 | | 812,222 |
TOTAL NETHERLANDS | | 4,187,380 |
Portugal - 1.2% |
Jeronimo Martins SGPS SA | 127,352 | | 2,228,409 |
South Africa - 0.4% |
Clicks Group Ltd. | 120,343 | | 829,708 |
Spain - 1.6% |
Inditex SA | 18,214 | | 2,323,979 |
Prosegur Compania de Seguridad SA (Reg.) | 151,049 | | 822,285 |
TOTAL SPAIN | | 3,146,264 |
Sweden - 3.5% |
ASSA ABLOY AB (B Shares) | 48,761 | | 1,625,391 |
Fagerhult AB | 15,400 | | 380,769 |
H&M Hennes & Mauritz AB (B Shares) | 74,630 | | 2,525,959 |
Intrum Justitia AB | 30,000 | | 434,199 |
Swedish Match Co. AB | 52,300 | | 1,781,996 |
TOTAL SWEDEN | | 6,748,314 |
Switzerland - 9.1% |
Nestle SA | 152,687 | | 9,689,468 |
Roche Holding AG (participation certificate) | 22,817 | | 4,387,979 |
Schindler Holding AG: | | | |
(participation certificate) | 9,410 | | 1,239,780 |
Common Stocks - continued |
| Shares | | Value |
Switzerland - continued |
Schindler Holding AG: - continued | | | |
(Reg.) | 1,530 | | $ 197,965 |
Swatch Group AG (Bearer) | 2,480 | | 1,026,299 |
UBS AG (NY Shares) | 61,021 | | 916,535 |
TOTAL SWITZERLAND | | 17,458,026 |
Turkey - 2.3% |
Anadolu Efes Biracilik Ve Malt Sanayii A/S | 43,800 | | 657,305 |
Coca-Cola Icecek A/S | 82,142 | | 1,594,723 |
Turkiye Garanti Bankasi A/S | 276,500 | | 1,320,413 |
Turkiye Petrol Rafinerile A/S | 32,687 | | 798,712 |
TOTAL TURKEY | | 4,371,153 |
United Kingdom - 18.9% |
Anglo American PLC: | | | |
ADR | 25,200 | | 387,324 |
(United Kingdom) | 12,200 | | 374,658 |
Babcock International Group PLC | 79,300 | | 1,251,550 |
BG Group PLC | 247,955 | | 4,591,577 |
BHP Billiton PLC ADR (d) | 56,100 | | 3,589,278 |
GlaxoSmithKline PLC sponsored ADR | 107,600 | | 4,831,240 |
InterContinental Hotel Group PLC ADR | 94,530 | | 2,327,329 |
Johnson Matthey PLC | 48,477 | | 1,759,387 |
Reckitt Benckiser Group PLC | 53,945 | | 3,264,515 |
Rexam PLC | 141,583 | | 1,020,618 |
Rolls-Royce Group PLC | 167,537 | | 2,310,250 |
Rolls-Royce Group PLC Class C | 12,732,812 | | 20,548 |
Rotork PLC | 38,200 | | 1,404,279 |
SABMiller PLC | 75,766 | | 3,245,588 |
Serco Group PLC | 135,342 | | 1,237,282 |
Shaftesbury PLC | 62,933 | | 556,539 |
Standard Chartered PLC (United Kingdom) | 162,631 | | 3,840,894 |
Unite Group PLC | 103,000 | | 470,558 |
TOTAL UNITED KINGDOM | | 36,483,414 |
United States of America - 16.3% |
Allergan, Inc. | 14,200 | | 1,276,864 |
Amazon.com, Inc. (a) | 5,500 | | 1,280,510 |
Autoliv, Inc. (d) | 33,400 | | 1,923,840 |
Berkshire Hathaway, Inc. Class B (a) | 23,023 | | 1,988,036 |
BorgWarner, Inc. (a) | 20,246 | | 1,332,592 |
CME Group, Inc. | 14,700 | | 822,171 |
Cummins, Inc. | 7,404 | | 692,866 |
Common Stocks - continued |
| Shares | | Value |
United States of America - continued |
Cymer, Inc. (a) | 9,787 | | $ 779,926 |
FMC Technologies, Inc. (a) | 24,788 | | 1,013,829 |
Freeport-McMoRan Copper & Gold, Inc. | 13,800 | | 536,544 |
Martin Marietta Materials, Inc. (d) | 6,000 | | 493,860 |
MasterCard, Inc. Class A | 7,400 | | 3,410,882 |
Mead Johnson Nutrition Co. Class A | 30,200 | | 1,862,132 |
Mohawk Industries, Inc. (a) | 11,200 | | 934,864 |
National Oilwell Varco, Inc. | 20,289 | | 1,495,299 |
Philip Morris International, Inc. | 44,508 | | 3,941,628 |
PriceSmart, Inc. | 9,200 | | 763,508 |
ResMed, Inc. | 26,100 | | 1,042,434 |
Solera Holdings, Inc. | 11,689 | | 547,162 |
SS&C Technologies Holdings, Inc. (a) | 19,300 | | 463,779 |
Union Pacific Corp. | 17,300 | | 2,128,419 |
Visa, Inc. Class A | 19,500 | | 2,705,820 |
TOTAL UNITED STATES OF AMERICA | | 31,436,965 |
TOTAL COMMON STOCKS (Cost $179,197,131) |
189,196,209
|
Money Market Funds - 6.7% |
| | | |
Fidelity Cash Central Fund, 0.19% (b) | 6,916,036 | | 6,916,036 |
Fidelity Securities Lending Cash Central Fund, 0.19% (b)(c) | 5,935,200 | | 5,935,200 |
TOTAL MONEY MARKET FUNDS (Cost $12,851,236) |
12,851,236
|
TOTAL INVESTMENT PORTFOLIO - 104.8% (Cost $192,048,367) | | 202,047,445 |
NET OTHER ASSETS (LIABILITIES) - (4.8)% | | (9,201,174) |
NET ASSETS - 100% | $ 192,846,271 |
Legend |
(a) Non-income producing |
(b) Affiliated fund that is available only to investment companies and other accounts managed by Fidelity Investments. The rate quoted is the annualized seven-day yield of the fund at period end. A complete unaudited listing of the fund's holdings as of its most recent quarter end is available upon request. In addition, each Fidelity Central Fund's financial statements, which are not covered by the Fund's Report of Independent Registered Public Accounting Firm, are available on the SEC's website or upon request. |
(c) Investment made with cash collateral received from securities on loan. |
(d) Security or a portion of the security is on loan at period end. |
Affiliated Central Funds |
Information regarding fiscal year to date income earned by the Fund from investments in Fidelity Central Funds is as follows: |
Fund | Income earned |
Fidelity Cash Central Fund | $ 7,474 |
Fidelity Securities Lending Cash Central Fund | 56,903 |
Total | $ 64,377 |
Other Information |
Categorizations in the Schedule of Investments are based on country or territory of incorporation. |
The following is a summary of the inputs used, as of October 31, 2012, involving the Fund's assets and liabilities carried at fair value. The inputs or methodology used for valuing securities may not be an indication of the risk associated with investing in those securities. For more information on valuation inputs, and their aggregation into the levels used in the tables below, please refer to the Security Valuation section in the accompanying Notes to Financial Statements. |
Valuation Inputs at Reporting Date: |
Description | Total | Level 1 | Level 2 | Level 3 |
Investments in Securities: | | | | |
Equities: | | | | |
Consumer Discretionary | $ 27,951,837 | $ 27,951,837 | $ - | $ - |
Consumer Staples | 46,360,558 | 39,470,103 | 6,890,455 | - |
Energy | 10,614,344 | 10,614,344 | - | - |
Financials | 14,187,562 | 14,187,562 | - | - |
Health Care | 21,930,570 | 21,930,570 | - | - |
Industrials | 27,966,498 | 27,966,498 | - | - |
Information Technology | 16,306,219 | 16,306,219 | - | - |
Materials | 23,878,621 | 23,878,621 | - | - |
Money Market Funds | 12,851,236 | 12,851,236 | - | - |
Total Investments in Securities: | $ 202,047,445 | $ 195,156,990 | $ 6,890,455 | $ - |
The following is a summary of transfers between Level 1 and Level 2 for the period ended October 31, 2012. Transfers are assumed to have occurred at the beginning of the period, and are primarily attributable to the valuation techniques used for foreign equity securities, as discussed in the accompanying Notes to Financial Statements: |
Transfers | Total |
Level 1 to Level 2 | $ 0 |
Level 2 to Level 1 | $ 8,172,491 |
See accompanying notes which are an integral part of the financial statements.
Annual Report
Statement of Assets and Liabilities
| October 31, 2012 |
| | |
Assets | | |
Investment in securities, at value (including securities loaned of $5,892,979) - See accompanying schedule: Unaffiliated issuers (cost $179,197,131) | $ 189,196,209 | |
Fidelity Central Funds (cost $12,851,236) | 12,851,236 | |
Total Investments (cost $192,048,367) | | $ 202,047,445 |
Foreign currency held at value (cost $128) | | 128 |
Receivable for investments sold | | 193,639 |
Receivable for fund shares sold | | 861,534 |
Dividends receivable | | 270,403 |
Distributions receivable from Fidelity Central Funds | | 4,169 |
Receivable from investment adviser for expense reductions | | 33,993 |
Other receivables | | 7,075 |
Total assets | | 203,418,386 |
| | |
Liabilities | | |
Payable for investments purchased | $ 4,214,811 | |
Payable for fund shares redeemed | 174,237 | |
Accrued management fee | 121,924 | |
Distribution and service plan fees payable | 14,452 | |
Other affiliated payables | 46,085 | |
Other payables and accrued expenses | 65,406 | |
Collateral on securities loaned, at value | 5,935,200 | |
Total liabilities | | 10,572,115 |
| | |
Net Assets | | $ 192,846,271 |
Net Assets consist of: | | |
Paid in capital | | $ 187,380,543 |
Undistributed net investment income | | 1,374,430 |
Accumulated undistributed net realized gain (loss) on investments and foreign currency transactions | | (5,900,404) |
Net unrealized appreciation (depreciation) on investments and assets and liabilities in foreign currencies | | 9,991,702 |
Net Assets | | $ 192,846,271 |
See accompanying notes which are an integral part of the financial statements.
Annual Report
Statement of Assets and Liabilities - continued
| October 31, 2012 |
| | |
Calculation of Maximum Offering Price Class A:
Net Asset Value and redemption price per share ($21,874,352 ÷ 2,455,261 shares) | | $ 8.91 |
| | |
Maximum offering price per share (100/94.25 of $8.91) | | $ 9.45 |
Class T:
Net Asset Value and redemption price per share ($10,689,976 ÷ 1,202,180 shares) | | $ 8.89 |
| | |
Maximum offering price per share (100/96.50 of $8.89) | | $ 9.21 |
Class B:
Net Asset Value and offering price per share ($1,116,152 ÷ 125,639 shares)A | | $ 8.88 |
| | |
Class C:
Net Asset Value and offering price per share ($5,647,907 ÷ 638,785 shares)A | | $ 8.84 |
| | |
International Growth:
Net Asset Value, offering price and redemption price per share ($149,526,022 ÷ 16,710,639 shares) | | $ 8.95 |
| | |
Institutional Class:
Net Asset Value, offering price and redemption price per share ($3,991,862 ÷ 446,301 shares) | | $ 8.94 |
A Redemption price per share is equal to net asset value less any applicable contingent deferred sales charge.
See accompanying notes which are an integral part of the financial statements.
Annual Report
Financial Statements - continued
Statement of Operations
| Year ended October 31, 2012 |
| | |
Investment Income | | |
Dividends | | $ 3,011,819 |
Interest | | 13 |
Income from Fidelity Central Funds | | 64,377 |
Income before foreign taxes withheld | | 3,076,209 |
Less foreign taxes withheld | | (190,510) |
Total income | | 2,885,699 |
| | |
Expenses | | |
Management fee
Basic fee | $ 841,290 | |
Performance adjustment | 98,242 | |
Transfer agent fees | 325,129 | |
Distribution and service plan fees | 96,288 | |
Accounting and security lending fees | 62,806 | |
Custodian fees and expenses | 59,416 | |
Independent trustees' compensation | 721 | |
Registration fees | 83,181 | |
Audit | 66,173 | |
Legal | 501 | |
Miscellaneous | 773 | |
Total expenses before reductions | 1,634,520 | |
Expense reductions | (126,529) | 1,507,991 |
Net investment income (loss) | | 1,377,708 |
Realized and Unrealized Gain (Loss) Net realized gain (loss) on: | | |
Investment securities: | | |
Unaffiliated issuers | (820,062) | |
Foreign currency transactions | (13,150) | |
Total net realized gain (loss) | | (833,212) |
Change in net unrealized appreciation (depreciation) on: Investment securities | 11,235,369 | |
Assets and liabilities in foreign currencies | (8,388) | |
Total change in net unrealized appreciation (depreciation) | | 11,226,981 |
Net gain (loss) | | 10,393,769 |
Net increase (decrease) in net assets resulting from operations | | $ 11,771,477 |
See accompanying notes which are an integral part of the financial statements.
Annual Report
Statement of Changes in Net Assets
| Year ended
October 31,
2012 | Year ended
October 31,
2011 |
Increase (Decrease) in Net Assets | | |
Operations | | |
Net investment income (loss) | $ 1,377,708 | $ 628,947 |
Net realized gain (loss) | (833,212) | 1,817,821 |
Change in net unrealized appreciation (depreciation) | 11,226,981 | (6,057,574) |
Net increase (decrease) in net assets resulting
from operations | 11,771,477 | (3,610,806) |
Distributions to shareholders from net investment income | (594,738) | (276,358) |
Distributions to shareholders from net realized gain | (48,645) | (48,341) |
Total distributions | (643,383) | (324,699) |
Share transactions - net increase (decrease) | 115,271,822 | 35,841,228 |
Redemption fees | 5,972 | 7,927 |
Total increase (decrease) in net assets | 126,405,888 | 31,913,650 |
| | |
Net Assets | | |
Beginning of period | 66,440,383 | 34,526,733 |
End of period (including undistributed net investment income of $1,374,430 and undistributed net investment income of $591,460, respectively) | $ 192,846,271 | $ 66,440,383 |
See accompanying notes which are an integral part of the financial statements.
Annual Report
Financial Highlights - Class A
Years ended October 31, | 2012 | 2011 | 2010 | 2009 | 2008 F |
Selected Per-Share Data | | | | | |
Net asset value, beginning of period | $ 8.09 | $ 8.38 | $ 7.01 | $ 5.46 | $ 10.00 |
Income from Investment Operations | | | | | |
Net investment income (loss) C | .08 | .08 | .05 | .05 | .07 |
Net realized and unrealized gain (loss) | .81 | (.31) | 1.39 | 1.55 | (4.61) |
Total from investment operations | .89 | (.23) | 1.44 | 1.60 | (4.54) |
Distributions from net investment income | (.06) | (.05) | (.05) | (.05) | - |
Distributions from net realized gain | (.01) | (.01) | (.03) | - | - |
Total distributions | (.07) | (.06) | (.07) I | (.05) | - |
Redemption fees added to paid in capital C, H | - | - | - | - | - |
Net asset value, end of period | $ 8.91 | $ 8.09 | $ 8.38 | $ 7.01 | $ 5.46 |
Total Return A, B | 11.10% | (2.76)% | 20.68% | 29.72% | (45.40)% |
Ratios to Average Net Assets D, G | | | | | |
Expenses before reductions | 1.58% | 1.77% | 2.13% | 2.46% | 2.88% |
Expenses net of fee waivers, if any | 1.45% | 1.45% | 1.50% | 1.50% | 1.50% |
Expenses net of all reductions | 1.44% | 1.43% | 1.48% | 1.47% | 1.48% |
Net investment income (loss) | .99% | .92% | .74% | .85% | .80% |
Supplemental Data | | | | | |
Net assets, end of period (000 omitted) | $ 21,874 | $ 6,352 | $ 3,084 | $ 1,452 | $ 820 |
Portfolio turnover rate E | 32% | 68% | 87% | 116% | 115% |
A Total returns would have been lower if certain expenses had not been reduced during the applicable periods shown.
B Total returns do not include the effect of the sales charges.
C Calculated based on average shares outstanding during the period.
D Fees and expenses of any underlying Fidelity Central Funds are not included in the Fund's expense ratio. The Fund indirectly bears its proportionate share of the expenses of any underlying Fidelity Central Funds.
E Amount does not include the portfolio activity of any underlying Fidelity Central Funds.
F For the period November 1, 2007 (commencement of operations) to October 31, 2008.
G Expense ratios reflect operating expenses of the class. Expenses before reductions do not reflect amounts reimbursed by the investment adviser or reductions from brokerage service arrangements or reductions from other expense offset arrangements and do not represent the amount paid by the class during periods when reimbursements or reductions occur. Expense ratios before reductions for start-up periods may not be representative of longer-term operating periods. Expenses net of fee waivers reflect expenses after reimbursement by the investment adviser but prior to reductions from brokerage service arrangements or other expense offset arrangements. Expenses net of all reductions represent the net expenses paid by the class.
H Amount represents less than $.01 per share.
I Total distributions of $.07 per share is comprised of distributions from net investment income of $.046 and distributions from net realized gain of $.025 per share.
See accompanying notes which are an integral part of the financial statements.
Annual Report
Financial Highlights - Class T
Years ended October 31, | 2012 | 2011 | 2010 | 2009 | 2008 F |
Selected Per-Share Data | | | | | |
Net asset value, beginning of period | $ 8.08 | $ 8.38 | $ 7.00 | $ 5.45 | $ 10.00 |
Income from Investment Operations | | | | | |
Net investment income (loss) C | .06 | .06 | .04 | .03 | .05 |
Net realized and unrealized gain (loss) | .81 | (.31) | 1.39 | 1.55 | (4.60) |
Total from investment operations | .87 | (.25) | 1.43 | 1.58 | (4.55) |
Distributions from net investment income | (.05) | (.04) | (.02) | (.03) | - |
Distributions from net realized gain | (.01) | (.01) | (.03) | - | - |
Total distributions | (.06) | (.05) | (.05) | (.03) | - |
Redemption fees added to paid in capital C, H | - | - | - | - | - |
Net asset value, end of period | $ 8.89 | $ 8.08 | $ 8.38 | $ 7.00 | $ 5.45 |
Total Return A, B | 10.82% | (3.03)% | 20.47% | 29.22% | (45.50)% |
Ratios to Average Net Assets D, G | | | | | |
Expenses before reductions | 1.85% | 2.03% | 2.41% | 2.67% | 3.07% |
Expenses net of fee waivers, if any | 1.70% | 1.70% | 1.75% | 1.75% | 1.75% |
Expenses net of all reductions | 1.69% | 1.68% | 1.73% | 1.73% | 1.73% |
Net investment income (loss) | .74% | .67% | .49% | .59% | .55% |
Supplemental Data | | | | | |
Net assets, end of period (000 omitted) | $ 10,690 | $ 2,917 | $ 1,034 | $ 532 | $ 507 |
Portfolio turnover rate E | 32% | 68% | 87% | 116% | 115% |
A Total returns would have been lower if certain expenses had not been reduced during the applicable periods shown.
B Total returns do not include the effect of the sales charges.
C Calculated based on average shares outstanding during the period.
D Fees and expenses of any underlying Fidelity Central Funds are not included in the Fund's expense ratio. The Fund indirectly bears its proportionate share of the expenses of any underlying Fidelity Central Funds.
E Amount does not include the portfolio activity of any underlying Fidelity Central Funds.
F For the period November 1, 2007 (commencement of operations) to October 31, 2008.
G Expense ratios reflect operating expenses of the class. Expenses before reductions do not reflect amounts reimbursed by the investment adviser or reductions from brokerage service arrangements or reductions from other expense offset arrangements and do not represent the amount paid by the class during periods when reimbursements or reductions occur. Expense ratios before reductions for start-up periods may not be representative of longer-term operating periods. Expenses net of fee waivers reflect expenses after reimbursement by the investment adviser but prior to reductions from brokerage service arrangements or other expense offset arrangements. Expenses net of all reductions represent the net expenses paid by the class.
H Amount represents less than $.01 per share.
See accompanying notes which are an integral part of the financial statements.
Annual Report
Financial Highlights - Class B
Years ended October 31, | 2012 | 2011 | 2010 | 2009 | 2008 F |
Selected Per-Share Data | | | | | |
Net asset value, beginning of period | $ 8.06 | $ 8.36 | $ 6.98 | $ 5.42 | $ 10.00 |
Income from Investment Operations | | | | | |
Net investment income (loss) C | .02 | .01 | - H | .01 | - H |
Net realized and unrealized gain (loss) | .80 | (.30) | 1.38 | 1.55 | (4.58) |
Total from investment operations | .82 | (.29) | 1.38 | 1.56 | (4.58) |
Distributions from net investment income | - | (.01) | - | - | - |
Distributions from net realized gain | - | - H | - | - | - |
Total distributions | - | (.01) | - | - | - |
Redemption fees added to paid in capital C, H | - | - | - | - | - |
Net asset value, end of period | $ 8.88 | $ 8.06 | $ 8.36 | $ 6.98 | $ 5.42 |
Total Return A, B | 10.17% | (3.47)% | 19.77% | 28.78% | (45.80)% |
Ratios to Average Net Assets D, G | | | | | |
Expenses before reductions | 2.35% | 2.55% | 2.87% | 3.17% | 3.55% |
Expenses net of fee waivers, if any | 2.20% | 2.20% | 2.25% | 2.25% | 2.25% |
Expenses net of all reductions | 2.19% | 2.18% | 2.23% | 2.23% | 2.23% |
Net investment income (loss) | .24% | .17% | (.01)% | .09% | .05% |
Supplemental Data | | | | | |
Net assets, end of period (000 omitted) | $ 1,116 | $ 473 | $ 581 | $ 328 | $ 642 |
Portfolio turnover rate E | 32% | 68% | 87% | 116% | 115% |
A Total returns would have been lower if certain expenses had not been reduced during the applicable periods shown.
B Total returns do not include the effect of the contingent deferred sales charge.
C Calculated based on average shares outstanding during the period.
D Fees and expenses of any underlying Fidelity Central Funds are not included in the Fund's expense ratio. The Fund indirectly bears its proportionate share of the expenses of any underlying Fidelity Central Funds.
E Amount does not include the portfolio activity of any underlying Fidelity Central Funds.
F For the period November 1, 2007 (commencement of operations) to October 31, 2008.
G Expense ratios reflect operating expenses of the class. Expenses before reductions do not reflect amounts reimbursed by the investment adviser or reductions from brokerage service arrangements or reductions from other expense offset arrangements and do not represent the amount paid by the class during periods when reimbursements or reductions occur. Expense ratios before reductions for start-up periods may not be representative of longer-term operating periods. Expenses net of fee waivers reflect expenses after reimbursement by the investment adviser but prior to reductions from brokerage service arrangements or other expense offset arrangements. Expenses net of all reductions represent the net expenses paid by the class.
H Amount represents less than $.01 per share.
See accompanying notes which are an integral part of the financial statements.
Annual Report
Financial Highlights - Class C
Years ended October 31, | 2012 | 2011 | 2010 | 2009 | 2008 F |
Selected Per-Share Data | | | | | |
Net asset value, beginning of period | $ 8.03 | $ 8.34 | $ 6.98 | $ 5.42 | $ 10.00 |
Income from Investment Operations | | | | | |
Net investment income (loss) C | .02 | .01 | - H | .01 | - H |
Net realized and unrealized gain (loss) | .80 | (.31) | 1.38 | 1.55 | (4.58) |
Total from investment operations | .82 | (.30) | 1.38 | 1.56 | (4.58) |
Distributions from net investment income | (.01) | (.01) | - | - | - |
Distributions from net realized gain | (.01) | (.01) | (.02) | - | - |
Total distributions | (.01) J | (.01) I | (.02) | - | - |
Redemption fees added to paid in capital C, H | - | - | - | - | - |
Net asset value, end of period | $ 8.84 | $ 8.03 | $ 8.34 | $ 6.98 | $ 5.42 |
Total Return A, B | 10.27% | (3.57)% | 19.82% | 28.78% | (45.80)% |
Ratios to Average Net Assets D, G | | | | | |
Expenses before reductions | 2.33% | 2.52% | 2.89% | 3.21% | 3.52% |
Expenses net of fee waivers, if any | 2.20% | 2.20% | 2.25% | 2.25% | 2.25% |
Expenses net of all reductions | 2.19% | 2.18% | 2.24% | 2.23% | 2.23% |
Net investment income (loss) | .24% | .17% | (.01)% | .09% | .05% |
Supplemental Data | | | | | |
Net assets, end of period (000 omitted) | $ 5,648 | $ 2,767 | $ 1,261 | $ 780 | $ 684 |
Portfolio turnover rate E | 32% | 68% | 87% | 116% | 115% |
A Total returns would have been lower if certain expenses had not been reduced during the applicable periods shown.
B Total returns do not include the effect of the contingent deferred sales charge.
C Calculated based on average shares outstanding during the period.
D Fees and expenses of any underlying Fidelity Central Funds are not included in the Fund's expense ratio. The Fund indirectly bears its proportionate share of the expenses of any underlying Fidelity Central Funds.
E Amount does not include the portfolio activity of any underlying Fidelity Central Funds.
F For the period November 1, 2007 (commencement of operations) to October 31, 2008.
G Expense ratios reflect operating expenses of the class. Expenses before reductions do not reflect amounts reimbursed by the investment adviser or reductions from brokerage service arrangements or reductions from other expense offset arrangements and do not represent the amount paid by the class during periods when reimbursements or reductions occur. Expense ratios before reductions for start-up periods may not be representative of longer-term operating periods. Expenses net of fee waivers reflect expenses after reimbursement by the investment adviser but prior to reductions from brokerage service arrangements or other expense offset arrangements. Expenses net of all reductions represent the net expenses paid by the class.
H Amount represents less than $.01 per share.
I Total distributions of $.01 per share is comprised of distributions from net investment income of $.008 and distributions from net realized gain of $.005 per share.
J Total distributions of $.01 per share is comprised of distributions from net investment income of $.007 and distributions from net realized gain of $.006 per share.
See accompanying notes which are an integral part of the financial statements.
Annual Report
Financial Highlights - International Growth
Years ended October 31, | 2012 | 2011 | 2010 | 2009 | 2008 E |
Selected Per-Share Data | | | | | |
Net asset value, beginning of period | $ 8.12 | $ 8.40 | $ 7.02 | $ 5.48 | $ 10.00 |
Income from Investment Operations | | | | | |
Net investment income (loss) B | .11 | .10 | .07 | .06 | .09 |
Net realized and unrealized gain (loss) | .81 | (.30) | 1.39 | 1.54 | (4.60) |
Total from investment operations | .92 | (.20) | 1.46 | 1.60 | (4.51) |
Distributions from net investment income | (.08) | (.07) | (.06) | (.06) | (.01) |
Distributions from net realized gain | (.01) | (.01) | (.03) | - | - |
Total distributions | (.09) | (.08) | (.08) H | (.06) | (.01) |
Redemption fees added to paid in capital B, G | - | - | - | - | - |
Net asset value, end of period | $ 8.95 | $ 8.12 | $ 8.40 | $ 7.02 | $ 5.48 |
Total Return A | 11.41% | (2.47)% | 20.97% | 29.77% | (45.17)% |
Ratios to Average Net Assets C, F | | | | | |
Expenses before reductions | 1.28% | 1.52% | 1.89% | 2.19% | 2.35% |
Expenses net of fee waivers, if any | 1.20% | 1.20% | 1.25% | 1.25% | 1.25% |
Expenses net of all reductions | 1.19% | 1.18% | 1.23% | 1.23% | 1.23% |
Net investment income (loss) | 1.24% | 1.17% | .99% | 1.09% | 1.05% |
Supplemental Data | | | | | |
Net assets, end of period (000 omitted) | $ 149,526 | $ 53,437 | $ 28,454 | $ 18,254 | $ 11,884 |
Portfolio turnover rate D | 32% | 68% | 87% | 116% | 115% |
A Total returns would have been lower if certain expenses had not been reduced during the applicable periods shown.
B Calculated based on average shares outstanding during the period.
C Fees and expenses of any underlying Fidelity Central Funds are not included in the Fund's expense ratio. The Fund indirectly bears its proportionate share of the expenses of any underlying Fidelity Central Funds.
D Amount does not include the portfolio activity of any underlying Fidelity Central Funds.
E For the period November 1, 2007 (commencement of operations) to October 31, 2008.
F Expense ratios reflect operating expenses of the class. Expenses before reductions do not reflect amounts reimbursed by the investment adviser or reductions from brokerage service arrangements or reductions from other expense offset arrangements and do not represent the amount paid by the class during periods when reimbursements or reductions occur. Expense ratios before reductions for start-up periods may not be representative of longer-term operating periods. Expenses net of fee waivers reflect expenses after reimbursement by the investment adviser but prior to reductions from brokerage service arrangements or other expense offset arrangements. Expenses net of all reductions represent the net expenses paid by the class.
G Amount represents less than $.01 per share.
H Total distributions of $.08 per share is comprised of distributions from net investment income of $.057 and distributions from net realized gain of $.025 per share.
See accompanying notes which are an integral part of the financial statements.
Annual Report
Financial Highlights - Institutional Class
Years ended October 31, | 2012 | 2011 | 2010 | 2009 | 2008 E |
Selected Per-Share Data | | | | | |
Net asset value, beginning of period | $ 8.12 | $ 8.40 | $ 7.02 | $ 5.48 | $ 10.00 |
Income from Investment Operations | | | | | |
Net investment income (loss) B | .10 | .10 | .07 | .06 | .09 |
Net realized and unrealized gain (loss) | .81 | (.30) | 1.39 | 1.54 | (4.60) |
Total from investment operations | .91 | (.20) | 1.46 | 1.60 | (4.51) |
Distributions from net investment income | (.08) | (.07) | (.06) | (.06) | (.01) |
Distributions from net realized gain | (.01) | (.01) | (.03) | - | - |
Total distributions | (.09) | (.08) | (.08) H | (.06) | (.01) |
Redemption fees added to paid in capital B, G | - | - | - | - | - |
Net asset value, end of period | $ 8.94 | $ 8.12 | $ 8.40 | $ 7.02 | $ 5.48 |
Total Return A | 11.28% | (2.47)% | 20.97% | 29.77% | (45.17)% |
Ratios to Average Net Assets C, F | | | | | |
Expenses before reductions | 1.27% | 1.50% | 1.92% | 2.01% | 2.56% |
Expenses net of fee waivers, if any | 1.20% | 1.20% | 1.25% | 1.25% | 1.25% |
Expenses net of all reductions | 1.19% | 1.18% | 1.23% | 1.23% | 1.23% |
Net investment income (loss) | 1.24% | 1.17% | .99% | 1.09% | 1.05% |
Supplemental Data | | | | | |
Net assets, end of period (000 omitted) | $ 3,992 | $ 493 | $ 113 | $ 36 | $ 521 |
Portfolio turnover rate D | 32% | 68% | 87% | 116% | 115% |
A Total returns would have been lower if certain expenses had not been reduced during the applicable periods shown.
B Calculated based on average shares outstanding during the period.
C Fees and expenses of any underlying Fidelity Central Funds are not included in the Fund's expense ratio. The Fund indirectly bears its proportionate share of the expenses of any underlying Fidelity Central Funds.
D Amount does not include the portfolio activity of any underlying Fidelity Central Funds.
E For the period November 1, 2007 (commencement of operations) to October 31, 2008.
F Expense ratios reflect operating expenses of the class. Expenses before reductions do not reflect amounts reimbursed by the investment adviser or reductions from brokerage service arrangements or reductions from other expense offset arrangements and do not represent the amount paid by the class during periods when reimbursements or reductions occur. Expense ratios before reductions for start-up periods may not be representative of longer-term operating periods. Expenses net of fee waivers reflect expenses after reimbursement by the investment adviser but prior to reductions from brokerage service arrangements or other expense offset arrangements. Expenses net of all reductions represent the net expenses paid by the class.
G Amount represents less than $.01 per share.
H Total distributions of $.08 per share is comprised of distributions from net investment income of $.057 and distributions from net realized gain of $.025 per share.
See accompanying notes which are an integral part of the financial statements.
Annual Report
Notes to Financial Statements
For the period ended October 31, 2012
1. Organization.
Fidelity International Growth Fund (the Fund) is a fund of Fidelity Investment Trust (the Trust) and is authorized to issue an unlimited number of shares. The Trust is registered under the Investment Company Act of 1940, as amended (the 1940 Act), as an open-end management investment company organized as a Massachusetts business trust. The Fund offers Class A, Class T, Class C, International Growth and Institutional Class shares, each of which, along with Class B shares, has equal rights as to assets and voting privileges. Effective after the close of business on September 1, 2010, Class B shares were closed to new accounts and additional purchases, except for exchanges and reinvestments. Each class has exclusive voting rights with respect to matters that affect that class. Class B shares will automatically convert to Class A shares after a holding period of seven years from the initial date of purchase. Investment income, realized and unrealized capital gains and losses, the common expenses of the Fund, and certain fund-level expense reductions, if any, are allocated on a pro-rata basis to each class based on the relative net assets of each class to the total net assets of the Fund. Each class differs with respect to transfer agent and distribution and service plan fees incurred. Certain expense reductions may also differ by class.
2. Investments in Fidelity Central Funds.
The Fund invests in Fidelity Central Funds, which are open-end investment companies available only to other investment companies and accounts managed by Fidelity Management & Research Company (FMR) and its affiliates. The Fund's Schedule of Investments lists each of the Fidelity Central Funds held as of period end, if any, as an investment of the Fund, but does not include the underlying holdings of each Fidelity Central Fund. As an Investing Fund, the Fund indirectly bears its proportionate share of the expenses of the underlying Fidelity Central Funds.
The Money Market Central Funds seek preservation of capital and current income and are managed by Fidelity Investments Money Management, Inc. (FIMM), an affiliate of FMR.
A complete unaudited list of holdings for each Fidelity Central Fund is available upon request or at the Securities and Exchange Commission (the SEC) web site at www.sec.gov. In addition, the financial statements of the Fidelity Central Funds, which are not covered by the Fund's Report of Independent Registered Public Accounting Firm, are available on the SEC web site or upon request.
Annual Report
3. Significant Accounting Policies.
The financial statements have been prepared in conformity with accounting principles generally accepted in the United States of America (GAAP), which require management to make certain estimates and assumptions at the date of the financial statements. Actual results could differ from those estimates. Subsequent events, if any, through the date that the financial statements were issued have been evaluated in the preparation of the financial statements. The following summarizes the significant accounting policies of the Fund:
Security Valuation. Investments are valued as of 4:00 p.m. Eastern time on the last calendar day of the period. In accordance with valuation policies and procedures approved by the Board of Trustees (the Board), the Fund attempts to obtain prices from one or more third party pricing vendors or brokers to value its investments. When current market prices, quotations or rates are not readily available or reliable, securities will be fair valued in good faith by the FMR Fair Value Committee (the Committee), in accordance with procedures adopted by the Fund's Board. Factors used in determining fair value vary by security type and may include market or security specific events. The frequency with which these procedures are used cannot be predicted and they may be utilized to a significant extent. The Committee oversees the Fund's valuation policies and procedures and is responsible for approving and reporting to the Board all fair value determinations.
The Fund categorizes the inputs to valuation techniques used to value its investments into a disclosure hierarchy consisting of three levels as shown below:
Level 1 - quoted prices in active markets for identical investments
Level 2 - other significant observable inputs (including quoted prices for similar investments, interest rates, prepayment speeds, etc.)
Level 3 - unobservable inputs (including the Fund's own assumptions based on the best information available)
Valuation techniques used to value the Fund's investments by major category are as follows:
Equity securities, including restricted securities, for which market quotations are readily available, are valued at the last reported sale price or official closing price as reported by a third party pricing vendor on the primary market or exchange on which they are traded and are categorized as Level 1 in the hierarchy. In the event there were no sales during the day or closing prices are not available, securities are valued at the last quoted bid price or may be valued using the last available price and are generally categorized as Level 2 in the hierarchy. For foreign equity securities, when significant market or security specific events arise, comparisons to the valuation of American Depositary Receipts
Annual Report
Notes to Financial Statements - continued
3. Significant Accounting Policies - continued
Security Valuation - continued
(ADRs), futures contracts, Exchange-Traded Funds (ETFs) and certain indexes as well as quoted prices for similar securities are used and are categorized as Level 2 in the hierarchy. Utilizing these techniques may result in transfers between Level 1 and Level 2.
Investments in open-end mutual funds, including the Fidelity Central Funds, are valued at their closing net asset value (NAV) each business day and are categorized as Level 1 in the hierarchy.
Changes in valuation techniques may result in transfers in or out of an assigned level within the disclosure hierarchy. The aggregate value of investments by input level, as of October 31, 2012, including information on transfers between Levels 1 and 2, is included at the end of the Fund's Schedule of Investments.
Foreign Currency Translation. The Fund may use foreign currency contracts to facilitate transactions in foreign-denominated securities. Gains and losses from these transactions may arise from changes in the value of the foreign currency or if the counterparties do not perform under the contracts' terms.
Foreign-denominated assets, including investment securities, and liabilities are translated into U.S. dollars at the exchange rates at period end. Purchases and sales of investment securities, income and dividends received and expenses denominated in foreign currencies are translated into U.S. dollars at the exchange rate in effect on the transaction date.
The effects of exchange rate fluctuations on investments are included with the net realized and unrealized gain (loss) on investment securities. Other foreign currency transactions resulting in realized and unrealized gain (loss) are disclosed separately.
Investment Transactions and Income. For financial reporting purposes, the Fund's investment holdings and NAV include trades executed through the end of the last business day of the period. The NAV per share for processing shareholder transactions is calculated as of the close of business of the New York Stock Exchange (NYSE), normally 4:00 p.m. Eastern time and includes trades executed through the end of the prior business day. Gains and losses on securities sold are determined on the basis of identified cost. Dividend income is recorded on the ex-dividend date, except for certain dividends from foreign securities where the ex-dividend date may have passed, which are recorded as soon as the Fund is informed of the ex-dividend date. Non-cash dividends included in dividend income, if any, are recorded at the fair market value of the securities received. Interest income and distributions from the Fidelity Central Funds are accrued as earned. Interest income includes coupon interest and amortization of premium and accretion of discount on debt securities. Investment income is recorded net of foreign taxes withheld where recovery of such taxes is uncertain.
Annual Report
3. Significant Accounting Policies - continued
Expenses. Expenses directly attributable to a fund are charged to that fund. Expenses attributable to more than one fund are allocated among the respective funds on the basis of relative net assets or other appropriate methods. Expense estimates are accrued in the period to which they relate and adjustments are made when actual amounts are known.
Income Tax Information and Distributions to Shareholders. Each year, the Fund intends to qualify as a regulated investment company under Subchapter M of the Internal Revenue Code, including distributing substantially all of its taxable income and realized gains. As a result, no provision for income taxes is required. As of October 31, 2012, the Fund did not have any unrecognized tax benefits in the financial statements; nor is the Fund aware of any tax positions for which it is reasonably possible that the total amounts of unrecognized tax benefits will significantly change in the next twelve months. The Fund files a U.S. federal tax return, in addition to state and local tax returns as required. A fund's federal income tax returns are subject to examination by the Internal Revenue Service (IRS) for a period of three fiscal years after they are filed. State and local tax returns may be subject to examination for an additional fiscal year depending on the jurisdiction. Foreign taxes are provided for based on the Fund's understanding of the tax rules and rates that exist in the foreign markets in which it invests.
Distributions are declared and recorded on the ex-dividend date. Income dividends and capital gain distributions are declared separately for each class. Income and capital gain distributions are determined in accordance with income tax regulations, which may differ from GAAP.
Capital accounts within the financial statements are adjusted for permanent book-tax differences. These adjustments have no impact on net assets or the results of operations. Temporary book-tax differences will reverse in a subsequent period.
Book-tax differences are primarily due to foreign currency transactions, passive foreign investment companies (PFIC), partnerships, capital loss carryforwards and losses deferred due to wash sales.
The federal tax cost of investment securities and unrealized appreciation (depreciation) as of period end were as follows:
Gross unrealized appreciation | $ 16,586,724 |
Gross unrealized depreciation | (6,916,202) |
Net unrealized appreciation (depreciation) on securities and other investments | $ 9,670,522 |
| |
Tax Cost | $ 192,376,923 |
Annual Report
Notes to Financial Statements - continued
3. Significant Accounting Policies - continued
Income Tax Information and Distributions to Shareholders - continued
The tax-based components of distributable earnings as of period end were as follows:
Undistributed ordinary income | $ 1,436,227 |
Capital loss carryforward | $ (5,633,645) |
Net unrealized appreciation (depreciation) | $ 9,663,146 |
Capital loss carryforwards are only available to offset future capital gains of the Fund to the extent provided by regulations and may be limited. Under the Regulated Investment Company Modernization Act of 2010 (the Act), the Fund is permitted to carry forward capital losses incurred in taxable years beginning after December 22, 2010 for an unlimited period and such capital losses are required to be used prior to any losses that expire. Capital loss carryforwards were as follows:
Fiscal year of expiration | |
2016 | $ (1,819,472) |
2017 | (2,797,799) |
Total with expiration | (4,617,271) |
No expiration | |
Short-term | (1,016,374) |
Total capital loss carryforward | $ (5,633,645) |
The tax character of distributions paid was as follows:
| October 31, 2012 | October 31, 2011 |
Ordinary Income | $ 643,383 | $ 324,699 |
Short-Term Trading (Redemption) Fees. Shares held by investors in the Fund less than 30 days are subject to a redemption fee equal to 1.00% of the net asset value of shares redeemed. All redemption fees, which reduce the proceeds of the shareholder redemption, are retained by the Fund and accounted for as an addition to paid in capital.
New Accounting Pronouncement. In December 2011, the Financial Accounting Standards Board issued Accounting Standard Update No. 2011-11, Disclosures about Offsetting Assets and Liabilities. The update creates new disclosure requirements requiring entities to disclose both gross and net information for derivatives and other financial instruments that are either offset in the Statement of Assets and Liabilities or subject to an enforceable master netting arrangement or similar agreement. The disclosure requirements are effective for annual reporting periods beginning on or after January 1, 2013, and interim periods within those annual periods. Management is
Annual Report
3. Significant Accounting Policies - continued
New Accounting Pronouncement - continued
currently evaluating the impact of the update's adoption on the Fund's financial statement disclosures.
4. Purchases and Sales of Investments.
Purchases and sales of securities, other than short-term securities, aggregated $152,600,135 and $37,480,345, respectively.
5. Fees and Other Transactions with Affiliates.
Management Fee. FMR and its affiliates provide the Fund with investment management related services for which the Fund pays a monthly management fee. The management fee is the sum of an individual fund fee rate that is based on an annual rate of .45% of the Fund's average net assets and an annualized group fee rate that averaged .26% during the period. The group fee rate is based upon the average net assets of all the mutual funds advised by FMR. The group fee rate decreases as assets under management increase and increases as assets under management decrease. In addition, the management fee is subject to a performance adjustment (up to a maximum of ± .20% of the Fund's average net assets over a 36 month performance period). The upward or downward adjustment to the management fee is based on the relative investment performance of International Growth as compared to an appropriate benchmark index. For the period, the total annual management fee rate, including the performance adjustment, was .79% of the Fund's average net assets.
Distribution and Service Plan Fees. In accordance with Rule 12b-1 of the 1940 Act, the Fund has adopted separate Distribution and Service Plans for each class of shares. Certain classes pay Fidelity Distributors Corporation (FDC), an affiliate of FMR, separate Distribution and Service Fees, each of which is based on an annual percentage of each class' average net assets. In addition, FDC may pay financial intermediaries for selling shares of the Fund and providing shareholder support services. For the period, the Distribution and Service Fee rates, total fees and amounts retained by FDC were as follows:
| Distribution
Fee | Service
Fee | Total Fees | Retained
by FDC |
Class A | -% | .25% | $ 27,055 | $ 698 |
Class T | .25% | .25% | 25,571 | 121 |
Class B | .75% | .25% | 6,002 | 4,531 |
Class C | .75% | .25% | 37,660 | 12,092 |
| | | $ 96,288 | $ 17,442 |
Annual Report
Notes to Financial Statements - continued
5. Fees and Other Transactions with Affiliates - continued
Sales Load. FDC may receive a front-end sales charge of up to 5.75% for selling Class A shares and 3.50% for selling Class T shares, some of which is paid to financial intermediaries for selling shares of the Fund. Depending on the holding period, FDC may receive contingent deferred sales charges levied on Class A, Class T, Class B, and Class C redemptions. The deferred sales charges range from 5.00% to 1.00% for Class B shares, 1.00% for Class C shares, 1.00% for certain purchases of Class A shares and .25% for certain purchases of Class T shares.
For the period, sales charge amounts retained by FDC were as follows:
| Retained
by FDC |
Class A | $ 15,825 |
Class T | 3,545 |
Class B* | 1,058 |
Class C* | 1,676 |
| $ 22,104 |
* When Class B and Class C shares are initially sold, FDC pays commissions from its own resources to financial intermediaries through which the sales are made.
Transfer Agent Fees. Fidelity Investments Institutional Operations Company, Inc. (FIIOC), an affiliate of FMR, is the transfer, dividend disbursing and shareholder servicing agent for each class of the Fund. FIIOC receives account fees and asset-based fees that vary according to the account size and type of account of the shareholders of the respective classes of the Fund. FIIOC pays for typesetting, printing and mailing of shareholder reports, except proxy statements. For the period, transfer agent fees for each class were as follows:
| Amount | % of
Average
Net Assets |
Class A | $ 32,331 | .30 |
Class T | 16,359 | .32 |
Class B | 1,802 | .30 |
Class C | 11,442 | .30 |
International Growth | 258,582 | .27 |
Institutional Class | 4,613 | .25 |
| $ 325,129 | |
Annual Report
5. Fees and Other Transactions with Affiliates - continued
Accounting and Security Lending Fees. Fidelity Service Company, Inc. (FSC), an affiliate of FMR, maintains the Fund's accounting records. The accounting fee is based on the level of average net assets for each month. Under a separate contract, FSC administers the security lending program. The security lending fee is based on the number and duration of lending transactions.
Brokerage Commissions. The Fund placed a portion of its portfolio transactions with brokerage firms which are affiliates of the investment adviser. The commissions paid to these affiliated firms were $375 for the period.
6. Committed Line of Credit.
The Fund participates with other funds managed by FMR or an affiliate in a $4.25 billion credit facility (the "line of credit") to be utilized for temporary or emergency purposes to fund shareholder redemptions or for other short-term liquidity purposes. The Fund has agreed to pay commitment fees on its pro-rata portion of the line of credit, which amounted to $289 and is reflected in Miscellaneous expenses on the Statement of Operations. During the period, there were no borrowings on this line of credit.
7. Security Lending.
The Fund lends portfolio securities through a lending agent from time to time in order to earn additional income. For equity securities, a lending agent is used and may loan securities to certain qualified borrowers, including Fidelity Capital Markets (FCM), a broker-dealer affiliated with the Fund. On the settlement date of the loan, the Fund receives collateral (in the form of U.S. Treasury obligations, letters of credit and/or cash) against the loaned securities and maintains collateral in an amount not less than 100% of the market value of the loaned securities during the period of the loan. The market value of the loaned securities is determined at the close of business of the Fund and any additional required collateral is delivered to the Fund on the next business day. If the borrower defaults on its obligation to return the securities loaned because of insolvency or other reasons, a fund could experience delays and costs in recovering the securities loaned or in gaining access to the collateral. Any cash collateral received is invested in the Fidelity Securities Lending Cash Central Fund. The value of loaned securities and cash collateral at period end are disclosed on the Fund's Statement of Assets and Liabilities. Security lending income represents the income earned on investing cash collateral, less rebates paid to borrowers and any lending agent fees associated with the loan, plus any premium payments received for lending certain types of securities. Security lending income is presented in the Statement of Operations as a component of income from Fidelity Central Funds. Total security lending income during the period amounted to $56,903. During the period, there were no securities loaned to FCM.
Annual Report
Notes to Financial Statements - continued
8. Expense Reductions.
FMR contractually agreed to reimburse each class to the extent annual operating expenses exceeded certain levels of average net assets as noted in the table below. This reimbursement will remain in place through December 31, 2013. Some expenses, for example interest expense, including commitment fees, are excluded from this reimbursement.
The following classes were in reimbursement during the period:
| Expense
Limitations | Reimbursement
from adviser |
Class A | 1.45% | $ 13,952 |
Class T | 1.70% | 7,830 |
Class B | 2.20% | 897 |
Class C | 2.20% | 4,960 |
International Growth | 1.20% | 82,095 |
Institutional Class | 1.20% | 1,177 |
| | $ 110,911 |
Many of the brokers with whom FMR places trades on behalf of the Fund provided services to the Fund in addition to trade execution. These services included payments of certain expenses on behalf of the Fund totaling $15,575 for the period. In addition, through arrangements with the Fund's custodian, credits realized as a result of uninvested cash balances were used to reduce the Fund's expenses. During the period, these credits reduced the Fund's custody expenses by $43.
9. Distributions to Shareholders.
Distributions to shareholders of each class were as follows:
Years ended October 31, | 2012 | 2011 |
From net investment income | | |
Class A | $ 50,503 | $ 19,878 |
Class T | 18,666 | 5,087 |
Class B | - | 545 |
Class C | 2,205 | 1,547 |
International Growth | 516,958 | 247,117 |
Institutional Class | 6,406 | 2,184 |
Total | $ 594,738 | $ 276,358 |
Annual Report
9. Distributions to Shareholders - continued
Years ended October 31, | 2012 | 2011 |
From net realized gain | | |
Class A | $ 4,810 | $ 4,255 |
Class T | 2,196 | 1,455 |
Class B | - | 211 |
Class C | 1,890 | 826 |
International Growth | 39,262 | 41,245 |
Institutional Class | 487 | 349 |
Total | $ 48,645 | $ 48,341 |
10. Share Transactions.
Transactions for each class of shares were as follows:
| Shares | Dollars |
Years ended October 31, | 2012 | 2011 | 2012 | 2011 |
Class A | | | | |
Shares sold | 1,901,699 | 547,911 | $ 16,560,116 | $ 4,762,829 |
Reinvestment of distributions | 5,422 | 2,679 | 42,831 | 22,867 |
Shares redeemed | (236,851) | (133,581) | (2,015,265) | (1,142,023) |
Net increase (decrease) | 1,670,270 | 417,009 | $ 14,587,682 | $ 3,643,673 |
Class T | | | | |
Shares sold | 941,446 | 292,221 | $ 8,178,600 | $ 2,542,402 |
Reinvestment of distributions | 2,626 | 762 | 20,742 | 6,516 |
Shares redeemed | (102,766) | (55,432) | (866,637) | (470,382) |
Net increase (decrease) | 841,306 | 237,551 | $ 7,332,705 | $ 2,078,536 |
Class B | | | | |
Shares sold | 92,865 | 22,762 | $ 806,549 | $ 193,446 |
Reinvestment of distributions | - | 78 | - | 670 |
Shares redeemed | (25,954) | (33,639) | (218,180) | (282,311) |
Net increase (decrease) | 66,911 | (10,799) | $ 588,369 | $ (88,195) |
Class C | | | | |
Shares sold | 400,291 | 258,483 | $ 3,375,948 | $ 2,202,762 |
Reinvestment of distributions | 510 | 274 | 4,026 | 2,357 |
Shares redeemed | (106,475) | (65,559) | (879,489) | (555,739) |
Net increase (decrease) | 294,326 | 193,198 | $ 2,500,485 | $ 1,649,380 |
International Growth | | | | |
Shares sold | 13,301,892 | 5,799,026 | $ 114,028,412 | $ 50,047,832 |
Reinvestment of distributions | 68,821 | 33,184 | 544,378 | 283,553 |
Shares redeemed | (3,238,606) | (2,639,092) | (27,713,258) | (22,190,157) |
Net increase (decrease) | 10,132,107 | 3,193,118 | $ 86,859,532 | $ 28,141,228 |
Annual Report
Notes to Financial Statements - continued
10. Share Transactions - continued
| Shares | Dollars |
Years ended October 31, | 2012 | 2011 | 2012 | 2011 |
Institutional Class | | | | |
Shares sold | 438,656 | 76,126 | $ 3,841,370 | $ 670,433 |
Reinvestment of distributions | 655 | 292 | 5,178 | 2,491 |
Shares redeemed | (53,696) | (29,187) | (443,499) | (256,318) |
Net increase (decrease) | 385,615 | 47,231 | $ 3,403,049 | $ 416,606 |
11. Other.
The Fund's organizational documents provide former and current trustees and officers with a limited indemnification against liabilities arising in connection with the performance of their duties to the Fund. In the normal course of business, the Fund may also enter into contracts that provide general indemnifications. The Fund's maximum exposure under these arrangements is unknown as this would be dependent on future claims that may be made against the Fund. The risk of material loss from such claims is considered remote.
At the end of the period, Fidelity VIP FundsManager 60% Portfolio was the owner of record of approximately 10% of the total outstanding shares of the Fund.
Annual Report
To the Trustees of Fidelity Investment Trust and the Shareholders of Fidelity International Growth Fund:
In our opinion, the accompanying statement of assets and liabilities, including the schedule of investments, and the related statements of operations and of changes in net assets and the financial highlights present fairly, in all material respects, the financial position of Fidelity International Growth Fund (a fund of Fidelity Investment Trust) at October 31, 2012, the results of its operations for the year then ended, the changes in its net assets for each of the two years in the period then ended and the financial highlights for each of the periods indicated, in conformity with accounting principles generally accepted in the United States of America. These financial statements and financial highlights (hereafter referred to as "financial statements") are the responsibility of the Fidelity International Growth Fund's management. Our responsibility is to express an opinion on these financial statements based on our audits. We conducted our audits of these financial statements in accordance with the standards of the Public Company Accounting Oversight Board (United States). Those standards require that we plan and perform the audit to obtain reasonable assurance about whether the financial statements are free of material misstatement. An audit includes examining, on a test basis, evidence supporting the amounts and disclosures in the financial statements, assessing the accounting principles used and significant estimates made by management, and evaluating the overall financial statement presentation. We believe that our audits, which included confirmation of securities at October 31, 2012 by correspondence with the custodian and brokers, provide a reasonable basis for our opinion.
PricewaterhouseCoopers LLP
Boston, Massachusetts
December 14, 2012
Annual Report
The Trustees, Members of the Advisory Board, and executive officers of the trust and fund, as applicable, are listed below. The Board of Trustees governs the fund and is responsible for protecting the interests of shareholders. The Trustees are experienced executives who meet periodically throughout the year to oversee the fund's activities, review contractual arrangements with companies that provide services to the fund, oversee management of the risks associated with such activities and contractual arrangements, and review the fund's performance. Except for James C. Curvey, each of the Trustees oversees 236 funds advised by FMR or an affiliate. Mr. Curvey oversees 443 funds advised by FMR or an affiliate.
The Trustees hold office without limit in time except that (a) any Trustee may resign; (b) any Trustee may be removed by written instrument, signed by at least two-thirds of the number of Trustees prior to such removal; (c) any Trustee who requests to be retired or who has become incapacitated by illness or injury may be retired by written instrument signed by a majority of the other Trustees; and (d) any Trustee may be removed at any special meeting of shareholders by a two-thirds vote of the outstanding voting securities of the trust. Each Trustee who is not an interested person (as defined in the 1940 Act) (Independent Trustee), shall retire not later than the last day of the calendar year in which his or her 75th birthday occurs. The Independent Trustees may waive this mandatory retirement age policy with respect to individual Trustees. The executive officers and Advisory Board Members hold office without limit in time, except that any officer and Advisory Board Member may resign or may be removed by a vote of a majority of the Trustees at any regular meeting or any special meeting of the Trustees. Except as indicated, each individual has held the office shown or other offices in the same company for the past five years.
Experience, Skills, Attributes, and Qualifications of the Fund's Trustees. The Governance and Nominating Committee has adopted a statement of policy that describes the experience, qualifications, attributes, and skills that are necessary and desirable for potential Independent Trustee candidates (Statement of Policy). The Board believes that each Trustee satisfied at the time he or she was initially elected or appointed a Trustee, and continues to satisfy, the standards contemplated by the Statement of Policy. The Governance and Nominating Committee also engages professional search firms to help identify potential Independent Trustee candidates who have the experience, qualifications, attributes, and skills consistent with the Statement of Policy. From time to time, additional criteria based on the composition and skills of the current Independent Trustees, as well as experience or skills that may be appropriate in light of future changes to board composition, business conditions, and regulatory or other developments, have also been considered by the professional search firms and the Governance and Nominating Committee. In addition, the Board takes into account the Trustees' commitment and participation in Board and committee meetings, as well as their leadership of standing and ad hoc committees throughout their tenure.
In determining that a particular Trustee was and continues to be qualified to serve as a Trustee, the Board has considered a variety of criteria, none of which, in isolation, was controlling. The Board believes that, collectively, the Trustees have balanced and diverse experience, qualifications, attributes, and skills, which allow the Board to operate effectively in governing the fund and protecting the interests of shareholders. Information about the specific experience, skills, attributes, and qualifications of each Trustee, which in each case led to the Board's conclusion that the Trustee should serve (or continue to serve) as a trustee of the fund, is provided below.
Annual Report
Trustees and Officers - continued
Board Structure and Oversight Function. James C. Curvey is an interested person (as defined in the 1940 Act) and currently serves as Chairman. The Trustees have determined that an interested Chairman is appropriate and benefits shareholders because an interested Chairman has a personal and professional stake in the quality and continuity of services provided to the fund. Independent Trustees exercise their informed business judgment to appoint an individual of their choosing to serve as Chairman, regardless of whether the Trustee happens to be independent or a member of management. The Independent Trustees have determined that they can act independently and effectively without having an Independent Trustee serve as Chairman and that a key structural component for assuring that they are in a position to do so is for the Independent Trustees to constitute a substantial majority for the Board. The Independent Trustees also regularly meet in executive session. Ned C. Lautenbach serves as Chairman of the Independent Trustees and as such (i) acts as a liaison between the Independent Trustees and management with respect to matters important to the Independent Trustees and (ii) with management prepares agendas for Board meetings.
Fidelity funds are overseen by different Boards of Trustees. The fund's Board oversees Fidelity's equity and high income funds and another Board oversees Fidelity's investment-grade bond, money market, and asset allocation funds. The asset allocation funds may invest in Fidelity funds overseen by the fund's Board. The use of separate Boards, each with its own committee structure, allows the Trustees of each group of Fidelity funds to focus on the unique issues of the funds they oversee, including common research, investment, and operational issues. On occasion, the separate Boards establish joint committees to address issues of overlapping consequences for the Fidelity funds overseen by each Board.
The Trustees operate using a system of committees to facilitate the timely and efficient consideration of all matters of importance to the Trustees, the fund, and fund shareholders and to facilitate compliance with legal and regulatory requirements and oversight of the fund's activities and associated risks. The Board, acting through its committees, has charged FMR and its affiliates with (i) identifying events or circumstances the occurrence of which could have demonstrably adverse effects on the fund's business and/or reputation; (ii) implementing processes and controls to lessen the possibility that such events or circumstances occur or to mitigate the effects of such events or circumstances if they do occur; and (iii) creating and maintaining a system designed to evaluate continuously business and market conditions in order to facilitate the identification and implementation processes described in (i) and (ii) above. Because the day-to-day operations and activities of the fund are carried out by or through FMR, its affiliates and other service providers, the fund's exposure to risks is mitigated but not eliminated by the processes overseen by the Trustees. While each of the Board's committees has responsibility for overseeing different aspects of the fund's activities, oversight is exercised primarily through the Operations, Audit, and Compliance Committees. In addition, the Independent Trustees have worked with FMR to enhance the Board's oversight of investment and financial risks, legal and regulatory risks, technology risks, and operational risks, including the development of additional risk reporting to the Board. For example, a working group comprised of Independent Trustees and FMR has worked and continues to work to review the Fidelity funds' valuation-related activities, reporting and risk management. Appropriate personnel, including but not limited to the fund's Chief Compliance Officer (CCO), FMR's internal auditor, the independent accountants, the fund's Treasurer and portfolio management personnel, make periodic reports to the Board's committees, as appropriate, including an annual review of FMR's risk management program for the Fidelity funds. The responsibilities of each standing committee, including their oversight responsibilities, are described further under "Standing Committees of the Fund's Trustees."
Annual Report
The fund's Statement of Additional Information (SAI) includes more information about the Trustees. To request a free copy, call Fidelity at 1-877-208-0098.
Interested Trustees*:
Correspondence intended for each Trustee who is an interested person may be sent to Fidelity Investments, 82 Devonshire Street, Boston, Massachusetts 02109.
Name, Age; Principal Occupations and Other Relevant Experience+ |
James C. Curvey (77) |
| Year of Election or Appointment: 2007 Mr. Curvey is Trustee and Chairman of the Board of Trustees of certain Trusts. Mr. Curvey also serves as Trustee (2007-present) of other investment companies advised by FMR. Mr. Curvey is a Director of Fidelity Investments Money Management, Inc. (2009-present), Director of Fidelity Research & Analysis Co. (2009-present) and Director of FMR and FMR Co., Inc. (2007-present). Mr. Curvey is also Vice Chairman (2007-present) and Director of FMR LLC. In addition, Mr. Curvey serves as an Overseer for the Boston Symphony Orchestra and a member of the Trustees of Villanova University. Previously, Mr. Curvey was the Vice Chairman (2006-2007) and Director (2000-2007) of FMR Corp. |
Ronald P. O'Hanley (55) |
| Year of Election or Appointment: 2011 Mr. O'Hanley is Director of FMR Co., Inc. (2010-present), Director of Fidelity Investments Money Management, Inc. (2010-present), Director of Fidelity Research & Analysis Company (2010-present), President of Fidelity Asset Management and Corporate Services and a member of Fidelity's Executive Committee (2010-present). Previously, Mr. O'Hanley served as President and Chief Executive Officer of BNY Mellon Asset Management (2007-2010). Mr. O'Hanley also served as Vice Chairman of Bank New York Mellon Corp. and a member of that firm's Executive Committee. Prior to the 2007 merger of The Bank of New York and Mellon Financial Corporation, he was Vice Chairman of Mellon Financial Corporation and President and Chief Executive Officer of Mellon Asset Management. He joined Mellon in February 1997. Mr. O'Hanley currently serves as Chairman of the Boston Public Library Foundation Board of Directors and sits on the Board of Directors of Beth Israel Deaconess Medical Center, the Board of Trustees of the Marine Biological Laboratory and the Advisory Board of the Maxwell School of Citizenship and Public Administration at Syracuse University. Mr. O'Hanley also chairs the Council on Asset Management for the Financial Services Roundtable and is a member of the Board of Directors of Institutional Investor's U.S. Institute. |
* Trustees have been determined to be "Interested Trustees" by virtue of, among other things, their affiliation with the trust or various entities under common control with FMR.
+ The information above includes each Trustee's principal occupation during the last five years and other information relating to the experience, attributes, and skills relevant to each Trustee's qualifications to serve as a Trustee, which led to the conclusion that each Trustee should serve as a Trustee for the fund.
Annual Report
Independent Trustees:
Correspondence intended for each Independent Trustee (that is, the Trustees other than the Interested Trustees) may be sent to Fidelity Investments, P.O. Box 55235, Boston, Massachusetts 02205-5235.
Name, Age; Principal Occupations and Other Relevant Experience+ |
Dennis J. Dirks (64) |
| Year of Election or Appointment: 2005 Prior to his retirement in May 2003, Mr. Dirks was Chief Operating Officer and a member of the Board of The Depository Trust & Clearing Corporation (DTCC). He also served as President, Chief Operating Officer, and Board member of The Depository Trust Company (DTC) and President and Board member of the National Securities Clearing Corporation (NSCC). In addition, Mr. Dirks served as Chief Executive Officer and Board member of the Government Securities Clearing Corporation, Chief Executive Officer and Board member of the Mortgage-Backed Securities Clearing Corporation, as a Trustee and a member of the Finance Committee of Manhattan College (2005-2008), and as a Trustee and a member of the Finance Committee of AHRC of Nassau County (2006-2008). Mr. Dirks is a member of the Independent Directors Council (IDC) Governing Council (2010-present) and Board of Directors for The Brookville Center for Children's Services, Inc. (2009-present). |
Alan J. Lacy (59) |
| Year of Election or Appointment: 2008 Mr. Lacy serves as Senior Adviser (2007-present) of Oak Hill Capital Partners, L.P. (private equity). Mr. Lacy also served as Chief Executive Officer (2000-2005) and Vice Chairman (2005-2006) of Sears Holdings Corporation and Sears, Roebuck and Co. (retail). In addition, Mr. Lacy serves as a member of the Board of Directors of Dave & Buster's Entertainment, Inc. (restaurant and entertainment complexes, 2010-present), Earth Fare, Inc. (retail grocery, 2012-present), The Hillman Companies, Inc. (hardware wholesalers, 2010-present), and Bristol-Myers Squibb Company (global pharmaceuticals, 2008-present). Mr. Lacy is a member of the Board of Trustees of The National Parks Conservation Association (2006-present). Previously, Mr. Lacy served as Chairman of the Board of Trustees of the National Parks Conservation Association (2008-2011) and as a member of the Board of Directors for the Western Union Company (global money transfer, 2006-2011). |
Ned C. Lautenbach (68) |
| Year of Election or Appointment: 2000 Mr. Lautenbach is Chairman of the Independent Trustees of the Equity and High Income Funds (2006-present). Mr. Lautenbach currently serves as the Lead Director of the Eaton Corporation Board of Directors (diversified industrial, 1997-present). Mr. Lautenbach is Chairman of the Board of Directors of the Philharmonic Center for the Arts in Naples, Florida (2012-present) and a member of the Council on Foreign Relations (1994-present). Previously, Mr. Lautenbach was a Partner/Advisory Partner at Clayton, Dubilier & Rice, LLC (private equity investment, 1998-2010), as well as a Director of Sony Corporation (2006-2007). |
Joseph Mauriello (68) |
| Year of Election or Appointment: 2008 Prior to his retirement in January 2006, Mr. Mauriello served in numerous senior management positions including Deputy Chairman and Chief Operating Officer (2004-2005), and Vice Chairman of Financial Services (2002-2004) of KPMG LLP US (professional services, 1965-2005). Mr. Mauriello currently serves as a member of the Board of Directors of XL Group plc. (global insurance and re-insurance, 2006-present). Previously, Mr. Mauriello served as a Director of the Hamilton Funds of the Bank of New York (2006-2007) and of Arcadia Resources Inc. (health care services and products, 2007-2012). |
Robert W. Selander (62) |
| Year of Election or Appointment: 2011 Previously, Mr. Selander served as a Member of the Advisory Board of Fidelity's Equity and High Income Funds (2011), Executive Vice Chairman (2010), Chief Executive Officer (2009-2010), and President and Chief Executive Officer (1997-2009) of Mastercard, Inc. |
Cornelia M. Small (68) |
| Year of Election or Appointment: 2005 Ms. Small is a member of the Board of Directors (2009-present) and Chair of the Investment Committee (2010-present) of the Teagle Foundation. Ms. Small also serves on the Investment Committee of the Berkshire Taconic Community Foundation (2008-present). Previously, Ms. Small served as Chairperson (2002-2008) and a member of the Investment Committee and Chairperson (2008-2012) and a member of the Board of Trustees of Smith College. In addition, Ms. Small served as Chief Investment Officer, Director of Global Equity Investments, and a member of the Board of Directors of Scudder, Stevens & Clark and Scudder Kemper Investments. |
William S. Stavropoulos (73) |
| Year of Election or Appointment: 2001 Mr. Stavropoulos is Vice Chairman of the Independent Trustees of the Equity and High Income Funds (2006-present). Mr. Stavropoulos serves as President and Founder of the Michigan Baseball Foundation, the Great Lakes Loons (2007-present). Mr. Stavropoulos is Chairman Emeritus of the Board of Directors of The Dow Chemical Company, where he previously served in numerous senior management positions, including President, CEO (1995-2000; 2002-2004), Chairman of the Executive Committee (2000-2006), and as a member of the Board of Directors (1990-2006). Currently, Mr. Stavropoulos is a Director of Univar Inc. (global distributor of commodity and specialty chemicals, Chairman from 2010-May 2012 and Lead Director from May 2012-present), Teradata Corporation (data warehousing and technology solutions, 2008-present), Maersk Inc. (industrial conglomerate), and Tyco International, Ltd. (multinational manufacturing and services, 2007-present), and a member of the Advisory Board for Metalmark Capital LLC (private equity investment, 2005-present). Mr. Stavropoulos is an operating advisor to Clayton, Dubilier & Rice, LLC (private equity investment). In addition, Mr. Stavropoulos is a member of the University of Notre Dame Advisory Council for the College of Science, a Trustee of the Rollin L. Gerstacker Foundation, and a Director of the Naples Philharmonic Center for the Arts. Previously, Mr. Stavropoulos served as a Director of Chemical Financial Corporation (bank holding company, 1993-2012). |
David M. Thomas (63) |
| Year of Election or Appointment: 2008 Previously, Mr. Thomas served as Executive Chairman (2005-2006) and Chairman and Chief Executive Officer (2000-2005) of IMS Health, Inc. (pharmaceutical and healthcare information solutions), and a Director of Fortune Brands, Inc. (consumer products, 2000-2011). In addition, Mr. Thomas serves as Non-Executive Chairman of the Board of Directors of Fortune Brands Home and Security (home and security products, 2011-present), and as a member of the Board of Directors of Interpublic Group of Companies, Inc. (marketing communication, 2004-present). |
Michael E. Wiley (62) |
| Year of Election or Appointment: 2008 Mr. Wiley also serves as a Director of Asia Pacific Exploration Consolidated (international oil and gas exploration and production, 2008-present). Mr. Wiley serves as a Director of Tesoro Corporation (independent oil refiner and marketer, 2005-present), and a Director of Bill Barrett Corporation (exploration and production, 2005-present). In addition, Mr. Wiley also serves as a Director of Post Oak Bank (privately-held bank, 2004-present). Previously, Mr. Wiley served as a member of the Board of Trustees of the University of Tulsa (2000-2006; 2007-2010), as a Senior Energy Advisor of Katzenbach Partners, LLC (consulting, 2006-2007), as an Advisory Director of Riverstone Holdings (private investment), Chairman, President, and CEO of Baker Hughes, Inc. (oilfield services, 2000-2004), and as Director of Spinnaker Exploration Company (exploration and production, 2001-2005). |
+ The information above includes each Trustee's principal occupation during the last five years and other information relating to the experience, attributes, and skills relevant to each Trustee's qualifications to serve as a Trustee, which led to the conclusion that each Trustee should serve as a Trustee for the fund.
Advisory Board Members and Executive Officers:
Correspondence intended for David A. Rosow and Garnett A. Smith may be sent to Fidelity Investments, P.O. Box 55235, Boston, Massachusetts 02205-5235. Correspondence intended for each executive officer, Edward C. Johnson 3d and Peter S. Lynch may be sent to Fidelity Investments, 82 Devonshire Street, Boston, Massachusetts 02109.
Name, Age; Principal Occupation |
Edward C. Johnson 3d (82) |
| Year of Election or Appointment: 2011 Member of the Advisory Board of Fidelity's Equity and High Income Funds. Mr. Johnson serves as Chief Executive Officer, Chairman, and a Director of FMR LLC, and also serves as Chairman and Director of FIL Limited. Previously, Mr. Johnson served as a Trustee and Chairman of the Board of certain Fidelity Trusts, Chairman and a Director of FMR, Chairman and a Director of FMR Co., Inc., and President of FMR LLC (2006-2007). |
Peter S. Lynch (68) |
| Year of Election or Appointment: 2003 Member of the Advisory Board of Fidelity's Equity and High Income Funds. Mr. Lynch is Vice Chairman and a Director of FMR and FMR Co., Inc. In addition, Mr. Lynch serves as a Trustee of Boston College and as the Chairman of the Inner-City Scholarship Fund. Previously, Mr. Lynch served on the Special Olympics International Board of Directors (1997-2006). |
David A. Rosow (70) |
| Year of Election or Appointment: 2012 Member of the Advisory Board of Fidelity's Equity and High Income Funds. Chairman and Chief Executive Officer of International Golf Group, Inc. (golf course development, 1989-present). Previously, Mr. Rosow served as Chairman and Chief Executive Officer of Rosow & Company, Inc. (private investment company, 1989-2011), a Lead Director of Hudson United Bancorp (2001-2006) and as a Director of TD Banknorth (1996-2006). In addition, Mr. Rosow is a member (2008-present) and President (2009-present) of the Town Council of Palm Beach, Florida. |
Garnett A. Smith (65) |
| Year of Election or Appointment: 2012 Member of the Advisory Board of Fidelity's Equity and High Income Funds. Prior to Mr. Smith's retirement, he served as Chairman and Chief Executive Officer of Inbrand Corp. (manufacturer of personal absorbent products, 1990-1997). He also served as President (1986-1990) of Inbrand Corp. Prior to his employment with Inbrand Corp., he was employed by a retail fabric chain and North Carolina National Bank. In addition, Mr. Smith is a board member of the Jackson Hole Land Trust (2009-present). |
Kenneth B. Robins (43) |
| Year of Election or Appointment: 2008 President and Treasurer of Fidelity's Equity and High Income Funds. Mr. Robins also serves as President and Treasurer (2010-present) and Assistant Treasurer (2009-present) of other Fidelity funds and is an employee of Fidelity Investments (2004-present). Previously, Mr. Robins served as Deputy Treasurer of the Fidelity funds (2005-2008) and Treasurer and Chief Financial Officer of The North Carolina Capital Management Trust: Cash and Term Portfolios (2006-2008). |
Bruce T. Herring (47) |
| Year of Election or Appointment: 2006 Vice President of certain Equity Funds. Mr. Herring also serves as President of Fidelity Research & Analysis Company (2010-present), Chief Investment Officer and Director of Fidelity Management & Research (U.K.) Inc. (2010-present) and Group Chief Investment Officer of FMR. Previously, Mr. Herring served as Vice President (2005-2006) and Senior Vice President (2006-2007) of Fidelity Management & Research Company, Vice President of FMR Co., Inc. (2001-2007) and as a portfolio manager for Fidelity U.S. Equity Funds. |
Brian B. Hogan (48) |
| Year of Election or Appointment: 2009 Vice President of Equity and High Income Funds. Mr. Hogan also serves as President of FMR's Equity Division (2009-present). Previously, Mr. Hogan served as Senior Vice President, Equity Research of FMR (2006-2009) and as a portfolio manager. |
Scott C. Goebel (44) |
| Year of Election or Appointment: 2008 Secretary and Chief Legal Officer (CLO) of the Fidelity funds. Mr. Goebel also serves as Secretary of Fidelity Investments Money Management, Inc. (FIMM) (2010-present) and Fidelity Research and Analysis Company (FRAC) (2010-present); Secretary and CLO of The North Carolina Capital Management Trust: Cash and Term Portfolios (2008-present); General Counsel, Secretary, and Senior Vice President of FMR (2008-present) and FMR Co., Inc. (2008-present); employed by FMR LLC or an affiliate (2001-present); Chief Legal Officer of Fidelity Management & Research (Hong Kong) Limited (2008-present) and Assistant Secretary of Fidelity Management & Research (Japan) Inc. (2008-present), and Fidelity Management & Research (U.K.) Inc. (2008-present). Previously, Mr. Goebel served as Assistant Secretary of FIMM (2008-2010), FRAC (2008-2010), and the Funds (2007-2008) and as Vice President and Secretary of Fidelity Distributors Corporation (FDC) (2005-2007). |
William C. Coffey (43) |
| Year of Election or Appointment: 2009 Assistant Secretary of Fidelity's Equity and High Income Funds. Mr. Coffey also serves as Senior Vice President and Deputy General Counsel of FMR LLC (2010-present), and is an employee of Fidelity Investments. Previously, Mr. Coffey served as Vice President and Associate General Counsel of FMR LLC (2005-2009). |
Elizabeth Paige Baumann (44) |
| Year of Election or Appointment: 2012 Anti-Money Laundering (AML) Officer of the Fidelity funds. Ms. Baumann also serves as AML Officer of The North Carolina Capital Management Trust: Cash and Term Portfolios (2012-present), Chief AML Officer of FMR LLC (2012-present), and is an employee of Fidelity Investments. Previously, Ms. Baumann served as Vice President and Deputy Anti-Money Laundering Officer (2007-2012). |
Christine Reynolds (54) |
| Year of Election or Appointment: 2008 Chief Financial Officer of the Fidelity funds. Ms. Reynolds became President of Fidelity Pricing and Cash Management Services (FPCMS) in August 2008. Ms. Reynolds served as Chief Operating Officer of FPCMS (2007-2008). Previously, Ms. Reynolds served as President, Treasurer, and Anti-Money Laundering officer of the Fidelity funds (2004-2007). |
Joseph A. Hanlon (44) |
| Year of Election or Appointment: 2012 Chief Compliance Officer of Fidelity's Equity and High Income Funds. Mr. Hanlon serves as Compliance Officer of FMR, FMR Co., Inc., Fidelity Investments Money Management, Inc. (FIMM), Fidelity Research and Analysis Company (FRAC), Fidelity Management & Research (Japan) Inc., Fidelity Management & Research (U.K.) Inc., Fidelity Management & Research (Hong Kong), and Strategic Advisers, Inc. (2009-present), as Senior Vice President of the Fidelity Asset Management Division (2009-present), and is an employee of Fidelity Investments. |
Joseph F. Zambello (55) |
| Year of Election or Appointment: 2011 Deputy Treasurer of the Fidelity funds. Mr. Zambello is an employee of Fidelity Investments. Previously, Mr. Zambello served as Vice President of FMR's Program Management Group (2009-2011) and Vice President of the Transfer Agent Oversight Group (2005-2009). |
Adrien E. Deberghes (45) |
| Year of Election or Appointment: 2008 Deputy Treasurer of Fidelity's Equity and High Income Funds. Mr. Deberghes also serves as Vice President (2011-present) and Assistant Treasurer (2010-present) of other Fidelity funds, and is an employee of Fidelity Investments (2008-present). Previously, Mr. Deberghes served as Senior Vice President of Mutual Fund Administration at State Street Corporation (2007-2008), Senior Director of Mutual Fund Administration at Investors Bank & Trust (2005-2007), and Director of Finance for Dunkin' Brands (2000-2005). |
Stephen Sadoski (41) |
| Year of Election or Appointment: 2012 Deputy Treasurer of Fidelity's Equity and High Income Funds. Mr. Sadoski also serves as Assistant Treasurer of other Fidelity funds (2012-present) and is an employee of Fidelity Investments (2012-present). Previously, Mr. Sadoski served as an assistant chief accountant in the Division of Investment Management of the Securities and Exchange Commission (SEC) (2009-2012) and as a senior manager at Deloitte & Touche (1997-2009). |
Stephanie J. Dorsey (43) |
| Year of Election or Appointment: 2010 Assistant Treasurer of Fidelity's Equity and High Income Funds. Ms. Dorsey also serves as Deputy Treasurer of other Fidelity funds (2008-present) and is an employee of Fidelity Investments (2008-present). Previously, Ms. Dorsey served as Treasurer (2004-2008) of the JPMorgan Mutual Funds and Vice President (2004-2008) of JPMorgan Chase Bank. |
John R. Hebble (54) |
| Year of Election or Appointment: 2009 Assistant Treasurer of Fidelity's Equity and High Income Funds. Mr. Hebble also serves as President (2011-present), Treasurer, and Chief Financial Officer of The North Carolina Capital Management Trust: Cash and Term Portfolios (2008-present), President and Treasurer of other Fidelity funds (2008-present) and is an employee of Fidelity Investments. |
Gary W. Ryan (54) |
| Year of Election or Appointment: 2005 Assistant Treasurer of the Fidelity funds. Mr. Ryan is an employee of Fidelity Investments. Previously, Mr. Ryan served as Vice President of Fund Reporting in Fidelity Pricing and Cash Management Services (FPCMS) (1999-2005). |
Jonathan Davis (44) |
| Year of Election or Appointment: 2010 Assistant Treasurer of the Fidelity funds. Mr. Davis is also Assistant Treasurer of Fidelity Rutland Square Trust II and Fidelity Commonwealth Trust II. Mr. Davis is an employee of Fidelity Investments. Previously, Mr. Davis served as Vice President and Associate General Counsel of FMR LLC (2003-2010). |
Annual Report
The Board of Trustees of Fidelity International Growth Fund voted to pay to shareholders of record at the opening of business on record date, the following distributions per share derived from capital gains realized from sales of portfolio securities, and dividends derived from net investment income:
| Pay Date | Record Date | Dividends | Capital Gains |
Class A | 12/10/2012 | 12/07/2012 | $0.084 | $0.005 |
| | | | |
Class T | 12/10/2012 | 12/07/2012 | $0.069 | $0.005 |
| | | | |
Class B | 12/10/2012 | 12/07/2012 | $0.034 | $0.005 |
| | | | |
Class C | 12/10/2012 | 12/07/2012 | $0.022 | $0.005 |
Class A designates 12%, Class T designates 14%, Class B designates 0%, and Class C designates 46% of the dividends distributed in December 2011 as indicated in the Corporate Qualifying memo distributed by the Tax department, during the fiscal year as qualifying for the dividends received deduction for corporate shareholders.
Class A, Class T, Class B, and Class C designates 100% of the dividends distributed during the fiscal year as amounts which may be taken into account as a dividend for purposes of the maximum rate under section 1(h)(11) of the Internal Revenue Code.
The amounts per share which represent income derived from sources within, and taxes paid to, foreign countries or possessions of the United States are as follows:
| Pay Date | Income | Taxes |
Class A | 12/05/2011 | $0.066 | $0.0072 |
| | | |
Class T | 12/05/2011 | $0.056 | $0.0072 |
| | | |
Class B | 12/05/2011 | $0.000 | $0.0000 |
| | | |
Class C | 12/05/2011 | $0.018 | $0.0072 |
The fund will notify shareholders in January 2013 of amounts for use in preparing 2012 income tax returns.
Annual Report
Board Approval of Investment Advisory Contracts and Management Fees
Fidelity International Growth Fund
Each year, the Board of Trustees, including the Independent Trustees (together, the Board), votes on the renewal of the management contract and sub-advisory agreements (together, the Advisory Contracts) for the fund. The Board, assisted by the advice of fund counsel and Independent Trustees' counsel, requests and considers a broad range of information relevant to the renewal of the Advisory Contracts throughout the year.
The Board meets regularly and, at each of its meetings, considers factors that are relevant to its annual consideration of the renewal of the fund's Advisory Contracts, including the services and support provided to the fund and its shareholders. The Board has established various standing committees, each composed of and chaired by Independent Trustees with varying backgrounds, to which the Board has assigned specific subject matter responsibilities in order to enhance effective decision-making by the Board. The Board, acting directly and through its Committees, requests and receives information concerning the annual consideration of the renewal of the fund's Advisory Contracts. The Board also meets as needed to consider matters specifically related to the Board's annual consideration of the renewal of Advisory Contracts. Members of the Board may also meet with trustees of other Fidelity funds through ad hoc joint committees to discuss certain matters relevant to the Fidelity funds.
At its July 2012 meeting, the Board of Trustees, including the Independent Trustees, unanimously determined to renew the fund's Advisory Contracts. In reaching its determination, the Board considered all factors it believed relevant, including (i) the nature, extent, and quality of the services to be provided to the fund and its shareholders (including the investment performance of the fund); (ii) the competitiveness of the fund's management fee and total expense ratio relative to peer funds; (iii) the total costs of the services to be provided by and the profits to be realized by Fidelity from its relationship with the fund; (iv) the extent to which economies of scale exist and would be realized as the fund grows; and (v) whether fee levels reflect these economies of scale, if any, for the benefit of fund shareholders.
In considering whether to renew the Advisory Contracts for the fund, the Board reached a determination, with the assistance of fund counsel and Independent Trustees' counsel and through the exercise of its business judgment, that the renewal of the Advisory Contracts is in the best interests of the fund and its shareholders and that the compensation payable under the Advisory Contracts is fair and reasonable. The Board's decision to renew the Advisory Contracts was not based on any single factor, but rather was based on a comprehensive consideration of all the information provided to the Board at its meetings throughout the year. The Board, in reaching its determination to renew the Advisory Contracts, is aware that shareholders in the fund have a broad range of investment choices available to them, including a wide choice among mutual funds offered by Fidelity's competitors, and that the fund's shareholders, who have the opportunity to review and weigh the disclosure provided by the fund in its prospectus and other public disclosures, have chosen to invest in this fund, managed by Fidelity.
Annual Report
Nature, Extent, and Quality of Services Provided. The Board considered the staffing within the investment adviser, FMR, and the sub-advisers (together, the Investment Advisers), including the backgrounds of the fund's investment personnel, and also considered the fund's investment objective, strategies, and related investment philosophy. The Independent Trustees also had discussions with senior management of Fidelity's investment operations and investment groups. The Board considered the structure of the portfolio manager compensation program and whether this structure provides appropriate incentives to act in the best interests of the fund.
Resources Dedicated to Investment Management and Support Services. The Board and the Fund Oversight and Research Committees reviewed the general qualifications and capabilities of the Investment Advisers' investment staff, including its size, education, experience, and resources, as well as the Investment Advisers' approach to recruiting, training, managing, and compensating investment personnel. The Board also noted that FMR has continued to increase the resources devoted to non-U.S. offices, including expansion of Fidelity's global investment organization. The Board noted that Fidelity's analysts have extensive resources, tools and capabilities that allow them to conduct sophisticated quantitative and fundamental analysis, as well as credit analysis of issuers, counterparties and guarantors. The Board also believes that Fidelity's investment professionals have sufficient access to global information and data so as to provide competitive investment results over time, and that those professionals also have access to sophisticated tools that permit them to assess portfolio construction and risk and performance attribution characteristics continuously, as well as to transmit new information and research conclusions rapidly around the world. Additionally, in its deliberations, the Board considered the Investment Advisers' trading and risk management capabilities and resources, which are an integral part of the investment management process.
Shareholder and Administrative Services. The Board considered (i) the nature, extent, quality, and cost of advisory, administrative, and shareholder services performed by the Investment Advisers and their affiliates under the Advisory Contracts and under separate agreements covering transfer agency, pricing and bookkeeping, and securities lending services for the fund; (ii) the nature and extent of the supervision of third party service providers, principally custodians and subcustodians; and (iii) the resources devoted to, and the record of compliance with, the fund's compliance policies and procedures. The Board also reviewed the allocation of fund brokerage, including allocations to brokers affiliated with the Investment Advisers, the use of brokerage commissions to pay fund expenses, and the use of "soft" commission dollars to pay for research services.
Annual Report
Board Approval of Investment Advisory Contracts and
Management Fees - continued
The Board noted that the growth of fund assets over time across the complex allows Fidelity to reinvest in the development of services designed to enhance the value or convenience of the Fidelity funds as investment vehicles. These services include 24-hour access to account information and market information through telephone representatives and over the Internet, investor education materials and asset allocation tools, and the expanded availability of Fidelity Investor Centers.
Investment in a Large Fund Family. The Board considered the benefits to shareholders of investing in a Fidelity fund, including the benefits of investing in a fund that is part of a large family of funds offering a variety of investment disciplines and providing a large variety of mutual fund investor services. The Board noted that Fidelity had taken, or had made recommendations that resulted in the Fidelity funds taking, a number of actions over the previous year that benefited particular funds, including (i) continuing to dedicate additional resources to investment research and support of the senior management team that oversees asset management; (ii) persisting in efforts to enhance Fidelity's research capabilities, in particular, international research; (iii) launching new funds and making other enhancements to meet client needs for global and income-oriented solutions; (iv) continuing to launch dedicated lower cost underlying funds to meet investment management's portfolio construction needs related to expanding underlying fund options, specifically for the Freedom Fund product lines; (v) adopting a "Stock Selector" sector neutral investment approach and employing a team of portfolio managers who are sector specialists to manage certain funds; (vi) rationalizing product lines and gaining increased efficiencies through the mergers of several funds into other funds; (vii) strengthening the Spartan Index Fund product line by adding new funds and/or new low-cost institutional share classes, restructuring fund expenses to accommodate new classes, and reducing investment minimums for certain classes of shares; (viii) modifying the eligibility criteria for Institutional Class shares to increase their appeal to government entities and charitable investors; and (ix) reducing certain transfer agent fee rates.
Investment Performance. The Board considered whether the fund has operated in accordance with its investment objective, as well as its record of compliance with its investment restrictions. It also reviewed the fund's absolute investment performance for each class, as well as the fund's relative investment performance for each class measured over multiple periods against (i) a broad-based securities market index, and (ii) a custom peer group of mutual funds deemed appropriate by Fidelity and reviewed by the Board. Because the fund had been in existence less than five calendar years, the following charts considered by the Board show, over the one- and three-year periods ended December 31, 2011, the cumulative total returns of the retail class and Class C of the fund, the cumulative total returns of a broad-based securities market index ("benchmark"), and a range of cumulative total returns of a custom peer group of mutual funds defined by FMR based on categories assigned by Morningstar, Inc. The returns of the retail class and Class C show the performance of the highest and lowest performing classes, respectively (based on three-year performance). The box within each chart shows the 25th percentile return (top of box) and the 75th percentile return (bottom of box) of the peer group. Returns shown above the box are in the first quartile and returns shown below the box are in the fourth quartile. The percentage beaten numbers noted below each chart correspond to the percentile box and represent the percentage of funds in the peer group whose performance was equal to or lower than that of the class indicated. The fund's custom peer group, defined by FMR, is a peer group that FMR believes provides a more meaningful performance comparison than the peer group assigned by Morningstar, Inc., which assigns mutual funds to categories based on their investment styles as measured by their underlying portfolio holdings.
Annual Report
Fidelity International Growth Fund

The Board reviewed the fund's relative investment performance against its peer group and noted that the performance of the retail class of the fund was in the first quartile for the one-year period and the second quartile for the three-year period. The Board also noted that the investment performance of the retail class of the fund compared favorably to its benchmark for all the periods shown. The Board considered that the variations in performance among the fund's classes reflect the variations in class expenses, which result in lower performance for higher expense classes. The Board also reviewed the fund's performance since inception as well as performance in the current year.
The Board also considered that the fund's management fee is subject to upward or downward adjustment depending upon whether, and to what extent, the fund's investment performance for the performance period exceeds, or is exceeded by, the record (over the same period) of a Board-approved performance adjustment index. The Board noted that the performance adjustment provides FMR with a strong economic incentive to seek to achieve superior performance for the fund's shareholders and helps to more closely align the interests of FMR and the fund's shareholders.
Annual Report
Board Approval of Investment Advisory Contracts and
Management Fees - continued
Based on its review, the Board concluded that the nature, extent, and quality of services provided to the fund under the Advisory Contracts should benefit the fund's shareholders.
Competitiveness of Management Fee and Total Expense Ratio. The Board considered the fund's management fee and total expense ratio compared to "mapped groups" of competitive funds and classes. Fidelity creates "mapped groups" by combining similar Lipper investment objective categories that have comparable management fee characteristics. Combining Lipper investment objective categories aids the Board's management fee and total expense ratio comparisons by broadening the competitive group used for comparison and by reducing the number of universes to which various Fidelity funds are compared.
Management Fee. The Board considered two proprietary management fee comparisons for the 12-month (or shorter) periods shown in the chart below. The group of Lipper funds used by the Board for management fee comparisons is referred to below as the "Total Mapped Group." The Total Mapped Group comparison focuses on a fund's standing relative to the total universe of comparable funds available to investors in terms of gross management fees before expense reimbursements or caps, and without giving effect to the fund's performance adjustment. "TMG %" represents the percentage of funds in the Total Mapped Group that had management fees that were lower than the fund's. For example, a TMG % of 17% means that 83% of the funds in the Total Mapped Group had higher management fees than the fund. The "Asset-Size Peer Group" (ASPG) comparison focuses on a fund's standing relative to non-Fidelity funds similar in size to the fund within the Total Mapped Group. The ASPG represents at least 15% of the funds in the Total Mapped Group with comparable asset size and management fee characteristics, subject to a minimum of 50 funds (or all funds in the Total Mapped Group if fewer than 50). Additional information, such as the ASPG quartile in which the fund's management fee ranked and the impact of the fund's performance adjustment, is also included in the chart and considered by the Board.
Annual Report
Fidelity International Growth Fund

The Board noted that the fund's management fee ranked below the median of its Total Mapped Group and below the median of its ASPG for 2011. The Board also noted the effect of the fund's positive performance adjustment on the fund's management fee ranking. The Board noted that the performance adjustment for each year represents calculations for performance periods that differ from the periods shown in the performance charts above.
Based on its review, the Board concluded that the fund's management fee is fair and reasonable in light of the services that the fund receives and the other factors considered.
Total Expense Ratio. In its review of each class's total expense ratio, the Board considered the fund's management fee as well as other fund or class expenses, as applicable, such as transfer agent fees, pricing and bookkeeping fees, fund-paid 12b-1 fees, and custodial, legal, and audit fees. The Board also noted the effects of any waivers and reimbursements on fees and expenses, as well as the impact of the fund's performance adjustment. As part of its review, the Board also considered the current and historical total expense ratios of each class of the fund compared to competitive fund median expenses. Each class of the fund is compared to those funds and classes in the Total Mapped Group (used by the Board for management fee comparisons) that have a similar sales load structure.
The Board noted that the total expense ratio of each of Class A and the retail class ranked below its competitive median for 2011, the total expense ratio of Class B ranked equal to its competitive median for 2011, and the total expense ratio of each of Class T, Class C, and Institutional Class ranked above its competitive median for 2011. The Board considered that various factors, including 12b-1 fees, positive or negative performance adjustments, and relatively higher other expenses in the case of small fund size, can affect total expense ratios. The Board noted that the total expense ratio of Class T was above the competitive median primarily because of higher 12b-1 fees on Class T. Class T has a higher 12b-1 fee, but a lower front-end sales charge, than traditionally priced front-end sales charge classes. The Board considered that Class T is primarily sold load-waived in the retirement plan market where its 0.50% 12b-1 fee is comparable to competing no-load, higher 12b-1 fee classes designed specifically for retirement plans. The Board noted that the fund offers multiple classes, each of which has a different sales load and 12b-1 fee structure, and that the multiple structures are intended to offer a range of pricing options for the intermediary market. The Board also noted that the total expense ratios of the classes vary primarily by the level of their 12b-1 fees, although differences in transfer agent fees may also cause expenses to vary from class to class.
Annual Report
Board Approval of Investment Advisory Contracts and
Management Fees - continued
The Board further considered that FMR contractually agreed to reimburse Class A, Class T, Class B, Class C, Institutional Class, and the retail class of the fund to the extent that total operating expenses (excluding interest, taxes, certain securities lending costs, brokerage commissions, extraordinary expenses, and acquired fund fees and expenses, if any), as a percentage of their respective average net assets, exceed 1.45%, 1.70%, 2.20%, 2.20%, 1.20%, and 1.20% through December 31, 2012.
Fees Charged to Other Fidelity Clients. The Board also considered Fidelity fee structures and other information with respect to clients of FMR and its affiliates, such as other mutual funds advised or subadvised by FMR or its affiliates, pension plan clients, and other institutional clients. The Board noted the findings of the 2010 ad hoc joint committee (created with the board of other Fidelity funds), which reviewed and compared Fidelity's institutional investment advisory business with its business of providing services to the Fidelity funds, including the differences in services provided, fees charged, and costs incurred, as well as competition in their respective marketplaces.
Based on its review of total expense ratios and fees charged to other Fidelity clients, the Board concluded that the total expense ratio of each class of the fund was reasonable, although in some cases above the median of the universe presented for comparison, in light of the services that the fund and its shareholders receive and the other factors considered.
Costs of the Services and Profitability. The Board considered the revenues earned and the expenses incurred by Fidelity in conducting the business of developing, marketing, distributing, managing, administering and servicing the fund and its shareholders. The Board also considered the level of Fidelity's profits in respect of all the Fidelity funds.
Annual Report
On an annual basis, FMR presents to the Board Fidelity's profitability for the fund. Fidelity calculates the profitability for each fund, as well as aggregate profitability for groups of Fidelity funds and all Fidelity funds, using a series of detailed revenue and cost allocation methodologies which originate with the books and records of Fidelity on which Fidelity's audited financial statements are based. The Audit Committee of the Board reviews any significant changes from the prior year's methodologies.
PricewaterhouseCoopers LLP (PwC), independent registered public accounting firm and auditor to Fidelity and certain Fidelity funds, has been engaged annually by the Board as part of the Board's assessment of Fidelity's profitability analysis. PwC's engagement includes the review and assessment of Fidelity's methodologies used in determining the revenues and expenses attributable to Fidelity's mutual fund business, and completion of agreed-upon procedures surrounding the mathematical accuracy of fund profitability and its conformity to allocation methodologies. After considering PwC's reports issued under the engagement and information provided by Fidelity, the Board concluded that while other allocation methods may also be reasonable, Fidelity's profitability methodologies are reasonable in all material respects.
The Board also reviewed Fidelity's non-fund businesses and fall-out benefits related to the mutual fund business as well as cases where Fidelity's affiliates may benefit from or be related to the fund's business.
The Board considered the costs of the services provided by and the profits realized by Fidelity in connection with the operation of the fund and was satisfied that the profitability was not excessive in the circumstances.
Economies of Scale. The Board considered whether there have been economies of scale in respect of the management of the Fidelity funds, whether the Fidelity funds (including the fund) have appropriately benefited from any such economies of scale, and whether there is potential for realization of any further economies of scale. The Board considered the extent to which the fund will benefit from economies of scale through increased services to the fund, through waivers or reimbursements, or through fee or expense reductions. The Board also noted that in 2009, it and the board of other Fidelity funds created an ad hoc committee (the Economies of Scale Committee) to analyze whether FMR attains economies of scale in respect of the management and servicing of the Fidelity funds, whether the Fidelity funds have appropriately benefited from such economies of scale, and whether there is potential for realization of any further economies of scale.
The Board recognized that the fund's management contract incorporates a "group fee" structure, which provides for lower group fee rates as total fund assets under FMR's management increase, and for higher group fee rates as total fund assets under FMR's management decrease. FMR calculates the group fee rates based on a tiered asset "breakpoint" schedule that varies based on asset class. The Board considered that the group fee is designed to deliver the benefits of economies of scale to fund shareholders when total Fidelity fund assets increase, even if assets of any particular fund are unchanged or have declined, because some portion of Fidelity's costs are attributable to services provided to all Fidelity funds, and all funds benefit if those costs can be allocated among more assets. The Board concluded that, given the group fee structure, fund shareholders will benefit from lower management fees as assets under FMR's management increase at the fund complex level, regardless of whether Fidelity achieves any such economies of scale.
Annual Report
Board Approval of Investment Advisory Contracts and
Management Fees - continued
The Board concluded, taking into account the analysis of the Economies of Scale Committee, that economies of scale, if any, are being appropriately shared between fund shareholders and Fidelity.
Additional Information Requested by the Board. In order to develop fully the factual basis for consideration of the Fidelity funds' Advisory Contracts, the Board requested and received additional information on certain topics, including (i) fund performance trends, actions to be taken by FMR to improve certain funds' overall performance, and Fidelity's long-term strategies for certain funds; (ii) the potential to further rationalize the Fidelity fund lineup with the possibility of achieving savings for the funds and Fidelity; (iii) Fidelity's compensation structure for portfolio managers and other key investment personnel; (iv) the amount of the investment that each portfolio manager has made in the Fidelity fund(s) that he or she manages; (v) the realization of fall-out benefits in certain Fidelity business units; (vi) Fidelity's group fee structures, the potential impact of regulatory changes on such structures, and the rationale for the individual fee rates of certain funds; (vii) fund profitability methodology, including Fidelity's cost allocation methodology, and the impact of certain factors on fund profitability results; (viii) trends regarding industry use of performance fee structures and the possibility of implementing performance fee structures for additional funds; and (ix) the impact of net redemptions from the Fidelity funds.
Based on its evaluation of all of the conclusions noted above, and after considering all factors it believed relevant, the Board ultimately concluded that the advisory fee structures are fair and reasonable, and that the fund's Advisory Contracts should be renewed.
Annual Report
Investment Adviser
Fidelity Management & Research Company
Boston, MA
Investment Sub-Advisers
FMR Co., Inc.
Fidelity Management & Research
(U.K.) Inc.
Fidelity Management & Research
(Hong Kong) Limited
Fidelity Management & Research
(Japan) Inc.
FIL Investment Advisors
FIL Investments (Japan) Limited
FIL Investment Advisors (UK) Limited
General Distributor
Fidelity Distributors Corporation
Smithfield, RI
Transfer and Service Agents
Fidelity Investments Institutional Operations Company, Inc.
Boston, MA
Fidelity Service Company, Inc.
Boston, MA
Custodian
State Street Bank and Trust Company
Quincy, MA
(Fidelity Investment logo)(registered trademark)
AIGF-UANN-1212
1.853348.104
(Fidelity Investment logo)(registered trademark)
Fidelity Advisor®
International Growth
Fund - Institutional Class
Annual Report
October 31, 2012
(Fidelity Cover Art)
Institutional Class is
a class of Fidelity®
International Growth Fund
Contents
Performance | (Click Here) | How the fund has done over time. |
Management's Discussion of Fund Performance | (Click Here) | The Portfolio Manager's review of fund performance and strategy. |
Shareholder Expense Example | (Click Here) | An example of shareholder expenses. |
Investment Changes | (Click Here) | A summary of major shifts in the fund's investments over the past six months. |
Investments | (Click Here) | A complete list of the fund's investments with their market values. |
Financial Statements | (Click Here) | Statements of assets and liabilities, operations, and changes in net assets, as well as financial highlights. |
Notes | (Click Here) | Notes to financial statements. |
Report of Independent Registered Public Accounting Firm | (Click Here) | |
Trustees and Officers | (Click Here) | |
Distributions | (Click Here) | |
Board Approval of Investment Advisory Contracts and Management Fees | (Click Here) | |
To view a fund's proxy voting guidelines and proxy voting record for the 12-month period ended June 30, visit http://www.fidelity.com/proxyvotingresults or visit the Securities and Exchange Commission's (SEC) web site at http://www.sec.gov. You may also call 1-877-208-0098 to request a free copy of the proxy voting guidelines.
Standard & Poor's, S&P and S&P 500 are registered service marks of The McGraw-Hill Companies, Inc. and have been licensed for use by Fidelity Distributors Corporation.
Other third party marks appearing herein are the property of their respective owners.
All other marks appearing herein are registered or unregistered trademarks or service marks of FMR LLC or an affiliated company. © 2012 FMR LLC. All rights reserved.
Annual Report
This report and the financial statements contained herein are submitted for the general information of the shareholders of the fund. This report is not authorized for distribution to prospective investors in the fund unless preceded or accompanied by an effective prospectus.
A fund files its complete schedule of portfolio holdings with the SEC for the first and third quarters of each fiscal year on Form N-Q. Forms N-Q are available on the SEC's web site at http://www.sec.gov. A fund's Forms N-Q may be reviewed and copied at the SEC's Public Reference Room in Washington, DC. Information regarding the operation of the SEC's Public Reference Room may be obtained by calling 1-800-SEC-0330. For a complete list of a fund's portfolio holdings, view the most recent holdings listing, semiannual report, or annual report on Fidelity's web site at http://www.fidelity.com, http://www.advisor.fidelity.com, or http://www.401k.com, as applicable.
NOT FDIC INSURED • MAY LOSE VALUE • NO BANK GUARANTEE
Neither the fund nor Fidelity Distributors Corporation is a bank.
Annual Report
Average annual total return reflects the change in the value of an investment, assuming reinvestment of the class' distributions from dividend income and capital gains (the profits earned upon the sale of securities that have grown in value, if any) and assuming a constant rate of performance each year. The $10,000 table and the fund's returns do not reflect the deduction of taxes that a shareholder would pay on fund distributions or the redemption of fund shares. During periods of reimbursement by Fidelity, a fund's total return will be greater than it would be had the reimbursement not occurred. How a fund did yesterday is no guarantee of how it will do tomorrow.
Average Annual Total Returns
Periods ended October 31, 2012 | Past 1
year | Life of
fund A |
Institutional Class | 11.28% | -1.35% |
A From November 1, 2007.
$10,000 Over Life of Fund
Let's say hypothetically that $10,000 was invested in Fidelity Advisor® International Growth Fund - Institutional Class on November 1, 2007, when the fund started. The chart shows how the value of your investment would have changed, and also shows how the MSCI® EAFE® Growth Index performed over the same period.
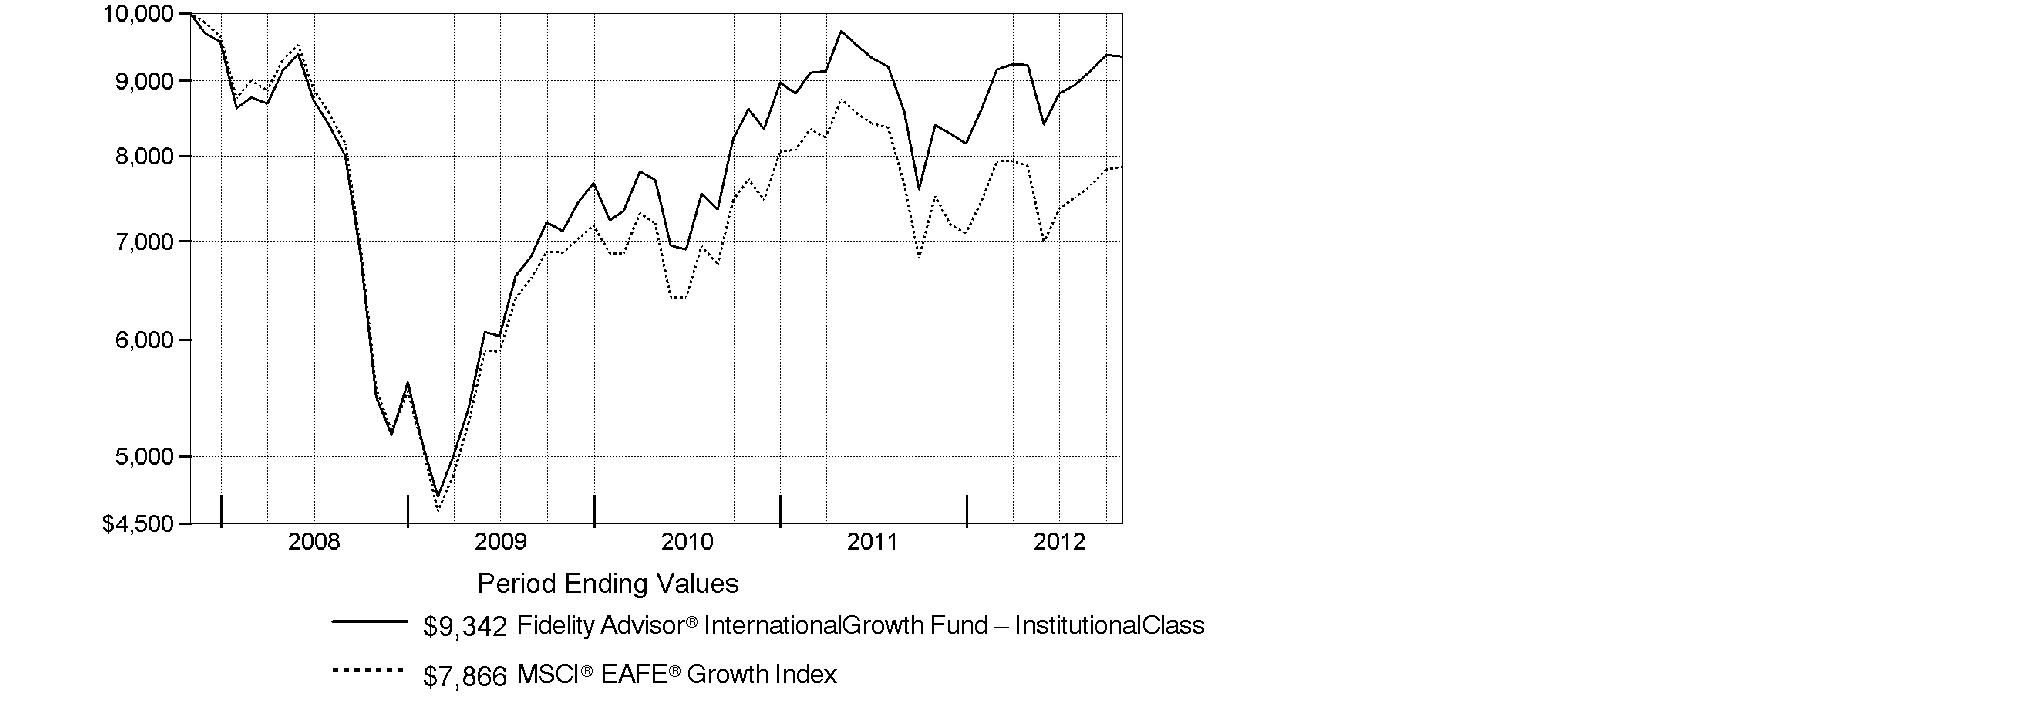
Annual Report
Market Recap: International stocks experienced pendulum-like swings during the 12 months ending October 31, 2012, finishing the period with a modest advance. The market faced periodic bouts of volatility this past year, as a number of macroeconomic concerns - including the eurozone debt crisis, the strength and pace of the U.S. economic recovery, and a slowdown in China's once-blistering growth - dominated headlines and weighed on investors. While a stronger U.S. dollar provided an additional head wind, foreign developed- and emerging-markets stocks still managed a gain for the 12 months, as the MSCI® ACWI® (All Country World Index) ex USA Index rose 4.11%, largely buttressed in the summertime by pledges of accommodative monetary action from eurozone officials, as well as signs that the U.S. housing market was on the mend. Within the index, Asia-Pacific ex Japan showed the most impressive gains, advancing roughly 11%. A number of core European components, most notably Germany (+11%), Switzerland (+10%) and the U.K. (+9%), benefited from optimism about the eurozone's ability to resolve its debt woes, which also helped the region outpace the index overall. Elsewhere, results from Canada (+3%) and the generally more volatile emerging markets (+2%) each fell short of the MSCI index, while Japan was among the few benchmark constituents to finish in the red, returning about -3%.
Comments from Jed Weiss, Portfolio Manager of Fidelity Advisor® International Growth Fund: For the year, the fund's Institutional Class shares returned 11.28%, easily outpacing the 4.77% advance of the MSCI® EAFE® Growth Index. Following the fund's bottom-up stock selection strategy, portfolio positioning in Japan and Europe was especially helpful. An out-of-benchmark allocation to globally oriented U.S.-based stocks also contributed, while stock picking in Canada was modestly negative. In sector terms, security selection was very strong in information technology, materials, industrials, consumer discretionary and health care, while my picks in only two groups - energy and telecommunication services - had a negative impact. The top individual contributor was Belgian brewer Anheuser-Busch InBev, while in health care, Australian biotechnology company CSL and Denmark's Novo-Nordisk also added value. U.S.-based credit card networks MasterCard and Visa, neither of which is in the index, were additional contributors. In contrast, not owning Diageo, a strong-performing U.K.-based spirits company and benchmark component, hurt. Other notable detractors were U.K. natural gas producer BG Group and Bharti Airtel, an Indian telecommunication services provider and non-index stock that I sold before period end.
The views expressed above reflect those of the portfolio manager(s) only through the end of the period as stated on the cover of this report and do not necessarily represent the views of Fidelity or any other person in the Fidelity organization. Any such views are subject to change at any time based upon market or other conditions and Fidelity disclaims any responsibility to update such views. These views may not be relied on as investment advice and, because investment decisions for a Fidelity fund are based on numerous factors, may not be relied on as an indication of trading intent on behalf of any Fidelity fund.
Annual Report
Shareholder Expense Example
As a shareholder of the Fund, you incur two types of costs: (1) transaction costs, including sales charges (loads) on purchase payments or redemption proceeds, redemption fees and (2) ongoing costs, including management fees, distribution and/or service (12b-1) fees and other Fund expenses. This Example is intended to help you understand your ongoing costs (in dollars) of investing in the Fund and to compare these costs with the ongoing costs of investing in other mutual funds.
The Example is based on an investment of $1,000 invested at the beginning of the period and held for the entire period (May 1, 2012 to October 31, 2012).
Actual Expenses
The first line of the accompanying table for each class of the Fund provides information about actual account values and actual expenses. You may use the information in this line, together with the amount you invested, to estimate the expenses that you paid over the period. Simply divide your account value by $1,000.00 (for example, an $8,600 account value divided by $1,000.00 = 8.6), then multiply the result by the number in the first line for a class of the Fund under the heading entitled "Expenses Paid During Period" to estimate the expenses you paid on your account during this period. A small balance maintenance fee of $12.00 that is charged once a year may apply for certain accounts with a value of less than $2,000. This fee is not included in the table below. If it was, the estimate of expenses you paid during the period would be higher, and your ending account value lower, by this amount. In addition, the Fund, as a shareholder in the underlying Fidelity Central Funds, will indirectly bear its pro-rata share of the fees and expenses incurred by the underlying Fidelity Central Funds. These fees and expenses are not included in the Fund's annualized expense ratio used to calculate the expense estimate in the table below.
Hypothetical Example for Comparison Purposes
The second line of the accompanying table for each class of the Fund provides information about hypothetical account values and hypothetical expenses based on a Class' actual expense ratio and an assumed rate of return of 5% per year before expenses, which is not the Class' actual return. The hypothetical account values and expenses may not be used to estimate the actual ending account balance or expenses you paid for the period. You may use this information to compare the ongoing costs of investing in the Fund and other funds. To do so, compare this 5% hypothetical example with the 5% hypothetical examples that appear in the shareholder reports of the other funds. A small balance maintenance fee of $12.00 that is charged once a year may apply for certain accounts with a value of less than $2,000. This fee is not included in the table below. If it was, the estimate of expenses you paid during the period would be higher, and your ending account value lower, by this amount. In addition, the Fund, as a shareholder in the underlying Fidelity Central Funds, will indirectly bear its pro-rata share of the fees and expenses incurred by the underlying Fidelity Central Funds. These fees and expenses are not included in the Fund's annualized expense ratio used to calculate the expense estimate in the table below.
Please note that the expenses shown in the table are meant to highlight your ongoing costs only and do not reflect any transaction costs. Therefore, the second line of the table is useful in comparing ongoing costs only, and will not help you determine the relative total costs of owning different funds. In addition, if these transactional costs were included, your costs would have been higher.
Annual Report
Shareholder Expense Example - continued
| Annualized
Expense Ratio | Beginning
Account Value
May 1, 2012 | Ending
Account Value
October 31, 2012 | Expenses Paid
During Period*
May 1, 2012
to October 31, 2012 |
Class A | 1.45% | | | |
Actual | | $ 1,000.00 | $ 1,012.50 | $ 7.34 |
HypotheticalA | | $ 1,000.00 | $ 1,017.85 | $ 7.35 |
Class T | 1.70% | | | |
Actual | | $ 1,000.00 | $ 1,011.40 | $ 8.60 |
HypotheticalA | | $ 1,000.00 | $ 1,016.59 | $ 8.62 |
Class B | 2.20% | | | |
Actual | | $ 1,000.00 | $ 1,007.90 | $ 11.10 |
HypotheticalA | | $ 1,000.00 | $ 1,014.08 | $ 11.14 |
Class C | 2.20% | | | |
Actual | | $ 1,000.00 | $ 1,009.10 | $ 11.11 |
HypotheticalA | | $ 1,000.00 | $ 1,014.08 | $ 11.14 |
International Growth | 1.20% | | | |
Actual | | $ 1,000.00 | $ 1,013.60 | $ 6.07 |
HypotheticalA | | $ 1,000.00 | $ 1,019.10 | $ 6.09 |
Institutional Class | 1.20% | | | |
Actual | | $ 1,000.00 | $ 1,013.60 | $ 6.07 |
HypotheticalA | | $ 1,000.00 | $ 1,019.10 | $ 6.09 |
A 5% return per year before expenses
* Expenses are equal to each Class' annualized expense ratio, multiplied by the average account value over the period, multiplied by 184/366 (to reflect the one-half year period).
Annual Report
Investment Changes (Unaudited)
Geographic Diversification (% of fund's net assets) |
As of October 31, 2012 |
 | United Kingdom 18.9% | |
 | United States of America 18.2% | |
 | Japan 10.9% | |
 | Switzerland 9.1% | |
 | Australia 5.4% | |
 | Belgium 4.6% | |
 | France 3.6% | |
 | Sweden 3.5% | |
 | Denmark 3.1% | |
| Other 22.7% | |

Percentages are based on country or territory of incorporation and are adjusted for the effect of futures contracts, if applicable. |
As of April 30, 2012 |
| United Kingdom 18.3% | |
| United States of America 18.1% | |
| Japan 10.6% | |
| Switzerland 9.5% | |
| Belgium 4.2% | |
| Australia 4.0% | |
| Germany 3.8% | |
| Denmark 3.3% | |
| France 3.3% | |
| Other 24.9% | |

Percentages are based on country or territory of incorporation and are adjusted for the effect of futures contracts, if applicable. |
Asset Allocation |
| % of fund's
net assets | % of fund's net assets
6 months ago |
Stocks | 98.1 | 97.4 |
Short-Term Investments and Net Other Assets (Liabilities) | 1.9 | 2.6 |
Top Ten Stocks as of October 31, 2012 |
| % of fund's
net assets | % of fund's net assets
6 months ago |
Nestle SA (Switzerland, Food Products) | 5.0 | 5.0 |
Anheuser-Busch InBev SA NV (Belgium, Beverages) | 3.6 | 3.3 |
Novo Nordisk A/S Series B sponsored ADR (Denmark, Pharmaceuticals) | 2.7 | 2.5 |
GlaxoSmithKline PLC sponsored ADR (United Kingdom, Pharmaceuticals) | 2.5 | 1.7 |
Linde AG (Germany, Chemicals) | 2.4 | 2.4 |
BG Group PLC (United Kingdom, Oil, Gas & Consumable Fuels) | 2.4 | 2.9 |
Roche Holding AG (participation certificate) (Switzerland, Pharmaceuticals) | 2.3 | 2.0 |
Philip Morris International, Inc. (United States of America, Tobacco) | 2.0 | 1.8 |
Standard Chartered PLC (United Kingdom) (United Kingdom, Commercial Banks) | 2.0 | 1.9 |
CSL Ltd. (Australia, Biotechnology) | 1.9 | 1.5 |
| 26.8 | |
Market Sectors as of October 31, 2012 |
| % of fund's
net assets | % of fund's net assets
6 months ago |
Consumer Staples | 24.2 | 22.4 |
Industrials | 14.5 | 13.4 |
Consumer Discretionary | 14.5 | 15.2 |
Materials | 12.4 | 13.2 |
Health Care | 11.4 | 9.5 |
Information Technology | 8.4 | 7.5 |
Financials | 7.2 | 10.9 |
Energy | 5.5 | 4.9 |
Telecommunication Services | 0.0 | 0.4 |
Annual Report
Investments October 31, 2012
Showing Percentage of Net Assets
Common Stocks - 98.1% |
| Shares | | Value |
Australia - 5.4% |
Coca-Cola Amatil Ltd. | 147,671 | | $ 2,061,749 |
CSL Ltd. | 74,105 | | 3,653,923 |
Newcrest Mining Ltd. | 45,609 | | 1,251,313 |
Sydney Airport unit | 179,470 | | 631,553 |
Woodside Petroleum Ltd. | 40,108 | | 1,432,213 |
WorleyParsons Ltd. | 50,089 | | 1,282,714 |
TOTAL AUSTRALIA | | 10,313,465 |
Austria - 1.1% |
Andritz AG | 36,600 | | 2,204,495 |
Bailiwick of Jersey - 1.1% |
Informa PLC | 86,364 | | 557,758 |
Randgold Resources Ltd. sponsored ADR | 12,335 | | 1,475,143 |
TOTAL BAILIWICK OF JERSEY | | 2,032,901 |
Belgium - 4.6% |
Anheuser-Busch InBev SA NV | 82,391 | | 6,890,455 |
Umicore SA | 38,731 | | 1,987,716 |
TOTAL BELGIUM | | 8,878,171 |
Bermuda - 0.8% |
Lazard Ltd. Class A | 20,292 | | 597,802 |
Li & Fung Ltd. | 519,000 | | 870,575 |
TOTAL BERMUDA | | 1,468,377 |
Brazil - 1.1% |
Arezzo Industria e Comercio SA | 27,400 | | 489,033 |
Iguatemi Empresa de Shopping Centers SA | 49,200 | | 624,977 |
Multiplan Empreendimentos Imobiliarios SA | 33,800 | | 990,177 |
TOTAL BRAZIL | | 2,104,187 |
Canada - 1.8% |
Agnico-Eagle Mines Ltd. (Canada) | 13,300 | | 750,926 |
Fairfax Financial Holdings Ltd. (sub. vtg.) | 1,300 | | 482,266 |
First Quantum Minerals Ltd. | 22,400 | | 503,509 |
Goldcorp, Inc. | 29,006 | | 1,311,260 |
Open Text Corp. (a) | 8,600 | | 462,226 |
TOTAL CANADA | | 3,510,187 |
Common Stocks - continued |
| Shares | | Value |
Cayman Islands - 1.7% |
Baidu.com, Inc. sponsored ADR (a) | 8,080 | | $ 861,490 |
Sands China Ltd. | 655,600 | | 2,465,886 |
TOTAL CAYMAN ISLANDS | | 3,327,376 |
Denmark - 3.1% |
Novo Nordisk A/S Series B sponsored ADR | 32,400 | | 5,193,396 |
William Demant Holding A/S (a) | 9,700 | | 834,267 |
TOTAL DENMARK | | 6,027,663 |
Finland - 1.5% |
Nokian Tyres PLC | 58,508 | | 2,426,725 |
Outotec Oyj | 9,000 | | 438,267 |
TOTAL FINLAND | | 2,864,992 |
France - 3.6% |
Alstom SA | 47,499 | | 1,622,260 |
Danone SA | 46,652 | | 2,867,694 |
Remy Cointreau SA | 8,587 | | 890,626 |
Safran SA | 39,100 | | 1,555,606 |
TOTAL FRANCE | | 6,936,186 |
Germany - 3.0% |
Linde AG | 27,941 | | 4,698,991 |
Siemens AG sponsored ADR (d) | 11,200 | | 1,130,192 |
TOTAL GERMANY | | 5,829,183 |
Ireland - 1.8% |
CRH PLC sponsored ADR | 68,700 | | 1,281,255 |
Elan Corp. PLC sponsored ADR (a) | 65,784 | | 710,467 |
James Hardie Industries NV sponsored ADR (d) | 32,000 | | 1,538,880 |
TOTAL IRELAND | | 3,530,602 |
Israel - 0.2% |
Azrieli Group | 19,200 | | 428,628 |
Italy - 0.9% |
Fiat Industrial SpA | 115,401 | | 1,249,716 |
Interpump Group SpA | 75,351 | | 572,324 |
TOTAL ITALY | | 1,822,040 |
Japan - 10.9% |
Autobacs Seven Co. Ltd. | 19,900 | | 816,391 |
Denso Corp. | 85,000 | | 2,660,842 |
Fanuc Corp. | 17,000 | | 2,706,627 |
Common Stocks - continued |
| Shares | | Value |
Japan - continued |
Fast Retailing Co. Ltd. | 8,200 | | $ 1,826,331 |
Japan Tobacco, Inc. | 27,700 | | 765,454 |
JS Group Corp. | 34,900 | | 771,621 |
Keyence Corp. | 10,062 | | 2,669,587 |
Kobayashi Pharmaceutical Co. Ltd. | 16,400 | | 865,915 |
Mitsui Fudosan Co. Ltd. | 55,000 | | 1,111,299 |
Nintendo Co. Ltd. | 8,000 | | 1,030,189 |
Osaka Securities Exchange Co. Ltd. | 10 | | 37,267 |
SHO-BOND Holdings Co. Ltd. | 15,600 | | 471,537 |
SMC Corp. | 5,500 | | 866,717 |
Unicharm Corp. | 24,900 | | 1,347,463 |
USS Co. Ltd. | 20,580 | | 2,162,924 |
Yamato Kogyo Co. Ltd. | 32,700 | | 917,959 |
TOTAL JAPAN | | 21,028,123 |
Netherlands - 2.2% |
ASML Holding NV | 61,400 | | 3,375,158 |
D.E. Master Blenders 1753 NV (a) | 66,459 | | 812,222 |
TOTAL NETHERLANDS | | 4,187,380 |
Portugal - 1.2% |
Jeronimo Martins SGPS SA | 127,352 | | 2,228,409 |
South Africa - 0.4% |
Clicks Group Ltd. | 120,343 | | 829,708 |
Spain - 1.6% |
Inditex SA | 18,214 | | 2,323,979 |
Prosegur Compania de Seguridad SA (Reg.) | 151,049 | | 822,285 |
TOTAL SPAIN | | 3,146,264 |
Sweden - 3.5% |
ASSA ABLOY AB (B Shares) | 48,761 | | 1,625,391 |
Fagerhult AB | 15,400 | | 380,769 |
H&M Hennes & Mauritz AB (B Shares) | 74,630 | | 2,525,959 |
Intrum Justitia AB | 30,000 | | 434,199 |
Swedish Match Co. AB | 52,300 | | 1,781,996 |
TOTAL SWEDEN | | 6,748,314 |
Switzerland - 9.1% |
Nestle SA | 152,687 | | 9,689,468 |
Roche Holding AG (participation certificate) | 22,817 | | 4,387,979 |
Schindler Holding AG: | | | |
(participation certificate) | 9,410 | | 1,239,780 |
Common Stocks - continued |
| Shares | | Value |
Switzerland - continued |
Schindler Holding AG: - continued | | | |
(Reg.) | 1,530 | | $ 197,965 |
Swatch Group AG (Bearer) | 2,480 | | 1,026,299 |
UBS AG (NY Shares) | 61,021 | | 916,535 |
TOTAL SWITZERLAND | | 17,458,026 |
Turkey - 2.3% |
Anadolu Efes Biracilik Ve Malt Sanayii A/S | 43,800 | | 657,305 |
Coca-Cola Icecek A/S | 82,142 | | 1,594,723 |
Turkiye Garanti Bankasi A/S | 276,500 | | 1,320,413 |
Turkiye Petrol Rafinerile A/S | 32,687 | | 798,712 |
TOTAL TURKEY | | 4,371,153 |
United Kingdom - 18.9% |
Anglo American PLC: | | | |
ADR | 25,200 | | 387,324 |
(United Kingdom) | 12,200 | | 374,658 |
Babcock International Group PLC | 79,300 | | 1,251,550 |
BG Group PLC | 247,955 | | 4,591,577 |
BHP Billiton PLC ADR (d) | 56,100 | | 3,589,278 |
GlaxoSmithKline PLC sponsored ADR | 107,600 | | 4,831,240 |
InterContinental Hotel Group PLC ADR | 94,530 | | 2,327,329 |
Johnson Matthey PLC | 48,477 | | 1,759,387 |
Reckitt Benckiser Group PLC | 53,945 | | 3,264,515 |
Rexam PLC | 141,583 | | 1,020,618 |
Rolls-Royce Group PLC | 167,537 | | 2,310,250 |
Rolls-Royce Group PLC Class C | 12,732,812 | | 20,548 |
Rotork PLC | 38,200 | | 1,404,279 |
SABMiller PLC | 75,766 | | 3,245,588 |
Serco Group PLC | 135,342 | | 1,237,282 |
Shaftesbury PLC | 62,933 | | 556,539 |
Standard Chartered PLC (United Kingdom) | 162,631 | | 3,840,894 |
Unite Group PLC | 103,000 | | 470,558 |
TOTAL UNITED KINGDOM | | 36,483,414 |
United States of America - 16.3% |
Allergan, Inc. | 14,200 | | 1,276,864 |
Amazon.com, Inc. (a) | 5,500 | | 1,280,510 |
Autoliv, Inc. (d) | 33,400 | | 1,923,840 |
Berkshire Hathaway, Inc. Class B (a) | 23,023 | | 1,988,036 |
BorgWarner, Inc. (a) | 20,246 | | 1,332,592 |
CME Group, Inc. | 14,700 | | 822,171 |
Cummins, Inc. | 7,404 | | 692,866 |
Common Stocks - continued |
| Shares | | Value |
United States of America - continued |
Cymer, Inc. (a) | 9,787 | | $ 779,926 |
FMC Technologies, Inc. (a) | 24,788 | | 1,013,829 |
Freeport-McMoRan Copper & Gold, Inc. | 13,800 | | 536,544 |
Martin Marietta Materials, Inc. (d) | 6,000 | | 493,860 |
MasterCard, Inc. Class A | 7,400 | | 3,410,882 |
Mead Johnson Nutrition Co. Class A | 30,200 | | 1,862,132 |
Mohawk Industries, Inc. (a) | 11,200 | | 934,864 |
National Oilwell Varco, Inc. | 20,289 | | 1,495,299 |
Philip Morris International, Inc. | 44,508 | | 3,941,628 |
PriceSmart, Inc. | 9,200 | | 763,508 |
ResMed, Inc. | 26,100 | | 1,042,434 |
Solera Holdings, Inc. | 11,689 | | 547,162 |
SS&C Technologies Holdings, Inc. (a) | 19,300 | | 463,779 |
Union Pacific Corp. | 17,300 | | 2,128,419 |
Visa, Inc. Class A | 19,500 | | 2,705,820 |
TOTAL UNITED STATES OF AMERICA | | 31,436,965 |
TOTAL COMMON STOCKS (Cost $179,197,131) |
189,196,209
|
Money Market Funds - 6.7% |
| | | |
Fidelity Cash Central Fund, 0.19% (b) | 6,916,036 | | 6,916,036 |
Fidelity Securities Lending Cash Central Fund, 0.19% (b)(c) | 5,935,200 | | 5,935,200 |
TOTAL MONEY MARKET FUNDS (Cost $12,851,236) |
12,851,236
|
TOTAL INVESTMENT PORTFOLIO - 104.8% (Cost $192,048,367) | | 202,047,445 |
NET OTHER ASSETS (LIABILITIES) - (4.8)% | | (9,201,174) |
NET ASSETS - 100% | $ 192,846,271 |
Legend |
(a) Non-income producing |
(b) Affiliated fund that is available only to investment companies and other accounts managed by Fidelity Investments. The rate quoted is the annualized seven-day yield of the fund at period end. A complete unaudited listing of the fund's holdings as of its most recent quarter end is available upon request. In addition, each Fidelity Central Fund's financial statements, which are not covered by the Fund's Report of Independent Registered Public Accounting Firm, are available on the SEC's website or upon request. |
(c) Investment made with cash collateral received from securities on loan. |
(d) Security or a portion of the security is on loan at period end. |
Affiliated Central Funds |
Information regarding fiscal year to date income earned by the Fund from investments in Fidelity Central Funds is as follows: |
Fund | Income earned |
Fidelity Cash Central Fund | $ 7,474 |
Fidelity Securities Lending Cash Central Fund | 56,903 |
Total | $ 64,377 |
Other Information |
Categorizations in the Schedule of Investments are based on country or territory of incorporation. |
The following is a summary of the inputs used, as of October 31, 2012, involving the Fund's assets and liabilities carried at fair value. The inputs or methodology used for valuing securities may not be an indication of the risk associated with investing in those securities. For more information on valuation inputs, and their aggregation into the levels used in the tables below, please refer to the Security Valuation section in the accompanying Notes to Financial Statements. |
Valuation Inputs at Reporting Date: |
Description | Total | Level 1 | Level 2 | Level 3 |
Investments in Securities: | | | | |
Equities: | | | | |
Consumer Discretionary | $ 27,951,837 | $ 27,951,837 | $ - | $ - |
Consumer Staples | 46,360,558 | 39,470,103 | 6,890,455 | - |
Energy | 10,614,344 | 10,614,344 | - | - |
Financials | 14,187,562 | 14,187,562 | - | - |
Health Care | 21,930,570 | 21,930,570 | - | - |
Industrials | 27,966,498 | 27,966,498 | - | - |
Information Technology | 16,306,219 | 16,306,219 | - | - |
Materials | 23,878,621 | 23,878,621 | - | - |
Money Market Funds | 12,851,236 | 12,851,236 | - | - |
Total Investments in Securities: | $ 202,047,445 | $ 195,156,990 | $ 6,890,455 | $ - |
The following is a summary of transfers between Level 1 and Level 2 for the period ended October 31, 2012. Transfers are assumed to have occurred at the beginning of the period, and are primarily attributable to the valuation techniques used for foreign equity securities, as discussed in the accompanying Notes to Financial Statements: |
Transfers | Total |
Level 1 to Level 2 | $ 0 |
Level 2 to Level 1 | $ 8,172,491 |
See accompanying notes which are an integral part of the financial statements.
Annual Report
Statement of Assets and Liabilities
| October 31, 2012 |
| | |
Assets | | |
Investment in securities, at value (including securities loaned of $5,892,979) - See accompanying schedule: Unaffiliated issuers (cost $179,197,131) | $ 189,196,209 | |
Fidelity Central Funds (cost $12,851,236) | 12,851,236 | |
Total Investments (cost $192,048,367) | | $ 202,047,445 |
Foreign currency held at value (cost $128) | | 128 |
Receivable for investments sold | | 193,639 |
Receivable for fund shares sold | | 861,534 |
Dividends receivable | | 270,403 |
Distributions receivable from Fidelity Central Funds | | 4,169 |
Receivable from investment adviser for expense reductions | | 33,993 |
Other receivables | | 7,075 |
Total assets | | 203,418,386 |
| | |
Liabilities | | |
Payable for investments purchased | $ 4,214,811 | |
Payable for fund shares redeemed | 174,237 | |
Accrued management fee | 121,924 | |
Distribution and service plan fees payable | 14,452 | |
Other affiliated payables | 46,085 | |
Other payables and accrued expenses | 65,406 | |
Collateral on securities loaned, at value | 5,935,200 | |
Total liabilities | | 10,572,115 |
| | |
Net Assets | | $ 192,846,271 |
Net Assets consist of: | | |
Paid in capital | | $ 187,380,543 |
Undistributed net investment income | | 1,374,430 |
Accumulated undistributed net realized gain (loss) on investments and foreign currency transactions | | (5,900,404) |
Net unrealized appreciation (depreciation) on investments and assets and liabilities in foreign currencies | | 9,991,702 |
Net Assets | | $ 192,846,271 |
See accompanying notes which are an integral part of the financial statements.
Annual Report
Financial Statements - continued
Statement of Assets and Liabilities - continued
| October 31, 2012 |
| | |
Calculation of Maximum Offering Price Class A:
Net Asset Value and redemption price per share ($21,874,352 ÷ 2,455,261 shares) | | $ 8.91 |
| | |
Maximum offering price per share (100/94.25 of $8.91) | | $ 9.45 |
Class T:
Net Asset Value and redemption price per share ($10,689,976 ÷ 1,202,180 shares) | | $ 8.89 |
| | |
Maximum offering price per share (100/96.50 of $8.89) | | $ 9.21 |
Class B:
Net Asset Value and offering price per share ($1,116,152 ÷ 125,639 shares)A | | $ 8.88 |
| | |
Class C:
Net Asset Value and offering price per share ($5,647,907 ÷ 638,785 shares)A | | $ 8.84 |
| | |
International Growth:
Net Asset Value, offering price and redemption price per share ($149,526,022 ÷ 16,710,639 shares) | | $ 8.95 |
| | |
Institutional Class:
Net Asset Value, offering price and redemption price per share ($3,991,862 ÷ 446,301 shares) | | $ 8.94 |
A Redemption price per share is equal to net asset value less any applicable contingent deferred sales charge.
See accompanying notes which are an integral part of the financial statements.
Annual Report
Statement of Operations
| Year ended October 31, 2012 |
| | |
Investment Income | | |
Dividends | | $ 3,011,819 |
Interest | | 13 |
Income from Fidelity Central Funds | | 64,377 |
Income before foreign taxes withheld | | 3,076,209 |
Less foreign taxes withheld | | (190,510) |
Total income | | 2,885,699 |
| | |
Expenses | | |
Management fee
Basic fee | $ 841,290 | |
Performance adjustment | 98,242 | |
Transfer agent fees | 325,129 | |
Distribution and service plan fees | 96,288 | |
Accounting and security lending fees | 62,806 | |
Custodian fees and expenses | 59,416 | |
Independent trustees' compensation | 721 | |
Registration fees | 83,181 | |
Audit | 66,173 | |
Legal | 501 | |
Miscellaneous | 773 | |
Total expenses before reductions | 1,634,520 | |
Expense reductions | (126,529) | 1,507,991 |
Net investment income (loss) | | 1,377,708 |
Realized and Unrealized Gain (Loss) Net realized gain (loss) on: | | |
Investment securities: | | |
Unaffiliated issuers | (820,062) | |
Foreign currency transactions | (13,150) | |
Total net realized gain (loss) | | (833,212) |
Change in net unrealized appreciation (depreciation) on: Investment securities | 11,235,369 | |
Assets and liabilities in foreign currencies | (8,388) | |
Total change in net unrealized appreciation (depreciation) | | 11,226,981 |
Net gain (loss) | | 10,393,769 |
Net increase (decrease) in net assets resulting from operations | | $ 11,771,477 |
See accompanying notes which are an integral part of the financial statements.
Annual Report
Financial Statements - continued
Statement of Changes in Net Assets
| Year ended
October 31,
2012 | Year ended
October 31,
2011 |
Increase (Decrease) in Net Assets | | |
Operations | | |
Net investment income (loss) | $ 1,377,708 | $ 628,947 |
Net realized gain (loss) | (833,212) | 1,817,821 |
Change in net unrealized appreciation (depreciation) | 11,226,981 | (6,057,574) |
Net increase (decrease) in net assets resulting
from operations | 11,771,477 | (3,610,806) |
Distributions to shareholders from net investment income | (594,738) | (276,358) |
Distributions to shareholders from net realized gain | (48,645) | (48,341) |
Total distributions | (643,383) | (324,699) |
Share transactions - net increase (decrease) | 115,271,822 | 35,841,228 |
Redemption fees | 5,972 | 7,927 |
Total increase (decrease) in net assets | 126,405,888 | 31,913,650 |
| | |
Net Assets | | |
Beginning of period | 66,440,383 | 34,526,733 |
End of period (including undistributed net investment income of $1,374,430 and undistributed net investment income of $591,460, respectively) | $ 192,846,271 | $ 66,440,383 |
See accompanying notes which are an integral part of the financial statements.
Annual Report
Financial Highlights - Class A
Years ended October 31, | 2012 | 2011 | 2010 | 2009 | 2008 F |
Selected Per-Share Data | | | | | |
Net asset value, beginning of period | $ 8.09 | $ 8.38 | $ 7.01 | $ 5.46 | $ 10.00 |
Income from Investment Operations | | | | | |
Net investment income (loss) C | .08 | .08 | .05 | .05 | .07 |
Net realized and unrealized gain (loss) | .81 | (.31) | 1.39 | 1.55 | (4.61) |
Total from investment operations | .89 | (.23) | 1.44 | 1.60 | (4.54) |
Distributions from net investment income | (.06) | (.05) | (.05) | (.05) | - |
Distributions from net realized gain | (.01) | (.01) | (.03) | - | - |
Total distributions | (.07) | (.06) | (.07) I | (.05) | - |
Redemption fees added to paid in capital C, H | - | - | - | - | - |
Net asset value, end of period | $ 8.91 | $ 8.09 | $ 8.38 | $ 7.01 | $ 5.46 |
Total Return A, B | 11.10% | (2.76)% | 20.68% | 29.72% | (45.40)% |
Ratios to Average Net Assets D, G | | | | | |
Expenses before reductions | 1.58% | 1.77% | 2.13% | 2.46% | 2.88% |
Expenses net of fee waivers, if any | 1.45% | 1.45% | 1.50% | 1.50% | 1.50% |
Expenses net of all reductions | 1.44% | 1.43% | 1.48% | 1.47% | 1.48% |
Net investment income (loss) | .99% | .92% | .74% | .85% | .80% |
Supplemental Data | | | | | |
Net assets, end of period (000 omitted) | $ 21,874 | $ 6,352 | $ 3,084 | $ 1,452 | $ 820 |
Portfolio turnover rate E | 32% | 68% | 87% | 116% | 115% |
A Total returns would have been lower if certain expenses had not been reduced during the applicable periods shown.
B Total returns do not include the effect of the sales charges.
C Calculated based on average shares outstanding during the period.
D Fees and expenses of any underlying Fidelity Central Funds are not included in the Fund's expense ratio. The Fund indirectly bears its proportionate share of the expenses of any underlying Fidelity Central Funds.
E Amount does not include the portfolio activity of any underlying Fidelity Central Funds.
F For the period November 1, 2007 (commencement of operations) to October 31, 2008.
G Expense ratios reflect operating expenses of the class. Expenses before reductions do not reflect amounts reimbursed by the investment adviser or reductions from brokerage service arrangements or reductions from other expense offset arrangements and do not represent the amount paid by the class during periods when reimbursements or reductions occur. Expense ratios before reductions for start-up periods may not be representative of longer-term operating periods. Expenses net of fee waivers reflect expenses after reimbursement by the investment adviser but prior to reductions from brokerage service arrangements or other expense offset arrangements. Expenses net of all reductions represent the net expenses paid by the class.
H Amount represents less than $.01 per share.
I Total distributions of $.07 per share is comprised of distributions from net investment income of $.046 and distributions from net realized gain of $.025 per share.
See accompanying notes which are an integral part of the financial statements.
Annual Report
Financial Highlights - Class T
Years ended October 31, | 2012 | 2011 | 2010 | 2009 | 2008 F |
Selected Per-Share Data | | | | | |
Net asset value, beginning of period | $ 8.08 | $ 8.38 | $ 7.00 | $ 5.45 | $ 10.00 |
Income from Investment Operations | | | | | |
Net investment income (loss) C | .06 | .06 | .04 | .03 | .05 |
Net realized and unrealized gain (loss) | .81 | (.31) | 1.39 | 1.55 | (4.60) |
Total from investment operations | .87 | (.25) | 1.43 | 1.58 | (4.55) |
Distributions from net investment income | (.05) | (.04) | (.02) | (.03) | - |
Distributions from net realized gain | (.01) | (.01) | (.03) | - | - |
Total distributions | (.06) | (.05) | (.05) | (.03) | - |
Redemption fees added to paid in capital C, H | - | - | - | - | - |
Net asset value, end of period | $ 8.89 | $ 8.08 | $ 8.38 | $ 7.00 | $ 5.45 |
Total Return A, B | 10.82% | (3.03)% | 20.47% | 29.22% | (45.50)% |
Ratios to Average Net Assets D, G | | | | | |
Expenses before reductions | 1.85% | 2.03% | 2.41% | 2.67% | 3.07% |
Expenses net of fee waivers, if any | 1.70% | 1.70% | 1.75% | 1.75% | 1.75% |
Expenses net of all reductions | 1.69% | 1.68% | 1.73% | 1.73% | 1.73% |
Net investment income (loss) | .74% | .67% | .49% | .59% | .55% |
Supplemental Data | | | | | |
Net assets, end of period (000 omitted) | $ 10,690 | $ 2,917 | $ 1,034 | $ 532 | $ 507 |
Portfolio turnover rate E | 32% | 68% | 87% | 116% | 115% |
A Total returns would have been lower if certain expenses had not been reduced during the applicable periods shown.
B Total returns do not include the effect of the sales charges.
C Calculated based on average shares outstanding during the period.
D Fees and expenses of any underlying Fidelity Central Funds are not included in the Fund's expense ratio. The Fund indirectly bears its proportionate share of the expenses of any underlying Fidelity Central Funds.
E Amount does not include the portfolio activity of any underlying Fidelity Central Funds.
F For the period November 1, 2007 (commencement of operations) to October 31, 2008.
G Expense ratios reflect operating expenses of the class. Expenses before reductions do not reflect amounts reimbursed by the investment adviser or reductions from brokerage service arrangements or reductions from other expense offset arrangements and do not represent the amount paid by the class during periods when reimbursements or reductions occur. Expense ratios before reductions for start-up periods may not be representative of longer-term operating periods. Expenses net of fee waivers reflect expenses after reimbursement by the investment adviser but prior to reductions from brokerage service arrangements or other expense offset arrangements. Expenses net of all reductions represent the net expenses paid by the class.
H Amount represents less than $.01 per share.
See accompanying notes which are an integral part of the financial statements.
Annual Report
Financial Highlights - Class B
Years ended October 31, | 2012 | 2011 | 2010 | 2009 | 2008 F |
Selected Per-Share Data | | | | | |
Net asset value, beginning of period | $ 8.06 | $ 8.36 | $ 6.98 | $ 5.42 | $ 10.00 |
Income from Investment Operations | | | | | |
Net investment income (loss) C | .02 | .01 | - H | .01 | - H |
Net realized and unrealized gain (loss) | .80 | (.30) | 1.38 | 1.55 | (4.58) |
Total from investment operations | .82 | (.29) | 1.38 | 1.56 | (4.58) |
Distributions from net investment income | - | (.01) | - | - | - |
Distributions from net realized gain | - | - H | - | - | - |
Total distributions | - | (.01) | - | - | - |
Redemption fees added to paid in capital C, H | - | - | - | - | - |
Net asset value, end of period | $ 8.88 | $ 8.06 | $ 8.36 | $ 6.98 | $ 5.42 |
Total Return A, B | 10.17% | (3.47)% | 19.77% | 28.78% | (45.80)% |
Ratios to Average Net Assets D, G | | | | | |
Expenses before reductions | 2.35% | 2.55% | 2.87% | 3.17% | 3.55% |
Expenses net of fee waivers, if any | 2.20% | 2.20% | 2.25% | 2.25% | 2.25% |
Expenses net of all reductions | 2.19% | 2.18% | 2.23% | 2.23% | 2.23% |
Net investment income (loss) | .24% | .17% | (.01)% | .09% | .05% |
Supplemental Data | | | | | |
Net assets, end of period (000 omitted) | $ 1,116 | $ 473 | $ 581 | $ 328 | $ 642 |
Portfolio turnover rate E | 32% | 68% | 87% | 116% | 115% |
A Total returns would have been lower if certain expenses had not been reduced during the applicable periods shown.
B Total returns do not include the effect of the contingent deferred sales charge.
C Calculated based on average shares outstanding during the period.
D Fees and expenses of any underlying Fidelity Central Funds are not included in the Fund's expense ratio. The Fund indirectly bears its proportionate share of the expenses of any underlying Fidelity Central Funds.
E Amount does not include the portfolio activity of any underlying Fidelity Central Funds.
F For the period November 1, 2007 (commencement of operations) to October 31, 2008.
G Expense ratios reflect operating expenses of the class. Expenses before reductions do not reflect amounts reimbursed by the investment adviser or reductions from brokerage service arrangements or reductions from other expense offset arrangements and do not represent the amount paid by the class during periods when reimbursements or reductions occur. Expense ratios before reductions for start-up periods may not be representative of longer-term operating periods. Expenses net of fee waivers reflect expenses after reimbursement by the investment adviser but prior to reductions from brokerage service arrangements or other expense offset arrangements. Expenses net of all reductions represent the net expenses paid by the class.
H Amount represents less than $.01 per share.
See accompanying notes which are an integral part of the financial statements.
Annual Report
Financial Highlights - Class C
Years ended October 31, | 2012 | 2011 | 2010 | 2009 | 2008 F |
Selected Per-Share Data | | | | | |
Net asset value, beginning of period | $ 8.03 | $ 8.34 | $ 6.98 | $ 5.42 | $ 10.00 |
Income from Investment Operations | | | | | |
Net investment income (loss) C | .02 | .01 | - H | .01 | - H |
Net realized and unrealized gain (loss) | .80 | (.31) | 1.38 | 1.55 | (4.58) |
Total from investment operations | .82 | (.30) | 1.38 | 1.56 | (4.58) |
Distributions from net investment income | (.01) | (.01) | - | - | - |
Distributions from net realized gain | (.01) | (.01) | (.02) | - | - |
Total distributions | (.01) J | (.01) I | (.02) | - | - |
Redemption fees added to paid in capital C, H | - | - | - | - | - |
Net asset value, end of period | $ 8.84 | $ 8.03 | $ 8.34 | $ 6.98 | $ 5.42 |
Total Return A, B | 10.27% | (3.57)% | 19.82% | 28.78% | (45.80)% |
Ratios to Average Net Assets D, G | | | | | |
Expenses before reductions | 2.33% | 2.52% | 2.89% | 3.21% | 3.52% |
Expenses net of fee waivers, if any | 2.20% | 2.20% | 2.25% | 2.25% | 2.25% |
Expenses net of all reductions | 2.19% | 2.18% | 2.24% | 2.23% | 2.23% |
Net investment income (loss) | .24% | .17% | (.01)% | .09% | .05% |
Supplemental Data | | | | | |
Net assets, end of period (000 omitted) | $ 5,648 | $ 2,767 | $ 1,261 | $ 780 | $ 684 |
Portfolio turnover rate E | 32% | 68% | 87% | 116% | 115% |
A Total returns would have been lower if certain expenses had not been reduced during the applicable periods shown.
B Total returns do not include the effect of the contingent deferred sales charge.
C Calculated based on average shares outstanding during the period.
D Fees and expenses of any underlying Fidelity Central Funds are not included in the Fund's expense ratio. The Fund indirectly bears its proportionate share of the expenses of any underlying Fidelity Central Funds.
E Amount does not include the portfolio activity of any underlying Fidelity Central Funds.
F For the period November 1, 2007 (commencement of operations) to October 31, 2008.
G Expense ratios reflect operating expenses of the class. Expenses before reductions do not reflect amounts reimbursed by the investment adviser or reductions from brokerage service arrangements or reductions from other expense offset arrangements and do not represent the amount paid by the class during periods when reimbursements or reductions occur. Expense ratios before reductions for start-up periods may not be representative of longer-term operating periods. Expenses net of fee waivers reflect expenses after reimbursement by the investment adviser but prior to reductions from brokerage service arrangements or other expense offset arrangements. Expenses net of all reductions represent the net expenses paid by the class.
H Amount represents less than $.01 per share.
I Total distributions of $.01 per share is comprised of distributions from net investment income of $.008 and distributions from net realized gain of $.005 per share.
J Total distributions of $.01 per share is comprised of distributions from net investment income of $.007 and distributions from net realized gain of $.006 per share.
See accompanying notes which are an integral part of the financial statements.
Annual Report
Financial Highlights - International Growth
Years ended October 31, | 2012 | 2011 | 2010 | 2009 | 2008 E |
Selected Per-Share Data | | | | | |
Net asset value, beginning of period | $ 8.12 | $ 8.40 | $ 7.02 | $ 5.48 | $ 10.00 |
Income from Investment Operations | | | | | |
Net investment income (loss) B | .11 | .10 | .07 | .06 | .09 |
Net realized and unrealized gain (loss) | .81 | (.30) | 1.39 | 1.54 | (4.60) |
Total from investment operations | .92 | (.20) | 1.46 | 1.60 | (4.51) |
Distributions from net investment income | (.08) | (.07) | (.06) | (.06) | (.01) |
Distributions from net realized gain | (.01) | (.01) | (.03) | - | - |
Total distributions | (.09) | (.08) | (.08) H | (.06) | (.01) |
Redemption fees added to paid in capital B, G | - | - | - | - | - |
Net asset value, end of period | $ 8.95 | $ 8.12 | $ 8.40 | $ 7.02 | $ 5.48 |
Total Return A | 11.41% | (2.47)% | 20.97% | 29.77% | (45.17)% |
Ratios to Average Net Assets C, F | | | | | |
Expenses before reductions | 1.28% | 1.52% | 1.89% | 2.19% | 2.35% |
Expenses net of fee waivers, if any | 1.20% | 1.20% | 1.25% | 1.25% | 1.25% |
Expenses net of all reductions | 1.19% | 1.18% | 1.23% | 1.23% | 1.23% |
Net investment income (loss) | 1.24% | 1.17% | .99% | 1.09% | 1.05% |
Supplemental Data | | | | | |
Net assets, end of period (000 omitted) | $ 149,526 | $ 53,437 | $ 28,454 | $ 18,254 | $ 11,884 |
Portfolio turnover rate D | 32% | 68% | 87% | 116% | 115% |
A Total returns would have been lower if certain expenses had not been reduced during the applicable periods shown.
B Calculated based on average shares outstanding during the period.
C Fees and expenses of any underlying Fidelity Central Funds are not included in the Fund's expense ratio. The Fund indirectly bears its proportionate share of the expenses of any underlying Fidelity Central Funds.
D Amount does not include the portfolio activity of any underlying Fidelity Central Funds.
E For the period November 1, 2007 (commencement of operations) to October 31, 2008.
F Expense ratios reflect operating expenses of the class. Expenses before reductions do not reflect amounts reimbursed by the investment adviser or reductions from brokerage service arrangements or reductions from other expense offset arrangements and do not represent the amount paid by the class during periods when reimbursements or reductions occur. Expense ratios before reductions for start-up periods may not be representative of longer-term operating periods. Expenses net of fee waivers reflect expenses after reimbursement by the investment adviser but prior to reductions from brokerage service arrangements or other expense offset arrangements. Expenses net of all reductions represent the net expenses paid by the class.
G Amount represents less than $.01 per share.
H Total distributions of $.08 per share is comprised of distributions from net investment income of $.057 and distributions from net realized gain of $.025 per share.
See accompanying notes which are an integral part of the financial statements.
Annual Report
Financial Highlights - Institutional Class
Years ended October 31, | 2012 | 2011 | 2010 | 2009 | 2008 E |
Selected Per-Share Data | | | | | |
Net asset value, beginning of period | $ 8.12 | $ 8.40 | $ 7.02 | $ 5.48 | $ 10.00 |
Income from Investment Operations | | | | | |
Net investment income (loss) B | .10 | .10 | .07 | .06 | .09 |
Net realized and unrealized gain (loss) | .81 | (.30) | 1.39 | 1.54 | (4.60) |
Total from investment operations | .91 | (.20) | 1.46 | 1.60 | (4.51) |
Distributions from net investment income | (.08) | (.07) | (.06) | (.06) | (.01) |
Distributions from net realized gain | (.01) | (.01) | (.03) | - | - |
Total distributions | (.09) | (.08) | (.08) H | (.06) | (.01) |
Redemption fees added to paid in capital B, G | - | - | - | - | - |
Net asset value, end of period | $ 8.94 | $ 8.12 | $ 8.40 | $ 7.02 | $ 5.48 |
Total Return A | 11.28% | (2.47)% | 20.97% | 29.77% | (45.17)% |
Ratios to Average Net Assets C, F | | | | | |
Expenses before reductions | 1.27% | 1.50% | 1.92% | 2.01% | 2.56% |
Expenses net of fee waivers, if any | 1.20% | 1.20% | 1.25% | 1.25% | 1.25% |
Expenses net of all reductions | 1.19% | 1.18% | 1.23% | 1.23% | 1.23% |
Net investment income (loss) | 1.24% | 1.17% | .99% | 1.09% | 1.05% |
Supplemental Data | | | | | |
Net assets, end of period (000 omitted) | $ 3,992 | $ 493 | $ 113 | $ 36 | $ 521 |
Portfolio turnover rate D | 32% | 68% | 87% | 116% | 115% |
A Total returns would have been lower if certain expenses had not been reduced during the applicable periods shown.
B Calculated based on average shares outstanding during the period.
C Fees and expenses of any underlying Fidelity Central Funds are not included in the Fund's expense ratio. The Fund indirectly bears its proportionate share of the expenses of any underlying Fidelity Central Funds.
D Amount does not include the portfolio activity of any underlying Fidelity Central Funds.
E For the period November 1, 2007 (commencement of operations) to October 31, 2008.
F Expense ratios reflect operating expenses of the class. Expenses before reductions do not reflect amounts reimbursed by the investment adviser or reductions from brokerage service arrangements or reductions from other expense offset arrangements and do not represent the amount paid by the class during periods when reimbursements or reductions occur. Expense ratios before reductions for start-up periods may not be representative of longer-term operating periods. Expenses net of fee waivers reflect expenses after reimbursement by the investment adviser but prior to reductions from brokerage service arrangements or other expense offset arrangements. Expenses net of all reductions represent the net expenses paid by the class.
G Amount represents less than $.01 per share.
H Total distributions of $.08 per share is comprised of distributions from net investment income of $.057 and distributions from net realized gain of $.025 per share.
See accompanying notes which are an integral part of the financial statements.
Annual Report
Notes to Financial Statements
For the period ended October 31, 2012
1. Organization.
Fidelity International Growth Fund (the Fund) is a fund of Fidelity Investment Trust (the Trust) and is authorized to issue an unlimited number of shares. The Trust is registered under the Investment Company Act of 1940, as amended (the 1940 Act), as an open-end management investment company organized as a Massachusetts business trust. The Fund offers Class A, Class T, Class C, International Growth and Institutional Class shares, each of which, along with Class B shares, has equal rights as to assets and voting privileges. Effective after the close of business on September 1, 2010, Class B shares were closed to new accounts and additional purchases, except for exchanges and reinvestments. Each class has exclusive voting rights with respect to matters that affect that class. Class B shares will automatically convert to Class A shares after a holding period of seven years from the initial date of purchase. Investment income, realized and unrealized capital gains and losses, the common expenses of the Fund, and certain fund-level expense reductions, if any, are allocated on a pro-rata basis to each class based on the relative net assets of each class to the total net assets of the Fund. Each class differs with respect to transfer agent and distribution and service plan fees incurred. Certain expense reductions may also differ by class.
2. Investments in Fidelity Central Funds.
The Fund invests in Fidelity Central Funds, which are open-end investment companies available only to other investment companies and accounts managed by Fidelity Management & Research Company (FMR) and its affiliates. The Fund's Schedule of Investments lists each of the Fidelity Central Funds held as of period end, if any, as an investment of the Fund, but does not include the underlying holdings of each Fidelity Central Fund. As an Investing Fund, the Fund indirectly bears its proportionate share of the expenses of the underlying Fidelity Central Funds.
The Money Market Central Funds seek preservation of capital and current income and are managed by Fidelity Investments Money Management, Inc. (FIMM), an affiliate of FMR.
A complete unaudited list of holdings for each Fidelity Central Fund is available upon request or at the Securities and Exchange Commission (the SEC) web site at www.sec.gov. In addition, the financial statements of the Fidelity Central Funds, which are not covered by the Fund's Report of Independent Registered Public Accounting Firm, are available on the SEC web site or upon request.
Annual Report
3. Significant Accounting Policies.
The financial statements have been prepared in conformity with accounting principles generally accepted in the United States of America (GAAP), which require management to make certain estimates and assumptions at the date of the financial statements. Actual results could differ from those estimates. Subsequent events, if any, through the date that the financial statements were issued have been evaluated in the preparation of the financial statements. The following summarizes the significant accounting policies of the Fund:
Security Valuation. Investments are valued as of 4:00 p.m. Eastern time on the last calendar day of the period. In accordance with valuation policies and procedures approved by the Board of Trustees (the Board), the Fund attempts to obtain prices from one or more third party pricing vendors or brokers to value its investments. When current market prices, quotations or rates are not readily available or reliable, securities will be fair valued in good faith by the FMR Fair Value Committee (the Committee), in accordance with procedures adopted by the Fund's Board. Factors used in determining fair value vary by security type and may include market or security specific events. The frequency with which these procedures are used cannot be predicted and they may be utilized to a significant extent. The Committee oversees the Fund's valuation policies and procedures and is responsible for approving and reporting to the Board all fair value determinations.
The Fund categorizes the inputs to valuation techniques used to value its investments into a disclosure hierarchy consisting of three levels as shown below:
Level 1 - quoted prices in active markets for identical investments
Level 2 - other significant observable inputs (including quoted prices for similar investments, interest rates, prepayment speeds, etc.)
Level 3 - unobservable inputs (including the Fund's own assumptions based on the best information available)
Valuation techniques used to value the Fund's investments by major category are as follows:
Equity securities, including restricted securities, for which market quotations are readily available, are valued at the last reported sale price or official closing price as reported by a third party pricing vendor on the primary market or exchange on which they are traded and are categorized as Level 1 in the hierarchy. In the event there were no sales during the day or closing prices are not available, securities are valued at the last quoted bid price or may be valued using the last available price and are generally categorized as Level 2 in the hierarchy. For foreign equity securities, when significant market or security specific events arise, comparisons to the valuation of American Depositary Receipts
Annual Report
Notes to Financial Statements - continued
3. Significant Accounting Policies - continued
Security Valuation - continued
(ADRs), futures contracts, Exchange-Traded Funds (ETFs) and certain indexes as well as quoted prices for similar securities are used and are categorized as Level 2 in the hierarchy. Utilizing these techniques may result in transfers between Level 1 and Level 2.
Investments in open-end mutual funds, including the Fidelity Central Funds, are valued at their closing net asset value (NAV) each business day and are categorized as Level 1 in the hierarchy.
Changes in valuation techniques may result in transfers in or out of an assigned level within the disclosure hierarchy. The aggregate value of investments by input level, as of October 31, 2012, including information on transfers between Levels 1 and 2, is included at the end of the Fund's Schedule of Investments.
Foreign Currency Translation. The Fund may use foreign currency contracts to facilitate transactions in foreign-denominated securities. Gains and losses from these transactions may arise from changes in the value of the foreign currency or if the counterparties do not perform under the contracts' terms.
Foreign-denominated assets, including investment securities, and liabilities are translated into U.S. dollars at the exchange rates at period end. Purchases and sales of investment securities, income and dividends received and expenses denominated in foreign currencies are translated into U.S. dollars at the exchange rate in effect on the transaction date.
The effects of exchange rate fluctuations on investments are included with the net realized and unrealized gain (loss) on investment securities. Other foreign currency transactions resulting in realized and unrealized gain (loss) are disclosed separately.
Investment Transactions and Income. For financial reporting purposes, the Fund's investment holdings and NAV include trades executed through the end of the last business day of the period. The NAV per share for processing shareholder transactions is calculated as of the close of business of the New York Stock Exchange (NYSE), normally 4:00 p.m. Eastern time and includes trades executed through the end of the prior business day. Gains and losses on securities sold are determined on the basis of identified cost. Dividend income is recorded on the ex-dividend date, except for certain dividends from foreign securities where the ex-dividend date may have passed, which are recorded as soon as the Fund is informed of the ex-dividend date. Non-cash dividends included in dividend income, if any, are recorded at the fair market value of the securities received. Interest income and distributions from the Fidelity Central Funds are accrued as earned. Interest income includes coupon interest and amortization of premium and accretion of discount on debt securities. Investment income is recorded net of foreign taxes withheld where recovery of such taxes is uncertain.
Annual Report
3. Significant Accounting Policies - continued
Expenses. Expenses directly attributable to a fund are charged to that fund. Expenses attributable to more than one fund are allocated among the respective funds on the basis of relative net assets or other appropriate methods. Expense estimates are accrued in the period to which they relate and adjustments are made when actual amounts are known.
Income Tax Information and Distributions to Shareholders. Each year, the Fund intends to qualify as a regulated investment company under Subchapter M of the Internal Revenue Code, including distributing substantially all of its taxable income and realized gains. As a result, no provision for income taxes is required. As of October 31, 2012, the Fund did not have any unrecognized tax benefits in the financial statements; nor is the Fund aware of any tax positions for which it is reasonably possible that the total amounts of unrecognized tax benefits will significantly change in the next twelve months. The Fund files a U.S. federal tax return, in addition to state and local tax returns as required. A fund's federal income tax returns are subject to examination by the Internal Revenue Service (IRS) for a period of three fiscal years after they are filed. State and local tax returns may be subject to examination for an additional fiscal year depending on the jurisdiction. Foreign taxes are provided for based on the Fund's understanding of the tax rules and rates that exist in the foreign markets in which it invests.
Distributions are declared and recorded on the ex-dividend date. Income dividends and capital gain distributions are declared separately for each class. Income and capital gain distributions are determined in accordance with income tax regulations, which may differ from GAAP.
Capital accounts within the financial statements are adjusted for permanent book-tax differences. These adjustments have no impact on net assets or the results of operations. Temporary book-tax differences will reverse in a subsequent period.
Book-tax differences are primarily due to foreign currency transactions, passive foreign investment companies (PFIC), partnerships, capital loss carryforwards and losses deferred due to wash sales.
The federal tax cost of investment securities and unrealized appreciation (depreciation) as of period end were as follows:
Gross unrealized appreciation | $ 16,586,724 |
Gross unrealized depreciation | (6,916,202) |
Net unrealized appreciation (depreciation) on securities and other investments | $ 9,670,522 |
| |
Tax Cost | $ 192,376,923 |
Annual Report
Notes to Financial Statements - continued
3. Significant Accounting Policies - continued
Income Tax Information and Distributions to Shareholders - continued
The tax-based components of distributable earnings as of period end were as follows:
Undistributed ordinary income | $ 1,436,227 |
Capital loss carryforward | $ (5,633,645) |
Net unrealized appreciation (depreciation) | $ 9,663,146 |
Capital loss carryforwards are only available to offset future capital gains of the Fund to the extent provided by regulations and may be limited. Under the Regulated Investment Company Modernization Act of 2010 (the Act), the Fund is permitted to carry forward capital losses incurred in taxable years beginning after December 22, 2010 for an unlimited period and such capital losses are required to be used prior to any losses that expire. Capital loss carryforwards were as follows:
Fiscal year of expiration | |
2016 | $ (1,819,472) |
2017 | (2,797,799) |
Total with expiration | (4,617,271) |
No expiration | |
Short-term | (1,016,374) |
Total capital loss carryforward | $ (5,633,645) |
The tax character of distributions paid was as follows:
| October 31, 2012 | October 31, 2011 |
Ordinary Income | $ 643,383 | $ 324,699 |
Short-Term Trading (Redemption) Fees. Shares held by investors in the Fund less than 30 days are subject to a redemption fee equal to 1.00% of the net asset value of shares redeemed. All redemption fees, which reduce the proceeds of the shareholder redemption, are retained by the Fund and accounted for as an addition to paid in capital.
New Accounting Pronouncement. In December 2011, the Financial Accounting Standards Board issued Accounting Standard Update No. 2011-11, Disclosures about Offsetting Assets and Liabilities. The update creates new disclosure requirements requiring entities to disclose both gross and net information for derivatives and other financial instruments that are either offset in the Statement of Assets and Liabilities or subject to an enforceable master netting arrangement or similar agreement. The disclosure requirements are effective for annual reporting periods beginning on or after January 1, 2013, and interim periods within those annual periods. Management is
Annual Report
3. Significant Accounting Policies - continued
New Accounting Pronouncement - continued
currently evaluating the impact of the update's adoption on the Fund's financial statement disclosures.
4. Purchases and Sales of Investments.
Purchases and sales of securities, other than short-term securities, aggregated $152,600,135 and $37,480,345, respectively.
5. Fees and Other Transactions with Affiliates.
Management Fee. FMR and its affiliates provide the Fund with investment management related services for which the Fund pays a monthly management fee. The management fee is the sum of an individual fund fee rate that is based on an annual rate of .45% of the Fund's average net assets and an annualized group fee rate that averaged .26% during the period. The group fee rate is based upon the average net assets of all the mutual funds advised by FMR. The group fee rate decreases as assets under management increase and increases as assets under management decrease. In addition, the management fee is subject to a performance adjustment (up to a maximum of ± .20% of the Fund's average net assets over a 36 month performance period). The upward or downward adjustment to the management fee is based on the relative investment performance of International Growth as compared to an appropriate benchmark index. For the period, the total annual management fee rate, including the performance adjustment, was .79% of the Fund's average net assets.
Distribution and Service Plan Fees. In accordance with Rule 12b-1 of the 1940 Act, the Fund has adopted separate Distribution and Service Plans for each class of shares. Certain classes pay Fidelity Distributors Corporation (FDC), an affiliate of FMR, separate Distribution and Service Fees, each of which is based on an annual percentage of each class' average net assets. In addition, FDC may pay financial intermediaries for selling shares of the Fund and providing shareholder support services. For the period, the Distribution and Service Fee rates, total fees and amounts retained by FDC were as follows:
| Distribution
Fee | Service
Fee | Total Fees | Retained
by FDC |
Class A | -% | .25% | $ 27,055 | $ 698 |
Class T | .25% | .25% | 25,571 | 121 |
Class B | .75% | .25% | 6,002 | 4,531 |
Class C | .75% | .25% | 37,660 | 12,092 |
| | | $ 96,288 | $ 17,442 |
Annual Report
Notes to Financial Statements - continued
5. Fees and Other Transactions with Affiliates - continued
Sales Load. FDC may receive a front-end sales charge of up to 5.75% for selling Class A shares and 3.50% for selling Class T shares, some of which is paid to financial intermediaries for selling shares of the Fund. Depending on the holding period, FDC may receive contingent deferred sales charges levied on Class A, Class T, Class B, and Class C redemptions. The deferred sales charges range from 5.00% to 1.00% for Class B shares, 1.00% for Class C shares, 1.00% for certain purchases of Class A shares and .25% for certain purchases of Class T shares.
For the period, sales charge amounts retained by FDC were as follows:
| Retained
by FDC |
Class A | $ 15,825 |
Class T | 3,545 |
Class B* | 1,058 |
Class C* | 1,676 |
| $ 22,104 |
* When Class B and Class C shares are initially sold, FDC pays commissions from its own resources to financial intermediaries through which the sales are made.
Transfer Agent Fees. Fidelity Investments Institutional Operations Company, Inc. (FIIOC), an affiliate of FMR, is the transfer, dividend disbursing and shareholder servicing agent for each class of the Fund. FIIOC receives account fees and asset-based fees that vary according to the account size and type of account of the shareholders of the respective classes of the Fund. FIIOC pays for typesetting, printing and mailing of shareholder reports, except proxy statements. For the period, transfer agent fees for each class were as follows:
| Amount | % of
Average
Net Assets |
Class A | $ 32,331 | .30 |
Class T | 16,359 | .32 |
Class B | 1,802 | .30 |
Class C | 11,442 | .30 |
International Growth | 258,582 | .27 |
Institutional Class | 4,613 | .25 |
| $ 325,129 | |
Annual Report
5. Fees and Other Transactions with Affiliates - continued
Accounting and Security Lending Fees. Fidelity Service Company, Inc. (FSC), an affiliate of FMR, maintains the Fund's accounting records. The accounting fee is based on the level of average net assets for each month. Under a separate contract, FSC administers the security lending program. The security lending fee is based on the number and duration of lending transactions.
Brokerage Commissions. The Fund placed a portion of its portfolio transactions with brokerage firms which are affiliates of the investment adviser. The commissions paid to these affiliated firms were $375 for the period.
6. Committed Line of Credit.
The Fund participates with other funds managed by FMR or an affiliate in a $4.25 billion credit facility (the "line of credit") to be utilized for temporary or emergency purposes to fund shareholder redemptions or for other short-term liquidity purposes. The Fund has agreed to pay commitment fees on its pro-rata portion of the line of credit, which amounted to $289 and is reflected in Miscellaneous expenses on the Statement of Operations. During the period, there were no borrowings on this line of credit.
7. Security Lending.
The Fund lends portfolio securities through a lending agent from time to time in order to earn additional income. For equity securities, a lending agent is used and may loan securities to certain qualified borrowers, including Fidelity Capital Markets (FCM), a broker-dealer affiliated with the Fund. On the settlement date of the loan, the Fund receives collateral (in the form of U.S. Treasury obligations, letters of credit and/or cash) against the loaned securities and maintains collateral in an amount not less than 100% of the market value of the loaned securities during the period of the loan. The market value of the loaned securities is determined at the close of business of the Fund and any additional required collateral is delivered to the Fund on the next business day. If the borrower defaults on its obligation to return the securities loaned because of insolvency or other reasons, a fund could experience delays and costs in recovering the securities loaned or in gaining access to the collateral. Any cash collateral received is invested in the Fidelity Securities Lending Cash Central Fund. The value of loaned securities and cash collateral at period end are disclosed on the Fund's Statement of Assets and Liabilities. Security lending income represents the income earned on investing cash collateral, less rebates paid to borrowers and any lending agent fees associated with the loan, plus any premium payments received for lending certain types of securities. Security lending income is presented in the Statement of Operations as a component of income from Fidelity Central Funds. Total security lending income during the period amounted to $56,903. During the period, there were no securities loaned to FCM.
Annual Report
Notes to Financial Statements - continued
8. Expense Reductions.
FMR contractually agreed to reimburse each class to the extent annual operating expenses exceeded certain levels of average net assets as noted in the table below. This reimbursement will remain in place through December 31, 2013. Some expenses, for example interest expense, including commitment fees, are excluded from this reimbursement.
The following classes were in reimbursement during the period:
| Expense
Limitations | Reimbursement
from adviser |
Class A | 1.45% | $ 13,952 |
Class T | 1.70% | 7,830 |
Class B | 2.20% | 897 |
Class C | 2.20% | 4,960 |
International Growth | 1.20% | 82,095 |
Institutional Class | 1.20% | 1,177 |
| | $ 110,911 |
Many of the brokers with whom FMR places trades on behalf of the Fund provided services to the Fund in addition to trade execution. These services included payments of certain expenses on behalf of the Fund totaling $15,575 for the period. In addition, through arrangements with the Fund's custodian, credits realized as a result of uninvested cash balances were used to reduce the Fund's expenses. During the period, these credits reduced the Fund's custody expenses by $43.
9. Distributions to Shareholders.
Distributions to shareholders of each class were as follows:
Years ended October 31, | 2012 | 2011 |
From net investment income | | |
Class A | $ 50,503 | $ 19,878 |
Class T | 18,666 | 5,087 |
Class B | - | 545 |
Class C | 2,205 | 1,547 |
International Growth | 516,958 | 247,117 |
Institutional Class | 6,406 | 2,184 |
Total | $ 594,738 | $ 276,358 |
Annual Report
9. Distributions to Shareholders - continued
Years ended October 31, | 2012 | 2011 |
From net realized gain | | |
Class A | $ 4,810 | $ 4,255 |
Class T | 2,196 | 1,455 |
Class B | - | 211 |
Class C | 1,890 | 826 |
International Growth | 39,262 | 41,245 |
Institutional Class | 487 | 349 |
Total | $ 48,645 | $ 48,341 |
10. Share Transactions.
Transactions for each class of shares were as follows:
| Shares | Dollars |
Years ended October 31, | 2012 | 2011 | 2012 | 2011 |
Class A | | | | |
Shares sold | 1,901,699 | 547,911 | $ 16,560,116 | $ 4,762,829 |
Reinvestment of distributions | 5,422 | 2,679 | 42,831 | 22,867 |
Shares redeemed | (236,851) | (133,581) | (2,015,265) | (1,142,023) |
Net increase (decrease) | 1,670,270 | 417,009 | $ 14,587,682 | $ 3,643,673 |
Class T | | | | |
Shares sold | 941,446 | 292,221 | $ 8,178,600 | $ 2,542,402 |
Reinvestment of distributions | 2,626 | 762 | 20,742 | 6,516 |
Shares redeemed | (102,766) | (55,432) | (866,637) | (470,382) |
Net increase (decrease) | 841,306 | 237,551 | $ 7,332,705 | $ 2,078,536 |
Class B | | | | |
Shares sold | 92,865 | 22,762 | $ 806,549 | $ 193,446 |
Reinvestment of distributions | - | 78 | - | 670 |
Shares redeemed | (25,954) | (33,639) | (218,180) | (282,311) |
Net increase (decrease) | 66,911 | (10,799) | $ 588,369 | $ (88,195) |
Class C | | | | |
Shares sold | 400,291 | 258,483 | $ 3,375,948 | $ 2,202,762 |
Reinvestment of distributions | 510 | 274 | 4,026 | 2,357 |
Shares redeemed | (106,475) | (65,559) | (879,489) | (555,739) |
Net increase (decrease) | 294,326 | 193,198 | $ 2,500,485 | $ 1,649,380 |
International Growth | | | | |
Shares sold | 13,301,892 | 5,799,026 | $ 114,028,412 | $ 50,047,832 |
Reinvestment of distributions | 68,821 | 33,184 | 544,378 | 283,553 |
Shares redeemed | (3,238,606) | (2,639,092) | (27,713,258) | (22,190,157) |
Net increase (decrease) | 10,132,107 | 3,193,118 | $ 86,859,532 | $ 28,141,228 |
Annual Report
Notes to Financial Statements - continued
10. Share Transactions - continued
| Shares | Dollars |
Years ended October 31, | 2012 | 2011 | 2012 | 2011 |
Institutional Class | | | | |
Shares sold | 438,656 | 76,126 | $ 3,841,370 | $ 670,433 |
Reinvestment of distributions | 655 | 292 | 5,178 | 2,491 |
Shares redeemed | (53,696) | (29,187) | (443,499) | (256,318) |
Net increase (decrease) | 385,615 | 47,231 | $ 3,403,049 | $ 416,606 |
11. Other.
The Fund's organizational documents provide former and current trustees and officers with a limited indemnification against liabilities arising in connection with the performance of their duties to the Fund. In the normal course of business, the Fund may also enter into contracts that provide general indemnifications. The Fund's maximum exposure under these arrangements is unknown as this would be dependent on future claims that may be made against the Fund. The risk of material loss from such claims is considered remote.
At the end of the period, Fidelity VIP FundsManager 60% Portfolio was the owner of record of approximately 10% of the total outstanding shares of the Fund.
Annual Report
To the Trustees of Fidelity Investment Trust and the Shareholders of Fidelity International Growth Fund:
In our opinion, the accompanying statement of assets and liabilities, including the schedule of investments, and the related statements of operations and of changes in net assets and the financial highlights present fairly, in all material respects, the financial position of Fidelity International Growth Fund (a fund of Fidelity Investment Trust) at October 31, 2012, the results of its operations for the year then ended, the changes in its net assets for each of the two years in the period then ended and the financial highlights for each of the periods indicated, in conformity with accounting principles generally accepted in the United States of America. These financial statements and financial highlights (hereafter referred to as "financial statements") are the responsibility of the Fidelity International Growth Fund's management. Our responsibility is to express an opinion on these financial statements based on our audits. We conducted our audits of these financial statements in accordance with the standards of the Public Company Accounting Oversight Board (United States). Those standards require that we plan and perform the audit to obtain reasonable assurance about whether the financial statements are free of material misstatement. An audit includes examining, on a test basis, evidence supporting the amounts and disclosures in the financial statements, assessing the accounting principles used and significant estimates made by management, and evaluating the overall financial statement presentation. We believe that our audits, which included confirmation of securities at October 31, 2012 by correspondence with the custodian and brokers, provide a reasonable basis for our opinion.
PricewaterhouseCoopers LLP
Boston, Massachusetts
December 14, 2012
Annual Report
The Trustees, Members of the Advisory Board, and executive officers of the trust and fund, as applicable, are listed below. The Board of Trustees governs the fund and is responsible for protecting the interests of shareholders. The Trustees are experienced executives who meet periodically throughout the year to oversee the fund's activities, review contractual arrangements with companies that provide services to the fund, oversee management of the risks associated with such activities and contractual arrangements, and review the fund's performance. Except for James C. Curvey, each of the Trustees oversees 236 funds advised by FMR or an affiliate. Mr. Curvey oversees 443 funds advised by FMR or an affiliate.
The Trustees hold office without limit in time except that (a) any Trustee may resign; (b) any Trustee may be removed by written instrument, signed by at least two-thirds of the number of Trustees prior to such removal; (c) any Trustee who requests to be retired or who has become incapacitated by illness or injury may be retired by written instrument signed by a majority of the other Trustees; and (d) any Trustee may be removed at any special meeting of shareholders by a two-thirds vote of the outstanding voting securities of the trust. Each Trustee who is not an interested person (as defined in the 1940 Act) (Independent Trustee), shall retire not later than the last day of the calendar year in which his or her 75th birthday occurs. The Independent Trustees may waive this mandatory retirement age policy with respect to individual Trustees. The executive officers and Advisory Board Members hold office without limit in time, except that any officer and Advisory Board Member may resign or may be removed by a vote of a majority of the Trustees at any regular meeting or any special meeting of the Trustees. Except as indicated, each individual has held the office shown or other offices in the same company for the past five years.
Experience, Skills, Attributes, and Qualifications of the Fund's Trustees. The Governance and Nominating Committee has adopted a statement of policy that describes the experience, qualifications, attributes, and skills that are necessary and desirable for potential Independent Trustee candidates (Statement of Policy). The Board believes that each Trustee satisfied at the time he or she was initially elected or appointed a Trustee, and continues to satisfy, the standards contemplated by the Statement of Policy. The Governance and Nominating Committee also engages professional search firms to help identify potential Independent Trustee candidates who have the experience, qualifications, attributes, and skills consistent with the Statement of Policy. From time to time, additional criteria based on the composition and skills of the current Independent Trustees, as well as experience or skills that may be appropriate in light of future changes to board composition, business conditions, and regulatory or other developments, have also been considered by the professional search firms and the Governance and Nominating Committee. In addition, the Board takes into account the Trustees' commitment and participation in Board and committee meetings, as well as their leadership of standing and ad hoc committees throughout their tenure.
In determining that a particular Trustee was and continues to be qualified to serve as a Trustee, the Board has considered a variety of criteria, none of which, in isolation, was controlling. The Board believes that, collectively, the Trustees have balanced and diverse experience, qualifications, attributes, and skills, which allow the Board to operate effectively in governing the fund and protecting the interests of shareholders. Information about the specific experience, skills, attributes, and qualifications of each Trustee, which in each case led to the Board's conclusion that the Trustee should serve (or continue to serve) as a trustee of the fund, is provided below.
Annual Report
Trustees and Officers - continued
Board Structure and Oversight Function. James C. Curvey is an interested person (as defined in the 1940 Act) and currently serves as Chairman. The Trustees have determined that an interested Chairman is appropriate and benefits shareholders because an interested Chairman has a personal and professional stake in the quality and continuity of services provided to the fund. Independent Trustees exercise their informed business judgment to appoint an individual of their choosing to serve as Chairman, regardless of whether the Trustee happens to be independent or a member of management. The Independent Trustees have determined that they can act independently and effectively without having an Independent Trustee serve as Chairman and that a key structural component for assuring that they are in a position to do so is for the Independent Trustees to constitute a substantial majority for the Board. The Independent Trustees also regularly meet in executive session. Ned C. Lautenbach serves as Chairman of the Independent Trustees and as such (i) acts as a liaison between the Independent Trustees and management with respect to matters important to the Independent Trustees and (ii) with management prepares agendas for Board meetings.
Fidelity funds are overseen by different Boards of Trustees. The fund's Board oversees Fidelity's equity and high income funds and another Board oversees Fidelity's investment-grade bond, money market, and asset allocation funds. The asset allocation funds may invest in Fidelity funds overseen by the fund's Board. The use of separate Boards, each with its own committee structure, allows the Trustees of each group of Fidelity funds to focus on the unique issues of the funds they oversee, including common research, investment, and operational issues. On occasion, the separate Boards establish joint committees to address issues of overlapping consequences for the Fidelity funds overseen by each Board.
The Trustees operate using a system of committees to facilitate the timely and efficient consideration of all matters of importance to the Trustees, the fund, and fund shareholders and to facilitate compliance with legal and regulatory requirements and oversight of the fund's activities and associated risks. The Board, acting through its committees, has charged FMR and its affiliates with (i) identifying events or circumstances the occurrence of which could have demonstrably adverse effects on the fund's business and/or reputation; (ii) implementing processes and controls to lessen the possibility that such events or circumstances occur or to mitigate the effects of such events or circumstances if they do occur; and (iii) creating and maintaining a system designed to evaluate continuously business and market conditions in order to facilitate the identification and implementation processes described in (i) and (ii) above. Because the day-to-day operations and activities of the fund are carried out by or through FMR, its affiliates and other service providers, the fund's exposure to risks is mitigated but not eliminated by the processes overseen by the Trustees. While each of the Board's committees has responsibility for overseeing different aspects of the fund's activities, oversight is exercised primarily through the Operations, Audit, and Compliance Committees. In addition, the Independent Trustees have worked with FMR to enhance the Board's oversight of investment and financial risks, legal and regulatory risks, technology risks, and operational risks, including the development of additional risk reporting to the Board. For example, a working group comprised of Independent Trustees and FMR has worked and continues to work to review the Fidelity funds' valuation-related activities, reporting and risk management. Appropriate personnel, including but not limited to the fund's Chief Compliance Officer (CCO), FMR's internal auditor, the independent accountants, the fund's Treasurer and portfolio management personnel, make periodic reports to the Board's committees, as appropriate, including an annual review of FMR's risk management program for the Fidelity funds. The responsibilities of each standing committee, including their oversight responsibilities, are described further under "Standing Committees of the Fund's Trustees."
Annual Report
The fund's Statement of Additional Information (SAI) includes more information about the Trustees. To request a free copy, call Fidelity at 1-877-208-0098.
Interested Trustees*:
Correspondence intended for each Trustee who is an interested person may be sent to Fidelity Investments, 82 Devonshire Street, Boston, Massachusetts 02109.
Name, Age; Principal Occupations and Other Relevant Experience+ |
James C. Curvey (77) |
| Year of Election or Appointment: 2007 Mr. Curvey is Trustee and Chairman of the Board of Trustees of certain Trusts. Mr. Curvey also serves as Trustee (2007-present) of other investment companies advised by FMR. Mr. Curvey is a Director of Fidelity Investments Money Management, Inc. (2009-present), Director of Fidelity Research & Analysis Co. (2009-present) and Director of FMR and FMR Co., Inc. (2007-present). Mr. Curvey is also Vice Chairman (2007-present) and Director of FMR LLC. In addition, Mr. Curvey serves as an Overseer for the Boston Symphony Orchestra and a member of the Trustees of Villanova University. Previously, Mr. Curvey was the Vice Chairman (2006-2007) and Director (2000-2007) of FMR Corp. |
Ronald P. O'Hanley (55) |
| Year of Election or Appointment: 2011 Mr. O'Hanley is Director of FMR Co., Inc. (2010-present), Director of Fidelity Investments Money Management, Inc. (2010-present), Director of Fidelity Research & Analysis Company (2010-present), President of Fidelity Asset Management and Corporate Services and a member of Fidelity's Executive Committee (2010-present). Previously, Mr. O'Hanley served as President and Chief Executive Officer of BNY Mellon Asset Management (2007-2010). Mr. O'Hanley also served as Vice Chairman of Bank New York Mellon Corp. and a member of that firm's Executive Committee. Prior to the 2007 merger of The Bank of New York and Mellon Financial Corporation, he was Vice Chairman of Mellon Financial Corporation and President and Chief Executive Officer of Mellon Asset Management. He joined Mellon in February 1997. Mr. O'Hanley currently serves as Chairman of the Boston Public Library Foundation Board of Directors and sits on the Board of Directors of Beth Israel Deaconess Medical Center, the Board of Trustees of the Marine Biological Laboratory and the Advisory Board of the Maxwell School of Citizenship and Public Administration at Syracuse University. Mr. O'Hanley also chairs the Council on Asset Management for the Financial Services Roundtable and is a member of the Board of Directors of Institutional Investor's U.S. Institute. |
* Trustees have been determined to be "Interested Trustees" by virtue of, among other things, their affiliation with the trust or various entities under common control with FMR.
+ The information above includes each Trustee's principal occupation during the last five years and other information relating to the experience, attributes, and skills relevant to each Trustee's qualifications to serve as a Trustee, which led to the conclusion that each Trustee should serve as a Trustee for the fund.
Annual Report
Independent Trustees:
Correspondence intended for each Independent Trustee (that is, the Trustees other than the Interested Trustees) may be sent to Fidelity Investments, P.O. Box 55235, Boston, Massachusetts 02205-5235.
Name, Age; Principal Occupations and Other Relevant Experience+ |
Dennis J. Dirks (64) |
| Year of Election or Appointment: 2005 Prior to his retirement in May 2003, Mr. Dirks was Chief Operating Officer and a member of the Board of The Depository Trust & Clearing Corporation (DTCC). He also served as President, Chief Operating Officer, and Board member of The Depository Trust Company (DTC) and President and Board member of the National Securities Clearing Corporation (NSCC). In addition, Mr. Dirks served as Chief Executive Officer and Board member of the Government Securities Clearing Corporation, Chief Executive Officer and Board member of the Mortgage-Backed Securities Clearing Corporation, as a Trustee and a member of the Finance Committee of Manhattan College (2005-2008), and as a Trustee and a member of the Finance Committee of AHRC of Nassau County (2006-2008). Mr. Dirks is a member of the Independent Directors Council (IDC) Governing Council (2010-present) and Board of Directors for The Brookville Center for Children's Services, Inc. (2009-present). |
Alan J. Lacy (59) |
| Year of Election or Appointment: 2008 Mr. Lacy serves as Senior Adviser (2007-present) of Oak Hill Capital Partners, L.P. (private equity). Mr. Lacy also served as Chief Executive Officer (2000-2005) and Vice Chairman (2005-2006) of Sears Holdings Corporation and Sears, Roebuck and Co. (retail). In addition, Mr. Lacy serves as a member of the Board of Directors of Dave & Buster's Entertainment, Inc. (restaurant and entertainment complexes, 2010-present), Earth Fare, Inc. (retail grocery, 2012-present), The Hillman Companies, Inc. (hardware wholesalers, 2010-present), and Bristol-Myers Squibb Company (global pharmaceuticals, 2008-present). Mr. Lacy is a member of the Board of Trustees of The National Parks Conservation Association (2006-present). Previously, Mr. Lacy served as Chairman of the Board of Trustees of the National Parks Conservation Association (2008-2011) and as a member of the Board of Directors for the Western Union Company (global money transfer, 2006-2011). |
Ned C. Lautenbach (68) |
| Year of Election or Appointment: 2000 Mr. Lautenbach is Chairman of the Independent Trustees of the Equity and High Income Funds (2006-present). Mr. Lautenbach currently serves as the Lead Director of the Eaton Corporation Board of Directors (diversified industrial, 1997-present). Mr. Lautenbach is Chairman of the Board of Directors of the Philharmonic Center for the Arts in Naples, Florida (2012-present) and a member of the Council on Foreign Relations (1994-present). Previously, Mr. Lautenbach was a Partner/Advisory Partner at Clayton, Dubilier & Rice, LLC (private equity investment, 1998-2010), as well as a Director of Sony Corporation (2006-2007). |
Joseph Mauriello (68) |
| Year of Election or Appointment: 2008 Prior to his retirement in January 2006, Mr. Mauriello served in numerous senior management positions including Deputy Chairman and Chief Operating Officer (2004-2005), and Vice Chairman of Financial Services (2002-2004) of KPMG LLP US (professional services, 1965-2005). Mr. Mauriello currently serves as a member of the Board of Directors of XL Group plc. (global insurance and re-insurance, 2006-present). Previously, Mr. Mauriello served as a Director of the Hamilton Funds of the Bank of New York (2006-2007) and of Arcadia Resources Inc. (health care services and products, 2007-2012). |
Robert W. Selander (62) |
| Year of Election or Appointment: 2011 Previously, Mr. Selander served as a Member of the Advisory Board of Fidelity's Equity and High Income Funds (2011), Executive Vice Chairman (2010), Chief Executive Officer (2009-2010), and President and Chief Executive Officer (1997-2009) of Mastercard, Inc. |
Cornelia M. Small (68) |
| Year of Election or Appointment: 2005 Ms. Small is a member of the Board of Directors (2009-present) and Chair of the Investment Committee (2010-present) of the Teagle Foundation. Ms. Small also serves on the Investment Committee of the Berkshire Taconic Community Foundation (2008-present). Previously, Ms. Small served as Chairperson (2002-2008) and a member of the Investment Committee and Chairperson (2008-2012) and a member of the Board of Trustees of Smith College. In addition, Ms. Small served as Chief Investment Officer, Director of Global Equity Investments, and a member of the Board of Directors of Scudder, Stevens & Clark and Scudder Kemper Investments. |
William S. Stavropoulos (73) |
| Year of Election or Appointment: 2001 Mr. Stavropoulos is Vice Chairman of the Independent Trustees of the Equity and High Income Funds (2006-present). Mr. Stavropoulos serves as President and Founder of the Michigan Baseball Foundation, the Great Lakes Loons (2007-present). Mr. Stavropoulos is Chairman Emeritus of the Board of Directors of The Dow Chemical Company, where he previously served in numerous senior management positions, including President, CEO (1995-2000; 2002-2004), Chairman of the Executive Committee (2000-2006), and as a member of the Board of Directors (1990-2006). Currently, Mr. Stavropoulos is a Director of Univar Inc. (global distributor of commodity and specialty chemicals, Chairman from 2010-May 2012 and Lead Director from May 2012-present), Teradata Corporation (data warehousing and technology solutions, 2008-present), Maersk Inc. (industrial conglomerate), and Tyco International, Ltd. (multinational manufacturing and services, 2007-present), and a member of the Advisory Board for Metalmark Capital LLC (private equity investment, 2005-present). Mr. Stavropoulos is an operating advisor to Clayton, Dubilier & Rice, LLC (private equity investment). In addition, Mr. Stavropoulos is a member of the University of Notre Dame Advisory Council for the College of Science, a Trustee of the Rollin L. Gerstacker Foundation, and a Director of the Naples Philharmonic Center for the Arts. Previously, Mr. Stavropoulos served as a Director of Chemical Financial Corporation (bank holding company, 1993-2012). |
David M. Thomas (63) |
| Year of Election or Appointment: 2008 Previously, Mr. Thomas served as Executive Chairman (2005-2006) and Chairman and Chief Executive Officer (2000-2005) of IMS Health, Inc. (pharmaceutical and healthcare information solutions), and a Director of Fortune Brands, Inc. (consumer products, 2000-2011). In addition, Mr. Thomas serves as Non-Executive Chairman of the Board of Directors of Fortune Brands Home and Security (home and security products, 2011-present), and as a member of the Board of Directors of Interpublic Group of Companies, Inc. (marketing communication, 2004-present). |
Michael E. Wiley (62) |
| Year of Election or Appointment: 2008 Mr. Wiley also serves as a Director of Asia Pacific Exploration Consolidated (international oil and gas exploration and production, 2008-present). Mr. Wiley serves as a Director of Tesoro Corporation (independent oil refiner and marketer, 2005-present), and a Director of Bill Barrett Corporation (exploration and production, 2005-present). In addition, Mr. Wiley also serves as a Director of Post Oak Bank (privately-held bank, 2004-present). Previously, Mr. Wiley served as a member of the Board of Trustees of the University of Tulsa (2000-2006; 2007-2010), as a Senior Energy Advisor of Katzenbach Partners, LLC (consulting, 2006-2007), as an Advisory Director of Riverstone Holdings (private investment), Chairman, President, and CEO of Baker Hughes, Inc. (oilfield services, 2000-2004), and as Director of Spinnaker Exploration Company (exploration and production, 2001-2005). |
+ The information above includes each Trustee's principal occupation during the last five years and other information relating to the experience, attributes, and skills relevant to each Trustee's qualifications to serve as a Trustee, which led to the conclusion that each Trustee should serve as a Trustee for the fund.
Advisory Board Members and Executive Officers:
Correspondence intended for David A. Rosow and Garnett A. Smith may be sent to Fidelity Investments, P.O. Box 55235, Boston, Massachusetts 02205-5235. Correspondence intended for each executive officer, Edward C. Johnson 3d and Peter S. Lynch may be sent to Fidelity Investments, 82 Devonshire Street, Boston, Massachusetts 02109.
Name, Age; Principal Occupation |
Edward C. Johnson 3d (82) |
| Year of Election or Appointment: 2011 Member of the Advisory Board of Fidelity's Equity and High Income Funds. Mr. Johnson serves as Chief Executive Officer, Chairman, and a Director of FMR LLC, and also serves as Chairman and Director of FIL Limited. Previously, Mr. Johnson served as a Trustee and Chairman of the Board of certain Fidelity Trusts, Chairman and a Director of FMR, Chairman and a Director of FMR Co., Inc., and President of FMR LLC (2006-2007). |
Peter S. Lynch (68) |
| Year of Election or Appointment: 2003 Member of the Advisory Board of Fidelity's Equity and High Income Funds. Mr. Lynch is Vice Chairman and a Director of FMR and FMR Co., Inc. In addition, Mr. Lynch serves as a Trustee of Boston College and as the Chairman of the Inner-City Scholarship Fund. Previously, Mr. Lynch served on the Special Olympics International Board of Directors (1997-2006). |
David A. Rosow (70) |
| Year of Election or Appointment: 2012 Member of the Advisory Board of Fidelity's Equity and High Income Funds. Chairman and Chief Executive Officer of International Golf Group, Inc. (golf course development, 1989-present). Previously, Mr. Rosow served as Chairman and Chief Executive Officer of Rosow & Company, Inc. (private investment company, 1989-2011), a Lead Director of Hudson United Bancorp (2001-2006) and as a Director of TD Banknorth (1996-2006). In addition, Mr. Rosow is a member (2008-present) and President (2009-present) of the Town Council of Palm Beach, Florida. |
Garnett A. Smith (65) |
| Year of Election or Appointment: 2012 Member of the Advisory Board of Fidelity's Equity and High Income Funds. Prior to Mr. Smith's retirement, he served as Chairman and Chief Executive Officer of Inbrand Corp. (manufacturer of personal absorbent products, 1990-1997). He also served as President (1986-1990) of Inbrand Corp. Prior to his employment with Inbrand Corp., he was employed by a retail fabric chain and North Carolina National Bank. In addition, Mr. Smith is a board member of the Jackson Hole Land Trust (2009-present). |
Kenneth B. Robins (43) |
| Year of Election or Appointment: 2008 President and Treasurer of Fidelity's Equity and High Income Funds. Mr. Robins also serves as President and Treasurer (2010-present) and Assistant Treasurer (2009-present) of other Fidelity funds and is an employee of Fidelity Investments (2004-present). Previously, Mr. Robins served as Deputy Treasurer of the Fidelity funds (2005-2008) and Treasurer and Chief Financial Officer of The North Carolina Capital Management Trust: Cash and Term Portfolios (2006-2008). |
Bruce T. Herring (47) |
| Year of Election or Appointment: 2006 Vice President of certain Equity Funds. Mr. Herring also serves as President of Fidelity Research & Analysis Company (2010-present), Chief Investment Officer and Director of Fidelity Management & Research (U.K.) Inc. (2010-present) and Group Chief Investment Officer of FMR. Previously, Mr. Herring served as Vice President (2005-2006) and Senior Vice President (2006-2007) of Fidelity Management & Research Company, Vice President of FMR Co., Inc. (2001-2007) and as a portfolio manager for Fidelity U.S. Equity Funds. |
Brian B. Hogan (48) |
| Year of Election or Appointment: 2009 Vice President of Equity and High Income Funds. Mr. Hogan also serves as President of FMR's Equity Division (2009-present). Previously, Mr. Hogan served as Senior Vice President, Equity Research of FMR (2006-2009) and as a portfolio manager. |
Scott C. Goebel (44) |
| Year of Election or Appointment: 2008 Secretary and Chief Legal Officer (CLO) of the Fidelity funds. Mr. Goebel also serves as Secretary of Fidelity Investments Money Management, Inc. (FIMM) (2010-present) and Fidelity Research and Analysis Company (FRAC) (2010-present); Secretary and CLO of The North Carolina Capital Management Trust: Cash and Term Portfolios (2008-present); General Counsel, Secretary, and Senior Vice President of FMR (2008-present) and FMR Co., Inc. (2008-present); employed by FMR LLC or an affiliate (2001-present); Chief Legal Officer of Fidelity Management & Research (Hong Kong) Limited (2008-present) and Assistant Secretary of Fidelity Management & Research (Japan) Inc. (2008-present), and Fidelity Management & Research (U.K.) Inc. (2008-present). Previously, Mr. Goebel served as Assistant Secretary of FIMM (2008-2010), FRAC (2008-2010), and the Funds (2007-2008) and as Vice President and Secretary of Fidelity Distributors Corporation (FDC) (2005-2007). |
William C. Coffey (43) |
| Year of Election or Appointment: 2009 Assistant Secretary of Fidelity's Equity and High Income Funds. Mr. Coffey also serves as Senior Vice President and Deputy General Counsel of FMR LLC (2010-present), and is an employee of Fidelity Investments. Previously, Mr. Coffey served as Vice President and Associate General Counsel of FMR LLC (2005-2009). |
Elizabeth Paige Baumann (44) |
| Year of Election or Appointment: 2012 Anti-Money Laundering (AML) Officer of the Fidelity funds. Ms. Baumann also serves as AML Officer of The North Carolina Capital Management Trust: Cash and Term Portfolios (2012-present), Chief AML Officer of FMR LLC (2012-present), and is an employee of Fidelity Investments. Previously, Ms. Baumann served as Vice President and Deputy Anti-Money Laundering Officer (2007-2012). |
Christine Reynolds (54) |
| Year of Election or Appointment: 2008 Chief Financial Officer of the Fidelity funds. Ms. Reynolds became President of Fidelity Pricing and Cash Management Services (FPCMS) in August 2008. Ms. Reynolds served as Chief Operating Officer of FPCMS (2007-2008). Previously, Ms. Reynolds served as President, Treasurer, and Anti-Money Laundering officer of the Fidelity funds (2004-2007). |
Joseph A. Hanlon (44) |
| Year of Election or Appointment: 2012 Chief Compliance Officer of Fidelity's Equity and High Income Funds. Mr. Hanlon serves as Compliance Officer of FMR, FMR Co., Inc., Fidelity Investments Money Management, Inc. (FIMM), Fidelity Research and Analysis Company (FRAC), Fidelity Management & Research (Japan) Inc., Fidelity Management & Research (U.K.) Inc., Fidelity Management & Research (Hong Kong), and Strategic Advisers, Inc. (2009-present), as Senior Vice President of the Fidelity Asset Management Division (2009-present), and is an employee of Fidelity Investments. |
Joseph F. Zambello (55) |
| Year of Election or Appointment: 2011 Deputy Treasurer of the Fidelity funds. Mr. Zambello is an employee of Fidelity Investments. Previously, Mr. Zambello served as Vice President of FMR's Program Management Group (2009-2011) and Vice President of the Transfer Agent Oversight Group (2005-2009). |
Adrien E. Deberghes (45) |
| Year of Election or Appointment: 2008 Deputy Treasurer of Fidelity's Equity and High Income Funds. Mr. Deberghes also serves as Vice President (2011-present) and Assistant Treasurer (2010-present) of other Fidelity funds, and is an employee of Fidelity Investments (2008-present). Previously, Mr. Deberghes served as Senior Vice President of Mutual Fund Administration at State Street Corporation (2007-2008), Senior Director of Mutual Fund Administration at Investors Bank & Trust (2005-2007), and Director of Finance for Dunkin' Brands (2000-2005). |
Stephen Sadoski (41) |
| Year of Election or Appointment: 2012 Deputy Treasurer of Fidelity's Equity and High Income Funds. Mr. Sadoski also serves as Assistant Treasurer of other Fidelity funds (2012-present) and is an employee of Fidelity Investments (2012-present). Previously, Mr. Sadoski served as an assistant chief accountant in the Division of Investment Management of the Securities and Exchange Commission (SEC) (2009-2012) and as a senior manager at Deloitte & Touche (1997-2009). |
Stephanie J. Dorsey (43) |
| Year of Election or Appointment: 2010 Assistant Treasurer of Fidelity's Equity and High Income Funds. Ms. Dorsey also serves as Deputy Treasurer of other Fidelity funds (2008-present) and is an employee of Fidelity Investments (2008-present). Previously, Ms. Dorsey served as Treasurer (2004-2008) of the JPMorgan Mutual Funds and Vice President (2004-2008) of JPMorgan Chase Bank. |
John R. Hebble (54) |
| Year of Election or Appointment: 2009 Assistant Treasurer of Fidelity's Equity and High Income Funds. Mr. Hebble also serves as President (2011-present), Treasurer, and Chief Financial Officer of The North Carolina Capital Management Trust: Cash and Term Portfolios (2008-present), President and Treasurer of other Fidelity funds (2008-present) and is an employee of Fidelity Investments. |
Gary W. Ryan (54) |
| Year of Election or Appointment: 2005 Assistant Treasurer of the Fidelity funds. Mr. Ryan is an employee of Fidelity Investments. Previously, Mr. Ryan served as Vice President of Fund Reporting in Fidelity Pricing and Cash Management Services (FPCMS) (1999-2005). |
Jonathan Davis (44) |
| Year of Election or Appointment: 2010 Assistant Treasurer of the Fidelity funds. Mr. Davis is also Assistant Treasurer of Fidelity Rutland Square Trust II and Fidelity Commonwealth Trust II. Mr. Davis is an employee of Fidelity Investments. Previously, Mr. Davis served as Vice President and Associate General Counsel of FMR LLC (2003-2010). |
Annual Report
The Board of Trustees of Fidelity International Growth Fund voted to pay to shareholders of record at the opening of business on record date, the following distributions per share derived from capital gains realized from sales of portfolio securities, and dividends derived from net investment income:
| Pay Date | Record Date | Dividends | Capital Gains |
Institutional Class | 12/10/2012 | 12/07/2012 | $0.100 | $0.005 |
Institutional Class designates 10% of the dividends distributed in December 2011 as indicated in the Corporate Qualifying memo distributed by the Tax department, during the fiscal year as qualifying for the dividends-received deduction for corporate shareholders.
Institutional Class designates 100% of the dividends distributed in December during the fiscal year as amounts which may be taken into account as a dividend for purposes of the maximum rate under section 1(h)(11) of the Internal Revenue Code.
The amounts per share which represent income derived from sources within, and taxes paid to, foreign countries or possessions of the United States are as follows:
| Pay Date | Income | Taxes |
Institutional Class | 12/05/2011 | $0.080 | $0.0072 |
The fund will notify shareholders in January 2013 of amounts for use in preparing 2012 income tax returns.
Annual Report
Board Approval of Investment Advisory Contracts and Management Fees
Fidelity International Growth Fund
Each year, the Board of Trustees, including the Independent Trustees (together, the Board), votes on the renewal of the management contract and sub-advisory agreements (together, the Advisory Contracts) for the fund. The Board, assisted by the advice of fund counsel and Independent Trustees' counsel, requests and considers a broad range of information relevant to the renewal of the Advisory Contracts throughout the year.
The Board meets regularly and, at each of its meetings, considers factors that are relevant to its annual consideration of the renewal of the fund's Advisory Contracts, including the services and support provided to the fund and its shareholders. The Board has established various standing committees, each composed of and chaired by Independent Trustees with varying backgrounds, to which the Board has assigned specific subject matter responsibilities in order to enhance effective decision-making by the Board. The Board, acting directly and through its Committees, requests and receives information concerning the annual consideration of the renewal of the fund's Advisory Contracts. The Board also meets as needed to consider matters specifically related to the Board's annual consideration of the renewal of Advisory Contracts. Members of the Board may also meet with trustees of other Fidelity funds through ad hoc joint committees to discuss certain matters relevant to the Fidelity funds.
At its July 2012 meeting, the Board of Trustees, including the Independent Trustees, unanimously determined to renew the fund's Advisory Contracts. In reaching its determination, the Board considered all factors it believed relevant, including (i) the nature, extent, and quality of the services to be provided to the fund and its shareholders (including the investment performance of the fund); (ii) the competitiveness of the fund's management fee and total expense ratio relative to peer funds; (iii) the total costs of the services to be provided by and the profits to be realized by Fidelity from its relationship with the fund; (iv) the extent to which economies of scale exist and would be realized as the fund grows; and (v) whether fee levels reflect these economies of scale, if any, for the benefit of fund shareholders.
In considering whether to renew the Advisory Contracts for the fund, the Board reached a determination, with the assistance of fund counsel and Independent Trustees' counsel and through the exercise of its business judgment, that the renewal of the Advisory Contracts is in the best interests of the fund and its shareholders and that the compensation payable under the Advisory Contracts is fair and reasonable. The Board's decision to renew the Advisory Contracts was not based on any single factor, but rather was based on a comprehensive consideration of all the information provided to the Board at its meetings throughout the year. The Board, in reaching its determination to renew the Advisory Contracts, is aware that shareholders in the fund have a broad range of investment choices available to them, including a wide choice among mutual funds offered by Fidelity's competitors, and that the fund's shareholders, who have the opportunity to review and weigh the disclosure provided by the fund in its prospectus and other public disclosures, have chosen to invest in this fund, managed by Fidelity.
Annual Report
Nature, Extent, and Quality of Services Provided. The Board considered the staffing within the investment adviser, FMR, and the sub-advisers (together, the Investment Advisers), including the backgrounds of the fund's investment personnel, and also considered the fund's investment objective, strategies, and related investment philosophy. The Independent Trustees also had discussions with senior management of Fidelity's investment operations and investment groups. The Board considered the structure of the portfolio manager compensation program and whether this structure provides appropriate incentives to act in the best interests of the fund.
Resources Dedicated to Investment Management and Support Services. The Board and the Fund Oversight and Research Committees reviewed the general qualifications and capabilities of the Investment Advisers' investment staff, including its size, education, experience, and resources, as well as the Investment Advisers' approach to recruiting, training, managing, and compensating investment personnel. The Board also noted that FMR has continued to increase the resources devoted to non-U.S. offices, including expansion of Fidelity's global investment organization. The Board noted that Fidelity's analysts have extensive resources, tools and capabilities that allow them to conduct sophisticated quantitative and fundamental analysis, as well as credit analysis of issuers, counterparties and guarantors. The Board also believes that Fidelity's investment professionals have sufficient access to global information and data so as to provide competitive investment results over time, and that those professionals also have access to sophisticated tools that permit them to assess portfolio construction and risk and performance attribution characteristics continuously, as well as to transmit new information and research conclusions rapidly around the world. Additionally, in its deliberations, the Board considered the Investment Advisers' trading and risk management capabilities and resources, which are an integral part of the investment management process.
Shareholder and Administrative Services. The Board considered (i) the nature, extent, quality, and cost of advisory, administrative, and shareholder services performed by the Investment Advisers and their affiliates under the Advisory Contracts and under separate agreements covering transfer agency, pricing and bookkeeping, and securities lending services for the fund; (ii) the nature and extent of the supervision of third party service providers, principally custodians and subcustodians; and (iii) the resources devoted to, and the record of compliance with, the fund's compliance policies and procedures. The Board also reviewed the allocation of fund brokerage, including allocations to brokers affiliated with the Investment Advisers, the use of brokerage commissions to pay fund expenses, and the use of "soft" commission dollars to pay for research services.
Annual Report
Board Approval of Investment Advisory Contracts and
Management Fees - continued
The Board noted that the growth of fund assets over time across the complex allows Fidelity to reinvest in the development of services designed to enhance the value or convenience of the Fidelity funds as investment vehicles. These services include 24-hour access to account information and market information through telephone representatives and over the Internet, investor education materials and asset allocation tools, and the expanded availability of Fidelity Investor Centers.
Investment in a Large Fund Family. The Board considered the benefits to shareholders of investing in a Fidelity fund, including the benefits of investing in a fund that is part of a large family of funds offering a variety of investment disciplines and providing a large variety of mutual fund investor services. The Board noted that Fidelity had taken, or had made recommendations that resulted in the Fidelity funds taking, a number of actions over the previous year that benefited particular funds, including (i) continuing to dedicate additional resources to investment research and support of the senior management team that oversees asset management; (ii) persisting in efforts to enhance Fidelity's research capabilities, in particular, international research; (iii) launching new funds and making other enhancements to meet client needs for global and income-oriented solutions; (iv) continuing to launch dedicated lower cost underlying funds to meet investment management's portfolio construction needs related to expanding underlying fund options, specifically for the Freedom Fund product lines; (v) adopting a "Stock Selector" sector neutral investment approach and employing a team of portfolio managers who are sector specialists to manage certain funds; (vi) rationalizing product lines and gaining increased efficiencies through the mergers of several funds into other funds; (vii) strengthening the Spartan Index Fund product line by adding new funds and/or new low-cost institutional share classes, restructuring fund expenses to accommodate new classes, and reducing investment minimums for certain classes of shares; (viii) modifying the eligibility criteria for Institutional Class shares to increase their appeal to government entities and charitable investors; and (ix) reducing certain transfer agent fee rates.
Investment Performance. The Board considered whether the fund has operated in accordance with its investment objective, as well as its record of compliance with its investment restrictions. It also reviewed the fund's absolute investment performance for each class, as well as the fund's relative investment performance for each class measured over multiple periods against (i) a broad-based securities market index, and (ii) a custom peer group of mutual funds deemed appropriate by Fidelity and reviewed by the Board. Because the fund had been in existence less than five calendar years, the following charts considered by the Board show, over the one- and three-year periods ended December 31, 2011, the cumulative total returns of the retail class and Class C of the fund, the cumulative total returns of a broad-based securities market index ("benchmark"), and a range of cumulative total returns of a custom peer group of mutual funds defined by FMR based on categories assigned by Morningstar, Inc. The returns of the retail class and Class C show the performance of the highest and lowest performing classes, respectively (based on three-year performance). The box within each chart shows the 25th percentile return (top of box) and the 75th percentile return (bottom of box) of the peer group. Returns shown above the box are in the first quartile and returns shown below the box are in the fourth quartile. The percentage beaten numbers noted below each chart correspond to the percentile box and represent the percentage of funds in the peer group whose performance was equal to or lower than that of the class indicated. The fund's custom peer group, defined by FMR, is a peer group that FMR believes provides a more meaningful performance comparison than the peer group assigned by Morningstar, Inc., which assigns mutual funds to categories based on their investment styles as measured by their underlying portfolio holdings.
Annual Report
Fidelity International Growth Fund
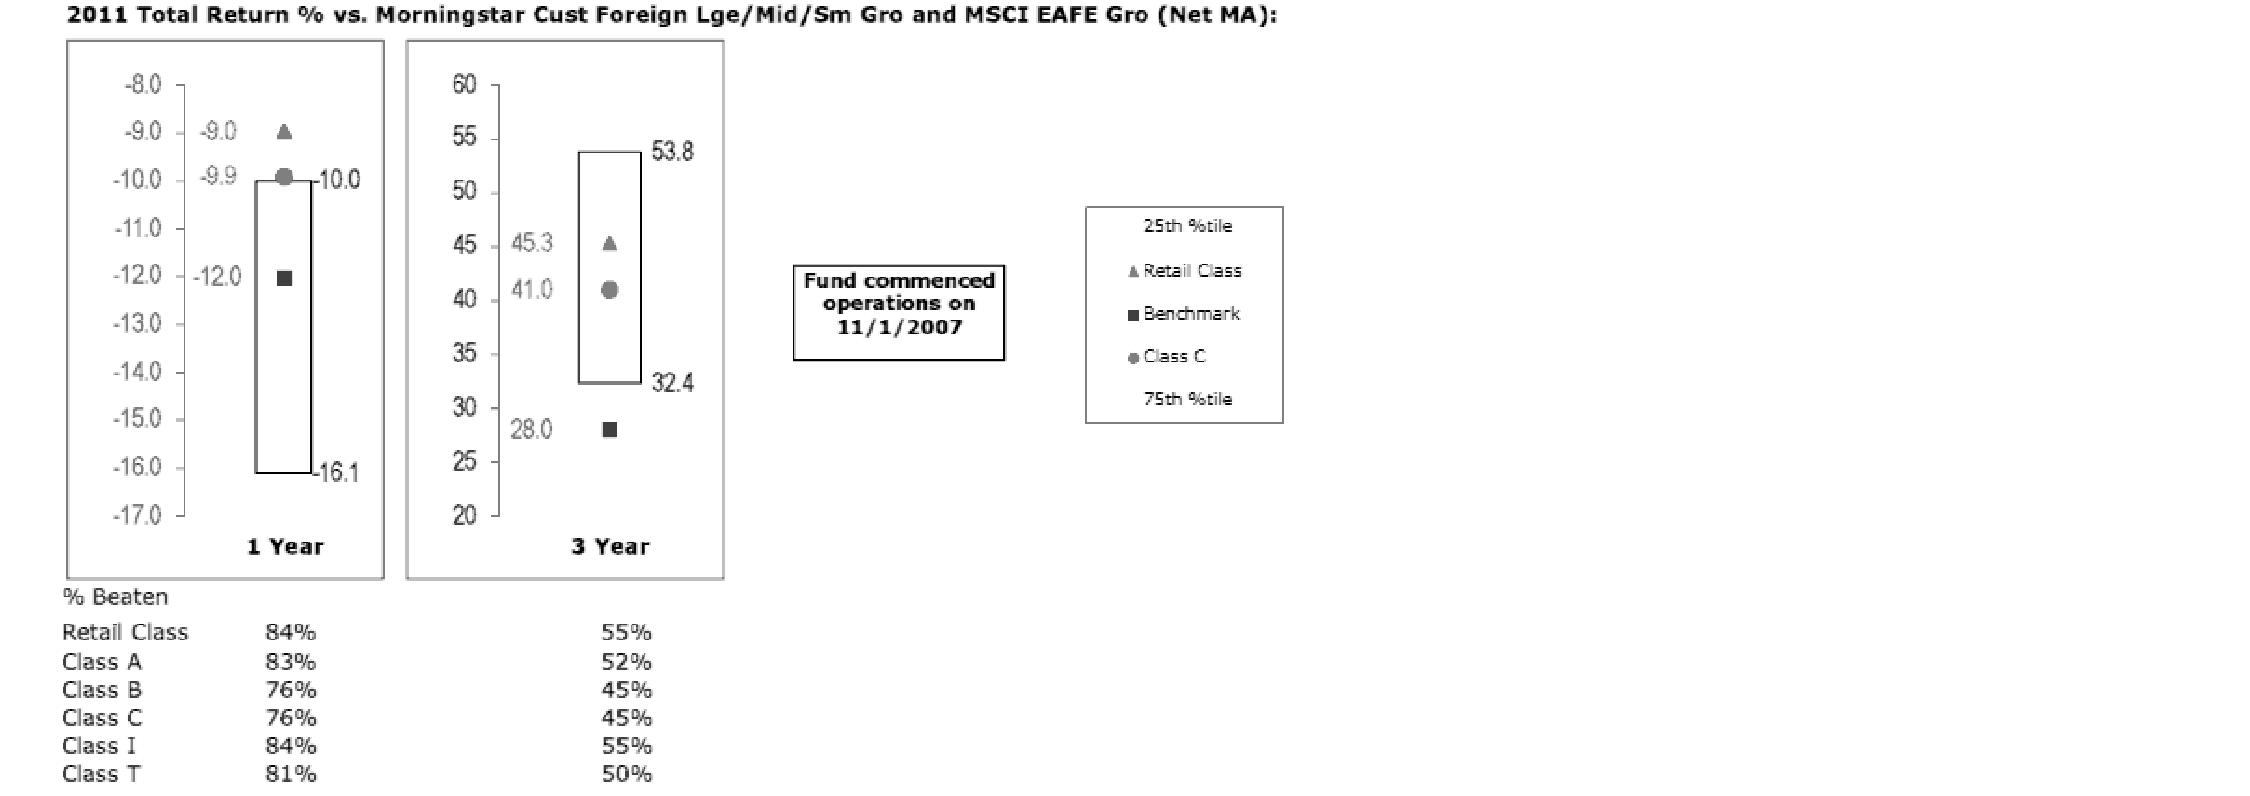
The Board reviewed the fund's relative investment performance against its peer group and noted that the performance of the retail class of the fund was in the first quartile for the one-year period and the second quartile for the three-year period. The Board also noted that the investment performance of the retail class of the fund compared favorably to its benchmark for all the periods shown. The Board considered that the variations in performance among the fund's classes reflect the variations in class expenses, which result in lower performance for higher expense classes. The Board also reviewed the fund's performance since inception as well as performance in the current year.
The Board also considered that the fund's management fee is subject to upward or downward adjustment depending upon whether, and to what extent, the fund's investment performance for the performance period exceeds, or is exceeded by, the record (over the same period) of a Board-approved performance adjustment index. The Board noted that the performance adjustment provides FMR with a strong economic incentive to seek to achieve superior performance for the fund's shareholders and helps to more closely align the interests of FMR and the fund's shareholders.
Annual Report
Board Approval of Investment Advisory Contracts and
Management Fees - continued
Based on its review, the Board concluded that the nature, extent, and quality of services provided to the fund under the Advisory Contracts should benefit the fund's shareholders.
Competitiveness of Management Fee and Total Expense Ratio. The Board considered the fund's management fee and total expense ratio compared to "mapped groups" of competitive funds and classes. Fidelity creates "mapped groups" by combining similar Lipper investment objective categories that have comparable management fee characteristics. Combining Lipper investment objective categories aids the Board's management fee and total expense ratio comparisons by broadening the competitive group used for comparison and by reducing the number of universes to which various Fidelity funds are compared.
Management Fee. The Board considered two proprietary management fee comparisons for the 12-month (or shorter) periods shown in the chart below. The group of Lipper funds used by the Board for management fee comparisons is referred to below as the "Total Mapped Group." The Total Mapped Group comparison focuses on a fund's standing relative to the total universe of comparable funds available to investors in terms of gross management fees before expense reimbursements or caps, and without giving effect to the fund's performance adjustment. "TMG %" represents the percentage of funds in the Total Mapped Group that had management fees that were lower than the fund's. For example, a TMG % of 17% means that 83% of the funds in the Total Mapped Group had higher management fees than the fund. The "Asset-Size Peer Group" (ASPG) comparison focuses on a fund's standing relative to non-Fidelity funds similar in size to the fund within the Total Mapped Group. The ASPG represents at least 15% of the funds in the Total Mapped Group with comparable asset size and management fee characteristics, subject to a minimum of 50 funds (or all funds in the Total Mapped Group if fewer than 50). Additional information, such as the ASPG quartile in which the fund's management fee ranked and the impact of the fund's performance adjustment, is also included in the chart and considered by the Board.
Annual Report
Fidelity International Growth Fund
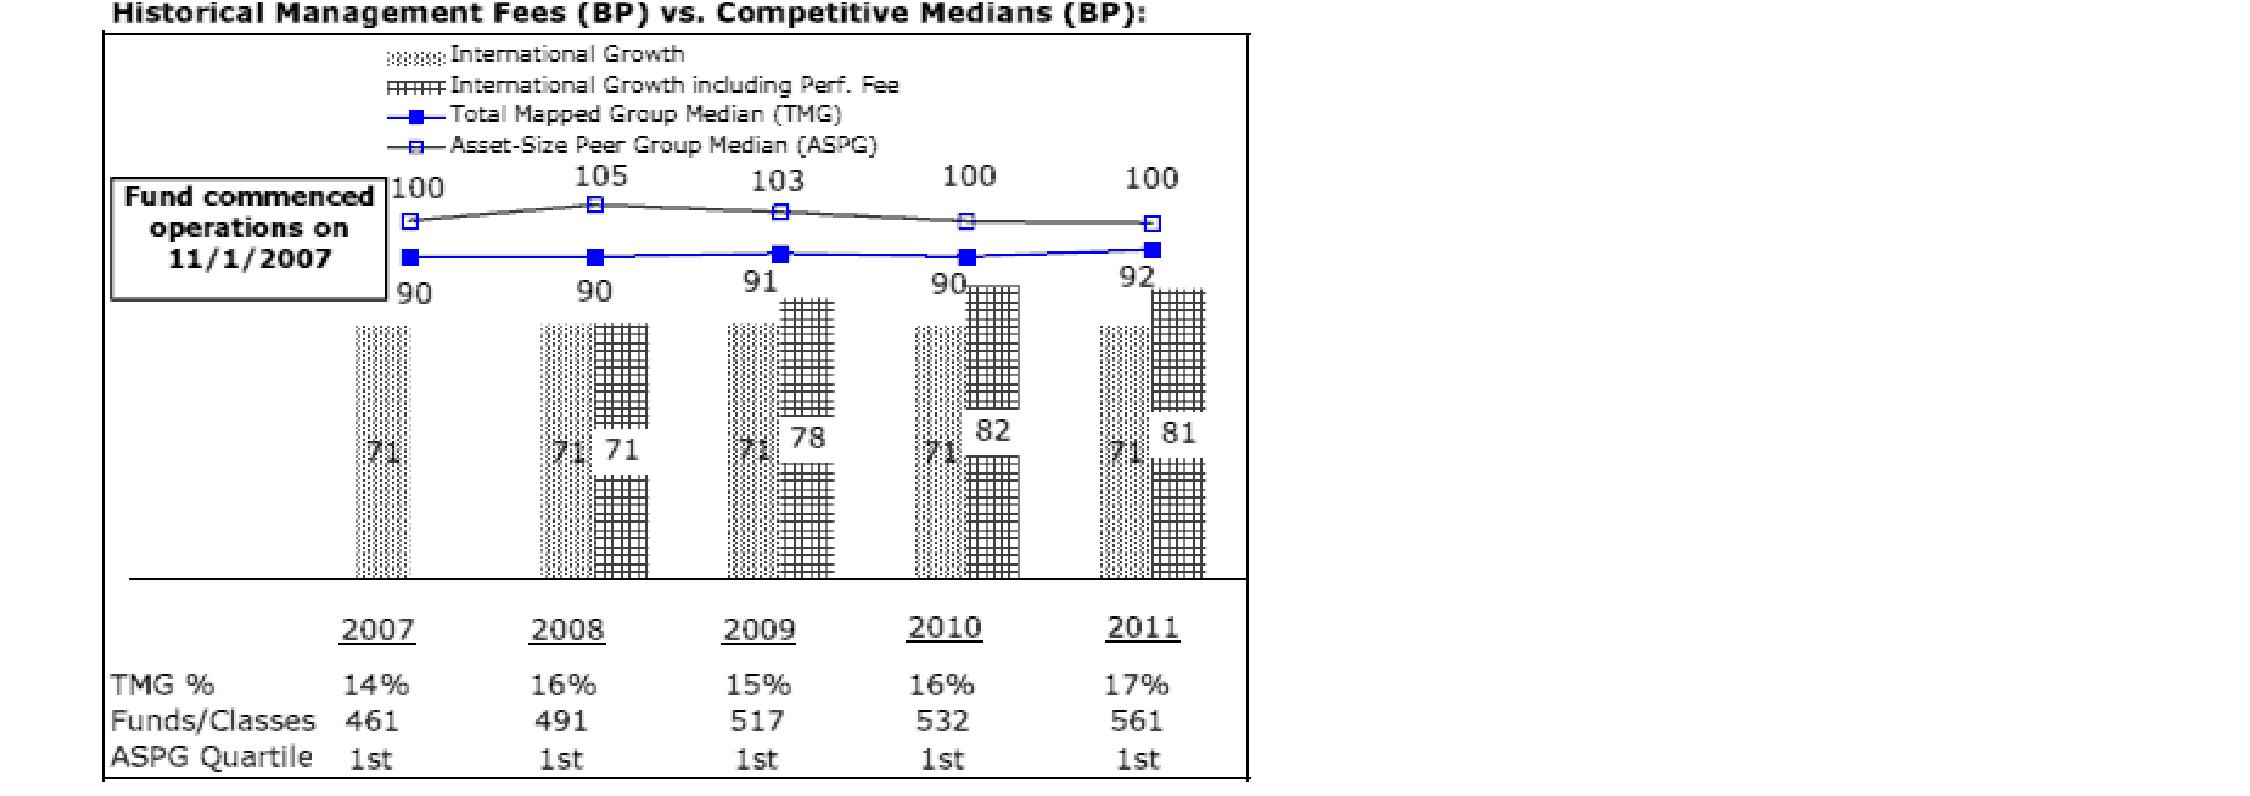
The Board noted that the fund's management fee ranked below the median of its Total Mapped Group and below the median of its ASPG for 2011. The Board also noted the effect of the fund's positive performance adjustment on the fund's management fee ranking. The Board noted that the performance adjustment for each year represents calculations for performance periods that differ from the periods shown in the performance charts above.
Based on its review, the Board concluded that the fund's management fee is fair and reasonable in light of the services that the fund receives and the other factors considered.
Total Expense Ratio. In its review of each class's total expense ratio, the Board considered the fund's management fee as well as other fund or class expenses, as applicable, such as transfer agent fees, pricing and bookkeeping fees, fund-paid 12b-1 fees, and custodial, legal, and audit fees. The Board also noted the effects of any waivers and reimbursements on fees and expenses, as well as the impact of the fund's performance adjustment. As part of its review, the Board also considered the current and historical total expense ratios of each class of the fund compared to competitive fund median expenses. Each class of the fund is compared to those funds and classes in the Total Mapped Group (used by the Board for management fee comparisons) that have a similar sales load structure.
The Board noted that the total expense ratio of each of Class A and the retail class ranked below its competitive median for 2011, the total expense ratio of Class B ranked equal to its competitive median for 2011, and the total expense ratio of each of Class T, Class C, and Institutional Class ranked above its competitive median for 2011. The Board considered that various factors, including 12b-1 fees, positive or negative performance adjustments, and relatively higher other expenses in the case of small fund size, can affect total expense ratios. The Board noted that the total expense ratio of Class T was above the competitive median primarily because of higher 12b-1 fees on Class T. Class T has a higher 12b-1 fee, but a lower front-end sales charge, than traditionally priced front-end sales charge classes. The Board considered that Class T is primarily sold load-waived in the retirement plan market where its 0.50% 12b-1 fee is comparable to competing no-load, higher 12b-1 fee classes designed specifically for retirement plans. The Board noted that the fund offers multiple classes, each of which has a different sales load and 12b-1 fee structure, and that the multiple structures are intended to offer a range of pricing options for the intermediary market. The Board also noted that the total expense ratios of the classes vary primarily by the level of their 12b-1 fees, although differences in transfer agent fees may also cause expenses to vary from class to class.
Annual Report
Board Approval of Investment Advisory Contracts and
Management Fees - continued
The Board further considered that FMR contractually agreed to reimburse Class A, Class T, Class B, Class C, Institutional Class, and the retail class of the fund to the extent that total operating expenses (excluding interest, taxes, certain securities lending costs, brokerage commissions, extraordinary expenses, and acquired fund fees and expenses, if any), as a percentage of their respective average net assets, exceed 1.45%, 1.70%, 2.20%, 2.20%, 1.20%, and 1.20% through December 31, 2012.
Fees Charged to Other Fidelity Clients. The Board also considered Fidelity fee structures and other information with respect to clients of FMR and its affiliates, such as other mutual funds advised or subadvised by FMR or its affiliates, pension plan clients, and other institutional clients. The Board noted the findings of the 2010 ad hoc joint committee (created with the board of other Fidelity funds), which reviewed and compared Fidelity's institutional investment advisory business with its business of providing services to the Fidelity funds, including the differences in services provided, fees charged, and costs incurred, as well as competition in their respective marketplaces.
Based on its review of total expense ratios and fees charged to other Fidelity clients, the Board concluded that the total expense ratio of each class of the fund was reasonable, although in some cases above the median of the universe presented for comparison, in light of the services that the fund and its shareholders receive and the other factors considered.
Costs of the Services and Profitability. The Board considered the revenues earned and the expenses incurred by Fidelity in conducting the business of developing, marketing, distributing, managing, administering and servicing the fund and its shareholders. The Board also considered the level of Fidelity's profits in respect of all the Fidelity funds.
Annual Report
On an annual basis, FMR presents to the Board Fidelity's profitability for the fund. Fidelity calculates the profitability for each fund, as well as aggregate profitability for groups of Fidelity funds and all Fidelity funds, using a series of detailed revenue and cost allocation methodologies which originate with the books and records of Fidelity on which Fidelity's audited financial statements are based. The Audit Committee of the Board reviews any significant changes from the prior year's methodologies.
PricewaterhouseCoopers LLP (PwC), independent registered public accounting firm and auditor to Fidelity and certain Fidelity funds, has been engaged annually by the Board as part of the Board's assessment of Fidelity's profitability analysis. PwC's engagement includes the review and assessment of Fidelity's methodologies used in determining the revenues and expenses attributable to Fidelity's mutual fund business, and completion of agreed-upon procedures surrounding the mathematical accuracy of fund profitability and its conformity to allocation methodologies. After considering PwC's reports issued under the engagement and information provided by Fidelity, the Board concluded that while other allocation methods may also be reasonable, Fidelity's profitability methodologies are reasonable in all material respects.
The Board also reviewed Fidelity's non-fund businesses and fall-out benefits related to the mutual fund business as well as cases where Fidelity's affiliates may benefit from or be related to the fund's business.
The Board considered the costs of the services provided by and the profits realized by Fidelity in connection with the operation of the fund and was satisfied that the profitability was not excessive in the circumstances.
Economies of Scale. The Board considered whether there have been economies of scale in respect of the management of the Fidelity funds, whether the Fidelity funds (including the fund) have appropriately benefited from any such economies of scale, and whether there is potential for realization of any further economies of scale. The Board considered the extent to which the fund will benefit from economies of scale through increased services to the fund, through waivers or reimbursements, or through fee or expense reductions. The Board also noted that in 2009, it and the board of other Fidelity funds created an ad hoc committee (the Economies of Scale Committee) to analyze whether FMR attains economies of scale in respect of the management and servicing of the Fidelity funds, whether the Fidelity funds have appropriately benefited from such economies of scale, and whether there is potential for realization of any further economies of scale.
The Board recognized that the fund's management contract incorporates a "group fee" structure, which provides for lower group fee rates as total fund assets under FMR's management increase, and for higher group fee rates as total fund assets under FMR's management decrease. FMR calculates the group fee rates based on a tiered asset "breakpoint" schedule that varies based on asset class. The Board considered that the group fee is designed to deliver the benefits of economies of scale to fund shareholders when total Fidelity fund assets increase, even if assets of any particular fund are unchanged or have declined, because some portion of Fidelity's costs are attributable to services provided to all Fidelity funds, and all funds benefit if those costs can be allocated among more assets. The Board concluded that, given the group fee structure, fund shareholders will benefit from lower management fees as assets under FMR's management increase at the fund complex level, regardless of whether Fidelity achieves any such economies of scale.
Annual Report
Board Approval of Investment Advisory Contracts and
Management Fees - continued
The Board concluded, taking into account the analysis of the Economies of Scale Committee, that economies of scale, if any, are being appropriately shared between fund shareholders and Fidelity.
Additional Information Requested by the Board. In order to develop fully the factual basis for consideration of the Fidelity funds' Advisory Contracts, the Board requested and received additional information on certain topics, including (i) fund performance trends, actions to be taken by FMR to improve certain funds' overall performance, and Fidelity's long-term strategies for certain funds; (ii) the potential to further rationalize the Fidelity fund lineup with the possibility of achieving savings for the funds and Fidelity; (iii) Fidelity's compensation structure for portfolio managers and other key investment personnel; (iv) the amount of the investment that each portfolio manager has made in the Fidelity fund(s) that he or she manages; (v) the realization of fall-out benefits in certain Fidelity business units; (vi) Fidelity's group fee structures, the potential impact of regulatory changes on such structures, and the rationale for the individual fee rates of certain funds; (vii) fund profitability methodology, including Fidelity's cost allocation methodology, and the impact of certain factors on fund profitability results; (viii) trends regarding industry use of performance fee structures and the possibility of implementing performance fee structures for additional funds; and (ix) the impact of net redemptions from the Fidelity funds.
Based on its evaluation of all of the conclusions noted above, and after considering all factors it believed relevant, the Board ultimately concluded that the advisory fee structures are fair and reasonable, and that the fund's Advisory Contracts should be renewed.
Annual Report
Investment Adviser
Fidelity Management & Research Company
Boston, MA
Investment Sub-Advisers
FMR Co., Inc.
Fidelity Management & Research
(U.K.) Inc.
Fidelity Management & Research
(Hong Kong) Limited
Fidelity Management & Research
(Japan) Inc.
FIL Investment Advisors
FIL Investments (Japan) Limited
FIL Investment Advisors (UK) Limited
General Distributor
Fidelity Distributors Corporation
Smithfield, RI
Transfer and Service Agents
Fidelity Investments Institutional Operations Company, Inc.
Boston, MA
Fidelity Service Company, Inc.
Boston, MA
Custodian
State Street Bank and Trust Company
Quincy, MA
(Fidelity Investment logo)(registered trademark)
AIGFI-UANN-1212
1.853341.104
Fidelity®
International Growth Fund
Annual Report
October 31, 2012
(Fidelity Cover Art)
Contents
Performance | (Click Here) | How the fund has done over time. |
Management's Discussion of Fund Performance | (Click Here) | The Portfolio Manager's review of fund performance and strategy. |
Shareholder Expense Example | (Click Here) | An example of shareholder expenses. |
Investment Changes | (Click Here) | A summary of major shifts in the fund's investments over the past six months. |
Investments | (Click Here) | A complete list of the fund's investments with their market values. |
Financial Statements | (Click Here) | Statements of assets and liabilities, operations, and changes in net assets, as well as financial highlights. |
Notes | (Click Here) | Notes to financial statements. |
Report of Independent Registered Public Accounting Firm | (Click Here) | |
Trustees and Officers | (Click Here) | |
Distributions | (Click Here) | |
Board Approval of Investment Advisory Contracts and Management Fees | (Click Here) | |
To view a fund's proxy voting guidelines and proxy voting record for the 12-month period ended June 30, visit http://www.fidelity.com/proxyvotingresults or visit the Securities and Exchange Commission's (SEC) web site at http://www.sec.gov. You may also call 1-800-544-8544 to request a free copy of the proxy voting guidelines.
Standard & Poor's, S&P and S&P 500 are registered service marks of The McGraw-Hill Companies, Inc. and have been licensed for use by Fidelity Distributors Corporation.
Other third party marks appearing herein are the property of their respective owners.
All other marks appearing herein are registered or unregistered trademarks or service marks of FMR LLC or an affiliated company. © 2012 FMR LLC. All rights reserved.
Annual Report
This report and the financial statements contained herein are submitted for the general information of the shareholders of the fund. This report is not authorized for distribution to prospective investors in the fund unless preceded or accompanied by an effective prospectus.
A fund files its complete schedule of portfolio holdings with the SEC for the first and third quarters of each fiscal year on Form N-Q. Forms N-Q are available on the SEC's web site at http://www.sec.gov. A fund's Forms N-Q may be reviewed and copied at the SEC's Public Reference Room in Washington, DC. Information regarding the operation of the SEC's Public Reference Room may be obtained by calling 1-800-SEC-0330. For a complete list of a fund's portfolio holdings, view the most recent holdings listing, semiannual report, or annual report on Fidelity's web site at http://www.fidelity.com, http://www.advisor.fidelity.com, or http://www.401k.com, as applicable.
NOT FDIC INSURED • MAY LOSE VALUE • NO BANK GUARANTEE
Neither the fund nor Fidelity Distributors Corporation is a bank.
Annual Report
Average annual total return reflects the change in the value of an investment, assuming reinvestment of the class' distributions from dividend income and capital gains (the profits earned upon the sale of securities that have grown in value, if any) and assuming a constant rate of performance each year. The $10,000 table and the fund's returns do not reflect the deduction of taxes that a shareholder would pay on fund distributions or the redemption of fund shares. During periods of reimbursement by Fidelity, a fund's total return will be greater than it would be had the reimbursement not occurred. How a fund did yesterday is no guarantee of how it will do tomorrow.
Average Annual Total Returns
Periods ended October 31, 2012 | Past 1
year | Life of
fundA |
Fidelity® International Growth Fund | 11.41% | -1.33% |
A From November 1, 2007.
$10,000 Over Life of Fund
Let's say hypothetically that $10,000 was invested in Fidelity® International Growth Fund, a class of the fund, on November 1, 2007, when the fund started. The chart shows how the value of your investment would have changed, and also shows how the MSCI® EAFE® Growth Index performed over the same period.
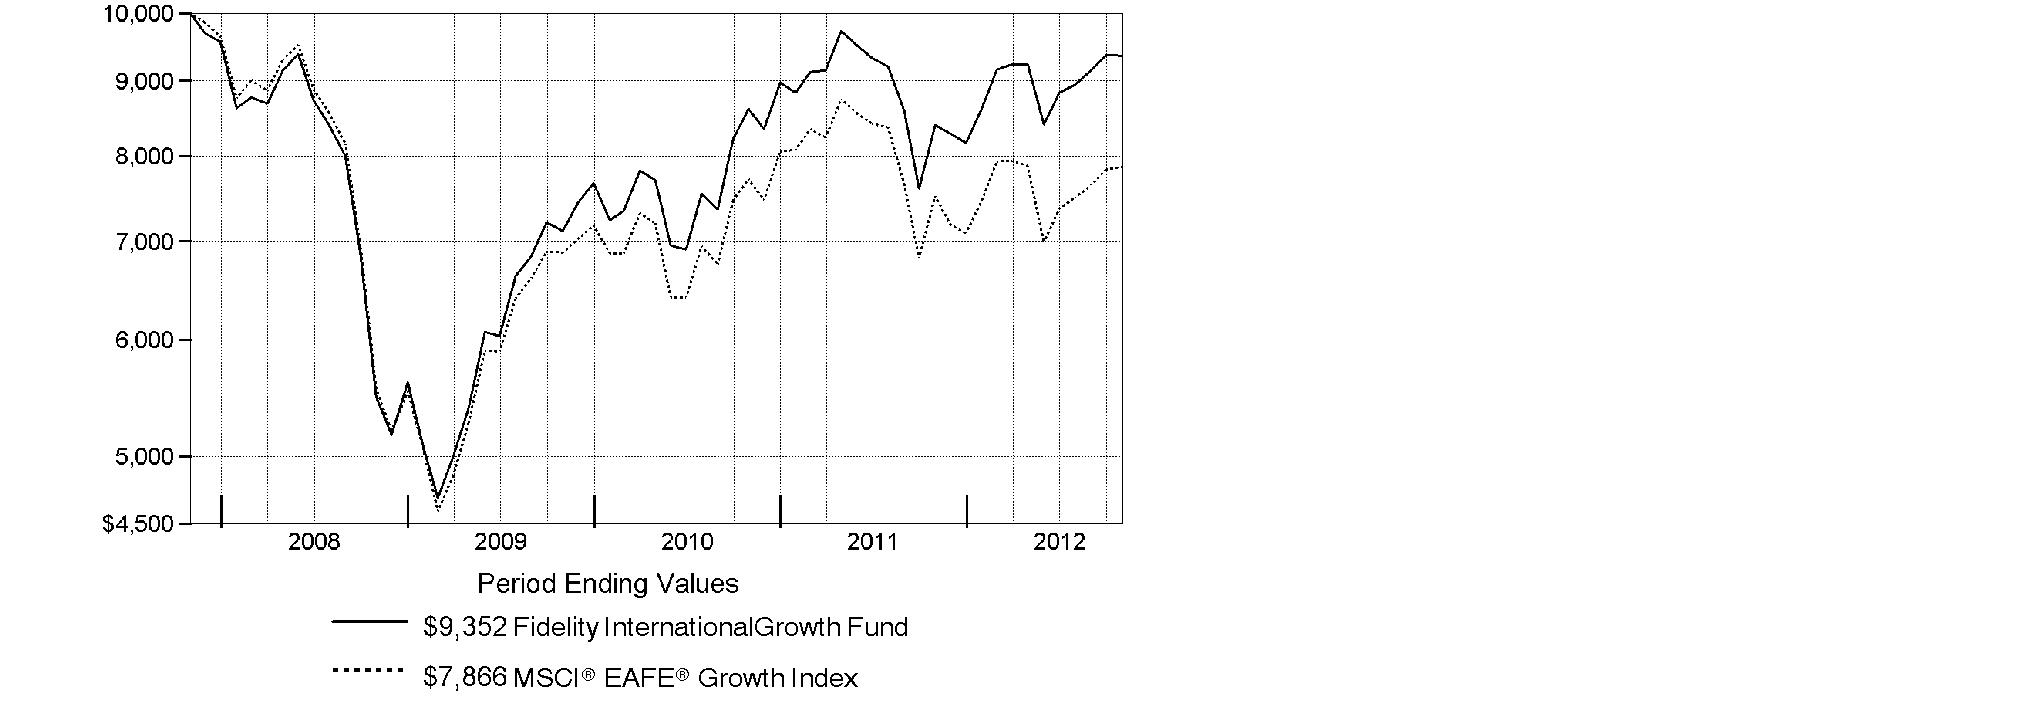
Annual Report
Market Recap: International stocks experienced pendulum-like swings during the 12 months ending October 31, 2012, finishing the period with a modest advance. The market faced periodic bouts of volatility this past year, as a number of macroeconomic concerns - including the eurozone debt crisis, the strength and pace of the U.S. economic recovery, and a slowdown in China's once-blistering growth - dominated headlines and weighed on investors. While a stronger U.S. dollar provided an additional head wind, foreign developed- and emerging-markets stocks still managed a gain for the 12 months, as the MSCI® ACWI® (All Country World Index) ex USA Index rose 4.11%, largely buttressed in the summertime by pledges of accommodative monetary action from eurozone officials, as well as signs that the U.S. housing market was on the mend. Within the index, Asia-Pacific ex Japan showed the most impressive gains, advancing roughly 11%. A number of core European components, most notably Germany (+11%), Switzerland (+10%) and the U.K. (+9%), benefited from optimism about the eurozone's ability to resolve its debt woes, which also helped the region outpace the index overall. Elsewhere, results from Canada (+3%) and the generally more volatile emerging markets (+2%) each fell short of the MSCI index, while Japan was among the few benchmark constituents to finish in the red, returning about -3%.
Comments from Jed Weiss, Portfolio Manager of Fidelity® International Growth Fund: For the year, the fund's Retail Class shares gained 11.41%, easily outpacing the 4.77% advance of the MSCI® EAFE® Growth Index. Following the fund's bottom-up stock selection strategy, portfolio positioning in Japan and Europe was especially helpful. An out-of-benchmark allocation to globally oriented U.S.-based stocks also contributed, while stock picking in Canada was modestly negative. In sector terms, security selection was very strong in information technology, materials, industrials, consumer discretionary and health care, while my picks in only two groups - energy and telecommunication services - had a negative impact. The top individual contributor was Belgian brewer Anheuser-Busch InBev, while in health care, Australian biotechnology company CSL and Denmark's Novo Nordisk also added value. U.S.-based credit card networks MasterCard and Visa, neither of which is in the index, were additional contributors. In contrast, not owning Diageo, a strong-performing U.K.-based spirits company and benchmark component, hurt. Other notable detractors were U.K. natural gas producer BG Group and Bharti Airtel, an Indian telecommunication services provider and non-index stock that I sold before period end.
The views expressed above reflect those of the portfolio manager(s) only through the end of the period as stated on the cover of this report and do not necessarily represent the views of Fidelity or any other person in the Fidelity organization. Any such views are subject to change at any time based upon market or other conditions and Fidelity disclaims any responsibility to update such views. These views may not be relied on as investment advice and, because investment decisions for a Fidelity fund are based on numerous factors, may not be relied on as an indication of trading intent on behalf of any Fidelity fund.
Annual Report
Shareholder Expense Example
As a shareholder of the Fund, you incur two types of costs: (1) transaction costs, including sales charges (loads) on purchase payments or redemption proceeds, redemption fees and (2) ongoing costs, including management fees, distribution and/or service (12b-1) fees and other Fund expenses. This Example is intended to help you understand your ongoing costs (in dollars) of investing in the Fund and to compare these costs with the ongoing costs of investing in other mutual funds.
The Example is based on an investment of $1,000 invested at the beginning of the period and held for the entire period (May 1, 2012 to October 31, 2012).
Actual Expenses
The first line of the accompanying table for each class of the Fund provides information about actual account values and actual expenses. You may use the information in this line, together with the amount you invested, to estimate the expenses that you paid over the period. Simply divide your account value by $1,000.00 (for example, an $8,600 account value divided by $1,000.00 = 8.6), then multiply the result by the number in the first line for a class of the Fund under the heading entitled "Expenses Paid During Period" to estimate the expenses you paid on your account during this period. A small balance maintenance fee of $12.00 that is charged once a year may apply for certain accounts with a value of less than $2,000. This fee is not included in the table below. If it was, the estimate of expenses you paid during the period would be higher, and your ending account value lower, by this amount. In addition, the Fund, as a shareholder in the underlying Fidelity Central Funds, will indirectly bear its pro-rata share of the fees and expenses incurred by the underlying Fidelity Central Funds. These fees and expenses are not included in the Fund's annualized expense ratio used to calculate the expense estimate in the table below.
Hypothetical Example for Comparison Purposes
The second line of the accompanying table for each class of the Fund provides information about hypothetical account values and hypothetical expenses based on a Class' actual expense ratio and an assumed rate of return of 5% per year before expenses, which is not the Class' actual return. The hypothetical account values and expenses may not be used to estimate the actual ending account balance or expenses you paid for the period. You may use this information to compare the ongoing costs of investing in the Fund and other funds. To do so, compare this 5% hypothetical example with the 5% hypothetical examples that appear in the shareholder reports of the other funds. A small balance maintenance fee of $12.00 that is charged once a year may apply for certain accounts with a value of less than $2,000. This fee is not included in the table below. If it was, the estimate of expenses you paid during the period would be higher, and your ending account value lower, by this amount. In addition, the Fund, as a shareholder in the underlying Fidelity Central Funds, will indirectly bear its pro-rata share of the fees and expenses incurred by the underlying Fidelity Central Funds. These fees and expenses are not included in the Fund's annualized expense ratio used to calculate the expense estimate in the table below.
Please note that the expenses shown in the table are meant to highlight your ongoing costs only and do not reflect any transaction costs. Therefore, the second line of the table is useful in comparing ongoing costs only, and will not help you determine the relative total costs of owning different funds. In addition, if these transactional costs were included, your costs would have been higher.
Annual Report
Shareholder Expense Example - continued
| Annualized
Expense Ratio | Beginning
Account Value
May 1, 2012 | Ending
Account Value
October 31, 2012 | Expenses Paid
During Period*
May 1, 2012
to October 31, 2012 |
Class A | 1.45% | | | |
Actual | | $ 1,000.00 | $ 1,012.50 | $ 7.34 |
HypotheticalA | | $ 1,000.00 | $ 1,017.85 | $ 7.35 |
Class T | 1.70% | | | |
Actual | | $ 1,000.00 | $ 1,011.40 | $ 8.60 |
HypotheticalA | | $ 1,000.00 | $ 1,016.59 | $ 8.62 |
Class B | 2.20% | | | |
Actual | | $ 1,000.00 | $ 1,007.90 | $ 11.10 |
HypotheticalA | | $ 1,000.00 | $ 1,014.08 | $ 11.14 |
Class C | 2.20% | | | |
Actual | | $ 1,000.00 | $ 1,009.10 | $ 11.11 |
HypotheticalA | | $ 1,000.00 | $ 1,014.08 | $ 11.14 |
International Growth | 1.20% | | | |
Actual | | $ 1,000.00 | $ 1,013.60 | $ 6.07 |
HypotheticalA | | $ 1,000.00 | $ 1,019.10 | $ 6.09 |
Institutional Class | 1.20% | | | |
Actual | | $ 1,000.00 | $ 1,013.60 | $ 6.07 |
HypotheticalA | | $ 1,000.00 | $ 1,019.10 | $ 6.09 |
A 5% return per year before expenses
* Expenses are equal to each Class' annualized expense ratio, multiplied by the average account value over the period, multiplied by 184/366 (to reflect the one-half year period).
Annual Report
Investment Changes (Unaudited)
Geographic Diversification (% of fund's net assets) |
As of October 31, 2012 |
 | United Kingdom 18.9% | |
 | United States of America 18.2% | |
 | Japan 10.9% | |
 | Switzerland 9.1% | |
 | Australia 5.4% | |
 | Belgium 4.6% | |
 | France 3.6% | |
 | Sweden 3.5% | |
 | Denmark 3.1% | |
| Other 22.7% | |

Percentages are based on country or territory of incorporation and are adjusted for the effect of futures contracts, if applicable. |
As of April 30, 2012 |
| United Kingdom 18.3% | |
| United States of America 18.1% | |
| Japan 10.6% | |
| Switzerland 9.5% | |
| Belgium 4.2% | |
| Australia 4.0% | |
| Germany 3.8% | |
| Denmark 3.3% | |
| France 3.3% | |
| Other 24.9% | |

Percentages are based on country or territory of incorporation and are adjusted for the effect of futures contracts, if applicable. |
Asset Allocation |
| % of fund's
net assets | % of fund's net assets
6 months ago |
Stocks | 98.1 | 97.4 |
Short-Term Investments and Net Other Assets (Liabilities) | 1.9 | 2.6 |
Top Ten Stocks as of October 31, 2012 |
| % of fund's
net assets | % of fund's net assets
6 months ago |
Nestle SA (Switzerland, Food Products) | 5.0 | 5.0 |
Anheuser-Busch InBev SA NV (Belgium, Beverages) | 3.6 | 3.3 |
Novo Nordisk A/S Series B sponsored ADR (Denmark, Pharmaceuticals) | 2.7 | 2.5 |
GlaxoSmithKline PLC sponsored ADR (United Kingdom, Pharmaceuticals) | 2.5 | 1.7 |
Linde AG (Germany, Chemicals) | 2.4 | 2.4 |
BG Group PLC (United Kingdom, Oil, Gas & Consumable Fuels) | 2.4 | 2.9 |
Roche Holding AG (participation certificate) (Switzerland, Pharmaceuticals) | 2.3 | 2.0 |
Philip Morris International, Inc. (United States of America, Tobacco) | 2.0 | 1.8 |
Standard Chartered PLC (United Kingdom) (United Kingdom, Commercial Banks) | 2.0 | 1.9 |
CSL Ltd. (Australia, Biotechnology) | 1.9 | 1.5 |
| 26.8 | |
Market Sectors as of October 31, 2012 |
| % of fund's
net assets | % of fund's net assets
6 months ago |
Consumer Staples | 24.2 | 22.4 |
Industrials | 14.5 | 13.4 |
Consumer Discretionary | 14.5 | 15.2 |
Materials | 12.4 | 13.2 |
Health Care | 11.4 | 9.5 |
Information Technology | 8.4 | 7.5 |
Financials | 7.2 | 10.9 |
Energy | 5.5 | 4.9 |
Telecommunication Services | 0.0 | 0.4 |
Annual Report
Investments October 31, 2012
Showing Percentage of Net Assets
Common Stocks - 98.1% |
| Shares | | Value |
Australia - 5.4% |
Coca-Cola Amatil Ltd. | 147,671 | | $ 2,061,749 |
CSL Ltd. | 74,105 | | 3,653,923 |
Newcrest Mining Ltd. | 45,609 | | 1,251,313 |
Sydney Airport unit | 179,470 | | 631,553 |
Woodside Petroleum Ltd. | 40,108 | | 1,432,213 |
WorleyParsons Ltd. | 50,089 | | 1,282,714 |
TOTAL AUSTRALIA | | 10,313,465 |
Austria - 1.1% |
Andritz AG | 36,600 | | 2,204,495 |
Bailiwick of Jersey - 1.1% |
Informa PLC | 86,364 | | 557,758 |
Randgold Resources Ltd. sponsored ADR | 12,335 | | 1,475,143 |
TOTAL BAILIWICK OF JERSEY | | 2,032,901 |
Belgium - 4.6% |
Anheuser-Busch InBev SA NV | 82,391 | | 6,890,455 |
Umicore SA | 38,731 | | 1,987,716 |
TOTAL BELGIUM | | 8,878,171 |
Bermuda - 0.8% |
Lazard Ltd. Class A | 20,292 | | 597,802 |
Li & Fung Ltd. | 519,000 | | 870,575 |
TOTAL BERMUDA | | 1,468,377 |
Brazil - 1.1% |
Arezzo Industria e Comercio SA | 27,400 | | 489,033 |
Iguatemi Empresa de Shopping Centers SA | 49,200 | | 624,977 |
Multiplan Empreendimentos Imobiliarios SA | 33,800 | | 990,177 |
TOTAL BRAZIL | | 2,104,187 |
Canada - 1.8% |
Agnico-Eagle Mines Ltd. (Canada) | 13,300 | | 750,926 |
Fairfax Financial Holdings Ltd. (sub. vtg.) | 1,300 | | 482,266 |
First Quantum Minerals Ltd. | 22,400 | | 503,509 |
Goldcorp, Inc. | 29,006 | | 1,311,260 |
Open Text Corp. (a) | 8,600 | | 462,226 |
TOTAL CANADA | | 3,510,187 |
Common Stocks - continued |
| Shares | | Value |
Cayman Islands - 1.7% |
Baidu.com, Inc. sponsored ADR (a) | 8,080 | | $ 861,490 |
Sands China Ltd. | 655,600 | | 2,465,886 |
TOTAL CAYMAN ISLANDS | | 3,327,376 |
Denmark - 3.1% |
Novo Nordisk A/S Series B sponsored ADR | 32,400 | | 5,193,396 |
William Demant Holding A/S (a) | 9,700 | | 834,267 |
TOTAL DENMARK | | 6,027,663 |
Finland - 1.5% |
Nokian Tyres PLC | 58,508 | | 2,426,725 |
Outotec Oyj | 9,000 | | 438,267 |
TOTAL FINLAND | | 2,864,992 |
France - 3.6% |
Alstom SA | 47,499 | | 1,622,260 |
Danone SA | 46,652 | | 2,867,694 |
Remy Cointreau SA | 8,587 | | 890,626 |
Safran SA | 39,100 | | 1,555,606 |
TOTAL FRANCE | | 6,936,186 |
Germany - 3.0% |
Linde AG | 27,941 | | 4,698,991 |
Siemens AG sponsored ADR (d) | 11,200 | | 1,130,192 |
TOTAL GERMANY | | 5,829,183 |
Ireland - 1.8% |
CRH PLC sponsored ADR | 68,700 | | 1,281,255 |
Elan Corp. PLC sponsored ADR (a) | 65,784 | | 710,467 |
James Hardie Industries NV sponsored ADR (d) | 32,000 | | 1,538,880 |
TOTAL IRELAND | | 3,530,602 |
Israel - 0.2% |
Azrieli Group | 19,200 | | 428,628 |
Italy - 0.9% |
Fiat Industrial SpA | 115,401 | | 1,249,716 |
Interpump Group SpA | 75,351 | | 572,324 |
TOTAL ITALY | | 1,822,040 |
Japan - 10.9% |
Autobacs Seven Co. Ltd. | 19,900 | | 816,391 |
Denso Corp. | 85,000 | | 2,660,842 |
Fanuc Corp. | 17,000 | | 2,706,627 |
Common Stocks - continued |
| Shares | | Value |
Japan - continued |
Fast Retailing Co. Ltd. | 8,200 | | $ 1,826,331 |
Japan Tobacco, Inc. | 27,700 | | 765,454 |
JS Group Corp. | 34,900 | | 771,621 |
Keyence Corp. | 10,062 | | 2,669,587 |
Kobayashi Pharmaceutical Co. Ltd. | 16,400 | | 865,915 |
Mitsui Fudosan Co. Ltd. | 55,000 | | 1,111,299 |
Nintendo Co. Ltd. | 8,000 | | 1,030,189 |
Osaka Securities Exchange Co. Ltd. | 10 | | 37,267 |
SHO-BOND Holdings Co. Ltd. | 15,600 | | 471,537 |
SMC Corp. | 5,500 | | 866,717 |
Unicharm Corp. | 24,900 | | 1,347,463 |
USS Co. Ltd. | 20,580 | | 2,162,924 |
Yamato Kogyo Co. Ltd. | 32,700 | | 917,959 |
TOTAL JAPAN | | 21,028,123 |
Netherlands - 2.2% |
ASML Holding NV | 61,400 | | 3,375,158 |
D.E. Master Blenders 1753 NV (a) | 66,459 | | 812,222 |
TOTAL NETHERLANDS | | 4,187,380 |
Portugal - 1.2% |
Jeronimo Martins SGPS SA | 127,352 | | 2,228,409 |
South Africa - 0.4% |
Clicks Group Ltd. | 120,343 | | 829,708 |
Spain - 1.6% |
Inditex SA | 18,214 | | 2,323,979 |
Prosegur Compania de Seguridad SA (Reg.) | 151,049 | | 822,285 |
TOTAL SPAIN | | 3,146,264 |
Sweden - 3.5% |
ASSA ABLOY AB (B Shares) | 48,761 | | 1,625,391 |
Fagerhult AB | 15,400 | | 380,769 |
H&M Hennes & Mauritz AB (B Shares) | 74,630 | | 2,525,959 |
Intrum Justitia AB | 30,000 | | 434,199 |
Swedish Match Co. AB | 52,300 | | 1,781,996 |
TOTAL SWEDEN | | 6,748,314 |
Switzerland - 9.1% |
Nestle SA | 152,687 | | 9,689,468 |
Roche Holding AG (participation certificate) | 22,817 | | 4,387,979 |
Schindler Holding AG: | | | |
(participation certificate) | 9,410 | | 1,239,780 |
Common Stocks - continued |
| Shares | | Value |
Switzerland - continued |
Schindler Holding AG: - continued | | | |
(Reg.) | 1,530 | | $ 197,965 |
Swatch Group AG (Bearer) | 2,480 | | 1,026,299 |
UBS AG (NY Shares) | 61,021 | | 916,535 |
TOTAL SWITZERLAND | | 17,458,026 |
Turkey - 2.3% |
Anadolu Efes Biracilik Ve Malt Sanayii A/S | 43,800 | | 657,305 |
Coca-Cola Icecek A/S | 82,142 | | 1,594,723 |
Turkiye Garanti Bankasi A/S | 276,500 | | 1,320,413 |
Turkiye Petrol Rafinerile A/S | 32,687 | | 798,712 |
TOTAL TURKEY | | 4,371,153 |
United Kingdom - 18.9% |
Anglo American PLC: | | | |
ADR | 25,200 | | 387,324 |
(United Kingdom) | 12,200 | | 374,658 |
Babcock International Group PLC | 79,300 | | 1,251,550 |
BG Group PLC | 247,955 | | 4,591,577 |
BHP Billiton PLC ADR (d) | 56,100 | | 3,589,278 |
GlaxoSmithKline PLC sponsored ADR | 107,600 | | 4,831,240 |
InterContinental Hotel Group PLC ADR | 94,530 | | 2,327,329 |
Johnson Matthey PLC | 48,477 | | 1,759,387 |
Reckitt Benckiser Group PLC | 53,945 | | 3,264,515 |
Rexam PLC | 141,583 | | 1,020,618 |
Rolls-Royce Group PLC | 167,537 | | 2,310,250 |
Rolls-Royce Group PLC Class C | 12,732,812 | | 20,548 |
Rotork PLC | 38,200 | | 1,404,279 |
SABMiller PLC | 75,766 | | 3,245,588 |
Serco Group PLC | 135,342 | | 1,237,282 |
Shaftesbury PLC | 62,933 | | 556,539 |
Standard Chartered PLC (United Kingdom) | 162,631 | | 3,840,894 |
Unite Group PLC | 103,000 | | 470,558 |
TOTAL UNITED KINGDOM | | 36,483,414 |
United States of America - 16.3% |
Allergan, Inc. | 14,200 | | 1,276,864 |
Amazon.com, Inc. (a) | 5,500 | | 1,280,510 |
Autoliv, Inc. (d) | 33,400 | | 1,923,840 |
Berkshire Hathaway, Inc. Class B (a) | 23,023 | | 1,988,036 |
BorgWarner, Inc. (a) | 20,246 | | 1,332,592 |
CME Group, Inc. | 14,700 | | 822,171 |
Cummins, Inc. | 7,404 | | 692,866 |
Common Stocks - continued |
| Shares | | Value |
United States of America - continued |
Cymer, Inc. (a) | 9,787 | | $ 779,926 |
FMC Technologies, Inc. (a) | 24,788 | | 1,013,829 |
Freeport-McMoRan Copper & Gold, Inc. | 13,800 | | 536,544 |
Martin Marietta Materials, Inc. (d) | 6,000 | | 493,860 |
MasterCard, Inc. Class A | 7,400 | | 3,410,882 |
Mead Johnson Nutrition Co. Class A | 30,200 | | 1,862,132 |
Mohawk Industries, Inc. (a) | 11,200 | | 934,864 |
National Oilwell Varco, Inc. | 20,289 | | 1,495,299 |
Philip Morris International, Inc. | 44,508 | | 3,941,628 |
PriceSmart, Inc. | 9,200 | | 763,508 |
ResMed, Inc. | 26,100 | | 1,042,434 |
Solera Holdings, Inc. | 11,689 | | 547,162 |
SS&C Technologies Holdings, Inc. (a) | 19,300 | | 463,779 |
Union Pacific Corp. | 17,300 | | 2,128,419 |
Visa, Inc. Class A | 19,500 | | 2,705,820 |
TOTAL UNITED STATES OF AMERICA | | 31,436,965 |
TOTAL COMMON STOCKS (Cost $179,197,131) |
189,196,209
|
Money Market Funds - 6.7% |
| | | |
Fidelity Cash Central Fund, 0.19% (b) | 6,916,036 | | 6,916,036 |
Fidelity Securities Lending Cash Central Fund, 0.19% (b)(c) | 5,935,200 | | 5,935,200 |
TOTAL MONEY MARKET FUNDS (Cost $12,851,236) |
12,851,236
|
TOTAL INVESTMENT PORTFOLIO - 104.8% (Cost $192,048,367) | | 202,047,445 |
NET OTHER ASSETS (LIABILITIES) - (4.8)% | | (9,201,174) |
NET ASSETS - 100% | $ 192,846,271 |
Legend |
(a) Non-income producing |
(b) Affiliated fund that is available only to investment companies and other accounts managed by Fidelity Investments. The rate quoted is the annualized seven-day yield of the fund at period end. A complete unaudited listing of the fund's holdings as of its most recent quarter end is available upon request. In addition, each Fidelity Central Fund's financial statements, which are not covered by the Fund's Report of Independent Registered Public Accounting Firm, are available on the SEC's website or upon request. |
(c) Investment made with cash collateral received from securities on loan. |
(d) Security or a portion of the security is on loan at period end. |
Affiliated Central Funds |
Information regarding fiscal year to date income earned by the Fund from investments in Fidelity Central Funds is as follows: |
Fund | Income earned |
Fidelity Cash Central Fund | $ 7,474 |
Fidelity Securities Lending Cash Central Fund | 56,903 |
Total | $ 64,377 |
Other Information |
Categorizations in the Schedule of Investments are based on country or territory of incorporation. |
The following is a summary of the inputs used, as of October 31, 2012, involving the Fund's assets and liabilities carried at fair value. The inputs or methodology used for valuing securities may not be an indication of the risk associated with investing in those securities. For more information on valuation inputs, and their aggregation into the levels used in the tables below, please refer to the Security Valuation section in the accompanying Notes to Financial Statements. |
Valuation Inputs at Reporting Date: |
Description | Total | Level 1 | Level 2 | Level 3 |
Investments in Securities: | | | | |
Equities: | | | | |
Consumer Discretionary | $ 27,951,837 | $ 27,951,837 | $ - | $ - |
Consumer Staples | 46,360,558 | 39,470,103 | 6,890,455 | - |
Energy | 10,614,344 | 10,614,344 | - | - |
Financials | 14,187,562 | 14,187,562 | - | - |
Health Care | 21,930,570 | 21,930,570 | - | - |
Industrials | 27,966,498 | 27,966,498 | - | - |
Information Technology | 16,306,219 | 16,306,219 | - | - |
Materials | 23,878,621 | 23,878,621 | - | - |
Money Market Funds | 12,851,236 | 12,851,236 | - | - |
Total Investments in Securities: | $ 202,047,445 | $ 195,156,990 | $ 6,890,455 | $ - |
The following is a summary of transfers between Level 1 and Level 2 for the period ended October 31, 2012. Transfers are assumed to have occurred at the beginning of the period, and are primarily attributable to the valuation techniques used for foreign equity securities, as discussed in the accompanying Notes to Financial Statements: |
Transfers | Total |
Level 1 to Level 2 | $ 0 |
Level 2 to Level 1 | $ 8,172,491 |
See accompanying notes which are an integral part of the financial statements.
Annual Report
Statement of Assets and Liabilities
| October 31, 2012 |
| | |
Assets | | |
Investment in securities, at value (including securities loaned of $5,892,979) - See accompanying schedule: Unaffiliated issuers (cost $179,197,131) | $ 189,196,209 | |
Fidelity Central Funds (cost $12,851,236) | 12,851,236 | |
Total Investments (cost $192,048,367) | | $ 202,047,445 |
Foreign currency held at value (cost $128) | | 128 |
Receivable for investments sold | | 193,639 |
Receivable for fund shares sold | | 861,534 |
Dividends receivable | | 270,403 |
Distributions receivable from Fidelity Central Funds | | 4,169 |
Receivable from investment adviser for expense reductions | | 33,993 |
Other receivables | | 7,075 |
Total assets | | 203,418,386 |
| | |
Liabilities | | |
Payable for investments purchased | $ 4,214,811 | |
Payable for fund shares redeemed | 174,237 | |
Accrued management fee | 121,924 | |
Distribution and service plan fees payable | 14,452 | |
Other affiliated payables | 46,085 | |
Other payables and accrued expenses | 65,406 | |
Collateral on securities loaned, at value | 5,935,200 | |
Total liabilities | | 10,572,115 |
| | |
Net Assets | | $ 192,846,271 |
Net Assets consist of: | | |
Paid in capital | | $ 187,380,543 |
Undistributed net investment income | | 1,374,430 |
Accumulated undistributed net realized gain (loss) on investments and foreign currency transactions | | (5,900,404) |
Net unrealized appreciation (depreciation) on investments and assets and liabilities in foreign currencies | | 9,991,702 |
Net Assets | | $ 192,846,271 |
See accompanying notes which are an integral part of the financial statements.
Annual Report
Financial Statements - continued
Statement of Assets and Liabilities - continued
| October 31, 2012 |
| | |
Calculation of Maximum Offering Price Class A:
Net Asset Value and redemption price per share ($21,874,352 ÷ 2,455,261 shares) | | $ 8.91 |
| | |
Maximum offering price per share (100/94.25 of $8.91) | | $ 9.45 |
Class T:
Net Asset Value and redemption price per share ($10,689,976 ÷ 1,202,180 shares) | | $ 8.89 |
| | |
Maximum offering price per share (100/96.50 of $8.89) | | $ 9.21 |
Class B:
Net Asset Value and offering price per share ($1,116,152 ÷ 125,639 shares)A | | $ 8.88 |
| | |
Class C:
Net Asset Value and offering price per share ($5,647,907 ÷ 638,785 shares)A | | $ 8.84 |
| | |
International Growth:
Net Asset Value, offering price and redemption price per share ($149,526,022 ÷ 16,710,639 shares) | | $ 8.95 |
| | |
Institutional Class:
Net Asset Value, offering price and redemption price per share ($3,991,862 ÷ 446,301 shares) | | $ 8.94 |
A Redemption price per share is equal to net asset value less any applicable contingent deferred sales charge.
See accompanying notes which are an integral part of the financial statements.
Annual Report
Statement of Operations
| Year ended October 31, 2012 |
| | |
Investment Income | | |
Dividends | | $ 3,011,819 |
Interest | | 13 |
Income from Fidelity Central Funds | | 64,377 |
Income before foreign taxes withheld | | 3,076,209 |
Less foreign taxes withheld | | (190,510) |
Total income | | 2,885,699 |
| | |
Expenses | | |
Management fee
Basic fee | $ 841,290 | |
Performance adjustment | 98,242 | |
Transfer agent fees | 325,129 | |
Distribution and service plan fees | 96,288 | |
Accounting and security lending fees | 62,806 | |
Custodian fees and expenses | 59,416 | |
Independent trustees' compensation | 721 | |
Registration fees | 83,181 | |
Audit | 66,173 | |
Legal | 501 | |
Miscellaneous | 773 | |
Total expenses before reductions | 1,634,520 | |
Expense reductions | (126,529) | 1,507,991 |
Net investment income (loss) | | 1,377,708 |
Realized and Unrealized Gain (Loss) Net realized gain (loss) on: | | |
Investment securities: | | |
Unaffiliated issuers | (820,062) | |
Foreign currency transactions | (13,150) | |
Total net realized gain (loss) | | (833,212) |
Change in net unrealized appreciation (depreciation) on: Investment securities | 11,235,369 | |
Assets and liabilities in foreign currencies | (8,388) | |
Total change in net unrealized appreciation (depreciation) | | 11,226,981 |
Net gain (loss) | | 10,393,769 |
Net increase (decrease) in net assets resulting from operations | | $ 11,771,477 |
See accompanying notes which are an integral part of the financial statements.
Annual Report
Financial Statements - continued
Statement of Changes in Net Assets
| Year ended
October 31,
2012 | Year ended
October 31,
2011 |
Increase (Decrease) in Net Assets | | |
Operations | | |
Net investment income (loss) | $ 1,377,708 | $ 628,947 |
Net realized gain (loss) | (833,212) | 1,817,821 |
Change in net unrealized appreciation (depreciation) | 11,226,981 | (6,057,574) |
Net increase (decrease) in net assets resulting
from operations | 11,771,477 | (3,610,806) |
Distributions to shareholders from net investment income | (594,738) | (276,358) |
Distributions to shareholders from net realized gain | (48,645) | (48,341) |
Total distributions | (643,383) | (324,699) |
Share transactions - net increase (decrease) | 115,271,822 | 35,841,228 |
Redemption fees | 5,972 | 7,927 |
Total increase (decrease) in net assets | 126,405,888 | 31,913,650 |
| | |
Net Assets | | |
Beginning of period | 66,440,383 | 34,526,733 |
End of period (including undistributed net investment income of $1,374,430 and undistributed net investment income of $591,460, respectively) | $ 192,846,271 | $ 66,440,383 |
See accompanying notes which are an integral part of the financial statements.
Annual Report
Financial Highlights - Class A
Years ended October 31, | 2012 | 2011 | 2010 | 2009 | 2008 F |
Selected Per-Share Data | | | | | |
Net asset value, beginning of period | $ 8.09 | $ 8.38 | $ 7.01 | $ 5.46 | $ 10.00 |
Income from Investment Operations | | | | | |
Net investment income (loss) C | .08 | .08 | .05 | .05 | .07 |
Net realized and unrealized gain (loss) | .81 | (.31) | 1.39 | 1.55 | (4.61) |
Total from investment operations | .89 | (.23) | 1.44 | 1.60 | (4.54) |
Distributions from net investment income | (.06) | (.05) | (.05) | (.05) | - |
Distributions from net realized gain | (.01) | (.01) | (.03) | - | - |
Total distributions | (.07) | (.06) | (.07) I | (.05) | - |
Redemption fees added to paid in capital C, H | - | - | - | - | - |
Net asset value, end of period | $ 8.91 | $ 8.09 | $ 8.38 | $ 7.01 | $ 5.46 |
Total Return A, B | 11.10% | (2.76)% | 20.68% | 29.72% | (45.40)% |
Ratios to Average Net Assets D, G | | | | | |
Expenses before reductions | 1.58% | 1.77% | 2.13% | 2.46% | 2.88% |
Expenses net of fee waivers, if any | 1.45% | 1.45% | 1.50% | 1.50% | 1.50% |
Expenses net of all reductions | 1.44% | 1.43% | 1.48% | 1.47% | 1.48% |
Net investment income (loss) | .99% | .92% | .74% | .85% | .80% |
Supplemental Data | | | | | |
Net assets, end of period (000 omitted) | $ 21,874 | $ 6,352 | $ 3,084 | $ 1,452 | $ 820 |
Portfolio turnover rate E | 32% | 68% | 87% | 116% | 115% |
A Total returns would have been lower if certain expenses had not been reduced during the applicable periods shown.
B Total returns do not include the effect of the sales charges.
C Calculated based on average shares outstanding during the period.
D Fees and expenses of any underlying Fidelity Central Funds are not included in the Fund's expense ratio. The Fund indirectly bears its proportionate share of the expenses of any underlying Fidelity Central Funds.
E Amount does not include the portfolio activity of any underlying Fidelity Central Funds.
F For the period November 1, 2007 (commencement of operations) to October 31, 2008.
G Expense ratios reflect operating expenses of the class. Expenses before reductions do not reflect amounts reimbursed by the investment adviser or reductions from brokerage service arrangements or reductions from other expense offset arrangements and do not represent the amount paid by the class during periods when reimbursements or reductions occur. Expense ratios before reductions for start-up periods may not be representative of longer-term operating periods. Expenses net of fee waivers reflect expenses after reimbursement by the investment adviser but prior to reductions from brokerage service arrangements or other expense offset arrangements. Expenses net of all reductions represent the net expenses paid by the class.
H Amount represents less than $.01 per share.
I Total distributions of $.07 per share is comprised of distributions from net investment income of $.046 and distributions from net realized gain of $.025 per share.
See accompanying notes which are an integral part of the financial statements.
Annual Report
Financial Highlights - Class T
Years ended October 31, | 2012 | 2011 | 2010 | 2009 | 2008 F |
Selected Per-Share Data | | | | | |
Net asset value, beginning of period | $ 8.08 | $ 8.38 | $ 7.00 | $ 5.45 | $ 10.00 |
Income from Investment Operations | | | | | |
Net investment income (loss) C | .06 | .06 | .04 | .03 | .05 |
Net realized and unrealized gain (loss) | .81 | (.31) | 1.39 | 1.55 | (4.60) |
Total from investment operations | .87 | (.25) | 1.43 | 1.58 | (4.55) |
Distributions from net investment income | (.05) | (.04) | (.02) | (.03) | - |
Distributions from net realized gain | (.01) | (.01) | (.03) | - | - |
Total distributions | (.06) | (.05) | (.05) | (.03) | - |
Redemption fees added to paid in capital C, H | - | - | - | - | - |
Net asset value, end of period | $ 8.89 | $ 8.08 | $ 8.38 | $ 7.00 | $ 5.45 |
Total Return A, B | 10.82% | (3.03)% | 20.47% | 29.22% | (45.50)% |
Ratios to Average Net Assets D, G | | | | | |
Expenses before reductions | 1.85% | 2.03% | 2.41% | 2.67% | 3.07% |
Expenses net of fee waivers, if any | 1.70% | 1.70% | 1.75% | 1.75% | 1.75% |
Expenses net of all reductions | 1.69% | 1.68% | 1.73% | 1.73% | 1.73% |
Net investment income (loss) | .74% | .67% | .49% | .59% | .55% |
Supplemental Data | | | | | |
Net assets, end of period (000 omitted) | $ 10,690 | $ 2,917 | $ 1,034 | $ 532 | $ 507 |
Portfolio turnover rate E | 32% | 68% | 87% | 116% | 115% |
A Total returns would have been lower if certain expenses had not been reduced during the applicable periods shown.
B Total returns do not include the effect of the sales charges.
C Calculated based on average shares outstanding during the period.
D Fees and expenses of any underlying Fidelity Central Funds are not included in the Fund's expense ratio. The Fund indirectly bears its proportionate share of the expenses of any underlying Fidelity Central Funds.
E Amount does not include the portfolio activity of any underlying Fidelity Central Funds.
F For the period November 1, 2007 (commencement of operations) to October 31, 2008.
G Expense ratios reflect operating expenses of the class. Expenses before reductions do not reflect amounts reimbursed by the investment adviser or reductions from brokerage service arrangements or reductions from other expense offset arrangements and do not represent the amount paid by the class during periods when reimbursements or reductions occur. Expense ratios before reductions for start-up periods may not be representative of longer-term operating periods. Expenses net of fee waivers reflect expenses after reimbursement by the investment adviser but prior to reductions from brokerage service arrangements or other expense offset arrangements. Expenses net of all reductions represent the net expenses paid by the class.
H Amount represents less than $.01 per share.
See accompanying notes which are an integral part of the financial statements.
Annual Report
Financial Highlights - Class B
Years ended October 31, | 2012 | 2011 | 2010 | 2009 | 2008 F |
Selected Per-Share Data | | | | | |
Net asset value, beginning of period | $ 8.06 | $ 8.36 | $ 6.98 | $ 5.42 | $ 10.00 |
Income from Investment Operations | | | | | |
Net investment income (loss) C | .02 | .01 | - H | .01 | - H |
Net realized and unrealized gain (loss) | .80 | (.30) | 1.38 | 1.55 | (4.58) |
Total from investment operations | .82 | (.29) | 1.38 | 1.56 | (4.58) |
Distributions from net investment income | - | (.01) | - | - | - |
Distributions from net realized gain | - | - H | - | - | - |
Total distributions | - | (.01) | - | - | - |
Redemption fees added to paid in capital C, H | - | - | - | - | - |
Net asset value, end of period | $ 8.88 | $ 8.06 | $ 8.36 | $ 6.98 | $ 5.42 |
Total Return A, B | 10.17% | (3.47)% | 19.77% | 28.78% | (45.80)% |
Ratios to Average Net Assets D, G | | | | | |
Expenses before reductions | 2.35% | 2.55% | 2.87% | 3.17% | 3.55% |
Expenses net of fee waivers, if any | 2.20% | 2.20% | 2.25% | 2.25% | 2.25% |
Expenses net of all reductions | 2.19% | 2.18% | 2.23% | 2.23% | 2.23% |
Net investment income (loss) | .24% | .17% | (.01)% | .09% | .05% |
Supplemental Data | | | | | |
Net assets, end of period (000 omitted) | $ 1,116 | $ 473 | $ 581 | $ 328 | $ 642 |
Portfolio turnover rate E | 32% | 68% | 87% | 116% | 115% |
A Total returns would have been lower if certain expenses had not been reduced during the applicable periods shown.
B Total returns do not include the effect of the contingent deferred sales charge.
C Calculated based on average shares outstanding during the period.
D Fees and expenses of any underlying Fidelity Central Funds are not included in the Fund's expense ratio. The Fund indirectly bears its proportionate share of the expenses of any underlying Fidelity Central Funds.
E Amount does not include the portfolio activity of any underlying Fidelity Central Funds.
F For the period November 1, 2007 (commencement of operations) to October 31, 2008.
G Expense ratios reflect operating expenses of the class. Expenses before reductions do not reflect amounts reimbursed by the investment adviser or reductions from brokerage service arrangements or reductions from other expense offset arrangements and do not represent the amount paid by the class during periods when reimbursements or reductions occur. Expense ratios before reductions for start-up periods may not be representative of longer-term operating periods. Expenses net of fee waivers reflect expenses after reimbursement by the investment adviser but prior to reductions from brokerage service arrangements or other expense offset arrangements. Expenses net of all reductions represent the net expenses paid by the class.
H Amount represents less than $.01 per share.
See accompanying notes which are an integral part of the financial statements.
Annual Report
Financial Highlights - Class C
Years ended October 31, | 2012 | 2011 | 2010 | 2009 | 2008 F |
Selected Per-Share Data | | | | | |
Net asset value, beginning of period | $ 8.03 | $ 8.34 | $ 6.98 | $ 5.42 | $ 10.00 |
Income from Investment Operations | | | | | |
Net investment income (loss) C | .02 | .01 | - H | .01 | - H |
Net realized and unrealized gain (loss) | .80 | (.31) | 1.38 | 1.55 | (4.58) |
Total from investment operations | .82 | (.30) | 1.38 | 1.56 | (4.58) |
Distributions from net investment income | (.01) | (.01) | - | - | - |
Distributions from net realized gain | (.01) | (.01) | (.02) | - | - |
Total distributions | (.01) J | (.01) I | (.02) | - | - |
Redemption fees added to paid in capital C, H | - | - | - | - | - |
Net asset value, end of period | $ 8.84 | $ 8.03 | $ 8.34 | $ 6.98 | $ 5.42 |
Total Return A, B | 10.27% | (3.57)% | 19.82% | 28.78% | (45.80)% |
Ratios to Average Net Assets D, G | | | | | |
Expenses before reductions | 2.33% | 2.52% | 2.89% | 3.21% | 3.52% |
Expenses net of fee waivers, if any | 2.20% | 2.20% | 2.25% | 2.25% | 2.25% |
Expenses net of all reductions | 2.19% | 2.18% | 2.24% | 2.23% | 2.23% |
Net investment income (loss) | .24% | .17% | (.01)% | .09% | .05% |
Supplemental Data | | | | | |
Net assets, end of period (000 omitted) | $ 5,648 | $ 2,767 | $ 1,261 | $ 780 | $ 684 |
Portfolio turnover rate E | 32% | 68% | 87% | 116% | 115% |
A Total returns would have been lower if certain expenses had not been reduced during the applicable periods shown.
B Total returns do not include the effect of the contingent deferred sales charge.
C Calculated based on average shares outstanding during the period.
D Fees and expenses of any underlying Fidelity Central Funds are not included in the Fund's expense ratio. The Fund indirectly bears its proportionate share of the expenses of any underlying Fidelity Central Funds.
E Amount does not include the portfolio activity of any underlying Fidelity Central Funds.
F For the period November 1, 2007 (commencement of operations) to October 31, 2008.
G Expense ratios reflect operating expenses of the class. Expenses before reductions do not reflect amounts reimbursed by the investment adviser or reductions from brokerage service arrangements or reductions from other expense offset arrangements and do not represent the amount paid by the class during periods when reimbursements or reductions occur. Expense ratios before reductions for start-up periods may not be representative of longer-term operating periods. Expenses net of fee waivers reflect expenses after reimbursement by the investment adviser but prior to reductions from brokerage service arrangements or other expense offset arrangements. Expenses net of all reductions represent the net expenses paid by the class.
H Amount represents less than $.01 per share.
I Total distributions of $.01 per share is comprised of distributions from net investment income of $.008 and distributions from net realized gain of $.005 per share.
J Total distributions of $.01 per share is comprised of distributions from net investment income of $.007 and distributions from net realized gain of $.006 per share.
See accompanying notes which are an integral part of the financial statements.
Annual Report
Financial Highlights - International Growth
Years ended October 31, | 2012 | 2011 | 2010 | 2009 | 2008 E |
Selected Per-Share Data | | | | | |
Net asset value, beginning of period | $ 8.12 | $ 8.40 | $ 7.02 | $ 5.48 | $ 10.00 |
Income from Investment Operations | | | | | |
Net investment income (loss) B | .11 | .10 | .07 | .06 | .09 |
Net realized and unrealized gain (loss) | .81 | (.30) | 1.39 | 1.54 | (4.60) |
Total from investment operations | .92 | (.20) | 1.46 | 1.60 | (4.51) |
Distributions from net investment income | (.08) | (.07) | (.06) | (.06) | (.01) |
Distributions from net realized gain | (.01) | (.01) | (.03) | - | - |
Total distributions | (.09) | (.08) | (.08) H | (.06) | (.01) |
Redemption fees added to paid in capital B, G | - | - | - | - | - |
Net asset value, end of period | $ 8.95 | $ 8.12 | $ 8.40 | $ 7.02 | $ 5.48 |
Total Return A | 11.41% | (2.47)% | 20.97% | 29.77% | (45.17)% |
Ratios to Average Net Assets C, F | | | | | |
Expenses before reductions | 1.28% | 1.52% | 1.89% | 2.19% | 2.35% |
Expenses net of fee waivers, if any | 1.20% | 1.20% | 1.25% | 1.25% | 1.25% |
Expenses net of all reductions | 1.19% | 1.18% | 1.23% | 1.23% | 1.23% |
Net investment income (loss) | 1.24% | 1.17% | .99% | 1.09% | 1.05% |
Supplemental Data | | | | | |
Net assets, end of period (000 omitted) | $ 149,526 | $ 53,437 | $ 28,454 | $ 18,254 | $ 11,884 |
Portfolio turnover rate D | 32% | 68% | 87% | 116% | 115% |
A Total returns would have been lower if certain expenses had not been reduced during the applicable periods shown.
B Calculated based on average shares outstanding during the period.
C Fees and expenses of any underlying Fidelity Central Funds are not included in the Fund's expense ratio. The Fund indirectly bears its proportionate share of the expenses of any underlying Fidelity Central Funds.
D Amount does not include the portfolio activity of any underlying Fidelity Central Funds.
E For the period November 1, 2007 (commencement of operations) to October 31, 2008.
F Expense ratios reflect operating expenses of the class. Expenses before reductions do not reflect amounts reimbursed by the investment adviser or reductions from brokerage service arrangements or reductions from other expense offset arrangements and do not represent the amount paid by the class during periods when reimbursements or reductions occur. Expense ratios before reductions for start-up periods may not be representative of longer-term operating periods. Expenses net of fee waivers reflect expenses after reimbursement by the investment adviser but prior to reductions from brokerage service arrangements or other expense offset arrangements. Expenses net of all reductions represent the net expenses paid by the class.
G Amount represents less than $.01 per share.
H Total distributions of $.08 per share is comprised of distributions from net investment income of $.057 and distributions from net realized gain of $.025 per share.
See accompanying notes which are an integral part of the financial statements.
Annual Report
Financial Highlights - Institutional Class
Years ended October 31, | 2012 | 2011 | 2010 | 2009 | 2008 E |
Selected Per-Share Data | | | | | |
Net asset value, beginning of period | $ 8.12 | $ 8.40 | $ 7.02 | $ 5.48 | $ 10.00 |
Income from Investment Operations | | | | | |
Net investment income (loss) B | .10 | .10 | .07 | .06 | .09 |
Net realized and unrealized gain (loss) | .81 | (.30) | 1.39 | 1.54 | (4.60) |
Total from investment operations | .91 | (.20) | 1.46 | 1.60 | (4.51) |
Distributions from net investment income | (.08) | (.07) | (.06) | (.06) | (.01) |
Distributions from net realized gain | (.01) | (.01) | (.03) | - | - |
Total distributions | (.09) | (.08) | (.08) H | (.06) | (.01) |
Redemption fees added to paid in capital B, G | - | - | - | - | - |
Net asset value, end of period | $ 8.94 | $ 8.12 | $ 8.40 | $ 7.02 | $ 5.48 |
Total Return A | 11.28% | (2.47)% | 20.97% | 29.77% | (45.17)% |
Ratios to Average Net Assets C, F | | | | | |
Expenses before reductions | 1.27% | 1.50% | 1.92% | 2.01% | 2.56% |
Expenses net of fee waivers, if any | 1.20% | 1.20% | 1.25% | 1.25% | 1.25% |
Expenses net of all reductions | 1.19% | 1.18% | 1.23% | 1.23% | 1.23% |
Net investment income (loss) | 1.24% | 1.17% | .99% | 1.09% | 1.05% |
Supplemental Data | | | | | |
Net assets, end of period (000 omitted) | $ 3,992 | $ 493 | $ 113 | $ 36 | $ 521 |
Portfolio turnover rate D | 32% | 68% | 87% | 116% | 115% |
A Total returns would have been lower if certain expenses had not been reduced during the applicable periods shown.
B Calculated based on average shares outstanding during the period.
C Fees and expenses of any underlying Fidelity Central Funds are not included in the Fund's expense ratio. The Fund indirectly bears its proportionate share of the expenses of any underlying Fidelity Central Funds.
D Amount does not include the portfolio activity of any underlying Fidelity Central Funds.
E For the period November 1, 2007 (commencement of operations) to October 31, 2008.
F Expense ratios reflect operating expenses of the class. Expenses before reductions do not reflect amounts reimbursed by the investment adviser or reductions from brokerage service arrangements or reductions from other expense offset arrangements and do not represent the amount paid by the class during periods when reimbursements or reductions occur. Expense ratios before reductions for start-up periods may not be representative of longer-term operating periods. Expenses net of fee waivers reflect expenses after reimbursement by the investment adviser but prior to reductions from brokerage service arrangements or other expense offset arrangements. Expenses net of all reductions represent the net expenses paid by the class.
G Amount represents less than $.01 per share.
H Total distributions of $.08 per share is comprised of distributions from net investment income of $.057 and distributions from net realized gain of $.025 per share.
See accompanying notes which are an integral part of the financial statements.
Annual Report
Notes to Financial Statements
For the period ended October 31, 2012
1. Organization.
Fidelity International Growth Fund (the Fund) is a fund of Fidelity Investment Trust (the Trust) and is authorized to issue an unlimited number of shares. The Trust is registered under the Investment Company Act of 1940, as amended (the 1940 Act), as an open-end management investment company organized as a Massachusetts business trust. The Fund offers Class A, Class T, Class C, International Growth and Institutional Class shares, each of which, along with Class B shares, has equal rights as to assets and voting privileges. Effective after the close of business on September 1, 2010, Class B shares were closed to new accounts and additional purchases, except for exchanges and reinvestments. Each class has exclusive voting rights with respect to matters that affect that class. Class B shares will automatically convert to Class A shares after a holding period of seven years from the initial date of purchase. Investment income, realized and unrealized capital gains and losses, the common expenses of the Fund, and certain fund-level expense reductions, if any, are allocated on a pro-rata basis to each class based on the relative net assets of each class to the total net assets of the Fund. Each class differs with respect to transfer agent and distribution and service plan fees incurred. Certain expense reductions may also differ by class.
2. Investments in Fidelity Central Funds.
The Fund invests in Fidelity Central Funds, which are open-end investment companies available only to other investment companies and accounts managed by Fidelity Management & Research Company (FMR) and its affiliates. The Fund's Schedule of Investments lists each of the Fidelity Central Funds held as of period end, if any, as an investment of the Fund, but does not include the underlying holdings of each Fidelity Central Fund. As an Investing Fund, the Fund indirectly bears its proportionate share of the expenses of the underlying Fidelity Central Funds.
The Money Market Central Funds seek preservation of capital and current income and are managed by Fidelity Investments Money Management, Inc. (FIMM), an affiliate of FMR.
A complete unaudited list of holdings for each Fidelity Central Fund is available upon request or at the Securities and Exchange Commission (the SEC) web site at www.sec.gov. In addition, the financial statements of the Fidelity Central Funds, which are not covered by the Fund's Report of Independent Registered Public Accounting Firm, are available on the SEC web site or upon request.
Annual Report
3. Significant Accounting Policies.
The financial statements have been prepared in conformity with accounting principles generally accepted in the United States of America (GAAP), which require management to make certain estimates and assumptions at the date of the financial statements. Actual results could differ from those estimates. Subsequent events, if any, through the date that the financial statements were issued have been evaluated in the preparation of the financial statements. The following summarizes the significant accounting policies of the Fund:
Security Valuation. Investments are valued as of 4:00 p.m. Eastern time on the last calendar day of the period. In accordance with valuation policies and procedures approved by the Board of Trustees (the Board), the Fund attempts to obtain prices from one or more third party pricing vendors or brokers to value its investments. When current market prices, quotations or rates are not readily available or reliable, securities will be fair valued in good faith by the FMR Fair Value Committee (the Committee), in accordance with procedures adopted by the Fund's Board. Factors used in determining fair value vary by security type and may include market or security specific events. The frequency with which these procedures are used cannot be predicted and they may be utilized to a significant extent. The Committee oversees the Fund's valuation policies and procedures and is responsible for approving and reporting to the Board all fair value determinations.
The Fund categorizes the inputs to valuation techniques used to value its investments into a disclosure hierarchy consisting of three levels as shown below:
Level 1 - quoted prices in active markets for identical investments
Level 2 - other significant observable inputs (including quoted prices for similar investments, interest rates, prepayment speeds, etc.)
Level 3 - unobservable inputs (including the Fund's own assumptions based on the best information available)
Valuation techniques used to value the Fund's investments by major category are as follows:
Equity securities, including restricted securities, for which market quotations are readily available, are valued at the last reported sale price or official closing price as reported by a third party pricing vendor on the primary market or exchange on which they are traded and are categorized as Level 1 in the hierarchy. In the event there were no sales during the day or closing prices are not available, securities are valued at the last quoted bid price or may be valued using the last available price and are generally categorized as Level 2 in the hierarchy. For foreign equity securities, when significant market or security specific events arise, comparisons to the valuation of American Depositary Receipts
Annual Report
Notes to Financial Statements - continued
3. Significant Accounting Policies - continued
Security Valuation - continued
(ADRs), futures contracts, Exchange-Traded Funds (ETFs) and certain indexes as well as quoted prices for similar securities are used and are categorized as Level 2 in the hierarchy. Utilizing these techniques may result in transfers between Level 1 and Level 2.
Investments in open-end mutual funds, including the Fidelity Central Funds, are valued at their closing net asset value (NAV) each business day and are categorized as Level 1 in the hierarchy.
Changes in valuation techniques may result in transfers in or out of an assigned level within the disclosure hierarchy. The aggregate value of investments by input level, as of October 31, 2012, including information on transfers between Levels 1 and 2, is included at the end of the Fund's Schedule of Investments.
Foreign Currency Translation. The Fund may use foreign currency contracts to facilitate transactions in foreign-denominated securities. Gains and losses from these transactions may arise from changes in the value of the foreign currency or if the counterparties do not perform under the contracts' terms.
Foreign-denominated assets, including investment securities, and liabilities are translated into U.S. dollars at the exchange rates at period end. Purchases and sales of investment securities, income and dividends received and expenses denominated in foreign currencies are translated into U.S. dollars at the exchange rate in effect on the transaction date.
The effects of exchange rate fluctuations on investments are included with the net realized and unrealized gain (loss) on investment securities. Other foreign currency transactions resulting in realized and unrealized gain (loss) are disclosed separately.
Investment Transactions and Income. For financial reporting purposes, the Fund's investment holdings and NAV include trades executed through the end of the last business day of the period. The NAV per share for processing shareholder transactions is calculated as of the close of business of the New York Stock Exchange (NYSE), normally 4:00 p.m. Eastern time and includes trades executed through the end of the prior business day. Gains and losses on securities sold are determined on the basis of identified cost. Dividend income is recorded on the ex-dividend date, except for certain dividends from foreign securities where the ex-dividend date may have passed, which are recorded as soon as the Fund is informed of the ex-dividend date. Non-cash dividends included in dividend income, if any, are recorded at the fair market value of the securities received. Interest income and distributions from the Fidelity Central Funds are accrued as earned. Interest income includes coupon interest and amortization of premium and accretion of discount on debt securities. Investment income is recorded net of foreign taxes withheld where recovery of such taxes is uncertain.
Annual Report
3. Significant Accounting Policies - continued
Expenses. Expenses directly attributable to a fund are charged to that fund. Expenses attributable to more than one fund are allocated among the respective funds on the basis of relative net assets or other appropriate methods. Expense estimates are accrued in the period to which they relate and adjustments are made when actual amounts are known.
Income Tax Information and Distributions to Shareholders. Each year, the Fund intends to qualify as a regulated investment company under Subchapter M of the Internal Revenue Code, including distributing substantially all of its taxable income and realized gains. As a result, no provision for income taxes is required. As of October 31, 2012, the Fund did not have any unrecognized tax benefits in the financial statements; nor is the Fund aware of any tax positions for which it is reasonably possible that the total amounts of unrecognized tax benefits will significantly change in the next twelve months. The Fund files a U.S. federal tax return, in addition to state and local tax returns as required. A fund's federal income tax returns are subject to examination by the Internal Revenue Service (IRS) for a period of three fiscal years after they are filed. State and local tax returns may be subject to examination for an additional fiscal year depending on the jurisdiction. Foreign taxes are provided for based on the Fund's understanding of the tax rules and rates that exist in the foreign markets in which it invests.
Distributions are declared and recorded on the ex-dividend date. Income dividends and capital gain distributions are declared separately for each class. Income and capital gain distributions are determined in accordance with income tax regulations, which may differ from GAAP.
Capital accounts within the financial statements are adjusted for permanent book-tax differences. These adjustments have no impact on net assets or the results of operations. Temporary book-tax differences will reverse in a subsequent period.
Book-tax differences are primarily due to foreign currency transactions, passive foreign investment companies (PFIC), partnerships, capital loss carryforwards and losses deferred due to wash sales.
The federal tax cost of investment securities and unrealized appreciation (depreciation) as of period end were as follows:
Gross unrealized appreciation | $ 16,586,724 |
Gross unrealized depreciation | (6,916,202) |
Net unrealized appreciation (depreciation) on securities and other investments | $ 9,670,522 |
| |
Tax Cost | $ 192,376,923 |
Annual Report
Notes to Financial Statements - continued
3. Significant Accounting Policies - continued
Income Tax Information and Distributions to Shareholders - continued
The tax-based components of distributable earnings as of period end were as follows:
Undistributed ordinary income | $ 1,436,227 |
Capital loss carryforward | $ (5,633,645) |
Net unrealized appreciation (depreciation) | $ 9,663,146 |
Capital loss carryforwards are only available to offset future capital gains of the Fund to the extent provided by regulations and may be limited. Under the Regulated Investment Company Modernization Act of 2010 (the Act), the Fund is permitted to carry forward capital losses incurred in taxable years beginning after December 22, 2010 for an unlimited period and such capital losses are required to be used prior to any losses that expire. Capital loss carryforwards were as follows:
Fiscal year of expiration | |
2016 | $ (1,819,472) |
2017 | (2,797,799) |
Total with expiration | (4,617,271) |
No expiration | |
Short-term | (1,016,374) |
Total capital loss carryforward | $ (5,633,645) |
The tax character of distributions paid was as follows:
| October 31, 2012 | October 31, 2011 |
Ordinary Income | $ 643,383 | $ 324,699 |
Short-Term Trading (Redemption) Fees. Shares held by investors in the Fund less than 30 days are subject to a redemption fee equal to 1.00% of the net asset value of shares redeemed. All redemption fees, which reduce the proceeds of the shareholder redemption, are retained by the Fund and accounted for as an addition to paid in capital.
New Accounting Pronouncement. In December 2011, the Financial Accounting Standards Board issued Accounting Standard Update No. 2011-11, Disclosures about Offsetting Assets and Liabilities. The update creates new disclosure requirements requiring entities to disclose both gross and net information for derivatives and other financial instruments that are either offset in the Statement of Assets and Liabilities or subject to an enforceable master netting arrangement or similar agreement. The disclosure requirements are effective for annual reporting periods beginning on or after January 1, 2013, and interim periods within those annual periods. Management is
Annual Report
3. Significant Accounting Policies - continued
New Accounting Pronouncement - continued
currently evaluating the impact of the update's adoption on the Fund's financial statement disclosures.
4. Purchases and Sales of Investments.
Purchases and sales of securities, other than short-term securities, aggregated $152,600,135 and $37,480,345, respectively.
5. Fees and Other Transactions with Affiliates.
Management Fee. FMR and its affiliates provide the Fund with investment management related services for which the Fund pays a monthly management fee. The management fee is the sum of an individual fund fee rate that is based on an annual rate of .45% of the Fund's average net assets and an annualized group fee rate that averaged .26% during the period. The group fee rate is based upon the average net assets of all the mutual funds advised by FMR. The group fee rate decreases as assets under management increase and increases as assets under management decrease. In addition, the management fee is subject to a performance adjustment (up to a maximum of ± .20% of the Fund's average net assets over a 36 month performance period). The upward or downward adjustment to the management fee is based on the relative investment performance of International Growth as compared to an appropriate benchmark index. For the period, the total annual management fee rate, including the performance adjustment, was .79% of the Fund's average net assets.
Distribution and Service Plan Fees. In accordance with Rule 12b-1 of the 1940 Act, the Fund has adopted separate Distribution and Service Plans for each class of shares. Certain classes pay Fidelity Distributors Corporation (FDC), an affiliate of FMR, separate Distribution and Service Fees, each of which is based on an annual percentage of each class' average net assets. In addition, FDC may pay financial intermediaries for selling shares of the Fund and providing shareholder support services. For the period, the Distribution and Service Fee rates, total fees and amounts retained by FDC were as follows:
| Distribution
Fee | Service
Fee | Total Fees | Retained
by FDC |
Class A | -% | .25% | $ 27,055 | $ 698 |
Class T | .25% | .25% | 25,571 | 121 |
Class B | .75% | .25% | 6,002 | 4,531 |
Class C | .75% | .25% | 37,660 | 12,092 |
| | | $ 96,288 | $ 17,442 |
Annual Report
Notes to Financial Statements - continued
5. Fees and Other Transactions with Affiliates - continued
Sales Load. FDC may receive a front-end sales charge of up to 5.75% for selling Class A shares and 3.50% for selling Class T shares, some of which is paid to financial intermediaries for selling shares of the Fund. Depending on the holding period, FDC may receive contingent deferred sales charges levied on Class A, Class T, Class B, and Class C redemptions. The deferred sales charges range from 5.00% to 1.00% for Class B shares, 1.00% for Class C shares, 1.00% for certain purchases of Class A shares and .25% for certain purchases of Class T shares.
For the period, sales charge amounts retained by FDC were as follows:
| Retained
by FDC |
Class A | $ 15,825 |
Class T | 3,545 |
Class B* | 1,058 |
Class C* | 1,676 |
| $ 22,104 |
* When Class B and Class C shares are initially sold, FDC pays commissions from its own resources to financial intermediaries through which the sales are made.
Transfer Agent Fees. Fidelity Investments Institutional Operations Company, Inc. (FIIOC), an affiliate of FMR, is the transfer, dividend disbursing and shareholder servicing agent for each class of the Fund. FIIOC receives account fees and asset-based fees that vary according to the account size and type of account of the shareholders of the respective classes of the Fund. FIIOC pays for typesetting, printing and mailing of shareholder reports, except proxy statements. For the period, transfer agent fees for each class were as follows:
| Amount | % of
Average
Net Assets |
Class A | $ 32,331 | .30 |
Class T | 16,359 | .32 |
Class B | 1,802 | .30 |
Class C | 11,442 | .30 |
International Growth | 258,582 | .27 |
Institutional Class | 4,613 | .25 |
| $ 325,129 | |
Annual Report
5. Fees and Other Transactions with Affiliates - continued
Accounting and Security Lending Fees. Fidelity Service Company, Inc. (FSC), an affiliate of FMR, maintains the Fund's accounting records. The accounting fee is based on the level of average net assets for each month. Under a separate contract, FSC administers the security lending program. The security lending fee is based on the number and duration of lending transactions.
Brokerage Commissions. The Fund placed a portion of its portfolio transactions with brokerage firms which are affiliates of the investment adviser. The commissions paid to these affiliated firms were $375 for the period.
6. Committed Line of Credit.
The Fund participates with other funds managed by FMR or an affiliate in a $4.25 billion credit facility (the "line of credit") to be utilized for temporary or emergency purposes to fund shareholder redemptions or for other short-term liquidity purposes. The Fund has agreed to pay commitment fees on its pro-rata portion of the line of credit, which amounted to $289 and is reflected in Miscellaneous expenses on the Statement of Operations. During the period, there were no borrowings on this line of credit.
7. Security Lending.
The Fund lends portfolio securities through a lending agent from time to time in order to earn additional income. For equity securities, a lending agent is used and may loan securities to certain qualified borrowers, including Fidelity Capital Markets (FCM), a broker-dealer affiliated with the Fund. On the settlement date of the loan, the Fund receives collateral (in the form of U.S. Treasury obligations, letters of credit and/or cash) against the loaned securities and maintains collateral in an amount not less than 100% of the market value of the loaned securities during the period of the loan. The market value of the loaned securities is determined at the close of business of the Fund and any additional required collateral is delivered to the Fund on the next business day. If the borrower defaults on its obligation to return the securities loaned because of insolvency or other reasons, a fund could experience delays and costs in recovering the securities loaned or in gaining access to the collateral. Any cash collateral received is invested in the Fidelity Securities Lending Cash Central Fund. The value of loaned securities and cash collateral at period end are disclosed on the Fund's Statement of Assets and Liabilities. Security lending income represents the income earned on investing cash collateral, less rebates paid to borrowers and any lending agent fees associated with the loan, plus any premium payments received for lending certain types of securities. Security lending income is presented in the Statement of Operations as a component of income from Fidelity Central Funds. Total security lending income during the period amounted to $56,903. During the period, there were no securities loaned to FCM.
Annual Report
Notes to Financial Statements - continued
8. Expense Reductions.
FMR contractually agreed to reimburse each class to the extent annual operating expenses exceeded certain levels of average net assets as noted in the table below. This reimbursement will remain in place through December 31, 2013. Some expenses, for example interest expense, including commitment fees, are excluded from this reimbursement.
The following classes were in reimbursement during the period:
| Expense
Limitations | Reimbursement
from adviser |
Class A | 1.45% | $ 13,952 |
Class T | 1.70% | 7,830 |
Class B | 2.20% | 897 |
Class C | 2.20% | 4,960 |
International Growth | 1.20% | 82,095 |
Institutional Class | 1.20% | 1,177 |
| | $ 110,911 |
Many of the brokers with whom FMR places trades on behalf of the Fund provided services to the Fund in addition to trade execution. These services included payments of certain expenses on behalf of the Fund totaling $15,575 for the period. In addition, through arrangements with the Fund's custodian, credits realized as a result of uninvested cash balances were used to reduce the Fund's expenses. During the period, these credits reduced the Fund's custody expenses by $43.
9. Distributions to Shareholders.
Distributions to shareholders of each class were as follows:
Years ended October 31, | 2012 | 2011 |
From net investment income | | |
Class A | $ 50,503 | $ 19,878 |
Class T | 18,666 | 5,087 |
Class B | - | 545 |
Class C | 2,205 | 1,547 |
International Growth | 516,958 | 247,117 |
Institutional Class | 6,406 | 2,184 |
Total | $ 594,738 | $ 276,358 |
Annual Report
9. Distributions to Shareholders - continued
Years ended October 31, | 2012 | 2011 |
From net realized gain | | |
Class A | $ 4,810 | $ 4,255 |
Class T | 2,196 | 1,455 |
Class B | - | 211 |
Class C | 1,890 | 826 |
International Growth | 39,262 | 41,245 |
Institutional Class | 487 | 349 |
Total | $ 48,645 | $ 48,341 |
10. Share Transactions.
Transactions for each class of shares were as follows:
| Shares | Dollars |
Years ended October 31, | 2012 | 2011 | 2012 | 2011 |
Class A | | | | |
Shares sold | 1,901,699 | 547,911 | $ 16,560,116 | $ 4,762,829 |
Reinvestment of distributions | 5,422 | 2,679 | 42,831 | 22,867 |
Shares redeemed | (236,851) | (133,581) | (2,015,265) | (1,142,023) |
Net increase (decrease) | 1,670,270 | 417,009 | $ 14,587,682 | $ 3,643,673 |
Class T | | | | |
Shares sold | 941,446 | 292,221 | $ 8,178,600 | $ 2,542,402 |
Reinvestment of distributions | 2,626 | 762 | 20,742 | 6,516 |
Shares redeemed | (102,766) | (55,432) | (866,637) | (470,382) |
Net increase (decrease) | 841,306 | 237,551 | $ 7,332,705 | $ 2,078,536 |
Class B | | | | |
Shares sold | 92,865 | 22,762 | $ 806,549 | $ 193,446 |
Reinvestment of distributions | - | 78 | - | 670 |
Shares redeemed | (25,954) | (33,639) | (218,180) | (282,311) |
Net increase (decrease) | 66,911 | (10,799) | $ 588,369 | $ (88,195) |
Class C | | | | |
Shares sold | 400,291 | 258,483 | $ 3,375,948 | $ 2,202,762 |
Reinvestment of distributions | 510 | 274 | 4,026 | 2,357 |
Shares redeemed | (106,475) | (65,559) | (879,489) | (555,739) |
Net increase (decrease) | 294,326 | 193,198 | $ 2,500,485 | $ 1,649,380 |
International Growth | | | | |
Shares sold | 13,301,892 | 5,799,026 | $ 114,028,412 | $ 50,047,832 |
Reinvestment of distributions | 68,821 | 33,184 | 544,378 | 283,553 |
Shares redeemed | (3,238,606) | (2,639,092) | (27,713,258) | (22,190,157) |
Net increase (decrease) | 10,132,107 | 3,193,118 | $ 86,859,532 | $ 28,141,228 |
Annual Report
Notes to Financial Statements - continued
10. Share Transactions - continued
| Shares | Dollars |
Years ended October 31, | 2012 | 2011 | 2012 | 2011 |
Institutional Class | | | | |
Shares sold | 438,656 | 76,126 | $ 3,841,370 | $ 670,433 |
Reinvestment of distributions | 655 | 292 | 5,178 | 2,491 |
Shares redeemed | (53,696) | (29,187) | (443,499) | (256,318) |
Net increase (decrease) | 385,615 | 47,231 | $ 3,403,049 | $ 416,606 |
11. Other.
The Fund's organizational documents provide former and current trustees and officers with a limited indemnification against liabilities arising in connection with the performance of their duties to the Fund. In the normal course of business, the Fund may also enter into contracts that provide general indemnifications. The Fund's maximum exposure under these arrangements is unknown as this would be dependent on future claims that may be made against the Fund. The risk of material loss from such claims is considered remote.
At the end of the period, Fidelity VIP FundsManager 60% Portfolio was the owner of record of approximately 10% of the total outstanding shares of the Fund.
Annual Report
To the Trustees of Fidelity Investment Trust and the Shareholders of Fidelity International Growth Fund:
In our opinion, the accompanying statement of assets and liabilities, including the schedule of investments, and the related statements of operations and of changes in net assets and the financial highlights present fairly, in all material respects, the financial position of Fidelity International Growth Fund (a fund of Fidelity Investment Trust) at October 31, 2012, the results of its operations for the year then ended, the changes in its net assets for each of the two years in the period then ended and the financial highlights for each of the periods indicated, in conformity with accounting principles generally accepted in the United States of America. These financial statements and financial highlights (hereafter referred to as "financial statements") are the responsibility of the Fidelity International Growth Fund's management. Our responsibility is to express an opinion on these financial statements based on our audits. We conducted our audits of these financial statements in accordance with the standards of the Public Company Accounting Oversight Board (United States). Those standards require that we plan and perform the audit to obtain reasonable assurance about whether the financial statements are free of material misstatement. An audit includes examining, on a test basis, evidence supporting the amounts and disclosures in the financial statements, assessing the accounting principles used and significant estimates made by management, and evaluating the overall financial statement presentation. We believe that our audits, which included confirmation of securities at October 31, 2012 by correspondence with the custodian and brokers, provide a reasonable basis for our opinion.
PricewaterhouseCoopers LLP
Boston, Massachusetts
December 14, 2012
Annual Report
The Trustees, Members of the Advisory Board, and executive officers of the trust and fund, as applicable, are listed below. The Board of Trustees governs the fund and is responsible for protecting the interests of shareholders. The Trustees are experienced executives who meet periodically throughout the year to oversee the fund's activities, review contractual arrangements with companies that provide services to the fund, oversee management of the risks associated with such activities and contractual arrangements, and review the fund's performance. Except for James C. Curvey, each of the Trustees oversees 236 funds advised by FMR or an affiliate. Mr. Curvey oversees 443 funds advised by FMR or an affiliate.
The Trustees hold office without limit in time except that (a) any Trustee may resign; (b) any Trustee may be removed by written instrument, signed by at least two-thirds of the number of Trustees prior to such removal; (c) any Trustee who requests to be retired or who has become incapacitated by illness or injury may be retired by written instrument signed by a majority of the other Trustees; and (d) any Trustee may be removed at any special meeting of shareholders by a two-thirds vote of the outstanding voting securities of the trust. Each Trustee who is not an interested person (as defined in the 1940 Act) (Independent Trustee), shall retire not later than the last day of the calendar year in which his or her 75th birthday occurs. The Independent Trustees may waive this mandatory retirement age policy with respect to individual Trustees. The executive officers and Advisory Board Members hold office without limit in time, except that any officer and Advisory Board Member may resign or may be removed by a vote of a majority of the Trustees at any regular meeting or any special meeting of the Trustees. Except as indicated, each individual has held the office shown or other offices in the same company for the past five years.
Experience, Skills, Attributes, and Qualifications of the Fund's Trustees. The Governance and Nominating Committee has adopted a statement of policy that describes the experience, qualifications, attributes, and skills that are necessary and desirable for potential Independent Trustee candidates (Statement of Policy). The Board believes that each Trustee satisfied at the time he or she was initially elected or appointed a Trustee, and continues to satisfy, the standards contemplated by the Statement of Policy. The Governance and Nominating Committee also engages professional search firms to help identify potential Independent Trustee candidates who have the experience, qualifications, attributes, and skills consistent with the Statement of Policy. From time to time, additional criteria based on the composition and skills of the current Independent Trustees, as well as experience or skills that may be appropriate in light of future changes to board composition, business conditions, and regulatory or other developments, have also been considered by the professional search firms and the Governance and Nominating Committee. In addition, the Board takes into account the Trustees' commitment and participation in Board and committee meetings, as well as their leadership of standing and ad hoc committees throughout their tenure.
In determining that a particular Trustee was and continues to be qualified to serve as a Trustee, the Board has considered a variety of criteria, none of which, in isolation, was controlling. The Board believes that, collectively, the Trustees have balanced and diverse experience, qualifications, attributes, and skills, which allow the Board to operate effectively in governing the fund and protecting the interests of shareholders. Information about the specific experience, skills, attributes, and qualifications of each Trustee, which in each case led to the Board's conclusion that the Trustee should serve (or continue to serve) as a trustee of the fund, is provided below.
Annual Report
Trustees and Officers - continued
Board Structure and Oversight Function. James C. Curvey is an interested person (as defined in the 1940 Act) and currently serves as Chairman. The Trustees have determined that an interested Chairman is appropriate and benefits shareholders because an interested Chairman has a personal and professional stake in the quality and continuity of services provided to the fund. Independent Trustees exercise their informed business judgment to appoint an individual of their choosing to serve as Chairman, regardless of whether the Trustee happens to be independent or a member of management. The Independent Trustees have determined that they can act independently and effectively without having an Independent Trustee serve as Chairman and that a key structural component for assuring that they are in a position to do so is for the Independent Trustees to constitute a substantial majority for the Board. The Independent Trustees also regularly meet in executive session. Ned C. Lautenbach serves as Chairman of the Independent Trustees and as such (i) acts as a liaison between the Independent Trustees and management with respect to matters important to the Independent Trustees and (ii) with management prepares agendas for Board meetings.
Fidelity funds are overseen by different Boards of Trustees. The fund's Board oversees Fidelity's equity and high income funds and another Board oversees Fidelity's investment-grade bond, money market, and asset allocation funds. The asset allocation funds may invest in Fidelity funds overseen by the fund's Board. The use of separate Boards, each with its own committee structure, allows the Trustees of each group of Fidelity funds to focus on the unique issues of the funds they oversee, including common research, investment, and operational issues. On occasion, the separate Boards establish joint committees to address issues of overlapping consequences for the Fidelity funds overseen by each Board.
The Trustees operate using a system of committees to facilitate the timely and efficient consideration of all matters of importance to the Trustees, the fund, and fund shareholders and to facilitate compliance with legal and regulatory requirements and oversight of the fund's activities and associated risks. The Board, acting through its committees, has charged FMR and its affiliates with (i) identifying events or circumstances the occurrence of which could have demonstrably adverse effects on the fund's business and/or reputation; (ii) implementing processes and controls to lessen the possibility that such events or circumstances occur or to mitigate the effects of such events or circumstances if they do occur; and (iii) creating and maintaining a system designed to evaluate continuously business and market conditions in order to facilitate the identification and implementation processes described in (i) and (ii) above. Because the day-to-day operations and activities of the fund are carried out by or through FMR, its affiliates and other service providers, the fund's exposure to risks is mitigated but not eliminated by the processes overseen by the Trustees. While each of the Board's committees has responsibility for overseeing different aspects of the fund's activities, oversight is exercised primarily through the Operations, Audit, and Compliance Committees. In addition, the Independent Trustees have worked with FMR to enhance the Board's oversight of investment and financial risks, legal and regulatory risks, technology risks, and operational risks, including the development of additional risk reporting to the Board. For example, a working group comprised of Independent Trustees and FMR has worked and continues to work to review the Fidelity funds' valuation-related activities, reporting and risk management. Appropriate personnel, including but not limited to the fund's Chief Compliance Officer (CCO), FMR's internal auditor, the independent accountants, the fund's Treasurer and portfolio management personnel, make periodic reports to the Board's committees, as appropriate, including an annual review of FMR's risk management program for the Fidelity funds. The responsibilities of each standing committee, including their oversight responsibilities, are described further under "Standing Committees of the Fund's Trustees."
Annual Report
The fund's Statement of Additional Information (SAI) includes more information about the Trustees. To request a free copy, call Fidelity at 1-800-544-8544.
Interested Trustees*:
Correspondence intended for each Trustee who is an interested person may be sent to Fidelity Investments, 82 Devonshire Street, Boston, Massachusetts 02109.
Name, Age; Principal Occupations and Other Relevant Experience+ |
James C. Curvey (77) |
| Year of Election or Appointment: 2007 Mr. Curvey is Trustee and Chairman of the Board of Trustees of certain Trusts. Mr. Curvey also serves as Trustee (2007-present) of other investment companies advised by FMR. Mr. Curvey is a Director of Fidelity Investments Money Management, Inc. (2009-present), Director of Fidelity Research & Analysis Co. (2009-present) and Director of FMR and FMR Co., Inc. (2007-present). Mr. Curvey is also Vice Chairman (2007-present) and Director of FMR LLC. In addition, Mr. Curvey serves as an Overseer for the Boston Symphony Orchestra and a member of the Trustees of Villanova University. Previously, Mr. Curvey was the Vice Chairman (2006-2007) and Director (2000-2007) of FMR Corp. |
Ronald P. O'Hanley (55) |
| Year of Election or Appointment: 2011 Mr. O'Hanley is Director of FMR Co., Inc. (2010-present), Director of Fidelity Investments Money Management, Inc. (2010-present), Director of Fidelity Research & Analysis Company (2010-present), President of Fidelity Asset Management and Corporate Services and a member of Fidelity's Executive Committee (2010-present). Previously, Mr. O'Hanley served as President and Chief Executive Officer of BNY Mellon Asset Management (2007-2010). Mr. O'Hanley also served as Vice Chairman of Bank New York Mellon Corp. and a member of that firm's Executive Committee. Prior to the 2007 merger of The Bank of New York and Mellon Financial Corporation, he was Vice Chairman of Mellon Financial Corporation and President and Chief Executive Officer of Mellon Asset Management. He joined Mellon in February 1997. Mr. O'Hanley currently serves as Chairman of the Boston Public Library Foundation Board of Directors and sits on the Board of Directors of Beth Israel Deaconess Medical Center, the Board of Trustees of the Marine Biological Laboratory and the Advisory Board of the Maxwell School of Citizenship and Public Administration at Syracuse University. Mr. O'Hanley also chairs the Council on Asset Management for the Financial Services Roundtable and is a member of the Board of Directors of Institutional Investor's U.S. Institute. |
* Trustees have been determined to be "Interested Trustees" by virtue of, among other things, their affiliation with the trust or various entities under common control with FMR.
+ The information above includes each Trustee's principal occupation during the last five years and other information relating to the experience, attributes, and skills relevant to each Trustee's qualifications to serve as a Trustee, which led to the conclusion that each Trustee should serve as a Trustee for the fund.
Annual Report
Independent Trustees:
Correspondence intended for each Independent Trustee (that is, the Trustees other than the Interested Trustees) may be sent to Fidelity Investments, P.O. Box 55235, Boston, Massachusetts 02205-5235.
Name, Age; Principal Occupations and Other Relevant Experience+ |
Dennis J. Dirks (64) |
| Year of Election or Appointment: 2005 Prior to his retirement in May 2003, Mr. Dirks was Chief Operating Officer and a member of the Board of The Depository Trust & Clearing Corporation (DTCC). He also served as President, Chief Operating Officer, and Board member of The Depository Trust Company (DTC) and President and Board member of the National Securities Clearing Corporation (NSCC). In addition, Mr. Dirks served as Chief Executive Officer and Board member of the Government Securities Clearing Corporation, Chief Executive Officer and Board member of the Mortgage-Backed Securities Clearing Corporation, as a Trustee and a member of the Finance Committee of Manhattan College (2005-2008), and as a Trustee and a member of the Finance Committee of AHRC of Nassau County (2006-2008). Mr. Dirks is a member of the Independent Directors Council (IDC) Governing Council (2010-present) and Board of Directors for The Brookville Center for Children's Services, Inc. (2009-present). |
Alan J. Lacy (59) |
| Year of Election or Appointment: 2008 Mr. Lacy serves as Senior Adviser (2007-present) of Oak Hill Capital Partners, L.P. (private equity). Mr. Lacy also served as Chief Executive Officer (2000-2005) and Vice Chairman (2005-2006) of Sears Holdings Corporation and Sears, Roebuck and Co. (retail). In addition, Mr. Lacy serves as a member of the Board of Directors of Dave & Buster's Entertainment, Inc. (restaurant and entertainment complexes, 2010-present), Earth Fare, Inc. (retail grocery, 2012-present), The Hillman Companies, Inc. (hardware wholesalers, 2010-present), and Bristol-Myers Squibb Company (global pharmaceuticals, 2008-present). Mr. Lacy is a member of the Board of Trustees of The National Parks Conservation Association (2006-present). Previously, Mr. Lacy served as Chairman of the Board of Trustees of the National Parks Conservation Association (2008-2011) and as a member of the Board of Directors for the Western Union Company (global money transfer, 2006-2011). |
Ned C. Lautenbach (68) |
| Year of Election or Appointment: 2000 Mr. Lautenbach is Chairman of the Independent Trustees of the Equity and High Income Funds (2006-present). Mr. Lautenbach currently serves as the Lead Director of the Eaton Corporation Board of Directors (diversified industrial, 1997-present). Mr. Lautenbach is Chairman of the Board of Directors of the Philharmonic Center for the Arts in Naples, Florida (2012-present) and a member of the Council on Foreign Relations (1994-present). Previously, Mr. Lautenbach was a Partner/Advisory Partner at Clayton, Dubilier & Rice, LLC (private equity investment, 1998-2010), as well as a Director of Sony Corporation (2006-2007). |
Joseph Mauriello (68) |
| Year of Election or Appointment: 2008 Prior to his retirement in January 2006, Mr. Mauriello served in numerous senior management positions including Deputy Chairman and Chief Operating Officer (2004-2005), and Vice Chairman of Financial Services (2002-2004) of KPMG LLP US (professional services, 1965-2005). Mr. Mauriello currently serves as a member of the Board of Directors of XL Group plc. (global insurance and re-insurance, 2006-present). Previously, Mr. Mauriello served as a Director of the Hamilton Funds of the Bank of New York (2006-2007) and of Arcadia Resources Inc. (health care services and products, 2007-2012). |
Robert W. Selander (62) |
| Year of Election or Appointment: 2011 Previously, Mr. Selander served as a Member of the Advisory Board of Fidelity's Equity and High Income Funds (2011), Executive Vice Chairman (2010), Chief Executive Officer (2009-2010), and President and Chief Executive Officer (1997-2009) of Mastercard, Inc. |
Cornelia M. Small (68) |
| Year of Election or Appointment: 2005 Ms. Small is a member of the Board of Directors (2009-present) and Chair of the Investment Committee (2010-present) of the Teagle Foundation. Ms. Small also serves on the Investment Committee of the Berkshire Taconic Community Foundation (2008-present). Previously, Ms. Small served as Chairperson (2002-2008) and a member of the Investment Committee and Chairperson (2008-2012) and a member of the Board of Trustees of Smith College. In addition, Ms. Small served as Chief Investment Officer, Director of Global Equity Investments, and a member of the Board of Directors of Scudder, Stevens & Clark and Scudder Kemper Investments. |
William S. Stavropoulos (73) |
| Year of Election or Appointment: 2001 Mr. Stavropoulos is Vice Chairman of the Independent Trustees of the Equity and High Income Funds (2006-present). Mr. Stavropoulos serves as President and Founder of the Michigan Baseball Foundation, the Great Lakes Loons (2007-present). Mr. Stavropoulos is Chairman Emeritus of the Board of Directors of The Dow Chemical Company, where he previously served in numerous senior management positions, including President, CEO (1995-2000; 2002-2004), Chairman of the Executive Committee (2000-2006), and as a member of the Board of Directors (1990-2006). Currently, Mr. Stavropoulos is a Director of Univar Inc. (global distributor of commodity and specialty chemicals, Chairman from 2010-May 2012 and Lead Director from May 2012-present), Teradata Corporation (data warehousing and technology solutions, 2008-present), Maersk Inc. (industrial conglomerate), and Tyco International, Ltd. (multinational manufacturing and services, 2007-present), and a member of the Advisory Board for Metalmark Capital LLC (private equity investment, 2005-present). Mr. Stavropoulos is an operating advisor to Clayton, Dubilier & Rice, LLC (private equity investment). In addition, Mr. Stavropoulos is a member of the University of Notre Dame Advisory Council for the College of Science, a Trustee of the Rollin L. Gerstacker Foundation, and a Director of the Naples Philharmonic Center for the Arts. Previously, Mr. Stavropoulos served as a Director of Chemical Financial Corporation (bank holding company, 1993-2012). |
David M. Thomas (63) |
| Year of Election or Appointment: 2008 Previously, Mr. Thomas served as Executive Chairman (2005-2006) and Chairman and Chief Executive Officer (2000-2005) of IMS Health, Inc. (pharmaceutical and healthcare information solutions), and a Director of Fortune Brands, Inc. (consumer products, 2000-2011). In addition, Mr. Thomas serves as Non-Executive Chairman of the Board of Directors of Fortune Brands Home and Security (home and security products, 2011-present), and as a member of the Board of Directors of Interpublic Group of Companies, Inc. (marketing communication, 2004-present). |
Michael E. Wiley (62) |
| Year of Election or Appointment: 2008 Mr. Wiley also serves as a Director of Asia Pacific Exploration Consolidated (international oil and gas exploration and production, 2008-present). Mr. Wiley serves as a Director of Tesoro Corporation (independent oil refiner and marketer, 2005-present), and a Director of Bill Barrett Corporation (exploration and production, 2005-present). In addition, Mr. Wiley also serves as a Director of Post Oak Bank (privately-held bank, 2004-present). Previously, Mr. Wiley served as a member of the Board of Trustees of the University of Tulsa (2000-2006; 2007-2010), as a Senior Energy Advisor of Katzenbach Partners, LLC (consulting, 2006-2007), as an Advisory Director of Riverstone Holdings (private investment), Chairman, President, and CEO of Baker Hughes, Inc. (oilfield services, 2000-2004), and as Director of Spinnaker Exploration Company (exploration and production, 2001-2005). |
+ The information above includes each Trustee's principal occupation during the last five years and other information relating to the experience, attributes, and skills relevant to each Trustee's qualifications to serve as a Trustee, which led to the conclusion that each Trustee should serve as a Trustee for the fund.
Advisory Board Members and Executive Officers:
Correspondence intended for David A. Rosow and Garnett A. Smith may be sent to Fidelity Investments, P.O. Box 55235, Boston, Massachusetts 02205-5235. Correspondence intended for each executive officer, Edward C. Johnson 3d, and Peter S. Lynch may be sent to Fidelity Investments, 82 Devonshire Street, Boston, Massachusetts 02109.
Name, Age; Principal Occupation |
Edward C. Johnson 3d (82) |
| Year of Election or Appointment: 2011 Member of the Advisory Board of Fidelity's Equity and High Income Funds. Mr. Johnson serves as Chief Executive Officer, Chairman, and a Director of FMR LLC, and also serves as Chairman and Director of FIL Limited. Previously, Mr. Johnson served as a Trustee and Chairman of the Board of certain Fidelity Trusts, Chairman and a Director of FMR, Chairman and a Director of FMR Co., Inc., and President of FMR LLC (2006-2007). |
Peter S. Lynch (68) |
| Year of Election or Appointment: 2003 Member of the Advisory Board of Fidelity's Equity and High Income Funds. Mr. Lynch is Vice Chairman and a Director of FMR and FMR Co., Inc. In addition, Mr. Lynch serves as a Trustee of Boston College and as the Chairman of the Inner-City Scholarship Fund. Previously, Mr. Lynch served on the Special Olympics International Board of Directors (1997-2006). |
David A. Rosow (70) |
| Year of Election or Appointment: 2012 Member of the Advisory Board of Fidelity's Equity and High Income Funds. Chairman and Chief Executive Officer of International Golf Group, Inc. (golf course development, 1989-present). Previously, Mr. Rosow served as Chairman and Chief Executive Officer of Rosow & Company, Inc. (private investment company, 1989-2011), a Lead Director of Hudson United Bancorp (2001-2006) and as a Director of TD Banknorth (1996-2006). In addition, Mr. Rosow is a member (2008-present) and President (2009-present) of the Town Council of Palm Beach, Florida. |
Garnett A. Smith (65) |
| Year of Election or Appointment: 2012 Member of the Advisory Board of Fidelity's Equity and High Income Funds. Prior to Mr. Smith's retirement, he served as Chairman and Chief Executive Officer of Inbrand Corp. (manufacturer of personal absorbent products, 1990-1997). He also served as President (1986-1990) of Inbrand Corp. Prior to his employment with Inbrand Corp., he was employed by a retail fabric chain and North Carolina National Bank. In addition, Mr. Smith is a board member of the Jackson Hole Land Trust (2009-present). |
Kenneth B. Robins (43) |
| Year of Election or Appointment: 2008 President and Treasurer of Fidelity's Equity and High Income Funds. Mr. Robins also serves as President and Treasurer (2010-present) and Assistant Treasurer (2009-present) of other Fidelity funds and is an employee of Fidelity Investments (2004-present). Previously, Mr. Robins served as Deputy Treasurer of the Fidelity funds (2005-2008) and Treasurer and Chief Financial Officer of The North Carolina Capital Management Trust: Cash and Term Portfolios (2006-2008). |
Bruce T. Herring (47) |
| Year of Election or Appointment: 2006 Vice President of certain Equity Funds. Mr. Herring also serves as President of Fidelity Research & Analysis Company (2010-present), Chief Investment Officer and Director of Fidelity Management & Research (U.K.) Inc. (2010-present) and Group Chief Investment Officer of FMR. Previously, Mr. Herring served as Vice President (2005-2006) and Senior Vice President (2006-2007) of Fidelity Management & Research Company, Vice President of FMR Co., Inc. (2001-2007) and as a portfolio manager for Fidelity U.S. Equity Funds. |
Brian B. Hogan (48) |
| Year of Election or Appointment: 2009 Vice President of Equity and High Income Funds. Mr. Hogan also serves as President of FMR's Equity Division (2009-present). Previously, Mr. Hogan served as Senior Vice President, Equity Research of FMR (2006-2009) and as a portfolio manager. |
Scott C. Goebel (44) |
| Year of Election or Appointment: 2008 Secretary and Chief Legal Officer (CLO) of the Fidelity funds. Mr. Goebel also serves as Secretary of Fidelity Investments Money Management, Inc. (FIMM) (2010-present) and Fidelity Research and Analysis Company (FRAC) (2010-present); Secretary and CLO of The North Carolina Capital Management Trust: Cash and Term Portfolios (2008-present); General Counsel, Secretary, and Senior Vice President of FMR (2008-present) and FMR Co., Inc. (2008-present); employed by FMR LLC or an affiliate (2001-present); Chief Legal Officer of Fidelity Management & Research (Hong Kong) Limited (2008-present) and Assistant Secretary of Fidelity Management & Research (Japan) Inc. (2008-present), and Fidelity Management & Research (U.K.) Inc. (2008-present). Previously, Mr. Goebel served as Assistant Secretary of FIMM (2008-2010), FRAC (2008-2010), and the Funds (2007-2008) and as Vice President and Secretary of Fidelity Distributors Corporation (FDC) (2005-2007). |
William C. Coffey (43) |
| Year of Election or Appointment: 2009 Assistant Secretary of Fidelity's Equity and High Income Funds. Mr. Coffey also serves as Senior Vice President and Deputy General Counsel of FMR LLC (2010-present), and is an employee of Fidelity Investments. Previously, Mr. Coffey served as Vice President and Associate General Counsel of FMR LLC (2005-2009). |
Elizabeth Paige Baumann (44) |
| Year of Election or Appointment: 2012 Anti-Money Laundering (AML) Officer of the Fidelity funds. Ms. Baumann also serves as AML Officer of The North Carolina Capital Management Trust: Cash and Term Portfolios (2012-present), Chief AML Officer of FMR LLC (2012-present), and is an employee of Fidelity Investments. Previously, Ms. Baumann served as Vice President and Deputy Anti-Money Laundering Officer (2007-2012). |
Christine Reynolds (54) |
| Year of Election or Appointment: 2008 Chief Financial Officer of the Fidelity funds. Ms. Reynolds became President of Fidelity Pricing and Cash Management Services (FPCMS) in August 2008. Ms. Reynolds served as Chief Operating Officer of FPCMS (2007-2008). Previously, Ms. Reynolds served as President, Treasurer, and Anti-Money Laundering officer of the Fidelity funds (2004-2007). |
Joseph A. Hanlon (44) |
| Year of Election or Appointment: 2012 Chief Compliance Officer of Fidelity's Equity and High Income Funds. Mr. Hanlon serves as Compliance Officer of FMR, FMR Co., Inc., Fidelity Investments Money Management, Inc. (FIMM), Fidelity Research and Analysis Company (FRAC), Fidelity Management & Research (Japan) Inc., Fidelity Management & Research (U.K.) Inc., Fidelity Management & Research (Hong Kong), and Strategic Advisers, Inc. (2009-present), as Senior Vice President of the Fidelity Asset Management Division (2009-present), and is an employee of Fidelity Investments. |
Joseph F. Zambello (55) |
| Year of Election or Appointment: 2011 Deputy Treasurer of the Fidelity funds. Mr. Zambello is an employee of Fidelity Investments. Previously, Mr. Zambello served as Vice President of FMR's Program Management Group (2009-2011) and Vice President of the Transfer Agent Oversight Group (2005-2009). |
Adrien E. Deberghes (45) |
| Year of Election or Appointment: 2008 Deputy Treasurer of Fidelity's Equity and High Income Funds. Mr. Deberghes also serves as Vice President (2011-present) and Assistant Treasurer (2010-present) of other Fidelity funds, and is an employee of Fidelity Investments (2008-present). Previously, Mr. Deberghes served as Senior Vice President of Mutual Fund Administration at State Street Corporation (2007-2008), Senior Director of Mutual Fund Administration at Investors Bank & Trust (2005-2007), and Director of Finance for Dunkin' Brands (2000-2005). |
Stephen Sadoski (41) |
| Year of Election or Appointment: 2012 Deputy Treasurer of Fidelity's Equity and High Income Funds. Mr. Sadoski also serves as Assistant Treasurer of other Fidelity funds (2012-present) and is an employee of Fidelity Investments (2012-present). Previously, Mr. Sadoski served as an assistant chief accountant in the Division of Investment Management of the Securities and Exchange Commission (SEC) (2009-2012) and as a senior manager at Deloitte & Touche (1997-2009). |
Stephanie J. Dorsey (43) |
| Year of Election or Appointment: 2010 Assistant Treasurer of Fidelity's Equity and High Income Funds. Ms. Dorsey also serves as Deputy Treasurer of other Fidelity funds (2008-present) and is an employee of Fidelity Investments (2008-present). Previously, Ms. Dorsey served as Treasurer (2004-2008) of the JPMorgan Mutual Funds and Vice President (2004-2008) of JPMorgan Chase Bank. |
John R. Hebble (54) |
| Year of Election or Appointment: 2009 Assistant Treasurer of Fidelity's Equity and High Income Funds. Mr. Hebble also serves as President (2011-present), Treasurer, and Chief Financial Officer of The North Carolina Capital Management Trust: Cash and Term Portfolios (2008-present), President and Treasurer of other Fidelity funds (2008-present) and is an employee of Fidelity Investments. |
Gary W. Ryan (54) |
| Year of Election or Appointment: 2005 Assistant Treasurer of the Fidelity funds. Mr. Ryan is an employee of Fidelity Investments. Previously, Mr. Ryan served as Vice President of Fund Reporting in Fidelity Pricing and Cash Management Services (FPCMS) (1999-2005). |
Jonathan Davis (44) |
| Year of Election or Appointment: 2010 Assistant Treasurer of the Fidelity funds. Mr. Davis is also Assistant Treasurer of Fidelity Rutland Square Trust II and Fidelity Commonwealth Trust II. Mr. Davis is an employee of Fidelity Investments. Previously, Mr. Davis served as Vice President and Associate General Counsel of FMR LLC (2003-2010). |
Annual Report
The Board of Trustees of Fidelity International Growth Fund voted to pay on December 10, 2012, to shareholders of record at the opening of business on December 7, 2012, a distribution of $0.005 per share derived from capital gains realized from sales of portfolio securities and a dividend of $0.097 per share from net investment income.
The fund designates 10% of the dividends distributed during the fiscal year as qualifying for the dividends-received deduction for corporate shareholders.
The fund designates 100% of the dividends distributed in December 2011 during the fiscal year as amounts which may be taken into account as a dividend for the purposes of the maximum rate under section 1(h)(11) of the Internal Revenue Code.
The amounts per share which represent income derived from sources within, and taxes paid to, foreign countries or possessions of the United States are as follows:
| Pay Date | Income | Taxes |
International Growth Fund | 12/05/2011 | $0.080 | $0.0072 |
The fund will notify shareholders in January 2013 of amounts for use in preparing 2012 income tax returns.
Annual Report
Board Approval of Investment Advisory Contracts and Management Fees
Fidelity International Growth Fund
Each year, the Board of Trustees, including the Independent Trustees (together, the Board), votes on the renewal of the management contract and sub-advisory agreements (together, the Advisory Contracts) for the fund. The Board, assisted by the advice of fund counsel and Independent Trustees' counsel, requests and considers a broad range of information relevant to the renewal of the Advisory Contracts throughout the year.
The Board meets regularly and, at each of its meetings, considers factors that are relevant to its annual consideration of the renewal of the fund's Advisory Contracts, including the services and support provided to the fund and its shareholders. The Board has established various standing committees, each composed of and chaired by Independent Trustees with varying backgrounds, to which the Board has assigned specific subject matter responsibilities in order to enhance effective decision-making by the Board. The Board, acting directly and through its Committees, requests and receives information concerning the annual consideration of the renewal of the fund's Advisory Contracts. The Board also meets as needed to consider matters specifically related to the Board's annual consideration of the renewal of Advisory Contracts. Members of the Board may also meet with trustees of other Fidelity funds through ad hoc joint committees to discuss certain matters relevant to the Fidelity funds.
At its July 2012 meeting, the Board of Trustees, including the Independent Trustees, unanimously determined to renew the fund's Advisory Contracts. In reaching its determination, the Board considered all factors it believed relevant, including (i) the nature, extent, and quality of the services to be provided to the fund and its shareholders (including the investment performance of the fund); (ii) the competitiveness of the fund's management fee and total expense ratio relative to peer funds; (iii) the total costs of the services to be provided by and the profits to be realized by Fidelity from its relationship with the fund; (iv) the extent to which economies of scale exist and would be realized as the fund grows; and (v) whether fee levels reflect these economies of scale, if any, for the benefit of fund shareholders.
In considering whether to renew the Advisory Contracts for the fund, the Board reached a determination, with the assistance of fund counsel and Independent Trustees' counsel and through the exercise of its business judgment, that the renewal of the Advisory Contracts is in the best interests of the fund and its shareholders and that the compensation payable under the Advisory Contracts is fair and reasonable. The Board's decision to renew the Advisory Contracts was not based on any single factor, but rather was based on a comprehensive consideration of all the information provided to the Board at its meetings throughout the year. The Board, in reaching its determination to renew the Advisory Contracts, is aware that shareholders in the fund have a broad range of investment choices available to them, including a wide choice among mutual funds offered by Fidelity's competitors, and that the fund's shareholders, who have the opportunity to review and weigh the disclosure provided by the fund in its prospectus and other public disclosures, have chosen to invest in this fund, managed by Fidelity.
Annual Report
Nature, Extent, and Quality of Services Provided. The Board considered the staffing within the investment adviser, FMR, and the sub-advisers (together, the Investment Advisers), including the backgrounds of the fund's investment personnel, and also considered the fund's investment objective, strategies, and related investment philosophy. The Independent Trustees also had discussions with senior management of Fidelity's investment operations and investment groups. The Board considered the structure of the portfolio manager compensation program and whether this structure provides appropriate incentives to act in the best interests of the fund.
Resources Dedicated to Investment Management and Support Services. The Board and the Fund Oversight and Research Committees reviewed the general qualifications and capabilities of the Investment Advisers' investment staff, including its size, education, experience, and resources, as well as the Investment Advisers' approach to recruiting, training, managing, and compensating investment personnel. The Board also noted that FMR has continued to increase the resources devoted to non-U.S. offices, including expansion of Fidelity's global investment organization. The Board noted that Fidelity's analysts have extensive resources, tools and capabilities that allow them to conduct sophisticated quantitative and fundamental analysis, as well as credit analysis of issuers, counterparties and guarantors. The Board also believes that Fidelity's investment professionals have sufficient access to global information and data so as to provide competitive investment results over time, and that those professionals also have access to sophisticated tools that permit them to assess portfolio construction and risk and performance attribution characteristics continuously, as well as to transmit new information and research conclusions rapidly around the world. Additionally, in its deliberations, the Board considered the Investment Advisers' trading and risk management capabilities and resources, which are an integral part of the investment management process.
Shareholder and Administrative Services. The Board considered (i) the nature, extent, quality, and cost of advisory, administrative, and shareholder services performed by the Investment Advisers and their affiliates under the Advisory Contracts and under separate agreements covering transfer agency, pricing and bookkeeping, and securities lending services for the fund; (ii) the nature and extent of the supervision of third party service providers, principally custodians and subcustodians; and (iii) the resources devoted to, and the record of compliance with, the fund's compliance policies and procedures. The Board also reviewed the allocation of fund brokerage, including allocations to brokers affiliated with the Investment Advisers, the use of brokerage commissions to pay fund expenses, and the use of "soft" commission dollars to pay for research services.
Annual Report
Board Approval of Investment Advisory Contracts and
Management Fees - continued
The Board noted that the growth of fund assets over time across the complex allows Fidelity to reinvest in the development of services designed to enhance the value or convenience of the Fidelity funds as investment vehicles. These services include 24-hour access to account information and market information through telephone representatives and over the Internet, investor education materials and asset allocation tools, and the expanded availability of Fidelity Investor Centers.
Investment in a Large Fund Family. The Board considered the benefits to shareholders of investing in a Fidelity fund, including the benefits of investing in a fund that is part of a large family of funds offering a variety of investment disciplines and providing a large variety of mutual fund investor services. The Board noted that Fidelity had taken, or had made recommendations that resulted in the Fidelity funds taking, a number of actions over the previous year that benefited particular funds, including (i) continuing to dedicate additional resources to investment research and support of the senior management team that oversees asset management; (ii) persisting in efforts to enhance Fidelity's research capabilities, in particular, international research; (iii) launching new funds and making other enhancements to meet client needs for global and income-oriented solutions; (iv) continuing to launch dedicated lower cost underlying funds to meet investment management's portfolio construction needs related to expanding underlying fund options, specifically for the Freedom Fund product lines; (v) adopting a "Stock Selector" sector neutral investment approach and employing a team of portfolio managers who are sector specialists to manage certain funds; (vi) rationalizing product lines and gaining increased efficiencies through the mergers of several funds into other funds; (vii) strengthening the Spartan Index Fund product line by adding new funds and/or new low-cost institutional share classes, restructuring fund expenses to accommodate new classes, and reducing investment minimums for certain classes of shares; (viii) modifying the eligibility criteria for Institutional Class shares to increase their appeal to government entities and charitable investors; and (ix) reducing certain transfer agent fee rates.
Investment Performance. The Board considered whether the fund has operated in accordance with its investment objective, as well as its record of compliance with its investment restrictions. It also reviewed the fund's absolute investment performance for each class, as well as the fund's relative investment performance for each class measured over multiple periods against (i) a broad-based securities market index, and (ii) a custom peer group of mutual funds deemed appropriate by Fidelity and reviewed by the Board. Because the fund had been in existence less than five calendar years, the following charts considered by the Board show, over the one- and three-year periods ended December 31, 2011, the cumulative total returns of the retail class and Class C of the fund, the cumulative total returns of a broad-based securities market index ("benchmark"), and a range of cumulative total returns of a custom peer group of mutual funds defined by FMR based on categories assigned by Morningstar, Inc. The returns of the retail class and Class C show the performance of the highest and lowest performing classes, respectively (based on three-year performance). The box within each chart shows the 25th percentile return (top of box) and the 75th percentile return (bottom of box) of the peer group. Returns shown above the box are in the first quartile and returns shown below the box are in the fourth quartile. The percentage beaten numbers noted below each chart correspond to the percentile box and represent the percentage of funds in the peer group whose performance was equal to or lower than that of the class indicated. The fund's custom peer group, defined by FMR, is a peer group that FMR believes provides a more meaningful performance comparison than the peer group assigned by Morningstar, Inc., which assigns mutual funds to categories based on their investment styles as measured by their underlying portfolio holdings.
Annual Report
Fidelity International Growth Fund

The Board reviewed the fund's relative investment performance against its peer group and noted that the performance of the retail class of the fund was in the first quartile for the one-year period and the second quartile for the three-year period. The Board also noted that the investment performance of the retail class of the fund compared favorably to its benchmark for all the periods shown. The Board considered that the variations in performance among the fund's classes reflect the variations in class expenses, which result in lower performance for higher expense classes. The Board also reviewed the fund's performance since inception as well as performance in the current year.
The Board also considered that the fund's management fee is subject to upward or downward adjustment depending upon whether, and to what extent, the fund's investment performance for the performance period exceeds, or is exceeded by, the record (over the same period) of a Board-approved performance adjustment index. The Board noted that the performance adjustment provides FMR with a strong economic incentive to seek to achieve superior performance for the fund's shareholders and helps to more closely align the interests of FMR and the fund's shareholders.
Annual Report
Board Approval of Investment Advisory Contracts and
Management Fees - continued
Based on its review, the Board concluded that the nature, extent, and quality of services provided to the fund under the Advisory Contracts should benefit the fund's shareholders.
Competitiveness of Management Fee and Total Expense Ratio. The Board considered the fund's management fee and total expense ratio compared to "mapped groups" of competitive funds and classes. Fidelity creates "mapped groups" by combining similar Lipper investment objective categories that have comparable management fee characteristics. Combining Lipper investment objective categories aids the Board's management fee and total expense ratio comparisons by broadening the competitive group used for comparison and by reducing the number of universes to which various Fidelity funds are compared.
Management Fee. The Board considered two proprietary management fee comparisons for the 12-month (or shorter) periods shown in the chart below. The group of Lipper funds used by the Board for management fee comparisons is referred to below as the "Total Mapped Group." The Total Mapped Group comparison focuses on a fund's standing relative to the total universe of comparable funds available to investors in terms of gross management fees before expense reimbursements or caps, and without giving effect to the fund's performance adjustment. "TMG %" represents the percentage of funds in the Total Mapped Group that had management fees that were lower than the fund's. For example, a TMG % of 17% means that 83% of the funds in the Total Mapped Group had higher management fees than the fund. The "Asset-Size Peer Group" (ASPG) comparison focuses on a fund's standing relative to non-Fidelity funds similar in size to the fund within the Total Mapped Group. The ASPG represents at least 15% of the funds in the Total Mapped Group with comparable asset size and management fee characteristics, subject to a minimum of 50 funds (or all funds in the Total Mapped Group if fewer than 50). Additional information, such as the ASPG quartile in which the fund's management fee ranked and the impact of the fund's performance adjustment, is also included in the chart and considered by the Board.
Annual Report
Fidelity International Growth Fund

The Board noted that the fund's management fee ranked below the median of its Total Mapped Group and below the median of its ASPG for 2011. The Board also noted the effect of the fund's positive performance adjustment on the fund's management fee ranking. The Board noted that the performance adjustment for each year represents calculations for performance periods that differ from the periods shown in the performance charts above.
Based on its review, the Board concluded that the fund's management fee is fair and reasonable in light of the services that the fund receives and the other factors considered.
Total Expense Ratio. In its review of each class's total expense ratio, the Board considered the fund's management fee as well as other fund or class expenses, as applicable, such as transfer agent fees, pricing and bookkeeping fees, fund-paid 12b-1 fees, and custodial, legal, and audit fees. The Board also noted the effects of any waivers and reimbursements on fees and expenses, as well as the impact of the fund's performance adjustment. As part of its review, the Board also considered the current and historical total expense ratios of each class of the fund compared to competitive fund median expenses. Each class of the fund is compared to those funds and classes in the Total Mapped Group (used by the Board for management fee comparisons) that have a similar sales load structure.
The Board noted that the total expense ratio of each of Class A and the retail class ranked below its competitive median for 2011, the total expense ratio of Class B ranked equal to its competitive median for 2011, and the total expense ratio of each of Class T, Class C, and Institutional Class ranked above its competitive median for 2011. The Board considered that various factors, including 12b-1 fees, positive or negative performance adjustments, and relatively higher other expenses in the case of small fund size, can affect total expense ratios. The Board noted that the total expense ratio of Class T was above the competitive median primarily because of higher 12b-1 fees on Class T. Class T has a higher 12b-1 fee, but a lower front-end sales charge, than traditionally priced front-end sales charge classes. The Board considered that Class T is primarily sold load-waived in the retirement plan market where its 0.50% 12b-1 fee is comparable to competing no-load, higher 12b-1 fee classes designed specifically for retirement plans. The Board noted that the fund offers multiple classes, each of which has a different sales load and 12b-1 fee structure, and that the multiple structures are intended to offer a range of pricing options for the intermediary market. The Board also noted that the total expense ratios of the classes vary primarily by the level of their 12b-1 fees, although differences in transfer agent fees may also cause expenses to vary from class to class.
Annual Report
Board Approval of Investment Advisory Contracts and
Management Fees - continued
The Board further considered that FMR contractually agreed to reimburse Class A, Class T, Class B, Class C, Institutional Class, and the retail class of the fund to the extent that total operating expenses (excluding interest, taxes, certain securities lending costs, brokerage commissions, extraordinary expenses, and acquired fund fees and expenses, if any), as a percentage of their respective average net assets, exceed 1.45%, 1.70%, 2.20%, 2.20%, 1.20%, and 1.20% through December 31, 2012.
Fees Charged to Other Fidelity Clients. The Board also considered Fidelity fee structures and other information with respect to clients of FMR and its affiliates, such as other mutual funds advised or subadvised by FMR or its affiliates, pension plan clients, and other institutional clients. The Board noted the findings of the 2010 ad hoc joint committee (created with the board of other Fidelity funds), which reviewed and compared Fidelity's institutional investment advisory business with its business of providing services to the Fidelity funds, including the differences in services provided, fees charged, and costs incurred, as well as competition in their respective marketplaces.
Based on its review of total expense ratios and fees charged to other Fidelity clients, the Board concluded that the total expense ratio of each class of the fund was reasonable, although in some cases above the median of the universe presented for comparison, in light of the services that the fund and its shareholders receive and the other factors considered.
Costs of the Services and Profitability. The Board considered the revenues earned and the expenses incurred by Fidelity in conducting the business of developing, marketing, distributing, managing, administering and servicing the fund and its shareholders. The Board also considered the level of Fidelity's profits in respect of all the Fidelity funds.
Annual Report
On an annual basis, FMR presents to the Board Fidelity's profitability for the fund. Fidelity calculates the profitability for each fund, as well as aggregate profitability for groups of Fidelity funds and all Fidelity funds, using a series of detailed revenue and cost allocation methodologies which originate with the books and records of Fidelity on which Fidelity's audited financial statements are based. The Audit Committee of the Board reviews any significant changes from the prior year's methodologies.
PricewaterhouseCoopers LLP (PwC), independent registered public accounting firm and auditor to Fidelity and certain Fidelity funds, has been engaged annually by the Board as part of the Board's assessment of Fidelity's profitability analysis. PwC's engagement includes the review and assessment of Fidelity's methodologies used in determining the revenues and expenses attributable to Fidelity's mutual fund business, and completion of agreed-upon procedures surrounding the mathematical accuracy of fund profitability and its conformity to allocation methodologies. After considering PwC's reports issued under the engagement and information provided by Fidelity, the Board concluded that while other allocation methods may also be reasonable, Fidelity's profitability methodologies are reasonable in all material respects.
The Board also reviewed Fidelity's non-fund businesses and fall-out benefits related to the mutual fund business as well as cases where Fidelity's affiliates may benefit from or be related to the fund's business.
The Board considered the costs of the services provided by and the profits realized by Fidelity in connection with the operation of the fund and was satisfied that the profitability was not excessive in the circumstances.
Economies of Scale. The Board considered whether there have been economies of scale in respect of the management of the Fidelity funds, whether the Fidelity funds (including the fund) have appropriately benefited from any such economies of scale, and whether there is potential for realization of any further economies of scale. The Board considered the extent to which the fund will benefit from economies of scale through increased services to the fund, through waivers or reimbursements, or through fee or expense reductions. The Board also noted that in 2009, it and the board of other Fidelity funds created an ad hoc committee (the Economies of Scale Committee) to analyze whether FMR attains economies of scale in respect of the management and servicing of the Fidelity funds, whether the Fidelity funds have appropriately benefited from such economies of scale, and whether there is potential for realization of any further economies of scale.
The Board recognized that the fund's management contract incorporates a "group fee" structure, which provides for lower group fee rates as total fund assets under FMR's management increase, and for higher group fee rates as total fund assets under FMR's management decrease. FMR calculates the group fee rates based on a tiered asset "breakpoint" schedule that varies based on asset class. The Board considered that the group fee is designed to deliver the benefits of economies of scale to fund shareholders when total Fidelity fund assets increase, even if assets of any particular fund are unchanged or have declined, because some portion of Fidelity's costs are attributable to services provided to all Fidelity funds, and all funds benefit if those costs can be allocated among more assets. The Board concluded that, given the group fee structure, fund shareholders will benefit from lower management fees as assets under FMR's management increase at the fund complex level, regardless of whether Fidelity achieves any such economies of scale.
Annual Report
Board Approval of Investment Advisory Contracts and
Management Fees - continued
The Board concluded, taking into account the analysis of the Economies of Scale Committee, that economies of scale, if any, are being appropriately shared between fund shareholders and Fidelity.
Additional Information Requested by the Board. In order to develop fully the factual basis for consideration of the Fidelity funds' Advisory Contracts, the Board requested and received additional information on certain topics, including (i) fund performance trends, actions to be taken by FMR to improve certain funds' overall performance, and Fidelity's long-term strategies for certain funds; (ii) the potential to further rationalize the Fidelity fund lineup with the possibility of achieving savings for the funds and Fidelity; (iii) Fidelity's compensation structure for portfolio managers and other key investment personnel; (iv) the amount of the investment that each portfolio manager has made in the Fidelity fund(s) that he or she manages; (v) the realization of fall-out benefits in certain Fidelity business units; (vi) Fidelity's group fee structures, the potential impact of regulatory changes on such structures, and the rationale for the individual fee rates of certain funds; (vii) fund profitability methodology, including Fidelity's cost allocation methodology, and the impact of certain factors on fund profitability results; (viii) trends regarding industry use of performance fee structures and the possibility of implementing performance fee structures for additional funds; and (ix) the impact of net redemptions from the Fidelity funds.
Based on its evaluation of all of the conclusions noted above, and after considering all factors it believed relevant, the Board ultimately concluded that the advisory fee structures are fair and reasonable, and that the fund's Advisory Contracts should be renewed.
Annual Report
Investment Adviser
Fidelity Management & Research Company
Boston, MA
Investment Sub-Advisers
FMR Co., Inc.
Fidelity Management & Research
(U.K.) Inc.
Fidelity Management & Research
(Hong Kong) Limited
Fidelity Management & Research
(Japan) Inc.
FIL Investment Advisors
FIL Investments (Japan) Limited
FIL Investment Advisors (U.K.) Ltd.
General Distributor
Fidelity Distributors Corporation
Smithfield, RI
Transfer and Service Agent
Fidelity Investments Institutional
Operations Company, Inc.
Boston, MA
Fidelity Service Company, Inc.
Boston, MA
Custodian
State Street Bank and Trust Company
Quincy, MA
The Fidelity Telephone Connection
Mutual Fund 24-Hour Service
Exchanges/Redemptions
and Account Assistance 1-800-544-6666
Product Information 1-800-544-8888
Retirement Accounts 1-800-544-4774
(8 a.m. - 9 p.m.)
TDD Service 1-800-544-0118
for the deaf and hearing impaired
(9 a.m. - 9 p.m. Eastern time)
Fidelity Automated Service
Telephone (FAST®) (automated graphic)
1-800-544-5555
(automated graphic)
Automated line for quickest service
(Fidelity Investment logo)(registered trademark)
Corporate Headquarters
82 Devonshire St., Boston, MA 02109
www.fidelity.com
IGF-UANN-1212
1.912349.102
Fidelity®
International Small Cap Opportunities
Fund
Annual Report
October 31, 2012
(Fidelity Cover Art)
Contents
Performance | (Click Here) | How the fund has done over time. |
Management's Discussion of Fund Performance | (Click Here) | The Portfolio Manager's review of fund performance and strategy. |
Shareholder Expense Example | (Click Here) | An example of shareholder expenses. |
Investment Changes | (Click Here) | A summary of major shifts in the fund's investments over the past six months. |
Investments | (Click Here) | A complete list of the fund's investments with their market values. |
Financial Statements | (Click Here) | Statements of assets and liabilities, operations, and changes in net assets, as well as financial highlights. |
Notes | (Click Here) | Notes to the financial statements. |
Report of Independent Registered Public Accounting Firm | (Click Here) | |
Trustees and Officers | (Click Here) | |
Distributions | (Click Here) | |
Board Approval of Investment Advisory Contracts and Management Fees | (Click Here) | |
To view a fund's proxy voting guidelines and proxy voting record for the 12-month period ended June 30, visit http://www.fidelity.com/proxyvotingresults or visit the Securities and Exchange Commission's (SEC) web site at http://www.sec.gov. You may also call 1-800-544-8544 to request a free copy of the proxy voting guidelines.
Standard & Poor's, S&P and S&P 500 are registered service marks of The McGraw-Hill Companies, Inc. and have been licensed for use by Fidelity Distributors Corporation.
Other third party marks appearing herein are the property of their respective owners.
All other marks appearing herein are registered or unregistered trademarks or service marks of FMR LLC or an affiliated company. © 2012 FMR LLC. All rights reserved.
Annual Report
This report and the financial statements contained herein are submitted for the general information of the shareholders of the fund. This report is not authorized for distribution to prospective investors in the fund unless preceded or accompanied by an effective prospectus.
A fund files its complete schedule of portfolio holdings with the SEC for the first and third quarters of each fiscal year on Form N-Q. Forms N-Q are available on the SEC's web site at http://www.sec.gov. A fund's Forms N-Q may be reviewed and copied at the SEC's Public Reference Room in Washington, DC. Information regarding the operation of the SEC's Public Reference Room may be obtained by calling 1-800-SEC-0330. For a complete list of a fund's portfolio holdings, view the most recent holdings listing, semiannual report, or annual report on Fidelity's web site at http://www.fidelity.com, http://www.advisor.fidelity.com, or http://www.401k.com, as applicable.
NOT FDIC INSURED • MAY LOSE VALUE • NO BANK GUARANTEE
Neither the fund nor Fidelity Distributors Corporation is a bank.
Annual Report
Average annual total return reflects the change in the value of an investment, assuming reinvestment of the class' distributions from dividend income and capital gains (the profits earned upon the sale of securities that have grown in value, if any) and assuming a constant rate of performance each year. The $10,000 table and the fund's returns do not reflect the deduction of taxes that a shareholder would pay on fund distributions or the redemption of fund shares. During periods of reimbursement by Fidelity, a fund's total return will be greater than it would be had the reimbursement not occurred. How a fund did yesterday is no guarantee of how it will do tomorrow.
Average Annual Total Returns
Periods ended October 31, 2012 | Past 1
year | Past 5
years | Life of fund A |
Fidelity® International Small Cap Opportunities Fund | 12.21% | -7.45% | 3.64% |
A From August 2, 2005
$10,000 Over Life of Fund
Let's say hypothetically that $10,000 was invested in Fidelity® International Small Cap Opportunities Fund, a class of the fund, on August 2, 2005, when the fund started. The chart shows how the value of your investment would have changed, and also shows how the MSCI® EAFE® Small Cap Index performed over the same period.
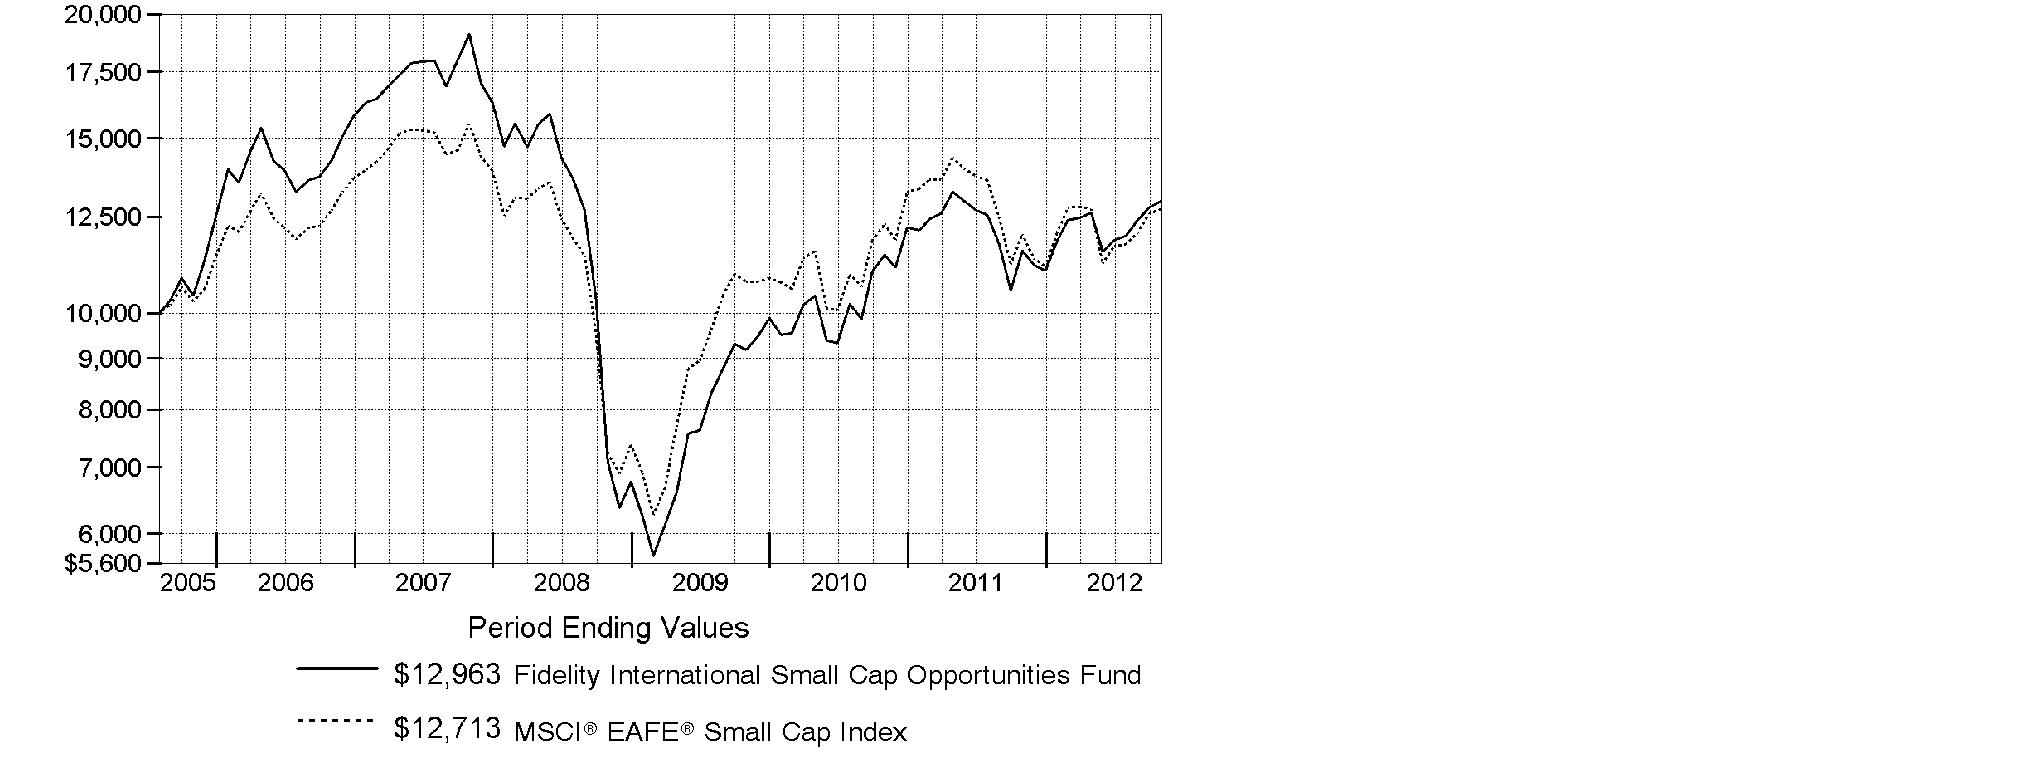
Annual Report
Market Recap: International stocks experienced pendulum-like swings during the 12 months ending October 31, 2012, finishing the period with a modest advance. The market faced periodic bouts of volatility this past year, as a number of macroeconomic concerns - including the eurozone debt crisis, the strength and pace of the U.S. economic recovery, and a slowdown in China's once-blistering growth - dominated headlines and weighed on investors. While a stronger U.S. dollar provided an additional head wind, foreign developed- and emerging-markets stocks still managed a gain for the 12 months, as the MSCI® ACWI® (All Country World Index) ex USA Index rose 4.11%, largely buttressed in the summertime by pledges of accommodative monetary action from eurozone officials, as well as signs that the U.S. housing market was on the mend. Within the index, Asia-Pacific ex Japan showed the most impressive gains, advancing roughly 11%. A number of core European components, most notably Germany (+11%), Switzerland (+10%) and the U.K. (+9%), benefited from optimism about the eurozone's ability to resolve its debt woes, which also helped the region outpace the index overall. Elsewhere, results from Canada (+3%) and the generally more volatile emerging markets (+2%) each fell short of the MSCI index, while Japan was among the few benchmark constituents to finish in the red, returning about -3%.
Comments from Jed Weiss, Portfolio Manager of Fidelity® International Small Cap Opportunities Fund: For the year, the fund's Retail Class shares gained 12.21%, easily outpacing the 5.99% advance of the benchmark MSCI® EAFE® Small Cap Index. Security selection in emerging markets and Japan was very helpful. An out-of-benchmark allocation to globally oriented U.S.-based stocks also contributed to relative performance, while stock picking in Canada hurt. In sector terms, security selection helped in consumer discretionary, materials, industrials and financials, while energy and telecommunication services were detractors. The top individual contributor was Cymer, a U.S. laser manufacturer that gained sharply after in October after agreeing to be acquired by ASML Holding. Unite Group, a U.K.-based owner of student housing properties, added value, while better housing data lifted shares of U.S. carpet manufacturer Mohawk Industries and building products company James Hardie Industries, incorporated in Ireland and listed in Australia. In contrast, Austrian lighting company Zumtobel was hurt by weakness in its lighting-components business. Other disappointments were Nippon Thompson, a Japanese maker of linear motion guides, and Brazilian chemicals maker Braskem. Most of the names I've mentioned were not in the index, and I sold Braskem before period end.
The views expressed above reflect those of the portfolio manager(s) only through the end of the period as stated on the cover of this report and do not necessarily represent the views of Fidelity or any other person in the Fidelity organization. Any such views are subject to change at any time based upon market or other conditions and Fidelity disclaims any responsibility to update such views. These views may not be relied on as investment advice and, because investment decisions for a Fidelity fund are based on numerous factors, may not be relied on as an indication of trading intent on behalf of any Fidelity fund.
Annual Report
Shareholder Expense Example
As a shareholder of the Fund, you incur two types of costs: (1) transaction costs, including sales charges (loads) on purchase payments or redemption proceeds, redemption fees and (2) ongoing costs, including management fees, distribution and/or service (12b-1) fees and other Fund expenses. This Example is intended to help you understand your ongoing costs (in dollars) of investing in the Fund and to compare these costs with the ongoing costs of investing in other mutual funds.
The Example is based on an investment of $1,000 invested at the beginning of the period and held for the entire period (May 1, 2012 to October 31, 2012).
Actual Expenses
The first line of the accompanying table for each class of the Fund provides information about actual account values and actual expenses. You may use the information in this line, together with the amount you invested, to estimate the expenses that you paid over the period. Simply divide your account value by $1,000.00 (for example, an $8,600 account value divided by $1,000.00 = 8.6), then multiply the result by the number in the first line for a class of the Fund under the heading entitled "Expenses Paid During Period" to estimate the expenses you paid on your account during this period. A small balance maintenance fee of $12.00 that is charged once a year may apply for certain accounts with a value of less than $2,000. This fee is not included in the table below. If it was, the estimate of expenses you paid during the period would be higher, and your ending account value lower, by this amount. In addition, the Fund, as a shareholder in the underlying Fidelity Central Funds, will indirectly bear its pro-rata share of the fees and expenses incurred by the underlying Fidelity Central Funds. These fees and expenses are not included in the Fund's annualized expense ratio used to calculate the expense estimate in the table below.
Hypothetical Example for Comparison Purposes
The second line of the accompanying table for each class of the Fund provides information about hypothetical account values and hypothetical expenses based on a Class' actual expense ratio and an assumed rate of return of 5% per year before expenses, which is not the Class' actual return. The hypothetical account values and expenses may not be used to estimate the actual ending account balance or expenses you paid for the period. You may use this information to compare the ongoing costs of investing in the Fund and other funds. To do so, compare this 5% hypothetical example with the 5% hypothetical examples that appear in the shareholder reports of the other funds. A small balance maintenance fee of $12.00 that is charged once a year may apply for certain accounts with a value of less than $2,000. This fee is not included in the table below. If it was, the estimate of expenses you paid during the period would be higher, and your ending account value lower, by this amount. In addition, the Fund, as a shareholder in the underlying Fidelity Central Funds, will indirectly bear its pro-rata share of the fees and expenses incurred by the underlying Fidelity Central Funds. These fees and expenses are not included in the Fund's annualized expense ratio used to calculate the expense estimate in the table below.
Please note that the expenses shown in the table are meant to highlight your ongoing costs only and do not reflect any transaction costs. Therefore, the second line of the table is useful in comparing ongoing costs only, and will not help you determine the relative total costs of owning different funds. In addition, if these transactional costs were included, your costs would have been higher.
Annual Report
Shareholder Expense Example - continued
| Annualized
Expense Ratio | Beginning
Account Value
May 1, 2012 | Ending
Account Value
October 31, 2012 | Expenses Paid
During Period*
May 1, 2012
to October 31, 2012 |
Class A | 1.65% | | | |
Actual | | $ 1,000.00 | $ 1,025.70 | $ 8.40 |
Hypothetical A | | $ 1,000.00 | $ 1,016.84 | $ 8.36 |
Class T | 1.90% | | | |
Actual | | $ 1,000.00 | $ 1,024.90 | $ 9.67 |
Hypothetical A | | $ 1,000.00 | $ 1,015.58 | $ 9.63 |
Class B | 2.40% | | | |
Actual | | $ 1,000.00 | $ 1,022.40 | $ 12.20 |
Hypothetical A | | $ 1,000.00 | $ 1,013.07 | $ 12.14 |
Class C | 2.40% | | | |
Actual | | $ 1,000.00 | $ 1,022.40 | $ 12.20 |
Hypothetical A | | $ 1,000.00 | $ 1,013.07 | $ 12.14 |
International Small Cap Opportunities | 1.40% | | | |
Actual | | $ 1,000.00 | $ 1,027.40 | $ 7.13 |
Hypothetical A | | $ 1,000.00 | $ 1,018.10 | $ 7.10 |
Institutional Class | 1.40% | | | |
Actual | | $ 1,000.00 | $ 1,028.30 | $ 7.14 |
Hypothetical A | | $ 1,000.00 | $ 1,018.10 | $ 7.10 |
A 5% return per year before expenses
* Expenses are equal to each Class' annualized expense ratio, multiplied by the average account value over the period, multiplied by 184/366 (to reflect the one-half year period).
Annual Report
Investment Changes (Unaudited)
Geographic Diversification (% of fund's net assets) |
As of October 31, 2012 |
 | Japan 21.1% | |
 | United Kingdom 19.2% | |
 | United States of America 16.6% | |
 | Germany 4.8% | |
 | Canada 3.5% | |
 | France 3.0% | |
 | Turkey 2.8% | |
 | Sweden 2.5% | |
 | Brazil 2.5% | |
| Other 24.0% | |

Percentages are based on country or territory of incorporation and are adjusted for the effect of futures contracts, if applicable. |
As of April 30, 2012 |
| Japan 21.1% | |
| United States of America 17.8% | |
| United Kingdom 17.5% | |
| Germany 4.7% | |
| France 3.1% | |
| Canada 2.9% | |
| Brazil 2.9% | |
| South Africa 2.6% | |
| Sweden 2.5% | |
| Other 24.9% | |

Percentages are based on country or territory of incorporation and are adjusted for the effect of futures contracts, if applicable. |
Asset Allocation |
| % of fund's
net assets | % of fund's net assets
6 months ago |
Stocks | 96.1 | 94.5 |
Short-Term Investments and Net Other Assets (Liabilities) | 3.9 | 5.5 |
Top Ten Stocks as of October 31, 2012 |
| % of fund's
net assets | % of fund's net assets
6 months ago |
PriceSmart, Inc. (United States of America, Food & Staples Retailing) | 2.5 | 2.5 |
USS Co. Ltd. (Japan, Specialty Retail) | 2.0 | 2.0 |
Andritz AG (Austria, Machinery) | 1.6 | 1.5 |
Unite Group PLC (United Kingdom, Real Estate Management & Development) | 1.5 | 1.2 |
Kobayashi Pharmaceutical Co. Ltd. (Japan, Personal Products) | 1.5 | 1.4 |
Spirax-Sarco Engineering PLC (United Kingdom, Machinery) | 1.5 | 1.7 |
Prosegur Compania de Seguridad SA (Reg.) (Spain, Commercial Services & Supplies) | 1.4 | 1.4 |
Coca-Cola Icecek A/S (Turkey, Beverages) | 1.4 | 1.0 |
Interpump Group SpA (Italy, Machinery) | 1.3 | 1.3 |
Meggitt PLC (United Kingdom, Aerospace & Defense) | 1.3 | 1.3 |
| 16.0 | |
Market Sectors as of October 31, 2012 |
| % of fund's
net assets | % of fund's net assets
6 months ago |
Industrials | 24.0 | 23.0 |
Consumer Discretionary | 18.6 | 19.1 |
Financials | 14.0 | 14.7 |
Consumer Staples | 12.6 | 12.1 |
Materials | 9.7 | 9.5 |
Information Technology | 7.6 | 7.7 |
Health Care | 5.1 | 4.9 |
Energy | 4.5 | 3.5 |
Annual Report
Investments October 31, 2012
Showing Percentage of Net Assets
Common Stocks - 95.4% |
| Shares | | Value |
Australia - 1.0% |
Ramsay Health Care Ltd. | 66,365 | | $ 1,636,831 |
Sydney Airport unit | 637,981 | | 2,245,048 |
TOTAL AUSTRALIA | | 3,881,879 |
Austria - 2.1% |
Andritz AG | 101,600 | | 6,119,580 |
Zumtobel AG | 157,681 | | 1,684,690 |
TOTAL AUSTRIA | | 7,804,270 |
Bailiwick of Jersey - 1.6% |
Informa PLC | 588,230 | | 3,798,923 |
Randgold Resources Ltd. sponsored ADR | 18,300 | | 2,188,497 |
TOTAL BAILIWICK OF JERSEY | | 5,987,420 |
Belgium - 1.6% |
Gimv NV | 55,410 | | 2,678,156 |
Umicore SA | 62,474 | | 3,206,232 |
TOTAL BELGIUM | | 5,884,388 |
Bermuda - 1.0% |
GP Investments Ltd. (depositary receipt) (a) | 357,600 | | 825,752 |
Lazard Ltd. Class A | 32,899 | | 969,205 |
Trinity Ltd. | 2,704,000 | | 1,894,532 |
TOTAL BERMUDA | | 3,689,489 |
Brazil - 1.8% |
Arezzo Industria e Comercio SA | 108,700 | | 1,940,068 |
Banco Pine SA | 242,285 | | 1,693,925 |
Iguatemi Empresa de Shopping Centers SA | 89,400 | | 1,135,629 |
Multiplan Empreendimentos Imobiliarios SA | 63,600 | | 1,863,174 |
TOTAL BRAZIL | | 6,632,796 |
British Virgin Islands - 0.2% |
Gem Diamonds Ltd. (a) | 346,495 | | 943,576 |
Canada - 3.5% |
Agnico-Eagle Mines Ltd. (Canada) | 22,960 | | 1,296,335 |
Baytex Energy Corp. (d) | 21,900 | | 996,601 |
Copper Mountain Mining Corp. (a) | 206,100 | | 833,686 |
Eldorado Gold Corp. | 123,100 | | 1,819,230 |
Fairfax Financial Holdings Ltd. (sub. vtg.) | 4,790 | | 1,776,964 |
Open Text Corp. (a) | 30,200 | | 1,623,165 |
Painted Pony Petroleum Ltd. Class A (a) | 99,100 | | 1,071,620 |
Common Stocks - continued |
| Shares | | Value |
Canada - continued |
Pason Systems, Inc. | 114,900 | | $ 1,871,763 |
Petrominerales Ltd. | 101,379 | | 813,062 |
TAG Oil Ltd. (a) | 148,400 | | 1,040,100 |
TOTAL CANADA | | 13,142,526 |
Cayman Islands - 0.3% |
Vantage Drilling Co. (a) | 525,331 | | 966,609 |
Denmark - 0.2% |
William Demant Holding A/S (a) | 10,433 | | 897,310 |
Finland - 1.9% |
Nokian Tyres PLC | 88,600 | | 3,674,844 |
Outotec Oyj | 68,900 | | 3,355,179 |
TOTAL FINLAND | | 7,030,023 |
France - 3.0% |
Laurent-Perrier Group | 28,463 | | 2,427,515 |
Remy Cointreau SA | 27,273 | | 2,828,699 |
Saft Groupe SA | 79,819 | | 1,774,812 |
Vetoquinol SA | 37,895 | | 1,267,234 |
Virbac SA | 16,000 | | 2,789,315 |
TOTAL FRANCE | | 11,087,575 |
Germany - 4.8% |
alstria office REIT-AG | 170,500 | | 2,059,218 |
Bilfinger Berger AG | 36,659 | | 3,586,950 |
CompuGROUP Holding AG | 109,908 | | 1,994,402 |
CTS Eventim AG | 137,426 | | 4,079,056 |
Fielmann AG | 36,437 | | 3,546,809 |
Software AG (Bearer) | 65,781 | | 2,635,450 |
TOTAL GERMANY | | 17,901,885 |
India - 0.7% |
Jyothy Laboratories Ltd. | 817,354 | | 2,694,131 |
Ireland - 1.4% |
FBD Holdings PLC | 82,200 | | 1,028,145 |
James Hardie Industries NV: | | | |
CDI | 35,000 | | 335,342 |
sponsored ADR (d) | 83,775 | | 4,028,740 |
TOTAL IRELAND | | 5,392,227 |
Israel - 0.9% |
Azrieli Group | 70,005 | | 1,562,817 |
Common Stocks - continued |
| Shares | | Value |
Israel - continued |
Ituran Location & Control Ltd. | 131,286 | | $ 1,622,695 |
Strauss Group Ltd. | 23,244 | | 262,626 |
TOTAL ISRAEL | | 3,448,138 |
Italy - 2.1% |
Azimut Holding SpA | 253,073 | | 3,204,761 |
Interpump Group SpA | 640,443 | | 4,864,446 |
TOTAL ITALY | | 8,069,207 |
Japan - 21.1% |
Air Water, Inc. | 76,000 | | 952,023 |
Aozora Bank Ltd. | 813,000 | | 2,291,432 |
Asahi Co. Ltd. (d) | 106,500 | | 1,603,570 |
Autobacs Seven Co. Ltd. | 99,200 | | 4,069,648 |
Azbil Corp. | 68,200 | | 1,395,097 |
Cosmos Pharmaceutical Corp. | 14,300 | | 1,409,758 |
Daikoku Denki Co. Ltd. | 32,800 | | 829,964 |
Daikokutenbussan Co. Ltd. | 121,200 | | 3,853,258 |
FCC Co. Ltd. | 176,500 | | 3,172,711 |
Fields Corp. | 59,200 | | 851,329 |
GCA Savvian Group Corp. | 1,309 | | 1,554,468 |
Glory Ltd. | 93,000 | | 2,257,723 |
Goldcrest Co. Ltd. | 106,940 | | 1,608,856 |
Iwatsuka Confectionary Co. Ltd. | 26,500 | | 991,883 |
Kamigumi Co. Ltd. | 207,000 | | 1,669,899 |
Kobayashi Pharmaceutical Co. Ltd. | 106,300 | | 5,612,608 |
Kyoto Kimono Yuzen Co. Ltd. | 123,300 | | 1,490,474 |
Meiko Network Japan Co. Ltd. | 104,500 | | 1,060,316 |
Miraial Co. Ltd. | 39,200 | | 746,386 |
Nabtesco Corp. | 108,100 | | 2,012,233 |
Nagaileben Co. Ltd. | 125,700 | | 1,845,427 |
Nihon M&A Center, Inc. | 127,200 | | 3,816,159 |
Nihon Parkerizing Co. Ltd. | 181,000 | | 2,732,118 |
Nippon Seiki Co. Ltd. | 186,000 | | 1,787,073 |
Nippon Thompson Co. Ltd. | 460,000 | | 1,590,380 |
NS Tool Co., Ltd. | 4,400 | | 74,959 |
Obic Co. Ltd. | 10,130 | | 2,084,879 |
Osaka Securities Exchange Co. Ltd. | 178 | | 663,347 |
OSG Corp. | 173,600 | | 2,272,479 |
Seven Bank Ltd. | 1,158,900 | | 3,309,899 |
SHO-BOND Holdings Co. Ltd. | 95,200 | | 2,877,585 |
Shoei Co. Ltd. | 95,800 | | 522,022 |
Common Stocks - continued |
| Shares | | Value |
Japan - continued |
The Nippon Synthetic Chemical Industry Co. Ltd. | 318,000 | | $ 2,087,336 |
Tocalo Co. Ltd. | 70,000 | | 1,016,285 |
Tsutsumi Jewelry Co. Ltd. | 41,800 | | 958,735 |
USS Co. Ltd. | 72,710 | | 7,641,700 |
Yamato Kogyo Co. Ltd. | 151,700 | | 4,258,546 |
TOTAL JAPAN | | 78,972,565 |
Korea (South) - 0.6% |
Woongjin Coway Co. Ltd. | 61,100 | | 2,224,732 |
Netherlands - 2.3% |
Aalberts Industries NV | 205,700 | | 3,732,653 |
ASM International NV unit | 71,200 | | 2,258,464 |
Heijmans NV unit | 112,623 | | 953,663 |
QIAGEN NV (a) | 94,600 | | 1,650,770 |
TOTAL NETHERLANDS | | 8,595,550 |
Papua New Guinea - 0.4% |
Oil Search Ltd. ADR | 207,544 | | 1,602,881 |
Philippines - 0.6% |
Jollibee Food Corp. | 856,460 | | 2,202,623 |
Portugal - 0.8% |
Jeronimo Martins SGPS SA | 161,700 | | 2,829,431 |
South Africa - 2.0% |
African Rainbow Minerals Ltd. | 77,800 | | 1,628,563 |
City Lodge Hotels Ltd. | 76,302 | | 809,603 |
Clicks Group Ltd. | 495,688 | | 3,417,533 |
Mr Price Group Ltd. | 98,200 | | 1,517,059 |
TOTAL SOUTH AFRICA | | 7,372,758 |
Spain - 1.8% |
Grifols SA (a) | 49,232 | | 1,707,611 |
Prosegur Compania de Seguridad SA (Reg.) | 946,390 | | 5,151,986 |
TOTAL SPAIN | | 6,859,597 |
Sweden - 2.5% |
Fagerhult AB | 90,605 | | 2,240,230 |
Intrum Justitia AB | 288,334 | | 4,173,147 |
Swedish Match Co. AB | 85,600 | | 2,916,613 |
TOTAL SWEDEN | | 9,329,990 |
Switzerland - 0.5% |
Zehnder Group AG | 31,864 | | 1,876,667 |
Common Stocks - continued |
| Shares | | Value |
Turkey - 2.8% |
Albaraka Turk Katilim Bankasi A/S | 2,942,565 | | $ 2,331,070 |
Boyner Buyuk Magazacilik A/S (a) | 1,290,451 | | 2,966,058 |
Coca-Cola Icecek A/S | 264,362 | | 5,132,384 |
TOTAL TURKEY | | 10,429,512 |
United Kingdom - 19.2% |
AMEC PLC | 111,405 | | 1,905,666 |
Babcock International Group PLC | 205,700 | | 3,246,455 |
Bellway PLC | 198,072 | | 3,231,547 |
Berendsen PLC | 176,863 | | 1,606,873 |
Britvic PLC | 429,700 | | 2,490,795 |
Dechra Pharmaceuticals PLC | 282,100 | | 2,808,824 |
Derwent London PLC | 58,600 | | 1,949,946 |
Elementis PLC | 405,882 | | 1,370,898 |
Great Portland Estates PLC | 487,489 | | 3,678,541 |
H&T Group PLC | 232,153 | | 1,077,081 |
InterContinental Hotel Group PLC ADR | 111,626 | | 2,748,232 |
Johnson Matthey PLC | 79,175 | | 2,873,517 |
Meggitt PLC | 771,669 | | 4,806,784 |
Persimmon PLC | 202,563 | | 2,598,744 |
Rotork PLC | 119,500 | | 4,392,966 |
Serco Group PLC | 426,309 | | 3,897,272 |
Shaftesbury PLC | 412,873 | | 3,651,180 |
Spectris PLC | 130,587 | | 3,641,497 |
Spirax-Sarco Engineering PLC | 174,930 | | 5,462,375 |
Ted Baker PLC | 112,000 | | 1,713,415 |
Ultra Electronics Holdings PLC | 129,658 | | 3,542,359 |
Unite Group PLC | 1,274,170 | | 5,821,079 |
Victrex PLC | 146,882 | | 3,377,689 |
TOTAL UNITED KINGDOM | | 71,893,735 |
United States of America - 12.7% |
ANSYS, Inc. (a) | 15,285 | | 1,083,401 |
Autoliv, Inc. | 61,900 | | 3,565,440 |
BPZ Energy, Inc. (a)(d) | 286,767 | | 825,889 |
Broadridge Financial Solutions, Inc. | 61,705 | | 1,416,130 |
Cymer, Inc. (a) | 49,209 | | 3,921,465 |
Dril-Quip, Inc. (a) | 40,569 | | 2,809,809 |
Evercore Partners, Inc. Class A | 56,200 | | 1,567,980 |
Greenhill & Co., Inc. | 40,995 | | 1,956,281 |
Kansas City Southern | 42,800 | | 3,443,688 |
Martin Marietta Materials, Inc. | 23,800 | | 1,958,978 |
Common Stocks - continued |
| Shares | | Value |
United States of America - continued |
Mohawk Industries, Inc. (a) | 41,700 | | $ 3,480,699 |
Oceaneering International, Inc. | 53,100 | | 2,778,723 |
PriceSmart, Inc. | 110,996 | | 9,211,553 |
ResMed, Inc. | 98,000 | | 3,914,120 |
Solera Holdings, Inc. | 68,456 | | 3,204,425 |
SS&C Technologies Holdings, Inc. (a) | 106,858 | | 2,567,798 |
TOTAL UNITED STATES OF AMERICA | | 47,706,379 |
TOTAL COMMON STOCKS (Cost $286,436,564) |
357,349,869
|
Nonconvertible Preferred Stocks - 0.7% |
| | | |
Brazil - 0.7% |
Banco ABC Brasil SA
(Cost $2,957,747) | 452,289 | |
2,569,811
|
Money Market Funds - 4.1% |
| | | |
Fidelity Cash Central Fund, 0.19% (b) | 14,393,835 | | 14,393,835 |
Fidelity Securities Lending Cash Central Fund, 0.19% (b)(c) | 1,000,230 | | 1,000,230 |
TOTAL MONEY MARKET FUNDS (Cost $15,394,065) |
15,394,065
|
TOTAL INVESTMENT PORTFOLIO - 100.2% (Cost $304,788,376) | | 375,313,745 |
NET OTHER ASSETS (LIABILITIES) - (0.2)% | | (868,125) |
NET ASSETS - 100% | $ 374,445,620 |
Legend |
(a) Non-income producing |
(b) Affiliated fund that is available only to investment companies and other accounts managed by Fidelity Investments. The rate quoted is the annualized seven-day yield of the fund at period end. A complete unaudited listing of the fund's holdings as of its most recent quarter end is available upon request. In addition, each Fidelity Central Fund's financial statements, which are not covered by the Fund's Report of Independent Registered Public Accounting Firm, are available on the SEC's website or upon request. |
(c) Investment made with cash collateral received from securities on loan. |
(d) Security or a portion of the security is on loan at period end. |
Affiliated Central Funds |
Information regarding fiscal year to date income earned by the Fund from investments in Fidelity Central Funds is as follows: |
Fund | Income earned |
Fidelity Cash Central Fund | $ 20,578 |
Fidelity Securities Lending Cash Central Fund | 123,696 |
Total | $ 144,274 |
Other Information |
Categorizations in the Schedule of Investments are based on country or territory of incorporation. |
All investments are categorized as Level 1 under the Fair Value Hierarchy. The inputs or methodology used for valuing securities may not be an indication of the risk associated with investing in those securities. For more information on valuation inputs, please refer to the Security Valuation section in the accompanying Notes to Financial Statements. |
The following is a summary of transfers between Level 1 and Level 2 for the period ended October 31, 2012. Transfers are assumed to have occurred at the beginning of the period, and are primarily attributable to the valuation techniques used for foreign equity securities, as discussed in the accompanying Notes to Financial Statements: |
Transfers | Total |
Level 1 to Level 2 | $ 0 |
Level 2 to Level 1 | $ 83,755,081 |
See accompanying notes which are an integral part of the financial statements.
Annual Report
Statement of Assets and Liabilities
| October 31, 2012 |
| | |
Assets | | |
Investment in securities, at value (including securities loaned of $950,434) - See accompanying schedule: Unaffiliated issuers (cost $289,394,311) | $ 359,919,680 | |
Fidelity Central Funds (cost $15,394,065) | 15,394,065 | |
Total Investments (cost $304,788,376) | | $ 375,313,745 |
Receivable for investments sold | | 852,658 |
Receivable for fund shares sold | | 208,144 |
Dividends receivable | | 1,012,746 |
Distributions receivable from Fidelity Central Funds | | 3,106 |
Receivable from investment adviser for expense reductions | | 3,081 |
Other receivables | | 8,858 |
Total assets | | 377,402,338 |
| | |
Liabilities | | |
Payable for investments purchased | $ 833,907 | |
Payable for fund shares redeemed | 609,477 | |
Accrued management fee | 332,364 | |
Distribution and service plan fees payable | 14,354 | |
Other affiliated payables | 98,330 | |
Other payables and accrued expenses | 68,056 | |
Collateral on securities loaned, at value | 1,000,230 | |
Total liabilities | | 2,956,718 |
| | |
Net Assets | | $ 374,445,620 |
Net Assets consist of: | | |
Paid in capital | | $ 650,027,368 |
Undistributed net investment income | | 3,302,296 |
Accumulated undistributed net realized gain (loss) on investments and foreign currency transactions | | (349,390,238) |
Net unrealized appreciation (depreciation) on investments and assets and liabilities in foreign currencies | | 70,506,194 |
Net Assets | | $ 374,445,620 |
See accompanying notes which are an integral part of the financial statements.
Annual Report
Financial Statements - continued
Statement of Assets and Liabilities - continued
| October 31, 2012 |
| | |
Calculation of Maximum Offering Price Class A:
Net Asset Value and redemption price per share ($18,194,312 ÷ 1,687,285 shares) | | $ 10.78 |
| | |
Maximum offering price per share (100/94.25 of $10.78) | | $ 11.44 |
Class T:
Net Asset Value and redemption price per share ($8,168,756 ÷ 763,991 shares) | | $ 10.69 |
| | |
Maximum offering price per share (100/96.50 of $10.69) | | $ 11.08 |
Class B:
Net Asset Value and offering price per share ($1,965,725 ÷ 187,264 shares)A | | $ 10.50 |
| | |
Class C:
Net Asset Value and offering price per share ($6,608,275 ÷ 630,481 shares)A | | $ 10.48 |
| | |
International Small Cap Opportunities:
Net Asset Value, offering price and redemption price per share ($334,917,873 ÷ 30,769,882 shares) | | $ 10.88 |
| | |
Institutional Class:
Net Asset Value, offering price and redemption price per share ($4,590,679 ÷ 421,283 shares) | | $ 10.90 |
A Redemption price per share is equal to net asset value less any applicable contingent deferred sales charge.
See accompanying notes which are an integral part of the financial statements.
Annual Report
Statement of Operations
| Year ended October 31, 2012 |
| | |
Investment Income | | |
Dividends | | $ 9,443,414 |
Income from Fidelity Central Funds | | 144,274 |
Income before foreign taxes withheld | | 9,587,688 |
Less foreign taxes withheld | | (625,721) |
Total income | | 8,961,967 |
| | |
Expenses | | |
Management fee
Basic fee | $ 3,085,108 | |
Performance adjustment | 775,332 | |
Transfer agent fees | 999,785 | |
Distribution and service plan fees | 174,080 | |
Accounting and security lending fees | 188,109 | |
Custodian fees and expenses | 101,203 | |
Independent trustees' compensation | 2,363 | |
Registration fees | 81,326 | |
Audit | 67,233 | |
Legal | 1,855 | |
Miscellaneous | 3,487 | |
Total expenses before reductions | 5,479,881 | |
Expense reductions | (297,227) | 5,182,654 |
Net investment income (loss) | | 3,779,313 |
Realized and Unrealized Gain (Loss) Net realized gain (loss) on: | | |
Investment securities: | | |
Unaffiliated issuers | 21,390,324 | |
Foreign currency transactions | (29,044) | |
Total net realized gain (loss) | | 21,361,280 |
Change in net unrealized appreciation (depreciation) on: Investment securities | 17,246,510 | |
Assets and liabilities in foreign currencies | (10,085) | |
Total change in net unrealized appreciation (depreciation) | | 17,236,425 |
Net gain (loss) | | 38,597,705 |
Net increase (decrease) in net assets resulting from operations | | $ 42,377,018 |
See accompanying notes which are an integral part of the financial statements.
Annual Report
Financial Statements - continued
Statement of Changes in Net Assets
| Year ended
October 31,
2012 | Year ended
October 31,
2011 |
Increase (Decrease) in Net Assets | | |
Operations | | |
Net investment income (loss) | $ 3,779,313 | $ 7,043,577 |
Net realized gain (loss) | 21,361,280 | 54,021,779 |
Change in net unrealized appreciation (depreciation) | 17,236,425 | (52,262,552) |
Net increase (decrease) in net assets resulting
from operations | 42,377,018 | 8,802,804 |
Distributions to shareholders from net investment income | (4,886,680) | (6,223,295) |
Distributions to shareholders from net realized gain | (369,319) | (1,761,993) |
Total distributions | (5,255,999) | (7,985,288) |
Share transactions - net increase (decrease) | (28,976,326) | (78,669,716) |
Redemption fees | 64,463 | 71,408 |
Total increase (decrease) in net assets | 8,209,156 | (77,780,792) |
| | |
Net Assets | | |
Beginning of period | 366,236,464 | 444,017,256 |
End of period (including undistributed net investment income of $3,302,296 and undistributed net investment income of $4,428,178, respectively) | $ 374,445,620 | $ 366,236,464 |
See accompanying notes which are an integral part of the financial statements.
Annual Report
Financial Highlights - Class A
Years ended October 31, | 2012 | 2011 | 2010 | 2009 | 2008 |
Selected Per-Share Data | | | | | |
Net asset value, beginning of period | $ 9.75 | $ 9.82 | $ 8.07 | $ 6.24 | $ 18.97 |
Income from Investment Operations | | | | | |
Net investment income (loss) C | .08 | .15 F | .06 | .06 | .02 |
Net realized and unrealized gain (loss) | 1.07 | (.07) | 1.85 | 1.77 | (10.85) |
Total from investment operations | 1.15 | .08 | 1.91 | 1.83 | (10.83) |
Distributions from net investment income | (.11) | (.11) | (.07) | - | (.03) |
Distributions from net realized gain | (.01) | (.04) | (.09) | - | (1.88) |
Total distributions | (.12) | (.15) | (.16) | - | (1.90) I |
Redemption fees added to paid in capital C,H | - | - | - | - | - |
Net asset value, end of period | $ 10.78 | $ 9.75 | $ 9.82 | $ 8.07 | $ 6.24 |
Total Return A,B | 12.00% | .81% | 24.05% | 29.33% | (62.98)% |
Ratios to Average Net Assets D,G | | | | | |
Expenses before reductions | 1.75% | 1.34% | 1.16% | .94% | 1.75% |
Expenses net of fee waivers, if any | 1.65% | 1.33% | 1.16% | .94% | 1.66% |
Expenses net of all reductions | 1.64% | 1.32% | 1.15% | .89% | 1.62% |
Net investment income (loss) | .85% | 1.44% F | .74% | 1.00% | .13% |
Supplemental Data | | | | | |
Net assets, end of period (000 omitted) | $ 18,194 | $ 18,686 | $ 20,228 | $ 18,883 | $ 17,905 |
Portfolio turnover rate E | 28% | 24% | 49% | 174% | 61% |
A Total returns would have been lower if certain expenses had not been reduced during the applicable periods shown.
B Total returns do not include the effect of the sales charges.
C Calculated based on average shares outstanding during the period.
D Fees and expenses of any underlying Fidelity Central Funds are not included in the Fund's expense ratio. The Fund indirectly bears its proportionate share of the expenses of any underlying Fidelity Central Funds.
E Amount does not include the portfolio activity of any underlying Fidelity Central Funds.
F Investment income per share reflects a large, non-recurring dividend which amounted to $.06 per share. Excluding this non-recurring dividend, the ratio of net investment income (loss) to average net assets would have been .80%.
G Expense ratios reflect operating expenses of the class. Expenses before reductions do not reflect amounts reimbursed by the investment adviser or reductions from brokerage service arrangements or reductions from other expense offset arrangements and do not represent the amount paid by the class during periods when reimbursements or reductions occur. Expenses net of fee waivers reflect expenses after reimbursement by the investment adviser but prior to reductions from brokerage service arrangements or other expense offset arrangements. Expenses net of all reductions represent the net expenses paid by the class.
H Amount represents less than $.01 per share.
I Total distributions of $1.90 per share is comprised of distributions from net investment income of $.025 and distributions from net realized gain of $1.878 per share.
See accompanying notes which are an integral part of the financial statements.
Annual Report
Financial Highlights - Class T
Years ended October 31, | 2012 | 2011 | 2010 | 2009 | 2008 |
Selected Per-Share Data | | | | | |
Net asset value, beginning of period | $ 9.66 | $ 9.72 | $ 8.00 | $ 6.20 | $ 18.85 |
Income from Investment Operations | | | | | |
Net investment income (loss) C | .06 | .12 F | .04 | .05 | (.02) |
Net realized and unrealized gain (loss) | 1.06 | (.06) | 1.83 | 1.75 | (10.78) |
Total from investment operations | 1.12 | .06 | 1.87 | 1.80 | (10.80) |
Distributions from net investment income | (.08) | (.08) | (.06) | - | - |
Distributions from net realized gain | (.01) | (.04) | (.09) | - | (1.85) |
Total distributions | (.09) | (.12) | (.15) | - | (1.85) I |
Redemption fees added to paid in capital C,H | - | - | - | - | - |
Net asset value, end of period | $ 10.69 | $ 9.66 | $ 9.72 | $ 8.00 | $ 6.20 |
Total Return A,B | 11.72% | .60% | 23.65% | 29.03% | (63.08)% |
Ratios to Average Net Assets D,G | | | | | |
Expenses before reductions | 2.02% | 1.60% | 1.43% | 1.20% | 2.00% |
Expenses net of fee waivers, if any | 1.90% | 1.60% | 1.43% | 1.20% | 1.91% |
Expenses net of all reductions | 1.89% | 1.59% | 1.41% | 1.15% | 1.87% |
Net investment income (loss) | .60% | 1.17% F | .48% | .74% | (.12)% |
Supplemental Data | | | | | |
Net assets, end of period (000 omitted) | $ 8,169 | $ 8,701 | $ 11,202 | $ 11,915 | $ 11,614 |
Portfolio turnover rate E | 28% | 24% | 49% | 174% | 61% |
A Total returns would have been lower if certain expenses had not been reduced during the applicable periods shown.
B Total returns do not include the effect of the sales charges.
C Calculated based on average shares outstanding during the period.
D Fees and expenses of any underlying Fidelity Central Funds are not included in the Fund's expense ratio. The Fund indirectly bears its proportionate share of the expenses of any underlying Fidelity Central Funds.
E Amount does not include the portfolio activity of any underlying Fidelity Central Funds.
F Investment income per share reflects a large, non-recurring dividend which amounted to $.06 per share. Excluding this non-recurring dividend, the ratio of net investment income (loss) to average net assets would have been .54%.
G Expense ratios reflect operating expenses of the class. Expenses before reductions do not reflect amounts reimbursed by the investment adviser or reductions from brokerage service arrangements or reductions from other expense offset arrangements and do not represent the amount paid by the class during periods when reimbursements or reductions occur. Expenses net of fee waivers reflect expenses after reimbursement by the investment adviser but prior to reductions from brokerage service arrangements or other expense offset arrangements. Expenses net of all reductions represent the net expenses paid by the class.
H Amount represents less than $.01 per share.
I Total distributions of $1.85 per share is comprised of distributions from net realized gain of $1.852 per share.
See accompanying notes which are an integral part of the financial statements.
Annual Report
Financial Highlights - Class B
Years ended October 31, | 2012 | 2011 | 2010 | 2009 | 2008 |
Selected Per-Share Data | | | | | |
Net asset value, beginning of period | $ 9.48 | $ 9.54 | $ 7.87 | $ 6.12 | $ 18.64 |
Income from Investment Operations | | | | | |
Net investment income (loss) C | .01 | .07 F | - H | .02 | (.08) |
Net realized and unrealized gain (loss) | 1.05 | (.06) | 1.79 | 1.73 | (10.68) |
Total from investment operations | 1.06 | .01 | 1.79 | 1.75 | (10.76) |
Distributions from net investment income | (.03) | (.06) | (.03) | - | - |
Distributions from net realized gain | (.01) | (.02) | (.09) | - | (1.76) |
Total distributions | (.04) | (.07) J | (.12) | - | (1.76) I |
Redemption fees added to paid in capital C,H | - | - | - | - | - |
Net asset value, end of period | $ 10.50 | $ 9.48 | $ 9.54 | $ 7.87 | $ 6.12 |
Total Return A,B | 11.21% | .10% | 23.03% | 28.59% | (63.32)% |
Ratios to Average Net Assets D,G | | | | | |
Expenses before reductions | 2.50% | 2.09% | 1.91% | 1.69% | 2.51% |
Expenses net of fee waivers, if any | 2.40% | 2.09% | 1.91% | 1.69% | 2.41% |
Expenses net of all reductions | 2.39% | 2.07% | 1.90% | 1.64% | 2.38% |
Net investment income (loss) | .10% | .68% F | (.01)% | .25% | (.62)% |
Supplemental Data | | | | | |
Net assets, end of period (000 omitted) | $ 1,966 | $ 2,293 | $ 2,902 | $ 2,799 | $ 2,687 |
Portfolio turnover rate E | 28% | 24% | 49% | 174% | 61% |
A Total returns would have been lower if certain expenses had not been reduced during the applicable periods shown.
B Total returns do not include the effect of the contingent deferred sales charge.
C Calculated based on average shares outstanding during the period.
D Fees and expenses of any underlying Fidelity Central Funds are not included in the Fund's expense ratio. The Fund indirectly bears its proportionate share of the expenses of any underlying Fidelity Central Funds.
E Amount does not include the portfolio activity of any underlying Fidelity Central Funds.
F Investment income per share reflects a large, non-recurring dividend which amounted to $.06 per share. Excluding this non-recurring dividend, the ratio of net investment income (loss) to average net assets would have been .05%.
G Expense ratios reflect operating expenses of the class. Expenses before reductions do not reflect amounts reimbursed by the investment adviser or reductions from brokerage service arrangements or reductions from other expense offset arrangements and do not represent the amount paid by the class during periods when reimbursements or reductions occur. Expenses net of fee waivers reflect expenses after reimbursement by the investment adviser but prior to reductions from brokerage service arrangements or other expense offset arrangements. Expenses net of all reductions represent the net expenses paid by the class.
H Amount represents less than $.01 per share.
I Total distributions of $1.76 per share is comprised of distributions from net realized gain of $1.760 per share.
J Total distributions of $.07 per share is comprised of distributions from net investment income of $.058 and distributions from net realized gain of $.015 per share.
See accompanying notes which are an integral part of the financial statements.
Annual Report
Financial Highlights - Class C
Years ended October 31, | 2012 | 2011 | 2010 | 2009 | 2008 |
Selected Per-Share Data | | | | | |
Net asset value, beginning of period | $ 9.47 | $ 9.53 | $ 7.86 | $ 6.11 | $ 18.63 |
Income from Investment Operations | | | | | |
Net investment income (loss) C | .01 | .07 F | - H | .02 | (.08) |
Net realized and unrealized gain (loss) | 1.04 | (.06) | 1.79 | 1.73 | (10.66) |
Total from investment operations | 1.05 | .01 | 1.79 | 1.75 | (10.74) |
Distributions from net investment income | (.03) | (.06) | (.03) | - | - |
Distributions from net realized gain | (.01) | (.02) | (.09) | - | (1.78) |
Total distributions | (.04) | (.07) J | (.12) | - | (1.78) I |
Redemption fees added to paid in capital C,H | - | - | - | - | - |
Net asset value, end of period | $ 10.48 | $ 9.47 | $ 9.53 | $ 7.86 | $ 6.11 |
Total Return A,B | 11.13% | .10% | 23.06% | 28.64% | (63.32)% |
Ratios to Average Net Assets D,G | | | | | |
Expenses before reductions | 2.50% | 2.09% | 1.91% | 1.68% | 2.51% |
Expenses net of fee waivers, if any | 2.40% | 2.09% | 1.91% | 1.68% | 2.41% |
Expenses net of all reductions | 2.39% | 2.07% | 1.90% | 1.63% | 2.38% |
Net investment income (loss) | .10% | .68% F | (.01)% | .26% | (.62)% |
Supplemental Data | | | | | |
Net assets, end of period (000 omitted) | $ 6,608 | $ 6,900 | $ 8,936 | $ 8,543 | $ 9,497 |
Portfolio turnover rate E | 28% | 24% | 49% | 174% | 61% |
A Total returns would have been lower if certain expenses had not been reduced during the applicable periods shown.
B Total returns do not include the effect of the contingent deferred sales charge.
C Calculated based on average shares outstanding during the period.
D Fees and expenses of any underlying Fidelity Central Funds are not included in the Fund's expense ratio. The Fund indirectly bears its proportionate share of the expenses of any underlying Fidelity Central Funds.
E Amount does not include the portfolio activity of any underlying Fidelity Central Funds.
F Investment income per share reflects a large, non-recurring dividend which amounted to $.06 per share. Excluding this non-recurring dividend, the ratio of net investment income (loss) to average net assets would have been .05%.
G Expense ratios reflect operating expenses of the class. Expenses before reductions do not reflect amounts reimbursed by the investment adviser or reductions from brokerage service arrangements or reductions from other expense offset arrangements and do not represent the amount paid by the class during periods when reimbursements or reductions occur. Expenses net of fee waivers reflect expenses after reimbursement by the investment adviser but prior to reductions from brokerage service arrangements or other expense offset arrangements. Expenses net of all reductions represent the net expenses paid by the class.
H Amount represents less than $.01 per share.
I Total distributions of $1.78 per share is comprised of distributions from net realized gain of $1.775 per share.
J Total distributions of $.07 per share is comprised of distributions from net investment income of $.058 and distributions from net realized gain of $.015 per share.
See accompanying notes which are an integral part of the financial statements.
Annual Report
Financial Highlights - International Small Cap Opportunities
Years ended October 31, | 2012 | 2011 | 2010 | 2009 | 2008 |
Selected Per-Share Data | | | | | |
Net asset value, beginning of period | $ 9.85 | $ 9.92 | $ 8.14 | $ 6.28 | $ 19.09 |
Income from Investment Operations | | | | | |
Net investment income (loss) B | .11 | .17 E | .09 | .08 | .05 |
Net realized and unrealized gain (loss) | 1.07 | (.06) | 1.87 | 1.78 | (10.92) |
Total from investment operations | 1.18 | .11 | 1.96 | 1.86 | (10.87) |
Distributions from net investment income | (.14) | (.14) | (.09) | - G | (.06) |
Distributions from net realized gain | (.01) | (.04) | (.09) | - | (1.88) |
Total distributions | (.15) | (.18) | (.18) | - G | (1.94) H |
Redemption fees added to paid in capital B,G | - | - | - | - | - |
Net asset value, end of period | $ 10.88 | $ 9.85 | $ 9.92 | $ 8.14 | $ 6.28 |
Total Return A | 12.21% | 1.10% | 24.43% | 29.68% | (62.91)% |
Ratios to Average Net Assets C,F | | | | | |
Expenses before reductions | 1.47% | 1.08% | .91% | .68% | 1.44% |
Expenses net of fee waivers, if any | 1.40% | 1.08% | .91% | .68% | 1.44% |
Expenses net of all reductions | 1.39% | 1.06% | .89% | .64% | 1.40% |
Net investment income (loss) | 1.10% | 1.69% E | 1.00% | 1.25% | .36% |
Supplemental Data | | | | | |
Net assets, end of period (000 omitted) | $ 334,918 | $ 328,262 | $ 398,331 | $ 329,128 | $ 312,376 |
Portfolio turnover rate D | 28% | 24% | 49% | 174% | 61% |
A Total returns would have been lower if certain expenses had not been reduced during the applicable periods shown.
B Calculated based on average shares outstanding during the period.
C Fees and expenses of any underlying Fidelity Central Funds are not included in the Fund's expense ratio. The Fund indirectly bears its proportionate share of the expenses of any underlying Fidelity Central Funds.
D Amount does not include the portfolio activity of any underlying Fidelity Central Funds.
E Investment income per share reflects a large, non-recurring dividend which amounted to $.07 per share. Excluding this non-recurring dividend, the ratio of net investment income (loss) to average net assets would have been 1.06%.
F Expense ratios reflect operating expenses of the class. Expenses before reductions do not reflect amounts reimbursed by the investment adviser or reductions from brokerage service arrangements or reductions from other expense offset arrangements and do not represent the amount paid by the class during periods when reimbursements or reductions occur. Expenses net of fee waivers reflect expenses after reimbursement by the investment adviser but prior to reductions from brokerage service arrangements or other expense offset arrangements. Expenses net of all reductions represent the net expenses paid by the class.
G Amount represents less than $.01 per share.
H Total distributions of $1.94 per share is comprised of distributions from net investment income of $.064 and distributions from net realized gain of $1.878 per share.
See accompanying notes which are an integral part of the financial statements.
Annual Report
Financial Highlights - Institutional Class
Years ended October 31, | 2012 | 2011 | 2010 | 2009 | 2008 |
Selected Per-Share Data | | | | | |
Net asset value, beginning of period | $ 9.86 | $ 9.93 | $ 8.14 | $ 6.27 | $ 19.09 |
Income from Investment Operations | | | | | |
Net investment income (loss) B | .11 | .18 E | .09 | .08 | .05 |
Net realized and unrealized gain (loss) | 1.08 | (.06) | 1.86 | 1.79 | (10.92) |
Total from investment operations | 1.19 | .12 | 1.95 | 1.87 | (10.87) |
Distributions from net investment income | (.14) | (.15) | (.07) | - G | (.07) |
Distributions from net realized gain | (.01) | (.04) | (.09) | - | (1.88) |
Total distributions | (.15) | (.19) | (.16) | - G | (1.95) H |
Redemption fees added to paid in capital B,G | - | - | - | - | - |
Net asset value, end of period | $ 10.90 | $ 9.86 | $ 9.93 | $ 8.14 | $ 6.27 |
Total Return A | 12.32% | 1.13% | 24.33% | 29.87% | (62.95)% |
Ratios to Average Net Assets C,F | | | | | |
Expenses before reductions | 1.44% | 1.03% | .90% | .68% | 1.40% |
Expenses net of fee waivers, if any | 1.40% | 1.03% | .90% | .68% | 1.40% |
Expenses net of all reductions | 1.39% | 1.02% | .88% | .64% | 1.37% |
Net investment income (loss) | 1.10% | 1.74% E | 1.01% | 1.25% | .39% |
Supplemental Data | | | | | |
Net assets, end of period (000 omitted) | $ 4,591 | $ 1,395 | $ 2,418 | $ 2,022 | $ 8,117 |
Portfolio turnover rate D | 28% | 24% | 49% | 174% | 61% |
A Total returns would have been lower if certain expenses had not been reduced during the applicable periods shown.
B Calculated based on average shares outstanding during the period.
C Fees and expenses of any underlying Fidelity Central Funds are not included in the Fund's expense ratio. The Fund indirectly bears its proportionate share of the expenses of any underlying Fidelity Central Funds.
D Amount does not include the portfolio activity of any underlying Fidelity Central Funds.
E Investment income per share reflects a large, non-recurring dividend which amounted to $.07 per share. Excluding this non-recurring dividend, the ratio of net investment income (loss) to average net assets would have been 1.11%.
F Expense ratios reflect operating expenses of the class. Expenses before reductions do not reflect amounts reimbursed by the investment adviser or reductions from brokerage service arrangements or reductions from other expense offset arrangements and do not represent the amount paid by the class during periods when reimbursements or reductions occur. Expenses net of fee waivers reflect expenses after reimbursement by the investment adviser but prior to reductions from brokerage service arrangements or other expense offset arrangements. Expenses net of all reductions represent the net expenses paid by the class.
G Amount represents less than $.01 per share.
H Total distributions of $1.95 per share is comprised of distributions from net investment income of $.074 and distributions from net realized gain of $1.878 per share.
See accompanying notes which are an integral part of the financial statements.
Annual Report
Notes to Financial Statements
For the period ended October 31, 2012
1. Organization.
Fidelity International Small Cap Opportunities Fund (the Fund) is a fund of Fidelity Investment Trust (the Trust) and is authorized to issue an unlimited number of shares. The Trust is registered under the Investment Company Act of 1940, as amended (the 1940 Act), as an open-end management investment company organized as a Massachusetts business trust. The Fund offers Class A, Class T, Class C, International Small Cap Opportunities and Institutional Class shares, each of which, along with Class B shares, has equal rights as to assets and voting privileges. Effective after the close of business on September 1, 2010, Class B shares were closed to new accounts and additional purchases, except for exchanges and reinvestments. Each class has exclusive voting rights with respect to matters that affect that class. Class B shares will automatically convert to Class A shares after a holding period of seven years from the initial date of purchase. Investment income, realized and unrealized capital gains and losses, the common expenses of the Fund, and certain fund-level expense reductions, if any, are allocated on a pro-rata basis to each class based on the relative net assets of each class to the total net assets of the Fund. Each class differs with respect to transfer agent and distribution and service plan fees incurred. Certain expense reductions may also differ by class. The Fund's investments in emerging markets can be subject to social, economic, regulatory, and political uncertainties and can be extremely volatile.
2. Investments in Fidelity Central Funds.
The Fund may invest in Fidelity Central Funds, which are open-end investment companies available only to other investment companies and accounts managed by Fidelity Management & Research Company (FMR) and its affiliates. The Fund's Schedule of Investments lists each of the Fidelity Central Funds held as of period end, if any, as an investment of the Fund, but does not include the underlying holdings of each Fidelity Central Fund. As an Investing Fund, the Fund indirectly bears its proportionate share of the expenses of the underlying Fidelity Central Funds.
The Money Market Central Funds seek preservation of capital and current income and are managed by Fidelity Investments Money Management, Inc. (FIMM), an affiliate of FMR.
A complete unaudited list of holdings for each Fidelity Central Fund is available upon request or at the Securities and Exchange Commission (the SEC) web site at www.sec.gov. In addition, the financial statements of the Fidelity Central Funds, which are not covered by the Fund's Report of Independent Registered Public Accounting Firm, are available on the SEC web site or upon request.
Annual Report
Notes to Financial Statements - continued
3. Significant Accounting Policies.
The financial statements have been prepared in conformity with accounting principles generally accepted in the United States of America (GAAP), which require management to make certain estimates and assumptions at the date of the financial statements. Actual results could differ from those estimates. Subsequent events, if any, through the date that the financial statements were issued have been evaluated in the preparation of the financial statements. The following summarizes the significant accounting policies of the Fund:
Security Valuation. Investments are valued as of 4:00 p.m. Eastern time on the last calendar day of the period. In accordance with valuation policies and procedures approved by the Board of Trustees (the Board), the Fund attempts to obtain prices from one or more third party pricing vendors or brokers to value its investments. When current market prices, quotations or rates are not readily available or reliable, securities will be fair valued in good faith by the FMR Fair Value Committee (the Committee), in accordance with procedures adopted by the Fund's Board. Factors used in determining fair value vary by security type and may include market or security specific events. The frequency with which these procedures are used cannot be predicted and they may be utilized to a significant extent. The Committee oversees the Fund's valuation policies and procedures and is responsible for approving and reporting to the Board all fair value determinations.
The Fund categorizes the inputs to valuation techniques used to value its investments into a disclosure hierarchy consisting of three levels as shown below:
Level 1 - quoted prices in active markets for identical investments
Level 2 - other significant observable inputs (including quoted prices for similar investments, interest rates, prepayment speeds, etc.)
Level 3 - unobservable inputs (including the Fund's own assumptions based on the best information available)
Valuation techniques used to value the Fund's investments by major category are as follows:
Equity securities, including restricted securities, for which market quotations are readily available, are valued at the last reported sale price or official closing price as reported by a third party pricing vendor on the primary market or exchange on which they are traded and are categorized as Level 1 in the hierarchy. In the event there were no sales during the day or closing prices are not available, securities are valued at the last quoted bid price or may be valued using the last available price and are generally categorized as Level 2 in the hierarchy. For foreign equity securities, when significant market or security specific events arise, comparisons to the valuation of American Depositary Receipts
Annual Report
3. Significant Accounting Policies - continued
Security Valuation - continued
(ADRs), futures contracts, Exchange-Traded Funds (ETFs) and certain indexes as well as quoted prices for similar securities are used and are categorized as Level 2 in the hierarchy. Utilizing these techniques may result in transfers between Level 1 and Level 2.
Investments in open-end mutual funds, including the Fidelity Central Funds, are valued at their closing net asset value (NAV) each business day and are categorized as Level 1 in the hierarchy.
Changes in valuation techniques may result in transfers in or out of an assigned level within the disclosure hierarchy. Information on transfers between Levels 1 and 2 is included at the end of the Fund's Schedule of Investments.
Foreign Currency Translation. The Fund may use foreign currency contracts to facilitate transactions in foreign-denominated securities. Gains and losses from these transactions may arise from changes in the value of the foreign currency or if the counterparties do not perform under the contracts' terms.
Foreign-denominated assets, including investment securities, and liabilities are translated into U.S. dollars at the exchange rates at period end. Purchases and sales of investment securities, income and dividends received and expenses denominated in foreign currencies are translated into U.S. dollars at the exchange rate in effect on the transaction date. The effects of exchange rate fluctuations on investments are included with the net realized and unrealized gain (loss) on investment securities. Other foreign currency transactions resulting in realized and unrealized gain (loss) are disclosed separately.
Investment Transactions and Income. For financial reporting purposes, the Fund's investment holdings and NAV include trades executed through the end of the last business day of the period. The NAV per share for processing shareholder transactions is calculated as of the close of business of the New York Stock Exchange (NYSE), normally 4:00 p.m. Eastern time and includes trades executed through the end of the prior business day. Gains and losses on securities sold are determined on the basis of identified cost and may include proceeds received from litigation. Dividend income is recorded on the ex-dividend date, except for certain dividends from foreign securities where the ex-dividend date may have passed, which are recorded as soon as the Fund is informed of the ex-dividend date. Non-cash dividends included in dividend income, if any, are recorded at the fair market value of the securities received. Distributions received on securities that represent a return of capital or capital gain are recorded as a reduction of cost of investments and/or as a realized gain. The Fund estimates the components of distributions received that may be considered return of capital distributions or capital
Annual Report
Notes to Financial Statements - continued
3. Significant Accounting Policies - continued
Investment Transactions and Income - continued
gain distributions. Interest income and distributions from the Fidelity Central Funds are accrued as earned. Investment income is recorded net of foreign taxes withheld where recovery of such taxes is uncertain.
Expenses. Expenses directly attributable to a fund are charged to that fund. Expenses attributable to more than one fund are allocated among the respective funds on the basis of relative net assets or other appropriate methods. Expense estimates are accrued in the period to which they relate and adjustments are made when actual amounts are known.
Income Tax Information and Distributions to Shareholders. Each year, the Fund intends to qualify as a regulated investment company under Subchapter M of the Internal Revenue Code, including distributing substantially all of its taxable income and realized gains. As a result, no provision for income taxes is required. As of October 31, 2012, the Fund did not have any unrecognized tax benefits in the financial statements; nor is the Fund aware of any tax positions for which it is reasonably possible that the total amounts of unrecognized tax benefits will significantly change in the next twelve months. The Fund files a U.S. federal tax return, in addition to state and local tax returns as required. A fund's federal income tax returns are subject to examination by the Internal Revenue Service (IRS) for a period of three fiscal years after they are filed. State and local tax returns may be subject to examination for an additional fiscal year depending on the jurisdiction. Foreign taxes are provided for based on the Fund's understanding of the tax rules and rates that exist in the foreign markets in which it invests.
Distributions are declared and recorded on the ex-dividend date. Income dividends and capital gain distributions are declared separately for each class. Income and capital gain distributions are determined in accordance with income tax regulations, which may differ from GAAP.
Capital accounts within the financial statements are adjusted for permanent book-tax differences. These adjustments have no impact on net assets or the results of operations. Temporary book-tax differences will reverse in a subsequent period.
Book-tax differences are primarily due to foreign currency transactions, passive foreign investment companies (PFIC), partnerships, capital loss carryforwards and losses deferred due to wash sales.
Annual Report
3. Significant Accounting Policies - continued
Income Tax Information and Distributions to Shareholders - continued
The federal tax cost of investment securities and unrealized appreciation (depreciation) as of period end were as follows:
Gross unrealized appreciation | $ 83,324,701 |
Gross unrealized depreciation | (15,053,989) |
Net unrealized appreciation (depreciation) on securities and other investments | $ 68,270,712 |
| |
Tax Cost | $ 307,043,033 |
The tax-based components of distributable earnings as of period end were as follows:
Undistributed ordinary income | $ 3,403,046 |
Capital loss carryforward | $ (347,236,330) |
Net unrealized appreciation (depreciation) | $ 68,251,537 |
Capital loss carryforwards are only available to offset future capital gains of the Fund to the extent provided by regulations and may be limited. Under the Regulated Investment Company Modernization Act of 2010 (the Act), the Fund is permitted to carry forward capital losses incurred in taxable years beginning after December 22, 2010 for an unlimited period and such capital losses are required to be used prior to any losses that expire. Capital loss carryforwards were as follows:
Fiscal year of expiration | |
2016 | $ (16,734,422) |
2017 | (330,501,908) |
Total capital loss carryforward | $ (347,236,330) |
The tax character of distributions paid was as follows:
| October 31, 2012 | October 31, 2011 |
Ordinary Income | $ 5,255,999 | $ 7,985,288 |
Short-Term Trading (Redemption) Fees. Shares held by investors in the Fund less than 90 days are subject to a redemption fee equal to 2.00% of the net asset value of shares redeemed. All redemption fees, which reduce the proceeds of the shareholder redemption, are retained by the Fund and accounted for as an addition to paid in capital.
New Accounting Pronouncement. In December 2011, the Financial Accounting Standards Board issued Accounting Standard Update No. 2011-11, Disclosures about Offsetting Assets and Liabilities. The update creates new disclosure requirements
Annual Report
Notes to Financial Statements - continued
3. Significant Accounting Policies - continued
New Accounting Pronouncement - continued
requiring entities to disclose both gross and net information for derivatives and other financial instruments that are either offset in the Statement of Assets and Liabilities or subject to an enforceable master netting arrangement or similar agreement. The disclosure requirements are effective for annual reporting periods beginning on or after January 1, 2013, and interim periods within those annual periods. Management is currently evaluating the impact of the update's adoption on the Fund's financial statement disclosures.
4. Purchases and Sales of Investments.
Purchases and sales of securities, other than short-term securities, aggregated $95,723,212 and $132,775,590, respectively.
5. Fees and Other Transactions with Affiliates.
Management Fee. FMR and its affiliates provide the Fund with investment management related services for which the Fund pays a monthly management fee. The management fee is the sum of an individual fund fee rate that is based on an annual rate of .60% of the Fund's average net assets and an annualized group fee rate that averaged .26% during the period. The group fee rate is based upon the average net assets of all the mutual funds advised by FMR. The group fee rate decreases as assets under management increase and increases as assets under management decrease. In addition, the management fee is subject to a performance adjustment (up to a maximum of ± .20% of the Fund's average net assets over a 36 month performance period). The upward or downward adjustment to the management fee is based on the relative investment performance of International Small Cap Opportunities as compared to an appropriate benchmark index. For the period, the total annual management fee rate, including the performance adjustment, was 1.07% of the Fund's average net assets.
Distribution and Service Plan Fees. In accordance with Rule 12b-1 of the 1940 Act, the Fund has adopted separate Distribution and Service Plans for each class of shares. Certain classes pay Fidelity Distributors Corporation (FDC), an affiliate of FMR, separate Distribution and Service Fees, each of which is based on an annual percentage of each class' average net assets. In addition, FDC may pay financial intermediaries for selling shares of the Fund and providing shareholder support services. For the period,
Annual Report
5. Fees and Other Transactions with Affiliates - continued
Distribution and Service Plan Fees - continued
the Distribution and Service Fee rates, total fees and amounts retained by FDC were as follows:
| Distribution
Fee | Service
Fee | Total Fees | Retained
by FDC |
Class A | -% | .25% | $ 45,023 | $ 324 |
Class T | .25% | .25% | 41,524 | 226 |
Class B | .75% | .25% | 20,873 | 15,685 |
Class C | .75% | .25% | 66,660 | 4,234 |
| | | $ 174,080 | $ 20,469 |
Sales Load. FDC may receive a front-end sales charge of up to 5.75% for selling Class A shares and 3.50% for selling Class T shares, some of which is paid to financial intermediaries for selling shares of the Fund. Depending on the holding period, FDC may receive contingent deferred sales charges levied on Class A, Class T, Class B, and Class C redemptions. The deferred sales charges range from 5.00% to 1.00% for Class B shares, 1.00% for Class C shares, 1.00% for certain purchases of Class A shares and .25% for certain purchases of Class T shares.
For the period, sales charge amounts retained by FDC were as follows:
| Retained
by FDC |
Class A | $ 4,301 |
Class T | 1,534 |
Class B* | 2,943 |
Class C* | 466 |
| $ 9,244 |
* When Class B and Class C shares are initially sold, FDC pays commissions from its own resources to financial intermediaries through which the sales are made.
Transfer Agent Fees. Fidelity Investments Institutional Operations Company, Inc. (FIIOC), an affiliate of FMR, is the transfer, dividend disbursing and shareholder servicing agent for each class of the Fund. FIIOC receives account fees and asset-based fees that vary according to the account size and type of account of the shareholders of the respective classes of the Fund. FIIOC pays for typesetting, printing and mailing of
Annual Report
Notes to Financial Statements - continued
5. Fees and Other Transactions with Affiliates - continued
Transfer Agent Fees - continued
shareholder reports, except proxy statements. For the period, transfer agent fees for each applicable class were as follows:
| Amount | % of
Average
Net Assets |
Class A | $ 54,282 | .30 |
Class T | 26,259 | .32 |
Class B | 6,290 | .30 |
Class C | 20,134 | .30 |
International Small Cap Opportunities | 886,296 | .28 |
Institutional Class | 6,524 | .26 |
| $ 999,785 | |
Accounting and Security Lending Fees. Fidelity Service Company, Inc. (FSC), an affiliate of FMR, maintains the Fund's accounting records. The accounting fee is based on the level of average net assets for each month. Under a separate contract, FSC administers the security lending program. The security lending fee is based on the number and duration of lending transactions.
Brokerage Commissions. The Fund placed a portion of its portfolio transactions with brokerage firms which are affiliates of the investment adviser. The commissions paid to these affiliated firms were $417 for the period.
6. Committed Line of Credit.
The Fund participates with other funds managed by FMR or an affiliate in a $4.25 billion credit facility (the "line of credit") to be utilized for temporary or emergency purposes to fund shareholder redemptions or for other short-term liquidity purposes. The Fund has agreed to pay commitment fees on its pro-rata portion of the line of credit, which amounted to $987 and is reflected in Miscellaneous expenses on the Statement of Operations. During the period, there were no borrowings on this line of credit.
7. Security Lending.
The Fund lends portfolio securities through a lending agent from time to time in order to earn additional income. For equity securities, a lending agent is used and may loan securities to certain qualified borrowers, including Fidelity Capital Markets (FCM), a broker-dealer affiliated with the Fund. On the settlement date of the loan, the Fund
Annual Report
7. Security Lending - continued
receives collateral (in the form of U.S. Treasury obligations, letters of credit and/or cash) against the loaned securities and maintains collateral in an amount not less than 100% of the market value of the loaned securities during the period of the loan. The market value of the loaned securities is determined at the close of business of the Fund and any additional required collateral is delivered to the Fund on the next business day. If the borrower defaults on its obligation to return the securities loaned because of insolvency or other reasons, a fund could experience delays and costs in recovering the securities loaned or in gaining access to the collateral. Any cash collateral received is invested in the Fidelity Securities Lending Cash Central Fund. The value of loaned securities and cash collateral at period end are disclosed on the Fund's Statement of Assets and Liabilities. Security lending income represents the income earned on investing cash collateral, less rebates paid to borrowers and any lending agent fees associated with the loan, plus any premium payments received for lending certain types of securities. Security lending income is presented in the Statement of Operations as a component of income from Fidelity Central Funds. Total security lending income during the period amounted to $123,696 During the period, there were no securities loaned to FCM.
8. Expense Reductions.
FMR voluntarily agreed to reimburse each class to the extent annual operating expenses exceeded certain levels of average net assets as noted in the table below. Some expenses, for example interest expense, including commitment fees, are excluded from this reimbursement.
The following classes were in reimbursement during the period:
| Expense
Limitations | Reimbursement
from adviser |
Class A | 1.65% | $ 17,831 |
Class T | 1.90% | 9,529 |
Class B | 2.40% | 2,107 |
Class C | 2.40% | 6,700 |
International Small Cap Opportunities | 1.40% | 233,896 |
Institutional Class | 1.40% | 1,228 |
| | $ 271,291 |
Many of the brokers with whom FMR places trades on behalf of the Fund provided services to the Fund in addition to trade execution. These services included payments of certain expenses on behalf of the Fund totaling $25,931 for the period. In addition, through arrangements with the Fund's custodian, credits realized as a result of
Annual Report
Notes to Financial Statements - continued
8. Expense Reductions - continued
uninvested cash balances were used to reduce the Fund's expenses. During the period, these credits reduced the Fund's expenses by $5.
9. Distributions to Shareholders.
Distributions to shareholders of each class were as follows:
Years ended October 31, | 2012 | 2011 |
From net investment income | | |
Class A | $ 208,264 | $ 234,699 |
Class T | 69,950 | 95,132 |
Class B | 6,357 | 17,225 |
Class C | 20,258 | 53,555 |
International Small Cap Opportunities | 4,562,121 | 5,789,167 |
Institutional Class | 19,730 | 33,517 |
Total | $ 4,886,680 | $ 6,223,295 |
From net realized gain | | |
Class A | $ 18,763 | $ 81,710 |
Class T | 8,968 | 45,784 |
Class B | 2,355 | 4,543 |
Class C | 7,235 | 13,930 |
International Small Cap Opportunities | 330,589 | 1,606,951 |
Institutional Class | 1,409 | 9,075 |
Total | $ 369,319 | $ 1,761,993 |
10. Share Transactions.
Transactions for each class of shares were as follows:
| Shares | Dollars |
Years ended October 31, | 2012 | 2011 | 2012 | 2011 |
Class A | | | | |
Shares sold | 245,367 | 414,528 | $ 2,443,449 | $ 4,258,719 |
Reinvestment of distributions | 21,375 | 27,655 | 198,575 | 279,266 |
Shares redeemed | (495,775) | (586,134) | (4,923,741) | (5,964,528) |
Net increase (decrease) | (229,033) | (143,951) | $ (2,281,717) | $ (1,426,543) |
Class T | | | | |
Shares sold | 101,299 | 106,538 | $ 986,575 | $ 1,079,217 |
Reinvestment of distributions | 8,148 | 13,404 | 75,201 | 134,702 |
Shares redeemed | (246,162) | (371,432) | (2,450,796) | (3,710,229) |
Net increase (decrease) | (136,715) | (251,490) | $ (1,389,020) | $ (2,496,310) |
Annual Report
10. Share Transactions - continued
| Shares | Dollars |
Years ended October 31, | 2012 | 2011 | 2012 | 2011 |
Class B | | | | |
Shares sold | 3,884 | 6,900 | $ 38,597 | $ 67,544 |
Reinvestment of distributions | 862 | 1,989 | 7,845 | 19,877 |
Shares redeemed | (59,335) | (71,270) | (579,917) | (711,316) |
Net increase (decrease) | (54,589) | (62,381) | $ (533,475) | $ (623,895) |
Class C | | | | |
Shares sold | 69,065 | 80,402 | $ 669,794 | $ 802,688 |
Reinvestment of distributions | 2,800 | 5,984 | 25,455 | 59,727 |
Shares redeemed | (170,268) | (295,393) | (1,664,901) | (2,919,335) |
Net increase (decrease) | (98,403) | (209,007) | $ (969,652) | $ (2,056,920) |
International Small Cap Opportunities | | | | |
Shares sold | 5,283,408 | 4,054,816 | $ 53,067,911 | $ 41,630,046 |
Reinvestment of distributions | 495,697 | 693,159 | 4,634,765 | 7,035,420 |
Shares redeemed | (8,350,807) | (11,579,067) | (84,356,251) | (119,651,010) |
Net increase (decrease) | (2,571,702) | (6,831,092) | $ (26,653,575) | $ (70,985,544) |
Institutional Class | | | | |
Shares sold | 348,073 | 36,278 | $ 3,541,043 | $ 362,488 |
Reinvestment of distributions | 1,709 | 3,294 | 15,997 | 33,471 |
Shares redeemed | (70,045) | (141,623) | (705,927) | (1,476,463) |
Net increase (decrease) | 279,737 | (102,051) | $ 2,851,113 | $ (1,080,504) |
11. Other.
The Fund's organizational documents provide former and current trustees and officers with a limited indemnification against liabilities arising in connection with the performance of their duties to the Fund. In the normal course of business, the Fund may also enter into contracts that provide general indemnifications. The Fund's maximum exposure under these arrangements is unknown as this would be dependent on future claims that may be made against the Fund. The risk of material loss from such claims is considered remote.
Annual Report
To the Trustees of Fidelity Investment Trust and Shareholders of Fidelity International Small Cap Opportunities Fund:
We have audited the accompanying statement of assets and liabilities of Fidelity International Small Cap Opportunities Fund (the Fund), a fund of Fidelity Investment Trust, including the schedule of investments, as of October 31, 2012, and the related statement of operations for the year then ended, the statement of changes in net assets for each of the two years in the period then ended, and the financial highlights for each of the five years in the period then ended. These financial statements and financial highlights are the responsibility of the Fund's management. Our responsibility is to express an opinion on these financial statements and financial highlights based on our audits.
We conducted our audits in accordance with the standards of the Public Company Accounting Oversight Board (United States). Those standards require that we plan and perform the audit to obtain reasonable assurance about whether the financial statements and financial highlights are free of material misstatement. The Fund is not required to have, nor were we engaged to perform, an audit of its internal control over financial reporting. Our audits included consideration of internal control over financial reporting as a basis for designing audit procedures that are appropriate in the circumstances, but not for the purpose of expressing an opinion on the effectiveness of the Fund's internal control over financial reporting. Accordingly, we express no such opinion. An audit also includes examining, on a test basis, evidence supporting the amounts and disclosures in the financial statements, assessing the accounting principles used and significant estimates made by management, as well as evaluating the overall financial statement presentation. Our procedures included confirmation of securities owned as of October 31, 2012, by correspondence with the custodians and brokers; where replies were not received from brokers, we performed other auditing procedures. We believe that our audits provide a reasonable basis for our opinion.
In our opinion, the financial statements and financial highlights referred to above present fairly, in all material respects, the financial position of Fidelity International Small Cap Opportunities Fund as of October 31, 2012, the results of its operations for the year then ended, the changes in its net assets for each of the two years in the period then ended, and the financial highlights for each of the five years in the period then ended, in conformity with accounting principles generally accepted in the United States of America.
DELOITTE & TOUCHE LLP
Boston, Massachusetts
December 14, 2012
Annual Report
The Trustees, Members of the Advisory Board, and executive officers of the trust and fund, as applicable, are listed below. The Board of Trustees governs the fund and is responsible for protecting the interests of shareholders. The Trustees are experienced executives who meet periodically throughout the year to oversee the fund's activities, review contractual arrangements with companies that provide services to the fund, oversee management of the risks associated with such activities and contractual arrangements, and review the fund's performance. Except for James C. Curvey, each of the Trustees oversees 236 funds advised by FMR or an affiliate. Mr. Curvey oversees 443 funds advised by FMR or an affiliate.
The Trustees hold office without limit in time except that (a) any Trustee may resign; (b) any Trustee may be removed by written instrument, signed by at least two-thirds of the number of Trustees prior to such removal; (c) any Trustee who requests to be retired or who has become incapacitated by illness or injury may be retired by written instrument signed by a majority of the other Trustees; and (d) any Trustee may be removed at any special meeting of shareholders by a two-thirds vote of the outstanding voting securities of the trust. Each Trustee who is not an interested person (as defined in the 1940 Act) (Independent Trustee), shall retire not later than the last day of the calendar year in which his or her 75th birthday occurs. The Independent Trustees may waive this mandatory retirement age policy with respect to individual Trustees. The executive officers and Advisory Board Members hold office without limit in time, except that any officer and Advisory Board Member may resign or may be removed by a vote of a majority of the Trustees at any regular meeting or any special meeting of the Trustees. Except as indicated, each individual has held the office shown or other offices in the same company for the past five years.
Experience, Skills, Attributes, and Qualifications of the Fund's Trustees. The Governance and Nominating Committee has adopted a statement of policy that describes the experience, qualifications, attributes, and skills that are necessary and desirable for potential Independent Trustee candidates (Statement of Policy). The Board believes that each Trustee satisfied at the time he or she was initially elected or appointed a Trustee, and continues to satisfy, the standards contemplated by the Statement of Policy. The Governance and Nominating Committee also engages professional search firms to help identify potential Independent Trustee candidates who have the experience, qualifications, attributes, and skills consistent with the Statement of Policy. From time to time, additional criteria based on the composition and skills of the current Independent Trustees, as well as experience or skills that may be appropriate in light of future changes to board composition, business conditions, and regulatory or other developments, have also been considered by the professional search firms and the Governance and Nominating Committee. In addition, the Board takes into account the Trustees' commitment and participation in Board and committee meetings, as well as their leadership of standing and ad hoc committees throughout their tenure.
In determining that a particular Trustee was and continues to be qualified to serve as a Trustee, the Board has considered a variety of criteria, none of which, in isolation, was controlling. The Board believes that, collectively, the Trustees have balanced and diverse experience, qualifications, attributes, and skills, which allow the Board to operate effectively in governing the fund and protecting the interests of shareholders. Information about the specific experience, skills, attributes, and qualifications of each Trustee, which in each case led to the Board's conclusion that the Trustee should serve (or continue to serve) as a trustee of the fund, is provided below.
Annual Report
Board Structure and Oversight Function. James C. Curvey is an interested person (as defined in the 1940 Act) and currently serves as Chairman. The Trustees have determined that an interested Chairman is appropriate and benefits shareholders because an interested Chairman has a personal and professional stake in the quality and continuity of services provided to the fund. Independent Trustees exercise their informed business judgment to appoint an individual of their choosing to serve as Chairman, regardless of whether the Trustee happens to be independent or a member of management. The Independent Trustees have determined that they can act independently and effectively without having an Independent Trustee serve as Chairman and that a key structural component for assuring that they are in a position to do so is for the Independent Trustees to constitute a substantial majority for the Board. The Independent Trustees also regularly meet in executive session. Ned C. Lautenbach serves as Chairman of the Independent Trustees and as such (i) acts as a liaison between the Independent Trustees and management with respect to matters important to the Independent Trustees and (ii) with management prepares agendas for Board meetings.
Fidelity funds are overseen by different Boards of Trustees. The fund's Board oversees Fidelity's equity and high income funds and another Board oversees Fidelity's investment-grade bond, money market, and asset allocation funds. The asset allocation funds may invest in Fidelity funds overseen by the fund's Board. The use of separate Boards, each with its own committee structure, allows the Trustees of each group of Fidelity funds to focus on the unique issues of the funds they oversee, including common research, investment, and operational issues. On occasion, the separate Boards establish joint committees to address issues of overlapping consequences for the Fidelity funds overseen by each Board.
The Trustees operate using a system of committees to facilitate the timely and efficient consideration of all matters of importance to the Trustees, the fund, and fund shareholders and to facilitate compliance with legal and regulatory requirements and oversight of the fund's activities and associated risks. The Board, acting through its committees, has charged FMR and its affiliates with (i) identifying events or circumstances the occurrence of which could have demonstrably adverse effects on the fund's business and/or reputation; (ii) implementing processes and controls to lessen the possibility that such events or circumstances occur or to mitigate the effects of such events or circumstances if they do occur; and (iii) creating and maintaining a system designed to evaluate continuously business and market conditions in order to facilitate the identification and implementation processes described in (i) and (ii) above. Because the day-to-day operations and activities of the fund are carried out by or through FMR, its affiliates and other service providers, the fund's exposure to risks is mitigated but not eliminated by the processes overseen by the Trustees. While each of the Board's committees has responsibility for overseeing different aspects of the fund's activities, oversight is exercised primarily through the Operations, Audit, and Compliance Committees. In addition, the Independent Trustees have worked with FMR to enhance the Board's oversight of investment and financial risks, legal and regulatory risks, technology risks, and operational risks, including the development of additional risk reporting to the Board. For example, a working group comprised of Independent Trustees and FMR has worked and continues to work to review the Fidelity funds' valuation-related activities, reporting and risk management. Appropriate personnel, including but not limited to the fund's Chief Compliance Officer (CCO), FMR's internal auditor, the independent accountants, the fund's Treasurer and portfolio management personnel, make periodic reports to the Board's committees, as appropriate, including an annual review of FMR's risk management program for the Fidelity funds. The responsibilities of each standing committee, including their oversight responsibilities, are described further under "Standing Committees of the Fund's Trustees."
Annual Report
Trustees and Officers - continued
The fund's Statement of Additional Information (SAI) includes more information about the Trustees. To request a free copy, call Fidelity at 1-800-544-8544.
Interested Trustees*:
Correspondence intended for each Trustee who is an interested person may be sent to Fidelity Investments, 82 Devonshire Street, Boston, Massachusetts 02109.
Name, Age; Principal Occupations and Other Relevant Experience+ |
James C. Curvey (77) |
| Year of Election or Appointment: 2007 Mr. Curvey is Trustee and Chairman of the Board of Trustees of certain Trusts. Mr. Curvey also serves as Trustee (2007-present) of other investment companies advised by FMR. Mr. Curvey is a Director of Fidelity Investments Money Management, Inc. (2009-present), Director of Fidelity Research & Analysis Co. (2009-present) and Director of FMR and FMR Co., Inc. (2007-present). Mr. Curvey is also Vice Chairman (2007-present) and Director of FMR LLC. In addition, Mr. Curvey serves as an Overseer for the Boston Symphony Orchestra and a member of the Trustees of Villanova University. Previously, Mr. Curvey was the Vice Chairman (2006-2007) and Director (2000-2007) of FMR Corp. |
Ronald P. O'Hanley (55) |
| Year of Election or Appointment: 2011 Mr. O'Hanley is Director of FMR Co., Inc. (2010-present), Director of Fidelity Investments Money Management, Inc. (2010-present), Director of Fidelity Research & Analysis Company (2010-present), President of Fidelity Asset Management and Corporate Services and a member of Fidelity's Executive Committee (2010-present). Previously, Mr. O'Hanley served as President and Chief Executive Officer of BNY Mellon Asset Management (2007-2010). Mr. O'Hanley also served as Vice Chairman of Bank New York Mellon Corp. and a member of that firm's Executive Committee. Prior to the 2007 merger of The Bank of New York and Mellon Financial Corporation, he was Vice Chairman of Mellon Financial Corporation and President and Chief Executive Officer of Mellon Asset Management. He joined Mellon in February 1997. Mr. O'Hanley currently serves as Chairman of the Boston Public Library Foundation Board of Directors and sits on the Board of Directors of Beth Israel Deaconess Medical Center, the Board of Trustees of the Marine Biological Laboratory and the Advisory Board of the Maxwell School of Citizenship and Public Administration at Syracuse University. Mr. O'Hanley also chairs the Council on Asset Management for the Financial Services Roundtable and is a member of the Board of Directors of Institutional Investor's U.S. Institute. |
* Trustees have been determined to be "Interested Trustees" by virtue of, among other things, their affiliation with the trust or various entities under common control with FMR.
+ The information above includes each Trustee's principal occupation during the last five years and other information relating to the experience, attributes, and skills relevant to each Trustee's qualifications to serve as a Trustee, which led to the conclusion that each Trustee should serve as a Trustee for the fund.
Annual Report
Trustees and Officers - continued
Independent Trustees:
Correspondence intended for each Independent Trustee (that is, the Trustees other than the Interested Trustees) may be sent to Fidelity Investments, P.O. Box 55235, Boston, Massachusetts 02205-5235.
Name, Age; Principal Occupations and Other Relevant Experience+ |
Dennis J. Dirks (64) |
| Year of Election or Appointment: 2005 Prior to his retirement in May 2003, Mr. Dirks was Chief Operating Officer and a member of the Board of The Depository Trust & Clearing Corporation (DTCC). He also served as President, Chief Operating Officer, and Board member of The Depository Trust Company (DTC) and President and Board member of the National Securities Clearing Corporation (NSCC). In addition, Mr. Dirks served as Chief Executive Officer and Board member of the Government Securities Clearing Corporation, Chief Executive Officer and Board member of the Mortgage-Backed Securities Clearing Corporation, as a Trustee and a member of the Finance Committee of Manhattan College (2005-2008), and as a Trustee and a member of the Finance Committee of AHRC of Nassau County (2006-2008). Mr. Dirks is a member of the Independent Directors Council (IDC) Governing Council (2010-present) and Board of Directors for The Brookville Center for Children's Services, Inc. (2009-present). |
Alan J. Lacy (59) |
| Year of Election or Appointment: 2008 Mr. Lacy serves as Senior Adviser (2007-present) of Oak Hill Capital Partners, L.P. (private equity). Mr. Lacy also served as Chief Executive Officer (2000-2005) and Vice Chairman (2005-2006) of Sears Holdings Corporation and Sears, Roebuck and Co. (retail). In addition, Mr. Lacy serves as a member of the Board of Directors of Dave & Buster's Entertainment, Inc. (restaurant and entertainment complexes, 2010-present), Earth Fare, Inc. (retail grocery, 2012-present), The Hillman Companies, Inc. (hardware wholesalers, 2010-present), and Bristol-Myers Squibb Company (global pharmaceuticals, 2008-present). Mr. Lacy is a member of the Board of Trustees of The National Parks Conservation Association (2006-present). Previously, Mr. Lacy served as Chairman of the Board of Trustees of the National Parks Conservation Association (2008-2011) and as a member of the Board of Directors for the Western Union Company (global money transfer, 2006-2011). |
Ned C. Lautenbach (68) |
| Year of Election or Appointment: 2000 Mr. Lautenbach is Chairman of the Independent Trustees of the Equity and High Income Funds (2006-present). Mr. Lautenbach currently serves as the Lead Director of the Eaton Corporation Board of Directors (diversified industrial, 1997-present). Mr. Lautenbach is Chairman of the Board of Directors of the Philharmonic Center for the Arts in Naples, Florida (2012-present) and a member of the Council on Foreign Relations (1994-present). Previously, Mr. Lautenbach was a Partner/Advisory Partner at Clayton, Dubilier & Rice, LLC (private equity investment, 1998-2010), as well as a Director of Sony Corporation (2006-2007). |
Joseph Mauriello (68) |
| Year of Election or Appointment: 2008 Prior to his retirement in January 2006, Mr. Mauriello served in numerous senior management positions including Deputy Chairman and Chief Operating Officer (2004-2005), and Vice Chairman of Financial Services (2002-2004) of KPMG LLP US (professional services, 1965-2005). Mr. Mauriello currently serves as a member of the Board of Directors of XL Group plc. (global insurance and re-insurance, 2006-present). Previously, Mr. Mauriello served as a Director of the Hamilton Funds of the Bank of New York (2006-2007) and of Arcadia Resources Inc. (health care services and products, 2007-2012). |
Robert W. Selander (62) |
| Year of Election or Appointment: 2011 Previously, Mr. Selander served as a Member of the Advisory Board of Fidelity's Equity and High Income Funds (2011), Executive Vice Chairman (2010), Chief Executive Officer (2009-2010), and President and Chief Executive Officer (1997-2009) of Mastercard, Inc. |
Cornelia M. Small (68) |
| Year of Election or Appointment: 2005 Ms. Small is a member of the Board of Directors (2009-present) and Chair of the Investment Committee (2010-present) of the Teagle Foundation. Ms. Small also serves on the Investment Committee of the Berkshire Taconic Community Foundation (2008-present). Previously, Ms. Small served as Chairperson (2002-2008) and a member of the Investment Committee and Chairperson (2008-2012) and a member of the Board of Trustees of Smith College. In addition, Ms. Small served as Chief Investment Officer, Director of Global Equity Investments, and a member of the Board of Directors of Scudder, Stevens & Clark and Scudder Kemper Investments. |
William S. Stavropoulos (73) |
| Year of Election or Appointment: 2001 Mr. Stavropoulos is Vice Chairman of the Independent Trustees of the Equity and High Income Funds (2006-present). Mr. Stavropoulos serves as President and Founder of the Michigan Baseball Foundation, the Great Lakes Loons (2007-present). Mr. Stavropoulos is Chairman Emeritus of the Board of Directors of The Dow Chemical Company, where he previously served in numerous senior management positions, including President, CEO (1995-2000; 2002-2004), Chairman of the Executive Committee (2000-2006), and as a member of the Board of Directors (1990-2006). Currently, Mr. Stavropoulos is a Director of Univar Inc. (global distributor of commodity and specialty chemicals, Chairman from 2010-May 2012 and Lead Director from May 2012-present), Teradata Corporation (data warehousing and technology solutions, 2008-present), Maersk Inc. (industrial conglomerate), and Tyco International, Ltd. (multinational manufacturing and services, 2007-present), and a member of the Advisory Board for Metalmark Capital LLC (private equity investment, 2005-present). Mr. Stavropoulos is an operating advisor to Clayton, Dubilier & Rice, LLC (private equity investment). In addition, Mr. Stavropoulos is a member of the University of Notre Dame Advisory Council for the College of Science, a Trustee of the Rollin L. Gerstacker Foundation, and a Director of the Naples Philharmonic Center for the Arts. Previously, Mr. Stavropoulos served as a Director of Chemical Financial Corporation (bank holding company, 1993-2012). |
David M. Thomas (63) |
| Year of Election or Appointment: 2008 Previously, Mr. Thomas served as Executive Chairman (2005-2006) and Chairman and Chief Executive Officer (2000-2005) of IMS Health, Inc. (pharmaceutical and healthcare information solutions), and a Director of Fortune Brands, Inc. (consumer products, 2000-2011). In addition, Mr. Thomas serves as Non-Executive Chairman of the Board of Directors of Fortune Brands Home and Security (home and security products, 2011-present), and as a member of the Board of Directors of Interpublic Group of Companies, Inc. (marketing communication, 2004-present). |
Michael E. Wiley (62) |
| Year of Election or Appointment: 2008 Mr. Wiley also serves as a Director of Asia Pacific Exploration Consolidated (international oil and gas exploration and production, 2008-present). Mr. Wiley serves as a Director of Tesoro Corporation (independent oil refiner and marketer, 2005-present), and a Director of Bill Barrett Corporation (exploration and production, 2005-present). In addition, Mr. Wiley also serves as a Director of Post Oak Bank (privately-held bank, 2004-present). Previously, Mr. Wiley served as a member of the Board of Trustees of the University of Tulsa (2000-2006; 2007-2010), as a Senior Energy Advisor of Katzenbach Partners, LLC (consulting, 2006-2007), as an Advisory Director of Riverstone Holdings (private investment), Chairman, President, and CEO of Baker Hughes, Inc. (oilfield services, 2000-2004), and as Director of Spinnaker Exploration Company (exploration and production, 2001-2005). |
+ The information above includes each Trustee's principal occupation during the last five years and other information relating to the experience, attributes, and skills relevant to each Trustee's qualifications to serve as a Trustee, which led to the conclusion that each Trustee should serve as a Trustee for the fund.
Advisory Board Members and Executive Officers:
Correspondence intended for David A. Rosow and Garnett A. Smith may be sent to Fidelity Investments, P.O. Box 55235, Boston, Massachusetts 02205-5235. Correspondence intended for each executive officer, Edward C. Johnson 3d, and Peter S. Lynch may be sent to Fidelity Investments, 82 Devonshire Street, Boston, Massachusetts 02109.
Name, Age; Principal Occupation |
Edward C. Johnson 3d (82) |
| Year of Election or Appointment: 2011 Member of the Advisory Board of Fidelity's Equity and High Income Funds. Mr. Johnson serves as Chief Executive Officer, Chairman, and a Director of FMR LLC, and also serves as Chairman and Director of FIL Limited. Previously, Mr. Johnson served as a Trustee and Chairman of the Board of certain Fidelity Trusts, Chairman and a Director of FMR, Chairman and a Director of FMR Co., Inc., and President of FMR LLC (2006-2007). |
Peter S. Lynch (68) |
| Year of Election or Appointment: 2003 Member of the Advisory Board of Fidelity's Equity and High Income Funds. Mr. Lynch is Vice Chairman and a Director of FMR and FMR Co., Inc. In addition, Mr. Lynch serves as a Trustee of Boston College and as the Chairman of the Inner-City Scholarship Fund. Previously, Mr. Lynch served on the Special Olympics International Board of Directors (1997-2006). |
David A. Rosow (70) |
| Year of Election or Appointment: 2012 Member of the Advisory Board of Fidelity's Equity and High Income Funds. Chairman and Chief Executive Officer of International Golf Group, Inc. (golf course development, 1989-present). Previously, Mr. Rosow served as Chairman and Chief Executive Officer of Rosow & Company, Inc. (private investment company, 1989-2011), a Lead Director of Hudson United Bancorp (2001-2006) and as a Director of TD Banknorth (1996-2006). In addition, Mr. Rosow is a member (2008-present) and President (2009-present) of the Town Council of Palm Beach, Florida. |
Garnett A. Smith (65) |
| Year of Election or Appointment: 2012 Member of the Advisory Board of Fidelity's Equity and High Income Funds. Prior to Mr. Smith's retirement, he served as Chairman and Chief Executive Officer of Inbrand Corp. (manufacturer of personal absorbent products, 1990-1997). He also served as President (1986-1990) of Inbrand Corp. Prior to his employment with Inbrand Corp., he was employed by a retail fabric chain and North Carolina National Bank. In addition, Mr. Smith is a board member of the Jackson Hole Land Trust (2009-present). |
Kenneth B. Robins (43) |
| Year of Election or Appointment: 2008 President and Treasurer of Fidelity's Equity and High Income Funds. Mr. Robins also serves as President and Treasurer (2010-present) and Assistant Treasurer (2009-present) of other Fidelity funds and is an employee of Fidelity Investments (2004-present). Previously, Mr. Robins served as Deputy Treasurer of the Fidelity funds (2005-2008) and Treasurer and Chief Financial Officer of The North Carolina Capital Management Trust: Cash and Term Portfolios (2006-2008). |
Bruce T. Herring (47) |
| Year of Election or Appointment: 2006 Vice President of certain Equity Funds. Mr. Herring also serves as President of Fidelity Research & Analysis Company (2010-present), Chief Investment Officer and Director of Fidelity Management & Research (U.K.) Inc. (2010-present) and Group Chief Investment Officer of FMR. Previously, Mr. Herring served as Vice President (2005-2006) and Senior Vice President (2006-2007) of Fidelity Management & Research Company, Vice President of FMR Co., Inc. (2001-2007) and as a portfolio manager for Fidelity U.S. Equity Funds. |
Brian B. Hogan (48) |
| Year of Election or Appointment: 2009 Vice President of Equity and High Income Funds. Mr. Hogan also serves as President of FMR's Equity Division (2009-present). Previously, Mr. Hogan served as Senior Vice President, Equity Research of FMR (2006-2009) and as a portfolio manager. |
Scott C. Goebel (44) |
| Year of Election or Appointment: 2008 Secretary and Chief Legal Officer (CLO) of the Fidelity funds. Mr. Goebel also serves as Secretary of Fidelity Investments Money Management, Inc. (FIMM) (2010-present) and Fidelity Research and Analysis Company (FRAC) (2010-present); Secretary and CLO of The North Carolina Capital Management Trust: Cash and Term Portfolios (2008-present); General Counsel, Secretary, and Senior Vice President of FMR (2008-present) and FMR Co., Inc. (2008-present); employed by FMR LLC or an affiliate (2001-present); Chief Legal Officer of Fidelity Management & Research (Hong Kong) Limited (2008-present) and Assistant Secretary of Fidelity Management & Research (Japan) Inc. (2008-present), and Fidelity Management & Research (U.K.) Inc. (2008-present). Previously, Mr. Goebel served as Assistant Secretary of FIMM (2008-2010), FRAC (2008-2010), and the Funds (2007-2008) and as Vice President and Secretary of Fidelity Distributors Corporation (FDC) (2005-2007). |
William C. Coffey (43) |
| Year of Election or Appointment: 2009 Assistant Secretary of Fidelity's Equity and High Income Funds. Mr. Coffey also serves as Senior Vice President and Deputy General Counsel of FMR LLC (2010-present), and is an employee of Fidelity Investments. Previously, Mr. Coffey served as Vice President and Associate General Counsel of FMR LLC (2005-2009). |
Elizabeth Paige Baumann (44) |
| Year of Election or Appointment: 2012 Anti-Money Laundering (AML) Officer of the Fidelity funds. Ms. Baumann also serves as AML Officer of The North Carolina Capital Management Trust: Cash and Term Portfolios (2012-present), Chief AML Officer of FMR LLC (2012-present), and is an employee of Fidelity Investments. Previously, Ms. Baumann served as Vice President and Deputy Anti-Money Laundering Officer (2007-2012). |
Christine Reynolds (54) |
| Year of Election or Appointment: 2008 Chief Financial Officer of the Fidelity funds. Ms. Reynolds became President of Fidelity Pricing and Cash Management Services (FPCMS) in August 2008. Ms. Reynolds served as Chief Operating Officer of FPCMS (2007-2008). Previously, Ms. Reynolds served as President, Treasurer, and Anti-Money Laundering officer of the Fidelity funds (2004-2007). |
Joseph A. Hanlon (44) |
| Year of Election or Appointment: 2012 Chief Compliance Officer of Fidelity's Equity and High Income Funds. Mr. Hanlon serves as Compliance Officer of FMR, FMR Co., Inc., Fidelity Investments Money Management, Inc. (FIMM), Fidelity Research and Analysis Company (FRAC), Fidelity Management & Research (Japan) Inc., Fidelity Management & Research (U.K.) Inc., Fidelity Management & Research (Hong Kong), and Strategic Advisers, Inc. (2009-present), as Senior Vice President of the Fidelity Asset Management Division (2009-present), and is an employee of Fidelity Investments. |
Joseph F. Zambello (55) |
| Year of Election or Appointment: 2011 Deputy Treasurer of the Fidelity funds. Mr. Zambello is an employee of Fidelity Investments. Previously, Mr. Zambello served as Vice President of FMR's Program Management Group (2009-2011) and Vice President of the Transfer Agent Oversight Group (2005-2009). |
Adrien E. Deberghes (45) |
| Year of Election or Appointment: 2008 Deputy Treasurer of Fidelity's Equity and High Income Funds. Mr. Deberghes also serves as Vice President (2011-present) and Assistant Treasurer (2010-present) of other Fidelity funds, and is an employee of Fidelity Investments (2008-present). Previously, Mr. Deberghes served as Senior Vice President of Mutual Fund Administration at State Street Corporation (2007-2008), Senior Director of Mutual Fund Administration at Investors Bank & Trust (2005-2007), and Director of Finance for Dunkin' Brands (2000-2005). |
Stephen Sadoski (41) |
| Year of Election or Appointment: 2012 Deputy Treasurer of Fidelity's Equity and High Income Funds. Mr. Sadoski also serves as Assistant Treasurer of other Fidelity funds (2012-present) and is an employee of Fidelity Investments (2012-present). Previously, Mr. Sadoski served as an assistant chief accountant in the Division of Investment Management of the Securities and Exchange Commission (SEC) (2009-2012) and as a senior manager at Deloitte & Touche (1997-2009). |
Stephanie J. Dorsey (43) |
| Year of Election or Appointment: 2010 Assistant Treasurer of Fidelity's Equity and High Income Funds. Ms. Dorsey also serves as Deputy Treasurer of other Fidelity funds (2008-present) and is an employee of Fidelity Investments (2008-present). Previously, Ms. Dorsey served as Treasurer (2004-2008) of the JPMorgan Mutual Funds and Vice President (2004-2008) of JPMorgan Chase Bank. |
John R. Hebble (54) |
| Year of Election or Appointment: 2009 Assistant Treasurer of Fidelity's Equity and High Income Funds. Mr. Hebble also serves as President (2011-present), Treasurer, and Chief Financial Officer of The North Carolina Capital Management Trust: Cash and Term Portfolios (2008-present), President and Treasurer of other Fidelity funds (2008-present) and is an employee of Fidelity Investments. |
Gary W. Ryan (54) |
| Year of Election or Appointment: 2005 Assistant Treasurer of the Fidelity funds. Mr. Ryan is an employee of Fidelity Investments. Previously, Mr. Ryan served as Vice President of Fund Reporting in Fidelity Pricing and Cash Management Services (FPCMS) (1999-2005). |
Jonathan Davis (44) |
| Year of Election or Appointment: 2010 Assistant Treasurer of the Fidelity funds. Mr. Davis is also Assistant Treasurer of Fidelity Rutland Square Trust II and Fidelity Commonwealth Trust II. Mr. Davis is an employee of Fidelity Investments. Previously, Mr. Davis served as Vice President and Associate General Counsel of FMR LLC (2003-2010). |
Annual Report
The Board of Trustees of International Small Cap Opportunities Fund voted to pay to shareholders of record at the opening of business on record date, the following distributions per share derived from capital gains realized from sales of portfolio securities, and dividends derived from net investment income:
| Pay Date | Record Date | Dividends | Capital Gains |
International Small Cap Opportunities | 12/10/12 | 12/07/12 | $0.101 | $0.005 |
International Small Cap Opportunities designates 5% of the dividends distributed during the fiscal year as qualifying for the dividends-received deduction for corporate shareholders.
International Small Cap Opportunities designates 98% of the dividends distributed during the fiscal year as amounts which may be taken into account as a dividend for purposes of the maximum rate under section 1(h) (11) of the Internal Revenue Code.
The amounts per share which represent income derived from sources within, and taxes paid to, foreign countries or possessions of the United States are as follows:
| Pay Date | Income | Taxes |
International Small Cap Opportunities | 12/05/11 | $0.158 | $0.0103 |
The fund will notify shareholders in January 2013 of amounts for use in preparing 2012 income tax returns.
Annual Report
Board Approval of Investment Advisory Contracts and Management Fees
Fidelity International Small Cap Opportunities Fund
Each year, the Board of Trustees, including the Independent Trustees (together, the Board), votes on the renewal of the management contract and sub-advisory agreements (together, the Advisory Contracts) for the fund. The Board, assisted by the advice of fund counsel and Independent Trustees' counsel, requests and considers a broad range of information relevant to the renewal of the Advisory Contracts throughout the year.
The Board meets regularly and, at each of its meetings, considers factors that are relevant to its annual consideration of the renewal of the fund's Advisory Contracts, including the services and support provided to the fund and its shareholders. The Board has established various standing committees, each composed of and chaired by Independent Trustees with varying backgrounds, to which the Board has assigned specific subject matter responsibilities in order to enhance effective decision-making by the Board. The Board, acting directly and through its Committees, requests and receives information concerning the annual consideration of the renewal of the fund's Advisory Contracts. The Board also meets as needed to consider matters specifically related to the Board's annual consideration of the renewal of Advisory Contracts. Members of the Board may also meet with trustees of other Fidelity funds through ad hoc joint committees to discuss certain matters relevant to the Fidelity funds.
At its July 2012 meeting, the Board of Trustees, including the Independent Trustees, unanimously determined to renew the fund's Advisory Contracts. In reaching its determination, the Board considered all factors it believed relevant, including (i) the nature, extent, and quality of the services to be provided to the fund and its shareholders (including the investment performance of the fund); (ii) the competitiveness of the fund's management fee and total expense ratio relative to peer funds; (iii) the total costs of the services to be provided by and the profits to be realized by Fidelity from its relationship with the fund; (iv) the extent to which economies of scale exist and would be realized as the fund grows; and (v) whether fee levels reflect these economies of scale, if any, for the benefit of fund shareholders.
In considering whether to renew the Advisory Contracts for the fund, the Board reached a determination, with the assistance of fund counsel and Independent Trustees' counsel and through the exercise of its business judgment, that the renewal of the Advisory Contracts is in the best interests of the fund and its shareholders and that the compensation payable under the Advisory Contracts is fair and reasonable. The Board's decision to renew the Advisory Contracts was not based on any single factor, but rather was based on a comprehensive consideration of all the information provided to the Board at its meetings throughout the year. The Board, in reaching its determination to renew the Advisory Contracts, is aware that shareholders in the fund have a broad range of investment choices available to them, including a wide choice among mutual funds offered by Fidelity's competitors, and that the fund's shareholders, who have the opportunity to review and weigh the disclosure provided by the fund in its prospectus and other public disclosures, have chosen to invest in this fund, managed by Fidelity.
Annual Report
Board Approval of Investment Advisory Contracts and
Management Fees - continued
Nature, Extent, and Quality of Services Provided. The Board considered the staffing within the investment adviser, FMR, and the sub-advisers (together, the Investment Advisers), including the backgrounds of the fund's investment personnel, and also considered the fund's investment objective, strategies, and related investment philosophy. The Independent Trustees also had discussions with senior management of Fidelity's investment operations and investment groups. The Board considered the structure of the portfolio manager compensation program and whether this structure provides appropriate incentives to act in the best interests of the fund.
Resources Dedicated to Investment Management and Support Services. The Board and the Fund Oversight and Research Committees reviewed the general qualifications and capabilities of the Investment Advisers' investment staff, including its size, education, experience, and resources, as well as the Investment Advisers' approach to recruiting, training, managing, and compensating investment personnel. The Board also noted that FMR has continued to increase the resources devoted to non-U.S. offices, including expansion of Fidelity's global investment organization. The Board noted that Fidelity's analysts have extensive resources, tools and capabilities that allow them to conduct sophisticated quantitative and fundamental analysis, as well as credit analysis of issuers, counterparties and guarantors. The Board also believes that Fidelity's investment professionals have sufficient access to global information and data so as to provide competitive investment results over time, and that those professionals also have access to sophisticated tools that permit them to assess portfolio construction and risk and performance attribution characteristics continuously, as well as to transmit new information and research conclusions rapidly around the world. Additionally, in its deliberations, the Board considered the Investment Advisers' trading and risk management capabilities and resources, which are an integral part of the investment management process.
Shareholder and Administrative Services. The Board considered (i) the nature, extent, quality, and cost of advisory, administrative, and shareholder services performed by the Investment Advisers and their affiliates under the Advisory Contracts and under separate agreements covering transfer agency, pricing and bookkeeping, and securities lending services for the fund; (ii) the nature and extent of the supervision of third party service providers, principally custodians and subcustodians; and (iii) the resources devoted to, and the record of compliance with, the fund's compliance policies and procedures. The Board also reviewed the allocation of fund brokerage, including allocations to brokers affiliated with the Investment Advisers, the use of brokerage commissions to pay fund expenses, and the use of "soft" commission dollars to pay for research services.
Annual Report
The Board noted that the growth of fund assets over time across the complex allows Fidelity to reinvest in the development of services designed to enhance the value or convenience of the Fidelity funds as investment vehicles. These services include 24-hour access to account information and market information through telephone representatives and over the Internet, investor education materials and asset allocation tools, and the expanded availability of Fidelity Investor Centers.
Investment in a Large Fund Family. The Board considered the benefits to shareholders of investing in a Fidelity fund, including the benefits of investing in a fund that is part of a large family of funds offering a variety of investment disciplines and providing a large variety of mutual fund investor services. The Board noted that Fidelity had taken, or had made recommendations that resulted in the Fidelity funds taking, a number of actions over the previous year that benefited particular funds, including (i) continuing to dedicate additional resources to investment research and support of the senior management team that oversees asset management; (ii) persisting in efforts to enhance Fidelity's research capabilities, in particular, international research; (iii) launching new funds and making other enhancements to meet client needs for global and income-oriented solutions; (iv) continuing to launch dedicated lower cost underlying funds to meet investment management's portfolio construction needs related to expanding underlying fund options, specifically for the Freedom Fund product lines; (v) adopting a "Stock Selector" sector neutral investment approach and employing a team of portfolio managers who are sector specialists to manage certain funds; (vi) rationalizing product lines and gaining increased efficiencies through the mergers of several funds into other funds; (vii) strengthening the Spartan Index Fund product line by adding new funds and/or new low-cost institutional share classes, restructuring fund expenses to accommodate new classes, and reducing investment minimums for certain classes of shares; (viii) modifying the eligibility criteria for Institutional Class shares to increase their appeal to government entities and charitable investors; and (ix) reducing certain transfer agent fee rates.
Investment Performance. The Board considered whether the fund has operated in accordance with its investment objective, as well as its record of compliance with its investment restrictions. It also reviewed the fund's absolute investment performance for each class, as well as the fund's relative investment performance for each class measured over multiple periods against (i) a broad-based securities market index, and (ii) a peer group of mutual funds deemed appropriate by Fidelity and reviewed by the Board. The following charts considered by the Board show, over the one-, three-, and five-year periods ended December 31, 2011, the cumulative total returns of Institutional Class (Class I) and Class C of the fund, the cumulative total returns of a broad-based securities market index ("benchmark"), and a range of cumulative total returns of a peer group of mutual funds identified by Lipper Inc. as having an investment objective similar to that of the fund. The returns of Institutional Class (Class I) and Class C show the performance of the highest and lowest performing classes, respectively (based on five-year performance). The box within each chart shows the 25th percentile return (top of box) and the 75th percentile return (bottom of box) of the peer group. Returns shown above the box are in the first quartile and returns shown below the box are in the fourth quartile. The percentage beaten numbers noted below each chart correspond to the percentile box and represent the percentage of funds in the peer group whose performance was equal to or lower than that of the class indicated.
Annual Report
Board Approval of Investment Advisory Contracts and
Management Fees - continued
Fidelity International Small Cap Opportunities Fund

The Board reviewed the fund's relative investment performance against its peer group and noted that the performance of Institutional Class (Class I) of the fund was in the first quartile for the one- and three-year periods and the fourth quartile for the five-year period. The Board also noted that the investment performance of Institutional Class (Class I) the fund compared favorably to its benchmark for the one- and three-year periods, although the fund's five-year cumulative total return was lower than its benchmark. The Board considered that the variations in performance among the fund's classes reflect the variations in class expenses, which result in lower performance for higher expense classes. The Board also reviewed the fund's performance since inception as well as performance in the current year.
The Board also considered that the fund's management fee is subject to upward or downward adjustment depending upon whether, and to what extent, the fund's investment performance for the performance period exceeds, or is exceeded by, the record (over the same period) of a Board-approved performance adjustment index. The Board noted that the performance adjustment provides FMR with a strong economic incentive to seek to achieve superior performance for the fund's shareholders and helps to more closely align the interests of FMR and the fund's shareholders.
Annual Report
Based on its review, the Board concluded that the nature, extent, and quality of services provided to the fund under the Advisory Contracts should benefit the fund's shareholders.
Competitiveness of Management Fee and Total Expense Ratio. The Board considered the fund's management fee and total expense ratio compared to "mapped groups" of competitive funds and classes. Fidelity creates "mapped groups" by combining similar Lipper investment objective categories that have comparable management fee characteristics. Combining Lipper investment objective categories aids the Board's management fee and total expense ratio comparisons by broadening the competitive group used for comparison and by reducing the number of universes to which various Fidelity funds are compared.
Management Fee. The Board considered two proprietary management fee comparisons for the 12-month periods shown in the chart below. The group of Lipper funds used by the Board for management fee comparisons is referred to below as the "Total Mapped Group." The Total Mapped Group is broader than the Lipper peer group used by the Board for performance comparisons because the Total Mapped Group combines several Lipper investment objective categories while the Lipper peer group does not. The Total Mapped Group comparison focuses on a fund's standing relative to the total universe of comparable funds available to investors in terms of gross management fees before expense reimbursements or caps, and without giving effect to the fund's performance adjustment. "TMG %" represents the percentage of funds in the Total Mapped Group that had management fees that were lower than the fund's. For example, a TMG % of 19% means that 81% of the funds in the Total Mapped Group had higher management fees than the fund. The "Asset-Size Peer Group" (ASPG) comparison focuses on a fund's standing relative to non-Fidelity funds similar in size to the fund within the Total Mapped Group. The ASPG represents at least 15% of the funds in the Total Mapped Group with comparable asset size and management fee characteristics, subject to a minimum of 50 funds (or all funds in the Total Mapped Group if fewer than 50). Additional information, such as the ASPG quartile in which the fund's management fee ranked and the impact of the fund's performance adjustment, is also included in the chart and considered by the Board.
Annual Report
Board Approval of Investment Advisory Contracts and
Management Fees - continued
Fidelity International Small Cap Opportunities Fund

The Board noted that the fund's management fee ranked below the median of its Total Mapped Group and below the median of its ASPG for 2011. The Board also noted the effect of the fund's negative performance adjustment on the fund's management fee ranking. The Board noted that the performance adjustment for each year represents calculations for performance periods that differ from the periods shown in the performance charts above.
Based on its review, the Board concluded that the fund's management fee is fair and reasonable in light of the services that the fund receives and the other factors considered.
Total Expense Ratio. In its review of each class's total expense ratio, the Board considered the fund's management fee as well as other fund or class expenses, as applicable, such as transfer agent fees, pricing and bookkeeping fees, fund-paid 12b-1 fees, and custodial, legal, and audit fees. The Board also noted the effects of any waivers and reimbursements on fees and expenses, as well as the impact of the fund's performance adjustment. As part of its review, the Board also considered the current and historical total expense ratios of each class of the fund compared to competitive fund median expenses. Each class of the fund is compared to those funds and classes in the Total Mapped Group (used by the Board for management fee comparisons) that have a similar sales load structure.
The Board noted that the total expense ratio of each class ranked below its competitive median for 2011.
Annual Report
Fees Charged to Other Fidelity Clients. The Board also considered Fidelity fee structures and other information with respect to clients of FMR and its affiliates, such as other mutual funds advised or subadvised by FMR or its affiliates, pension plan clients, and other institutional clients. The Board noted the findings of the 2010 ad hoc joint committee (created with the board of other Fidelity funds), which reviewed and compared Fidelity's institutional investment advisory business with its business of providing services to the Fidelity funds, including the differences in services provided, fees charged, and costs incurred, as well as competition in their respective marketplaces.
Based on its review of total expense ratios and fees charged to other Fidelity clients, the Board concluded that the total expense ratio of each class of the fund was reasonable in light of the services that the fund and its shareholders receive and the other factors considered.
Costs of the Services and Profitability. The Board considered the revenues earned and the expenses incurred by Fidelity in conducting the business of developing, marketing, distributing, managing, administering and servicing the fund and its shareholders. The Board also considered the level of Fidelity's profits in respect of all the Fidelity funds.
On an annual basis, FMR presents to the Board Fidelity's profitability for the fund. Fidelity calculates the profitability for each fund, as well as aggregate profitability for groups of Fidelity funds and all Fidelity funds, using a series of detailed revenue and cost allocation methodologies which originate with the books and records of Fidelity on which Fidelity's audited financial statements are based. The Audit Committee of the Board reviews any significant changes from the prior year's methodologies.
PricewaterhouseCoopers LLP (PwC), independent registered public accounting firm and auditor to Fidelity and certain Fidelity funds, has been engaged annually by the Board as part of the Board's assessment of Fidelity's profitability analysis. PwC's engagement includes the review and assessment of Fidelity's methodologies used in determining the revenues and expenses attributable to Fidelity's mutual fund business, and completion of agreed-upon procedures surrounding the mathematical accuracy of fund profitability and its conformity to allocation methodologies. After considering PwC's reports issued under the engagement and information provided by Fidelity, the Board concluded that while other allocation methods may also be reasonable, Fidelity's profitability methodologies are reasonable in all material respects.
The Board also reviewed Fidelity's non-fund businesses and fall-out benefits related to the mutual fund business as well as cases where Fidelity's affiliates may benefit from or be related to the fund's business.
Annual Report
Board Approval of Investment Advisory Contracts and
Management Fees - continued
The Board considered the costs of the services provided by and the profits realized by Fidelity in connection with the operation of the fund and was satisfied that the profitability was not excessive in the circumstances.
Economies of Scale. The Board considered whether there have been economies of scale in respect of the management of the Fidelity funds, whether the Fidelity funds (including the fund) have appropriately benefited from any such economies of scale, and whether there is potential for realization of any further economies of scale. The Board considered the extent to which the fund will benefit from economies of scale through increased services to the fund, through waivers or reimbursements, or through fee or expense reductions. The Board also noted that in 2009, it and the board of other Fidelity funds created an ad hoc committee (the Economies of Scale Committee) to analyze whether FMR attains economies of scale in respect of the management and servicing of the Fidelity funds, whether the Fidelity funds have appropriately benefited from such economies of scale, and whether there is potential for realization of any further economies of scale.
The Board recognized that the fund's management contract incorporates a "group fee" structure, which provides for lower group fee rates as total fund assets under FMR's management increase, and for higher group fee rates as total fund assets under FMR's management decrease. FMR calculates the group fee rates based on a tiered asset "breakpoint" schedule that varies based on asset class. The Board considered that the group fee is designed to deliver the benefits of economies of scale to fund shareholders when total Fidelity fund assets increase, even if assets of any particular fund are unchanged or have declined, because some portion of Fidelity's costs are attributable to services provided to all Fidelity funds, and all funds benefit if those costs can be allocated among more assets. The Board concluded that, given the group fee structure, fund shareholders will benefit from lower management fees as assets under FMR's management increase at the fund complex level, regardless of whether Fidelity achieves any such economies of scale.
The Board concluded, taking into account the analysis of the Economies of Scale Committee, that economies of scale, if any, are being appropriately shared between fund shareholders and Fidelity.
Additional Information Requested by the Board. In order to develop fully the factual basis for consideration of the Fidelity funds' Advisory Contracts, the Board requested and received additional information on certain topics, including (i) fund performance trends, actions to be taken by FMR to improve certain funds' overall performance, and Fidelity's long-term strategies for certain funds; (ii) the potential to further rationalize the Fidelity fund lineup with the possibility of achieving savings for the funds and Fidelity; (iii) Fidelity's compensation structure for portfolio managers and other key investment personnel; (iv) the amount of the investment that each portfolio manager has made in the Fidelity fund(s) that he or she manages; (v) the realization of fall-out benefits in certain Fidelity business units; (vi) Fidelity's group fee structures, the potential impact of regulatory changes on such structures, and the rationale for the individual fee rates of certain funds; (vii) fund profitability methodology, including Fidelity's cost allocation methodology, and the impact of certain factors on fund profitability results; (viii) trends regarding industry use of performance fee structures and the possibility of implementing performance fee structures for additional funds; and (ix) the impact of net redemptions from the Fidelity funds.
Annual Report
Based on its evaluation of all of the conclusions noted above, and after considering all factors it believed relevant, the Board ultimately concluded that the advisory fee structures are fair and reasonable, and that the fund's Advisory Contracts should be renewed.
Annual Report
Investment Adviser
Fidelity Management & Research Company
Boston, MA
Investment Sub-Advisers
FMR Co., Inc.
Fidelity Management & Research
(Hong Kong) Limited
Fidelity Management & Research
(Japan) Inc.
Fidelity Management & Research
(U.K.) Inc.
FIL Investments (Japan) Limited
FIL Investment Advisors
FIL Investment Advisors (U.K.) Limited
General Distributor
Fidelity Distributors Corporation
Smithfield, RI
Transfer and Service Agents
Fidelity Investments Institutional
Operations Company, Inc.
Boston, MA
Fidelity Service Company, Inc.
Boston, MA
Custodian
The Northern Trust Company
Chicago, IL
The Fidelity Telephone Connection
Mutual Fund 24-Hour Service
Exchanges/Redemptions
and Account Assistance 1-800-544-6666
Product Information 1-800-544-6666
Retirement Accounts 1-800-544-4774
(8 a.m. - 9 p.m.)
TDD Service 1-800-544-0118
for the deaf and hearing impaired
(9 a.m. - 9 p.m. Eastern time)
Fidelity Automated Service
Telephone (FAST®) (automated graphic)
1-800-544-5555
(automated graphic)
Automated line for quickest service
(Fidelity Investment logo)(registered trademark)
Corporate Headquarters
82 Devonshire St., Boston, MA 02109
www.fidelity.com
ILS-UANN-1212
1.815061.108
(Fidelity Investment logo)(registered trademark)
Fidelity Advisor®
International Small Cap Opportunities
Fund - Class A, Class T, Class B
and Class C
Annual Report
October 31, 2012
(Fidelity Cover Art)
Class A, Class T, Class B
and Class C are classes of
Fidelity® International
Small Cap Opportunities Fund
Contents
Performance | (Click Here) | How the fund has done over time. |
Management's Discussion of Fund Performance | (Click Here) | The Portfolio Manager's review of fund performance and strategy. |
Shareholder Expense Example | (Click Here) | An example of shareholder expenses. |
Investment Changes | (Click Here) | A summary of major shifts in the fund's investments over the past six months. |
Investments | (Click Here) | A complete list of the fund's investments with their market values. |
Financial Statements | (Click Here) | Statements of assets and liabilities, operations, and changes in net assets, as well as financial highlights. |
Notes | (Click Here) | Notes to the financial statements. |
Report of Independent Registered Public Accounting Firm | (Click Here) | |
Trustees and Officers | (Click Here) | |
Distributions | (Click Here) | |
Board Approval of Investment Advisory Contracts and Management Fees | (Click Here) | |
To view a fund's proxy voting guidelines and proxy voting record for the 12-month period ended June 30, visit http://www.fidelity.com/proxyvotingresults or visit the Securities and Exchange Commission's (SEC) web site at http://www.sec.gov. You may also call 1-877-208-0098 to request a free copy of the proxy voting guidelines.
Standard & Poor's, S&P and S&P 500 are registered service marks of The McGraw-Hill Companies, Inc. and have been licensed for use by Fidelity Distributors Corporation.
Other third party marks appearing herein are the property of their respective owners.
All other marks appearing herein are registered or unregistered trademarks or service marks of FMR LLC or an affiliated company. © 2012 FMR LLC. All rights reserved.
Annual Report
This report and the financial statements contained herein are submitted for the general information of the shareholders of the fund. This report is not authorized for distribution to prospective investors in the fund unless preceded or accompanied by an effective prospectus.
A fund files its complete schedule of portfolio holdings with the SEC for the first and third quarters of each fiscal year on Form N-Q. Forms N-Q are available on the SEC's web site at http://www.sec.gov. A fund's Forms N-Q may be reviewed and copied at the SEC's Public Reference Room in Washington, DC. Information regarding the operation of the SEC's Public Reference Room may be obtained by calling 1-800-SEC-0330. For a complete list of a fund's portfolio holdings, view the most recent holdings listing, semiannual report, or annual report on Fidelity's web site at http://www.fidelity.com, http://www.advisor.fidelity.com, or http://www.401k.com, as applicable.
NOT FDIC INSURED • MAY LOSE VALUE • NO BANK GUARANTEE
Neither the fund nor Fidelity Distributors Corporation is a bank.
Annual Report
Average annual total return reflects the change in the value of an investment, assuming reinvestment of the class' distributions from dividend income and capital gains (the profits earned upon the sale of securities that have grown in value, if any) and assuming a constant rate of performance each year. The $10,000 table and the fund's returns do not reflect the deduction of taxes that a shareholder would pay on fund distributions or the redemption of fund shares. During periods of reimbursement by Fidelity, a fund's total return will be greater than it would be had the reimbursement not occurred. How a fund did yesterday is no guarantee of how it will do tomorrow. Returns reflect the conversion of Class B shares to Class A shares after a maximum of seven years.
Average Annual Total Returns
Periods ended October 31, 2012 | Past 1
year | Past 5
years | Life of
fundA |
Class A (incl. 5.75% sales charge) | 5.56% | -8.77% | 2.54% |
Class T (incl. 3.50% sales charge) | 7.81% | -8.57% | 2.60% |
Class B (incl. contingent deferred sales charge) B | 6.21% | -8.69% | 2.60% |
Class C (incl. contingent deferred sales charge) C | 10.13% | -8.37% | 2.59% |
A From August 2, 2005.
B Class B shares' contingent deferred sales charges included in the past one year, past five years, and life of fund total return figures are 5%, 2%, and 0%, respectively.
C Class C shares' contingent deferred sales charge included in the past one year, past five years, and life of fund total return figures are 1%, 0%, and 0%, respectively.
Annual Report
$10,000 Over Life of Fund
Let's say hypothetically that $10,000 was invested in Fidelity Advisor® International Small Cap Opportunities Fund - Class A on August 2, 2005, when the fund started, and the current 5.75% sales charge was paid. The chart shows how the value of your investment would have changed, and also shows how the MSCI® EAFE® Small Cap Index performed over the same period.
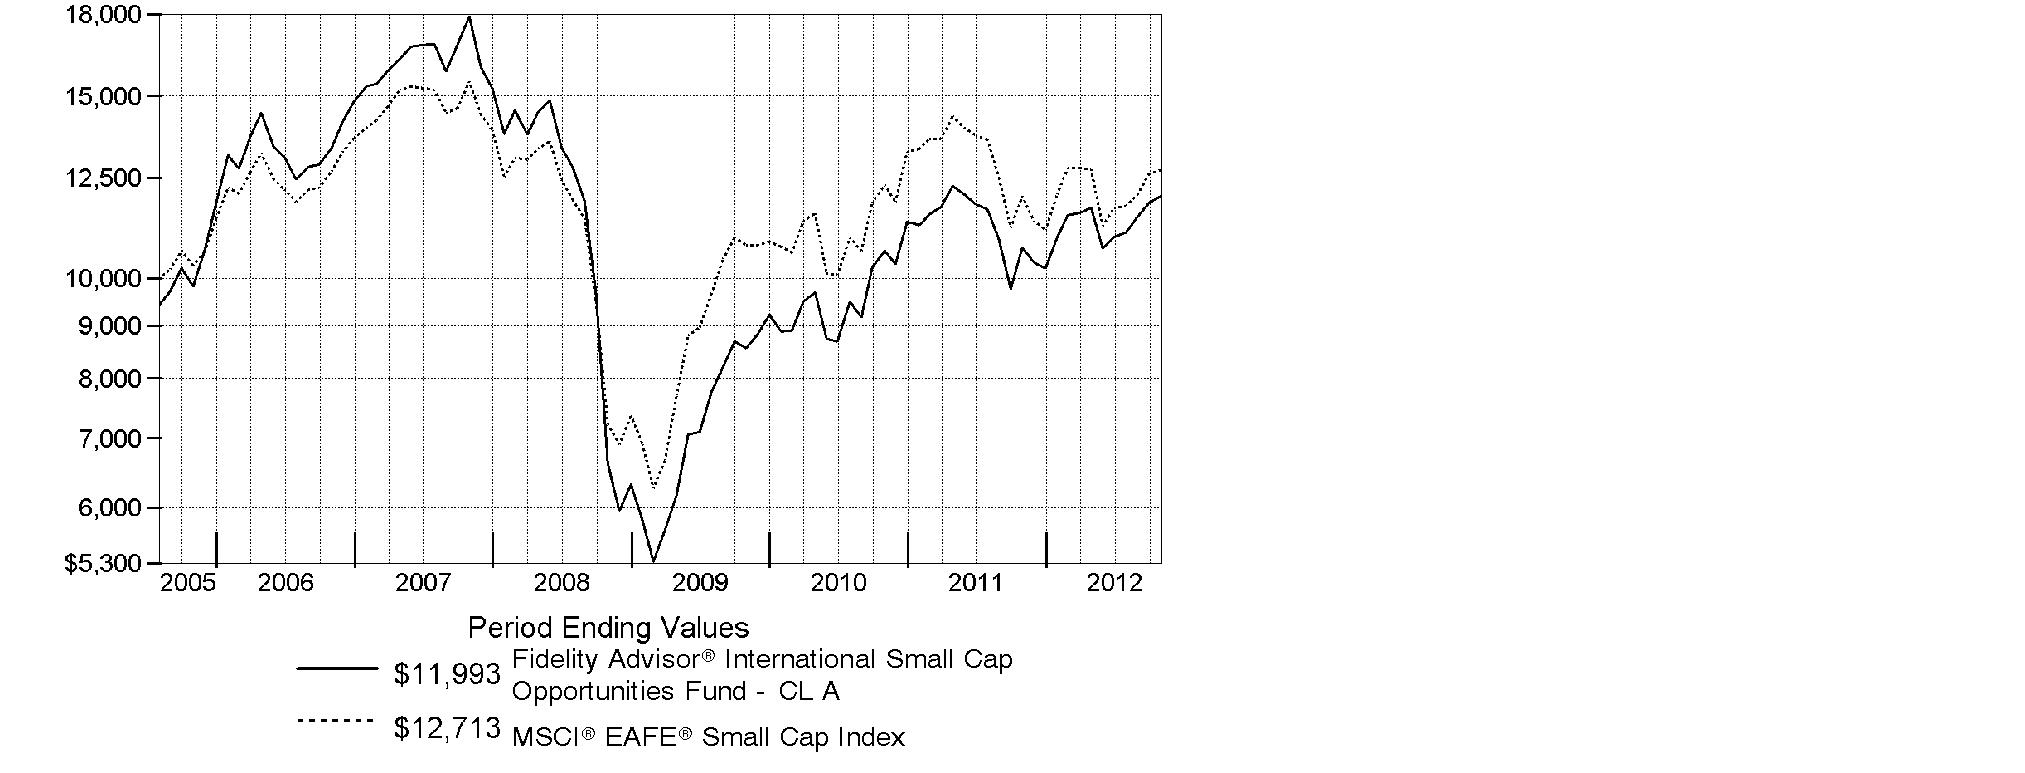
Annual Report
Market Recap: International stocks experienced pendulum-like swings during the 12 months ending October 31, 2012, finishing the period with a modest advance. The market faced periodic bouts of volatility this past year, as a number of macroeconomic concerns - including the eurozone debt crisis, the strength and pace of the U.S. economic recovery, and a slowdown in China's once-blistering growth - dominated headlines and weighed on investors. While a stronger U.S. dollar provided an additional head wind, foreign developed- and emerging-markets stocks still managed a gain for the 12 months, as the MSCI® ACWI® (All Country World Index) ex USA Index rose 4.11%, largely buttressed in the summertime by pledges of accommodative monetary action from eurozone officials, as well as signs that the U.S. housing market was on the mend. Within the index, Asia-Pacific ex Japan showed the most impressive gains, advancing roughly 11%. A number of core European components, most notably Germany (+11%), Switzerland (+10%) and the U.K. (+9%), benefited from optimism about the eurozone's ability to resolve its debt woes, which also helped the region outpace the index overall. Elsewhere, results from Canada (+3%) and the generally more volatile emerging markets (+2%) each fell short of the MSCI index, while Japan was among the few benchmark constituents to finish in the red, returning about -3%.
Comments from Jed Weiss, Portfolio Manager of Fidelity Advisor® International Small Cap Opportunities Fund: For the year, the fund's Class A, Class T, Class B and Class C shares returned 12.00%, 11.72%, 11.21% and 11.13%, respectively (excluding sales charges), easily outpacing the 5.99% advance of the benchmark MSCI® EAFE® Small Cap Index. Security selection in emerging markets and Japan was very helpful. An out-of-benchmark allocation to globally oriented U.S.-based stocks also contributed to relative performance, while stock picking in Canada hurt. In sector terms, security selection helped in consumer discretionary, materials, industrials and financials, while energy and telecommunication services were detractors. The top individual contributor was Cymer, a U.S. laser manufacturer that gained sharply after in October after agreeing to be acquired by ASML Holding. Unite Group, a U.K.-based owner of student housing properties, added value, while better housing data lifted shares of U.S. carpet manufacturer Mohawk Industries and building products company James Hardie Industries, incorporated in Ireland and listed in Australia. In contrast, Austrian lighting company Zumtobel was hurt by weakness in its lighting-components business. Other disappointments were Nippon Thompson, a Japanese maker of linear motion guides, and Brazilian chemicals maker Braskem. Most of the names I've mentioned were not in the index, and I sold Braskem before period end.
The views expressed above reflect those of the portfolio manager(s) only through the end of the period as stated on the cover of this report and do not necessarily represent the views of Fidelity or any other person in the Fidelity organization. Any such views are subject to change at any time based upon market or other conditions and Fidelity disclaims any responsibility to update such views. These views may not be relied on as investment advice and, because investment decisions for a Fidelity fund are based on numerous factors, may not be relied on as an indication of trading intent on behalf of any Fidelity fund.
Annual Report
Shareholder Expense Example
As a shareholder of the Fund, you incur two types of costs: (1) transaction costs, including sales charges (loads) on purchase payments or redemption proceeds, redemption fees and (2) ongoing costs, including management fees, distribution and/or service (12b-1) fees and other Fund expenses. This Example is intended to help you understand your ongoing costs (in dollars) of investing in the Fund and to compare these costs with the ongoing costs of investing in other mutual funds.
The Example is based on an investment of $1,000 invested at the beginning of the period and held for the entire period (May 1, 2012 to October 31, 2012).
Actual Expenses
The first line of the accompanying table for each class of the Fund provides information about actual account values and actual expenses. You may use the information in this line, together with the amount you invested, to estimate the expenses that you paid over the period. Simply divide your account value by $1,000.00 (for example, an $8,600 account value divided by $1,000.00 = 8.6), then multiply the result by the number in the first line for a class of the Fund under the heading entitled "Expenses Paid During Period" to estimate the expenses you paid on your account during this period. A small balance maintenance fee of $12.00 that is charged once a year may apply for certain accounts with a value of less than $2,000. This fee is not included in the table below. If it was, the estimate of expenses you paid during the period would be higher, and your ending account value lower, by this amount. In addition, the Fund, as a shareholder in the underlying Fidelity Central Funds, will indirectly bear its pro-rata share of the fees and expenses incurred by the underlying Fidelity Central Funds. These fees and expenses are not included in the Fund's annualized expense ratio used to calculate the expense estimate in the table below.
Hypothetical Example for Comparison Purposes
The second line of the accompanying table for each class of the Fund provides information about hypothetical account values and hypothetical expenses based on a Class' actual expense ratio and an assumed rate of return of 5% per year before expenses, which is not the Class' actual return. The hypothetical account values and expenses may not be used to estimate the actual ending account balance or expenses you paid for the period. You may use this information to compare the ongoing costs of investing in the Fund and other funds. To do so, compare this 5% hypothetical example with the 5% hypothetical examples that appear in the shareholder reports of the other funds. A small balance maintenance fee of $12.00 that is charged once a year may apply for certain accounts with a value of less than $2,000. This fee is not included in the table below. If it was, the estimate of expenses you paid during the period would be higher, and your ending account value lower, by this amount. In addition, the Fund, as a shareholder in the underlying Fidelity Central Funds, will indirectly bear its pro-rata share of the fees and expenses incurred by the underlying Fidelity Central Funds. These fees and expenses are not included in the Fund's annualized expense ratio used to calculate the expense estimate in the table below.
Please note that the expenses shown in the table are meant to highlight your ongoing costs only and do not reflect any transaction costs. Therefore, the second line of the table is useful in comparing ongoing costs only, and will not help you determine the relative total costs of owning different funds. In addition, if these transactional costs were included, your costs would have been higher.
Annual Report
| Annualized
Expense Ratio | Beginning
Account Value
May 1, 2012 | Ending
Account Value
October 31, 2012 | Expenses Paid
During Period*
May 1, 2012
to October 31, 2012 |
Class A | 1.65% | | | |
Actual | | $ 1,000.00 | $ 1,025.70 | $ 8.40 |
Hypothetical A | | $ 1,000.00 | $ 1,016.84 | $ 8.36 |
Class T | 1.90% | | | |
Actual | | $ 1,000.00 | $ 1,024.90 | $ 9.67 |
Hypothetical A | | $ 1,000.00 | $ 1,015.58 | $ 9.63 |
Class B | 2.40% | | | |
Actual | | $ 1,000.00 | $ 1,022.40 | $ 12.20 |
Hypothetical A | | $ 1,000.00 | $ 1,013.07 | $ 12.14 |
Class C | 2.40% | | | |
Actual | | $ 1,000.00 | $ 1,022.40 | $ 12.20 |
Hypothetical A | | $ 1,000.00 | $ 1,013.07 | $ 12.14 |
International Small Cap Opportunities | 1.40% | | | |
Actual | | $ 1,000.00 | $ 1,027.40 | $ 7.13 |
Hypothetical A | | $ 1,000.00 | $ 1,018.10 | $ 7.10 |
Institutional Class | 1.40% | | | |
Actual | | $ 1,000.00 | $ 1,028.30 | $ 7.14 |
Hypothetical A | | $ 1,000.00 | $ 1,018.10 | $ 7.10 |
A 5% return per year before expenses
* Expenses are equal to each Class' annualized expense ratio, multiplied by the average account value over the period, multiplied by 184/366 (to reflect the one-half year period).
Annual Report
Investment Changes (Unaudited)
Geographic Diversification (% of fund's net assets) |
As of October 31, 2012 |
 | Japan 21.1% | |
 | United Kingdom 19.2% | |
 | United States of America 16.6% | |
 | Germany 4.8% | |
 | Canada 3.5% | |
 | France 3.0% | |
 | Turkey 2.8% | |
 | Sweden 2.5% | |
 | Brazil 2.5% | |
| Other 24.0% | |

Percentages are based on country or territory of incorporation and are adjusted for the effect of futures contracts, if applicable. |
As of April 30, 2012 |
| Japan 21.1% | |
| United States of America 17.8% | |
| United Kingdom 17.5% | |
| Germany 4.7% | |
| France 3.1% | |
| Canada 2.9% | |
| Brazil 2.9% | |
| South Africa 2.6% | |
| Sweden 2.5% | |
| Other 24.9% | |

Percentages are based on country or territory of incorporation and are adjusted for the effect of futures contracts, if applicable. |
Asset Allocation |
| % of fund's
net assets | % of fund's net assets
6 months ago |
Stocks | 96.1 | 94.5 |
Short-Term Investments and Net Other Assets (Liabilities) | 3.9 | 5.5 |
Top Ten Stocks as of October 31, 2012 |
| % of fund's
net assets | % of fund's net assets
6 months ago |
PriceSmart, Inc. (United States of America, Food & Staples Retailing) | 2.5 | 2.5 |
USS Co. Ltd. (Japan, Specialty Retail) | 2.0 | 2.0 |
Andritz AG (Austria, Machinery) | 1.6 | 1.5 |
Unite Group PLC (United Kingdom, Real Estate Management & Development) | 1.5 | 1.2 |
Kobayashi Pharmaceutical Co. Ltd. (Japan, Personal Products) | 1.5 | 1.4 |
Spirax-Sarco Engineering PLC (United Kingdom, Machinery) | 1.5 | 1.7 |
Prosegur Compania de Seguridad SA (Reg.) (Spain, Commercial Services & Supplies) | 1.4 | 1.4 |
Coca-Cola Icecek A/S (Turkey, Beverages) | 1.4 | 1.0 |
Interpump Group SpA (Italy, Machinery) | 1.3 | 1.3 |
Meggitt PLC (United Kingdom, Aerospace & Defense) | 1.3 | 1.3 |
| 16.0 | |
Market Sectors as of October 31, 2012 |
| % of fund's
net assets | % of fund's net assets
6 months ago |
Industrials | 24.0 | 23.0 |
Consumer Discretionary | 18.6 | 19.1 |
Financials | 14.0 | 14.7 |
Consumer Staples | 12.6 | 12.1 |
Materials | 9.7 | 9.5 |
Information Technology | 7.6 | 7.7 |
Health Care | 5.1 | 4.9 |
Energy | 4.5 | 3.5 |
Annual Report
Investments October 31, 2012
Showing Percentage of Net Assets
Common Stocks - 95.4% |
| Shares | | Value |
Australia - 1.0% |
Ramsay Health Care Ltd. | 66,365 | | $ 1,636,831 |
Sydney Airport unit | 637,981 | | 2,245,048 |
TOTAL AUSTRALIA | | 3,881,879 |
Austria - 2.1% |
Andritz AG | 101,600 | | 6,119,580 |
Zumtobel AG | 157,681 | | 1,684,690 |
TOTAL AUSTRIA | | 7,804,270 |
Bailiwick of Jersey - 1.6% |
Informa PLC | 588,230 | | 3,798,923 |
Randgold Resources Ltd. sponsored ADR | 18,300 | | 2,188,497 |
TOTAL BAILIWICK OF JERSEY | | 5,987,420 |
Belgium - 1.6% |
Gimv NV | 55,410 | | 2,678,156 |
Umicore SA | 62,474 | | 3,206,232 |
TOTAL BELGIUM | | 5,884,388 |
Bermuda - 1.0% |
GP Investments Ltd. (depositary receipt) (a) | 357,600 | | 825,752 |
Lazard Ltd. Class A | 32,899 | | 969,205 |
Trinity Ltd. | 2,704,000 | | 1,894,532 |
TOTAL BERMUDA | | 3,689,489 |
Brazil - 1.8% |
Arezzo Industria e Comercio SA | 108,700 | | 1,940,068 |
Banco Pine SA | 242,285 | | 1,693,925 |
Iguatemi Empresa de Shopping Centers SA | 89,400 | | 1,135,629 |
Multiplan Empreendimentos Imobiliarios SA | 63,600 | | 1,863,174 |
TOTAL BRAZIL | | 6,632,796 |
British Virgin Islands - 0.2% |
Gem Diamonds Ltd. (a) | 346,495 | | 943,576 |
Canada - 3.5% |
Agnico-Eagle Mines Ltd. (Canada) | 22,960 | | 1,296,335 |
Baytex Energy Corp. (d) | 21,900 | | 996,601 |
Copper Mountain Mining Corp. (a) | 206,100 | | 833,686 |
Eldorado Gold Corp. | 123,100 | | 1,819,230 |
Fairfax Financial Holdings Ltd. (sub. vtg.) | 4,790 | | 1,776,964 |
Open Text Corp. (a) | 30,200 | | 1,623,165 |
Painted Pony Petroleum Ltd. Class A (a) | 99,100 | | 1,071,620 |
Common Stocks - continued |
| Shares | | Value |
Canada - continued |
Pason Systems, Inc. | 114,900 | | $ 1,871,763 |
Petrominerales Ltd. | 101,379 | | 813,062 |
TAG Oil Ltd. (a) | 148,400 | | 1,040,100 |
TOTAL CANADA | | 13,142,526 |
Cayman Islands - 0.3% |
Vantage Drilling Co. (a) | 525,331 | | 966,609 |
Denmark - 0.2% |
William Demant Holding A/S (a) | 10,433 | | 897,310 |
Finland - 1.9% |
Nokian Tyres PLC | 88,600 | | 3,674,844 |
Outotec Oyj | 68,900 | | 3,355,179 |
TOTAL FINLAND | | 7,030,023 |
France - 3.0% |
Laurent-Perrier Group | 28,463 | | 2,427,515 |
Remy Cointreau SA | 27,273 | | 2,828,699 |
Saft Groupe SA | 79,819 | | 1,774,812 |
Vetoquinol SA | 37,895 | | 1,267,234 |
Virbac SA | 16,000 | | 2,789,315 |
TOTAL FRANCE | | 11,087,575 |
Germany - 4.8% |
alstria office REIT-AG | 170,500 | | 2,059,218 |
Bilfinger Berger AG | 36,659 | | 3,586,950 |
CompuGROUP Holding AG | 109,908 | | 1,994,402 |
CTS Eventim AG | 137,426 | | 4,079,056 |
Fielmann AG | 36,437 | | 3,546,809 |
Software AG (Bearer) | 65,781 | | 2,635,450 |
TOTAL GERMANY | | 17,901,885 |
India - 0.7% |
Jyothy Laboratories Ltd. | 817,354 | | 2,694,131 |
Ireland - 1.4% |
FBD Holdings PLC | 82,200 | | 1,028,145 |
James Hardie Industries NV: | | | |
CDI | 35,000 | | 335,342 |
sponsored ADR (d) | 83,775 | | 4,028,740 |
TOTAL IRELAND | | 5,392,227 |
Israel - 0.9% |
Azrieli Group | 70,005 | | 1,562,817 |
Common Stocks - continued |
| Shares | | Value |
Israel - continued |
Ituran Location & Control Ltd. | 131,286 | | $ 1,622,695 |
Strauss Group Ltd. | 23,244 | | 262,626 |
TOTAL ISRAEL | | 3,448,138 |
Italy - 2.1% |
Azimut Holding SpA | 253,073 | | 3,204,761 |
Interpump Group SpA | 640,443 | | 4,864,446 |
TOTAL ITALY | | 8,069,207 |
Japan - 21.1% |
Air Water, Inc. | 76,000 | | 952,023 |
Aozora Bank Ltd. | 813,000 | | 2,291,432 |
Asahi Co. Ltd. (d) | 106,500 | | 1,603,570 |
Autobacs Seven Co. Ltd. | 99,200 | | 4,069,648 |
Azbil Corp. | 68,200 | | 1,395,097 |
Cosmos Pharmaceutical Corp. | 14,300 | | 1,409,758 |
Daikoku Denki Co. Ltd. | 32,800 | | 829,964 |
Daikokutenbussan Co. Ltd. | 121,200 | | 3,853,258 |
FCC Co. Ltd. | 176,500 | | 3,172,711 |
Fields Corp. | 59,200 | | 851,329 |
GCA Savvian Group Corp. | 1,309 | | 1,554,468 |
Glory Ltd. | 93,000 | | 2,257,723 |
Goldcrest Co. Ltd. | 106,940 | | 1,608,856 |
Iwatsuka Confectionary Co. Ltd. | 26,500 | | 991,883 |
Kamigumi Co. Ltd. | 207,000 | | 1,669,899 |
Kobayashi Pharmaceutical Co. Ltd. | 106,300 | | 5,612,608 |
Kyoto Kimono Yuzen Co. Ltd. | 123,300 | | 1,490,474 |
Meiko Network Japan Co. Ltd. | 104,500 | | 1,060,316 |
Miraial Co. Ltd. | 39,200 | | 746,386 |
Nabtesco Corp. | 108,100 | | 2,012,233 |
Nagaileben Co. Ltd. | 125,700 | | 1,845,427 |
Nihon M&A Center, Inc. | 127,200 | | 3,816,159 |
Nihon Parkerizing Co. Ltd. | 181,000 | | 2,732,118 |
Nippon Seiki Co. Ltd. | 186,000 | | 1,787,073 |
Nippon Thompson Co. Ltd. | 460,000 | | 1,590,380 |
NS Tool Co., Ltd. | 4,400 | | 74,959 |
Obic Co. Ltd. | 10,130 | | 2,084,879 |
Osaka Securities Exchange Co. Ltd. | 178 | | 663,347 |
OSG Corp. | 173,600 | | 2,272,479 |
Seven Bank Ltd. | 1,158,900 | | 3,309,899 |
SHO-BOND Holdings Co. Ltd. | 95,200 | | 2,877,585 |
Shoei Co. Ltd. | 95,800 | | 522,022 |
Common Stocks - continued |
| Shares | | Value |
Japan - continued |
The Nippon Synthetic Chemical Industry Co. Ltd. | 318,000 | | $ 2,087,336 |
Tocalo Co. Ltd. | 70,000 | | 1,016,285 |
Tsutsumi Jewelry Co. Ltd. | 41,800 | | 958,735 |
USS Co. Ltd. | 72,710 | | 7,641,700 |
Yamato Kogyo Co. Ltd. | 151,700 | | 4,258,546 |
TOTAL JAPAN | | 78,972,565 |
Korea (South) - 0.6% |
Woongjin Coway Co. Ltd. | 61,100 | | 2,224,732 |
Netherlands - 2.3% |
Aalberts Industries NV | 205,700 | | 3,732,653 |
ASM International NV unit | 71,200 | | 2,258,464 |
Heijmans NV unit | 112,623 | | 953,663 |
QIAGEN NV (a) | 94,600 | | 1,650,770 |
TOTAL NETHERLANDS | | 8,595,550 |
Papua New Guinea - 0.4% |
Oil Search Ltd. ADR | 207,544 | | 1,602,881 |
Philippines - 0.6% |
Jollibee Food Corp. | 856,460 | | 2,202,623 |
Portugal - 0.8% |
Jeronimo Martins SGPS SA | 161,700 | | 2,829,431 |
South Africa - 2.0% |
African Rainbow Minerals Ltd. | 77,800 | | 1,628,563 |
City Lodge Hotels Ltd. | 76,302 | | 809,603 |
Clicks Group Ltd. | 495,688 | | 3,417,533 |
Mr Price Group Ltd. | 98,200 | | 1,517,059 |
TOTAL SOUTH AFRICA | | 7,372,758 |
Spain - 1.8% |
Grifols SA (a) | 49,232 | | 1,707,611 |
Prosegur Compania de Seguridad SA (Reg.) | 946,390 | | 5,151,986 |
TOTAL SPAIN | | 6,859,597 |
Sweden - 2.5% |
Fagerhult AB | 90,605 | | 2,240,230 |
Intrum Justitia AB | 288,334 | | 4,173,147 |
Swedish Match Co. AB | 85,600 | | 2,916,613 |
TOTAL SWEDEN | | 9,329,990 |
Switzerland - 0.5% |
Zehnder Group AG | 31,864 | | 1,876,667 |
Common Stocks - continued |
| Shares | | Value |
Turkey - 2.8% |
Albaraka Turk Katilim Bankasi A/S | 2,942,565 | | $ 2,331,070 |
Boyner Buyuk Magazacilik A/S (a) | 1,290,451 | | 2,966,058 |
Coca-Cola Icecek A/S | 264,362 | | 5,132,384 |
TOTAL TURKEY | | 10,429,512 |
United Kingdom - 19.2% |
AMEC PLC | 111,405 | | 1,905,666 |
Babcock International Group PLC | 205,700 | | 3,246,455 |
Bellway PLC | 198,072 | | 3,231,547 |
Berendsen PLC | 176,863 | | 1,606,873 |
Britvic PLC | 429,700 | | 2,490,795 |
Dechra Pharmaceuticals PLC | 282,100 | | 2,808,824 |
Derwent London PLC | 58,600 | | 1,949,946 |
Elementis PLC | 405,882 | | 1,370,898 |
Great Portland Estates PLC | 487,489 | | 3,678,541 |
H&T Group PLC | 232,153 | | 1,077,081 |
InterContinental Hotel Group PLC ADR | 111,626 | | 2,748,232 |
Johnson Matthey PLC | 79,175 | | 2,873,517 |
Meggitt PLC | 771,669 | | 4,806,784 |
Persimmon PLC | 202,563 | | 2,598,744 |
Rotork PLC | 119,500 | | 4,392,966 |
Serco Group PLC | 426,309 | | 3,897,272 |
Shaftesbury PLC | 412,873 | | 3,651,180 |
Spectris PLC | 130,587 | | 3,641,497 |
Spirax-Sarco Engineering PLC | 174,930 | | 5,462,375 |
Ted Baker PLC | 112,000 | | 1,713,415 |
Ultra Electronics Holdings PLC | 129,658 | | 3,542,359 |
Unite Group PLC | 1,274,170 | | 5,821,079 |
Victrex PLC | 146,882 | | 3,377,689 |
TOTAL UNITED KINGDOM | | 71,893,735 |
United States of America - 12.7% |
ANSYS, Inc. (a) | 15,285 | | 1,083,401 |
Autoliv, Inc. | 61,900 | | 3,565,440 |
BPZ Energy, Inc. (a)(d) | 286,767 | | 825,889 |
Broadridge Financial Solutions, Inc. | 61,705 | | 1,416,130 |
Cymer, Inc. (a) | 49,209 | | 3,921,465 |
Dril-Quip, Inc. (a) | 40,569 | | 2,809,809 |
Evercore Partners, Inc. Class A | 56,200 | | 1,567,980 |
Greenhill & Co., Inc. | 40,995 | | 1,956,281 |
Kansas City Southern | 42,800 | | 3,443,688 |
Martin Marietta Materials, Inc. | 23,800 | | 1,958,978 |
Common Stocks - continued |
| Shares | | Value |
United States of America - continued |
Mohawk Industries, Inc. (a) | 41,700 | | $ 3,480,699 |
Oceaneering International, Inc. | 53,100 | | 2,778,723 |
PriceSmart, Inc. | 110,996 | | 9,211,553 |
ResMed, Inc. | 98,000 | | 3,914,120 |
Solera Holdings, Inc. | 68,456 | | 3,204,425 |
SS&C Technologies Holdings, Inc. (a) | 106,858 | | 2,567,798 |
TOTAL UNITED STATES OF AMERICA | | 47,706,379 |
TOTAL COMMON STOCKS (Cost $286,436,564) |
357,349,869
|
Nonconvertible Preferred Stocks - 0.7% |
| | | |
Brazil - 0.7% |
Banco ABC Brasil SA
(Cost $2,957,747) | 452,289 | |
2,569,811
|
Money Market Funds - 4.1% |
| | | |
Fidelity Cash Central Fund, 0.19% (b) | 14,393,835 | | 14,393,835 |
Fidelity Securities Lending Cash Central Fund, 0.19% (b)(c) | 1,000,230 | | 1,000,230 |
TOTAL MONEY MARKET FUNDS (Cost $15,394,065) |
15,394,065
|
TOTAL INVESTMENT PORTFOLIO - 100.2% (Cost $304,788,376) | | 375,313,745 |
NET OTHER ASSETS (LIABILITIES) - (0.2)% | | (868,125) |
NET ASSETS - 100% | $ 374,445,620 |
Legend |
(a) Non-income producing |
(b) Affiliated fund that is available only to investment companies and other accounts managed by Fidelity Investments. The rate quoted is the annualized seven-day yield of the fund at period end. A complete unaudited listing of the fund's holdings as of its most recent quarter end is available upon request. In addition, each Fidelity Central Fund's financial statements, which are not covered by the Fund's Report of Independent Registered Public Accounting Firm, are available on the SEC's website or upon request. |
(c) Investment made with cash collateral received from securities on loan. |
(d) Security or a portion of the security is on loan at period end. |
Affiliated Central Funds |
Information regarding fiscal year to date income earned by the Fund from investments in Fidelity Central Funds is as follows: |
Fund | Income earned |
Fidelity Cash Central Fund | $ 20,578 |
Fidelity Securities Lending Cash Central Fund | 123,696 |
Total | $ 144,274 |
Other Information |
Categorizations in the Schedule of Investments are based on country or territory of incorporation. |
All investments are categorized as Level 1 under the Fair Value Hierarchy. The inputs or methodology used for valuing securities may not be an indication of the risk associated with investing in those securities. For more information on valuation inputs, please refer to the Security Valuation section in the accompanying Notes to Financial Statements. |
The following is a summary of transfers between Level 1 and Level 2 for the period ended October 31, 2012. Transfers are assumed to have occurred at the beginning of the period, and are primarily attributable to the valuation techniques used for foreign equity securities, as discussed in the accompanying Notes to Financial Statements: |
Transfers | Total |
Level 1 to Level 2 | $ 0 |
Level 2 to Level 1 | $ 83,755,081 |
See accompanying notes which are an integral part of the financial statements.
Annual Report
Statement of Assets and Liabilities
| October 31, 2012 |
| | |
Assets | | |
Investment in securities, at value (including securities loaned of $950,434) - See accompanying schedule: Unaffiliated issuers (cost $289,394,311) | $ 359,919,680 | |
Fidelity Central Funds (cost $15,394,065) | 15,394,065 | |
Total Investments (cost $304,788,376) | | $ 375,313,745 |
Receivable for investments sold | | 852,658 |
Receivable for fund shares sold | | 208,144 |
Dividends receivable | | 1,012,746 |
Distributions receivable from Fidelity Central Funds | | 3,106 |
Receivable from investment adviser for expense reductions | | 3,081 |
Other receivables | | 8,858 |
Total assets | | 377,402,338 |
| | |
Liabilities | | |
Payable for investments purchased | $ 833,907 | |
Payable for fund shares redeemed | 609,477 | |
Accrued management fee | 332,364 | |
Distribution and service plan fees payable | 14,354 | |
Other affiliated payables | 98,330 | |
Other payables and accrued expenses | 68,056 | |
Collateral on securities loaned, at value | 1,000,230 | |
Total liabilities | | 2,956,718 |
| | |
Net Assets | | $ 374,445,620 |
Net Assets consist of: | | |
Paid in capital | | $ 650,027,368 |
Undistributed net investment income | | 3,302,296 |
Accumulated undistributed net realized gain (loss) on investments and foreign currency transactions | | (349,390,238) |
Net unrealized appreciation (depreciation) on investments and assets and liabilities in foreign currencies | | 70,506,194 |
Net Assets | | $ 374,445,620 |
See accompanying notes which are an integral part of the financial statements.
Annual Report
Statement of Assets and Liabilities - continued
| October 31, 2012 |
| | |
Calculation of Maximum Offering Price Class A:
Net Asset Value and redemption price per share ($18,194,312 ÷ 1,687,285 shares) | | $ 10.78 |
| | |
Maximum offering price per share (100/94.25 of $10.78) | | $ 11.44 |
Class T:
Net Asset Value and redemption price per share ($8,168,756 ÷ 763,991 shares) | | $ 10.69 |
| | |
Maximum offering price per share (100/96.50 of $10.69) | | $ 11.08 |
Class B:
Net Asset Value and offering price per share ($1,965,725 ÷ 187,264 shares)A | | $ 10.50 |
| | |
Class C:
Net Asset Value and offering price per share ($6,608,275 ÷ 630,481 shares)A | | $ 10.48 |
| | |
International Small Cap Opportunities:
Net Asset Value, offering price and redemption price per share ($334,917,873 ÷ 30,769,882 shares) | | $ 10.88 |
| | |
Institutional Class:
Net Asset Value, offering price and redemption price per share ($4,590,679 ÷ 421,283 shares) | | $ 10.90 |
A Redemption price per share is equal to net asset value less any applicable contingent deferred sales charge.
See accompanying notes which are an integral part of the financial statements.
Annual Report
Financial Statements - continued
Statement of Operations
| Year ended October 31, 2012 |
| | |
Investment Income | | |
Dividends | | $ 9,443,414 |
Income from Fidelity Central Funds | | 144,274 |
Income before foreign taxes withheld | | 9,587,688 |
Less foreign taxes withheld | | (625,721) |
Total income | | 8,961,967 |
| | |
Expenses | | |
Management fee
Basic fee | $ 3,085,108 | |
Performance adjustment | 775,332 | |
Transfer agent fees | 999,785 | |
Distribution and service plan fees | 174,080 | |
Accounting and security lending fees | 188,109 | |
Custodian fees and expenses | 101,203 | |
Independent trustees' compensation | 2,363 | |
Registration fees | 81,326 | |
Audit | 67,233 | |
Legal | 1,855 | |
Miscellaneous | 3,487 | |
Total expenses before reductions | 5,479,881 | |
Expense reductions | (297,227) | 5,182,654 |
Net investment income (loss) | | 3,779,313 |
Realized and Unrealized Gain (Loss) Net realized gain (loss) on: | | |
Investment securities: | | |
Unaffiliated issuers | 21,390,324 | |
Foreign currency transactions | (29,044) | |
Total net realized gain (loss) | | 21,361,280 |
Change in net unrealized appreciation (depreciation) on: Investment securities | 17,246,510 | |
Assets and liabilities in foreign currencies | (10,085) | |
Total change in net unrealized appreciation (depreciation) | | 17,236,425 |
Net gain (loss) | | 38,597,705 |
Net increase (decrease) in net assets resulting from operations | | $ 42,377,018 |
See accompanying notes which are an integral part of the financial statements.
Annual Report
Statement of Changes in Net Assets
| Year ended
October 31,
2012 | Year ended
October 31,
2011 |
Increase (Decrease) in Net Assets | | |
Operations | | |
Net investment income (loss) | $ 3,779,313 | $ 7,043,577 |
Net realized gain (loss) | 21,361,280 | 54,021,779 |
Change in net unrealized appreciation (depreciation) | 17,236,425 | (52,262,552) |
Net increase (decrease) in net assets resulting
from operations | 42,377,018 | 8,802,804 |
Distributions to shareholders from net investment income | (4,886,680) | (6,223,295) |
Distributions to shareholders from net realized gain | (369,319) | (1,761,993) |
Total distributions | (5,255,999) | (7,985,288) |
Share transactions - net increase (decrease) | (28,976,326) | (78,669,716) |
Redemption fees | 64,463 | 71,408 |
Total increase (decrease) in net assets | 8,209,156 | (77,780,792) |
| | |
Net Assets | | |
Beginning of period | 366,236,464 | 444,017,256 |
End of period (including undistributed net investment income of $3,302,296 and undistributed net investment income of $4,428,178, respectively) | $ 374,445,620 | $ 366,236,464 |
See accompanying notes which are an integral part of the financial statements.
Annual Report
Financial Highlights - Class A
Years ended October 31, | 2012 | 2011 | 2010 | 2009 | 2008 |
Selected Per-Share Data | | | | | |
Net asset value, beginning of period | $ 9.75 | $ 9.82 | $ 8.07 | $ 6.24 | $ 18.97 |
Income from Investment Operations | | | | | |
Net investment income (loss) C | .08 | .15 F | .06 | .06 | .02 |
Net realized and unrealized gain (loss) | 1.07 | (.07) | 1.85 | 1.77 | (10.85) |
Total from investment operations | 1.15 | .08 | 1.91 | 1.83 | (10.83) |
Distributions from net investment income | (.11) | (.11) | (.07) | - | (.03) |
Distributions from net realized gain | (.01) | (.04) | (.09) | - | (1.88) |
Total distributions | (.12) | (.15) | (.16) | - | (1.90) I |
Redemption fees added to paid in capital C,H | - | - | - | - | - |
Net asset value, end of period | $ 10.78 | $ 9.75 | $ 9.82 | $ 8.07 | $ 6.24 |
Total Return A,B | 12.00% | .81% | 24.05% | 29.33% | (62.98)% |
Ratios to Average Net Assets D,G | | | | | |
Expenses before reductions | 1.75% | 1.34% | 1.16% | .94% | 1.75% |
Expenses net of fee waivers, if any | 1.65% | 1.33% | 1.16% | .94% | 1.66% |
Expenses net of all reductions | 1.64% | 1.32% | 1.15% | .89% | 1.62% |
Net investment income (loss) | .85% | 1.44% F | .74% | 1.00% | .13% |
Supplemental Data | | | | | |
Net assets, end of period (000 omitted) | $ 18,194 | $ 18,686 | $ 20,228 | $ 18,883 | $ 17,905 |
Portfolio turnover rate E | 28% | 24% | 49% | 174% | 61% |
A Total returns would have been lower if certain expenses had not been reduced during the applicable periods shown.
B Total returns do not include the effect of the sales charges.
C Calculated based on average shares outstanding during the period.
D Fees and expenses of any underlying Fidelity Central Funds are not included in the Fund's expense ratio. The Fund indirectly bears its proportionate share of the expenses of any underlying Fidelity Central Funds.
E Amount does not include the portfolio activity of any underlying Fidelity Central Funds.
F Investment income per share reflects a large, non-recurring dividend which amounted to $.06 per share. Excluding this non-recurring dividend, the ratio of net investment income (loss) to average net assets would have been .80%.
G Expense ratios reflect operating expenses of the class. Expenses before reductions do not reflect amounts reimbursed by the investment adviser or reductions from brokerage service arrangements or reductions from other expense offset arrangements and do not represent the amount paid by the class during periods when reimbursements or reductions occur. Expenses net of fee waivers reflect expenses after reimbursement by the investment adviser but prior to reductions from brokerage service arrangements or other expense offset arrangements. Expenses net of all reductions represent the net expenses paid by the class.
H Amount represents less than $.01 per share.
I Total distributions of $1.90 per share is comprised of distributions from net investment income of $.025 and distributions from net realized gain of $1.878 per share.
See accompanying notes which are an integral part of the financial statements.
Annual Report
Financial Highlights - Class T
Years ended October 31, | 2012 | 2011 | 2010 | 2009 | 2008 |
Selected Per-Share Data | | | | | |
Net asset value, beginning of period | $ 9.66 | $ 9.72 | $ 8.00 | $ 6.20 | $ 18.85 |
Income from Investment Operations | | | | | |
Net investment income (loss) C | .06 | .12 F | .04 | .05 | (.02) |
Net realized and unrealized gain (loss) | 1.06 | (.06) | 1.83 | 1.75 | (10.78) |
Total from investment operations | 1.12 | .06 | 1.87 | 1.80 | (10.80) |
Distributions from net investment income | (.08) | (.08) | (.06) | - | - |
Distributions from net realized gain | (.01) | (.04) | (.09) | - | (1.85) |
Total distributions | (.09) | (.12) | (.15) | - | (1.85) I |
Redemption fees added to paid in capital C,H | - | - | - | - | - |
Net asset value, end of period | $ 10.69 | $ 9.66 | $ 9.72 | $ 8.00 | $ 6.20 |
Total Return A,B | 11.72% | .60% | 23.65% | 29.03% | (63.08)% |
Ratios to Average Net Assets D,G | | | | | |
Expenses before reductions | 2.02% | 1.60% | 1.43% | 1.20% | 2.00% |
Expenses net of fee waivers, if any | 1.90% | 1.60% | 1.43% | 1.20% | 1.91% |
Expenses net of all reductions | 1.89% | 1.59% | 1.41% | 1.15% | 1.87% |
Net investment income (loss) | .60% | 1.17% F | .48% | .74% | (.12)% |
Supplemental Data | | | | | |
Net assets, end of period (000 omitted) | $ 8,169 | $ 8,701 | $ 11,202 | $ 11,915 | $ 11,614 |
Portfolio turnover rate E | 28% | 24% | 49% | 174% | 61% |
A Total returns would have been lower if certain expenses had not been reduced during the applicable periods shown.
B Total returns do not include the effect of the sales charges.
C Calculated based on average shares outstanding during the period.
D Fees and expenses of any underlying Fidelity Central Funds are not included in the Fund's expense ratio. The Fund indirectly bears its proportionate share of the expenses of any underlying Fidelity Central Funds.
E Amount does not include the portfolio activity of any underlying Fidelity Central Funds.
F Investment income per share reflects a large, non-recurring dividend which amounted to $.06 per share. Excluding this non-recurring dividend, the ratio of net investment income (loss) to average net assets would have been .54%.
G Expense ratios reflect operating expenses of the class. Expenses before reductions do not reflect amounts reimbursed by the investment adviser or reductions from brokerage service arrangements or reductions from other expense offset arrangements and do not represent the amount paid by the class during periods when reimbursements or reductions occur. Expenses net of fee waivers reflect expenses after reimbursement by the investment adviser but prior to reductions from brokerage service arrangements or other expense offset arrangements. Expenses net of all reductions represent the net expenses paid by the class.
H Amount represents less than $.01 per share.
I Total distributions of $1.85 per share is comprised of distributions from net realized gain of $1.852 per share.
See accompanying notes which are an integral part of the financial statements.
Annual Report
Financial Highlights - Class B
Years ended October 31, | 2012 | 2011 | 2010 | 2009 | 2008 |
Selected Per-Share Data | | | | | |
Net asset value, beginning of period | $ 9.48 | $ 9.54 | $ 7.87 | $ 6.12 | $ 18.64 |
Income from Investment Operations | | | | | |
Net investment income (loss) C | .01 | .07 F | - H | .02 | (.08) |
Net realized and unrealized gain (loss) | 1.05 | (.06) | 1.79 | 1.73 | (10.68) |
Total from investment operations | 1.06 | .01 | 1.79 | 1.75 | (10.76) |
Distributions from net investment income | (.03) | (.06) | (.03) | - | - |
Distributions from net realized gain | (.01) | (.02) | (.09) | - | (1.76) |
Total distributions | (.04) | (.07) J | (.12) | - | (1.76) I |
Redemption fees added to paid in capital C,H | - | - | - | - | - |
Net asset value, end of period | $ 10.50 | $ 9.48 | $ 9.54 | $ 7.87 | $ 6.12 |
Total Return A,B | 11.21% | .10% | 23.03% | 28.59% | (63.32)% |
Ratios to Average Net Assets D,G | | | | | |
Expenses before reductions | 2.50% | 2.09% | 1.91% | 1.69% | 2.51% |
Expenses net of fee waivers, if any | 2.40% | 2.09% | 1.91% | 1.69% | 2.41% |
Expenses net of all reductions | 2.39% | 2.07% | 1.90% | 1.64% | 2.38% |
Net investment income (loss) | .10% | .68% F | (.01)% | .25% | (.62)% |
Supplemental Data | | | | | |
Net assets, end of period (000 omitted) | $ 1,966 | $ 2,293 | $ 2,902 | $ 2,799 | $ 2,687 |
Portfolio turnover rate E | 28% | 24% | 49% | 174% | 61% |
A Total returns would have been lower if certain expenses had not been reduced during the applicable periods shown.
B Total returns do not include the effect of the contingent deferred sales charge.
C Calculated based on average shares outstanding during the period.
D Fees and expenses of any underlying Fidelity Central Funds are not included in the Fund's expense ratio. The Fund indirectly bears its proportionate share of the expenses of any underlying Fidelity Central Funds.
E Amount does not include the portfolio activity of any underlying Fidelity Central Funds.
F Investment income per share reflects a large, non-recurring dividend which amounted to $.06 per share. Excluding this non-recurring dividend, the ratio of net investment income (loss) to average net assets would have been .05%.
G Expense ratios reflect operating expenses of the class. Expenses before reductions do not reflect amounts reimbursed by the investment adviser or reductions from brokerage service arrangements or reductions from other expense offset arrangements and do not represent the amount paid by the class during periods when reimbursements or reductions occur. Expenses net of fee waivers reflect expenses after reimbursement by the investment adviser but prior to reductions from brokerage service arrangements or other expense offset arrangements. Expenses net of all reductions represent the net expenses paid by the class.
H Amount represents less than $.01 per share.
I Total distributions of $1.76 per share is comprised of distributions from net realized gain of $1.760 per share.
J Total distributions of $.07 per share is comprised of distributions from net investment income of $.058 and distributions from net realized gain of $.015 per share.
See accompanying notes which are an integral part of the financial statements.
Annual Report
Financial Highlights - Class C
Years ended October 31, | 2012 | 2011 | 2010 | 2009 | 2008 |
Selected Per-Share Data | | | | | |
Net asset value, beginning of period | $ 9.47 | $ 9.53 | $ 7.86 | $ 6.11 | $ 18.63 |
Income from Investment Operations | | | | | |
Net investment income (loss) C | .01 | .07 F | - H | .02 | (.08) |
Net realized and unrealized gain (loss) | 1.04 | (.06) | 1.79 | 1.73 | (10.66) |
Total from investment operations | 1.05 | .01 | 1.79 | 1.75 | (10.74) |
Distributions from net investment income | (.03) | (.06) | (.03) | - | - |
Distributions from net realized gain | (.01) | (.02) | (.09) | - | (1.78) |
Total distributions | (.04) | (.07) J | (.12) | - | (1.78) I |
Redemption fees added to paid in capital C,H | - | - | - | - | - |
Net asset value, end of period | $ 10.48 | $ 9.47 | $ 9.53 | $ 7.86 | $ 6.11 |
Total Return A,B | 11.13% | .10% | 23.06% | 28.64% | (63.32)% |
Ratios to Average Net Assets D,G | | | | | |
Expenses before reductions | 2.50% | 2.09% | 1.91% | 1.68% | 2.51% |
Expenses net of fee waivers, if any | 2.40% | 2.09% | 1.91% | 1.68% | 2.41% |
Expenses net of all reductions | 2.39% | 2.07% | 1.90% | 1.63% | 2.38% |
Net investment income (loss) | .10% | .68% F | (.01)% | .26% | (.62)% |
Supplemental Data | | | | | |
Net assets, end of period (000 omitted) | $ 6,608 | $ 6,900 | $ 8,936 | $ 8,543 | $ 9,497 |
Portfolio turnover rate E | 28% | 24% | 49% | 174% | 61% |
A Total returns would have been lower if certain expenses had not been reduced during the applicable periods shown.
B Total returns do not include the effect of the contingent deferred sales charge.
C Calculated based on average shares outstanding during the period.
D Fees and expenses of any underlying Fidelity Central Funds are not included in the Fund's expense ratio. The Fund indirectly bears its proportionate share of the expenses of any underlying Fidelity Central Funds.
E Amount does not include the portfolio activity of any underlying Fidelity Central Funds.
F Investment income per share reflects a large, non-recurring dividend which amounted to $.06 per share. Excluding this non-recurring dividend, the ratio of net investment income (loss) to average net assets would have been .05%.
G Expense ratios reflect operating expenses of the class. Expenses before reductions do not reflect amounts reimbursed by the investment adviser or reductions from brokerage service arrangements or reductions from other expense offset arrangements and do not represent the amount paid by the class during periods when reimbursements or reductions occur. Expenses net of fee waivers reflect expenses after reimbursement by the investment adviser but prior to reductions from brokerage service arrangements or other expense offset arrangements. Expenses net of all reductions represent the net expenses paid by the class.
H Amount represents less than $.01 per share.
I Total distributions of $1.78 per share is comprised of distributions from net realized gain of $1.775 per share.
J Total distributions of $.07 per share is comprised of distributions from net investment income of $.058 and distributions from net realized gain of $.015 per share.
See accompanying notes which are an integral part of the financial statements.
Annual Report
Financial Highlights - International Small Cap Opportunities
Years ended October 31, | 2012 | 2011 | 2010 | 2009 | 2008 |
Selected Per-Share Data | | | | | |
Net asset value, beginning of period | $ 9.85 | $ 9.92 | $ 8.14 | $ 6.28 | $ 19.09 |
Income from Investment Operations | | | | | |
Net investment income (loss) B | .11 | .17 E | .09 | .08 | .05 |
Net realized and unrealized gain (loss) | 1.07 | (.06) | 1.87 | 1.78 | (10.92) |
Total from investment operations | 1.18 | .11 | 1.96 | 1.86 | (10.87) |
Distributions from net investment income | (.14) | (.14) | (.09) | - G | (.06) |
Distributions from net realized gain | (.01) | (.04) | (.09) | - | (1.88) |
Total distributions | (.15) | (.18) | (.18) | - G | (1.94) H |
Redemption fees added to paid in capital B,G | - | - | - | - | - |
Net asset value, end of period | $ 10.88 | $ 9.85 | $ 9.92 | $ 8.14 | $ 6.28 |
Total Return A | 12.21% | 1.10% | 24.43% | 29.68% | (62.91)% |
Ratios to Average Net Assets C,F | | | | | |
Expenses before reductions | 1.47% | 1.08% | .91% | .68% | 1.44% |
Expenses net of fee waivers, if any | 1.40% | 1.08% | .91% | .68% | 1.44% |
Expenses net of all reductions | 1.39% | 1.06% | .89% | .64% | 1.40% |
Net investment income (loss) | 1.10% | 1.69% E | 1.00% | 1.25% | .36% |
Supplemental Data | | | | | |
Net assets, end of period (000 omitted) | $ 334,918 | $ 328,262 | $ 398,331 | $ 329,128 | $ 312,376 |
Portfolio turnover rate D | 28% | 24% | 49% | 174% | 61% |
A Total returns would have been lower if certain expenses had not been reduced during the applicable periods shown.
B Calculated based on average shares outstanding during the period.
C Fees and expenses of any underlying Fidelity Central Funds are not included in the Fund's expense ratio. The Fund indirectly bears its proportionate share of the expenses of any underlying Fidelity Central Funds.
D Amount does not include the portfolio activity of any underlying Fidelity Central Funds.
E Investment income per share reflects a large, non-recurring dividend which amounted to $.07 per share. Excluding this non-recurring dividend, the ratio of net investment income (loss) to average net assets would have been 1.06%.
F Expense ratios reflect operating expenses of the class. Expenses before reductions do not reflect amounts reimbursed by the investment adviser or reductions from brokerage service arrangements or reductions from other expense offset arrangements and do not represent the amount paid by the class during periods when reimbursements or reductions occur. Expenses net of fee waivers reflect expenses after reimbursement by the investment adviser but prior to reductions from brokerage service arrangements or other expense offset arrangements. Expenses net of all reductions represent the net expenses paid by the class.
G Amount represents less than $.01 per share.
H Total distributions of $1.94 per share is comprised of distributions from net investment income of $.064 and distributions from net realized gain of $1.878 per share.
See accompanying notes which are an integral part of the financial statements.
Annual Report
Financial Highlights - Institutional Class
Years ended October 31, | 2012 | 2011 | 2010 | 2009 | 2008 |
Selected Per-Share Data | | | | | |
Net asset value, beginning of period | $ 9.86 | $ 9.93 | $ 8.14 | $ 6.27 | $ 19.09 |
Income from Investment Operations | | | | | |
Net investment income (loss) B | .11 | .18 E | .09 | .08 | .05 |
Net realized and unrealized gain (loss) | 1.08 | (.06) | 1.86 | 1.79 | (10.92) |
Total from investment operations | 1.19 | .12 | 1.95 | 1.87 | (10.87) |
Distributions from net investment income | (.14) | (.15) | (.07) | - G | (.07) |
Distributions from net realized gain | (.01) | (.04) | (.09) | - | (1.88) |
Total distributions | (.15) | (.19) | (.16) | - G | (1.95) H |
Redemption fees added to paid in capital B,G | - | - | - | - | - |
Net asset value, end of period | $ 10.90 | $ 9.86 | $ 9.93 | $ 8.14 | $ 6.27 |
Total Return A | 12.32% | 1.13% | 24.33% | 29.87% | (62.95)% |
Ratios to Average Net Assets C,F | | | | | |
Expenses before reductions | 1.44% | 1.03% | .90% | .68% | 1.40% |
Expenses net of fee waivers, if any | 1.40% | 1.03% | .90% | .68% | 1.40% |
Expenses net of all reductions | 1.39% | 1.02% | .88% | .64% | 1.37% |
Net investment income (loss) | 1.10% | 1.74% E | 1.01% | 1.25% | .39% |
Supplemental Data | | | | | |
Net assets, end of period (000 omitted) | $ 4,591 | $ 1,395 | $ 2,418 | $ 2,022 | $ 8,117 |
Portfolio turnover rate D | 28% | 24% | 49% | 174% | 61% |
A Total returns would have been lower if certain expenses had not been reduced during the applicable periods shown.
B Calculated based on average shares outstanding during the period.
C Fees and expenses of any underlying Fidelity Central Funds are not included in the Fund's expense ratio. The Fund indirectly bears its proportionate share of the expenses of any underlying Fidelity Central Funds.
D Amount does not include the portfolio activity of any underlying Fidelity Central Funds.
E Investment income per share reflects a large, non-recurring dividend which amounted to $.07 per share. Excluding this non-recurring dividend, the ratio of net investment income (loss) to average net assets would have been 1.11%.
F Expense ratios reflect operating expenses of the class. Expenses before reductions do not reflect amounts reimbursed by the investment adviser or reductions from brokerage service arrangements or reductions from other expense offset arrangements and do not represent the amount paid by the class during periods when reimbursements or reductions occur. Expenses net of fee waivers reflect expenses after reimbursement by the investment adviser but prior to reductions from brokerage service arrangements or other expense offset arrangements. Expenses net of all reductions represent the net expenses paid by the class.
G Amount represents less than $.01 per share.
H Total distributions of $1.95 per share is comprised of distributions from net investment income of $.074 and distributions from net realized gain of $1.878 per share.
See accompanying notes which are an integral part of the financial statements.
Annual Report
Notes to Financial Statements
For the period ended October 31, 2012
1. Organization.
Fidelity International Small Cap Opportunities Fund (the Fund) is a fund of Fidelity Investment Trust (the Trust) and is authorized to issue an unlimited number of shares. The Trust is registered under the Investment Company Act of 1940, as amended (the 1940 Act), as an open-end management investment company organized as a Massachusetts business trust. The Fund offers Class A, Class T, Class C, International Small Cap Opportunities and Institutional Class shares, each of which, along with Class B shares, has equal rights as to assets and voting privileges. Effective after the close of business on September 1, 2010, Class B shares were closed to new accounts and additional purchases, except for exchanges and reinvestments. Each class has exclusive voting rights with respect to matters that affect that class. Class B shares will automatically convert to Class A shares after a holding period of seven years from the initial date of purchase. Investment income, realized and unrealized capital gains and losses, the common expenses of the Fund, and certain fund-level expense reductions, if any, are allocated on a pro-rata basis to each class based on the relative net assets of each class to the total net assets of the Fund. Each class differs with respect to transfer agent and distribution and service plan fees incurred. Certain expense reductions may also differ by class. The Fund's investments in emerging markets can be subject to social, economic, regulatory, and political uncertainties and can be extremely volatile.
2. Investments in Fidelity Central Funds.
The Fund may invest in Fidelity Central Funds, which are open-end investment companies available only to other investment companies and accounts managed by Fidelity Management & Research Company (FMR) and its affiliates. The Fund's Schedule of Investments lists each of the Fidelity Central Funds held as of period end, if any, as an investment of the Fund, but does not include the underlying holdings of each Fidelity Central Fund. As an Investing Fund, the Fund indirectly bears its proportionate share of the expenses of the underlying Fidelity Central Funds.
The Money Market Central Funds seek preservation of capital and current income and are managed by Fidelity Investments Money Management, Inc. (FIMM), an affiliate of FMR.
A complete unaudited list of holdings for each Fidelity Central Fund is available upon request or at the Securities and Exchange Commission (the SEC) web site at www.sec.gov. In addition, the financial statements of the Fidelity Central Funds, which are not covered by the Fund's Report of Independent Registered Public Accounting Firm, are available on the SEC web site or upon request.
Annual Report
3. Significant Accounting Policies.
The financial statements have been prepared in conformity with accounting principles generally accepted in the United States of America (GAAP), which require management to make certain estimates and assumptions at the date of the financial statements. Actual results could differ from those estimates. Subsequent events, if any, through the date that the financial statements were issued have been evaluated in the preparation of the financial statements. The following summarizes the significant accounting policies of the Fund:
Security Valuation. Investments are valued as of 4:00 p.m. Eastern time on the last calendar day of the period. In accordance with valuation policies and procedures approved by the Board of Trustees (the Board), the Fund attempts to obtain prices from one or more third party pricing vendors or brokers to value its investments. When current market prices, quotations or rates are not readily available or reliable, securities will be fair valued in good faith by the FMR Fair Value Committee (the Committee), in accordance with procedures adopted by the Fund's Board. Factors used in determining fair value vary by security type and may include market or security specific events. The frequency with which these procedures are used cannot be predicted and they may be utilized to a significant extent. The Committee oversees the Fund's valuation policies and procedures and is responsible for approving and reporting to the Board all fair value determinations.
The Fund categorizes the inputs to valuation techniques used to value its investments into a disclosure hierarchy consisting of three levels as shown below:
Level 1 - quoted prices in active markets for identical investments
Level 2 - other significant observable inputs (including quoted prices for similar investments, interest rates, prepayment speeds, etc.)
Level 3 - unobservable inputs (including the Fund's own assumptions based on the best information available)
Valuation techniques used to value the Fund's investments by major category are as follows:
Equity securities, including restricted securities, for which market quotations are readily available, are valued at the last reported sale price or official closing price as reported by a third party pricing vendor on the primary market or exchange on which they are traded and are categorized as Level 1 in the hierarchy. In the event there were no sales during the day or closing prices are not available, securities are valued at the last quoted bid price or may be valued using the last available price and are generally categorized as Level 2 in the hierarchy. For foreign equity securities, when significant market or security specific events arise, comparisons to the valuation of American Depositary Receipts
Annual Report
Notes to Financial Statements - continued
3. Significant Accounting Policies - continued
Security Valuation - continued
(ADRs), futures contracts, Exchange-Traded Funds (ETFs) and certain indexes as well as quoted prices for similar securities are used and are categorized as Level 2 in the hierarchy. Utilizing these techniques may result in transfers between Level 1 and Level 2.
Investments in open-end mutual funds, including the Fidelity Central Funds, are valued at their closing net asset value (NAV) each business day and are categorized as Level 1 in the hierarchy.
Changes in valuation techniques may result in transfers in or out of an assigned level within the disclosure hierarchy. Information on transfers between Levels 1 and 2 is included at the end of the Fund's Schedule of Investments.
Foreign Currency Translation. The Fund may use foreign currency contracts to facilitate transactions in foreign-denominated securities. Gains and losses from these transactions may arise from changes in the value of the foreign currency or if the counterparties do not perform under the contracts' terms.
Foreign-denominated assets, including investment securities, and liabilities are translated into U.S. dollars at the exchange rates at period end. Purchases and sales of investment securities, income and dividends received and expenses denominated in foreign currencies are translated into U.S. dollars at the exchange rate in effect on the transaction date. The effects of exchange rate fluctuations on investments are included with the net realized and unrealized gain (loss) on investment securities. Other foreign currency transactions resulting in realized and unrealized gain (loss) are disclosed separately.
Investment Transactions and Income. For financial reporting purposes, the Fund's investment holdings and NAV include trades executed through the end of the last business day of the period. The NAV per share for processing shareholder transactions is calculated as of the close of business of the New York Stock Exchange (NYSE), normally 4:00 p.m. Eastern time and includes trades executed through the end of the prior business day. Gains and losses on securities sold are determined on the basis of identified cost and may include proceeds received from litigation. Dividend income is recorded on the ex-dividend date, except for certain dividends from foreign securities where the ex-dividend date may have passed, which are recorded as soon as the Fund is informed of the ex-dividend date. Non-cash dividends included in dividend income, if any, are recorded at the fair market value of the securities received. Distributions received on securities that represent a return of capital or capital gain are recorded as a reduction of cost of investments and/or as a realized gain. The Fund estimates the components of distributions received that may be considered return of capital distributions or capital
Annual Report
3. Significant Accounting Policies - continued
Investment Transactions and Income - continued
gain distributions. Interest income and distributions from the Fidelity Central Funds are accrued as earned. Investment income is recorded net of foreign taxes withheld where recovery of such taxes is uncertain.
Expenses. Expenses directly attributable to a fund are charged to that fund. Expenses attributable to more than one fund are allocated among the respective funds on the basis of relative net assets or other appropriate methods. Expense estimates are accrued in the period to which they relate and adjustments are made when actual amounts are known.
Income Tax Information and Distributions to Shareholders. Each year, the Fund intends to qualify as a regulated investment company under Subchapter M of the Internal Revenue Code, including distributing substantially all of its taxable income and realized gains. As a result, no provision for income taxes is required. As of October 31, 2012, the Fund did not have any unrecognized tax benefits in the financial statements; nor is the Fund aware of any tax positions for which it is reasonably possible that the total amounts of unrecognized tax benefits will significantly change in the next twelve months. The Fund files a U.S. federal tax return, in addition to state and local tax returns as required. A fund's federal income tax returns are subject to examination by the Internal Revenue Service (IRS) for a period of three fiscal years after they are filed. State and local tax returns may be subject to examination for an additional fiscal year depending on the jurisdiction. Foreign taxes are provided for based on the Fund's understanding of the tax rules and rates that exist in the foreign markets in which it invests.
Distributions are declared and recorded on the ex-dividend date. Income dividends and capital gain distributions are declared separately for each class. Income and capital gain distributions are determined in accordance with income tax regulations, which may differ from GAAP.
Capital accounts within the financial statements are adjusted for permanent book-tax differences. These adjustments have no impact on net assets or the results of operations. Temporary book-tax differences will reverse in a subsequent period.
Book-tax differences are primarily due to foreign currency transactions, passive foreign investment companies (PFIC), partnerships, capital loss carryforwards and losses deferred due to wash sales.
Annual Report
Notes to Financial Statements - continued
3. Significant Accounting Policies - continued
Income Tax Information and Distributions to Shareholders - continued
The federal tax cost of investment securities and unrealized appreciation (depreciation) as of period end were as follows:
Gross unrealized appreciation | $ 83,324,701 |
Gross unrealized depreciation | (15,053,989) |
Net unrealized appreciation (depreciation) on securities and other investments | $ 68,270,712 |
| |
Tax Cost | $ 307,043,033 |
The tax-based components of distributable earnings as of period end were as follows:
Undistributed ordinary income | $ 3,403,046 |
Capital loss carryforward | $ (347,236,330) |
Net unrealized appreciation (depreciation) | $ 68,251,537 |
Capital loss carryforwards are only available to offset future capital gains of the Fund to the extent provided by regulations and may be limited. Under the Regulated Investment Company Modernization Act of 2010 (the Act), the Fund is permitted to carry forward capital losses incurred in taxable years beginning after December 22, 2010 for an unlimited period and such capital losses are required to be used prior to any losses that expire. Capital loss carryforwards were as follows:
Fiscal year of expiration | |
2016 | $ (16,734,422) |
2017 | (330,501,908) |
Total capital loss carryforward | $ (347,236,330) |
The tax character of distributions paid was as follows:
| October 31, 2012 | October 31, 2011 |
Ordinary Income | $ 5,255,999 | $ 7,985,288 |
Short-Term Trading (Redemption) Fees. Shares held by investors in the Fund less than 90 days are subject to a redemption fee equal to 2.00% of the net asset value of shares redeemed. All redemption fees, which reduce the proceeds of the shareholder redemption, are retained by the Fund and accounted for as an addition to paid in capital.
New Accounting Pronouncement. In December 2011, the Financial Accounting Standards Board issued Accounting Standard Update No. 2011-11, Disclosures about Offsetting Assets and Liabilities. The update creates new disclosure requirements
Annual Report
3. Significant Accounting Policies - continued
New Accounting Pronouncement - continued
requiring entities to disclose both gross and net information for derivatives and other financial instruments that are either offset in the Statement of Assets and Liabilities or subject to an enforceable master netting arrangement or similar agreement. The disclosure requirements are effective for annual reporting periods beginning on or after January 1, 2013, and interim periods within those annual periods. Management is currently evaluating the impact of the update's adoption on the Fund's financial statement disclosures.
4. Purchases and Sales of Investments.
Purchases and sales of securities, other than short-term securities, aggregated $95,723,212 and $132,775,590, respectively.
5. Fees and Other Transactions with Affiliates.
Management Fee. FMR and its affiliates provide the Fund with investment management related services for which the Fund pays a monthly management fee. The management fee is the sum of an individual fund fee rate that is based on an annual rate of .60% of the Fund's average net assets and an annualized group fee rate that averaged .26% during the period. The group fee rate is based upon the average net assets of all the mutual funds advised by FMR. The group fee rate decreases as assets under management increase and increases as assets under management decrease. In addition, the management fee is subject to a performance adjustment (up to a maximum of ± .20% of the Fund's average net assets over a 36 month performance period). The upward or downward adjustment to the management fee is based on the relative investment performance of International Small Cap Opportunities as compared to an appropriate benchmark index. For the period, the total annual management fee rate, including the performance adjustment, was 1.07% of the Fund's average net assets.
Distribution and Service Plan Fees. In accordance with Rule 12b-1 of the 1940 Act, the Fund has adopted separate Distribution and Service Plans for each class of shares. Certain classes pay Fidelity Distributors Corporation (FDC), an affiliate of FMR, separate Distribution and Service Fees, each of which is based on an annual percentage of each class' average net assets. In addition, FDC may pay financial intermediaries for selling shares of the Fund and providing shareholder support services. For the period,
Annual Report
Notes to Financial Statements - continued
5. Fees and Other Transactions with Affiliates - continued
Distribution and Service Plan Fees - continued
the Distribution and Service Fee rates, total fees and amounts retained by FDC were as follows:
| Distribution
Fee | Service
Fee | Total Fees | Retained
by FDC |
Class A | -% | .25% | $ 45,023 | $ 324 |
Class T | .25% | .25% | 41,524 | 226 |
Class B | .75% | .25% | 20,873 | 15,685 |
Class C | .75% | .25% | 66,660 | 4,234 |
| | | $ 174,080 | $ 20,469 |
Sales Load. FDC may receive a front-end sales charge of up to 5.75% for selling Class A shares and 3.50% for selling Class T shares, some of which is paid to financial intermediaries for selling shares of the Fund. Depending on the holding period, FDC may receive contingent deferred sales charges levied on Class A, Class T, Class B, and Class C redemptions. The deferred sales charges range from 5.00% to 1.00% for Class B shares, 1.00% for Class C shares, 1.00% for certain purchases of Class A shares and .25% for certain purchases of Class T shares.
For the period, sales charge amounts retained by FDC were as follows:
| Retained
by FDC |
Class A | $ 4,301 |
Class T | 1,534 |
Class B* | 2,943 |
Class C* | 466 |
| $ 9,244 |
* When Class B and Class C shares are initially sold, FDC pays commissions from its own resources to financial intermediaries through which the sales are made.
Transfer Agent Fees. Fidelity Investments Institutional Operations Company, Inc. (FIIOC), an affiliate of FMR, is the transfer, dividend disbursing and shareholder servicing agent for each class of the Fund. FIIOC receives account fees and asset-based fees that vary according to the account size and type of account of the shareholders of the respective classes of the Fund. FIIOC pays for typesetting, printing and mailing of
Annual Report
5. Fees and Other Transactions with Affiliates - continued
Transfer Agent Fees - continued
shareholder reports, except proxy statements. For the period, transfer agent fees for each applicable class were as follows:
| Amount | % of
Average
Net Assets |
Class A | $ 54,282 | .30 |
Class T | 26,259 | .32 |
Class B | 6,290 | .30 |
Class C | 20,134 | .30 |
International Small Cap Opportunities | 886,296 | .28 |
Institutional Class | 6,524 | .26 |
| $ 999,785 | |
Accounting and Security Lending Fees. Fidelity Service Company, Inc. (FSC), an affiliate of FMR, maintains the Fund's accounting records. The accounting fee is based on the level of average net assets for each month. Under a separate contract, FSC administers the security lending program. The security lending fee is based on the number and duration of lending transactions.
Brokerage Commissions. The Fund placed a portion of its portfolio transactions with brokerage firms which are affiliates of the investment adviser. The commissions paid to these affiliated firms were $417 for the period.
6. Committed Line of Credit.
The Fund participates with other funds managed by FMR or an affiliate in a $4.25 billion credit facility (the "line of credit") to be utilized for temporary or emergency purposes to fund shareholder redemptions or for other short-term liquidity purposes. The Fund has agreed to pay commitment fees on its pro-rata portion of the line of credit, which amounted to $987 and is reflected in Miscellaneous expenses on the Statement of Operations. During the period, there were no borrowings on this line of credit.
7. Security Lending.
The Fund lends portfolio securities through a lending agent from time to time in order to earn additional income. For equity securities, a lending agent is used and may loan securities to certain qualified borrowers, including Fidelity Capital Markets (FCM), a broker-dealer affiliated with the Fund. On the settlement date of the loan, the Fund
Annual Report
Notes to Financial Statements - continued
7. Security Lending - continued
receives collateral (in the form of U.S. Treasury obligations, letters of credit and/or cash) against the loaned securities and maintains collateral in an amount not less than 100% of the market value of the loaned securities during the period of the loan. The market value of the loaned securities is determined at the close of business of the Fund and any additional required collateral is delivered to the Fund on the next business day. If the borrower defaults on its obligation to return the securities loaned because of insolvency or other reasons, a fund could experience delays and costs in recovering the securities loaned or in gaining access to the collateral. Any cash collateral received is invested in the Fidelity Securities Lending Cash Central Fund. The value of loaned securities and cash collateral at period end are disclosed on the Fund's Statement of Assets and Liabilities. Security lending income represents the income earned on investing cash collateral, less rebates paid to borrowers and any lending agent fees associated with the loan, plus any premium payments received for lending certain types of securities. Security lending income is presented in the Statement of Operations as a component of income from Fidelity Central Funds. Total security lending income during the period amounted to $123,696 During the period, there were no securities loaned to FCM.
8. Expense Reductions.
FMR voluntarily agreed to reimburse each class to the extent annual operating expenses exceeded certain levels of average net assets as noted in the table below. Some expenses, for example interest expense, including commitment fees, are excluded from this reimbursement.
The following classes were in reimbursement during the period:
| Expense
Limitations | Reimbursement
from adviser |
Class A | 1.65% | $ 17,831 |
Class T | 1.90% | 9,529 |
Class B | 2.40% | 2,107 |
Class C | 2.40% | 6,700 |
International Small Cap Opportunities | 1.40% | 233,896 |
Institutional Class | 1.40% | 1,228 |
| | $ 271,291 |
Many of the brokers with whom FMR places trades on behalf of the Fund provided services to the Fund in addition to trade execution. These services included payments of certain expenses on behalf of the Fund totaling $25,931 for the period. In addition, through arrangements with the Fund's custodian, credits realized as a result of
Annual Report
8. Expense Reductions - continued
uninvested cash balances were used to reduce the Fund's expenses. During the period, these credits reduced the Fund's expenses by $5.
9. Distributions to Shareholders.
Distributions to shareholders of each class were as follows:
Years ended October 31, | 2012 | 2011 |
From net investment income | | |
Class A | $ 208,264 | $ 234,699 |
Class T | 69,950 | 95,132 |
Class B | 6,357 | 17,225 |
Class C | 20,258 | 53,555 |
International Small Cap Opportunities | 4,562,121 | 5,789,167 |
Institutional Class | 19,730 | 33,517 |
Total | $ 4,886,680 | $ 6,223,295 |
From net realized gain | | |
Class A | $ 18,763 | $ 81,710 |
Class T | 8,968 | 45,784 |
Class B | 2,355 | 4,543 |
Class C | 7,235 | 13,930 |
International Small Cap Opportunities | 330,589 | 1,606,951 |
Institutional Class | 1,409 | 9,075 |
Total | $ 369,319 | $ 1,761,993 |
10. Share Transactions.
Transactions for each class of shares were as follows:
| Shares | Dollars |
Years ended October 31, | 2012 | 2011 | 2012 | 2011 |
Class A | | | | |
Shares sold | 245,367 | 414,528 | $ 2,443,449 | $ 4,258,719 |
Reinvestment of distributions | 21,375 | 27,655 | 198,575 | 279,266 |
Shares redeemed | (495,775) | (586,134) | (4,923,741) | (5,964,528) |
Net increase (decrease) | (229,033) | (143,951) | $ (2,281,717) | $ (1,426,543) |
Class T | | | | |
Shares sold | 101,299 | 106,538 | $ 986,575 | $ 1,079,217 |
Reinvestment of distributions | 8,148 | 13,404 | 75,201 | 134,702 |
Shares redeemed | (246,162) | (371,432) | (2,450,796) | (3,710,229) |
Net increase (decrease) | (136,715) | (251,490) | $ (1,389,020) | $ (2,496,310) |
Annual Report
Notes to Financial Statements - continued
10. Share Transactions - continued
| Shares | Dollars |
Years ended October 31, | 2012 | 2011 | 2012 | 2011 |
Class B | | | | |
Shares sold | 3,884 | 6,900 | $ 38,597 | $ 67,544 |
Reinvestment of distributions | 862 | 1,989 | 7,845 | 19,877 |
Shares redeemed | (59,335) | (71,270) | (579,917) | (711,316) |
Net increase (decrease) | (54,589) | (62,381) | $ (533,475) | $ (623,895) |
Class C | | | | |
Shares sold | 69,065 | 80,402 | $ 669,794 | $ 802,688 |
Reinvestment of distributions | 2,800 | 5,984 | 25,455 | 59,727 |
Shares redeemed | (170,268) | (295,393) | (1,664,901) | (2,919,335) |
Net increase (decrease) | (98,403) | (209,007) | $ (969,652) | $ (2,056,920) |
International Small Cap Opportunities | | | | |
Shares sold | 5,283,408 | 4,054,816 | $ 53,067,911 | $ 41,630,046 |
Reinvestment of distributions | 495,697 | 693,159 | 4,634,765 | 7,035,420 |
Shares redeemed | (8,350,807) | (11,579,067) | (84,356,251) | (119,651,010) |
Net increase (decrease) | (2,571,702) | (6,831,092) | $ (26,653,575) | $ (70,985,544) |
Institutional Class | | | | |
Shares sold | 348,073 | 36,278 | $ 3,541,043 | $ 362,488 |
Reinvestment of distributions | 1,709 | 3,294 | 15,997 | 33,471 |
Shares redeemed | (70,045) | (141,623) | (705,927) | (1,476,463) |
Net increase (decrease) | 279,737 | (102,051) | $ 2,851,113 | $ (1,080,504) |
11. Other.
The Fund's organizational documents provide former and current trustees and officers with a limited indemnification against liabilities arising in connection with the performance of their duties to the Fund. In the normal course of business, the Fund may also enter into contracts that provide general indemnifications. The Fund's maximum exposure under these arrangements is unknown as this would be dependent on future claims that may be made against the Fund. The risk of material loss from such claims is considered remote.
Annual Report
To the Trustees of Fidelity Investment Trust and Shareholders of Fidelity International Small Cap Opportunities Fund:
We have audited the accompanying statement of assets and liabilities of Fidelity International Small Cap Opportunities Fund (the Fund), a fund of Fidelity Investment Trust, including the schedule of investments, as of October 31, 2012, and the related statement of operations for the year then ended, the statement of changes in net assets for each of the two years in the period then ended, and the financial highlights for each of the five years in the period then ended. These financial statements and financial highlights are the responsibility of the Fund's management. Our responsibility is to express an opinion on these financial statements and financial highlights based on our audits.
We conducted our audits in accordance with the standards of the Public Company Accounting Oversight Board (United States). Those standards require that we plan and perform the audit to obtain reasonable assurance about whether the financial statements and financial highlights are free of material misstatement. The Fund is not required to have, nor were we engaged to perform, an audit of its internal control over financial reporting. Our audits included consideration of internal control over financial reporting as a basis for designing audit procedures that are appropriate in the circumstances, but not for the purpose of expressing an opinion on the effectiveness of the Fund's internal control over financial reporting. Accordingly, we express no such opinion. An audit also includes examining, on a test basis, evidence supporting the amounts and disclosures in the financial statements, assessing the accounting principles used and significant estimates made by management, as well as evaluating the overall financial statement presentation. Our procedures included confirmation of securities owned as of October 31, 2012, by correspondence with the custodians and brokers; where replies were not received from brokers, we performed other auditing procedures. We believe that our audits provide a reasonable basis for our opinion.
In our opinion, the financial statements and financial highlights referred to above present fairly, in all material respects, the financial position of Fidelity International Small Cap Opportunities Fund as of October 31, 2012, the results of its operations for the year then ended, the changes in its net assets for each of the two years in the period then ended, and the financial highlights for each of the five years in the period then ended, in conformity with accounting principles generally accepted in the United States of America.
DELOITTE & TOUCHE LLP
Boston, Massachusetts
December 14, 2012
Annual Report
The Trustees, Members of the Advisory Board, and executive officers of the trust and fund, as applicable, are listed below. The Board of Trustees governs the fund and is responsible for protecting the interests of shareholders. The Trustees are experienced executives who meet periodically throughout the year to oversee the fund's activities, review contractual arrangements with companies that provide services to the fund, oversee management of the risks associated with such activities and contractual arrangements, and review the fund's performance. Except for James C. Curvey, each of the Trustees oversees 236 funds advised by FMR or an affiliate. Mr. Curvey oversees 443 funds advised by FMR or an affiliate.
The Trustees hold office without limit in time except that (a) any Trustee may resign; (b) any Trustee may be removed by written instrument, signed by at least two-thirds of the number of Trustees prior to such removal; (c) any Trustee who requests to be retired or who has become incapacitated by illness or injury may be retired by written instrument signed by a majority of the other Trustees; and (d) any Trustee may be removed at any special meeting of shareholders by a two-thirds vote of the outstanding voting securities of the trust. Each Trustee who is not an interested person (as defined in the 1940 Act) (Independent Trustee), shall retire not later than the last day of the calendar year in which his or her 75th birthday occurs. The Independent Trustees may waive this mandatory retirement age policy with respect to individual Trustees. The executive officers and Advisory Board Members hold office without limit in time, except that any officer and Advisory Board Member may resign or may be removed by a vote of a majority of the Trustees at any regular meeting or any special meeting of the Trustees. Except as indicated, each individual has held the office shown or other offices in the same company for the past five years.
Experience, Skills, Attributes, and Qualifications of the Fund's Trustees. The Governance and Nominating Committee has adopted a statement of policy that describes the experience, qualifications, attributes, and skills that are necessary and desirable for potential Independent Trustee candidates (Statement of Policy). The Board believes that each Trustee satisfied at the time he or she was initially elected or appointed a Trustee, and continues to satisfy, the standards contemplated by the Statement of Policy. The Governance and Nominating Committee also engages professional search firms to help identify potential Independent Trustee candidates who have the experience, qualifications, attributes, and skills consistent with the Statement of Policy. From time to time, additional criteria based on the composition and skills of the current Independent Trustees, as well as experience or skills that may be appropriate in light of future changes to board composition, business conditions, and regulatory or other developments, have also been considered by the professional search firms and the Governance and Nominating Committee. In addition, the Board takes into account the Trustees' commitment and participation in Board and committee meetings, as well as their leadership of standing and ad hoc committees throughout their tenure.
In determining that a particular Trustee was and continues to be qualified to serve as a Trustee, the Board has considered a variety of criteria, none of which, in isolation, was controlling. The Board believes that, collectively, the Trustees have balanced and diverse experience, qualifications, attributes, and skills, which allow the Board to operate effectively in governing the fund and protecting the interests of shareholders. Information about the specific experience, skills, attributes, and qualifications of each Trustee, which in each case led to the Board's conclusion that the Trustee should serve (or continue to serve) as a trustee of the fund, is provided below.
Annual Report
Board Structure and Oversight Function. James C. Curvey is an interested person (as defined in the 1940 Act) and currently serves as Chairman. The Trustees have determined that an interested Chairman is appropriate and benefits shareholders because an interested Chairman has a personal and professional stake in the quality and continuity of services provided to the fund. Independent Trustees exercise their informed business judgment to appoint an individual of their choosing to serve as Chairman, regardless of whether the Trustee happens to be independent or a member of management. The Independent Trustees have determined that they can act independently and effectively without having an Independent Trustee serve as Chairman and that a key structural component for assuring that they are in a position to do so is for the Independent Trustees to constitute a substantial majority for the Board. The Independent Trustees also regularly meet in executive session. Ned C. Lautenbach serves as Chairman of the Independent Trustees and as such (i) acts as a liaison between the Independent Trustees and management with respect to matters important to the Independent Trustees and (ii) with management prepares agendas for Board meetings.
Fidelity funds are overseen by different Boards of Trustees. The fund's Board oversees Fidelity's equity and high income funds and another Board oversees Fidelity's investment-grade bond, money market, and asset allocation funds. The asset allocation funds may invest in Fidelity funds overseen by the fund's Board. The use of separate Boards, each with its own committee structure, allows the Trustees of each group of Fidelity funds to focus on the unique issues of the funds they oversee, including common research, investment, and operational issues. On occasion, the separate Boards establish joint committees to address issues of overlapping consequences for the Fidelity funds overseen by each Board.
The Trustees operate using a system of committees to facilitate the timely and efficient consideration of all matters of importance to the Trustees, the fund, and fund shareholders and to facilitate compliance with legal and regulatory requirements and oversight of the fund's activities and associated risks. The Board, acting through its committees, has charged FMR and its affiliates with (i) identifying events or circumstances the occurrence of which could have demonstrably adverse effects on the fund's business and/or reputation; (ii) implementing processes and controls to lessen the possibility that such events or circumstances occur or to mitigate the effects of such events or circumstances if they do occur; and (iii) creating and maintaining a system designed to evaluate continuously business and market conditions in order to facilitate the identification and implementation processes described in (i) and (ii) above. Because the day-to-day operations and activities of the fund are carried out by or through FMR, its affiliates and other service providers, the fund's exposure to risks is mitigated but not eliminated by the processes overseen by the Trustees. While each of the Board's committees has responsibility for overseeing different aspects of the fund's activities, oversight is exercised primarily through the Operations, Audit, and Compliance Committees. In addition, the Independent Trustees have worked with FMR to enhance the Board's oversight of investment and financial risks, legal and regulatory risks, technology risks, and operational risks, including the development of additional risk reporting to the Board. For example, a working group comprised of Independent Trustees and FMR has worked and continues to work to review the Fidelity funds' valuation-related activities, reporting and risk management. Appropriate personnel, including but not limited to the fund's Chief Compliance Officer (CCO), FMR's internal auditor, the independent accountants, the fund's Treasurer and portfolio management personnel, make periodic reports to the Board's committees, as appropriate, including an annual review of FMR's risk management program for the Fidelity funds. The responsibilities of each standing committee, including their oversight responsibilities, are described further under "Standing Committees of the Fund's Trustees."
Annual Report
Trustees and Officers - continued
The fund's Statement of Additional Information (SAI) includes more information about the Trustees. To request a free copy, call Fidelity at 1-877-208-0098.
Interested Trustees*:
Correspondence intended for each Trustee who is an interested person may be sent to Fidelity Investments, 82 Devonshire Street, Boston, Massachusetts 02109.
Name, Age; Principal Occupations and Other Relevant Experience+ |
James C. Curvey (77) |
| Year of Election or Appointment: 2007 Mr. Curvey is Trustee and Chairman of the Board of Trustees of certain Trusts. Mr. Curvey also serves as Trustee (2007-present) of other investment companies advised by FMR. Mr. Curvey is a Director of Fidelity Investments Money Management, Inc. (2009-present), Director of Fidelity Research & Analysis Co. (2009-present) and Director of FMR and FMR Co., Inc. (2007-present). Mr. Curvey is also Vice Chairman (2007-present) and Director of FMR LLC. In addition, Mr. Curvey serves as an Overseer for the Boston Symphony Orchestra and a member of the Trustees of Villanova University. Previously, Mr. Curvey was the Vice Chairman (2006-2007) and Director (2000-2007) of FMR Corp. |
Ronald P. O'Hanley (55) |
| Year of Election or Appointment: 2011 Mr. O'Hanley is Director of FMR Co., Inc. (2010-present), Director of Fidelity Investments Money Management, Inc. (2010-present), Director of Fidelity Research & Analysis Company (2010-present), President of Fidelity Asset Management and Corporate Services and a member of Fidelity's Executive Committee (2010-present). Previously, Mr. O'Hanley served as President and Chief Executive Officer of BNY Mellon Asset Management (2007-2010). Mr. O'Hanley also served as Vice Chairman of Bank New York Mellon Corp. and a member of that firm's Executive Committee. Prior to the 2007 merger of The Bank of New York and Mellon Financial Corporation, he was Vice Chairman of Mellon Financial Corporation and President and Chief Executive Officer of Mellon Asset Management. He joined Mellon in February 1997. Mr. O'Hanley currently serves as Chairman of the Boston Public Library Foundation Board of Directors and sits on the Board of Directors of Beth Israel Deaconess Medical Center, the Board of Trustees of the Marine Biological Laboratory and the Advisory Board of the Maxwell School of Citizenship and Public Administration at Syracuse University. Mr. O'Hanley also chairs the Council on Asset Management for the Financial Services Roundtable and is a member of the Board of Directors of Institutional Investor's U.S. Institute. |
* Trustees have been determined to be "Interested Trustees" by virtue of, among other things, their affiliation with the trust or various entities under common control with FMR.
+ The information above includes each Trustee's principal occupation during the last five years and other information relating to the experience, attributes, and skills relevant to each Trustee's qualifications to serve as a Trustee, which led to the conclusion that each Trustee should serve as a Trustee for the fund.
Annual Report
Trustees and Officers - continued
Independent Trustees:
Correspondence intended for each Independent Trustee (that is, the Trustees other than the Interested Trustees) may be sent to Fidelity Investments, P.O. Box 55235, Boston, Massachusetts 02205-5235.
Name, Age; Principal Occupations and Other Relevant Experience+ |
Dennis J. Dirks (64) |
| Year of Election or Appointment: 2005 Prior to his retirement in May 2003, Mr. Dirks was Chief Operating Officer and a member of the Board of The Depository Trust & Clearing Corporation (DTCC). He also served as President, Chief Operating Officer, and Board member of The Depository Trust Company (DTC) and President and Board member of the National Securities Clearing Corporation (NSCC). In addition, Mr. Dirks served as Chief Executive Officer and Board member of the Government Securities Clearing Corporation, Chief Executive Officer and Board member of the Mortgage-Backed Securities Clearing Corporation, as a Trustee and a member of the Finance Committee of Manhattan College (2005-2008), and as a Trustee and a member of the Finance Committee of AHRC of Nassau County (2006-2008). Mr. Dirks is a member of the Independent Directors Council (IDC) Governing Council (2010-present) and Board of Directors for The Brookville Center for Children's Services, Inc. (2009-present). |
Alan J. Lacy (59) |
| Year of Election or Appointment: 2008 Mr. Lacy serves as Senior Adviser (2007-present) of Oak Hill Capital Partners, L.P. (private equity). Mr. Lacy also served as Chief Executive Officer (2000-2005) and Vice Chairman (2005-2006) of Sears Holdings Corporation and Sears, Roebuck and Co. (retail). In addition, Mr. Lacy serves as a member of the Board of Directors of Dave & Buster's Entertainment, Inc. (restaurant and entertainment complexes, 2010-present), Earth Fare, Inc. (retail grocery, 2012-present), The Hillman Companies, Inc. (hardware wholesalers, 2010-present), and Bristol-Myers Squibb Company (global pharmaceuticals, 2008-present). Mr. Lacy is a member of the Board of Trustees of The National Parks Conservation Association (2006-present). Previously, Mr. Lacy served as Chairman of the Board of Trustees of the National Parks Conservation Association (2008-2011) and as a member of the Board of Directors for the Western Union Company (global money transfer, 2006-2011). |
Ned C. Lautenbach (68) |
| Year of Election or Appointment: 2000 Mr. Lautenbach is Chairman of the Independent Trustees of the Equity and High Income Funds (2006-present). Mr. Lautenbach currently serves as the Lead Director of the Eaton Corporation Board of Directors (diversified industrial, 1997-present). Mr. Lautenbach is Chairman of the Board of Directors of the Philharmonic Center for the Arts in Naples, Florida (2012-present) and a member of the Council on Foreign Relations (1994-present). Previously, Mr. Lautenbach was a Partner/Advisory Partner at Clayton, Dubilier & Rice, LLC (private equity investment, 1998-2010), as well as a Director of Sony Corporation (2006-2007). |
Joseph Mauriello (68) |
| Year of Election or Appointment: 2008 Prior to his retirement in January 2006, Mr. Mauriello served in numerous senior management positions including Deputy Chairman and Chief Operating Officer (2004-2005), and Vice Chairman of Financial Services (2002-2004) of KPMG LLP US (professional services, 1965-2005). Mr. Mauriello currently serves as a member of the Board of Directors of XL Group plc. (global insurance and re-insurance, 2006-present). Previously, Mr. Mauriello served as a Director of the Hamilton Funds of the Bank of New York (2006-2007) and of Arcadia Resources Inc. (health care services and products, 2007-2012). |
Robert W. Selander (62) |
| Year of Election or Appointment: 2011 Previously, Mr. Selander served as a Member of the Advisory Board of Fidelity's Equity and High Income Funds (2011), Executive Vice Chairman (2010), Chief Executive Officer (2009-2010), and President and Chief Executive Officer (1997-2009) of Mastercard, Inc. |
Cornelia M. Small (68) |
| Year of Election or Appointment: 2005 Ms. Small is a member of the Board of Directors (2009-present) and Chair of the Investment Committee (2010-present) of the Teagle Foundation. Ms. Small also serves on the Investment Committee of the Berkshire Taconic Community Foundation (2008-present). Previously, Ms. Small served as Chairperson (2002-2008) and a member of the Investment Committee and Chairperson (2008-2012) and a member of the Board of Trustees of Smith College. In addition, Ms. Small served as Chief Investment Officer, Director of Global Equity Investments, and a member of the Board of Directors of Scudder, Stevens & Clark and Scudder Kemper Investments. |
William S. Stavropoulos (73) |
| Year of Election or Appointment: 2001 Mr. Stavropoulos is Vice Chairman of the Independent Trustees of the Equity and High Income Funds (2006-present). Mr. Stavropoulos serves as President and Founder of the Michigan Baseball Foundation, the Great Lakes Loons (2007-present). Mr. Stavropoulos is Chairman Emeritus of the Board of Directors of The Dow Chemical Company, where he previously served in numerous senior management positions, including President, CEO (1995-2000; 2002-2004), Chairman of the Executive Committee (2000-2006), and as a member of the Board of Directors (1990-2006). Currently, Mr. Stavropoulos is a Director of Univar Inc. (global distributor of commodity and specialty chemicals, Chairman from 2010-May 2012 and Lead Director from May 2012-present), Teradata Corporation (data warehousing and technology solutions, 2008-present), Maersk Inc. (industrial conglomerate), and Tyco International, Ltd. (multinational manufacturing and services, 2007-present), and a member of the Advisory Board for Metalmark Capital LLC (private equity investment, 2005-present). Mr. Stavropoulos is an operating advisor to Clayton, Dubilier & Rice, LLC (private equity investment). In addition, Mr. Stavropoulos is a member of the University of Notre Dame Advisory Council for the College of Science, a Trustee of the Rollin L. Gerstacker Foundation, and a Director of the Naples Philharmonic Center for the Arts. Previously, Mr. Stavropoulos served as a Director of Chemical Financial Corporation (bank holding company, 1993-2012). |
David M. Thomas (63) |
| Year of Election or Appointment: 2008 Previously, Mr. Thomas served as Executive Chairman (2005-2006) and Chairman and Chief Executive Officer (2000-2005) of IMS Health, Inc. (pharmaceutical and healthcare information solutions), and a Director of Fortune Brands, Inc. (consumer products, 2000-2011). In addition, Mr. Thomas serves as Non-Executive Chairman of the Board of Directors of Fortune Brands Home and Security (home and security products, 2011-present), and as a member of the Board of Directors of Interpublic Group of Companies, Inc. (marketing communication, 2004-present). |
Michael E. Wiley (62) |
| Year of Election or Appointment: 2008 Mr. Wiley also serves as a Director of Asia Pacific Exploration Consolidated (international oil and gas exploration and production, 2008-present). Mr. Wiley serves as a Director of Tesoro Corporation (independent oil refiner and marketer, 2005-present), and a Director of Bill Barrett Corporation (exploration and production, 2005-present). In addition, Mr. Wiley also serves as a Director of Post Oak Bank (privately-held bank, 2004-present). Previously, Mr. Wiley served as a member of the Board of Trustees of the University of Tulsa (2000-2006; 2007-2010), as a Senior Energy Advisor of Katzenbach Partners, LLC (consulting, 2006-2007), as an Advisory Director of Riverstone Holdings (private investment), Chairman, President, and CEO of Baker Hughes, Inc. (oilfield services, 2000-2004), and as Director of Spinnaker Exploration Company (exploration and production, 2001-2005). |
+ The information above includes each Trustee's principal occupation during the last five years and other information relating to the experience, attributes, and skills relevant to each Trustee's qualifications to serve as a Trustee, which led to the conclusion that each Trustee should serve as a Trustee for the fund.
Advisory Board Members and Executive Officers:
Correspondence intended for David A. Rosow and Garnett A. Smith may be sent to Fidelity Investments, P.O. Box 55235, Boston, Massachusetts 02205-5235. Correspondence intended for each executive officer, Edward C. Johnson 3d, and Peter S. Lynch may be sent to Fidelity Investments, 82 Devonshire Street, Boston, Massachusetts 02109.
Name, Age; Principal Occupation |
Edward C. Johnson 3d (82) |
| Year of Election or Appointment: 2011 Member of the Advisory Board of Fidelity's Equity and High Income Funds. Mr. Johnson serves as Chief Executive Officer, Chairman, and a Director of FMR LLC, and also serves as Chairman and Director of FIL Limited. Previously, Mr. Johnson served as a Trustee and Chairman of the Board of certain Fidelity Trusts, Chairman and a Director of FMR, Chairman and a Director of FMR Co., Inc., and President of FMR LLC (2006-2007). |
Peter S. Lynch (68) |
| Year of Election or Appointment: 2003 Member of the Advisory Board of Fidelity's Equity and High Income Funds. Mr. Lynch is Vice Chairman and a Director of FMR and FMR Co., Inc. In addition, Mr. Lynch serves as a Trustee of Boston College and as the Chairman of the Inner-City Scholarship Fund. Previously, Mr. Lynch served on the Special Olympics International Board of Directors (1997-2006). |
David A. Rosow (70) |
| Year of Election or Appointment: 2012 Member of the Advisory Board of Fidelity's Equity and High Income Funds. Chairman and Chief Executive Officer of International Golf Group, Inc. (golf course development, 1989-present). Previously, Mr. Rosow served as Chairman and Chief Executive Officer of Rosow & Company, Inc. (private investment company, 1989-2011), a Lead Director of Hudson United Bancorp (2001-2006) and as a Director of TD Banknorth (1996-2006). In addition, Mr. Rosow is a member (2008-present) and President (2009-present) of the Town Council of Palm Beach, Florida. |
Garnett A. Smith (65) |
| Year of Election or Appointment: 2012 Member of the Advisory Board of Fidelity's Equity and High Income Funds. Prior to Mr. Smith's retirement, he served as Chairman and Chief Executive Officer of Inbrand Corp. (manufacturer of personal absorbent products, 1990-1997). He also served as President (1986-1990) of Inbrand Corp. Prior to his employment with Inbrand Corp., he was employed by a retail fabric chain and North Carolina National Bank. In addition, Mr. Smith is a board member of the Jackson Hole Land Trust (2009-present). |
Kenneth B. Robins (43) |
| Year of Election or Appointment: 2008 President and Treasurer of Fidelity's Equity and High Income Funds. Mr. Robins also serves as President and Treasurer (2010-present) and Assistant Treasurer (2009-present) of other Fidelity funds and is an employee of Fidelity Investments (2004-present). Previously, Mr. Robins served as Deputy Treasurer of the Fidelity funds (2005-2008) and Treasurer and Chief Financial Officer of The North Carolina Capital Management Trust: Cash and Term Portfolios (2006-2008). |
Bruce T. Herring (47) |
| Year of Election or Appointment: 2006 Vice President of certain Equity Funds. Mr. Herring also serves as President of Fidelity Research & Analysis Company (2010-present), Chief Investment Officer and Director of Fidelity Management & Research (U.K.) Inc. (2010-present) and Group Chief Investment Officer of FMR. Previously, Mr. Herring served as Vice President (2005-2006) and Senior Vice President (2006-2007) of Fidelity Management & Research Company, Vice President of FMR Co., Inc. (2001-2007) and as a portfolio manager for Fidelity U.S. Equity Funds. |
Brian B. Hogan (48) |
| Year of Election or Appointment: 2009 Vice President of Equity and High Income Funds. Mr. Hogan also serves as President of FMR's Equity Division (2009-present). Previously, Mr. Hogan served as Senior Vice President, Equity Research of FMR (2006-2009) and as a portfolio manager. |
Scott C. Goebel (44) |
| Year of Election or Appointment: 2008 Secretary and Chief Legal Officer (CLO) of the Fidelity funds. Mr. Goebel also serves as Secretary of Fidelity Investments Money Management, Inc. (FIMM) (2010-present) and Fidelity Research and Analysis Company (FRAC) (2010-present); Secretary and CLO of The North Carolina Capital Management Trust: Cash and Term Portfolios (2008-present); General Counsel, Secretary, and Senior Vice President of FMR (2008-present) and FMR Co., Inc. (2008-present); employed by FMR LLC or an affiliate (2001-present); Chief Legal Officer of Fidelity Management & Research (Hong Kong) Limited (2008-present) and Assistant Secretary of Fidelity Management & Research (Japan) Inc. (2008-present), and Fidelity Management & Research (U.K.) Inc. (2008-present). Previously, Mr. Goebel served as Assistant Secretary of FIMM (2008-2010), FRAC (2008-2010), and the Funds (2007-2008) and as Vice President and Secretary of Fidelity Distributors Corporation (FDC) (2005-2007). |
William C. Coffey (43) |
| Year of Election or Appointment: 2009 Assistant Secretary of Fidelity's Equity and High Income Funds. Mr. Coffey also serves as Senior Vice President and Deputy General Counsel of FMR LLC (2010-present), and is an employee of Fidelity Investments. Previously, Mr. Coffey served as Vice President and Associate General Counsel of FMR LLC (2005-2009). |
Elizabeth Paige Baumann (44) |
| Year of Election or Appointment: 2012 Anti-Money Laundering (AML) Officer of the Fidelity funds. Ms. Baumann also serves as AML Officer of The North Carolina Capital Management Trust: Cash and Term Portfolios (2012-present), Chief AML Officer of FMR LLC (2012-present), and is an employee of Fidelity Investments. Previously, Ms. Baumann served as Vice President and Deputy Anti-Money Laundering Officer (2007-2012). |
Christine Reynolds (54) |
| Year of Election or Appointment: 2008 Chief Financial Officer of the Fidelity funds. Ms. Reynolds became President of Fidelity Pricing and Cash Management Services (FPCMS) in August 2008. Ms. Reynolds served as Chief Operating Officer of FPCMS (2007-2008). Previously, Ms. Reynolds served as President, Treasurer, and Anti-Money Laundering officer of the Fidelity funds (2004-2007). |
Joseph A. Hanlon (44) |
| Year of Election or Appointment: 2012 Chief Compliance Officer of Fidelity's Equity and High Income Funds. Mr. Hanlon serves as Compliance Officer of FMR, FMR Co., Inc., Fidelity Investments Money Management, Inc. (FIMM), Fidelity Research and Analysis Company (FRAC), Fidelity Management & Research (Japan) Inc., Fidelity Management & Research (U.K.) Inc., Fidelity Management & Research (Hong Kong), and Strategic Advisers, Inc. (2009-present), as Senior Vice President of the Fidelity Asset Management Division (2009-present), and is an employee of Fidelity Investments. |
Joseph F. Zambello (55) |
| Year of Election or Appointment: 2011 Deputy Treasurer of the Fidelity funds. Mr. Zambello is an employee of Fidelity Investments. Previously, Mr. Zambello served as Vice President of FMR's Program Management Group (2009-2011) and Vice President of the Transfer Agent Oversight Group (2005-2009). |
Adrien E. Deberghes (45) |
| Year of Election or Appointment: 2008 Deputy Treasurer of Fidelity's Equity and High Income Funds. Mr. Deberghes also serves as Vice President (2011-present) and Assistant Treasurer (2010-present) of other Fidelity funds, and is an employee of Fidelity Investments (2008-present). Previously, Mr. Deberghes served as Senior Vice President of Mutual Fund Administration at State Street Corporation (2007-2008), Senior Director of Mutual Fund Administration at Investors Bank & Trust (2005-2007), and Director of Finance for Dunkin' Brands (2000-2005). |
Stephen Sadoski (41) |
| Year of Election or Appointment: 2012 Deputy Treasurer of Fidelity's Equity and High Income Funds. Mr. Sadoski also serves as Assistant Treasurer of other Fidelity funds (2012-present) and is an employee of Fidelity Investments (2012-present). Previously, Mr. Sadoski served as an assistant chief accountant in the Division of Investment Management of the Securities and Exchange Commission (SEC) (2009-2012) and as a senior manager at Deloitte & Touche (1997-2009). |
Stephanie J. Dorsey (43) |
| Year of Election or Appointment: 2010 Assistant Treasurer of Fidelity's Equity and High Income Funds. Ms. Dorsey also serves as Deputy Treasurer of other Fidelity funds (2008-present) and is an employee of Fidelity Investments (2008-present). Previously, Ms. Dorsey served as Treasurer (2004-2008) of the JPMorgan Mutual Funds and Vice President (2004-2008) of JPMorgan Chase Bank. |
John R. Hebble (54) |
| Year of Election or Appointment: 2009 Assistant Treasurer of Fidelity's Equity and High Income Funds. Mr. Hebble also serves as President (2011-present), Treasurer, and Chief Financial Officer of The North Carolina Capital Management Trust: Cash and Term Portfolios (2008-present), President and Treasurer of other Fidelity funds (2008-present) and is an employee of Fidelity Investments. |
Gary W. Ryan (54) |
| Year of Election or Appointment: 2005 Assistant Treasurer of the Fidelity funds. Mr. Ryan is an employee of Fidelity Investments. Previously, Mr. Ryan served as Vice President of Fund Reporting in Fidelity Pricing and Cash Management Services (FPCMS) (1999-2005). |
Jonathan Davis (44) |
| Year of Election or Appointment: 2010 Assistant Treasurer of the Fidelity funds. Mr. Davis is also Assistant Treasurer of Fidelity Rutland Square Trust II and Fidelity Commonwealth Trust II. Mr. Davis is an employee of Fidelity Investments. Previously, Mr. Davis served as Vice President and Associate General Counsel of FMR LLC (2003-2010). |
Annual Report
The Board of Trustees of Advisor International Small Cap Opportunities Fund voted to pay to shareholders of record at the opening of business on record date, the following distributions per share derived from capital gains realized from sales of portfolio securities, and dividends derived from net investment income:
| Pay Date | Record Date | Dividends | Capital Gains |
Class A | 12/10/12 | 12/07/12 | $0.077 | $0.005 |
Class T | 12/10/12 | 12/07/12 | $0.054 | $0.005 |
Class B | 12/10/12 | 12/07/12 | $0.003 | $0.005 |
Class C | 12/10/12 | 12/07/12 | $0.011 | $0.005 |
Class A designates 6%, Class T designates 8%, Class B designates 17% and Class C designates 17% of the dividends distributed during the fiscal year as qualifying for the dividends-received deduction for corporate shareholders.
Class A, Class T, Class B and Class C designates 100% of the dividends distributed during the fiscal year as amounts which may be taken into account as a dividend for purposes of the maximum rate under section 1(h) (11) of the Internal Revenue Code.
The amounts per share which represent income derived from sources within, and taxes paid to, foreign countries or possessions of the United States are as follows:
| Pay Date | Income | Taxes |
Class A | 12/05/11 | $0.131 | $0.0103 |
| | | |
Class T | 12/05/11 | $0.098 | $0.0103 |
| | | |
Class B | 12/05/11 | $0.047 | $0.0103 |
| | | |
Class C | 12/05/11 | $0.048 | $0.0103 |
| | | |
The fund will notify shareholders in January 2013 of amounts for use in preparing 2012 income tax returns.
Annual Report
Board Approval of Investment Advisory Contracts and Management Fees
Fidelity International Small Cap Opportunities Fund
Each year, the Board of Trustees, including the Independent Trustees (together, the Board), votes on the renewal of the management contract and sub-advisory agreements (together, the Advisory Contracts) for the fund. The Board, assisted by the advice of fund counsel and Independent Trustees' counsel, requests and considers a broad range of information relevant to the renewal of the Advisory Contracts throughout the year.
The Board meets regularly and, at each of its meetings, considers factors that are relevant to its annual consideration of the renewal of the fund's Advisory Contracts, including the services and support provided to the fund and its shareholders. The Board has established various standing committees, each composed of and chaired by Independent Trustees with varying backgrounds, to which the Board has assigned specific subject matter responsibilities in order to enhance effective decision-making by the Board. The Board, acting directly and through its Committees, requests and receives information concerning the annual consideration of the renewal of the fund's Advisory Contracts. The Board also meets as needed to consider matters specifically related to the Board's annual consideration of the renewal of Advisory Contracts. Members of the Board may also meet with trustees of other Fidelity funds through ad hoc joint committees to discuss certain matters relevant to the Fidelity funds.
At its July 2012 meeting, the Board of Trustees, including the Independent Trustees, unanimously determined to renew the fund's Advisory Contracts. In reaching its determination, the Board considered all factors it believed relevant, including (i) the nature, extent, and quality of the services to be provided to the fund and its shareholders (including the investment performance of the fund); (ii) the competitiveness of the fund's management fee and total expense ratio relative to peer funds; (iii) the total costs of the services to be provided by and the profits to be realized by Fidelity from its relationship with the fund; (iv) the extent to which economies of scale exist and would be realized as the fund grows; and (v) whether fee levels reflect these economies of scale, if any, for the benefit of fund shareholders.
In considering whether to renew the Advisory Contracts for the fund, the Board reached a determination, with the assistance of fund counsel and Independent Trustees' counsel and through the exercise of its business judgment, that the renewal of the Advisory Contracts is in the best interests of the fund and its shareholders and that the compensation payable under the Advisory Contracts is fair and reasonable. The Board's decision to renew the Advisory Contracts was not based on any single factor, but rather was based on a comprehensive consideration of all the information provided to the Board at its meetings throughout the year. The Board, in reaching its determination to renew the Advisory Contracts, is aware that shareholders in the fund have a broad range of investment choices available to them, including a wide choice among mutual funds offered by Fidelity's competitors, and that the fund's shareholders, who have the opportunity to review and weigh the disclosure provided by the fund in its prospectus and other public disclosures, have chosen to invest in this fund, managed by Fidelity.
Annual Report
Board Approval of Investment Advisory Contracts and
Management Fees - continued
Nature, Extent, and Quality of Services Provided. The Board considered the staffing within the investment adviser, FMR, and the sub-advisers (together, the Investment Advisers), including the backgrounds of the fund's investment personnel, and also considered the fund's investment objective, strategies, and related investment philosophy. The Independent Trustees also had discussions with senior management of Fidelity's investment operations and investment groups. The Board considered the structure of the portfolio manager compensation program and whether this structure provides appropriate incentives to act in the best interests of the fund.
Resources Dedicated to Investment Management and Support Services. The Board and the Fund Oversight and Research Committees reviewed the general qualifications and capabilities of the Investment Advisers' investment staff, including its size, education, experience, and resources, as well as the Investment Advisers' approach to recruiting, training, managing, and compensating investment personnel. The Board also noted that FMR has continued to increase the resources devoted to non-U.S. offices, including expansion of Fidelity's global investment organization. The Board noted that Fidelity's analysts have extensive resources, tools and capabilities that allow them to conduct sophisticated quantitative and fundamental analysis, as well as credit analysis of issuers, counterparties and guarantors. The Board also believes that Fidelity's investment professionals have sufficient access to global information and data so as to provide competitive investment results over time, and that those professionals also have access to sophisticated tools that permit them to assess portfolio construction and risk and performance attribution characteristics continuously, as well as to transmit new information and research conclusions rapidly around the world. Additionally, in its deliberations, the Board considered the Investment Advisers' trading and risk management capabilities and resources, which are an integral part of the investment management process.
Shareholder and Administrative Services. The Board considered (i) the nature, extent, quality, and cost of advisory, administrative, and shareholder services performed by the Investment Advisers and their affiliates under the Advisory Contracts and under separate agreements covering transfer agency, pricing and bookkeeping, and securities lending services for the fund; (ii) the nature and extent of the supervision of third party service providers, principally custodians and subcustodians; and (iii) the resources devoted to, and the record of compliance with, the fund's compliance policies and procedures. The Board also reviewed the allocation of fund brokerage, including allocations to brokers affiliated with the Investment Advisers, the use of brokerage commissions to pay fund expenses, and the use of "soft" commission dollars to pay for research services.
Annual Report
The Board noted that the growth of fund assets over time across the complex allows Fidelity to reinvest in the development of services designed to enhance the value or convenience of the Fidelity funds as investment vehicles. These services include 24-hour access to account information and market information through telephone representatives and over the Internet, investor education materials and asset allocation tools, and the expanded availability of Fidelity Investor Centers.
Investment in a Large Fund Family. The Board considered the benefits to shareholders of investing in a Fidelity fund, including the benefits of investing in a fund that is part of a large family of funds offering a variety of investment disciplines and providing a large variety of mutual fund investor services. The Board noted that Fidelity had taken, or had made recommendations that resulted in the Fidelity funds taking, a number of actions over the previous year that benefited particular funds, including (i) continuing to dedicate additional resources to investment research and support of the senior management team that oversees asset management; (ii) persisting in efforts to enhance Fidelity's research capabilities, in particular, international research; (iii) launching new funds and making other enhancements to meet client needs for global and income-oriented solutions; (iv) continuing to launch dedicated lower cost underlying funds to meet investment management's portfolio construction needs related to expanding underlying fund options, specifically for the Freedom Fund product lines; (v) adopting a "Stock Selector" sector neutral investment approach and employing a team of portfolio managers who are sector specialists to manage certain funds; (vi) rationalizing product lines and gaining increased efficiencies through the mergers of several funds into other funds; (vii) strengthening the Spartan Index Fund product line by adding new funds and/or new low-cost institutional share classes, restructuring fund expenses to accommodate new classes, and reducing investment minimums for certain classes of shares; (viii) modifying the eligibility criteria for Institutional Class shares to increase their appeal to government entities and charitable investors; and (ix) reducing certain transfer agent fee rates.
Investment Performance. The Board considered whether the fund has operated in accordance with its investment objective, as well as its record of compliance with its investment restrictions. It also reviewed the fund's absolute investment performance for each class, as well as the fund's relative investment performance for each class measured over multiple periods against (i) a broad-based securities market index, and (ii) a peer group of mutual funds deemed appropriate by Fidelity and reviewed by the Board. The following charts considered by the Board show, over the one-, three-, and five-year periods ended December 31, 2011, the cumulative total returns of Institutional Class (Class I) and Class C of the fund, the cumulative total returns of a broad-based securities market index ("benchmark"), and a range of cumulative total returns of a peer group of mutual funds identified by Lipper Inc. as having an investment objective similar to that of the fund. The returns of Institutional Class (Class I) and Class C show the performance of the highest and lowest performing classes, respectively (based on five-year performance). The box within each chart shows the 25th percentile return (top of box) and the 75th percentile return (bottom of box) of the peer group. Returns shown above the box are in the first quartile and returns shown below the box are in the fourth quartile. The percentage beaten numbers noted below each chart correspond to the percentile box and represent the percentage of funds in the peer group whose performance was equal to or lower than that of the class indicated.
Annual Report
Board Approval of Investment Advisory Contracts and
Management Fees - continued
Fidelity International Small Cap Opportunities Fund

The Board reviewed the fund's relative investment performance against its peer group and noted that the performance of Institutional Class (Class I) of the fund was in the first quartile for the one- and three-year periods and the fourth quartile for the five-year period. The Board also noted that the investment performance of Institutional Class (Class I) the fund compared favorably to its benchmark for the one- and three-year periods, although the fund's five-year cumulative total return was lower than its benchmark. The Board considered that the variations in performance among the fund's classes reflect the variations in class expenses, which result in lower performance for higher expense classes. The Board also reviewed the fund's performance since inception as well as performance in the current year.
The Board also considered that the fund's management fee is subject to upward or downward adjustment depending upon whether, and to what extent, the fund's investment performance for the performance period exceeds, or is exceeded by, the record (over the same period) of a Board-approved performance adjustment index. The Board noted that the performance adjustment provides FMR with a strong economic incentive to seek to achieve superior performance for the fund's shareholders and helps to more closely align the interests of FMR and the fund's shareholders.
Annual Report
Based on its review, the Board concluded that the nature, extent, and quality of services provided to the fund under the Advisory Contracts should benefit the fund's shareholders.
Competitiveness of Management Fee and Total Expense Ratio. The Board considered the fund's management fee and total expense ratio compared to "mapped groups" of competitive funds and classes. Fidelity creates "mapped groups" by combining similar Lipper investment objective categories that have comparable management fee characteristics. Combining Lipper investment objective categories aids the Board's management fee and total expense ratio comparisons by broadening the competitive group used for comparison and by reducing the number of universes to which various Fidelity funds are compared.
Management Fee. The Board considered two proprietary management fee comparisons for the 12-month periods shown in the chart below. The group of Lipper funds used by the Board for management fee comparisons is referred to below as the "Total Mapped Group." The Total Mapped Group is broader than the Lipper peer group used by the Board for performance comparisons because the Total Mapped Group combines several Lipper investment objective categories while the Lipper peer group does not. The Total Mapped Group comparison focuses on a fund's standing relative to the total universe of comparable funds available to investors in terms of gross management fees before expense reimbursements or caps, and without giving effect to the fund's performance adjustment. "TMG %" represents the percentage of funds in the Total Mapped Group that had management fees that were lower than the fund's. For example, a TMG % of 19% means that 81% of the funds in the Total Mapped Group had higher management fees than the fund. The "Asset-Size Peer Group" (ASPG) comparison focuses on a fund's standing relative to non-Fidelity funds similar in size to the fund within the Total Mapped Group. The ASPG represents at least 15% of the funds in the Total Mapped Group with comparable asset size and management fee characteristics, subject to a minimum of 50 funds (or all funds in the Total Mapped Group if fewer than 50). Additional information, such as the ASPG quartile in which the fund's management fee ranked and the impact of the fund's performance adjustment, is also included in the chart and considered by the Board.
Annual Report
Board Approval of Investment Advisory Contracts and
Management Fees - continued
Fidelity International Small Cap Opportunities Fund
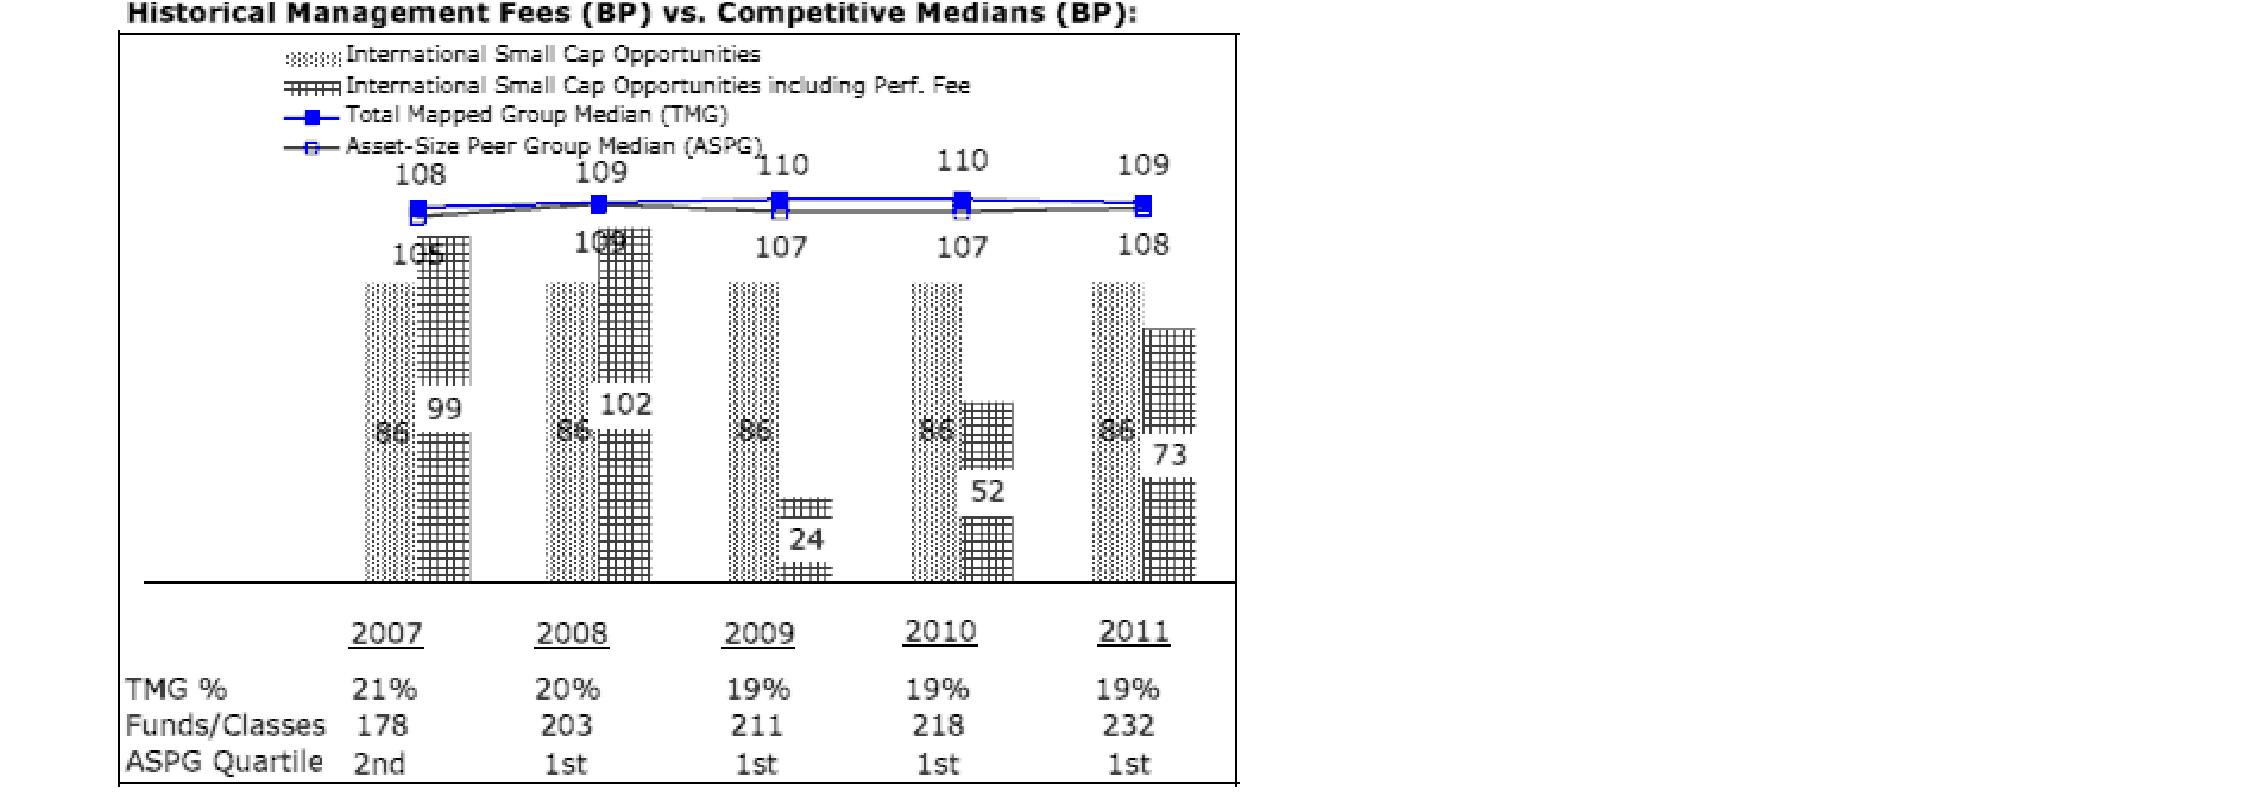
The Board noted that the fund's management fee ranked below the median of its Total Mapped Group and below the median of its ASPG for 2011. The Board also noted the effect of the fund's negative performance adjustment on the fund's management fee ranking. The Board noted that the performance adjustment for each year represents calculations for performance periods that differ from the periods shown in the performance charts above.
Based on its review, the Board concluded that the fund's management fee is fair and reasonable in light of the services that the fund receives and the other factors considered.
Total Expense Ratio. In its review of each class's total expense ratio, the Board considered the fund's management fee as well as other fund or class expenses, as applicable, such as transfer agent fees, pricing and bookkeeping fees, fund-paid 12b-1 fees, and custodial, legal, and audit fees. The Board also noted the effects of any waivers and reimbursements on fees and expenses, as well as the impact of the fund's performance adjustment. As part of its review, the Board also considered the current and historical total expense ratios of each class of the fund compared to competitive fund median expenses. Each class of the fund is compared to those funds and classes in the Total Mapped Group (used by the Board for management fee comparisons) that have a similar sales load structure.
The Board noted that the total expense ratio of each class ranked below its competitive median for 2011.
Annual Report
Fees Charged to Other Fidelity Clients. The Board also considered Fidelity fee structures and other information with respect to clients of FMR and its affiliates, such as other mutual funds advised or subadvised by FMR or its affiliates, pension plan clients, and other institutional clients. The Board noted the findings of the 2010 ad hoc joint committee (created with the board of other Fidelity funds), which reviewed and compared Fidelity's institutional investment advisory business with its business of providing services to the Fidelity funds, including the differences in services provided, fees charged, and costs incurred, as well as competition in their respective marketplaces.
Based on its review of total expense ratios and fees charged to other Fidelity clients, the Board concluded that the total expense ratio of each class of the fund was reasonable in light of the services that the fund and its shareholders receive and the other factors considered.
Costs of the Services and Profitability. The Board considered the revenues earned and the expenses incurred by Fidelity in conducting the business of developing, marketing, distributing, managing, administering and servicing the fund and its shareholders. The Board also considered the level of Fidelity's profits in respect of all the Fidelity funds.
On an annual basis, FMR presents to the Board Fidelity's profitability for the fund. Fidelity calculates the profitability for each fund, as well as aggregate profitability for groups of Fidelity funds and all Fidelity funds, using a series of detailed revenue and cost allocation methodologies which originate with the books and records of Fidelity on which Fidelity's audited financial statements are based. The Audit Committee of the Board reviews any significant changes from the prior year's methodologies.
PricewaterhouseCoopers LLP (PwC), independent registered public accounting firm and auditor to Fidelity and certain Fidelity funds, has been engaged annually by the Board as part of the Board's assessment of Fidelity's profitability analysis. PwC's engagement includes the review and assessment of Fidelity's methodologies used in determining the revenues and expenses attributable to Fidelity's mutual fund business, and completion of agreed-upon procedures surrounding the mathematical accuracy of fund profitability and its conformity to allocation methodologies. After considering PwC's reports issued under the engagement and information provided by Fidelity, the Board concluded that while other allocation methods may also be reasonable, Fidelity's profitability methodologies are reasonable in all material respects.
The Board also reviewed Fidelity's non-fund businesses and fall-out benefits related to the mutual fund business as well as cases where Fidelity's affiliates may benefit from or be related to the fund's business.
Annual Report
Board Approval of Investment Advisory Contracts and
Management Fees - continued
The Board considered the costs of the services provided by and the profits realized by Fidelity in connection with the operation of the fund and was satisfied that the profitability was not excessive in the circumstances.
Economies of Scale. The Board considered whether there have been economies of scale in respect of the management of the Fidelity funds, whether the Fidelity funds (including the fund) have appropriately benefited from any such economies of scale, and whether there is potential for realization of any further economies of scale. The Board considered the extent to which the fund will benefit from economies of scale through increased services to the fund, through waivers or reimbursements, or through fee or expense reductions. The Board also noted that in 2009, it and the board of other Fidelity funds created an ad hoc committee (the Economies of Scale Committee) to analyze whether FMR attains economies of scale in respect of the management and servicing of the Fidelity funds, whether the Fidelity funds have appropriately benefited from such economies of scale, and whether there is potential for realization of any further economies of scale.
The Board recognized that the fund's management contract incorporates a "group fee" structure, which provides for lower group fee rates as total fund assets under FMR's management increase, and for higher group fee rates as total fund assets under FMR's management decrease. FMR calculates the group fee rates based on a tiered asset "breakpoint" schedule that varies based on asset class. The Board considered that the group fee is designed to deliver the benefits of economies of scale to fund shareholders when total Fidelity fund assets increase, even if assets of any particular fund are unchanged or have declined, because some portion of Fidelity's costs are attributable to services provided to all Fidelity funds, and all funds benefit if those costs can be allocated among more assets. The Board concluded that, given the group fee structure, fund shareholders will benefit from lower management fees as assets under FMR's management increase at the fund complex level, regardless of whether Fidelity achieves any such economies of scale.
The Board concluded, taking into account the analysis of the Economies of Scale Committee, that economies of scale, if any, are being appropriately shared between fund shareholders and Fidelity.
Additional Information Requested by the Board. In order to develop fully the factual basis for consideration of the Fidelity funds' Advisory Contracts, the Board requested and received additional information on certain topics, including (i) fund performance trends, actions to be taken by FMR to improve certain funds' overall performance, and Fidelity's long-term strategies for certain funds; (ii) the potential to further rationalize the Fidelity fund lineup with the possibility of achieving savings for the funds and Fidelity; (iii) Fidelity's compensation structure for portfolio managers and other key investment personnel; (iv) the amount of the investment that each portfolio manager has made in the Fidelity fund(s) that he or she manages; (v) the realization of fall-out benefits in certain Fidelity business units; (vi) Fidelity's group fee structures, the potential impact of regulatory changes on such structures, and the rationale for the individual fee rates of certain funds; (vii) fund profitability methodology, including Fidelity's cost allocation methodology, and the impact of certain factors on fund profitability results; (viii) trends regarding industry use of performance fee structures and the possibility of implementing performance fee structures for additional funds; and (ix) the impact of net redemptions from the Fidelity funds.
Annual Report
Based on its evaluation of all of the conclusions noted above, and after considering all factors it believed relevant, the Board ultimately concluded that the advisory fee structures are fair and reasonable, and that the fund's Advisory Contracts should be renewed.
Annual Report
Investment Adviser
Fidelity Management & Research Company
Boston, MA
Investment Sub-Advisers
FMR Co., Inc.
Fidelity Management & Research
(Hong Kong) Limited
Fidelity Management & Research
(Japan) Inc.
Fidelity Management & Research
(U.K.) Inc.
FIL Investment Advisors
FIL Investments (Japan) Limited
FIL Investment Advisors (U.K.) Limited
General Distributor
Fidelity Distributors Corporation
Smithfield, RI
Transfer and Service Agents
Fidelity Investments Institutional
Operations Company, Inc.
Boston, MA
Fidelity Service Company, Inc.
Boston, MA
Custodian
The Northern Trust Company
Chicago, IL
(Fidelity Investment logo)(registered trademark)
AILS-UANN-1212
1.815089.107
(Fidelity Investment logo)(registered trademark)
Fidelity Advisor®
International Small Cap Opportunities
Fund - Institutional Class
Annual Report
October 31, 2012
(Fidelity Cover Art)
Institutional Class
is a class of Fidelity®
International Small Cap
Opportunities Fund
Contents
Performance | (Click Here) | How the fund has done over time. |
Management's Discussion of Fund Performance | (Click Here) | The Portfolio Manager's review of fund performance and strategy. |
Shareholder Expense Example | (Click Here) | An example of shareholder expenses. |
Investment Changes | (Click Here) | A summary of major shifts in the fund's investments over the past six months. |
Investments | (Click Here) | A complete list of the fund's investments with their market values. |
Financial Statements | (Click Here) | Statements of assets and liabilities, operations, and changes in net assets, as well as financial highlights. |
Notes | (Click Here) | Notes to the financial statements. |
Report of Independent Registered Public Accounting Firm | (Click Here) | |
Trustees and Officers | (Click Here) | |
Distributions | (Click Here) | |
Board Approval of Investment Advisory Contracts and Management Fees | (Click Here) | |
To view a fund's proxy voting guidelines and proxy voting record for the 12-month period ended June 30, visit http://www.fidelity.com/proxyvotingresults or visit the Securities and Exchange Commission's (SEC) web site at http://www.sec.gov. You may also call 1-877-208-0098 to request a free copy of the proxy voting guidelines.
Standard & Poor's, S&P and S&P 500 are registered service marks of The McGraw-Hill Companies, Inc. and have been licensed for use by Fidelity Distributors Corporation.
Other third party marks appearing herein are the property of their respective owners.
All other marks appearing herein are registered or unregistered trademarks or service marks of FMR LLC or an affiliated company. © 2012 FMR LLC. All rights reserved.
Annual Report
This report and the financial statements contained herein are submitted for the general information of the shareholders of the fund. This report is not authorized for distribution to prospective investors in the fund unless preceded or accompanied by an effective prospectus.
A fund files its complete schedule of portfolio holdings with the SEC for the first and third quarters of each fiscal year on Form N-Q. Forms N-Q are available on the SEC's web site at http://www.sec.gov. A fund's Forms N-Q may be reviewed and copied at the SEC's Public Reference Room in Washington, DC. Information regarding the operation of the SEC's Public Reference Room may be obtained by calling 1-800-SEC-0330. For a complete list of a fund's portfolio holdings, view the most recent holdings listing, semiannual report, or annual report on Fidelity's web site at http://www.fidelity.com, http://www.advisor.fidelity.com, or http://www.401k.com, as applicable.
NOT FDIC INSURED • MAY LOSE VALUE • NO BANK GUARANTEE
Neither the fund nor Fidelity Distributors Corporation is a bank.
Annual Report
Average annual total return reflects the change in the value of an investment, assuming reinvestment of the class' distributions from dividend income and capital gains (the profits earned upon the sale of securities that have grown in value, if any) and assuming a constant rate of performance each year. The $10,000 table and the fund's returns do not reflect the deduction of taxes that a shareholder would pay on fund distributions or the redemption of fund shares. During periods of reimbursement by Fidelity, a fund's total return will be greater than it would be had the reimbursement not occurred. How a fund did yesterday is no guarantee of how it will do tomorrow.
Average Annual Total Returns
Periods ended October 31, 2012 | Past 1
year | Past 5
years | Life of
fund A |
Institutional Class | 12.32% | -7.44% | 3.66% |
A From August 2, 2005.
$10,000 Over Life of Fund
Let's say hypothetically that $10,000 was invested in Fidelity Advisor® International Small Cap Opportunities Fund - Institutional Class on August 2, 2005, when the fund started. The chart shows how the value of your investment would have changed, and also shows how the MSCI® EAFE® Small Cap Index performed over the same period.
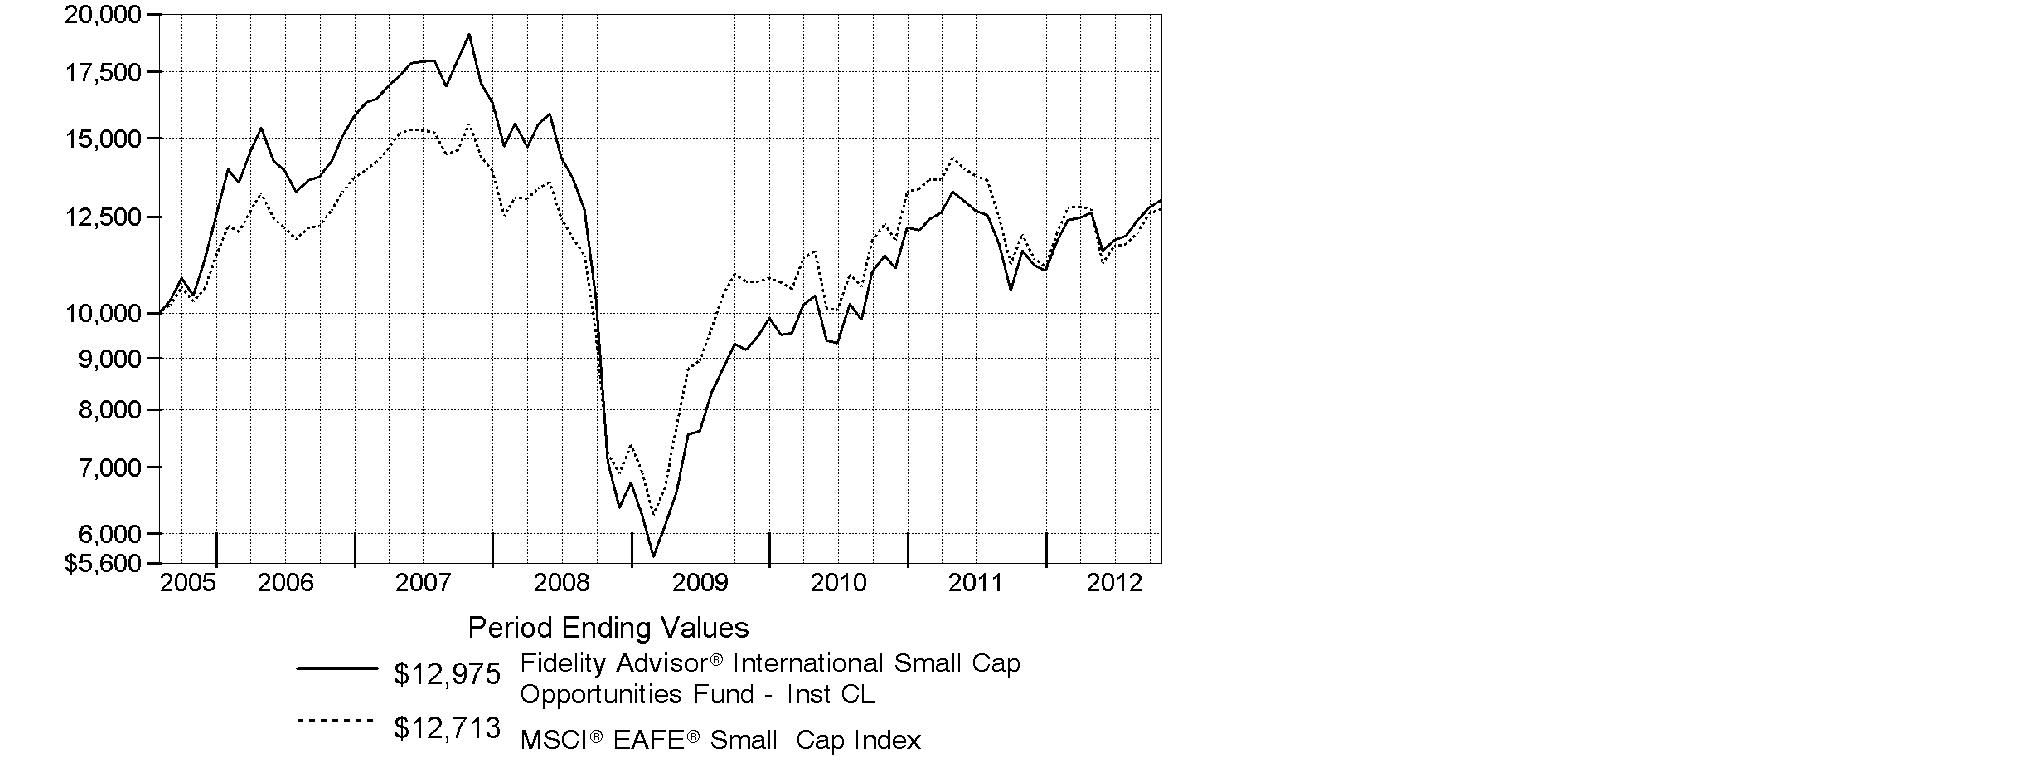
Annual Report
Market Recap: International stocks experienced pendulum-like swings during the 12 months ending October 31, 2012, finishing the period with a modest advance. The market faced periodic bouts of volatility this past year, as a number of macroeconomic concerns - including the eurozone debt crisis, the strength and pace of the U.S. economic recovery, and a slowdown in China's once-blistering growth - dominated headlines and weighed on investors. While a stronger U.S. dollar provided an additional head wind, foreign developed- and emerging-markets stocks still managed a gain for the 12 months, as the MSCI® ACWI® (All Country World Index) ex USA Index rose 4.11%, largely buttressed in the summertime by pledges of accommodative monetary action from eurozone officials, as well as signs that the U.S. housing market was on the mend. Within the index, Asia-Pacific ex Japan showed the most impressive gains, advancing roughly 11%. A number of core European components, most notably Germany (+11%), Switzerland (+10%) and the U.K. (+9%), benefited from optimism about the eurozone's ability to resolve its debt woes, which also helped the region outpace the index overall. Elsewhere, results from Canada (+3%) and the generally more volatile emerging markets (+2%) each fell short of the MSCI index, while Japan was among the few benchmark constituents to finish in the red, returning about -3%.
Comments from Jed Weiss, Portfolio Manager of Fidelity Advisor® International Small Cap Opportunities Fund: For the year, the fund's Institutional Class shares returned 12.32%, easily outpacing the 5.99% advance of the benchmark MSCI® EAFE® Small Cap Index. Security selection in emerging markets and Japan was very helpful. An out-of-benchmark allocation to globally oriented U.S.-based stocks also contributed to relative performance, while stock picking in Canada hurt. In sector terms, security selection helped in consumer discretionary, materials, industrials and financials, while energy and telecommunication services were detractors. The top individual contributor was Cymer, a U.S. laser manufacturer that gained sharply after in October after agreeing to be acquired by ASML Holding. Unite Group, a U.K.-based owner of student housing properties, added value, while better housing data lifted shares of U.S. carpet manufacturer Mohawk Industries and building products company James Hardie Industries, incorporated in Ireland and listed in Australia. In contrast, Austrian lighting company Zumtobel was hurt by weakness in its lighting-components business. Other disappointments were Nippon Thompson, a Japanese maker of linear motion guides, and Brazilian chemicals maker Braskem. Most of the names I've mentioned were not in the index, and I sold Braskem before period end.
The views expressed above reflect those of the portfolio manager(s) only through the end of the period as stated on the cover of this report and do not necessarily represent the views of Fidelity or any other person in the Fidelity organization. Any such views are subject to change at any time based upon market or other conditions and Fidelity disclaims any responsibility to update such views. These views may not be relied on as investment advice and, because investment decisions for a Fidelity fund are based on numerous factors, may not be relied on as an indication of trading intent on behalf of any Fidelity fund.
Annual Report
Shareholder Expense Example
As a shareholder of the Fund, you incur two types of costs: (1) transaction costs, including sales charges (loads) on purchase payments or redemption proceeds, redemption fees and (2) ongoing costs, including management fees, distribution and/or service (12b-1) fees and other Fund expenses. This Example is intended to help you understand your ongoing costs (in dollars) of investing in the Fund and to compare these costs with the ongoing costs of investing in other mutual funds.
The Example is based on an investment of $1,000 invested at the beginning of the period and held for the entire period (May 1, 2012 to October 31, 2012).
Actual Expenses
The first line of the accompanying table for each class of the Fund provides information about actual account values and actual expenses. You may use the information in this line, together with the amount you invested, to estimate the expenses that you paid over the period. Simply divide your account value by $1,000.00 (for example, an $8,600 account value divided by $1,000.00 = 8.6), then multiply the result by the number in the first line for a class of the Fund under the heading entitled "Expenses Paid During Period" to estimate the expenses you paid on your account during this period. A small balance maintenance fee of $12.00 that is charged once a year may apply for certain accounts with a value of less than $2,000. This fee is not included in the table below. If it was, the estimate of expenses you paid during the period would be higher, and your ending account value lower, by this amount. In addition, the Fund, as a shareholder in the underlying Fidelity Central Funds, will indirectly bear its pro-rata share of the fees and expenses incurred by the underlying Fidelity Central Funds. These fees and expenses are not included in the Fund's annualized expense ratio used to calculate the expense estimate in the table below.
Hypothetical Example for Comparison Purposes
The second line of the accompanying table for each class of the Fund provides information about hypothetical account values and hypothetical expenses based on a Class' actual expense ratio and an assumed rate of return of 5% per year before expenses, which is not the Class' actual return. The hypothetical account values and expenses may not be used to estimate the actual ending account balance or expenses you paid for the period. You may use this information to compare the ongoing costs of investing in the Fund and other funds. To do so, compare this 5% hypothetical example with the 5% hypothetical examples that appear in the shareholder reports of the other funds. A small balance maintenance fee of $12.00 that is charged once a year may apply for certain accounts with a value of less than $2,000. This fee is not included in the table below. If it was, the estimate of expenses you paid during the period would be higher, and your ending account value lower, by this amount. In addition, the Fund, as a shareholder in the underlying Fidelity Central Funds, will indirectly bear its pro-rata share of the fees and expenses incurred by the underlying Fidelity Central Funds. These fees and expenses are not included in the Fund's annualized expense ratio used to calculate the expense estimate in the table below.
Please note that the expenses shown in the table are meant to highlight your ongoing costs only and do not reflect any transaction costs. Therefore, the second line of the table is useful in comparing ongoing costs only, and will not help you determine the relative total costs of owning different funds. In addition, if these transactional costs were included, your costs would have been higher.
Annual Report
| Annualized
Expense Ratio | Beginning
Account Value
May 1, 2012 | Ending
Account Value
October 31, 2012 | Expenses Paid
During Period*
May 1, 2012
to October 31, 2012 |
Class A | 1.65% | | | |
Actual | | $ 1,000.00 | $ 1,025.70 | $ 8.40 |
Hypothetical A | | $ 1,000.00 | $ 1,016.84 | $ 8.36 |
Class T | 1.90% | | | |
Actual | | $ 1,000.00 | $ 1,024.90 | $ 9.67 |
Hypothetical A | | $ 1,000.00 | $ 1,015.58 | $ 9.63 |
Class B | 2.40% | | | |
Actual | | $ 1,000.00 | $ 1,022.40 | $ 12.20 |
Hypothetical A | | $ 1,000.00 | $ 1,013.07 | $ 12.14 |
Class C | 2.40% | | | |
Actual | | $ 1,000.00 | $ 1,022.40 | $ 12.20 |
Hypothetical A | | $ 1,000.00 | $ 1,013.07 | $ 12.14 |
International Small Cap Opportunities | 1.40% | | | |
Actual | | $ 1,000.00 | $ 1,027.40 | $ 7.13 |
Hypothetical A | | $ 1,000.00 | $ 1,018.10 | $ 7.10 |
Institutional Class | 1.40% | | | |
Actual | | $ 1,000.00 | $ 1,028.30 | $ 7.14 |
Hypothetical A | | $ 1,000.00 | $ 1,018.10 | $ 7.10 |
A 5% return per year before expenses
* Expenses are equal to each Class' annualized expense ratio, multiplied by the average account value over the period, multiplied by 184/366 (to reflect the one-half year period).
Annual Report
Investment Changes (Unaudited)
Geographic Diversification (% of fund's net assets) |
As of October 31, 2012 |
 | Japan 21.1% | |
 | United Kingdom 19.2% | |
 | United States of America 16.6% | |
 | Germany 4.8% | |
 | Canada 3.5% | |
 | France 3.0% | |
 | Turkey 2.8% | |
 | Sweden 2.5% | |
 | Brazil 2.5% | |
| Other 24.0% | |

Percentages are based on country or territory of incorporation and are adjusted for the effect of futures contracts, if applicable. |
As of April 30, 2012 |
| Japan 21.1% | |
| United States of America 17.8% | |
| United Kingdom 17.5% | |
| Germany 4.7% | |
| France 3.1% | |
| Canada 2.9% | |
| Brazil 2.9% | |
| South Africa 2.6% | |
| Sweden 2.5% | |
| Other 24.9% | |

Percentages are based on country or territory of incorporation and are adjusted for the effect of futures contracts, if applicable. |
Asset Allocation |
| % of fund's
net assets | % of fund's net assets
6 months ago |
Stocks | 96.1 | 94.5 |
Short-Term Investments and Net Other Assets (Liabilities) | 3.9 | 5.5 |
Top Ten Stocks as of October 31, 2012 |
| % of fund's
net assets | % of fund's net assets
6 months ago |
PriceSmart, Inc. (United States of America, Food & Staples Retailing) | 2.5 | 2.5 |
USS Co. Ltd. (Japan, Specialty Retail) | 2.0 | 2.0 |
Andritz AG (Austria, Machinery) | 1.6 | 1.5 |
Unite Group PLC (United Kingdom, Real Estate Management & Development) | 1.5 | 1.2 |
Kobayashi Pharmaceutical Co. Ltd. (Japan, Personal Products) | 1.5 | 1.4 |
Spirax-Sarco Engineering PLC (United Kingdom, Machinery) | 1.5 | 1.7 |
Prosegur Compania de Seguridad SA (Reg.) (Spain, Commercial Services & Supplies) | 1.4 | 1.4 |
Coca-Cola Icecek A/S (Turkey, Beverages) | 1.4 | 1.0 |
Interpump Group SpA (Italy, Machinery) | 1.3 | 1.3 |
Meggitt PLC (United Kingdom, Aerospace & Defense) | 1.3 | 1.3 |
| 16.0 | |
Market Sectors as of October 31, 2012 |
| % of fund's
net assets | % of fund's net assets
6 months ago |
Industrials | 24.0 | 23.0 |
Consumer Discretionary | 18.6 | 19.1 |
Financials | 14.0 | 14.7 |
Consumer Staples | 12.6 | 12.1 |
Materials | 9.7 | 9.5 |
Information Technology | 7.6 | 7.7 |
Health Care | 5.1 | 4.9 |
Energy | 4.5 | 3.5 |
Annual Report
Investments October 31, 2012
Showing Percentage of Net Assets
Common Stocks - 95.4% |
| Shares | | Value |
Australia - 1.0% |
Ramsay Health Care Ltd. | 66,365 | | $ 1,636,831 |
Sydney Airport unit | 637,981 | | 2,245,048 |
TOTAL AUSTRALIA | | 3,881,879 |
Austria - 2.1% |
Andritz AG | 101,600 | | 6,119,580 |
Zumtobel AG | 157,681 | | 1,684,690 |
TOTAL AUSTRIA | | 7,804,270 |
Bailiwick of Jersey - 1.6% |
Informa PLC | 588,230 | | 3,798,923 |
Randgold Resources Ltd. sponsored ADR | 18,300 | | 2,188,497 |
TOTAL BAILIWICK OF JERSEY | | 5,987,420 |
Belgium - 1.6% |
Gimv NV | 55,410 | | 2,678,156 |
Umicore SA | 62,474 | | 3,206,232 |
TOTAL BELGIUM | | 5,884,388 |
Bermuda - 1.0% |
GP Investments Ltd. (depositary receipt) (a) | 357,600 | | 825,752 |
Lazard Ltd. Class A | 32,899 | | 969,205 |
Trinity Ltd. | 2,704,000 | | 1,894,532 |
TOTAL BERMUDA | | 3,689,489 |
Brazil - 1.8% |
Arezzo Industria e Comercio SA | 108,700 | | 1,940,068 |
Banco Pine SA | 242,285 | | 1,693,925 |
Iguatemi Empresa de Shopping Centers SA | 89,400 | | 1,135,629 |
Multiplan Empreendimentos Imobiliarios SA | 63,600 | | 1,863,174 |
TOTAL BRAZIL | | 6,632,796 |
British Virgin Islands - 0.2% |
Gem Diamonds Ltd. (a) | 346,495 | | 943,576 |
Canada - 3.5% |
Agnico-Eagle Mines Ltd. (Canada) | 22,960 | | 1,296,335 |
Baytex Energy Corp. (d) | 21,900 | | 996,601 |
Copper Mountain Mining Corp. (a) | 206,100 | | 833,686 |
Eldorado Gold Corp. | 123,100 | | 1,819,230 |
Fairfax Financial Holdings Ltd. (sub. vtg.) | 4,790 | | 1,776,964 |
Open Text Corp. (a) | 30,200 | | 1,623,165 |
Painted Pony Petroleum Ltd. Class A (a) | 99,100 | | 1,071,620 |
Common Stocks - continued |
| Shares | | Value |
Canada - continued |
Pason Systems, Inc. | 114,900 | | $ 1,871,763 |
Petrominerales Ltd. | 101,379 | | 813,062 |
TAG Oil Ltd. (a) | 148,400 | | 1,040,100 |
TOTAL CANADA | | 13,142,526 |
Cayman Islands - 0.3% |
Vantage Drilling Co. (a) | 525,331 | | 966,609 |
Denmark - 0.2% |
William Demant Holding A/S (a) | 10,433 | | 897,310 |
Finland - 1.9% |
Nokian Tyres PLC | 88,600 | | 3,674,844 |
Outotec Oyj | 68,900 | | 3,355,179 |
TOTAL FINLAND | | 7,030,023 |
France - 3.0% |
Laurent-Perrier Group | 28,463 | | 2,427,515 |
Remy Cointreau SA | 27,273 | | 2,828,699 |
Saft Groupe SA | 79,819 | | 1,774,812 |
Vetoquinol SA | 37,895 | | 1,267,234 |
Virbac SA | 16,000 | | 2,789,315 |
TOTAL FRANCE | | 11,087,575 |
Germany - 4.8% |
alstria office REIT-AG | 170,500 | | 2,059,218 |
Bilfinger Berger AG | 36,659 | | 3,586,950 |
CompuGROUP Holding AG | 109,908 | | 1,994,402 |
CTS Eventim AG | 137,426 | | 4,079,056 |
Fielmann AG | 36,437 | | 3,546,809 |
Software AG (Bearer) | 65,781 | | 2,635,450 |
TOTAL GERMANY | | 17,901,885 |
India - 0.7% |
Jyothy Laboratories Ltd. | 817,354 | | 2,694,131 |
Ireland - 1.4% |
FBD Holdings PLC | 82,200 | | 1,028,145 |
James Hardie Industries NV: | | | |
CDI | 35,000 | | 335,342 |
sponsored ADR (d) | 83,775 | | 4,028,740 |
TOTAL IRELAND | | 5,392,227 |
Israel - 0.9% |
Azrieli Group | 70,005 | | 1,562,817 |
Common Stocks - continued |
| Shares | | Value |
Israel - continued |
Ituran Location & Control Ltd. | 131,286 | | $ 1,622,695 |
Strauss Group Ltd. | 23,244 | | 262,626 |
TOTAL ISRAEL | | 3,448,138 |
Italy - 2.1% |
Azimut Holding SpA | 253,073 | | 3,204,761 |
Interpump Group SpA | 640,443 | | 4,864,446 |
TOTAL ITALY | | 8,069,207 |
Japan - 21.1% |
Air Water, Inc. | 76,000 | | 952,023 |
Aozora Bank Ltd. | 813,000 | | 2,291,432 |
Asahi Co. Ltd. (d) | 106,500 | | 1,603,570 |
Autobacs Seven Co. Ltd. | 99,200 | | 4,069,648 |
Azbil Corp. | 68,200 | | 1,395,097 |
Cosmos Pharmaceutical Corp. | 14,300 | | 1,409,758 |
Daikoku Denki Co. Ltd. | 32,800 | | 829,964 |
Daikokutenbussan Co. Ltd. | 121,200 | | 3,853,258 |
FCC Co. Ltd. | 176,500 | | 3,172,711 |
Fields Corp. | 59,200 | | 851,329 |
GCA Savvian Group Corp. | 1,309 | | 1,554,468 |
Glory Ltd. | 93,000 | | 2,257,723 |
Goldcrest Co. Ltd. | 106,940 | | 1,608,856 |
Iwatsuka Confectionary Co. Ltd. | 26,500 | | 991,883 |
Kamigumi Co. Ltd. | 207,000 | | 1,669,899 |
Kobayashi Pharmaceutical Co. Ltd. | 106,300 | | 5,612,608 |
Kyoto Kimono Yuzen Co. Ltd. | 123,300 | | 1,490,474 |
Meiko Network Japan Co. Ltd. | 104,500 | | 1,060,316 |
Miraial Co. Ltd. | 39,200 | | 746,386 |
Nabtesco Corp. | 108,100 | | 2,012,233 |
Nagaileben Co. Ltd. | 125,700 | | 1,845,427 |
Nihon M&A Center, Inc. | 127,200 | | 3,816,159 |
Nihon Parkerizing Co. Ltd. | 181,000 | | 2,732,118 |
Nippon Seiki Co. Ltd. | 186,000 | | 1,787,073 |
Nippon Thompson Co. Ltd. | 460,000 | | 1,590,380 |
NS Tool Co., Ltd. | 4,400 | | 74,959 |
Obic Co. Ltd. | 10,130 | | 2,084,879 |
Osaka Securities Exchange Co. Ltd. | 178 | | 663,347 |
OSG Corp. | 173,600 | | 2,272,479 |
Seven Bank Ltd. | 1,158,900 | | 3,309,899 |
SHO-BOND Holdings Co. Ltd. | 95,200 | | 2,877,585 |
Shoei Co. Ltd. | 95,800 | | 522,022 |
Common Stocks - continued |
| Shares | | Value |
Japan - continued |
The Nippon Synthetic Chemical Industry Co. Ltd. | 318,000 | | $ 2,087,336 |
Tocalo Co. Ltd. | 70,000 | | 1,016,285 |
Tsutsumi Jewelry Co. Ltd. | 41,800 | | 958,735 |
USS Co. Ltd. | 72,710 | | 7,641,700 |
Yamato Kogyo Co. Ltd. | 151,700 | | 4,258,546 |
TOTAL JAPAN | | 78,972,565 |
Korea (South) - 0.6% |
Woongjin Coway Co. Ltd. | 61,100 | | 2,224,732 |
Netherlands - 2.3% |
Aalberts Industries NV | 205,700 | | 3,732,653 |
ASM International NV unit | 71,200 | | 2,258,464 |
Heijmans NV unit | 112,623 | | 953,663 |
QIAGEN NV (a) | 94,600 | | 1,650,770 |
TOTAL NETHERLANDS | | 8,595,550 |
Papua New Guinea - 0.4% |
Oil Search Ltd. ADR | 207,544 | | 1,602,881 |
Philippines - 0.6% |
Jollibee Food Corp. | 856,460 | | 2,202,623 |
Portugal - 0.8% |
Jeronimo Martins SGPS SA | 161,700 | | 2,829,431 |
South Africa - 2.0% |
African Rainbow Minerals Ltd. | 77,800 | | 1,628,563 |
City Lodge Hotels Ltd. | 76,302 | | 809,603 |
Clicks Group Ltd. | 495,688 | | 3,417,533 |
Mr Price Group Ltd. | 98,200 | | 1,517,059 |
TOTAL SOUTH AFRICA | | 7,372,758 |
Spain - 1.8% |
Grifols SA (a) | 49,232 | | 1,707,611 |
Prosegur Compania de Seguridad SA (Reg.) | 946,390 | | 5,151,986 |
TOTAL SPAIN | | 6,859,597 |
Sweden - 2.5% |
Fagerhult AB | 90,605 | | 2,240,230 |
Intrum Justitia AB | 288,334 | | 4,173,147 |
Swedish Match Co. AB | 85,600 | | 2,916,613 |
TOTAL SWEDEN | | 9,329,990 |
Switzerland - 0.5% |
Zehnder Group AG | 31,864 | | 1,876,667 |
Common Stocks - continued |
| Shares | | Value |
Turkey - 2.8% |
Albaraka Turk Katilim Bankasi A/S | 2,942,565 | | $ 2,331,070 |
Boyner Buyuk Magazacilik A/S (a) | 1,290,451 | | 2,966,058 |
Coca-Cola Icecek A/S | 264,362 | | 5,132,384 |
TOTAL TURKEY | | 10,429,512 |
United Kingdom - 19.2% |
AMEC PLC | 111,405 | | 1,905,666 |
Babcock International Group PLC | 205,700 | | 3,246,455 |
Bellway PLC | 198,072 | | 3,231,547 |
Berendsen PLC | 176,863 | | 1,606,873 |
Britvic PLC | 429,700 | | 2,490,795 |
Dechra Pharmaceuticals PLC | 282,100 | | 2,808,824 |
Derwent London PLC | 58,600 | | 1,949,946 |
Elementis PLC | 405,882 | | 1,370,898 |
Great Portland Estates PLC | 487,489 | | 3,678,541 |
H&T Group PLC | 232,153 | | 1,077,081 |
InterContinental Hotel Group PLC ADR | 111,626 | | 2,748,232 |
Johnson Matthey PLC | 79,175 | | 2,873,517 |
Meggitt PLC | 771,669 | | 4,806,784 |
Persimmon PLC | 202,563 | | 2,598,744 |
Rotork PLC | 119,500 | | 4,392,966 |
Serco Group PLC | 426,309 | | 3,897,272 |
Shaftesbury PLC | 412,873 | | 3,651,180 |
Spectris PLC | 130,587 | | 3,641,497 |
Spirax-Sarco Engineering PLC | 174,930 | | 5,462,375 |
Ted Baker PLC | 112,000 | | 1,713,415 |
Ultra Electronics Holdings PLC | 129,658 | | 3,542,359 |
Unite Group PLC | 1,274,170 | | 5,821,079 |
Victrex PLC | 146,882 | | 3,377,689 |
TOTAL UNITED KINGDOM | | 71,893,735 |
United States of America - 12.7% |
ANSYS, Inc. (a) | 15,285 | | 1,083,401 |
Autoliv, Inc. | 61,900 | | 3,565,440 |
BPZ Energy, Inc. (a)(d) | 286,767 | | 825,889 |
Broadridge Financial Solutions, Inc. | 61,705 | | 1,416,130 |
Cymer, Inc. (a) | 49,209 | | 3,921,465 |
Dril-Quip, Inc. (a) | 40,569 | | 2,809,809 |
Evercore Partners, Inc. Class A | 56,200 | | 1,567,980 |
Greenhill & Co., Inc. | 40,995 | | 1,956,281 |
Kansas City Southern | 42,800 | | 3,443,688 |
Martin Marietta Materials, Inc. | 23,800 | | 1,958,978 |
Common Stocks - continued |
| Shares | | Value |
United States of America - continued |
Mohawk Industries, Inc. (a) | 41,700 | | $ 3,480,699 |
Oceaneering International, Inc. | 53,100 | | 2,778,723 |
PriceSmart, Inc. | 110,996 | | 9,211,553 |
ResMed, Inc. | 98,000 | | 3,914,120 |
Solera Holdings, Inc. | 68,456 | | 3,204,425 |
SS&C Technologies Holdings, Inc. (a) | 106,858 | | 2,567,798 |
TOTAL UNITED STATES OF AMERICA | | 47,706,379 |
TOTAL COMMON STOCKS (Cost $286,436,564) |
357,349,869
|
Nonconvertible Preferred Stocks - 0.7% |
| | | |
Brazil - 0.7% |
Banco ABC Brasil SA
(Cost $2,957,747) | 452,289 | |
2,569,811
|
Money Market Funds - 4.1% |
| | | |
Fidelity Cash Central Fund, 0.19% (b) | 14,393,835 | | 14,393,835 |
Fidelity Securities Lending Cash Central Fund, 0.19% (b)(c) | 1,000,230 | | 1,000,230 |
TOTAL MONEY MARKET FUNDS (Cost $15,394,065) |
15,394,065
|
TOTAL INVESTMENT PORTFOLIO - 100.2% (Cost $304,788,376) | | 375,313,745 |
NET OTHER ASSETS (LIABILITIES) - (0.2)% | | (868,125) |
NET ASSETS - 100% | $ 374,445,620 |
Legend |
(a) Non-income producing |
(b) Affiliated fund that is available only to investment companies and other accounts managed by Fidelity Investments. The rate quoted is the annualized seven-day yield of the fund at period end. A complete unaudited listing of the fund's holdings as of its most recent quarter end is available upon request. In addition, each Fidelity Central Fund's financial statements, which are not covered by the Fund's Report of Independent Registered Public Accounting Firm, are available on the SEC's website or upon request. |
(c) Investment made with cash collateral received from securities on loan. |
(d) Security or a portion of the security is on loan at period end. |
Affiliated Central Funds |
Information regarding fiscal year to date income earned by the Fund from investments in Fidelity Central Funds is as follows: |
Fund | Income earned |
Fidelity Cash Central Fund | $ 20,578 |
Fidelity Securities Lending Cash Central Fund | 123,696 |
Total | $ 144,274 |
Other Information |
Categorizations in the Schedule of Investments are based on country or territory of incorporation. |
All investments are categorized as Level 1 under the Fair Value Hierarchy. The inputs or methodology used for valuing securities may not be an indication of the risk associated with investing in those securities. For more information on valuation inputs, please refer to the Security Valuation section in the accompanying Notes to Financial Statements. |
The following is a summary of transfers between Level 1 and Level 2 for the period ended October 31, 2012. Transfers are assumed to have occurred at the beginning of the period, and are primarily attributable to the valuation techniques used for foreign equity securities, as discussed in the accompanying Notes to Financial Statements: |
Transfers | Total |
Level 1 to Level 2 | $ 0 |
Level 2 to Level 1 | $ 83,755,081 |
See accompanying notes which are an integral part of the financial statements.
Annual Report
Statement of Assets and Liabilities
| October 31, 2012 |
| | |
Assets | | |
Investment in securities, at value (including securities loaned of $950,434) - See accompanying schedule: Unaffiliated issuers (cost $289,394,311) | $ 359,919,680 | |
Fidelity Central Funds (cost $15,394,065) | 15,394,065 | |
Total Investments (cost $304,788,376) | | $ 375,313,745 |
Receivable for investments sold | | 852,658 |
Receivable for fund shares sold | | 208,144 |
Dividends receivable | | 1,012,746 |
Distributions receivable from Fidelity Central Funds | | 3,106 |
Receivable from investment adviser for expense reductions | | 3,081 |
Other receivables | | 8,858 |
Total assets | | 377,402,338 |
| | |
Liabilities | | |
Payable for investments purchased | $ 833,907 | |
Payable for fund shares redeemed | 609,477 | |
Accrued management fee | 332,364 | |
Distribution and service plan fees payable | 14,354 | |
Other affiliated payables | 98,330 | |
Other payables and accrued expenses | 68,056 | |
Collateral on securities loaned, at value | 1,000,230 | |
Total liabilities | | 2,956,718 |
| | |
Net Assets | | $ 374,445,620 |
Net Assets consist of: | | |
Paid in capital | | $ 650,027,368 |
Undistributed net investment income | | 3,302,296 |
Accumulated undistributed net realized gain (loss) on investments and foreign currency transactions | | (349,390,238) |
Net unrealized appreciation (depreciation) on investments and assets and liabilities in foreign currencies | | 70,506,194 |
Net Assets | | $ 374,445,620 |
See accompanying notes which are an integral part of the financial statements.
Annual Report
Statement of Assets and Liabilities - continued
| October 31, 2012 |
| | |
Calculation of Maximum Offering Price Class A:
Net Asset Value and redemption price per share ($18,194,312 ÷ 1,687,285 shares) | | $ 10.78 |
| | |
Maximum offering price per share (100/94.25 of $10.78) | | $ 11.44 |
Class T:
Net Asset Value and redemption price per share ($8,168,756 ÷ 763,991 shares) | | $ 10.69 |
| | |
Maximum offering price per share (100/96.50 of $10.69) | | $ 11.08 |
Class B:
Net Asset Value and offering price per share ($1,965,725 ÷ 187,264 shares)A | | $ 10.50 |
| | |
Class C:
Net Asset Value and offering price per share ($6,608,275 ÷ 630,481 shares)A | | $ 10.48 |
| | |
International Small Cap Opportunities:
Net Asset Value, offering price and redemption price per share ($334,917,873 ÷ 30,769,882 shares) | | $ 10.88 |
| | |
Institutional Class:
Net Asset Value, offering price and redemption price per share ($4,590,679 ÷ 421,283 shares) | | $ 10.90 |
A Redemption price per share is equal to net asset value less any applicable contingent deferred sales charge.
See accompanying notes which are an integral part of the financial statements.
Annual Report
Financial Statements - continued
Statement of Operations
| Year ended October 31, 2012 |
| | |
Investment Income | | |
Dividends | | $ 9,443,414 |
Income from Fidelity Central Funds | | 144,274 |
Income before foreign taxes withheld | | 9,587,688 |
Less foreign taxes withheld | | (625,721) |
Total income | | 8,961,967 |
| | |
Expenses | | |
Management fee
Basic fee | $ 3,085,108 | |
Performance adjustment | 775,332 | |
Transfer agent fees | 999,785 | |
Distribution and service plan fees | 174,080 | |
Accounting and security lending fees | 188,109 | |
Custodian fees and expenses | 101,203 | |
Independent trustees' compensation | 2,363 | |
Registration fees | 81,326 | |
Audit | 67,233 | |
Legal | 1,855 | |
Miscellaneous | 3,487 | |
Total expenses before reductions | 5,479,881 | |
Expense reductions | (297,227) | 5,182,654 |
Net investment income (loss) | | 3,779,313 |
Realized and Unrealized Gain (Loss) Net realized gain (loss) on: | | |
Investment securities: | | |
Unaffiliated issuers | 21,390,324 | |
Foreign currency transactions | (29,044) | |
Total net realized gain (loss) | | 21,361,280 |
Change in net unrealized appreciation (depreciation) on: Investment securities | 17,246,510 | |
Assets and liabilities in foreign currencies | (10,085) | |
Total change in net unrealized appreciation (depreciation) | | 17,236,425 |
Net gain (loss) | | 38,597,705 |
Net increase (decrease) in net assets resulting from operations | | $ 42,377,018 |
See accompanying notes which are an integral part of the financial statements.
Annual Report
Statement of Changes in Net Assets
| Year ended
October 31,
2012 | Year ended
October 31,
2011 |
Increase (Decrease) in Net Assets | | |
Operations | | |
Net investment income (loss) | $ 3,779,313 | $ 7,043,577 |
Net realized gain (loss) | 21,361,280 | 54,021,779 |
Change in net unrealized appreciation (depreciation) | 17,236,425 | (52,262,552) |
Net increase (decrease) in net assets resulting
from operations | 42,377,018 | 8,802,804 |
Distributions to shareholders from net investment income | (4,886,680) | (6,223,295) |
Distributions to shareholders from net realized gain | (369,319) | (1,761,993) |
Total distributions | (5,255,999) | (7,985,288) |
Share transactions - net increase (decrease) | (28,976,326) | (78,669,716) |
Redemption fees | 64,463 | 71,408 |
Total increase (decrease) in net assets | 8,209,156 | (77,780,792) |
| | |
Net Assets | | |
Beginning of period | 366,236,464 | 444,017,256 |
End of period (including undistributed net investment income of $3,302,296 and undistributed net investment income of $4,428,178, respectively) | $ 374,445,620 | $ 366,236,464 |
See accompanying notes which are an integral part of the financial statements.
Annual Report
Financial Highlights - Class A
Years ended October 31, | 2012 | 2011 | 2010 | 2009 | 2008 |
Selected Per-Share Data | | | | | |
Net asset value, beginning of period | $ 9.75 | $ 9.82 | $ 8.07 | $ 6.24 | $ 18.97 |
Income from Investment Operations | | | | | |
Net investment income (loss) C | .08 | .15 F | .06 | .06 | .02 |
Net realized and unrealized gain (loss) | 1.07 | (.07) | 1.85 | 1.77 | (10.85) |
Total from investment operations | 1.15 | .08 | 1.91 | 1.83 | (10.83) |
Distributions from net investment income | (.11) | (.11) | (.07) | - | (.03) |
Distributions from net realized gain | (.01) | (.04) | (.09) | - | (1.88) |
Total distributions | (.12) | (.15) | (.16) | - | (1.90) I |
Redemption fees added to paid in capital C,H | - | - | - | - | - |
Net asset value, end of period | $ 10.78 | $ 9.75 | $ 9.82 | $ 8.07 | $ 6.24 |
Total Return A,B | 12.00% | .81% | 24.05% | 29.33% | (62.98)% |
Ratios to Average Net Assets D,G | | | | | |
Expenses before reductions | 1.75% | 1.34% | 1.16% | .94% | 1.75% |
Expenses net of fee waivers, if any | 1.65% | 1.33% | 1.16% | .94% | 1.66% |
Expenses net of all reductions | 1.64% | 1.32% | 1.15% | .89% | 1.62% |
Net investment income (loss) | .85% | 1.44% F | .74% | 1.00% | .13% |
Supplemental Data | | | | | |
Net assets, end of period (000 omitted) | $ 18,194 | $ 18,686 | $ 20,228 | $ 18,883 | $ 17,905 |
Portfolio turnover rate E | 28% | 24% | 49% | 174% | 61% |
A Total returns would have been lower if certain expenses had not been reduced during the applicable periods shown.
B Total returns do not include the effect of the sales charges.
C Calculated based on average shares outstanding during the period.
D Fees and expenses of any underlying Fidelity Central Funds are not included in the Fund's expense ratio. The Fund indirectly bears its proportionate share of the expenses of any underlying Fidelity Central Funds.
E Amount does not include the portfolio activity of any underlying Fidelity Central Funds.
F Investment income per share reflects a large, non-recurring dividend which amounted to $.06 per share. Excluding this non-recurring dividend, the ratio of net investment income (loss) to average net assets would have been .80%.
G Expense ratios reflect operating expenses of the class. Expenses before reductions do not reflect amounts reimbursed by the investment adviser or reductions from brokerage service arrangements or reductions from other expense offset arrangements and do not represent the amount paid by the class during periods when reimbursements or reductions occur. Expenses net of fee waivers reflect expenses after reimbursement by the investment adviser but prior to reductions from brokerage service arrangements or other expense offset arrangements. Expenses net of all reductions represent the net expenses paid by the class.
H Amount represents less than $.01 per share.
I Total distributions of $1.90 per share is comprised of distributions from net investment income of $.025 and distributions from net realized gain of $1.878 per share.
See accompanying notes which are an integral part of the financial statements.
Annual Report
Financial Highlights - Class T
Years ended October 31, | 2012 | 2011 | 2010 | 2009 | 2008 |
Selected Per-Share Data | | | | | |
Net asset value, beginning of period | $ 9.66 | $ 9.72 | $ 8.00 | $ 6.20 | $ 18.85 |
Income from Investment Operations | | | | | |
Net investment income (loss) C | .06 | .12 F | .04 | .05 | (.02) |
Net realized and unrealized gain (loss) | 1.06 | (.06) | 1.83 | 1.75 | (10.78) |
Total from investment operations | 1.12 | .06 | 1.87 | 1.80 | (10.80) |
Distributions from net investment income | (.08) | (.08) | (.06) | - | - |
Distributions from net realized gain | (.01) | (.04) | (.09) | - | (1.85) |
Total distributions | (.09) | (.12) | (.15) | - | (1.85) I |
Redemption fees added to paid in capital C,H | - | - | - | - | - |
Net asset value, end of period | $ 10.69 | $ 9.66 | $ 9.72 | $ 8.00 | $ 6.20 |
Total Return A,B | 11.72% | .60% | 23.65% | 29.03% | (63.08)% |
Ratios to Average Net Assets D,G | | | | | |
Expenses before reductions | 2.02% | 1.60% | 1.43% | 1.20% | 2.00% |
Expenses net of fee waivers, if any | 1.90% | 1.60% | 1.43% | 1.20% | 1.91% |
Expenses net of all reductions | 1.89% | 1.59% | 1.41% | 1.15% | 1.87% |
Net investment income (loss) | .60% | 1.17% F | .48% | .74% | (.12)% |
Supplemental Data | | | | | |
Net assets, end of period (000 omitted) | $ 8,169 | $ 8,701 | $ 11,202 | $ 11,915 | $ 11,614 |
Portfolio turnover rate E | 28% | 24% | 49% | 174% | 61% |
A Total returns would have been lower if certain expenses had not been reduced during the applicable periods shown.
B Total returns do not include the effect of the sales charges.
C Calculated based on average shares outstanding during the period.
D Fees and expenses of any underlying Fidelity Central Funds are not included in the Fund's expense ratio. The Fund indirectly bears its proportionate share of the expenses of any underlying Fidelity Central Funds.
E Amount does not include the portfolio activity of any underlying Fidelity Central Funds.
F Investment income per share reflects a large, non-recurring dividend which amounted to $.06 per share. Excluding this non-recurring dividend, the ratio of net investment income (loss) to average net assets would have been .54%.
G Expense ratios reflect operating expenses of the class. Expenses before reductions do not reflect amounts reimbursed by the investment adviser or reductions from brokerage service arrangements or reductions from other expense offset arrangements and do not represent the amount paid by the class during periods when reimbursements or reductions occur. Expenses net of fee waivers reflect expenses after reimbursement by the investment adviser but prior to reductions from brokerage service arrangements or other expense offset arrangements. Expenses net of all reductions represent the net expenses paid by the class.
H Amount represents less than $.01 per share.
I Total distributions of $1.85 per share is comprised of distributions from net realized gain of $1.852 per share.
See accompanying notes which are an integral part of the financial statements.
Annual Report
Financial Highlights - Class B
Years ended October 31, | 2012 | 2011 | 2010 | 2009 | 2008 |
Selected Per-Share Data | | | | | |
Net asset value, beginning of period | $ 9.48 | $ 9.54 | $ 7.87 | $ 6.12 | $ 18.64 |
Income from Investment Operations | | | | | |
Net investment income (loss) C | .01 | .07 F | - H | .02 | (.08) |
Net realized and unrealized gain (loss) | 1.05 | (.06) | 1.79 | 1.73 | (10.68) |
Total from investment operations | 1.06 | .01 | 1.79 | 1.75 | (10.76) |
Distributions from net investment income | (.03) | (.06) | (.03) | - | - |
Distributions from net realized gain | (.01) | (.02) | (.09) | - | (1.76) |
Total distributions | (.04) | (.07) J | (.12) | - | (1.76) I |
Redemption fees added to paid in capital C,H | - | - | - | - | - |
Net asset value, end of period | $ 10.50 | $ 9.48 | $ 9.54 | $ 7.87 | $ 6.12 |
Total Return A,B | 11.21% | .10% | 23.03% | 28.59% | (63.32)% |
Ratios to Average Net Assets D,G | | | | | |
Expenses before reductions | 2.50% | 2.09% | 1.91% | 1.69% | 2.51% |
Expenses net of fee waivers, if any | 2.40% | 2.09% | 1.91% | 1.69% | 2.41% |
Expenses net of all reductions | 2.39% | 2.07% | 1.90% | 1.64% | 2.38% |
Net investment income (loss) | .10% | .68% F | (.01)% | .25% | (.62)% |
Supplemental Data | | | | | |
Net assets, end of period (000 omitted) | $ 1,966 | $ 2,293 | $ 2,902 | $ 2,799 | $ 2,687 |
Portfolio turnover rate E | 28% | 24% | 49% | 174% | 61% |
A Total returns would have been lower if certain expenses had not been reduced during the applicable periods shown.
B Total returns do not include the effect of the contingent deferred sales charge.
C Calculated based on average shares outstanding during the period.
D Fees and expenses of any underlying Fidelity Central Funds are not included in the Fund's expense ratio. The Fund indirectly bears its proportionate share of the expenses of any underlying Fidelity Central Funds.
E Amount does not include the portfolio activity of any underlying Fidelity Central Funds.
F Investment income per share reflects a large, non-recurring dividend which amounted to $.06 per share. Excluding this non-recurring dividend, the ratio of net investment income (loss) to average net assets would have been .05%.
G Expense ratios reflect operating expenses of the class. Expenses before reductions do not reflect amounts reimbursed by the investment adviser or reductions from brokerage service arrangements or reductions from other expense offset arrangements and do not represent the amount paid by the class during periods when reimbursements or reductions occur. Expenses net of fee waivers reflect expenses after reimbursement by the investment adviser but prior to reductions from brokerage service arrangements or other expense offset arrangements. Expenses net of all reductions represent the net expenses paid by the class.
H Amount represents less than $.01 per share.
I Total distributions of $1.76 per share is comprised of distributions from net realized gain of $1.760 per share.
J Total distributions of $.07 per share is comprised of distributions from net investment income of $.058 and distributions from net realized gain of $.015 per share.
See accompanying notes which are an integral part of the financial statements.
Annual Report
Financial Highlights - Class C
Years ended October 31, | 2012 | 2011 | 2010 | 2009 | 2008 |
Selected Per-Share Data | | | | | |
Net asset value, beginning of period | $ 9.47 | $ 9.53 | $ 7.86 | $ 6.11 | $ 18.63 |
Income from Investment Operations | | | | | |
Net investment income (loss) C | .01 | .07 F | - H | .02 | (.08) |
Net realized and unrealized gain (loss) | 1.04 | (.06) | 1.79 | 1.73 | (10.66) |
Total from investment operations | 1.05 | .01 | 1.79 | 1.75 | (10.74) |
Distributions from net investment income | (.03) | (.06) | (.03) | - | - |
Distributions from net realized gain | (.01) | (.02) | (.09) | - | (1.78) |
Total distributions | (.04) | (.07) J | (.12) | - | (1.78) I |
Redemption fees added to paid in capital C,H | - | - | - | - | - |
Net asset value, end of period | $ 10.48 | $ 9.47 | $ 9.53 | $ 7.86 | $ 6.11 |
Total Return A,B | 11.13% | .10% | 23.06% | 28.64% | (63.32)% |
Ratios to Average Net Assets D,G | | | | | |
Expenses before reductions | 2.50% | 2.09% | 1.91% | 1.68% | 2.51% |
Expenses net of fee waivers, if any | 2.40% | 2.09% | 1.91% | 1.68% | 2.41% |
Expenses net of all reductions | 2.39% | 2.07% | 1.90% | 1.63% | 2.38% |
Net investment income (loss) | .10% | .68% F | (.01)% | .26% | (.62)% |
Supplemental Data | | | | | |
Net assets, end of period (000 omitted) | $ 6,608 | $ 6,900 | $ 8,936 | $ 8,543 | $ 9,497 |
Portfolio turnover rate E | 28% | 24% | 49% | 174% | 61% |
A Total returns would have been lower if certain expenses had not been reduced during the applicable periods shown.
B Total returns do not include the effect of the contingent deferred sales charge.
C Calculated based on average shares outstanding during the period.
D Fees and expenses of any underlying Fidelity Central Funds are not included in the Fund's expense ratio. The Fund indirectly bears its proportionate share of the expenses of any underlying Fidelity Central Funds.
E Amount does not include the portfolio activity of any underlying Fidelity Central Funds.
F Investment income per share reflects a large, non-recurring dividend which amounted to $.06 per share. Excluding this non-recurring dividend, the ratio of net investment income (loss) to average net assets would have been .05%.
G Expense ratios reflect operating expenses of the class. Expenses before reductions do not reflect amounts reimbursed by the investment adviser or reductions from brokerage service arrangements or reductions from other expense offset arrangements and do not represent the amount paid by the class during periods when reimbursements or reductions occur. Expenses net of fee waivers reflect expenses after reimbursement by the investment adviser but prior to reductions from brokerage service arrangements or other expense offset arrangements. Expenses net of all reductions represent the net expenses paid by the class.
H Amount represents less than $.01 per share.
I Total distributions of $1.78 per share is comprised of distributions from net realized gain of $1.775 per share.
J Total distributions of $.07 per share is comprised of distributions from net investment income of $.058 and distributions from net realized gain of $.015 per share.
See accompanying notes which are an integral part of the financial statements.
Annual Report
Financial Highlights - International Small Cap Opportunities
Years ended October 31, | 2012 | 2011 | 2010 | 2009 | 2008 |
Selected Per-Share Data | | | | | |
Net asset value, beginning of period | $ 9.85 | $ 9.92 | $ 8.14 | $ 6.28 | $ 19.09 |
Income from Investment Operations | | | | | |
Net investment income (loss) B | .11 | .17 E | .09 | .08 | .05 |
Net realized and unrealized gain (loss) | 1.07 | (.06) | 1.87 | 1.78 | (10.92) |
Total from investment operations | 1.18 | .11 | 1.96 | 1.86 | (10.87) |
Distributions from net investment income | (.14) | (.14) | (.09) | - G | (.06) |
Distributions from net realized gain | (.01) | (.04) | (.09) | - | (1.88) |
Total distributions | (.15) | (.18) | (.18) | - G | (1.94) H |
Redemption fees added to paid in capital B,G | - | - | - | - | - |
Net asset value, end of period | $ 10.88 | $ 9.85 | $ 9.92 | $ 8.14 | $ 6.28 |
Total Return A | 12.21% | 1.10% | 24.43% | 29.68% | (62.91)% |
Ratios to Average Net Assets C,F | | | | | |
Expenses before reductions | 1.47% | 1.08% | .91% | .68% | 1.44% |
Expenses net of fee waivers, if any | 1.40% | 1.08% | .91% | .68% | 1.44% |
Expenses net of all reductions | 1.39% | 1.06% | .89% | .64% | 1.40% |
Net investment income (loss) | 1.10% | 1.69% E | 1.00% | 1.25% | .36% |
Supplemental Data | | | | | |
Net assets, end of period (000 omitted) | $ 334,918 | $ 328,262 | $ 398,331 | $ 329,128 | $ 312,376 |
Portfolio turnover rate D | 28% | 24% | 49% | 174% | 61% |
A Total returns would have been lower if certain expenses had not been reduced during the applicable periods shown.
B Calculated based on average shares outstanding during the period.
C Fees and expenses of any underlying Fidelity Central Funds are not included in the Fund's expense ratio. The Fund indirectly bears its proportionate share of the expenses of any underlying Fidelity Central Funds.
D Amount does not include the portfolio activity of any underlying Fidelity Central Funds.
E Investment income per share reflects a large, non-recurring dividend which amounted to $.07 per share. Excluding this non-recurring dividend, the ratio of net investment income (loss) to average net assets would have been 1.06%.
F Expense ratios reflect operating expenses of the class. Expenses before reductions do not reflect amounts reimbursed by the investment adviser or reductions from brokerage service arrangements or reductions from other expense offset arrangements and do not represent the amount paid by the class during periods when reimbursements or reductions occur. Expenses net of fee waivers reflect expenses after reimbursement by the investment adviser but prior to reductions from brokerage service arrangements or other expense offset arrangements. Expenses net of all reductions represent the net expenses paid by the class.
G Amount represents less than $.01 per share.
H Total distributions of $1.94 per share is comprised of distributions from net investment income of $.064 and distributions from net realized gain of $1.878 per share.
See accompanying notes which are an integral part of the financial statements.
Annual Report
Financial Highlights - Institutional Class
Years ended October 31, | 2012 | 2011 | 2010 | 2009 | 2008 |
Selected Per-Share Data | | | | | |
Net asset value, beginning of period | $ 9.86 | $ 9.93 | $ 8.14 | $ 6.27 | $ 19.09 |
Income from Investment Operations | | | | | |
Net investment income (loss) B | .11 | .18 E | .09 | .08 | .05 |
Net realized and unrealized gain (loss) | 1.08 | (.06) | 1.86 | 1.79 | (10.92) |
Total from investment operations | 1.19 | .12 | 1.95 | 1.87 | (10.87) |
Distributions from net investment income | (.14) | (.15) | (.07) | - G | (.07) |
Distributions from net realized gain | (.01) | (.04) | (.09) | - | (1.88) |
Total distributions | (.15) | (.19) | (.16) | - G | (1.95) H |
Redemption fees added to paid in capital B,G | - | - | - | - | - |
Net asset value, end of period | $ 10.90 | $ 9.86 | $ 9.93 | $ 8.14 | $ 6.27 |
Total Return A | 12.32% | 1.13% | 24.33% | 29.87% | (62.95)% |
Ratios to Average Net Assets C,F | | | | | |
Expenses before reductions | 1.44% | 1.03% | .90% | .68% | 1.40% |
Expenses net of fee waivers, if any | 1.40% | 1.03% | .90% | .68% | 1.40% |
Expenses net of all reductions | 1.39% | 1.02% | .88% | .64% | 1.37% |
Net investment income (loss) | 1.10% | 1.74% E | 1.01% | 1.25% | .39% |
Supplemental Data | | | | | |
Net assets, end of period (000 omitted) | $ 4,591 | $ 1,395 | $ 2,418 | $ 2,022 | $ 8,117 |
Portfolio turnover rate D | 28% | 24% | 49% | 174% | 61% |
A Total returns would have been lower if certain expenses had not been reduced during the applicable periods shown.
B Calculated based on average shares outstanding during the period.
C Fees and expenses of any underlying Fidelity Central Funds are not included in the Fund's expense ratio. The Fund indirectly bears its proportionate share of the expenses of any underlying Fidelity Central Funds.
D Amount does not include the portfolio activity of any underlying Fidelity Central Funds.
E Investment income per share reflects a large, non-recurring dividend which amounted to $.07 per share. Excluding this non-recurring dividend, the ratio of net investment income (loss) to average net assets would have been 1.11%.
F Expense ratios reflect operating expenses of the class. Expenses before reductions do not reflect amounts reimbursed by the investment adviser or reductions from brokerage service arrangements or reductions from other expense offset arrangements and do not represent the amount paid by the class during periods when reimbursements or reductions occur. Expenses net of fee waivers reflect expenses after reimbursement by the investment adviser but prior to reductions from brokerage service arrangements or other expense offset arrangements. Expenses net of all reductions represent the net expenses paid by the class.
G Amount represents less than $.01 per share.
H Total distributions of $1.95 per share is comprised of distributions from net investment income of $.074 and distributions from net realized gain of $1.878 per share.
See accompanying notes which are an integral part of the financial statements.
Annual Report
Notes to Financial Statements
For the period ended October 31, 2012
1. Organization.
Fidelity International Small Cap Opportunities Fund (the Fund) is a fund of Fidelity Investment Trust (the Trust) and is authorized to issue an unlimited number of shares. The Trust is registered under the Investment Company Act of 1940, as amended (the 1940 Act), as an open-end management investment company organized as a Massachusetts business trust. The Fund offers Class A, Class T, Class C, International Small Cap Opportunities and Institutional Class shares, each of which, along with Class B shares, has equal rights as to assets and voting privileges. Effective after the close of business on September 1, 2010, Class B shares were closed to new accounts and additional purchases, except for exchanges and reinvestments. Each class has exclusive voting rights with respect to matters that affect that class. Class B shares will automatically convert to Class A shares after a holding period of seven years from the initial date of purchase. Investment income, realized and unrealized capital gains and losses, the common expenses of the Fund, and certain fund-level expense reductions, if any, are allocated on a pro-rata basis to each class based on the relative net assets of each class to the total net assets of the Fund. Each class differs with respect to transfer agent and distribution and service plan fees incurred. Certain expense reductions may also differ by class. The Fund's investments in emerging markets can be subject to social, economic, regulatory, and political uncertainties and can be extremely volatile.
2. Investments in Fidelity Central Funds.
The Fund may invest in Fidelity Central Funds, which are open-end investment companies available only to other investment companies and accounts managed by Fidelity Management & Research Company (FMR) and its affiliates. The Fund's Schedule of Investments lists each of the Fidelity Central Funds held as of period end, if any, as an investment of the Fund, but does not include the underlying holdings of each Fidelity Central Fund. As an Investing Fund, the Fund indirectly bears its proportionate share of the expenses of the underlying Fidelity Central Funds.
The Money Market Central Funds seek preservation of capital and current income and are managed by Fidelity Investments Money Management, Inc. (FIMM), an affiliate of FMR.
A complete unaudited list of holdings for each Fidelity Central Fund is available upon request or at the Securities and Exchange Commission (the SEC) web site at www.sec.gov. In addition, the financial statements of the Fidelity Central Funds, which are not covered by the Fund's Report of Independent Registered Public Accounting Firm, are available on the SEC web site or upon request.
Annual Report
3. Significant Accounting Policies.
The financial statements have been prepared in conformity with accounting principles generally accepted in the United States of America (GAAP), which require management to make certain estimates and assumptions at the date of the financial statements. Actual results could differ from those estimates. Subsequent events, if any, through the date that the financial statements were issued have been evaluated in the preparation of the financial statements. The following summarizes the significant accounting policies of the Fund:
Security Valuation. Investments are valued as of 4:00 p.m. Eastern time on the last calendar day of the period. In accordance with valuation policies and procedures approved by the Board of Trustees (the Board), the Fund attempts to obtain prices from one or more third party pricing vendors or brokers to value its investments. When current market prices, quotations or rates are not readily available or reliable, securities will be fair valued in good faith by the FMR Fair Value Committee (the Committee), in accordance with procedures adopted by the Fund's Board. Factors used in determining fair value vary by security type and may include market or security specific events. The frequency with which these procedures are used cannot be predicted and they may be utilized to a significant extent. The Committee oversees the Fund's valuation policies and procedures and is responsible for approving and reporting to the Board all fair value determinations.
The Fund categorizes the inputs to valuation techniques used to value its investments into a disclosure hierarchy consisting of three levels as shown below:
Level 1 - quoted prices in active markets for identical investments
Level 2 - other significant observable inputs (including quoted prices for similar investments, interest rates, prepayment speeds, etc.)
Level 3 - unobservable inputs (including the Fund's own assumptions based on the best information available)
Valuation techniques used to value the Fund's investments by major category are as follows:
Equity securities, including restricted securities, for which market quotations are readily available, are valued at the last reported sale price or official closing price as reported by a third party pricing vendor on the primary market or exchange on which they are traded and are categorized as Level 1 in the hierarchy. In the event there were no sales during the day or closing prices are not available, securities are valued at the last quoted bid price or may be valued using the last available price and are generally categorized as Level 2 in the hierarchy. For foreign equity securities, when significant market or security specific events arise, comparisons to the valuation of American Depositary Receipts
Annual Report
Notes to Financial Statements - continued
3. Significant Accounting Policies - continued
Security Valuation - continued
(ADRs), futures contracts, Exchange-Traded Funds (ETFs) and certain indexes as well as quoted prices for similar securities are used and are categorized as Level 2 in the hierarchy. Utilizing these techniques may result in transfers between Level 1 and Level 2.
Investments in open-end mutual funds, including the Fidelity Central Funds, are valued at their closing net asset value (NAV) each business day and are categorized as Level 1 in the hierarchy.
Changes in valuation techniques may result in transfers in or out of an assigned level within the disclosure hierarchy. Information on transfers between Levels 1 and 2 is included at the end of the Fund's Schedule of Investments.
Foreign Currency Translation. The Fund may use foreign currency contracts to facilitate transactions in foreign-denominated securities. Gains and losses from these transactions may arise from changes in the value of the foreign currency or if the counterparties do not perform under the contracts' terms.
Foreign-denominated assets, including investment securities, and liabilities are translated into U.S. dollars at the exchange rates at period end. Purchases and sales of investment securities, income and dividends received and expenses denominated in foreign currencies are translated into U.S. dollars at the exchange rate in effect on the transaction date. The effects of exchange rate fluctuations on investments are included with the net realized and unrealized gain (loss) on investment securities. Other foreign currency transactions resulting in realized and unrealized gain (loss) are disclosed separately.
Investment Transactions and Income. For financial reporting purposes, the Fund's investment holdings and NAV include trades executed through the end of the last business day of the period. The NAV per share for processing shareholder transactions is calculated as of the close of business of the New York Stock Exchange (NYSE), normally 4:00 p.m. Eastern time and includes trades executed through the end of the prior business day. Gains and losses on securities sold are determined on the basis of identified cost and may include proceeds received from litigation. Dividend income is recorded on the ex-dividend date, except for certain dividends from foreign securities where the ex-dividend date may have passed, which are recorded as soon as the Fund is informed of the ex-dividend date. Non-cash dividends included in dividend income, if any, are recorded at the fair market value of the securities received. Distributions received on securities that represent a return of capital or capital gain are recorded as a reduction of cost of investments and/or as a realized gain. The Fund estimates the components of distributions received that may be considered return of capital distributions or capital
Annual Report
3. Significant Accounting Policies - continued
Investment Transactions and Income - continued
gain distributions. Interest income and distributions from the Fidelity Central Funds are accrued as earned. Investment income is recorded net of foreign taxes withheld where recovery of such taxes is uncertain.
Expenses. Expenses directly attributable to a fund are charged to that fund. Expenses attributable to more than one fund are allocated among the respective funds on the basis of relative net assets or other appropriate methods. Expense estimates are accrued in the period to which they relate and adjustments are made when actual amounts are known.
Income Tax Information and Distributions to Shareholders. Each year, the Fund intends to qualify as a regulated investment company under Subchapter M of the Internal Revenue Code, including distributing substantially all of its taxable income and realized gains. As a result, no provision for income taxes is required. As of October 31, 2012, the Fund did not have any unrecognized tax benefits in the financial statements; nor is the Fund aware of any tax positions for which it is reasonably possible that the total amounts of unrecognized tax benefits will significantly change in the next twelve months. The Fund files a U.S. federal tax return, in addition to state and local tax returns as required. A fund's federal income tax returns are subject to examination by the Internal Revenue Service (IRS) for a period of three fiscal years after they are filed. State and local tax returns may be subject to examination for an additional fiscal year depending on the jurisdiction. Foreign taxes are provided for based on the Fund's understanding of the tax rules and rates that exist in the foreign markets in which it invests.
Distributions are declared and recorded on the ex-dividend date. Income dividends and capital gain distributions are declared separately for each class. Income and capital gain distributions are determined in accordance with income tax regulations, which may differ from GAAP.
Capital accounts within the financial statements are adjusted for permanent book-tax differences. These adjustments have no impact on net assets or the results of operations. Temporary book-tax differences will reverse in a subsequent period.
Book-tax differences are primarily due to foreign currency transactions, passive foreign investment companies (PFIC), partnerships, capital loss carryforwards and losses deferred due to wash sales.
Annual Report
Notes to Financial Statements - continued
3. Significant Accounting Policies - continued
Income Tax Information and Distributions to Shareholders - continued
The federal tax cost of investment securities and unrealized appreciation (depreciation) as of period end were as follows:
Gross unrealized appreciation | $ 83,324,701 |
Gross unrealized depreciation | (15,053,989) |
Net unrealized appreciation (depreciation) on securities and other investments | $ 68,270,712 |
| |
Tax Cost | $ 307,043,033 |
The tax-based components of distributable earnings as of period end were as follows:
Undistributed ordinary income | $ 3,403,046 |
Capital loss carryforward | $ (347,236,330) |
Net unrealized appreciation (depreciation) | $ 68,251,537 |
Capital loss carryforwards are only available to offset future capital gains of the Fund to the extent provided by regulations and may be limited. Under the Regulated Investment Company Modernization Act of 2010 (the Act), the Fund is permitted to carry forward capital losses incurred in taxable years beginning after December 22, 2010 for an unlimited period and such capital losses are required to be used prior to any losses that expire. Capital loss carryforwards were as follows:
Fiscal year of expiration | |
2016 | $ (16,734,422) |
2017 | (330,501,908) |
Total capital loss carryforward | $ (347,236,330) |
The tax character of distributions paid was as follows:
| October 31, 2012 | October 31, 2011 |
Ordinary Income | $ 5,255,999 | $ 7,985,288 |
Short-Term Trading (Redemption) Fees. Shares held by investors in the Fund less than 90 days are subject to a redemption fee equal to 2.00% of the net asset value of shares redeemed. All redemption fees, which reduce the proceeds of the shareholder redemption, are retained by the Fund and accounted for as an addition to paid in capital.
New Accounting Pronouncement. In December 2011, the Financial Accounting Standards Board issued Accounting Standard Update No. 2011-11, Disclosures about Offsetting Assets and Liabilities. The update creates new disclosure requirements
Annual Report
3. Significant Accounting Policies - continued
New Accounting Pronouncement - continued
requiring entities to disclose both gross and net information for derivatives and other financial instruments that are either offset in the Statement of Assets and Liabilities or subject to an enforceable master netting arrangement or similar agreement. The disclosure requirements are effective for annual reporting periods beginning on or after January 1, 2013, and interim periods within those annual periods. Management is currently evaluating the impact of the update's adoption on the Fund's financial statement disclosures.
4. Purchases and Sales of Investments.
Purchases and sales of securities, other than short-term securities, aggregated $95,723,212 and $132,775,590, respectively.
5. Fees and Other Transactions with Affiliates.
Management Fee. FMR and its affiliates provide the Fund with investment management related services for which the Fund pays a monthly management fee. The management fee is the sum of an individual fund fee rate that is based on an annual rate of .60% of the Fund's average net assets and an annualized group fee rate that averaged .26% during the period. The group fee rate is based upon the average net assets of all the mutual funds advised by FMR. The group fee rate decreases as assets under management increase and increases as assets under management decrease. In addition, the management fee is subject to a performance adjustment (up to a maximum of ± .20% of the Fund's average net assets over a 36 month performance period). The upward or downward adjustment to the management fee is based on the relative investment performance of International Small Cap Opportunities as compared to an appropriate benchmark index. For the period, the total annual management fee rate, including the performance adjustment, was 1.07% of the Fund's average net assets.
Distribution and Service Plan Fees. In accordance with Rule 12b-1 of the 1940 Act, the Fund has adopted separate Distribution and Service Plans for each class of shares. Certain classes pay Fidelity Distributors Corporation (FDC), an affiliate of FMR, separate Distribution and Service Fees, each of which is based on an annual percentage of each class' average net assets. In addition, FDC may pay financial intermediaries for selling shares of the Fund and providing shareholder support services. For the period,
Annual Report
Notes to Financial Statements - continued
5. Fees and Other Transactions with Affiliates - continued
Distribution and Service Plan Fees - continued
the Distribution and Service Fee rates, total fees and amounts retained by FDC were as follows:
| Distribution
Fee | Service
Fee | Total Fees | Retained
by FDC |
Class A | -% | .25% | $ 45,023 | $ 324 |
Class T | .25% | .25% | 41,524 | 226 |
Class B | .75% | .25% | 20,873 | 15,685 |
Class C | .75% | .25% | 66,660 | 4,234 |
| | | $ 174,080 | $ 20,469 |
Sales Load. FDC may receive a front-end sales charge of up to 5.75% for selling Class A shares and 3.50% for selling Class T shares, some of which is paid to financial intermediaries for selling shares of the Fund. Depending on the holding period, FDC may receive contingent deferred sales charges levied on Class A, Class T, Class B, and Class C redemptions. The deferred sales charges range from 5.00% to 1.00% for Class B shares, 1.00% for Class C shares, 1.00% for certain purchases of Class A shares and .25% for certain purchases of Class T shares.
For the period, sales charge amounts retained by FDC were as follows:
| Retained
by FDC |
Class A | $ 4,301 |
Class T | 1,534 |
Class B* | 2,943 |
Class C* | 466 |
| $ 9,244 |
* When Class B and Class C shares are initially sold, FDC pays commissions from its own resources to financial intermediaries through which the sales are made.
Transfer Agent Fees. Fidelity Investments Institutional Operations Company, Inc. (FIIOC), an affiliate of FMR, is the transfer, dividend disbursing and shareholder servicing agent for each class of the Fund. FIIOC receives account fees and asset-based fees that vary according to the account size and type of account of the shareholders of the respective classes of the Fund. FIIOC pays for typesetting, printing and mailing of
Annual Report
5. Fees and Other Transactions with Affiliates - continued
Transfer Agent Fees - continued
shareholder reports, except proxy statements. For the period, transfer agent fees for each applicable class were as follows:
| Amount | % of
Average
Net Assets |
Class A | $ 54,282 | .30 |
Class T | 26,259 | .32 |
Class B | 6,290 | .30 |
Class C | 20,134 | .30 |
International Small Cap Opportunities | 886,296 | .28 |
Institutional Class | 6,524 | .26 |
| $ 999,785 | |
Accounting and Security Lending Fees. Fidelity Service Company, Inc. (FSC), an affiliate of FMR, maintains the Fund's accounting records. The accounting fee is based on the level of average net assets for each month. Under a separate contract, FSC administers the security lending program. The security lending fee is based on the number and duration of lending transactions.
Brokerage Commissions. The Fund placed a portion of its portfolio transactions with brokerage firms which are affiliates of the investment adviser. The commissions paid to these affiliated firms were $417 for the period.
6. Committed Line of Credit.
The Fund participates with other funds managed by FMR or an affiliate in a $4.25 billion credit facility (the "line of credit") to be utilized for temporary or emergency purposes to fund shareholder redemptions or for other short-term liquidity purposes. The Fund has agreed to pay commitment fees on its pro-rata portion of the line of credit, which amounted to $987 and is reflected in Miscellaneous expenses on the Statement of Operations. During the period, there were no borrowings on this line of credit.
7. Security Lending.
The Fund lends portfolio securities through a lending agent from time to time in order to earn additional income. For equity securities, a lending agent is used and may loan securities to certain qualified borrowers, including Fidelity Capital Markets (FCM), a broker-dealer affiliated with the Fund. On the settlement date of the loan, the Fund
Annual Report
Notes to Financial Statements - continued
7. Security Lending - continued
receives collateral (in the form of U.S. Treasury obligations, letters of credit and/or cash) against the loaned securities and maintains collateral in an amount not less than 100% of the market value of the loaned securities during the period of the loan. The market value of the loaned securities is determined at the close of business of the Fund and any additional required collateral is delivered to the Fund on the next business day. If the borrower defaults on its obligation to return the securities loaned because of insolvency or other reasons, a fund could experience delays and costs in recovering the securities loaned or in gaining access to the collateral. Any cash collateral received is invested in the Fidelity Securities Lending Cash Central Fund. The value of loaned securities and cash collateral at period end are disclosed on the Fund's Statement of Assets and Liabilities. Security lending income represents the income earned on investing cash collateral, less rebates paid to borrowers and any lending agent fees associated with the loan, plus any premium payments received for lending certain types of securities. Security lending income is presented in the Statement of Operations as a component of income from Fidelity Central Funds. Total security lending income during the period amounted to $123,696 During the period, there were no securities loaned to FCM.
8. Expense Reductions.
FMR voluntarily agreed to reimburse each class to the extent annual operating expenses exceeded certain levels of average net assets as noted in the table below. Some expenses, for example interest expense, including commitment fees, are excluded from this reimbursement.
The following classes were in reimbursement during the period:
| Expense
Limitations | Reimbursement
from adviser |
Class A | 1.65% | $ 17,831 |
Class T | 1.90% | 9,529 |
Class B | 2.40% | 2,107 |
Class C | 2.40% | 6,700 |
International Small Cap Opportunities | 1.40% | 233,896 |
Institutional Class | 1.40% | 1,228 |
| | $ 271,291 |
Many of the brokers with whom FMR places trades on behalf of the Fund provided services to the Fund in addition to trade execution. These services included payments of certain expenses on behalf of the Fund totaling $25,931 for the period. In addition, through arrangements with the Fund's custodian, credits realized as a result of
Annual Report
8. Expense Reductions - continued
uninvested cash balances were used to reduce the Fund's expenses. During the period, these credits reduced the Fund's expenses by $5.
9. Distributions to Shareholders.
Distributions to shareholders of each class were as follows:
Years ended October 31, | 2012 | 2011 |
From net investment income | | |
Class A | $ 208,264 | $ 234,699 |
Class T | 69,950 | 95,132 |
Class B | 6,357 | 17,225 |
Class C | 20,258 | 53,555 |
International Small Cap Opportunities | 4,562,121 | 5,789,167 |
Institutional Class | 19,730 | 33,517 |
Total | $ 4,886,680 | $ 6,223,295 |
From net realized gain | | |
Class A | $ 18,763 | $ 81,710 |
Class T | 8,968 | 45,784 |
Class B | 2,355 | 4,543 |
Class C | 7,235 | 13,930 |
International Small Cap Opportunities | 330,589 | 1,606,951 |
Institutional Class | 1,409 | 9,075 |
Total | $ 369,319 | $ 1,761,993 |
10. Share Transactions.
Transactions for each class of shares were as follows:
| Shares | Dollars |
Years ended October 31, | 2012 | 2011 | 2012 | 2011 |
Class A | | | | |
Shares sold | 245,367 | 414,528 | $ 2,443,449 | $ 4,258,719 |
Reinvestment of distributions | 21,375 | 27,655 | 198,575 | 279,266 |
Shares redeemed | (495,775) | (586,134) | (4,923,741) | (5,964,528) |
Net increase (decrease) | (229,033) | (143,951) | $ (2,281,717) | $ (1,426,543) |
Class T | | | | |
Shares sold | 101,299 | 106,538 | $ 986,575 | $ 1,079,217 |
Reinvestment of distributions | 8,148 | 13,404 | 75,201 | 134,702 |
Shares redeemed | (246,162) | (371,432) | (2,450,796) | (3,710,229) |
Net increase (decrease) | (136,715) | (251,490) | $ (1,389,020) | $ (2,496,310) |
Annual Report
Notes to Financial Statements - continued
10. Share Transactions - continued
| Shares | Dollars |
Years ended October 31, | 2012 | 2011 | 2012 | 2011 |
Class B | | | | |
Shares sold | 3,884 | 6,900 | $ 38,597 | $ 67,544 |
Reinvestment of distributions | 862 | 1,989 | 7,845 | 19,877 |
Shares redeemed | (59,335) | (71,270) | (579,917) | (711,316) |
Net increase (decrease) | (54,589) | (62,381) | $ (533,475) | $ (623,895) |
Class C | | | | |
Shares sold | 69,065 | 80,402 | $ 669,794 | $ 802,688 |
Reinvestment of distributions | 2,800 | 5,984 | 25,455 | 59,727 |
Shares redeemed | (170,268) | (295,393) | (1,664,901) | (2,919,335) |
Net increase (decrease) | (98,403) | (209,007) | $ (969,652) | $ (2,056,920) |
International Small Cap Opportunities | | | | |
Shares sold | 5,283,408 | 4,054,816 | $ 53,067,911 | $ 41,630,046 |
Reinvestment of distributions | 495,697 | 693,159 | 4,634,765 | 7,035,420 |
Shares redeemed | (8,350,807) | (11,579,067) | (84,356,251) | (119,651,010) |
Net increase (decrease) | (2,571,702) | (6,831,092) | $ (26,653,575) | $ (70,985,544) |
Institutional Class | | | | |
Shares sold | 348,073 | 36,278 | $ 3,541,043 | $ 362,488 |
Reinvestment of distributions | 1,709 | 3,294 | 15,997 | 33,471 |
Shares redeemed | (70,045) | (141,623) | (705,927) | (1,476,463) |
Net increase (decrease) | 279,737 | (102,051) | $ 2,851,113 | $ (1,080,504) |
11. Other.
The Fund's organizational documents provide former and current trustees and officers with a limited indemnification against liabilities arising in connection with the performance of their duties to the Fund. In the normal course of business, the Fund may also enter into contracts that provide general indemnifications. The Fund's maximum exposure under these arrangements is unknown as this would be dependent on future claims that may be made against the Fund. The risk of material loss from such claims is considered remote.
Annual Report
To the Trustees of Fidelity Investment Trust and Shareholders of Fidelity International Small Cap Opportunities Fund:
We have audited the accompanying statement of assets and liabilities of Fidelity International Small Cap Opportunities Fund (the Fund), a fund of Fidelity Investment Trust, including the schedule of investments, as of October 31, 2012, and the related statement of operations for the year then ended, the statement of changes in net assets for each of the two years in the period then ended, and the financial highlights for each of the five years in the period then ended. These financial statements and financial highlights are the responsibility of the Fund's management. Our responsibility is to express an opinion on these financial statements and financial highlights based on our audits.
We conducted our audits in accordance with the standards of the Public Company Accounting Oversight Board (United States). Those standards require that we plan and perform the audit to obtain reasonable assurance about whether the financial statements and financial highlights are free of material misstatement. The Fund is not required to have, nor were we engaged to perform, an audit of its internal control over financial reporting. Our audits included consideration of internal control over financial reporting as a basis for designing audit procedures that are appropriate in the circumstances, but not for the purpose of expressing an opinion on the effectiveness of the Fund's internal control over financial reporting. Accordingly, we express no such opinion. An audit also includes examining, on a test basis, evidence supporting the amounts and disclosures in the financial statements, assessing the accounting principles used and significant estimates made by management, as well as evaluating the overall financial statement presentation. Our procedures included confirmation of securities owned as of October 31, 2012, by correspondence with the custodians and brokers; where replies were not received from brokers, we performed other auditing procedures. We believe that our audits provide a reasonable basis for our opinion.
In our opinion, the financial statements and financial highlights referred to above present fairly, in all material respects, the financial position of Fidelity International Small Cap Opportunities Fund as of October 31, 2012, the results of its operations for the year then ended, the changes in its net assets for each of the two years in the period then ended, and the financial highlights for each of the five years in the period then ended, in conformity with accounting principles generally accepted in the United States of America.
DELOITTE & TOUCHE LLP
Boston, Massachusetts
December 14, 2012
Annual Report
The Trustees, Members of the Advisory Board, and executive officers of the trust and fund, as applicable, are listed below. The Board of Trustees governs the fund and is responsible for protecting the interests of shareholders. The Trustees are experienced executives who meet periodically throughout the year to oversee the fund's activities, review contractual arrangements with companies that provide services to the fund, oversee management of the risks associated with such activities and contractual arrangements, and review the fund's performance. Except for James C. Curvey, each of the Trustees oversees 236 funds advised by FMR or an affiliate. Mr. Curvey oversees 443 funds advised by FMR or an affiliate.
The Trustees hold office without limit in time except that (a) any Trustee may resign; (b) any Trustee may be removed by written instrument, signed by at least two-thirds of the number of Trustees prior to such removal; (c) any Trustee who requests to be retired or who has become incapacitated by illness or injury may be retired by written instrument signed by a majority of the other Trustees; and (d) any Trustee may be removed at any special meeting of shareholders by a two-thirds vote of the outstanding voting securities of the trust. Each Trustee who is not an interested person (as defined in the 1940 Act) (Independent Trustee), shall retire not later than the last day of the calendar year in which his or her 75th birthday occurs. The Independent Trustees may waive this mandatory retirement age policy with respect to individual Trustees. The executive officers and Advisory Board Members hold office without limit in time, except that any officer and Advisory Board Member may resign or may be removed by a vote of a majority of the Trustees at any regular meeting or any special meeting of the Trustees. Except as indicated, each individual has held the office shown or other offices in the same company for the past five years.
Experience, Skills, Attributes, and Qualifications of the Fund's Trustees. The Governance and Nominating Committee has adopted a statement of policy that describes the experience, qualifications, attributes, and skills that are necessary and desirable for potential Independent Trustee candidates (Statement of Policy). The Board believes that each Trustee satisfied at the time he or she was initially elected or appointed a Trustee, and continues to satisfy, the standards contemplated by the Statement of Policy. The Governance and Nominating Committee also engages professional search firms to help identify potential Independent Trustee candidates who have the experience, qualifications, attributes, and skills consistent with the Statement of Policy. From time to time, additional criteria based on the composition and skills of the current Independent Trustees, as well as experience or skills that may be appropriate in light of future changes to board composition, business conditions, and regulatory or other developments, have also been considered by the professional search firms and the Governance and Nominating Committee. In addition, the Board takes into account the Trustees' commitment and participation in Board and committee meetings, as well as their leadership of standing and ad hoc committees throughout their tenure.
In determining that a particular Trustee was and continues to be qualified to serve as a Trustee, the Board has considered a variety of criteria, none of which, in isolation, was controlling. The Board believes that, collectively, the Trustees have balanced and diverse experience, qualifications, attributes, and skills, which allow the Board to operate effectively in governing the fund and protecting the interests of shareholders. Information about the specific experience, skills, attributes, and qualifications of each Trustee, which in each case led to the Board's conclusion that the Trustee should serve (or continue to serve) as a trustee of the fund, is provided below.
Annual Report
Board Structure and Oversight Function. James C. Curvey is an interested person (as defined in the 1940 Act) and currently serves as Chairman. The Trustees have determined that an interested Chairman is appropriate and benefits shareholders because an interested Chairman has a personal and professional stake in the quality and continuity of services provided to the fund. Independent Trustees exercise their informed business judgment to appoint an individual of their choosing to serve as Chairman, regardless of whether the Trustee happens to be independent or a member of management. The Independent Trustees have determined that they can act independently and effectively without having an Independent Trustee serve as Chairman and that a key structural component for assuring that they are in a position to do so is for the Independent Trustees to constitute a substantial majority for the Board. The Independent Trustees also regularly meet in executive session. Ned C. Lautenbach serves as Chairman of the Independent Trustees and as such (i) acts as a liaison between the Independent Trustees and management with respect to matters important to the Independent Trustees and (ii) with management prepares agendas for Board meetings.
Fidelity funds are overseen by different Boards of Trustees. The fund's Board oversees Fidelity's equity and high income funds and another Board oversees Fidelity's investment-grade bond, money market, and asset allocation funds. The asset allocation funds may invest in Fidelity funds overseen by the fund's Board. The use of separate Boards, each with its own committee structure, allows the Trustees of each group of Fidelity funds to focus on the unique issues of the funds they oversee, including common research, investment, and operational issues. On occasion, the separate Boards establish joint committees to address issues of overlapping consequences for the Fidelity funds overseen by each Board.
The Trustees operate using a system of committees to facilitate the timely and efficient consideration of all matters of importance to the Trustees, the fund, and fund shareholders and to facilitate compliance with legal and regulatory requirements and oversight of the fund's activities and associated risks. The Board, acting through its committees, has charged FMR and its affiliates with (i) identifying events or circumstances the occurrence of which could have demonstrably adverse effects on the fund's business and/or reputation; (ii) implementing processes and controls to lessen the possibility that such events or circumstances occur or to mitigate the effects of such events or circumstances if they do occur; and (iii) creating and maintaining a system designed to evaluate continuously business and market conditions in order to facilitate the identification and implementation processes described in (i) and (ii) above. Because the day-to-day operations and activities of the fund are carried out by or through FMR, its affiliates and other service providers, the fund's exposure to risks is mitigated but not eliminated by the processes overseen by the Trustees. While each of the Board's committees has responsibility for overseeing different aspects of the fund's activities, oversight is exercised primarily through the Operations, Audit, and Compliance Committees. In addition, the Independent Trustees have worked with FMR to enhance the Board's oversight of investment and financial risks, legal and regulatory risks, technology risks, and operational risks, including the development of additional risk reporting to the Board. For example, a working group comprised of Independent Trustees and FMR has worked and continues to work to review the Fidelity funds' valuation-related activities, reporting and risk management. Appropriate personnel, including but not limited to the fund's Chief Compliance Officer (CCO), FMR's internal auditor, the independent accountants, the fund's Treasurer and portfolio management personnel, make periodic reports to the Board's committees, as appropriate, including an annual review of FMR's risk management program for the Fidelity funds. The responsibilities of each standing committee, including their oversight responsibilities, are described further under "Standing Committees of the Fund's Trustees."
Annual Report
Trustees and Officers - continued
The fund's Statement of Additional Information (SAI) includes more information about the Trustees. To request a free copy, call Fidelity at 1-877-208-0098.
Interested Trustees*:
Correspondence intended for each Trustee who is an interested person may be sent to Fidelity Investments, 82 Devonshire Street, Boston, Massachusetts 02109.
Name, Age; Principal Occupations and Other Relevant Experience+ |
James C. Curvey (77) |
| Year of Election or Appointment: 2007 Mr. Curvey is Trustee and Chairman of the Board of Trustees of certain Trusts. Mr. Curvey also serves as Trustee (2007-present) of other investment companies advised by FMR. Mr. Curvey is a Director of Fidelity Investments Money Management, Inc. (2009-present), Director of Fidelity Research & Analysis Co. (2009-present) and Director of FMR and FMR Co., Inc. (2007-present). Mr. Curvey is also Vice Chairman (2007-present) and Director of FMR LLC. In addition, Mr. Curvey serves as an Overseer for the Boston Symphony Orchestra and a member of the Trustees of Villanova University. Previously, Mr. Curvey was the Vice Chairman (2006-2007) and Director (2000-2007) of FMR Corp. |
Ronald P. O'Hanley (55) |
| Year of Election or Appointment: 2011 Mr. O'Hanley is Director of FMR Co., Inc. (2010-present), Director of Fidelity Investments Money Management, Inc. (2010-present), Director of Fidelity Research & Analysis Company (2010-present), President of Fidelity Asset Management and Corporate Services and a member of Fidelity's Executive Committee (2010-present). Previously, Mr. O'Hanley served as President and Chief Executive Officer of BNY Mellon Asset Management (2007-2010). Mr. O'Hanley also served as Vice Chairman of Bank New York Mellon Corp. and a member of that firm's Executive Committee. Prior to the 2007 merger of The Bank of New York and Mellon Financial Corporation, he was Vice Chairman of Mellon Financial Corporation and President and Chief Executive Officer of Mellon Asset Management. He joined Mellon in February 1997. Mr. O'Hanley currently serves as Chairman of the Boston Public Library Foundation Board of Directors and sits on the Board of Directors of Beth Israel Deaconess Medical Center, the Board of Trustees of the Marine Biological Laboratory and the Advisory Board of the Maxwell School of Citizenship and Public Administration at Syracuse University. Mr. O'Hanley also chairs the Council on Asset Management for the Financial Services Roundtable and is a member of the Board of Directors of Institutional Investor's U.S. Institute. |
* Trustees have been determined to be "Interested Trustees" by virtue of, among other things, their affiliation with the trust or various entities under common control with FMR.
+ The information above includes each Trustee's principal occupation during the last five years and other information relating to the experience, attributes, and skills relevant to each Trustee's qualifications to serve as a Trustee, which led to the conclusion that each Trustee should serve as a Trustee for the fund.
Annual Report
Trustees and Officers - continued
Independent Trustees:
Correspondence intended for each Independent Trustee (that is, the Trustees other than the Interested Trustees) may be sent to Fidelity Investments, P.O. Box 55235, Boston, Massachusetts 02205-5235.
Name, Age; Principal Occupations and Other Relevant Experience+ |
Dennis J. Dirks (64) |
| Year of Election or Appointment: 2005 Prior to his retirement in May 2003, Mr. Dirks was Chief Operating Officer and a member of the Board of The Depository Trust & Clearing Corporation (DTCC). He also served as President, Chief Operating Officer, and Board member of The Depository Trust Company (DTC) and President and Board member of the National Securities Clearing Corporation (NSCC). In addition, Mr. Dirks served as Chief Executive Officer and Board member of the Government Securities Clearing Corporation, Chief Executive Officer and Board member of the Mortgage-Backed Securities Clearing Corporation, as a Trustee and a member of the Finance Committee of Manhattan College (2005-2008), and as a Trustee and a member of the Finance Committee of AHRC of Nassau County (2006-2008). Mr. Dirks is a member of the Independent Directors Council (IDC) Governing Council (2010-present) and Board of Directors for The Brookville Center for Children's Services, Inc. (2009-present). |
Alan J. Lacy (59) |
| Year of Election or Appointment: 2008 Mr. Lacy serves as Senior Adviser (2007-present) of Oak Hill Capital Partners, L.P. (private equity). Mr. Lacy also served as Chief Executive Officer (2000-2005) and Vice Chairman (2005-2006) of Sears Holdings Corporation and Sears, Roebuck and Co. (retail). In addition, Mr. Lacy serves as a member of the Board of Directors of Dave & Buster's Entertainment, Inc. (restaurant and entertainment complexes, 2010-present), Earth Fare, Inc. (retail grocery, 2012-present), The Hillman Companies, Inc. (hardware wholesalers, 2010-present), and Bristol-Myers Squibb Company (global pharmaceuticals, 2008-present). Mr. Lacy is a member of the Board of Trustees of The National Parks Conservation Association (2006-present). Previously, Mr. Lacy served as Chairman of the Board of Trustees of the National Parks Conservation Association (2008-2011) and as a member of the Board of Directors for the Western Union Company (global money transfer, 2006-2011). |
Ned C. Lautenbach (68) |
| Year of Election or Appointment: 2000 Mr. Lautenbach is Chairman of the Independent Trustees of the Equity and High Income Funds (2006-present). Mr. Lautenbach currently serves as the Lead Director of the Eaton Corporation Board of Directors (diversified industrial, 1997-present). Mr. Lautenbach is Chairman of the Board of Directors of the Philharmonic Center for the Arts in Naples, Florida (2012-present) and a member of the Council on Foreign Relations (1994-present). Previously, Mr. Lautenbach was a Partner/Advisory Partner at Clayton, Dubilier & Rice, LLC (private equity investment, 1998-2010), as well as a Director of Sony Corporation (2006-2007). |
Joseph Mauriello (68) |
| Year of Election or Appointment: 2008 Prior to his retirement in January 2006, Mr. Mauriello served in numerous senior management positions including Deputy Chairman and Chief Operating Officer (2004-2005), and Vice Chairman of Financial Services (2002-2004) of KPMG LLP US (professional services, 1965-2005). Mr. Mauriello currently serves as a member of the Board of Directors of XL Group plc. (global insurance and re-insurance, 2006-present). Previously, Mr. Mauriello served as a Director of the Hamilton Funds of the Bank of New York (2006-2007) and of Arcadia Resources Inc. (health care services and products, 2007-2012). |
Robert W. Selander (62) |
| Year of Election or Appointment: 2011 Previously, Mr. Selander served as a Member of the Advisory Board of Fidelity's Equity and High Income Funds (2011), Executive Vice Chairman (2010), Chief Executive Officer (2009-2010), and President and Chief Executive Officer (1997-2009) of Mastercard, Inc. |
Cornelia M. Small (68) |
| Year of Election or Appointment: 2005 Ms. Small is a member of the Board of Directors (2009-present) and Chair of the Investment Committee (2010-present) of the Teagle Foundation. Ms. Small also serves on the Investment Committee of the Berkshire Taconic Community Foundation (2008-present). Previously, Ms. Small served as Chairperson (2002-2008) and a member of the Investment Committee and Chairperson (2008-2012) and a member of the Board of Trustees of Smith College. In addition, Ms. Small served as Chief Investment Officer, Director of Global Equity Investments, and a member of the Board of Directors of Scudder, Stevens & Clark and Scudder Kemper Investments. |
William S. Stavropoulos (73) |
| Year of Election or Appointment: 2001 Mr. Stavropoulos is Vice Chairman of the Independent Trustees of the Equity and High Income Funds (2006-present). Mr. Stavropoulos serves as President and Founder of the Michigan Baseball Foundation, the Great Lakes Loons (2007-present). Mr. Stavropoulos is Chairman Emeritus of the Board of Directors of The Dow Chemical Company, where he previously served in numerous senior management positions, including President, CEO (1995-2000; 2002-2004), Chairman of the Executive Committee (2000-2006), and as a member of the Board of Directors (1990-2006). Currently, Mr. Stavropoulos is a Director of Univar Inc. (global distributor of commodity and specialty chemicals, Chairman from 2010-May 2012 and Lead Director from May 2012-present), Teradata Corporation (data warehousing and technology solutions, 2008-present), Maersk Inc. (industrial conglomerate), and Tyco International, Ltd. (multinational manufacturing and services, 2007-present), and a member of the Advisory Board for Metalmark Capital LLC (private equity investment, 2005-present). Mr. Stavropoulos is an operating advisor to Clayton, Dubilier & Rice, LLC (private equity investment). In addition, Mr. Stavropoulos is a member of the University of Notre Dame Advisory Council for the College of Science, a Trustee of the Rollin L. Gerstacker Foundation, and a Director of the Naples Philharmonic Center for the Arts. Previously, Mr. Stavropoulos served as a Director of Chemical Financial Corporation (bank holding company, 1993-2012). |
David M. Thomas (63) |
| Year of Election or Appointment: 2008 Previously, Mr. Thomas served as Executive Chairman (2005-2006) and Chairman and Chief Executive Officer (2000-2005) of IMS Health, Inc. (pharmaceutical and healthcare information solutions), and a Director of Fortune Brands, Inc. (consumer products, 2000-2011). In addition, Mr. Thomas serves as Non-Executive Chairman of the Board of Directors of Fortune Brands Home and Security (home and security products, 2011-present), and as a member of the Board of Directors of Interpublic Group of Companies, Inc. (marketing communication, 2004-present). |
Michael E. Wiley (62) |
| Year of Election or Appointment: 2008 Mr. Wiley also serves as a Director of Asia Pacific Exploration Consolidated (international oil and gas exploration and production, 2008-present). Mr. Wiley serves as a Director of Tesoro Corporation (independent oil refiner and marketer, 2005-present), and a Director of Bill Barrett Corporation (exploration and production, 2005-present). In addition, Mr. Wiley also serves as a Director of Post Oak Bank (privately-held bank, 2004-present). Previously, Mr. Wiley served as a member of the Board of Trustees of the University of Tulsa (2000-2006; 2007-2010), as a Senior Energy Advisor of Katzenbach Partners, LLC (consulting, 2006-2007), as an Advisory Director of Riverstone Holdings (private investment), Chairman, President, and CEO of Baker Hughes, Inc. (oilfield services, 2000-2004), and as Director of Spinnaker Exploration Company (exploration and production, 2001-2005). |
+ The information above includes each Trustee's principal occupation during the last five years and other information relating to the experience, attributes, and skills relevant to each Trustee's qualifications to serve as a Trustee, which led to the conclusion that each Trustee should serve as a Trustee for the fund.
Advisory Board Members and Executive Officers:
Correspondence intended for David A. Rosow and Garnett A. Smith may be sent to Fidelity Investments, P.O. Box 55235, Boston, Massachusetts 02205-5235. Correspondence intended for each executive officer, Edward C. Johnson 3d, and Peter S. Lynch may be sent to Fidelity Investments, 82 Devonshire Street, Boston, Massachusetts 02109.
Name, Age; Principal Occupation |
Edward C. Johnson 3d (82) |
| Year of Election or Appointment: 2011 Member of the Advisory Board of Fidelity's Equity and High Income Funds. Mr. Johnson serves as Chief Executive Officer, Chairman, and a Director of FMR LLC, and also serves as Chairman and Director of FIL Limited. Previously, Mr. Johnson served as a Trustee and Chairman of the Board of certain Fidelity Trusts, Chairman and a Director of FMR, Chairman and a Director of FMR Co., Inc., and President of FMR LLC (2006-2007). |
Peter S. Lynch (68) |
| Year of Election or Appointment: 2003 Member of the Advisory Board of Fidelity's Equity and High Income Funds. Mr. Lynch is Vice Chairman and a Director of FMR and FMR Co., Inc. In addition, Mr. Lynch serves as a Trustee of Boston College and as the Chairman of the Inner-City Scholarship Fund. Previously, Mr. Lynch served on the Special Olympics International Board of Directors (1997-2006). |
David A. Rosow (70) |
| Year of Election or Appointment: 2012 Member of the Advisory Board of Fidelity's Equity and High Income Funds. Chairman and Chief Executive Officer of International Golf Group, Inc. (golf course development, 1989-present). Previously, Mr. Rosow served as Chairman and Chief Executive Officer of Rosow & Company, Inc. (private investment company, 1989-2011), a Lead Director of Hudson United Bancorp (2001-2006) and as a Director of TD Banknorth (1996-2006). In addition, Mr. Rosow is a member (2008-present) and President (2009-present) of the Town Council of Palm Beach, Florida. |
Garnett A. Smith (65) |
| Year of Election or Appointment: 2012 Member of the Advisory Board of Fidelity's Equity and High Income Funds. Prior to Mr. Smith's retirement, he served as Chairman and Chief Executive Officer of Inbrand Corp. (manufacturer of personal absorbent products, 1990-1997). He also served as President (1986-1990) of Inbrand Corp. Prior to his employment with Inbrand Corp., he was employed by a retail fabric chain and North Carolina National Bank. In addition, Mr. Smith is a board member of the Jackson Hole Land Trust (2009-present). |
Kenneth B. Robins (43) |
| Year of Election or Appointment: 2008 President and Treasurer of Fidelity's Equity and High Income Funds. Mr. Robins also serves as President and Treasurer (2010-present) and Assistant Treasurer (2009-present) of other Fidelity funds and is an employee of Fidelity Investments (2004-present). Previously, Mr. Robins served as Deputy Treasurer of the Fidelity funds (2005-2008) and Treasurer and Chief Financial Officer of The North Carolina Capital Management Trust: Cash and Term Portfolios (2006-2008). |
Bruce T. Herring (47) |
| Year of Election or Appointment: 2006 Vice President of certain Equity Funds. Mr. Herring also serves as President of Fidelity Research & Analysis Company (2010-present), Chief Investment Officer and Director of Fidelity Management & Research (U.K.) Inc. (2010-present) and Group Chief Investment Officer of FMR. Previously, Mr. Herring served as Vice President (2005-2006) and Senior Vice President (2006-2007) of Fidelity Management & Research Company, Vice President of FMR Co., Inc. (2001-2007) and as a portfolio manager for Fidelity U.S. Equity Funds. |
Brian B. Hogan (48) |
| Year of Election or Appointment: 2009 Vice President of Equity and High Income Funds. Mr. Hogan also serves as President of FMR's Equity Division (2009-present). Previously, Mr. Hogan served as Senior Vice President, Equity Research of FMR (2006-2009) and as a portfolio manager. |
Scott C. Goebel (44) |
| Year of Election or Appointment: 2008 Secretary and Chief Legal Officer (CLO) of the Fidelity funds. Mr. Goebel also serves as Secretary of Fidelity Investments Money Management, Inc. (FIMM) (2010-present) and Fidelity Research and Analysis Company (FRAC) (2010-present); Secretary and CLO of The North Carolina Capital Management Trust: Cash and Term Portfolios (2008-present); General Counsel, Secretary, and Senior Vice President of FMR (2008-present) and FMR Co., Inc. (2008-present); employed by FMR LLC or an affiliate (2001-present); Chief Legal Officer of Fidelity Management & Research (Hong Kong) Limited (2008-present) and Assistant Secretary of Fidelity Management & Research (Japan) Inc. (2008-present), and Fidelity Management & Research (U.K.) Inc. (2008-present). Previously, Mr. Goebel served as Assistant Secretary of FIMM (2008-2010), FRAC (2008-2010), and the Funds (2007-2008) and as Vice President and Secretary of Fidelity Distributors Corporation (FDC) (2005-2007). |
William C. Coffey (43) |
| Year of Election or Appointment: 2009 Assistant Secretary of Fidelity's Equity and High Income Funds. Mr. Coffey also serves as Senior Vice President and Deputy General Counsel of FMR LLC (2010-present), and is an employee of Fidelity Investments. Previously, Mr. Coffey served as Vice President and Associate General Counsel of FMR LLC (2005-2009). |
Elizabeth Paige Baumann (44) |
| Year of Election or Appointment: 2012 Anti-Money Laundering (AML) Officer of the Fidelity funds. Ms. Baumann also serves as AML Officer of The North Carolina Capital Management Trust: Cash and Term Portfolios (2012-present), Chief AML Officer of FMR LLC (2012-present), and is an employee of Fidelity Investments. Previously, Ms. Baumann served as Vice President and Deputy Anti-Money Laundering Officer (2007-2012). |
Christine Reynolds (54) |
| Year of Election or Appointment: 2008 Chief Financial Officer of the Fidelity funds. Ms. Reynolds became President of Fidelity Pricing and Cash Management Services (FPCMS) in August 2008. Ms. Reynolds served as Chief Operating Officer of FPCMS (2007-2008). Previously, Ms. Reynolds served as President, Treasurer, and Anti-Money Laundering officer of the Fidelity funds (2004-2007). |
Joseph A. Hanlon (44) |
| Year of Election or Appointment: 2012 Chief Compliance Officer of Fidelity's Equity and High Income Funds. Mr. Hanlon serves as Compliance Officer of FMR, FMR Co., Inc., Fidelity Investments Money Management, Inc. (FIMM), Fidelity Research and Analysis Company (FRAC), Fidelity Management & Research (Japan) Inc., Fidelity Management & Research (U.K.) Inc., Fidelity Management & Research (Hong Kong), and Strategic Advisers, Inc. (2009-present), as Senior Vice President of the Fidelity Asset Management Division (2009-present), and is an employee of Fidelity Investments. |
Joseph F. Zambello (55) |
| Year of Election or Appointment: 2011 Deputy Treasurer of the Fidelity funds. Mr. Zambello is an employee of Fidelity Investments. Previously, Mr. Zambello served as Vice President of FMR's Program Management Group (2009-2011) and Vice President of the Transfer Agent Oversight Group (2005-2009). |
Adrien E. Deberghes (45) |
| Year of Election or Appointment: 2008 Deputy Treasurer of Fidelity's Equity and High Income Funds. Mr. Deberghes also serves as Vice President (2011-present) and Assistant Treasurer (2010-present) of other Fidelity funds, and is an employee of Fidelity Investments (2008-present). Previously, Mr. Deberghes served as Senior Vice President of Mutual Fund Administration at State Street Corporation (2007-2008), Senior Director of Mutual Fund Administration at Investors Bank & Trust (2005-2007), and Director of Finance for Dunkin' Brands (2000-2005). |
Stephen Sadoski (41) |
| Year of Election or Appointment: 2012 Deputy Treasurer of Fidelity's Equity and High Income Funds. Mr. Sadoski also serves as Assistant Treasurer of other Fidelity funds (2012-present) and is an employee of Fidelity Investments (2012-present). Previously, Mr. Sadoski served as an assistant chief accountant in the Division of Investment Management of the Securities and Exchange Commission (SEC) (2009-2012) and as a senior manager at Deloitte & Touche (1997-2009). |
Stephanie J. Dorsey (43) |
| Year of Election or Appointment: 2010 Assistant Treasurer of Fidelity's Equity and High Income Funds. Ms. Dorsey also serves as Deputy Treasurer of other Fidelity funds (2008-present) and is an employee of Fidelity Investments (2008-present). Previously, Ms. Dorsey served as Treasurer (2004-2008) of the JPMorgan Mutual Funds and Vice President (2004-2008) of JPMorgan Chase Bank. |
John R. Hebble (54) |
| Year of Election or Appointment: 2009 Assistant Treasurer of Fidelity's Equity and High Income Funds. Mr. Hebble also serves as President (2011-present), Treasurer, and Chief Financial Officer of The North Carolina Capital Management Trust: Cash and Term Portfolios (2008-present), President and Treasurer of other Fidelity funds (2008-present) and is an employee of Fidelity Investments. |
Gary W. Ryan (54) |
| Year of Election or Appointment: 2005 Assistant Treasurer of the Fidelity funds. Mr. Ryan is an employee of Fidelity Investments. Previously, Mr. Ryan served as Vice President of Fund Reporting in Fidelity Pricing and Cash Management Services (FPCMS) (1999-2005). |
Jonathan Davis (44) |
| Year of Election or Appointment: 2010 Assistant Treasurer of the Fidelity funds. Mr. Davis is also Assistant Treasurer of Fidelity Rutland Square Trust II and Fidelity Commonwealth Trust II. Mr. Davis is an employee of Fidelity Investments. Previously, Mr. Davis served as Vice President and Associate General Counsel of FMR LLC (2003-2010). |
Annual Report
The Board of Trustees of Advisor International Small Cap Opportunities Fund voted to pay to shareholders of record at the opening of business on record date, the following distributions per share derived from capital gains realized from sales of portfolio securities, and dividends derived from net investment income:
| Pay Date | Record Date | Dividends | Capital Gains |
Institutional Class | 12/10/12 | 12/07/12 | $0.102 | $0.005 |
Institutional Class designates 5% of the dividends distributed during the fiscal year as qualifying for the dividends-received deduction for corporate shareholders.
Institutional Class designates 97% of the dividends distributed during the fiscal year as amounts which may be taken into account as a dividend for purposes of the maximum rate under section 1(h) (11) of the Internal Revenue Code.
The amounts per share which represent income derived from sources within, and taxes paid to, foreign countries or possessions of the United States are as follows:
| Pay Date | Income | Taxes |
Institutional Class | 12/05/11 | $0.160 | $0.0103 |
The fund will notify shareholders in January 2013 of amounts for use in preparing 2012 income tax returns.
Annual Report
Board Approval of Investment Advisory Contracts and Management Fees
Fidelity International Small Cap Opportunities Fund
Each year, the Board of Trustees, including the Independent Trustees (together, the Board), votes on the renewal of the management contract and sub-advisory agreements (together, the Advisory Contracts) for the fund. The Board, assisted by the advice of fund counsel and Independent Trustees' counsel, requests and considers a broad range of information relevant to the renewal of the Advisory Contracts throughout the year.
The Board meets regularly and, at each of its meetings, considers factors that are relevant to its annual consideration of the renewal of the fund's Advisory Contracts, including the services and support provided to the fund and its shareholders. The Board has established various standing committees, each composed of and chaired by Independent Trustees with varying backgrounds, to which the Board has assigned specific subject matter responsibilities in order to enhance effective decision-making by the Board. The Board, acting directly and through its Committees, requests and receives information concerning the annual consideration of the renewal of the fund's Advisory Contracts. The Board also meets as needed to consider matters specifically related to the Board's annual consideration of the renewal of Advisory Contracts. Members of the Board may also meet with trustees of other Fidelity funds through ad hoc joint committees to discuss certain matters relevant to the Fidelity funds.
At its July 2012 meeting, the Board of Trustees, including the Independent Trustees, unanimously determined to renew the fund's Advisory Contracts. In reaching its determination, the Board considered all factors it believed relevant, including (i) the nature, extent, and quality of the services to be provided to the fund and its shareholders (including the investment performance of the fund); (ii) the competitiveness of the fund's management fee and total expense ratio relative to peer funds; (iii) the total costs of the services to be provided by and the profits to be realized by Fidelity from its relationship with the fund; (iv) the extent to which economies of scale exist and would be realized as the fund grows; and (v) whether fee levels reflect these economies of scale, if any, for the benefit of fund shareholders.
In considering whether to renew the Advisory Contracts for the fund, the Board reached a determination, with the assistance of fund counsel and Independent Trustees' counsel and through the exercise of its business judgment, that the renewal of the Advisory Contracts is in the best interests of the fund and its shareholders and that the compensation payable under the Advisory Contracts is fair and reasonable. The Board's decision to renew the Advisory Contracts was not based on any single factor, but rather was based on a comprehensive consideration of all the information provided to the Board at its meetings throughout the year. The Board, in reaching its determination to renew the Advisory Contracts, is aware that shareholders in the fund have a broad range of investment choices available to them, including a wide choice among mutual funds offered by Fidelity's competitors, and that the fund's shareholders, who have the opportunity to review and weigh the disclosure provided by the fund in its prospectus and other public disclosures, have chosen to invest in this fund, managed by Fidelity.
Annual Report
Board Approval of Investment Advisory Contracts and
Management Fees - continued
Nature, Extent, and Quality of Services Provided. The Board considered the staffing within the investment adviser, FMR, and the sub-advisers (together, the Investment Advisers), including the backgrounds of the fund's investment personnel, and also considered the fund's investment objective, strategies, and related investment philosophy. The Independent Trustees also had discussions with senior management of Fidelity's investment operations and investment groups. The Board considered the structure of the portfolio manager compensation program and whether this structure provides appropriate incentives to act in the best interests of the fund.
Resources Dedicated to Investment Management and Support Services. The Board and the Fund Oversight and Research Committees reviewed the general qualifications and capabilities of the Investment Advisers' investment staff, including its size, education, experience, and resources, as well as the Investment Advisers' approach to recruiting, training, managing, and compensating investment personnel. The Board also noted that FMR has continued to increase the resources devoted to non-U.S. offices, including expansion of Fidelity's global investment organization. The Board noted that Fidelity's analysts have extensive resources, tools and capabilities that allow them to conduct sophisticated quantitative and fundamental analysis, as well as credit analysis of issuers, counterparties and guarantors. The Board also believes that Fidelity's investment professionals have sufficient access to global information and data so as to provide competitive investment results over time, and that those professionals also have access to sophisticated tools that permit them to assess portfolio construction and risk and performance attribution characteristics continuously, as well as to transmit new information and research conclusions rapidly around the world. Additionally, in its deliberations, the Board considered the Investment Advisers' trading and risk management capabilities and resources, which are an integral part of the investment management process.
Shareholder and Administrative Services. The Board considered (i) the nature, extent, quality, and cost of advisory, administrative, and shareholder services performed by the Investment Advisers and their affiliates under the Advisory Contracts and under separate agreements covering transfer agency, pricing and bookkeeping, and securities lending services for the fund; (ii) the nature and extent of the supervision of third party service providers, principally custodians and subcustodians; and (iii) the resources devoted to, and the record of compliance with, the fund's compliance policies and procedures. The Board also reviewed the allocation of fund brokerage, including allocations to brokers affiliated with the Investment Advisers, the use of brokerage commissions to pay fund expenses, and the use of "soft" commission dollars to pay for research services.
Annual Report
The Board noted that the growth of fund assets over time across the complex allows Fidelity to reinvest in the development of services designed to enhance the value or convenience of the Fidelity funds as investment vehicles. These services include 24-hour access to account information and market information through telephone representatives and over the Internet, investor education materials and asset allocation tools, and the expanded availability of Fidelity Investor Centers.
Investment in a Large Fund Family. The Board considered the benefits to shareholders of investing in a Fidelity fund, including the benefits of investing in a fund that is part of a large family of funds offering a variety of investment disciplines and providing a large variety of mutual fund investor services. The Board noted that Fidelity had taken, or had made recommendations that resulted in the Fidelity funds taking, a number of actions over the previous year that benefited particular funds, including (i) continuing to dedicate additional resources to investment research and support of the senior management team that oversees asset management; (ii) persisting in efforts to enhance Fidelity's research capabilities, in particular, international research; (iii) launching new funds and making other enhancements to meet client needs for global and income-oriented solutions; (iv) continuing to launch dedicated lower cost underlying funds to meet investment management's portfolio construction needs related to expanding underlying fund options, specifically for the Freedom Fund product lines; (v) adopting a "Stock Selector" sector neutral investment approach and employing a team of portfolio managers who are sector specialists to manage certain funds; (vi) rationalizing product lines and gaining increased efficiencies through the mergers of several funds into other funds; (vii) strengthening the Spartan Index Fund product line by adding new funds and/or new low-cost institutional share classes, restructuring fund expenses to accommodate new classes, and reducing investment minimums for certain classes of shares; (viii) modifying the eligibility criteria for Institutional Class shares to increase their appeal to government entities and charitable investors; and (ix) reducing certain transfer agent fee rates.
Investment Performance. The Board considered whether the fund has operated in accordance with its investment objective, as well as its record of compliance with its investment restrictions. It also reviewed the fund's absolute investment performance for each class, as well as the fund's relative investment performance for each class measured over multiple periods against (i) a broad-based securities market index, and (ii) a peer group of mutual funds deemed appropriate by Fidelity and reviewed by the Board. The following charts considered by the Board show, over the one-, three-, and five-year periods ended December 31, 2011, the cumulative total returns of Institutional Class (Class I) and Class C of the fund, the cumulative total returns of a broad-based securities market index ("benchmark"), and a range of cumulative total returns of a peer group of mutual funds identified by Lipper Inc. as having an investment objective similar to that of the fund. The returns of Institutional Class (Class I) and Class C show the performance of the highest and lowest performing classes, respectively (based on five-year performance). The box within each chart shows the 25th percentile return (top of box) and the 75th percentile return (bottom of box) of the peer group. Returns shown above the box are in the first quartile and returns shown below the box are in the fourth quartile. The percentage beaten numbers noted below each chart correspond to the percentile box and represent the percentage of funds in the peer group whose performance was equal to or lower than that of the class indicated.
Annual Report
Board Approval of Investment Advisory Contracts and
Management Fees - continued
Fidelity International Small Cap Opportunities Fund

The Board reviewed the fund's relative investment performance against its peer group and noted that the performance of Institutional Class (Class I) of the fund was in the first quartile for the one- and three-year periods and the fourth quartile for the five-year period. The Board also noted that the investment performance of Institutional Class (Class I) the fund compared favorably to its benchmark for the one- and three-year periods, although the fund's five-year cumulative total return was lower than its benchmark. The Board considered that the variations in performance among the fund's classes reflect the variations in class expenses, which result in lower performance for higher expense classes. The Board also reviewed the fund's performance since inception as well as performance in the current year.
The Board also considered that the fund's management fee is subject to upward or downward adjustment depending upon whether, and to what extent, the fund's investment performance for the performance period exceeds, or is exceeded by, the record (over the same period) of a Board-approved performance adjustment index. The Board noted that the performance adjustment provides FMR with a strong economic incentive to seek to achieve superior performance for the fund's shareholders and helps to more closely align the interests of FMR and the fund's shareholders.
Annual Report
Based on its review, the Board concluded that the nature, extent, and quality of services provided to the fund under the Advisory Contracts should benefit the fund's shareholders.
Competitiveness of Management Fee and Total Expense Ratio. The Board considered the fund's management fee and total expense ratio compared to "mapped groups" of competitive funds and classes. Fidelity creates "mapped groups" by combining similar Lipper investment objective categories that have comparable management fee characteristics. Combining Lipper investment objective categories aids the Board's management fee and total expense ratio comparisons by broadening the competitive group used for comparison and by reducing the number of universes to which various Fidelity funds are compared.
Management Fee. The Board considered two proprietary management fee comparisons for the 12-month periods shown in the chart below. The group of Lipper funds used by the Board for management fee comparisons is referred to below as the "Total Mapped Group." The Total Mapped Group is broader than the Lipper peer group used by the Board for performance comparisons because the Total Mapped Group combines several Lipper investment objective categories while the Lipper peer group does not. The Total Mapped Group comparison focuses on a fund's standing relative to the total universe of comparable funds available to investors in terms of gross management fees before expense reimbursements or caps, and without giving effect to the fund's performance adjustment. "TMG %" represents the percentage of funds in the Total Mapped Group that had management fees that were lower than the fund's. For example, a TMG % of 19% means that 81% of the funds in the Total Mapped Group had higher management fees than the fund. The "Asset-Size Peer Group" (ASPG) comparison focuses on a fund's standing relative to non-Fidelity funds similar in size to the fund within the Total Mapped Group. The ASPG represents at least 15% of the funds in the Total Mapped Group with comparable asset size and management fee characteristics, subject to a minimum of 50 funds (or all funds in the Total Mapped Group if fewer than 50). Additional information, such as the ASPG quartile in which the fund's management fee ranked and the impact of the fund's performance adjustment, is also included in the chart and considered by the Board.
Annual Report
Board Approval of Investment Advisory Contracts and
Management Fees - continued
Fidelity International Small Cap Opportunities Fund

The Board noted that the fund's management fee ranked below the median of its Total Mapped Group and below the median of its ASPG for 2011. The Board also noted the effect of the fund's negative performance adjustment on the fund's management fee ranking. The Board noted that the performance adjustment for each year represents calculations for performance periods that differ from the periods shown in the performance charts above.
Based on its review, the Board concluded that the fund's management fee is fair and reasonable in light of the services that the fund receives and the other factors considered.
Total Expense Ratio. In its review of each class's total expense ratio, the Board considered the fund's management fee as well as other fund or class expenses, as applicable, such as transfer agent fees, pricing and bookkeeping fees, fund-paid 12b-1 fees, and custodial, legal, and audit fees. The Board also noted the effects of any waivers and reimbursements on fees and expenses, as well as the impact of the fund's performance adjustment. As part of its review, the Board also considered the current and historical total expense ratios of each class of the fund compared to competitive fund median expenses. Each class of the fund is compared to those funds and classes in the Total Mapped Group (used by the Board for management fee comparisons) that have a similar sales load structure.
The Board noted that the total expense ratio of each class ranked below its competitive median for 2011.
Annual Report
Fees Charged to Other Fidelity Clients. The Board also considered Fidelity fee structures and other information with respect to clients of FMR and its affiliates, such as other mutual funds advised or subadvised by FMR or its affiliates, pension plan clients, and other institutional clients. The Board noted the findings of the 2010 ad hoc joint committee (created with the board of other Fidelity funds), which reviewed and compared Fidelity's institutional investment advisory business with its business of providing services to the Fidelity funds, including the differences in services provided, fees charged, and costs incurred, as well as competition in their respective marketplaces.
Based on its review of total expense ratios and fees charged to other Fidelity clients, the Board concluded that the total expense ratio of each class of the fund was reasonable in light of the services that the fund and its shareholders receive and the other factors considered.
Costs of the Services and Profitability. The Board considered the revenues earned and the expenses incurred by Fidelity in conducting the business of developing, marketing, distributing, managing, administering and servicing the fund and its shareholders. The Board also considered the level of Fidelity's profits in respect of all the Fidelity funds.
On an annual basis, FMR presents to the Board Fidelity's profitability for the fund. Fidelity calculates the profitability for each fund, as well as aggregate profitability for groups of Fidelity funds and all Fidelity funds, using a series of detailed revenue and cost allocation methodologies which originate with the books and records of Fidelity on which Fidelity's audited financial statements are based. The Audit Committee of the Board reviews any significant changes from the prior year's methodologies.
PricewaterhouseCoopers LLP (PwC), independent registered public accounting firm and auditor to Fidelity and certain Fidelity funds, has been engaged annually by the Board as part of the Board's assessment of Fidelity's profitability analysis. PwC's engagement includes the review and assessment of Fidelity's methodologies used in determining the revenues and expenses attributable to Fidelity's mutual fund business, and completion of agreed-upon procedures surrounding the mathematical accuracy of fund profitability and its conformity to allocation methodologies. After considering PwC's reports issued under the engagement and information provided by Fidelity, the Board concluded that while other allocation methods may also be reasonable, Fidelity's profitability methodologies are reasonable in all material respects.
The Board also reviewed Fidelity's non-fund businesses and fall-out benefits related to the mutual fund business as well as cases where Fidelity's affiliates may benefit from or be related to the fund's business.
Annual Report
Board Approval of Investment Advisory Contracts and
Management Fees - continued
The Board considered the costs of the services provided by and the profits realized by Fidelity in connection with the operation of the fund and was satisfied that the profitability was not excessive in the circumstances.
Economies of Scale. The Board considered whether there have been economies of scale in respect of the management of the Fidelity funds, whether the Fidelity funds (including the fund) have appropriately benefited from any such economies of scale, and whether there is potential for realization of any further economies of scale. The Board considered the extent to which the fund will benefit from economies of scale through increased services to the fund, through waivers or reimbursements, or through fee or expense reductions. The Board also noted that in 2009, it and the board of other Fidelity funds created an ad hoc committee (the Economies of Scale Committee) to analyze whether FMR attains economies of scale in respect of the management and servicing of the Fidelity funds, whether the Fidelity funds have appropriately benefited from such economies of scale, and whether there is potential for realization of any further economies of scale.
The Board recognized that the fund's management contract incorporates a "group fee" structure, which provides for lower group fee rates as total fund assets under FMR's management increase, and for higher group fee rates as total fund assets under FMR's management decrease. FMR calculates the group fee rates based on a tiered asset "breakpoint" schedule that varies based on asset class. The Board considered that the group fee is designed to deliver the benefits of economies of scale to fund shareholders when total Fidelity fund assets increase, even if assets of any particular fund are unchanged or have declined, because some portion of Fidelity's costs are attributable to services provided to all Fidelity funds, and all funds benefit if those costs can be allocated among more assets. The Board concluded that, given the group fee structure, fund shareholders will benefit from lower management fees as assets under FMR's management increase at the fund complex level, regardless of whether Fidelity achieves any such economies of scale.
The Board concluded, taking into account the analysis of the Economies of Scale Committee, that economies of scale, if any, are being appropriately shared between fund shareholders and Fidelity.
Additional Information Requested by the Board. In order to develop fully the factual basis for consideration of the Fidelity funds' Advisory Contracts, the Board requested and received additional information on certain topics, including (i) fund performance trends, actions to be taken by FMR to improve certain funds' overall performance, and Fidelity's long-term strategies for certain funds; (ii) the potential to further rationalize the Fidelity fund lineup with the possibility of achieving savings for the funds and Fidelity; (iii) Fidelity's compensation structure for portfolio managers and other key investment personnel; (iv) the amount of the investment that each portfolio manager has made in the Fidelity fund(s) that he or she manages; (v) the realization of fall-out benefits in certain Fidelity business units; (vi) Fidelity's group fee structures, the potential impact of regulatory changes on such structures, and the rationale for the individual fee rates of certain funds; (vii) fund profitability methodology, including Fidelity's cost allocation methodology, and the impact of certain factors on fund profitability results; (viii) trends regarding industry use of performance fee structures and the possibility of implementing performance fee structures for additional funds; and (ix) the impact of net redemptions from the Fidelity funds.
Annual Report
Based on its evaluation of all of the conclusions noted above, and after considering all factors it believed relevant, the Board ultimately concluded that the advisory fee structures are fair and reasonable, and that the fund's Advisory Contracts should be renewed.
Annual Report
Investment Adviser
Fidelity Management & Research Company
Boston, MA
Investment Sub-Advisers
FMR Co., Inc.
Fidelity Management & Research
(U.K.) Inc.
Fidelity Management & Research
(Hong Kong) Limited
Fidelity Management & Research
(Japan) Inc.
FIL Investment Advisors
FIL Investments (Japan) Limited
FIL Investment Advisors (U.K.) Limited
General Distributor
Fidelity Distributors Corporation
Smithfield, RI
Transfer and Service Agents
Fidelity Investments Institutional
Operations Company, Inc.
Boston, MA
Fidelity Service Company, Inc.
Boston, MA
Custodian
The Northern Trust Company
Chicago, IL
(Fidelity Investment logo)(registered trademark)
AILSI-UANN-1212
1.815081.107
(Fidelity Investment logo)(registered trademark)
Fidelity Advisor®
International Small Cap
Fund - Class A, Class T, Class B
and Class C
Annual Report
October 31, 2012
(Fidelity Cover Art)
Class A, Class T, Class B, and
Class C are classes of Fidelity®
International Small Cap Fund
Contents
Performance | 4 | How the fund has done over time. |
Management's Discussion of Fund Performance | 6 | The Portfolio Managers' review of fund performance and strategy. |
Shareholder Expense Example | 7 | An example of shareholder expenses. |
Investment Changes | 9 | A summary of major shifts in the fund's investments over the past six months. |
Investments | 11 | A complete list of the fund's investments with their market values. |
Financial Statements | 26 | Statements of assets and liabilities, operations, and changes in net assets, as well as financial highlights. |
Notes | 36 | Notes to financial statements. |
Report of Independent Registered Public Accounting Firm | 49 | |
Trustees and Officers | 50 | |
Distributions | 62 | |
Board Approval of Investment Advisory Contracts and Management Fees | 63 | |
To view a fund's proxy voting guidelines and proxy voting record for the 12-month period ended June 30, visit http://www.fidelity.com/proxyvotingresults or visit the Securities and Exchange Commission's (SEC) web site at http://www.sec.gov. You may also call 1-877-208-0098 to request a free copy of the proxy voting guidelines.
Standard & Poor's, S&P and S&P 500 are registered service marks of The McGraw-Hill Companies, Inc. and have been licensed for use by Fidelity Distributors Corporation.
Other third party marks appearing herein are the property of their respective owners.
All other marks appearing herein are registered or unregistered trademarks or service marks of FMR LLC or an affiliated company. © 2012 FMR LLC. All rights reserved.
Annual Report
This report and the financial statements contained herein are submitted for the general information of the shareholders of the fund. This report is not authorized for distribution to prospective investors in the fund unless preceded or accompanied by an effective prospectus.
A fund files its complete schedule of portfolio holdings with the SEC for the first and third quarters of each fiscal year on Form N-Q. Forms N-Q are available on the SEC's web site at http://www.sec.gov. A fund's Forms N-Q may be reviewed and copied at the SEC's Public Reference Room in Washington, DC. Information regarding the operation of the SEC's Public Reference Room may be obtained by calling 1-800-SEC-0330. For a complete list of a fund's portfolio holdings, view the most recent holdings listing, semiannual report, or annual report on Fidelity's web site at http://www.fidelity.com, http://www.advisor.fidelity.com, or http://www.401k.com, as applicable.
NOT FDIC INSURED • MAY LOSE VALUE • NO BANK GUARANTEE
Neither the fund nor Fidelity Distributors Corporation is a bank.
Annual Report
Performance: The Bottom Line
Average annual total return reflects the change in the value of an investment, assuming reinvestment of the class' distributions from dividend income and capital gains (the profits earned upon the sale of securities that have grown in value, if any) and assuming a constant rate of performance each year. The $10,000 table and the fund's returns do not reflect the deduction of taxes that a shareholder would pay on fund distributions or the redemption of fund shares. During periods of reimbursement by Fidelity, a fund's total return will be greater than it would be had the reimbursement not occurred. How a fund did yesterday is no guarantee of how it will do tomorrow.
Average Annual Total Returns
Periods ended October 31, 2012 | Past 1
year | Past 5
years | Past 10
years |
Class A (incl. 5.75% sales charge) A | 0.16% | -4.69% | 13.69% |
Class T (incl. 3.50% sales charge) B | 2.26% | -4.48% | 13.69% |
Class B (incl. contingent deferred sales charge) C | 0.45% | -4.57% | 13.72% |
Class C (incl. contingent deferred sales charge) D | 4.46% | -4.26% | 13.57% |
A Class A shares bear a 0.25% 12b-1 fee. The initial offering of Class A shares took place on May 27, 2003. Returns prior to May 27, 2003 are those of Fidelity® International Small Cap Fund, the original class of the fund, which has no 12b-1 fee. Had Class A shares' 12b-1 fee been reflected, returns prior to May 27, 2003 would have been lower.
B Class T shares bear a 0.50% 12b-1 fee. The initial offering of Class T shares took place on May 27, 2003. Returns prior to May 27, 2003 are those of Fidelity® International Small Cap Fund, the original class of the fund, which has no 12b-1 fee. Had Class T shares' 12b-1 fee been reflected, returns prior to May 27, 2003 would have been lower.
C Class B shares bear a 1.00% 12b-1 fee. The initial offering of Class B shares took place on May 27, 2003. Returns prior to May 27, 2003 are those of Fidelity International Small Cap Fund, the original class of the fund, which has no 12b-1 fee. Had Class B shares' 12b-1 fee been reflected, returns prior to May 27, 2003 would have been lower. Class B shares' contingent deferred sales charge included in the past one year, past five years, and past ten years total return figures are 5%, 2%, and 0%, respectively.
D Class C shares bear a 1.00% 12b-1 fee. The initial offering of Class C shares took place on May 27, 2003. Returns prior to May 27, 2003 are those of Fidelity International Small Cap Fund, the original class of the fund, which has no 12b-1 fee. Had Class C shares' 12b-1 fee been reflected, returns prior to May 27, 2003 would have been lower. Class C shares' contingent deferred sales charge included in the past one year, past five years, and past ten years total return figures are 1%, 0%, and 0%, respectively.
Annual Report
$10,000 Over 10 Years
Let's say hypothetically that $10,000 was invested in Fidelity Advisor® International Small Cap Fund - Class A on October 31, 2002, and the current 5.75% sales charge was paid. The chart shows how the value of your investment would have changed, and also shows how the MSCI® EAFE® Small Cap Index performed over the same period. The initial offering of Class A took place on May 27, 2003. See the previous page for additional information regarding the performance of Class A.
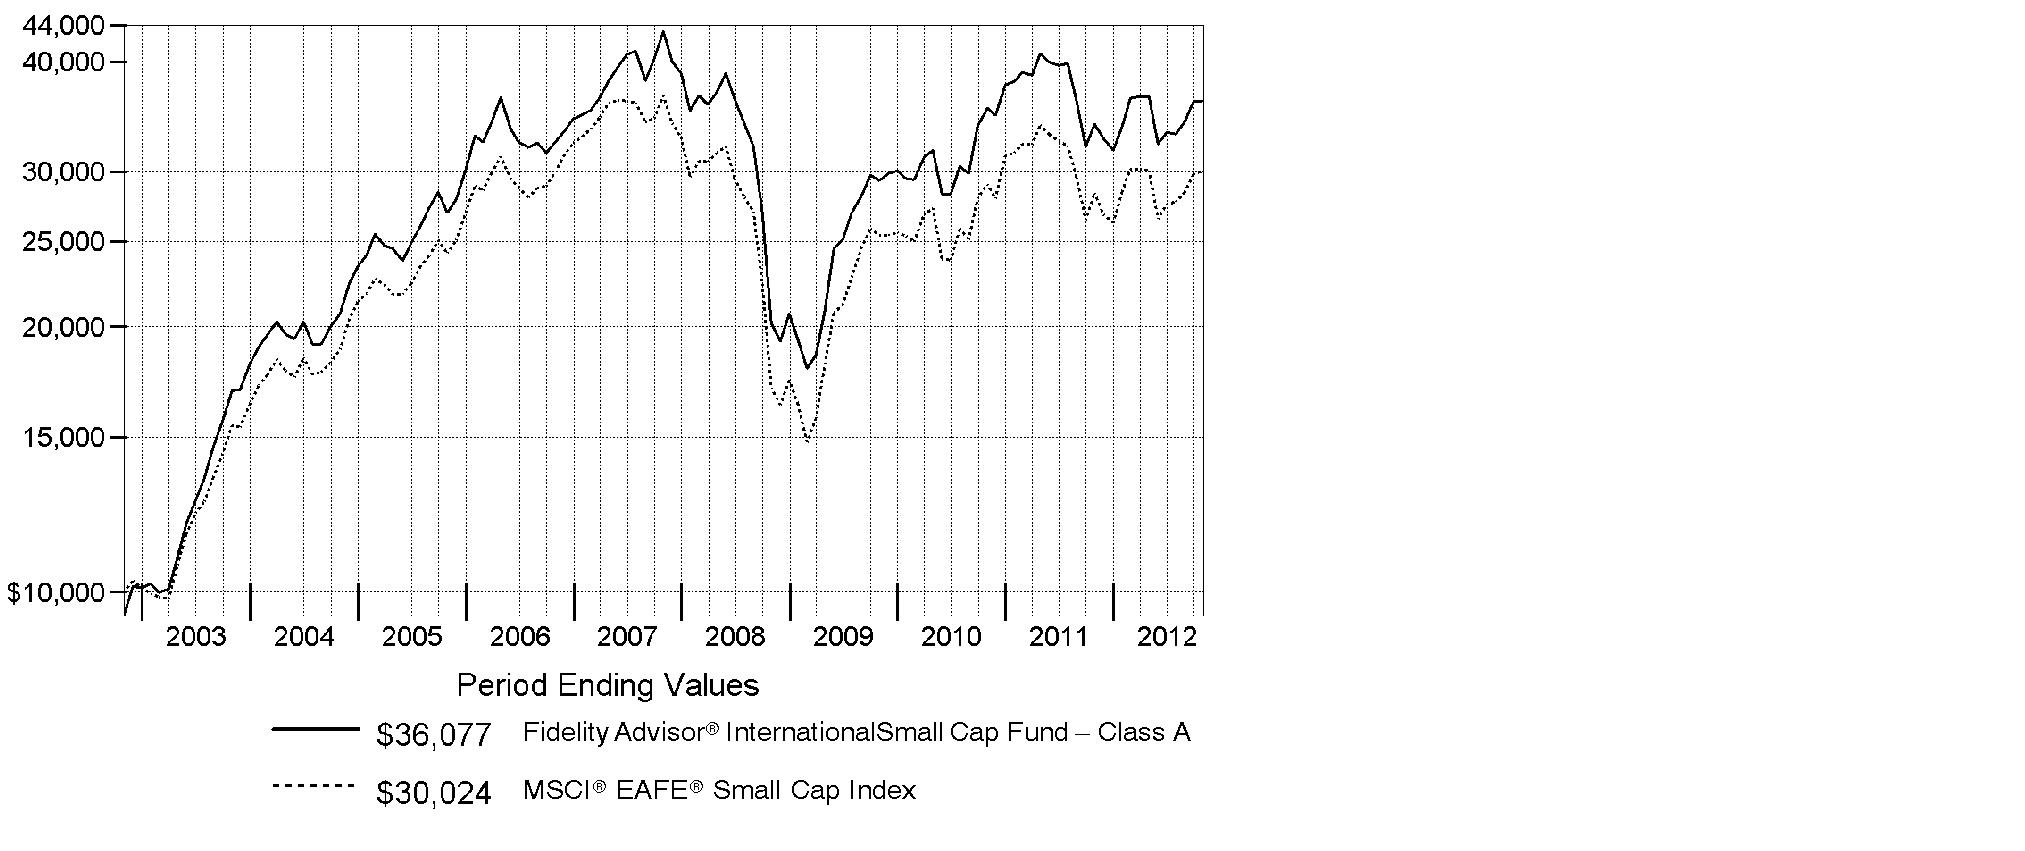
Annual Report
Management's Discussion of Fund Performance
Market Recap: International stocks experienced pendulum-like swings during the 12 months ending October 31, 2012, finishing the period with a modest advance. The market faced periodic bouts of volatility this past year, as a number of macroeconomic concerns - including the eurozone debt crisis, the strength and pace of the U.S. economic recovery, and a slowdown in China's once-blistering growth - dominated headlines and weighed on investors. While a stronger U.S. dollar provided an additional head wind, foreign developed- and emerging-markets stocks still managed a gain for the 12 months, as the MSCI® ACWI® (All Country World Index) ex USA Index rose 4.11%, largely buttressed in the summertime by pledges of accommodative monetary action from eurozone officials, as well as signs that the U.S. housing market was on the mend. Within the index, Asia-Pacific ex Japan showed the most impressive gains, advancing roughly 11%. A number of core European components, most notably Germany (+11%), Switzerland (+10%) and the U.K. (+9%), benefited from optimism about the eurozone's ability to resolve its debt woes, which also helped the region outpace the index overall. Elsewhere, results from Canada (+3%) and the generally more volatile emerging markets (+2%) each fell short of MSCI index, while Japan was among the few benchmark constituents to finish in the red, returning about -3%.
Comments from Colin Stone, Dale Nicholls and Nicholas Price, Co-Portfolio Managers of Fidelity Advisor® International Small Cap Fund: For the year, the fund's Class A, Class T, Class B and Class C shares returned 6.28%, 5.97%, 5.45% and 5.46%, respectively (excluding sales charges), about in line with the 5.99% gain of the MSCI® EAFE® Small Cap Index. Stock selection in the Netherlands and France aided relative performance, while our choices in the U.K., Australia and Singapore hampered results. The Europe/Middle East/Africa subportfolio handily outperformed its benchmark's low double-digit gain. One key contributor was crude oil exploration and production holding Amerisur Resources, while performance was hampered by London Mining, an iron ore and coal developer. The Asia-Pacific ex Japan subportfolio fell short of its benchmark's modest gain. An out-of-benchmark stake in Singapore-based consumer electronics retailer Pertama Holdings, the subportfolio's largest position during the period, detracted. Performance was aided by Toyo-Thai, a Thailand-based construction and engineering firm. The Japanese subportfolio outpaced its benchmark, which declined slightly. A sizable overweighting in Pigeon, a leading producer and retailer of infant products, helped, while a large non-benchmark stake in online social gaming company GREE fared poorly.
The views expressed above reflect those of the portfolio manager(s) only through the end of the period as stated on the cover of this report and do not necessarily represent the views of Fidelity or any other person in the Fidelity organization. Any such views are subject to change at any time based upon market or other conditions and Fidelity disclaims any responsibility to update such views. These views may not be relied on as investment advice and, because investment decisions for a Fidelity fund are based on numerous factors, may not be relied on as an indication of trading intent on behalf of any Fidelity fund.
Annual Report
Shareholder Expense Example
As a shareholder of the Fund, you incur two types of costs: (1) transaction costs, including sales charges (loads) on purchase payments or redemption proceeds, redemption fees and (2) ongoing costs, including management fees, distribution and/or service (12b-1) fees and other Fund expenses. This Example is intended to help you understand your ongoing costs (in dollars) of investing in the Fund and to compare these costs with the ongoing costs of investing in other mutual funds.
The Example is based on an investment of $1,000 invested at the beginning of the period and held for the entire period (May 1, 2012 to October 31, 2012).
Actual Expenses
The first line of the accompanying table for each class of the Fund provides information about actual account values and actual expenses. You may use the information in this line, together with the amount you invested, to estimate the expenses that you paid over the period. Simply divide your account value by $1,000.00 (for example, an $8,600 account value divided by $1,000.00 = 8.6), then multiply the result by the number in the first line for a class of the Fund under the heading entitled "Expenses Paid During Period" to estimate the expenses you paid on your account during this period. A small balance maintenance fee of $12.00 that is charged once a year may apply for certain accounts with a value of less than $2,000. This fee is not included in the table below. If it was, the estimate of expenses you paid during the period would be higher, and your ending account value lower, by this amount. In addition, the Fund, as a shareholder in the underlying Fidelity Central Funds, will indirectly bear its pro-rata share of the fees and expenses incurred by the underlying Fidelity Central Funds. These fees and expenses are not included in the Fund's annualized expense ratio used to calculate the expense estimate in the table below.
Hypothetical Example for Comparison Purposes
The second line of the accompanying table for each class of the Fund provides information about hypothetical account values and hypothetical expenses based on a Class' actual expense ratio and an assumed rate of return of 5% per year before expenses, which is not the Class' actual return. The hypothetical account values and expenses may not be used to estimate the actual ending account balance or expenses you paid for the period. You may use this information to compare the ongoing costs of investing in the Fund and other funds. To do so, compare this 5% hypothetical example with the 5% hypothetical examples that appear in the shareholder reports of the other funds. A small balance maintenance fee of $12.00 that is charged once a year may apply for certain accounts with a value of less than $2,000. This fee is not included in the table below. If it was, the estimate of expenses you paid during the period would be higher, and your ending account value lower, by this amount. In addition, the Fund, as a shareholder in the underlying Fidelity Central Funds, will indirectly bear its pro-rata share of the fees and expenses incurred by the underlying Fidelity Central Funds. These fees and expenses are not included in the Fund's annualized expense ratio used to calculate the expense estimate in the table below.
Please note that the expenses shown in the table are meant to highlight your ongoing costs only and do not reflect any transaction costs. Therefore, the second line of the table is useful in comparing ongoing costs only, and will not help you determine the relative total costs of owning different funds. In addition, if these transactional costs were included, your costs would have been higher.
Annual Report
| Annualized Expense Ratio | Beginning
Account Value
May 1, 2012 | Ending
Account Value
October 31, 2012 | Expenses Paid
During Period*
May 1, 2012 to October 31, 2012 |
Class A | 1.64% | | | |
Actual | | $ 1,000.00 | $ 988.50 | $ 8.20 |
HypotheticalA | | $ 1,000.00 | $ 1,016.89 | $ 8.31 |
Class T | 1.89% | | | |
Actual | | $ 1,000.00 | $ 987.40 | $ 9.44 |
HypotheticalA | | $ 1,000.00 | $ 1,015.63 | $ 9.58 |
Class B | 2.37% | | | |
Actual | | $ 1,000.00 | $ 985.10 | $ 11.83 |
HypotheticalA | | $ 1,000.00 | $ 1,013.22 | $ 11.99 |
Class C | 2.39% | | | |
Actual | | $ 1,000.00 | $ 985.10 | $ 11.93 |
HypotheticalA | | $ 1,000.00 | $ 1,013.12 | $ 12.09 |
International Small Cap | 1.37% | | | |
Actual | | $ 1,000.00 | $ 990.10 | $ 6.85 |
HypotheticalA | | $ 1,000.00 | $ 1,018.25 | $ 6.95 |
Institutional Class | 1.24% | | | |
Actual | | $ 1,000.00 | $ 990.60 | $ 6.20 |
HypotheticalA | | $ 1,000.00 | $ 1,018.90 | $ 6.29 |
A 5% return per year before expenses
* Expenses are equal to each Class' annualized expense ratio, multiplied by the average account value over the period, multiplied by 184/366 (to reflect the one-half year period).
Annual Report
Investment Changes (Unaudited)
Geographic Diversification (% of fund's net assets) |
As of October 31, 2012 |
 | Japan 26.4% | |
 | United Kingdom 20.6% | |
 | Germany 7.6% | |
 | Australia 6.0% | |
 | France 4.2% | |
 | United States of America 3.8% | |
 | Cayman Islands 3.4% | |
 | Singapore 2.9% | |
 | Ireland 2.6% | |
| Other 22.5% | |

Percentages are based on country or territory of incorporation and are adjusted for the effect of futures contracts, if applicable. |
As of April 30, 2012 |
| Japan 27.2% | |
| United Kingdom 19.8% | |
| Germany 9.0% | |
| Australia 6.1% | |
| France 4.4% | |
| United States of America 3.2% | |
| Cayman Islands 3.2% | |
| Ireland 2.9% | |
| Bermuda 2.8% | |
| Other 21.4% | |

Percentages are based on country or territory of incorporation and are adjusted for the effect of futures contracts, if applicable. |
Asset Allocation |
| % of fund's
net assets | % of fund's net assets
6 months ago |
Stocks and Equity Futures | 96.2 | 97.4 |
Bonds | 0.2 | 0.1 |
Short-Term Investments and Net Other Assets (Liabilities) | 3.6 | 2.5 |
Top Ten Stocks as of October 31, 2012 |
| % of fund's
net assets | % of fund's net assets
6 months ago |
Nintendo Co. Ltd. (Japan, Software) | 2.2 | 1.8 |
ORIX Corp. (Japan, Diversified Financial Services) | 1.8 | 2.0 |
Pigeon Corp. (Japan, Household Products) | 1.8 | 1.3 |
Kakaku.com, Inc. (Japan, Internet Software & Services) | 1.6 | 1.4 |
Eurofins Scientific SA (France, Life Sciences Tools & Services) | 1.3 | 0.8 |
Pertama Holdings Ltd. (Singapore, Specialty Retail) | 1.3 | 1.1 |
AZ Electronic Materials SA (Luxembourg, Chemicals) | 1.1 | 0.9 |
Kubota Corp. (Japan, Machinery) | 1.1 | 1.0 |
IBS Group Holding Ltd. GDR (Reg. S) (Isle of Man, IT Services) | 1.0 | 1.0 |
Playtech Ltd. (Isle of Man, Software) | 1.0 | 0.8 |
| 14.2 | |
Market Sectors as of October 31, 2012 |
| % of fund's
net assets | % of fund's net assets
6 months ago |
Consumer Discretionary | 19.5 | 19.0 |
Information Technology | 19.5 | 17.8 |
Industrials | 13.4 | 14.8 |
Financials | 11.9 | 11.3 |
Materials | 10.3 | 13.2 |
Health Care | 9.7 | 9.3 |
Energy | 7.3 | 7.9 |
Consumer Staples | 3.9 | 2.2 |
Telecommunication Services | 0.6 | 1.1 |
Utilities | 0.3 | 0.3 |
Annual Report
Investments October 31, 2012
Showing Percentage of Net Assets
Common Stocks - 96.2% |
| Shares | | Value |
Australia - 6.0% |
Acrux Ltd. | 381,062 | | $ 1,281,619 |
Alkane Resources Ltd. | 823,400 | | 726,521 |
Ausgold Ltd. (a) | 1,195,693 | | 198,590 |
Austal Ltd. | 508,767 | | 646,954 |
Beach Energy Ltd. | 1,188,831 | | 1,703,011 |
Berkeley Resources Ltd. (a) | 739,724 | | 360,899 |
Carsales.com Ltd. (d) | 338,881 | | 2,624,245 |
Challenger Ltd. | 360,905 | | 1,210,079 |
Clinuvel Pharmaceuticals Ltd. (a) | 143,106 | | 240,653 |
Dart Energy Ltd. (a) | 2,059,222 | | 363,388 |
Goodman Group unit | 253,653 | | 1,166,439 |
Iluka Resources Ltd. | 80,327 | | 827,164 |
Independence Group NL | 189,529 | | 784,995 |
iProperty Group Ltd. (a) | 322,458 | | 307,949 |
Karoon Gas Australia Ltd. (a) | 467,228 | | 2,706,334 |
Linc Energy Ltd. (a)(d) | 508,182 | | 290,135 |
Maverick Drilling & Exploration Ltd. (a)(d) | 781,710 | | 839,855 |
Medusa Mining Ltd. | 198,265 | | 1,255,435 |
Mesoblast Ltd. (a)(d) | 175,066 | | 1,048,566 |
Mineral Deposits Ltd. (a) | 856,877 | | 4,358,458 |
Monto Minerals Ltd. (a) | 273,551 | | 1,988 |
Navitas Ltd. | 286,457 | | 1,225,110 |
New Standard Energy Ltd. (a) | 816,242 | | 266,900 |
Panaust Ltd. | 388,877 | | 1,344,234 |
Papillon Resources Ltd. (a)(d) | 197,313 | | 377,894 |
Ramsay Health Care Ltd. | 18,317 | | 451,772 |
realestate.com.au Ltd. | 61,870 | | 1,107,867 |
SAI Global Ltd. | 316,231 | | 1,332,750 |
SEEK Ltd. | 522,733 | | 3,630,148 |
Silver Lake Resources Ltd. (a)(d) | 211,056 | | 768,994 |
Sino Gas & Energy Ltd. (a) | 8,152,205 | | 634,680 |
SomnoMed Ltd. (a) | 531,849 | | 455,471 |
Spark Infrastructure Group unit | 1,255,671 | | 2,202,829 |
Starpharma Holdings Ltd. (a) | 795,432 | | 1,341,760 |
Sydney Airport unit | 156,262 | | 549,884 |
Tiger Resources Ltd. (a) | 11,335,520 | | 3,647,719 |
Tissue Therapies Ltd. (a) | 819,448 | | 314,732 |
Troy Resources NL | 258,575 | | 1,186,389 |
Universal Biosensors, Inc. (a) | 343,694 | | 328,230 |
TOTAL AUSTRALIA | | 44,110,640 |
Common Stocks - continued |
| Shares | | Value |
Bailiwick of Jersey - 1.1% |
Informa PLC | 854,423 | | $ 5,518,058 |
LXB Retail Properties PLC (a) | 1,387,800 | | 2,575,497 |
TOTAL BAILIWICK OF JERSEY | | 8,093,555 |
Belgium - 0.7% |
EVS Broadcast Equipment SA | 92,900 | | 5,383,636 |
Bermuda - 2.2% |
Asia Satellite Telecommunications Holdings Ltd. | 271,000 | | 863,698 |
Biosensors International Group Ltd. (a) | 1,422,000 | | 1,264,855 |
China Animal Healthcare Ltd. | 2,129,000 | | 453,796 |
China Singyes Solar Tech Holdings Ltd. | 981,600 | | 581,357 |
I.T Ltd. | 1,552,000 | | 616,791 |
Imagi International Holdings Ltd. (a) | 26,792,000 | | 383,728 |
Luk Fook Holdings International Ltd. | 612,000 | | 1,538,282 |
Oakley Capital Investments Ltd. (a) | 1,518,300 | | 3,319,962 |
PAX Global Technology Ltd. (a) | 1,769,000 | | 314,994 |
Petra Diamonds Ltd. (a) | 1,478,632 | | 2,374,212 |
REXLot Holdings Ltd. | 11,800,000 | | 852,640 |
Vostok Nafta Investment Ltd. SDR | 818,000 | | 2,022,524 |
Vtech Holdings Ltd. | 126,000 | | 1,496,545 |
TOTAL BERMUDA | | 16,083,384 |
Brazil - 0.6% |
Alpargatas SA (PN) | 553,200 | | 4,189,073 |
British Virgin Islands - 0.0% |
Kalahari Energy (a)(f) | 1,451,000 | | 15 |
Canada - 1.4% |
AirSea Lines (a)(f) | 1,893,338 | | 25 |
Banro Corp. (a) | 976,700 | | 4,518,001 |
Mood Media Corp. (a) | 175,300 | | 410,715 |
Mood Media Corp. (United Kingdom) (a) | 1,139,822 | | 2,667,112 |
Rock Well Petroleum, Inc. (a)(f) | 770,400 | | 8 |
Teranga Gold Corp. (a) | 1,272,499 | | 2,726,556 |
TOTAL CANADA | | 10,322,417 |
Cayman Islands - 3.4% |
21Vianet Group, Inc. ADR (a) | 42,300 | | 468,684 |
3SBio, Inc. sponsored ADR (a) | 39,000 | | 522,990 |
51job, Inc. sponsored ADR (a) | 19,200 | | 902,976 |
AirMedia Group, Inc. ADR (a) | 272,500 | | 618,575 |
Airtac International Group | 106,000 | | 497,159 |
AMVIG Holdings Ltd. | 764,000 | | 226,734 |
Common Stocks - continued |
| Shares | | Value |
Cayman Islands - continued |
AutoNavi Holdings Ltd. ADR (a) | 34,300 | | $ 368,039 |
Baidu.com, Inc. sponsored ADR (a) | 6,000 | | 639,720 |
Bitauto Holdings Ltd. ADR (a) | 82,500 | | 415,800 |
Changshouhua Food Co. Ltd. | 872,000 | | 450,062 |
China Automation Group Ltd. | 1,872,000 | | 444,446 |
China High Precision Automation Group Ltd. | 712,000 | | 102,527 |
China Lodging Group Ltd. ADR (a)(d) | 26,500 | | 451,030 |
China Medical System Holdings Ltd. | 1,255,000 | | 723,847 |
China Metal International Holdings, Inc. | 2,522,000 | | 439,313 |
China Metal Recycling (Holdings) Ltd. | 436,800 | | 436,797 |
China Outfitters Holdings Ltd. | 1,888,000 | | 321,567 |
China Tianyi Holdings Ltd. (a) | 2,492,000 | | 360,132 |
China ZhengTong Auto Services Holdings Ltd. (a) | 472,000 | | 319,740 |
CNinsure, Inc. ADR (a) | 31,900 | | 187,572 |
Convenience Retail Asia Ltd. | 700,000 | | 437,158 |
EVA Precision Industrial Holdings Ltd. | 9,338,000 | | 988,014 |
Fook Woo Group Holdings Ltd. (a) | 2,055,000 | | 181,634 |
Greatview Aseptic Pack Co. Ltd. | 1,196,000 | | 626,546 |
Haitian International Holdings Ltd. | 338,000 | | 417,373 |
Hop Hing Group Holdings Ltd. (a) | 7,392,000 | | 362,444 |
Hutchison China Meditech Ltd. (a) | 77,117 | | 555,658 |
Kingdee International Software Group Co. Ltd. (a) | 1,178,400 | | 244,802 |
KongZhong Corp. sponsored ADR (a) | 56,200 | | 331,018 |
Lee's Pharmaceutical Holdings Ltd. | 1,085,000 | | 664,996 |
Marwyn Value Investors II Ltd. (a) | 1,875,100 | | 3,820,253 |
Ming Fai International Holdings Ltd. | 9,133,000 | | 824,911 |
Perfect World Co. Ltd. sponsored ADR Class B | 34,900 | | 370,987 |
Royale Furniture Holdings Ltd. | 6,740,958 | | 565,367 |
Shenguan Holdings Group Ltd. | 3,154,000 | | 1,737,741 |
SINA Corp. (a) | 5,000 | | 273,150 |
Sino Prosper State Gold Resources Holdings, Ltd. (a) | 7,495,000 | | 333,646 |
Sitoy Group Holdings Ltd. | 219,000 | | 126,878 |
SouFun Holdings Ltd. ADR (d) | 51,000 | | 921,570 |
Trauson Holdings Co. Ltd. | 1,237,000 | | 646,428 |
VanceInfo Technologies, Inc. ADR (a) | 38,100 | | 290,322 |
VisionChina Media, Inc. ADR (a)(d) | 172,100 | | 37,862 |
VST Holdings Ltd. | 1,858,000 | | 326,047 |
WuXi PharmaTech Cayman, Inc. sponsored ADR (a) | 42,300 | | 600,237 |
Yip's Chemical Holdings Ltd. | 592,000 | | 399,502 |
TOTAL CAYMAN ISLANDS | | 24,982,254 |
Common Stocks - continued |
| Shares | | Value |
China - 0.1% |
NQ Mobile, Inc. ADR (a)(d) | 33,300 | | $ 231,768 |
Travelsky Technology Ltd. (H Shares) | 877,000 | | 452,642 |
TOTAL CHINA | | 684,410 |
Cyprus - 0.6% |
Buried Hill Energy (Cyprus) PCL (a)(f) | 1,947,000 | | 4,380,750 |
France - 4.2% |
Altamir Amboise | 531,000 | | 4,762,729 |
ALTEN | 118,100 | | 3,714,373 |
Audika SA | 113,900 | | 1,353,781 |
Axway Software SA | 4,544 | | 71,089 |
Eurofins Scientific SA | 63,899 | | 9,880,747 |
Ipsos SA | 124,772 | | 4,384,317 |
Sartorius Stedim Biotech | 51,600 | | 4,662,967 |
Sopra Group SA | 39,300 | | 1,854,678 |
TOTAL FRANCE | | 30,684,681 |
Germany - 7.6% |
Bertrandt AG | 64,300 | | 5,379,755 |
Brenntag AG | 40,600 | | 5,117,128 |
CENTROTEC Sustainable AG | 231,049 | | 4,168,680 |
CTS Eventim AG | 193,820 | | 5,752,933 |
GFK AG | 142,601 | | 6,493,158 |
Lanxess AG | 70,485 | | 5,822,318 |
MTU Aero Engines Holdings AG | 67,300 | | 5,650,817 |
Rational AG | 15,520 | | 3,924,680 |
RIB Software AG | 379,800 | | 2,358,011 |
Stroer Out-of-Home Media AG (a) | 14,753 | | 130,030 |
United Internet AG | 200,152 | | 4,004,256 |
Wirecard AG | 289,100 | | 6,606,260 |
TOTAL GERMANY | | 55,408,026 |
Hong Kong - 0.8% |
Dah Sing Financial Holdings Ltd. | 164,261 | | 631,606 |
Guotai Junan International Holdings Ltd. | 1,331,000 | | 395,004 |
Magnificent Estates Ltd. | 29,588,000 | | 1,431,668 |
Singamas Container Holdings Ltd. | 3,164,000 | | 800,181 |
Techtronic Industries Co. Ltd. | 1,053,500 | | 2,006,395 |
YGM Trading Ltd. | 152,000 | | 365,190 |
TOTAL HONG KONG | | 5,630,044 |
Common Stocks - continued |
| Shares | | Value |
Iceland - 0.5% |
Ossur hf (a) | 2,571,700 | | $ 3,395,957 |
India - 1.2% |
Ahluwalia Contracts (India) Ltd. | 230,314 | | 172,077 |
Britannia Industries Ltd. (a) | 31,695 | | 284,904 |
Educomp Solutions Ltd. | 44,518 | | 121,999 |
Financial Technologies India Ltd. | 23,352 | | 431,972 |
Geodesic Ltd. | 256,340 | | 189,140 |
Manappuram General Finance & Leasing Ltd. | 367,032 | | 251,373 |
MT Educare Ltd. | 146,984 | | 285,472 |
Page Industries Ltd. | 87,661 | | 5,462,255 |
PI Industries Ltd. | 37,878 | | 351,993 |
Shriram City Union Finance Ltd. (a) | 739 | | 10,725 |
Thangamayil Jewellery Ltd. | 253,192 | | 1,178,316 |
WABCO India Ltd. | 10,191 | | 303,779 |
TOTAL INDIA | | 9,044,005 |
Indonesia - 1.0% |
PT Clipan Finance Indonesia Tbk | 13,895,400 | | 578,671 |
PT Clipan Finance Indonesia Tbk warrants 10/7/14 (a) | 2,275,700 | | 12,320 |
PT Mayora Indah Tbk | 352,000 | | 866,712 |
PT Media Nusantara Citra Tbk | 8,838,500 | | 2,599,548 |
PT Mitra Adiperkasa Tbk | 588,000 | | 400,977 |
PT MNC Sky Vision Tbk | 1,805,500 | | 408,844 |
PT Nippon Indosari Corpindo Tbk | 1,225,000 | | 765,223 |
PT Pembangunan Perumahan Persero Tbk | 4,982,500 | | 399,428 |
PT Tiga Pilar Sejahtera Food Tbk | 5,685,000 | | 532,689 |
PT Tower Bersama Infrastructure Tbk (a) | 1,383,000 | | 719,934 |
TOTAL INDONESIA | | 7,284,346 |
Ireland - 2.6% |
Glanbia PLC | 281,700 | | 2,672,718 |
Kenmare Resources PLC (a) | 11,137,400 | | 7,083,151 |
Paddy Power PLC (Ireland) | 88,784 | | 6,552,506 |
Petroceltic International PLC (a) | 22,766,000 | | 2,531,292 |
TOTAL IRELAND | | 18,839,667 |
Isle of Man - 2.4% |
Exillon Energy PLC (a) | 1,067,800 | | 2,683,825 |
IBS Group Holding Ltd. GDR (Reg. S) (a) | 336,400 | | 7,586,833 |
Playtech Ltd. | 1,083,636 | | 7,407,568 |
TOTAL ISLE OF MAN | | 17,678,226 |
Common Stocks - continued |
| Shares | | Value |
Israel - 0.1% |
Sarin Technologies Ltd. | 957,750 | | $ 773,392 |
Italy - 1.1% |
Brunello Cucinelli SpA (d) | 172,000 | | 3,043,101 |
Salvatore Ferragamo Italia SpA (d) | 244,915 | | 4,974,388 |
TOTAL ITALY | | 8,017,489 |
Japan - 26.4% |
ACOM Co. Ltd. (a) | 60,890 | | 1,797,792 |
Aeon Credit Service Co. Ltd. | 344,600 | | 7,312,444 |
Aeon Mall Co. Ltd. | 45,300 | | 1,175,201 |
Ajinomoto Co., Inc. | 125,000 | | 1,908,744 |
ARNEST ONE Corp. | 39,700 | | 589,309 |
Asahi Holdings, Inc. | 65,300 | | 1,101,012 |
ASAHI INTECC Co. Ltd. (d) | 109,500 | | 3,249,474 |
Avex Group Holdings, Inc. | 118,100 | | 2,334,483 |
CAC Corp. | 44,800 | | 377,121 |
Chiyoda Co. Ltd. | 66,700 | | 1,908,340 |
Citizen Holdings Co. Ltd. | 692,900 | | 3,515,276 |
CyberAgent, Inc. (d) | 3,280 | | 6,557,535 |
DeNA Co. Ltd. (d) | 107,500 | | 3,354,409 |
Enigmo, Inc. | 25,300 | | 2,383,264 |
Fields Corp. | 72,300 | | 1,039,714 |
Fuji Corp. | 35,700 | | 522,777 |
Fuji Spinning Co. Ltd. | 679,000 | | 2,806,840 |
GMO Internet, Inc. | 191,800 | | 1,340,654 |
GOLDWIN, Inc. (d) | 204,000 | | 1,249,605 |
GREE, Inc. (d) | 170,100 | | 2,966,043 |
Hajime Construction Co. Ltd. | 52,500 | | 1,653,326 |
Hitachi Chemical Co. Ltd. | 182,500 | | 2,571,871 |
Hitachi Metals Ltd. | 339,000 | | 3,172,153 |
Hitachi Transport System Ltd. | 97,000 | | 1,454,453 |
Honda Motor Co. Ltd. | 181,900 | | 5,468,505 |
Hoshizaki Electric Co. Ltd. | 128,800 | | 3,505,980 |
Iida Home Max Co., Ltd. | 125,000 | | 1,102,342 |
ITC Networks Corp. | 27,300 | | 218,865 |
Iwatsuka Confectionary Co. Ltd. | 11,600 | | 434,183 |
JSP Corp. | 59,400 | | 767,892 |
K'S Denki Corp. (d) | 52,300 | | 1,400,039 |
Kakaku.com, Inc. (d) | 338,200 | | 11,586,834 |
Kao Corp. | 35,000 | | 982,964 |
KAWAI Musical Instruments Manufacturing Co. Ltd. | 693,000 | | 1,449,718 |
Kitz Corp. | 44,900 | | 189,544 |
Common Stocks - continued |
| Shares | | Value |
Japan - continued |
Kobe Bussan Co. Ltd. | 7,300 | | $ 191,942 |
Koshidaka Holdings Co. Ltd. | 41,900 | | 1,149,455 |
Kubota Corp. | 761,000 | | 7,778,730 |
Makita Corp. | 92,500 | | 3,655,737 |
Maruwa Ceramic Co. Ltd. (d) | 9,900 | | 291,432 |
Megachips Corp. | 88,200 | | 1,968,839 |
Mitsubishi Gas Chemical Co., Inc. | 9,000 | | 44,419 |
Mizuho Financial Group, Inc. | 302,700 | | 473,629 |
Nichias Corp. (d) | 417,000 | | 2,042,428 |
Nikkiso Co. Ltd. | 525,000 | | 6,254,228 |
Nintendo Co. Ltd. | 127,900 | | 16,470,142 |
Nippon Seiki Co. Ltd. | 33,000 | | 317,061 |
Nitta Corp. | 153,100 | | 2,355,090 |
Nitta Gelatin, Inc. | 116,400 | | 944,848 |
NSD Co. Ltd. | 24,900 | | 238,301 |
Olympus Corp. (a)(d) | 204,500 | | 3,571,001 |
Origin Electric Co. Ltd. | 332,000 | | 1,285,081 |
ORIX Corp. | 130,390 | | 13,393,436 |
Pacific Metals Co. Ltd. | 166,000 | | 563,522 |
Pal Co. Ltd. | 35,250 | | 1,799,371 |
Pigeon Corp. | 284,300 | | 13,105,649 |
Rohto Pharmaceutical Co. Ltd. | 176,000 | | 2,429,563 |
Round One Corp. | 62,800 | | 317,815 |
Ryohin Keikaku Co. Ltd. | 5,800 | | 384,342 |
Sawada Holdings Co. Ltd. (a) | 271,700 | | 1,494,129 |
Seven & i Holdings Co., Ltd. | 6,800 | | 209,716 |
Shimadzu Corp. | 293,000 | | 1,970,951 |
SHIMANO, Inc. | 11,600 | | 730,903 |
Shin-Etsu Chemical Co., Ltd. | 3,300 | | 186,020 |
Shinko Kogyo Co. Ltd. | 239,200 | | 1,246,489 |
Shinko Shoji Co. Ltd. | 2,800 | | 24,237 |
Sosei Group Corp. (a) | 1,170 | | 3,231,680 |
Stanley Electric Co. Ltd. | 245,000 | | 3,375,924 |
STELLA CHEMIFA Corp. | 9,700 | | 182,262 |
Sugi Holdings Co. Ltd. | 600 | | 21,684 |
Sumitomo Chemical Co. Ltd. | 68,000 | | 190,805 |
Sumitomo Metal Mining Co. Ltd. | 88,000 | | 1,158,562 |
Sysmex Corp. | 500 | | 23,519 |
Taiheiyo Cement Corp. | 345,000 | | 734,686 |
Takara Leben Co. Ltd. | 445,200 | | 4,768,207 |
Toho Real Estate Co. Ltd. | 3,000 | | 16,385 |
Tokyu Land Corp. | 85,000 | | 477,014 |
Common Stocks - continued |
| Shares | | Value |
Japan - continued |
Topcon Corp. (d) | 421,500 | | $ 1,995,829 |
Toyo Engineering Corp. | 713,000 | | 2,947,388 |
Toyo Kanetsu KK | 398,000 | | 772,767 |
Tsukui Corp. | 26,500 | | 615,777 |
Uchiyama Holdings Co. Ltd. | 7,100 | | 129,851 |
Unicharm Corp. | 1,700 | | 91,995 |
WebCrew, Inc. | 90,300 | | 565,577 |
West Holdings Corp. (d) | 10,700 | | 135,911 |
Yamato Kogyo Co. Ltd. | 40,200 | | 1,128,501 |
Yamaya Corp. | 44,700 | | 641,691 |
TOTAL JAPAN | | 193,543,227 |
Korea (South) - 0.5% |
Daou Technology, Inc. | 87,960 | | 1,250,440 |
Genic Co. Ltd. (a) | 9,627 | | 523,590 |
Korea Plant Service & Engineering Co. Ltd. | 12,424 | | 683,689 |
SBS Contents Hub Co. Ltd. | 35,022 | | 525,176 |
Soulbrain Co. Ltd. | 11,656 | | 469,310 |
TOTAL KOREA (SOUTH) | | 3,452,205 |
Luxembourg - 1.1% |
AZ Electronic Materials SA | 1,467,500 | | 8,395,191 |
Malaysia - 0.1% |
JobStreet Corp. Bhd | 1,223,100 | | 915,518 |
Netherlands - 1.3% |
Gemalto NV | 81,831 | | 7,384,263 |
Ichor Coal NV (a) | 355,000 | | 1,932,560 |
TOTAL NETHERLANDS | | 9,316,823 |
Norway - 2.2% |
Aker Solutions ASA | 357,100 | | 7,015,102 |
Schibsted ASA (B Shares) | 195,600 | | 7,324,750 |
Sevan Drilling ASA (a)(d) | 2,185,100 | | 1,694,025 |
TOTAL NORWAY | | 16,033,877 |
Singapore - 2.9% |
Amtek Engineering Ltd. | 2,949,000 | | 1,450,566 |
CSE Global Ltd. | 1,069,000 | | 758,063 |
First Resources Ltd. | 71,000 | | 119,323 |
Goodpack Ltd. | 1,220,000 | | 1,940,318 |
Mapletree Industrial (REIT) | 1,424,000 | | 1,634,366 |
OSIM International Ltd. | 1,092,000 | | 1,454,747 |
Common Stocks - continued |
| Shares | | Value |
Singapore - continued |
Pertama Holdings Ltd. (e) | 23,060,000 | | $ 9,679,226 |
Petra Foods Ltd. | 370,000 | | 794,720 |
Phorm Corp. Ltd. (a) | 1,308,800 | | 1,520,695 |
Raffles Medical Group Ltd. | 368,205 | | 739,549 |
Sino Grandness Food Industry Group Ltd. (a) | 310,000 | | 121,987 |
Venture Corp. Ltd. | 212,000 | | 1,329,562 |
TOTAL SINGAPORE | | 21,543,122 |
South Africa - 0.3% |
Blue Label Telecoms Ltd. | 3,094,900 | | 2,405,774 |
Sweden - 0.9% |
Avanza Bank Holding AB | 162,600 | | 3,192,970 |
Elekta AB (B Shares) | 266,400 | | 3,795,444 |
TOTAL SWEDEN | | 6,988,414 |
Switzerland - 1.3% |
Sika AG (Bearer) | 1,610 | | 3,358,993 |
VZ Holding AG | 51,930 | | 6,189,445 |
TOTAL SWITZERLAND | | 9,548,438 |
Taiwan - 0.2% |
Pacific Hospital Supply Co. Ltd. | 114,400 | | 333,291 |
Tong Hsing Electronics Industries Ltd. | 158,721 | | 551,530 |
Topoint Technology Co. Ltd. | 571,927 | | 322,088 |
TOTAL TAIWAN | | 1,206,909 |
Thailand - 0.6% |
Toyo-Thai Corp. PCL | 5,276,700 | | 4,688,297 |
United Kingdom - 20.6% |
Aberdeen Asset Management PLC | 1,183,800 | | 6,199,109 |
Amerisur Resources PLC (a)(d) | 7,753,224 | | 5,880,530 |
Ashmore Group PLC | 897,400 | | 5,267,028 |
ASOS PLC (a)(d) | 188,176 | | 6,847,736 |
Avanti Communications Group PLC (a)(d) | 659,800 | | 2,842,889 |
Aveva Group PLC | 186,000 | | 5,973,134 |
Bond International Software PLC | 843,266 | | 700,823 |
Brammer PLC | 1,267,600 | | 4,914,529 |
Central Asia Metals PLC (a) | 1,336,700 | | 2,113,958 |
Craneware PLC | 791,600 | | 5,528,141 |
Faroe Petroleum PLC (a) | 480,947 | | 1,179,715 |
Hunting PLC | 194,900 | | 2,354,181 |
IG Group Holdings PLC | 719,702 | | 5,057,980 |
Common Stocks - continued |
| Shares | | Value |
United Kingdom - continued |
International Personal Finance PLC | 1,298,800 | | $ 7,272,907 |
John Wood Group PLC | 383,900 | | 5,262,811 |
Johnson Matthey PLC | 106,195 | | 3,854,160 |
Keronite PLC (a)(f) | 13,620,267 | | 220 |
London Mining PLC (a)(d) | 1,460,045 | | 3,593,125 |
Moneysupermarket.com Group PLC | 2,714,800 | | 5,870,551 |
Monitise PLC (a) | 11,841,415 | | 7,070,361 |
Mothercare PLC | 327,400 | | 1,466,148 |
NCC Group Ltd. | 218,315 | | 3,170,753 |
Ocado Group PLC (a)(d) | 1,088,800 | | 1,133,298 |
Ophir Energy PLC (a) | 616,500 | | 5,516,592 |
Optos PLC (a) | 478,181 | | 1,572,267 |
Pureprofile Media PLC (a)(f) | 1,108,572 | | 626,135 |
Regenersis PLC | 1,198,700 | | 2,548,575 |
Rockhopper Exploration PLC (a) | 1,054,900 | | 2,681,193 |
Salamander Energy PLC (a) | 632,400 | | 1,964,531 |
SDL PLC | 448,762 | | 3,841,826 |
Serco Group PLC | 339,746 | | 3,105,922 |
Silverdell PLC (a) | 12,644,400 | | 2,678,143 |
Sinclair Pharma PLC (a) | 4,146,298 | | 1,898,596 |
Sphere Medical Holding PLC | 817,054 | | 955,928 |
Sportingbet PLC | 5,292,800 | | 4,569,572 |
Sthree PLC | 1,031,809 | | 4,999,408 |
Synergy Health PLC | 284,953 | | 4,271,941 |
Ted Baker PLC | 462,675 | | 7,078,164 |
TMO Renewables Ltd. (a)(f) | 1,000,000 | | 403,438 |
Travis Perkins PLC | 313,000 | | 5,455,121 |
Wolfson Microelectronics PLC (a) | 939,800 | | 3,154,533 |
Zenergy Power PLC (a) | 32,776 | | 44,430 |
TOTAL UNITED KINGDOM | | 150,920,402 |
United States of America - 0.2% |
CTC Media, Inc. | 4,300 | | 36,077 |
GI Dynamics, Inc. CDI (a) | 690,238 | | 429,901 |
Mudalla Technology, Inc. (Reg. S) (a) | 996,527 | | 16 |
YOU On Demand Holdings, Inc. (a) | 86,974 | | 301,800 |
YOU On Demand Holdings, Inc. (f) | 27,500 | | 85,883 |
Common Stocks - continued |
| Shares | | Value |
United States of America - continued |
YOU On Demand Holdings, Inc. warrants 8/30/17 (a)(f) | 27,500 | | $ 2,693 |
Zhongpin, Inc. (a) | 40,200 | | 463,104 |
TOTAL UNITED STATES OF AMERICA | | 1,319,474 |
TOTAL COMMON STOCKS (Cost $657,977,485) |
705,263,638
|
Convertible Bonds - 0.2% |
| Principal Amount | | |
Canada - 0.2% |
Griffiths Energy International, Inc. 12% 9/1/17 (f)
(Cost $1,400,000) | | $ 1,400,000 | |
1,400,000
|
Money Market Funds - 9.5% |
| Shares | | |
Fidelity Cash Central Fund, 0.19% (b) | 27,463,856 | | 27,463,856 |
Fidelity Securities Lending Cash Central Fund, 0.19% (b)(c) | 42,020,618 | | 42,020,618 |
TOTAL MONEY MARKET FUNDS (Cost $69,484,474) |
69,484,474
|
TOTAL INVESTMENT PORTFOLIO - 105.9% (Cost $728,861,959) | 776,148,112 |
NET OTHER ASSETS (LIABILITIES) - (5.9)% | (42,900,112) |
NET ASSETS - 100% | $ 733,248,000 |
Legend |
(a) Non-income producing |
(b) Affiliated fund that is available only to investment companies and other accounts managed by Fidelity Investments. The rate quoted is the annualized seven-day yield of the fund at period end. A complete unaudited listing of the fund's holdings as of its most recent quarter end is available upon request. In addition, each Fidelity Central Fund's financial statements, which are not covered by the Fund's Report of Independent Registered Public Accounting Firm, are available on the SEC's website or upon request. |
(c) Investment made with cash collateral received from securities on loan. |
(d) Security or a portion of the security is on loan at period end. |
(e) Affiliated company |
(f) Restricted securities - Investment in securities not registered under the Securities Act of 1933 (excluding 144A issues). At the end of the period, the value of restricted securities (excluding 144A issues) amounted to $6,899,165 or 0.9% of net assets. |
Additional information on each restricted holding is as follows: |
Security | Acquisition Date | Acquisition Cost |
AirSea Lines | 8/4/06 | $ 1,199,182 |
Buried Hill Energy (Cyprus) PCL | 8/18/06 | $ 2,141,700 |
Griffiths Energy International, Inc. 12% 9/1/17 | 9/12/12 | $ 1,400,000 |
Kalahari Energy | 9/1/06 | $ 1,813,750 |
Keronite PLC | 8/16/06 | $ 1,548,992 |
Pureprofile Media PLC | 5/3/05 - 1/11/06 | $ 1,173,341 |
Rock Well Petroleum, Inc. | 4/13/06 | $ 1,004,171 |
TMO Renewables Ltd. | 10/27/05 | $ 535,065 |
YOU On Demand Holdings, Inc. | 8/29/12 | $ 110,000 |
YOU On Demand Holdings, Inc. warrants 8/30/17 | 9/14/12 | $ 0 |
Affiliated Central Funds |
Information regarding fiscal year to date income earned by the Fund from investments in Fidelity Central Funds is as follows: |
Fund | Income earned |
Fidelity Cash Central Fund | $ 27,191 |
Fidelity Securities Lending Cash Central Fund | 1,033,335 |
Total | $ 1,060,526 |
Other Affiliated Issuers |
An affiliated company is a company in which the Fund has ownership of at least 5% of the voting securities. Fiscal year to date transactions with companies which are or were affiliates are as follows: |
Affiliate | Value, beginning of period | Purchases | Sales Proceeds | Dividend Income | Value,
end of
period |
Pertama Holdings Ltd. | $ 11,809,703 | $ - | $ - | $ 146,001 | $ 9,679,226 |
Other Information |
Categorizations in the Schedule of Investments are based on country or territory of incorporation. |
The following is a summary of the inputs used, as of October 31, 2012, involving the Fund's assets and liabilities carried at fair value. The inputs or methodology used for valuing securities may not be an indication of the risk associated with investing in those securities. For more information on valuation inputs, and their aggregation into the levels used in the tables below, please refer to the Security Valuation section in the accompanying Notes to Financial Statements. |
Valuation Inputs at Reporting Date: |
Description | Total | Level 1 | Level 2 | Level 3 |
Investments in Securities: | | | | |
Equities: | | | | |
Consumer Discretionary | $ 143,537,049 | $ 128,300,726 | $ 5,557,081 | $ 9,679,242 |
Consumer Staples | 28,905,986 | 28,905,986 | - | - |
Energy | 53,015,099 | 48,634,326 | - | 4,380,773 |
Financials | 87,769,138 | 87,295,509 | 473,629 | - |
Health Care | 69,622,651 | 69,219,213 | - | 403,438 |
Industrials | 98,004,520 | 97,822,641 | - | 181,879 |
Information Technology | 142,870,718 | 142,142,056 | - | 728,662 |
Materials | 74,909,127 | 74,575,481 | - | 333,646 |
Telecommunication Services | 4,426,521 | 4,426,521 | - | - |
Utilities | 2,202,829 | 2,202,829 | - | - |
Corporate Bonds | 1,400,000 | - | - | 1,400,000 |
Money Market Funds | 69,484,474 | 69,484,474 | - | - |
Total Investments in Securities: | $ 776,148,112 | $ 753,009,762 | $ 6,030,710 | $ 17,107,640 |
The following is a summary of transfers between Level 1 and Level 2 for the period ended October 31, 2012. Transfers are assumed to have occurred at the beginning of the period, and are primarily attributable to the valuation techniques used for foreign equity securities, as discussed in the accompanying Notes to Financial Statements: |
Transfers | Total |
Level 1 to Level 2 | $ 0 |
Level 2 to Level 1 | $ 131,002,515 |
Valuation Inputs at Reporting Date: |
The following is a reconciliation of Investments in Securities for which Level 3 inputs were used in determining value: |
Investments in Securities: | |
Equities - Consumer Discretionary | |
Beginning Balance | $ 16 |
Total Realized Gain (Loss) | - |
Total Unrealized Gain (Loss) | (2,130,470) |
Cost of Purchases | - |
Proceeds of Sales | - |
Amortization/Accretion | - |
Transfers in to Level 3 | 11,809,696 |
Transfers out of Level 3 | - |
Ending Balance | $ 9,679,242 |
The change in unrealized gain (loss) for the period attributable to Level 3 securities held at October 31, 2012 | $ (2,130,470) |
Other Investments in Securities | |
Beginning Balance | $ 8,345,313 |
Total Realized Gain (Loss) | (6,001,770) |
Total Unrealized Gain (Loss) | 4,079,700 |
Cost of Purchases | 1,400,000 |
Proceeds of Sales | (2,051,934) |
Amortization/Accretion | - |
Transfers in to Level 3 | 1,657,089 |
Transfers out of Level 3 | - |
Ending Balance | $ 7,428,398 |
The change in unrealized gain (loss) for the period attributable to Level 3 securities held at October 31, 2012 | $ (2,023,569) |
The information used in the above reconciliations represents fiscal year to date activity for any Investments in Securities identified as using Level 3 inputs at either the beginning or the end of the current fiscal period. Transfers into Level 3 were attributable to a lack of observable market data resulting from decreases in market activity, decreases in liquidity, security restructurings or corporate actions. Transfers out of Level 3 were attributable to observable market data becoming available for those securities. Transfers in or out of Level 3 represent the beginning value of any Security or Instrument where a change in the pricing level occurred from the beginning to the end of the period. The cost of purchases and the proceeds of sales may include securities received or delivered through corporate actions or exchanges. Realized and unrealized gains (losses) disclosed in the reconciliations are included in Net Gain (Loss) on the Fund's Statement of Operations. |
See accompanying notes which are an integral part of the financial statements.
Annual Report
Financial Statements
Statement of Assets and Liabilities
| October 31, 2012 |
| | |
Assets | | |
Investment in securities, at value (including securities loaned of $39,538,303) - See accompanying schedule: Unaffiliated issuers (cost $652,965,199) | $ 696,984,412 | |
Fidelity Central Funds (cost $69,484,474) | 69,484,474 | |
Other affiliated issuers (cost $6,412,286) | 9,679,226 | |
Total Investments (cost $728,861,959) | | $ 776,148,112 |
Foreign currency held at value (cost $33,857) | | 33,838 |
Receivable for investments sold | | 2,827,704 |
Receivable for fund shares sold | | 709,719 |
Dividends receivable | | 1,714,617 |
Interest receivable | | 22,702 |
Distributions receivable from Fidelity Central Funds | | 108,952 |
Other receivables | | 50,490 |
Total assets | | 781,616,134 |
| | |
Liabilities | | |
Payable to custodian bank | $ 400,266 | |
Payable for investments purchased | 3,347,180 | |
Payable for fund shares redeemed | 1,443,678 | |
Accrued management fee | 613,770 | |
Distribution and service plan fees payable | 13,250 | |
Other affiliated payables | 200,735 | |
Other payables and accrued expenses | 328,637 | |
Collateral on securities loaned, at value | 42,020,618 | |
Total liabilities | | 48,368,134 |
| | |
Net Assets | | $ 733,248,000 |
Net Assets consist of: | | |
Paid in capital | | $ 777,008,696 |
Undistributed net investment income | | 4,511,102 |
Accumulated undistributed net realized gain (loss) on investments and foreign currency transactions | | (95,349,581) |
Net unrealized appreciation (depreciation) on investments and assets and liabilities in foreign currencies | | 47,077,783 |
Net Assets | | $ 733,248,000 |
See accompanying notes which are an integral part of the financial statements.
Annual Report
Financial Statements - continued
Statement of Assets and Liabilities - continued
| October 31, 2012 |
| | |
Calculation of Maximum Offering Price
Class A:
Net Asset Value and redemption price per share
($14,124,535 ÷ 715,414 shares) | | $ 19.74 |
| | |
Maximum offering price per share (100/94.25 of $19.74) | | $ 20.94 |
Class T:
Net Asset Value and redemption price per share ($9,262,276 ÷ 472,720 shares) | | $ 19.59 |
| | |
Maximum offering price per share (100/96.50 of $19.59) | | $ 20.30 |
Class B:
Net Asset Value and offering price per share ($789,979 ÷ 41,097 shares)A | | $ 19.22 |
| | |
Class C:
Net Asset Value and offering price per share ($6,798,784 ÷ 354,409 shares)A | | $ 19.18 |
| | |
International Small Cap:
Net Asset Value, offering price and redemption price per share ($692,769,335 ÷ 34,653,723 shares) | | $ 19.99 |
| | |
Institutional Class:
Net Asset Value, offering price and redemption price per share ($9,503,091 ÷ 475,117 shares) | | $ 20.00 |
A Redemption price per share is equal to net asset value less any applicable contingent deferred sales charge.
See accompanying notes which are an integral part of the financial statements.
Annual Report
Statement of Operations
| Year ended October 31, 2012 |
| | |
Investment Income | | |
Dividends (including $146,001 earned from other affiliated issuers) | | $ 14,934,160 |
Interest | | 35,091 |
Income from Fidelity Central Funds (including $1,033,335 from security lending) | | 1,060,526 |
Income before foreign taxes withheld | | 16,029,777 |
Less foreign taxes withheld | | (830,680) |
Total income | | 15,199,097 |
| | |
Expenses | | |
Management fee
Basic fee | $ 6,793,958 | |
Performance adjustment | 794,505 | |
Transfer agent fees | 2,203,397 | |
Distribution and service plan fees | 185,199 | |
Accounting and security lending fees | 390,539 | |
Custodian fees and expenses | 266,235 | |
Independent trustees' compensation | 5,334 | |
Registration fees | 89,380 | |
Audit | 149,081 | |
Legal | 4,272 | |
Miscellaneous | 10,991 | |
Total expenses before reductions | 10,892,891 | |
Expense reductions | (204,895) | 10,687,996 |
Net investment income (loss) | | 4,511,101 |
Realized and Unrealized Gain (Loss) Net realized gain (loss) on: | | |
Investment securities: | | |
Unaffiliated issuers (net of foreign taxes of $2,323) | (4,623,160) | |
Foreign currency transactions | (136,906) | |
Futures contracts | 617,111 | |
Total net realized gain (loss) | | (4,142,955) |
Change in net unrealized appreciation (depreciation) on: Investment securities (net of increase in deferred foreign taxes of $187,847) | 42,478,383 | |
Assets and liabilities in foreign currencies | (17,086) | |
Futures contracts | 113,279 | |
Total change in net unrealized appreciation (depreciation) | | 42,574,576 |
Net gain (loss) | | 38,431,621 |
Net increase (decrease) in net assets resulting from operations | | $ 42,942,722 |
See accompanying notes which are an integral part of the financial statements.
Annual Report
Financial Statements - continued
Statement of Changes in Net Assets
| Year ended
October 31,
2012 | Year ended
October 31,
2011 |
Increase (Decrease) in Net Assets | | |
Operations | | |
Net investment income (loss) | $ 4,511,101 | $ 8,017,121 |
Net realized gain (loss) | (4,142,955) | 35,260,441 |
Change in net unrealized appreciation (depreciation) | 42,574,576 | (96,830,627) |
Net increase (decrease) in net assets resulting
from operations | 42,942,722 | (53,553,065) |
Distributions to shareholders from net investment income | (8,016,423) | (2,430,566) |
Distributions to shareholders from net realized gain | (12,577,679) | (28,246,937) |
Total distributions | (20,594,102) | (30,677,503) |
Share transactions - net increase (decrease) | (204,187,386) | 129,451,482 |
Redemption fees | 102,611 | 283,575 |
Total increase (decrease) in net assets | (181,736,155) | 45,504,489 |
| | |
Net Assets | | |
Beginning of period | 914,984,155 | 869,479,666 |
End of period (including undistributed net investment income of $4,511,102 and undistributed net investment income of $8,017,124, respectively) | $ 733,248,000 | $ 914,984,155 |
See accompanying notes which are an integral part of the financial statements.
Annual Report
Financial Highlights - Class A
Years ended October 31, | 2012 | 2011 | 2010 | 2009 | 2008 |
Selected Per-Share Data | | | | | |
Net asset value, beginning of period | $ 18.97 | $ 20.42 | $ 17.28 | $ 11.91 | $ 31.14 |
Income from Investment Operations | | | | | |
Net investment income (loss) C | .06 | .10 | .03 | .06 | - H |
Net realized and unrealized gain (loss) | 1.09 | (.88) | 3.51 | 5.31 | (14.03) |
Total from investment operations | 1.15 | (.78) | 3.54 | 5.37 | (14.03) |
Distributions from net investment income | (.11) | (.02) | (.06) | - | (.03) |
Distributions from net realized gain | (.27) | (.66) | (.34) | - | (5.18) |
Total distributions | (.38) | (.68) | (.40) | - | (5.20) I |
Redemption fees added to paid in capital C | - H | .01 | - H | - H | - H |
Net asset value, end of period | $ 19.74 | $ 18.97 | $ 20.42 | $ 17.28 | $ 11.91 |
Total Return A,B | 6.28% | (4.00)% | 20.85% | 45.09% | (53.35)% |
Ratios to Average Net Assets D,G | | | | | |
Expenses before reductions | 1.63% | 1.56% | 1.71% | 1.75% | 1.82% |
Expenses net of fee waivers, if any | 1.63% | 1.55% | 1.65% | 1.65% | 1.65% |
Expenses net of all reductions | 1.60% | 1.54% | 1.63% | 1.62% | 1.60% |
Net investment income (loss) | .32% | .49% | .16% | .41% | -% F |
Supplemental Data | | | | | |
Net assets, end of period (000 omitted) | $ 14,125 | $ 17,185 | $ 19,720 | $ 17,590 | $ 13,561 |
Portfolio turnover rate E | 68% | 47% | 66% | 81% | 113% |
A Total returns would have been lower if certain expenses had not been reduced during the applicable periods shown.
B Total returns do not include the effect of the sales charges.
C Calculated based on average shares outstanding during the period.
D Fees and expenses of any underlying Fidelity Central Funds are not included in the Fund's expense ratio. The Fund indirectly bears its proportionate share of the expenses of any underlying Fidelity Central Funds.
E Amount does not include the portfolio activity of any underlying Fidelity Central Funds.
F Amount represents less than .01%.
G Expense ratios reflect operating expenses of the class. Expenses before reductions do not reflect amounts reimbursed by the investment adviser or reductions from brokerage service arrangements or reductions from other expense offset arrangements and do not represent the amount paid by the class during periods when reimbursements or reductions occur. Expenses net of fee waivers reflect expenses after reimbursement by the investment adviser but prior to reductions from brokerage service arrangements or other expense offset arrangements. Expenses net of all reductions represent the net expenses paid by the class.
H Amount represents less than $.01 per share.
I Total distributions of $5.20 per share is comprised of distributions from net investment income of $.026 and distributions from net realized gain of $5.176 per share.
See accompanying notes which are an integral part of the financial statements.
Annual Report
Financial Highlights - Class T
Years ended October 31, | 2012 | 2011 | 2010 | 2009 | 2008 |
Selected Per-Share Data | | | | | |
Net asset value, beginning of period | $ 18.80 | $ 20.23 | $ 17.14 | $ 11.84 | $ 30.96 |
Income from Investment Operations | | | | | |
Net investment income (loss) C | .01 | .05 | (.02) | .02 | (.05) |
Net realized and unrealized gain (loss) | 1.08 | (.86) | 3.47 | 5.28 | (13.95) |
Total from investment operations | 1.09 | (.81) | 3.45 | 5.30 | (14.00) |
Distributions from net investment income | (.03) | - | (.02) | - | - |
Distributions from net realized gain | (.27) | (.63) | (.34) | - | (5.12) |
Total distributions | (.30) | (.63) | (.36) | - | (5.12) |
Redemption fees added to paid in capital C | - G | .01 | - G | - G | - G |
Net asset value, end of period | $ 19.59 | $ 18.80 | $ 20.23 | $ 17.14 | $ 11.84 |
Total Return A,B | 5.97% | (4.18)% | 20.46% | 44.76% | (53.46)% |
Ratios to Average Net Assets D,F | | | | | |
Expenses before reductions | 1.88% | 1.82% | 1.97% | 2.00% | 2.07% |
Expenses net of fee waivers, if any | 1.88% | 1.81% | 1.90% | 1.90% | 1.90% |
Expenses net of all reductions | 1.85% | 1.79% | 1.88% | 1.86% | 1.86% |
Net investment income (loss) | .07% | .24% | (.09)% | .16% | (.25)% |
Supplemental Data | | | | | |
Net assets, end of period (000 omitted) | $ 9,262 | $ 13,744 | $ 16,092 | $ 15,760 | $ 13,493 |
Portfolio turnover rate E | 68% | 47% | 66% | 81% | 113% |
A Total returns would have been lower if certain expenses had not been reduced during the applicable periods shown.
B Total returns do not include the effect of the sales charges.
C Calculated based on average shares outstanding during the period.
D Fees and expenses of any underlying Fidelity Central Funds are not included in the Fund's expense ratio. The Fund indirectly bears its proportionate share of the expenses of any underlying Fidelity Central Funds.
E Amount does not include the portfolio activity of any underlying Fidelity Central Funds.
F Expense ratios reflect operating expenses of the class. Expenses before reductions do not reflect amounts reimbursed by the investment adviser or reductions from brokerage service arrangements or reductions from other expense offset arrangements and do not represent the amount paid by the class during periods when reimbursements or reductions occur. Expenses net of fee waivers reflect expenses after reimbursement by the investment adviser but prior to reductions from brokerage service arrangements or other expense offset arrangements. Expenses net of all reductions represent the net expenses paid by the class.
G Amount represents less than $.01 per share.
See accompanying notes which are an integral part of the financial statements.
Annual Report
Financial Highlights - Class B
Years ended October 31, | 2012 | 2011 | 2010 | 2009 | 2008 |
Selected Per-Share Data | | | | | |
Net asset value, beginning of period | $ 18.38 | $ 19.79 | $ 16.78 | $ 11.65 | $ 30.49 |
Income from Investment Operations | | | | | |
Net investment income (loss) C | (.08) | (.05) | (.10) | (.04) | (.16) |
Net realized and unrealized gain (loss) | 1.07 | (.85) | 3.39 | 5.17 | (13.73) |
Total from investment operations | .99 | (.90) | 3.29 | 5.13 | (13.89) |
Distributions from net realized gain | (.15) | (.52) | (.28) | - | (4.95) |
Redemption fees added to paid in capital C | - G | .01 | - G | - G | - G |
Net asset value, end of period | $ 19.22 | $ 18.38 | $ 19.79 | $ 16.78 | $ 11.65 |
Total Return A,B | 5.45% | (4.68)% | 19.90% | 44.03% | (53.68)% |
Ratios to Average Net Assets D,F | | | | | |
Expenses before reductions | 2.38% | 2.32% | 2.47% | 2.49% | 2.58% |
Expenses net of fee waivers, if any | 2.38% | 2.30% | 2.40% | 2.40% | 2.40% |
Expenses net of all reductions | 2.35% | 2.29% | 2.38% | 2.36% | 2.36% |
Net investment income (loss) | (.43)% | (.26)% | (.59)% | (.33)% | (.75)% |
Supplemental Data | | | | | |
Net assets, end of period (000 omitted) | $ 790 | $ 2,067 | $ 3,457 | $ 3,601 | $ 3,230 |
Portfolio turnover rate E | 68% | 47% | 66% | 81% | 113% |
A Total returns would have been lower if certain expenses had not been reduced during the applicable periods shown.
B Total returns do not include the effect of the contingent deferred sales charge.
C Calculated based on average shares outstanding during the period.
D Fees and expenses of any underlying Fidelity Central Funds are not included in the Fund's expense ratio. The Fund indirectly bears its proportionate share of the expenses of any underlying Fidelity Central Funds.
E Amount does not include the portfolio activity of any underlying Fidelity Central Funds.
F Expense ratios reflect operating expenses of the class. Expenses before reductions do not reflect amounts reimbursed by the investment adviser or reductions from brokerage service arrangements or reductions from other expense offset arrangements and do not represent the amount paid by the class during periods when reimbursements or reductions occur. Expenses net of fee waivers reflect expenses after reimbursement by the investment adviser but prior to reductions from brokerage service arrangements or other expense offset arrangements. Expenses net of all reductions represent the net expenses paid by the class.
G Amount represents less than $.01 per share.
See accompanying notes which are an integral part of the financial statements.
Annual Report
Financial Highlights - Class C
Years ended October 31, | 2012 | 2011 | 2010 | 2009 | 2008 |
Selected Per-Share Data | | | | | |
Net asset value, beginning of period | $ 18.38 | $ 19.85 | $ 16.85 | $ 11.70 | $ 30.62 |
Income from Investment Operations | | | | | |
Net investment income (loss) C | (.08) | (.04) | (.10) | (.04) | (.16) |
Net realized and unrealized gain (loss) | 1.07 | (.85) | 3.40 | 5.19 | (13.78) |
Total from investment operations | .99 | (.89) | 3.30 | 5.15 | (13.94) |
Distributions from net realized gain | (.19) | (.59) | (.30) | - | (4.98) |
Redemption fees added to paid in capital C | - G | .01 | - G | - G | - G |
Net asset value, end of period | $ 19.18 | $ 18.38 | $ 19.85 | $ 16.85 | $ 11.70 |
Total Return A,B | 5.46% | (4.64)% | 19.86% | 44.02% | (53.67)% |
Ratios to Average Net Assets D,F | | | | | |
Expenses before reductions | 2.38% | 2.27% | 2.42% | 2.49% | 2.57% |
Expenses net of fee waivers, if any | 2.38% | 2.26% | 2.40% | 2.40% | 2.40% |
Expenses net of all reductions | 2.35% | 2.24% | 2.37% | 2.36% | 2.36% |
Net investment income (loss) | (.43)% | (.21)% | (.59)% | (.33)% | (.76)% |
Supplemental Data | | | | | |
Net assets, end of period (000 omitted) | $ 6,799 | $ 9,545 | $ 13,501 | $ 5,814 | $ 5,658 |
Portfolio turnover rate E | 68% | 47% | 66% | 81% | 113% |
A Total returns would have been lower if certain expenses had not been reduced during the applicable periods shown.
B Total returns do not include the effect of the contingent deferred sales charge.
C Calculated based on average shares outstanding during the period.
D Fees and expenses of any underlying Fidelity Central Funds are not included in the Fund's expense ratio. The Fund indirectly bears its proportionate share of the expenses of any underlying Fidelity Central Funds.
E Amount does not include the portfolio activity of any underlying Fidelity Central Funds.
F Expense ratios reflect operating expenses of the class. Expenses before reductions do not reflect amounts reimbursed by the investment adviser or reductions from brokerage service arrangements or reductions from other expense offset arrangements and do not represent the amount paid by the class during periods when reimbursements or reductions occur. Expenses net of fee waivers reflect expenses after reimbursement by the investment adviser but prior to reductions from brokerage service arrangements or other expense offset arrangements. Expenses net of all reductions represent the net expenses paid by the class.
G Amount represents less than $.01 per share.
See accompanying notes which are an integral part of the financial statements.
Annual Report
Financial Highlights - International Small Cap
Years ended October 31, | 2012 | 2011 | 2010 | 2009 | 2008 |
Selected Per-Share Data | | | | | |
Net asset value, beginning of period | $ 19.23 | $ 20.66 | $ 17.48 | $ 12.03 | $ 31.44 |
Income from Investment Operations | | | | | |
Net investment income (loss) B | .11 | .17 | .07 | .08 | .03 |
Net realized and unrealized gain (loss) | 1.10 | (.89) | 3.53 | 5.37 | (14.14) |
Total from investment operations | 1.21 | (.72) | 3.60 | 5.45 | (14.11) |
Distributions from net investment income | (.18) | (.06) | (.08) | - | (.12) |
Distributions from net realized gain | (.27) | (.66) | (.34) | - | (5.18) |
Total distributions | (.45) | (.72) | (.42) | - | (5.30) |
Redemption fees added to paid in capital B | - F | .01 | - F | - F | - F |
Net asset value, end of period | $ 19.99 | $ 19.23 | $ 20.66 | $ 17.48 | $ 12.03 |
Total Return A | 6.55% | (3.65)% | 21.02% | 45.30% | (53.25)% |
Ratios to Average Net Assets C,E | | | | | |
Expenses before reductions | 1.35% | 1.26% | 1.44% | 1.48% | 1.49% |
Expenses net of fee waivers, if any | 1.35% | 1.25% | 1.44% | 1.48% | 1.49% |
Expenses net of all reductions | 1.33% | 1.23% | 1.42% | 1.44% | 1.44% |
Net investment income (loss) | .59% | .80% | .37% | .58% | .16% |
Supplemental Data | | | | | |
Net assets, end of period (000 omitted) | $ 692,769 | $ 856,692 | $ 808,478 | $ 669,035 | $ 536,291 |
Portfolio turnover rate D | 68% | 47% | 66% | 81% | 113% |
A Total returns would have been lower if certain expenses had not been reduced during the applicable periods shown.
B Calculated based on average shares outstanding during the period.
C Fees and expenses of any underlying Fidelity Central Funds are not included in the Fund's expense ratio. The Fund indirectly bears its proportionate share of the expenses of any underlying Fidelity Central Funds.
D Amount does not include the portfolio activity of any underlying Fidelity Central Funds.
E Expense ratios reflect operating expenses of the class. Expenses before reductions do not reflect amounts reimbursed by the investment adviser or reductions from brokerage service arrangements or reductions from other expense offset arrangements and do not represent the amount paid by the class during periods when reimbursements or reductions occur. Expenses net of fee waivers reflect expenses after reimbursement by the investment adviser but prior to reductions from brokerage service arrangements or other expense offset arrangements. Expenses net of all reductions represent the net expenses paid by the class.
F Amount represents less than $.01 per share.
See accompanying notes which are an integral part of the financial statements.
Annual Report
Financial Highlights - Institutional Class
Years ended October 31, | 2012 | 2011 | 2010 | 2009 | 2008 |
Selected Per-Share Data | | | | | |
Net asset value, beginning of period | $ 19.24 | $ 20.66 | $ 17.47 | $ 12.01 | $ 31.38 |
Income from Investment Operations | | | | | |
Net investment income (loss) B | .13 | .18 | .09 | .09 | .05 |
Net realized and unrealized gain (loss) | 1.10 | (.89) | 3.53 | 5.37 | (14.12) |
Total from investment operations | 1.23 | (.71) | 3.62 | 5.46 | (14.07) |
Distributions from net investment income | (.20) | (.06) | (.09) | - | (.12) |
Distributions from net realized gain | (.27) | (.66) | (.34) | - | (5.18) |
Total distributions | (.47) | (.72) | (.43) | - | (5.30) |
Redemption fees added to paid in capital B | - F | .01 | - F | - F | - F |
Net asset value, end of period | $ 20.00 | $ 19.24 | $ 20.66 | $ 17.47 | $ 12.01 |
Total Return A | 6.65% | (3.62)% | 21.15% | 45.46% | (53.22)% |
Ratios to Average Net Assets C,E | | | | | |
Expenses before reductions | 1.25% | 1.22% | 1.34% | 1.45% | 1.49% |
Expenses net of fee waivers, if any | 1.25% | 1.21% | 1.34% | 1.40% | 1.40% |
Expenses net of all reductions | 1.22% | 1.19% | 1.31% | 1.37% | 1.35% |
Net investment income (loss) | .70% | .84% | .47% | .66% | .25% |
Supplemental Data | | | | | |
Net assets, end of period (000 omitted) | $ 9,503 | $ 15,752 | $ 8,231 | $ 2,696 | $ 2,217 |
Portfolio turnover rate D | 68% | 47% | 66% | 81% | 113% |
A Total returns would have been lower if certain expenses had not been reduced during the applicable periods shown.
B Calculated based on average shares outstanding during the period.
C Fees and expenses of any underlying Fidelity Central Funds are not included in the Fund's expense ratio. The Fund indirectly bears its proportionate share of the expenses of any underlying Fidelity Central Funds.
D Amount does not include the portfolio activity of any underlying Fidelity Central Funds.
E Expense ratios reflect operating expenses of the class. Expenses before reductions do not reflect amounts reimbursed by the investment adviser or reductions from brokerage service arrangements or reductions from other expense offset arrangements and do not represent the amount paid by the class during periods when reimbursements or reductions occur. Expenses net of fee waivers reflect expenses after reimbursement by the investment adviser but prior to reductions from brokerage service arrangements or other expense offset arrangements. Expenses net of all reductions represent the net expenses paid by the class.
F Amount represents less than $.01 per share.
See accompanying notes which are an integral part of the financial statements.
Annual Report
Notes to Financial Statements
For the period ended October 31, 2012
1. Organization.
Fidelity International Small Cap Fund (the Fund) is a fund of Fidelity Investment Trust (the Trust) and is authorized to issue an unlimited number of shares. The Trust is registered under the Investment Company Act of 1940, as amended (the 1940 Act), as an open-end management investment company organized as a Massachusetts business trust. The Fund offers Class A, Class T, Class C, International Small Cap and Institutional Class shares, each of which, along with Class B shares, has equal rights as to assets and voting privileges. Effective after the close of business on September 1, 2010, Class B shares were closed to new accounts and additional purchases, except for exchanges and reinvestments. Each class has exclusive voting rights with respect to matters that affect that class. Class B shares will automatically convert to Class A shares after a holding period of seven years from the initial date of purchase. Investment income, realized and unrealized capital gains and losses, the common expenses of the Fund, and certain fund-level expense reductions, if any, are allocated on a pro-rata basis to each class based on the relative net assets of each class to the total net assets of the Fund. Each class differs with respect to transfer agent and distribution and service plan fees incurred. Certain expense reductions may also differ by class. The Fund's investments in emerging markets can be subject to social, economic, regulatory, and political uncertainties and can be extremely volatile.
2. Investments in Fidelity Central Funds.
The Fund invests in Fidelity Central Funds, which are open-end investment companies available only to other investment companies and accounts managed by Fidelity Management & Research Company (FMR) and its affiliates. The Fund's Schedule of Investments lists each of the Fidelity Central Funds held as of period end, as an investment of the Fund, but does not include the underlying holdings of each Fidelity Central Fund. As an Investing Fund, the Fund indirectly bears its proportionate share of the expenses of the underlying Fidelity Central Funds.
The Money Market Central Funds seek preservation of capital and current income and are managed by Fidelity Investments Money Management, Inc. (FIMM), an affiliate of FMR.
A complete unaudited list of holdings for each Fidelity Central Fund is available upon request or at the Securities and Exchange Commission (the SEC) web site at www.sec.gov. In addition, the financial statements of the Fidelity Central Funds, which are not covered by the Fund's Report of Independent Registered Public Accounting Firm, are available on the SEC web site or upon request.
Annual Report
3. Significant Accounting Policies.
The financial statements have been prepared in conformity with accounting principles generally accepted in the United States of America (GAAP), which require management to make certain estimates and assumptions at the date of the financial statements. Actual results could differ from those estimates. Subsequent events, if any, through the date that the financial statements were issued have been evaluated in the preparation of the financial statements. The following summarizes the significant accounting policies of the Fund:
Security Valuation. Investments are valued as of 4:00 p.m. Eastern time on the last calendar day of the period. In accordance with valuation policies and procedures approved by the Board of Trustees (the Board), the Fund attempts to obtain prices from one or more third party pricing vendors or brokers to value its investments. When current market prices, quotations or rates are not readily available or reliable, securities will be fair valued in good faith by the FMR Fair Value Committee (the Committee), in accordance with procedures adopted by the Fund's Board. Factors used in determining fair value vary by security type and may include market or security specific events, changes in interest rates and credit quality. The frequency with which these procedures are used cannot be predicted and they may be utilized to a significant extent. The Committee oversees the Fund's valuation policies and procedures and is responsible for approving and reporting to the Board all fair value determinations.
The Fund categorizes the inputs to valuation techniques used to value its investments into a disclosure hierarchy consisting of three levels as shown below:
Level 1 - quoted prices in active markets for identical investments
Level 2 - other significant observable inputs (including quoted prices for similar investments, interest rates, prepayment speeds, etc.)
Level 3 - unobservable inputs (including the Fund's own assumptions based on the best information available)
Valuation techniques used to value the Fund's investments by major category are as follows:
Equity securities, including restricted securities, for which market quotations are readily available, are valued at the last reported sale price or official closing price as reported by a third party pricing vendor on the primary market or exchange on which they are traded and are categorized as Level 1 in the hierarchy. In the event there were no sales during the day or closing prices are not available, securities are valued at the last quoted bid price or may be valued using the last available price and are generally categorized as Level 2 in the hierarchy. For foreign equity securities, when significant market or security specific events arise, comparisons to the valuation of American Depositary Receipts
Annual Report
Notes to Financial Statements - continued
3. Significant Accounting Policies - continued
Security Valuation - continued
(ADRs), futures contracts, Exchange-Traded Funds (ETFs) and certain indexes as well as quoted prices for similar securities are used and are categorized as Level 2 in the hierarchy. Utilizing these techniques may result in transfers between Level 1 and Level 2. For restricted equity securities and private placements where observable inputs are limited, assumptions about market activity and risk are used and these securities are categorized as Level 3 in the hierarchy.
Debt securities, including restricted securities, are valued based on evaluated prices received from third party pricing vendors or from brokers who make markets in such securities. For corporate bonds, pricing vendors utilize matrix pricing which considers yield or price of bonds of comparable quality, coupon, maturity and type as well as broker-supplied prices and are generally categorized as Level 2 in the hierarchy. When independent prices are unavailable or unreliable, debt securities may be valued utilizing pricing methodologies which consider similar factors that would be used by third party pricing vendors. These are generally categorized as Level 2 in the hierarchy but may be Level 3 depending on the circumstances.
Investments in open-end mutual funds, including the Fidelity Central Funds, are valued at their closing net asset value (NAV) each business day and are categorized as Level 1 in the hierarchy.
The following provides information on Level 3 securities held by the Fund that were valued at period end based on unobservable inputs. These amounts exclude valuations provided by a broker.
Asset Type | Fair Value at 10/31/12 | Valuation Technique (s) | Unobservable Input | Range | Weighted Average |
Common Stocks | $ 15,707,639 | Expected distribution | Recovery rate | 0% | 0% |
| | Market comparable | Discount for lack of marketability | 10% - 50% | 35.57% |
| | | EV/NOPAT multiple | 12.3 | 12.3 |
| | | Transaction price | $ .045 - $2.6 | $ 1.06 |
Corporate Bonds | $ 1,400,000 | Market comparable | Transaction price | $ 100 | $ 100 |
For the unobservable inputs listed in the table above, a significant increase in discount for lack of marketability could result in a significant decrease to the fair value measurement. A significant increase in recovery rates, EV/NOPAT multiples or transaction price could result in a significant increase to the fair value measurement.
Annual Report
3. Significant Accounting Policies - continued
Security Valuation - continued
Changes in valuation techniques may result in transfers in or out of an assigned level within the disclosure hierarchy. The aggregate value of investments by input level, as of October 31, 2012, including information on transfers between Levels 1 and 2, as well as a roll forward of Level 3 securities, is included at the end of the Fund's Schedule of Investments.
Foreign Currency Translation. The Fund may use foreign currency contracts to facilitate transactions in foreign-denominated securities. Gains and losses from these transactions may arise from changes in the value of the foreign currency or if the counterparties do not perform under the contracts' terms.
Foreign-denominated assets, including investment securities, and liabilities are translated into U.S. dollars at the exchange rates at period end. Purchases and sales of investment securities, income and dividends received and expenses denominated in foreign currencies are translated into U.S. dollars at the exchange rate in effect on the transaction date.
The effects of exchange rate fluctuations on investments are included with the net realized and unrealized gain (loss) on investment securities. Other foreign currency transactions resulting in realized and unrealized gain (loss) are disclosed separately.
Investment Transactions and Income. For financial reporting purposes, the Fund's investment holdings and NAV include trades executed through the end of the last business day of the period. The NAV per share for processing shareholder transactions is calculated as of the close of business of the New York Stock Exchange (NYSE), normally 4:00 p.m. Eastern time and includes trades executed through the end of the prior business day. Gains and losses on securities sold are determined on the basis of identified cost. Dividend income is recorded on the ex-dividend date, except for certain dividends from foreign securities where the ex-dividend date may have passed, which are recorded as soon as the Fund is informed of the ex-dividend date. Non-cash dividends included in dividend income, if any, are recorded at the fair market value of the securities received. Interest income and distributions from the Fidelity Central Funds are accrued as earned. Interest income includes coupon interest and amortization of premium and accretion of discount on debt securities. Investment income is recorded net of foreign taxes withheld where recovery of such taxes is uncertain.
Expenses. Expenses directly attributable to a fund are charged to that fund. Expenses attributable to more than one fund are allocated among the respective funds on the basis of relative net assets or other appropriate methods. Expense estimates are accrued in the period to which they relate and adjustments are made when actual amounts are known.
Annual Report
Notes to Financial Statements - continued
3. Significant Accounting Policies - continued
Income Tax Information and Distributions to Shareholders. Each year, the Fund intends to qualify as a regulated investment company under Subchapter M of the Internal Revenue Code, including distributing substantially all of its taxable income and realized gains. As a result, no provision for income taxes is required. As of October 31, 2012, the Fund did not have any unrecognized tax benefits in the financial statements; nor is the Fund aware of any tax positions for which it is reasonably possible that the total amounts of unrecognized tax benefits will significantly change in the next twelve months. The Fund files a U.S. federal tax return, in addition to state and local tax returns as required. A fund's federal income tax returns are subject to examination by the Internal Revenue Service (IRS) for a period of three fiscal years after they are filed. State and local tax returns may be subject to examination for an additional fiscal year depending on the jurisdiction. Foreign taxes are provided for based on the Fund's understanding of the tax rules and rates that exist in the foreign markets in which it invests. The Fund is subject to a tax imposed on capital gains by certain countries in which it invests. An estimated deferred tax liability for net unrealized appreciation on the applicable securities is included in Other payables and accrued expenses on the Statement of Assets & Liabilities.
Distributions are declared and recorded on the ex-dividend date. Income dividends and capital gain distributions are declared separately for each class. Income and capital gain distributions are determined in accordance with income tax regulations, which may differ from GAAP.
Capital accounts within the financial statements are adjusted for permanent book-tax differences. These adjustments have no impact on net assets or the results of operations. Temporary book-tax differences will reverse in a subsequent period.
Book-tax differences are primarily due futures transactions, foreign currency transactions, certain foreign taxes, passive foreign investment companies (PFIC), market discount, capital loss carryforwards and losses deferred due to wash sales.
The federal tax cost of investment securities and unrealized appreciation (depreciation) as of period end were as follows:
Gross unrealized appreciation | 127,681,860 |
Gross unrealized depreciation | (104,609,169) |
Net unrealized appreciation (depreciation) on securities and other investments | $ 23,072,691 |
| |
Tax Cost | $ 753,075,421 |
Annual Report
3. Significant Accounting Policies - continued
Income Tax Information and Distributions to Shareholders - continued
The tax-based components of distributable earnings as of period end were as follows:
Undistributed ordinary income | $ 16,278,609 |
Capital loss carryforward | $ (82,903,626) |
Net unrealized appreciation (depreciation) | $ 23,049,729 |
Capital loss carryforwards are only available to offset future capital gains of the Fund to the extent provided by regulations and may be limited. Under the Regulated Investment Company Modernization Act of 2010 (the Act), the Fund is permitted to carry forward capital losses incurred in taxable years beginning after December 22, 2010 for an unlimited period and such capital losses are required to be used prior to any losses that expire. Capital loss carryforwards were as follows:
Fiscal year of expiration | |
| |
2017 | $ (65,361,612) |
No expiration | |
Short-term | (13,191,063) |
Long-term | (4,350,951) |
Total no expiration | (17,542,014) |
Total capital loss carryforward | $ (82,903,626) |
| |
The tax character of distributions paid was as follows:
| October 31, 2012 | October 31, 2011 |
Ordinary Income | $ 20,594,102 | $ 30,677,503 |
Short-Term Trading (Redemption) Fees. Shares held by investors in the Fund less than 90 days are subject to a redemption fee equal to 2.00% of the net asset value of shares redeemed. All redemption fees, which reduce the proceeds of the shareholder redemption, are retained by the Fund and accounted for as an addition to paid in capital.
Restricted Securities. The Fund may invest in securities that are subject to legal or contractual restrictions on resale. These securities generally may be resold in transactions exempt from registration or to the public if the securities are registered. Disposal of these securities may involve time-consuming negotiations and expense, and prompt sale at an acceptable price may be difficult. Information regarding restricted securities is included at the end of the Fund's Schedule of Investments.
Annual Report
Notes to Financial Statements - continued
3. Significant Accounting Policies - continued
New Accounting Pronouncement. In December 2011, the Financial Accounting Standards Board issued Accounting Standard Update No. 2011-11, Disclosures about Offsetting Assets and Liabilities. The update creates new disclosure requirements requiring entities to disclose both gross and net information for derivatives and other financial instruments that are either offset in the Statement of Assets and Liabilities or subject to an enforceable master netting arrangement or similar agreement. The disclosure requirements are effective for annual reporting periods beginning on or after January 1, 2013, and interim periods within those annual periods. Management is currently evaluating the impact of the update's adoption on the Fund's financial statement disclosures.
4. Derivative Instruments.
Risk Exposures and the Use of Derivative Instruments. The Fund's investment objective allows the Fund to enter into various types of derivative contracts, including futures contracts. Derivatives are investments whose value is primarily derived from underlying assets, indices or reference rates and may be transacted on an exchange or over-the-counter (OTC). Derivatives may involve a future commitment to buy or sell a specified instrument based on specified terms, to exchange future cash flows at periodic intervals based on a notional principal amount, or for one party to make one or more payments upon the occurrence of specified events in exchange for periodic payments from the other party.
The Fund used derivatives to increase returns and to manage exposure to certain risks as defined below. The success of any strategy involving derivatives depends on analysis of numerous economic factors, and if the strategies for investment do not work as intended, the Fund may not achieve its objectives.
The Fund's use of derivatives increased or decreased its exposure to the following risk:
Equity Risk | Equity risk relates to the fluctuations in the value of financial instruments as a result of changes in market prices (other than those arising from interest rate risk or foreign exchange risk), whether caused by factors specific to an individual investment, its issuer, or all factors affecting all instruments traded in a market or market segment. |
The Fund is also exposed to additional risks from investing in derivatives, such as liquidity risk and counterparty credit risk. Liquidity risk is the risk that the Fund will be unable to close out the derivative in the open market in a timely manner. Counterparty credit risk is the risk that the counterparty will not be able to fulfill its obligation to the Fund. Counterparty credit risk related to exchange-traded futures contracts is minimal because of the protection provided by the exchange on which they trade.
Annual Report
4. Derivative Instruments - continued
Risk Exposures and the Use of Derivative Instruments - continued
Investing in derivatives may involve greater risks than investing in the underlying assets directly and, to varying degrees, may involve risk of loss in excess of any initial investment and collateral received and amounts recognized in the Statement of Assets and Liabilities. In addition, there may be the risk that the change in value of the derivative contract does not correspond to the change in value of the underlying instrument.
Futures Contracts. A futures contract is an agreement between two parties to buy or sell a specified underlying instrument for a fixed price at a specified future date. The Fund used futures contracts to manage its exposure to the stock market.
Upon entering into a futures contract, a fund is required to deposit either cash or securities (initial margin) with a clearing broker in an amount equal to a certain percentage of the face value of the contract. Futures contracts are marked-to-market daily and subsequent payments (variation margin) are made or received by a fund depending on the daily fluctuations in the value of the futures contracts and are recorded as unrealized appreciation or (depreciation). This receivable and/or payable is included in daily variation margin on futures contracts in the Statement of Assets and Liabilities. Realized gain or (loss) is recorded upon the expiration or closing of a futures contract.
Any open futures contracts at period end are shown in the Schedule of Investments under the caption "Futures Contracts." The underlying face amount at value reflects each contract's exposure to the underlying instrument at period end and is representative of activity for the period.
During the period the Fund recognized net realized gain (loss) of $617,111 and a change in net unrealized appreciation (depreciation) of $113,279 related to its investment in futures contracts. These amounts are included in the Statement of Operations.
5. Purchases and Sales of Investments.
Purchases and sales of securities, other than short-term securities, aggregated $526,733,625 and $758,337,261, respectively.
6. Fees and Other Transactions with Affiliates.
Management Fee. FMR and its affiliates provide the Fund with investment management related services for which the Fund pays a monthly management fee. The management fee is the sum of an individual fund fee rate that is based on an annual rate of .60% of the Fund's average net assets and an annualized group fee rate that averaged .26% during the period. The group fee rate is based upon the average net assets of all the
Annual Report
Notes to Financial Statements - continued
6. Fees and Other Transactions with Affiliates - continued
Management Fee - continued
mutual funds advised by FMR. The group fee rate decreases as assets under management increase and increases as assets under management decrease. In addition, the management fee is subject to a performance adjustment (up to a maximum of ± .20% of the Fund's average net assets over a 36 month performance period). The upward or downward adjustment to the management fee is based on the relative investment performance of International Small Cap as compared to an appropriate benchmark index. For the period, the total annual management fee rate, including the performance adjustment, was .96% of the Fund's average net assets.
Distribution and Service Plan Fees. In accordance with Rule 12b-1 of the 1940 Act, the Fund has adopted separate Distribution and Service Plans for each class of shares. Certain classes pay Fidelity Distributors Corporation (FDC), an affiliate of FMR, separate Distribution and Service Fees, each of which is based on an annual percentage of each class' average net assets. In addition, FDC may pay financial intermediaries for selling shares of the Fund and providing shareholder support services. For the period, the Distribution and Service Fee rates, total fees and amounts retained by FDC were as follows:
| Distribution
Fee | Service
Fee | Total Fees | Retained
by FDC |
Class A | -% | .25% | $ 37,801 | $ 382 |
Class T | .25% | .25% | 53,002 | 142 |
Class B | .75% | .25% | 12,735 | 9,557 |
Class C | .75% | .25% | 81,661 | 5,650 |
| | | $ 185,199 | $ 15,731 |
Sales Load. FDC may receive a front-end sales charge of up to 5.75% for selling Class A shares and 3.50% for selling Class T shares, some of which is paid to financial intermediaries for selling shares of the Fund. Depending on the holding period, FDC may receive contingent deferred sales charges levied on Class A, Class T, Class B, and Class C redemptions. The deferred sales charges range from 5.00% to 1.00% for Class B shares, 1.00% for Class C shares, 1.00% for certain purchases of Class A shares and .25% for certain purchases of Class T shares.
For the period, sales charge amounts retained by FDC were as follows:
| Retained
by FDC |
Class A | $ 4,719 |
Class T | 1,996 |
Class B* | 272 |
Class C* | 1,068 |
| $ 8,055 |
* When Class B and Class C shares are initially sold, FDC pays commissions from its own resources to financial intermediaries through which the sales are made.
Annual Report
6. Fees and Other Transactions with Affiliates - continued
Transfer Agent Fees. Fidelity Investments Institutional Operations Company, Inc. (FIIOC), an affiliate of FMR, is the transfer, dividend disbursing and shareholder servicing agent for each class of the Fund. FIIOC receives account fees and asset-based fees that vary according to the account size and type of account of the shareholders of the respective classes of the Fund. FIIOC pays for typesetting, printing and mailing of shareholder reports, except proxy statements. For the period, transfer agent fees for each class were as follows:
| Amount | % of
Average
Net Assets |
Class A | $ 45,432 | .30 |
Class T | 32,311 | .31 |
Class B | 3,797 | .30 |
Class C | 24,474 | .30 |
International Small Cap | 2,079,534 | .28 |
Institutional Class | 17,849 | .17 |
| $ 2,203,397 | |
Accounting and Security Lending Fees. Fidelity Service Company, Inc. (FSC), an affiliate of FMR, maintains the Fund's accounting records. The accounting fee is based on the level of average net assets for each month. Under a separate contract, FSC administers the security lending program. The security lending fee is based on the number and duration of lending transactions.
Brokerage Commissions. The Fund placed a portion of its portfolio transactions with brokerage firms which are affiliates of the investment adviser. The commissions paid to these affiliated firms were $572 for the period.
7. Committed Line of Credit.
The Fund participates with other funds managed by FMR or an affiliate in a $4.25 billion credit facility (the "line of credit") to be utilized for temporary or emergency purposes to fund shareholder redemptions or for other short-term liquidity purposes. The Fund has agreed to pay commitment fees on its pro-rata portion of the line of credit, which amounted to $2,240 and is reflected in Miscellaneous expenses on the Statement of Operations. During the period, there were no borrowings on this line of credit.
Annual Report
Notes to Financial Statements - continued
8. Security Lending.
The Fund lends portfolio securities through a lending agent from time to time in order to earn additional income. For equity securities, a lending agent is used and may loan securities to certain qualified borrowers, including Fidelity Capital Markets (FCM), a broker-dealer affiliated with the Fund. On the settlement date of the loan, the Fund receives collateral (in the form of U.S. Treasury obligations, letters of credit and/or cash) against the loaned securities and maintains collateral in an amount not less than 100% of the market value of the loaned securities during the period of the loan. The market value of the loaned securities is determined at the close of business of the Fund and any additional required collateral is delivered to the Fund on the next business day. If the borrower defaults on its obligation to return the securities loaned because of insolvency or other reasons, a fund could experience delays and costs in recovering the securities loaned or in gaining access to the collateral. Any cash collateral received is invested in the Fidelity Securities Lending Cash Central Fund. The value of loaned securities and cash collateral at period end are disclosed on the Fund's Statement of Assets and Liabilities. At period end, there were no security loans outstanding with FCM. Security lending income represents the income earned on investing cash collateral, less rebates paid to borrowers and any lending agent fees associated with the loan, plus any premium payments received for lending certain types of securities. Security lending income is presented in the Statement of Operations as a component of income from Fidelity Central Funds and includes $32,573 from securities loaned to FCM.
9. Expense Reductions.
Many of the brokers with whom FMR places trades on behalf of the Fund provided services to the Fund in addition to trade execution. These services included payments of certain expenses on behalf of the Fund totaling $204,895 for the period.
10. Distributions to Shareholders.
Distributions to shareholders of each class were as follows:
Years ended October 31, | 2012 | 2011 |
From net investment income | | |
Class A | $ 98,060 | $ 15,709 |
Class T | 18,440 | - |
International Small Cap | 7,747,338 | 2,403,692 |
Institutional Class | 152,585 | 11,165 |
Total | $ 8,016,423 | $ 2,430,566 |
Annual Report
10. Distributions to Shareholders - continued
Years ended October 31, | 2012 | 2011 |
From net realized gain | | |
Class A | $ 246,964 | $ 648,961 |
Class T | 172,958 | 496,268 |
Class B | 15,448 | 87,007 |
Class C | 91,928 | 402,241 |
International Small Cap | 11,838,630 | 26,480,677 |
Institutional Class | 211,751 | 131,783 |
Total | $ 12,577,679 | $ 28,246,937 |
11. Share Transactions.
Transactions for each class of shares were as follows:
| Shares | Dollars |
Years ended October 31, | 2012 | 2011 | 2012 | 2011 |
Class A | | | | |
Shares sold | 190,464 | 472,219 | $ 3,581,689 | $ 10,051,889 |
Reinvestment of distributions | 18,159 | 30,361 | 323,949 | 616,326 |
Shares redeemed | (398,912) | (562,759) | (7,484,565) | (11,902,630) |
Net increase (decrease) | (190,289) | (60,179) | $ (3,578,927) | $ (1,234,415) |
Class T | | | | |
Shares sold | 67,193 | 237,757 | $ 1,245,760 | $ 5,055,416 |
Reinvestment of distributions | 10,478 | 24,155 | 185,991 | 486,714 |
Shares redeemed | (336,074) | (326,059) | (6,220,818) | (6,629,520) |
Net increase (decrease) | (258,403) | (64,147) | $ (4,789,067) | $ (1,087,390) |
Class B | | | | |
Shares sold | 1,171 | 21,873 | $ 21,568 | $ 464,854 |
Reinvestment of distributions | 825 | 4,142 | 14,430 | 81,975 |
Shares redeemed | (73,396) | (88,228) | (1,354,968) | (1,778,852) |
Net increase (decrease) | (71,400) | (62,213) | $ (1,318,970) | $ (1,232,023) |
Class C | | | | |
Shares sold | 95,047 | 128,685 | $ 1,772,779 | $ 2,661,361 |
Reinvestment of distributions | 4,830 | 19,105 | 84,289 | 378,079 |
Shares redeemed | (264,717) | (308,659) | (4,745,500) | (6,253,765) |
Net increase (decrease) | (164,840) | (160,869) | $ (2,888,432) | $ (3,214,325) |
International Small Cap | | | | |
Shares sold | 4,700,621 | 17,502,789 | $ 88,441,440 | $ 375,309,666 |
Reinvestment of distributions | 1,033,828 | 1,321,812 | 18,629,579 | 27,110,370 |
Shares redeemed | (15,631,544) | (13,398,001) | (292,428,231) | (275,580,654) |
Net increase (decrease) | (9,897,095) | 5,426,600 | $ (185,357,212) | $ 126,839,382 |
Annual Report
Notes to Financial Statements - continued
11. Share Transactions - continued
| Shares | Dollars |
Years ended October 31, | 2012 | 2011 | 2012 | 2011 |
Institutional Class | | | | |
Shares sold | 199,584 | 798,910 | $ 3,790,776 | $ 17,190,303 |
Reinvestment of distributions | 15,793 | 5,609 | 284,438 | 115,044 |
Shares redeemed | (559,093) | (384,085) | (10,329,992) | (7,925,094) |
Net increase (decrease) | (343,716) | 420,434 | $ (6,254,778) | $ 9,380,253 |
12. Other.
The Fund's organizational documents provide former and current trustees and officers with a limited indemnification against liabilities arising in connection with the performance of their duties to the Fund. In the normal course of business, the Fund may also enter into contracts that provide general indemnifications. The Fund's maximum exposure under these arrangements is unknown as this would be dependent on future claims that may be made against the Fund. The risk of material loss from such claims is considered remote.
At the end of the period, FMR or its affiliates were the owners of record of 14% of the total outstanding shares of the Fund.
Annual Report
Report of Independent Registered Public Accounting Firm
To the Trustees of Fidelity Investment Trust and Shareholders of Fidelity International Small Cap Fund:
We have audited the accompanying statement of assets and liabilities of Fidelity International Small Cap Fund (the Fund), a fund of Fidelity Investment Trust, including the schedule of investments, as of October 31, 2012, and the related statement of operations for the year then ended, the statement of changes in net assets for each of the two years in the period then ended, and the financial highlights for each of the five years in the period then ended. These financial statements and financial highlights are the responsibility of the Fund's management. Our responsibility is to express an opinion on these financial statements and financial highlights based on our audits.
We conducted our audits in accordance with the standards of the Public Company Accounting Oversight Board (United States). Those standards require that we plan and perform the audit to obtain reasonable assurance about whether the financial statements and financial highlights are free of material misstatement. The Fund is not required to have, nor were we engaged to perform, an audit of its internal control over financial reporting. Our audits included consideration of internal control over financial reporting as a basis for designing audit procedures that are appropriate in the circumstances, but not for the purpose of expressing an opinion on the effectiveness of the Fund's internal control over financial reporting. Accordingly, we express no such opinion. An audit also includes examining, on a test basis, evidence supporting the amounts and disclosures in the financial statements, assessing the accounting principles used and significant estimates made by management, as well as evaluating the overall financial statement presentation. Our procedures included confirmation of securities owned as of October 31, 2012, by correspondence with the custodians and brokers; where replies were not received from brokers, we performed other auditing procedures. We believe that our audits provide a reasonable basis for our opinion.
In our opinion, the financial statements and financial highlights referred to above present fairly, in all material respects, the financial position of Fidelity International Small Cap Fund as of October 31, 2012, the results of its operations for the year then ended, the changes in its net assets for each of the two years in the period then ended, and the financial highlights for each of the five years in the period then ended, in conformity with accounting principles generally accepted in the United States of America.
DELOITTE & TOUCHE LLP
Boston, Massachusetts
December 18, 2012
Annual Report
Trustees and Officers
The Trustees, Members of the Advisory Board, and executive officers of the trust and fund, as applicable, are listed below. The Board of Trustees governs the fund and is responsible for protecting the interests of shareholders. The Trustees are experienced executives who meet periodically throughout the year to oversee the fund's activities, review contractual arrangements with companies that provide services to the fund, oversee management of the risks associated with such activities and contractual arrangements, and review the fund's performance. Except for James C. Curvey, each of the Trustees oversees 236 funds advised by FMR or an affiliate. Mr. Curvey oversees 443 funds advised by FMR or an affiliate.
The Trustees hold office without limit in time except that (a) any Trustee may resign; (b) any Trustee may be removed by written instrument, signed by at least two-thirds of the number of Trustees prior to such removal; (c) any Trustee who requests to be retired or who has become incapacitated by illness or injury may be retired by written instrument signed by a majority of the other Trustees; and (d) any Trustee may be removed at any special meeting of shareholders by a two-thirds vote of the outstanding voting securities of the trust. Each Trustee who is not an interested person (as defined in the 1940 Act) (Independent Trustee), shall retire not later than the last day of the calendar year in which his or her 75th birthday occurs. The Independent Trustees may waive this mandatory retirement age policy with respect to individual Trustees. The executive officers and Advisory Board Members hold office without limit in time, except that any officer and Advisory Board Member may resign or may be removed by a vote of a majority of the Trustees at any regular meeting or any special meeting of the Trustees. Except as indicated, each individual has held the office shown or other offices in the same company for the past five years.
Experience, Skills, Attributes, and Qualifications of the Fund's Trustees. The Governance and Nominating Committee has adopted a statement of policy that describes the experience, qualifications, attributes, and skills that are necessary and desirable for potential Independent Trustee candidates (Statement of Policy). The Board believes that each Trustee satisfied at the time he or she was initially elected or appointed a Trustee, and continues to satisfy, the standards contemplated by the Statement of Policy. The Governance and Nominating Committee also engages professional search firms to help identify potential Independent Trustee candidates who have the experience, qualifications, attributes, and skills consistent with the Statement of Policy. From time to time, additional criteria based on the composition and skills of the current Independent Trustees, as well as experience or skills that may be appropriate in light of future changes to board composition, business conditions, and regulatory or other developments, have also been considered by the professional search firms and the Governance and Nominating Committee. In addition, the Board takes into account the Trustees' commitment and participation in Board and committee meetings, as well as their leadership of standing and ad hoc committees throughout their tenure.
In determining that a particular Trustee was and continues to be qualified to serve as a Trustee, the Board has considered a variety of criteria, none of which, in isolation, was controlling. The Board believes that, collectively, the Trustees have balanced and diverse experience, qualifications, attributes, and skills, which allow the Board to operate effectively in governing the fund and protecting the interests of shareholders. Information about the specific experience, skills, attributes, and qualifications of each Trustee, which in each case led to the Board's conclusion that the Trustee should serve (or continue to serve) as a trustee of the fund, is provided below.
Annual Report
Board Structure and Oversight Function. James C. Curvey is an interested person (as defined in the 1940 Act) and currently serves as Chairman. The Trustees have determined that an interested Chairman is appropriate and benefits shareholders because an interested Chairman has a personal and professional stake in the quality and continuity of services provided to the fund. Independent Trustees exercise their informed business judgment to appoint an individual of their choosing to serve as Chairman, regardless of whether the Trustee happens to be independent or a member of management. The Independent Trustees have determined that they can act independently and effectively without having an Independent Trustee serve as Chairman and that a key structural component for assuring that they are in a position to do so is for the Independent Trustees to constitute a substantial majority for the Board. The Independent Trustees also regularly meet in executive session. Ned C. Lautenbach serves as Chairman of the Independent Trustees and as such (i) acts as a liaison between the Independent Trustees and management with respect to matters important to the Independent Trustees and (ii) with management prepares agendas for Board meetings.
Fidelity funds are overseen by different Boards of Trustees. The fund's Board oversees Fidelity's equity and high income funds and another Board oversees Fidelity's investment-grade bond, money market, and asset allocation funds. The asset allocation funds may invest in Fidelity funds overseen by the fund's Board. The use of separate Boards, each with its own committee structure, allows the Trustees of each group of Fidelity funds to focus on the unique issues of the funds they oversee, including common research, investment, and operational issues. On occasion, the separate Boards establish joint committees to address issues of overlapping consequences for the Fidelity funds overseen by each Board.
The Trustees operate using a system of committees to facilitate the timely and efficient consideration of all matters of importance to the Trustees, the fund, and fund shareholders and to facilitate compliance with legal and regulatory requirements and oversight of the fund's activities and associated risks. The Board, acting through its committees, has charged FMR and its affiliates with (i) identifying events or circumstances the occurrence of which could have demonstrably adverse effects on the fund's business and/or reputation; (ii) implementing processes and controls to lessen the possibility that such events or circumstances occur or to mitigate the effects of such events or circumstances if they do occur; and (iii) creating and maintaining a system designed to evaluate continuously business and market conditions in order to facilitate the identification and implementation processes described in (i) and (ii) above. Because the day-to-day operations and activities of the fund are carried out by or through FMR, its affiliates and other service providers, the fund's exposure to risks is mitigated but not eliminated by the processes overseen by the Trustees. While each of the Board's committees has responsibility for overseeing different aspects of the fund's activities, oversight is exercised primarily through the Operations, Audit, and Compliance Committees. In addition, the Independent Trustees have worked with FMR to enhance the Board's oversight of investment and financial risks, legal and regulatory risks, technology risks, and operational risks, including the development of additional risk reporting to the Board. For example, a working group comprised of Independent Trustees and FMR has worked and continues to work to review the Fidelity funds' valuation-related activities, reporting and risk management. Appropriate personnel, including but not limited to the fund's Chief Compliance Officer (CCO), FMR's internal auditor, the independent accountants, the fund's Treasurer and portfolio management personnel, make periodic reports to the Board's committees, as appropriate, including an annual review of FMR's risk management program for the Fidelity funds. The responsibilities of each standing committee, including their oversight responsibilities, are described further under "Standing Committees of the Fund's Trustees."
Annual Report
Trustees and Officers - continued
The fund's Statement of Additional Information (SAI) includes more information about the Trustees. To request a free copy, call Fidelity at 1-877-208-0098.
Interested Trustees*:
Correspondence intended for each Trustee who is an interested person may be sent to Fidelity Investments, 82 Devonshire Street, Boston, Massachusetts 02109.
Name, Age; Principal Occupations and Other Relevant Experience+ |
James C. Curvey (77) |
| Year of Election or Appointment: 2007 Mr. Curvey is Trustee and Chairman of the Board of Trustees of certain Trusts. Mr. Curvey also serves as Trustee (2007-present) of other investment companies advised by FMR. Mr. Curvey is a Director of Fidelity Investments Money Management, Inc. (2009-present), Director of Fidelity Research & Analysis Co. (2009-present) and Director of FMR and FMR Co., Inc. (2007-present). Mr. Curvey is also Vice Chairman (2007-present) and Director of FMR LLC. In addition, Mr. Curvey serves as an Overseer for the Boston Symphony Orchestra and a member of the Trustees of Villanova University. Previously, Mr. Curvey was the Vice Chairman (2006-2007) and Director (2000-2007) of FMR Corp. |
Ronald P. O'Hanley (55) |
| Year of Election or Appointment: 2011 Mr. O'Hanley is Director of FMR Co., Inc. (2010-present), Director of Fidelity Investments Money Management, Inc. (2010-present), Director of Fidelity Research & Analysis Company (2010-present), President of Fidelity Asset Management and Corporate Services and a member of Fidelity's Executive Committee (2010-present). Previously, Mr. O'Hanley served as President and Chief Executive Officer of BNY Mellon Asset Management (2007-2010). Mr. O'Hanley also served as Vice Chairman of Bank New York Mellon Corp. and a member of that firm's Executive Committee. Prior to the 2007 merger of The Bank of New York and Mellon Financial Corporation, he was Vice Chairman of Mellon Financial Corporation and President and Chief Executive Officer of Mellon Asset Management. He joined Mellon in February 1997. Mr. O'Hanley currently serves as Chairman of the Boston Public Library Foundation Board of Directors and sits on the Board of Directors of Beth Israel Deaconess Medical Center, the Board of Trustees of the Marine Biological Laboratory and the Advisory Board of the Maxwell School of Citizenship and Public Administration at Syracuse University. Mr. O'Hanley also chairs the Council on Asset Management for the Financial Services Roundtable and is a member of the Board of Directors of Institutional Investor's U.S. Institute. |
* Trustees have been determined to be "Interested Trustees" by virtue of, among other things, their affiliation with the trust or various entities under common control with FMR.
+ The information above includes each Trustee's principal occupation during the last five years and other information relating to the experience, attributes, and skills relevant to each Trustee's qualifications to serve as a Trustee, which led to the conclusion that each Trustee should serve as a Trustee for the fund.
Annual Report
Trustees and Officers - continued
Independent Trustees:
Correspondence intended for each Independent Trustee (that is, the Trustees other than the Interested Trustees) may be sent to Fidelity Investments, P.O. Box 55235, Boston, Massachusetts 02205-5235.
Name, Age; Principal Occupations and Other Relevant Experience+ |
Dennis J. Dirks (64) |
| Year of Election or Appointment: 2005 Prior to his retirement in May 2003, Mr. Dirks was Chief Operating Officer and a member of the Board of The Depository Trust & Clearing Corporation (DTCC). He also served as President, Chief Operating Officer, and Board member of The Depository Trust Company (DTC) and President and Board member of the National Securities Clearing Corporation (NSCC). In addition, Mr. Dirks served as Chief Executive Officer and Board member of the Government Securities Clearing Corporation, Chief Executive Officer and Board member of the Mortgage-Backed Securities Clearing Corporation, as a Trustee and a member of the Finance Committee of Manhattan College (2005-2008), and as a Trustee and a member of the Finance Committee of AHRC of Nassau County (2006-2008). Mr. Dirks is a member of the Independent Directors Council (IDC) Governing Council (2010-present) and Board of Directors for The Brookville Center for Children's Services, Inc. (2009-present). |
Alan J. Lacy (59) |
| Year of Election or Appointment: 2008 Mr. Lacy serves as Senior Adviser (2007-present) of Oak Hill Capital Partners, L.P. (private equity). Mr. Lacy also served as Chief Executive Officer (2000-2005) and Vice Chairman (2005-2006) of Sears Holdings Corporation and Sears, Roebuck and Co. (retail). In addition, Mr. Lacy serves as a member of the Board of Directors of Dave & Buster's Entertainment, Inc. (restaurant and entertainment complexes, 2010-present), Earth Fare, Inc. (retail grocery, 2012-present), The Hillman Companies, Inc. (hardware wholesalers, 2010-present), and Bristol-Myers Squibb Company (global pharmaceuticals, 2008-present). Mr. Lacy is a member of the Board of Trustees of The National Parks Conservation Association (2006-present). Previously, Mr. Lacy served as Chairman of the Board of Trustees of the National Parks Conservation Association (2008-2011) and as a member of the Board of Directors for the Western Union Company (global money transfer, 2006-2011). |
Ned C. Lautenbach (68) |
| Year of Election or Appointment: 2000 Mr. Lautenbach is Chairman of the Independent Trustees of the Equity and High Income Funds (2006-present). Mr. Lautenbach currently serves as the Lead Director of the Eaton Corporation Board of Directors (diversified industrial, 1997-present). Mr. Lautenbach is Chairman of the Board of Directors of the Philharmonic Center for the Arts in Naples, Florida (2012-present) and a member of the Council on Foreign Relations (1994-present). Previously, Mr. Lautenbach was a Partner/Advisory Partner at Clayton, Dubilier & Rice, LLC (private equity investment, 1998-2010), as well as a Director of Sony Corporation (2006-2007). |
Joseph Mauriello (68) |
| Year of Election or Appointment: 2008 Prior to his retirement in January 2006, Mr. Mauriello served in numerous senior management positions including Deputy Chairman and Chief Operating Officer (2004-2005), and Vice Chairman of Financial Services (2002-2004) of KPMG LLP US (professional services, 1965-2005). Mr. Mauriello currently serves as a member of the Board of Directors of XL Group plc. (global insurance and re-insurance, 2006-present). Previously, Mr. Mauriello served as a Director of the Hamilton Funds of the Bank of New York (2006-2007) and of Arcadia Resources Inc. (health care services and products, 2007-2012). |
Robert W. Selander (62) |
| Year of Election or Appointment: 2011 Previously, Mr. Selander served as a Member of the Advisory Board of Fidelity's Equity and High Income Funds (2011), Executive Vice Chairman (2010), Chief Executive Officer (2009-2010), and President and Chief Executive Officer (1997-2009) of Mastercard, Inc. |
Cornelia M. Small (68) |
| Year of Election or Appointment: 2005 Ms. Small is a member of the Board of Directors (2009-present) and Chair of the Investment Committee (2010-present) of the Teagle Foundation. Ms. Small also serves on the Investment Committee of the Berkshire Taconic Community Foundation (2008-present). Previously, Ms. Small served as Chairperson (2002-2008) and a member of the Investment Committee and Chairperson (2008-2012) and a member of the Board of Trustees of Smith College. In addition, Ms. Small served as Chief Investment Officer, Director of Global Equity Investments, and a member of the Board of Directors of Scudder, Stevens & Clark and Scudder Kemper Investments. |
William S. Stavropoulos (73) |
| Year of Election or Appointment: 2001 Mr. Stavropoulos is Vice Chairman of the Independent Trustees of the Equity and High Income Funds (2006-present). Mr. Stavropoulos serves as President and Founder of the Michigan Baseball Foundation, the Great Lakes Loons (2007-present). Mr. Stavropoulos is Chairman Emeritus of the Board of Directors of The Dow Chemical Company, where he previously served in numerous senior management positions, including President, CEO (1995-2000; 2002-2004), Chairman of the Executive Committee (2000-2006), and as a member of the Board of Directors (1990-2006). Currently, Mr. Stavropoulos is a Director of Univar Inc. (global distributor of commodity and specialty chemicals, Chairman from 2010-May 2012 and Lead Director from May 2012-present), Teradata Corporation (data warehousing and technology solutions, 2008-present), Maersk Inc. (industrial conglomerate), and Tyco International, Ltd. (multinational manufacturing and services, 2007-present), and a member of the Advisory Board for Metalmark Capital LLC (private equity investment, 2005-present). Mr. Stavropoulos is an operating advisor to Clayton, Dubilier & Rice, LLC (private equity investment). In addition, Mr. Stavropoulos is a member of the University of Notre Dame Advisory Council for the College of Science, a Trustee of the Rollin L. Gerstacker Foundation, and a Director of the Naples Philharmonic Center for the Arts. Previously, Mr. Stavropoulos served as a Director of Chemical Financial Corporation (bank holding company, 1993-2012). |
David M. Thomas (63) |
| Year of Election or Appointment: 2008 Previously, Mr. Thomas served as Executive Chairman (2005-2006) and Chairman and Chief Executive Officer (2000-2005) of IMS Health, Inc. (pharmaceutical and healthcare information solutions), and a Director of Fortune Brands, Inc. (consumer products, 2000-2011). In addition, Mr. Thomas serves as Non-Executive Chairman of the Board of Directors of Fortune Brands Home and Security (home and security products, 2011-present), and as a member of the Board of Directors of Interpublic Group of Companies, Inc. (marketing communication, 2004-present). |
Michael E. Wiley (62) |
| Year of Election or Appointment: 2008 Mr. Wiley also serves as a Director of Asia Pacific Exploration Consolidated (international oil and gas exploration and production, 2008-present). Mr. Wiley serves as a Director of Tesoro Corporation (independent oil refiner and marketer, 2005-present), and a Director of Bill Barrett Corporation (exploration and production, 2005-present). In addition, Mr. Wiley also serves as a Director of Post Oak Bank (privately-held bank, 2004-present). Previously, Mr. Wiley served as a member of the Board of Trustees of the University of Tulsa (2000-2006; 2007-2010), as a Senior Energy Advisor of Katzenbach Partners, LLC (consulting, 2006-2007), as an Advisory Director of Riverstone Holdings (private investment), Chairman, President, and CEO of Baker Hughes, Inc. (oilfield services, 2000-2004), and as Director of Spinnaker Exploration Company (exploration and production, 2001-2005). |
+ The information above includes each Trustee's principal occupation during the last five years and other information relating to the experience, attributes, and skills relevant to each Trustee's qualifications to serve as a Trustee, which led to the conclusion that each Trustee should serve as a Trustee for the fund.
Advisory Board Members and Executive Officers:
Correspondence intended for David A. Rosow and Garnett A. Smith may be sent to Fidelity Investments, P.O. Box 55235, Boston, Massachusetts 02205-5235. Correspondence intended for each executive officer, Edward C. Johnson 3d, and Peter S. Lynch may be sent to Fidelity Investments, 82 Devonshire Street, Boston, Massachusetts 02109.
Name, Age; Principal Occupation |
Edward C. Johnson 3d (82) |
| Year of Election or Appointment: 2011 Member of the Advisory Board of Fidelity's Equity and High Income Funds. Mr. Johnson serves as Chief Executive Officer, Chairman, and a Director of FMR LLC, and also serves as Chairman and Director of FIL Limited. Previously, Mr. Johnson served as a Trustee and Chairman of the Board of certain Fidelity Trusts, Chairman and a Director of FMR, Chairman and a Director of FMR Co., Inc., and President of FMR LLC (2006-2007). |
Peter S. Lynch (68) |
| Year of Election or Appointment: 2003 Member of the Advisory Board of Fidelity's Equity and High Income Funds. Mr. Lynch is Vice Chairman and a Director of FMR and FMR Co., Inc. In addition, Mr. Lynch serves as a Trustee of Boston College and as the Chairman of the Inner-City Scholarship Fund. Previously, Mr. Lynch served on the Special Olympics International Board of Directors (1997-2006). |
David A. Rosow (70) |
| Year of Election or Appointment: 2012 Member of the Advisory Board of Fidelity's Equity and High Income Funds. Chairman and Chief Executive Officer of International Golf Group, Inc. (golf course development, 1989-present). Previously, Mr. Rosow served as Chairman and Chief Executive Officer of Rosow & Company, Inc. (private investment company, 1989-2011), a Lead Director of Hudson United Bancorp (2001-2006) and as a Director of TD Banknorth (1996-2006). In addition, Mr. Rosow is a member (2008-present) and President (2009-present) of the Town Council of Palm Beach, Florida. |
Garnett A. Smith (65) |
| Year of Election or Appointment: 2012 Member of the Advisory Board of Fidelity's Equity and High Income Funds. Prior to Mr. Smith's retirement, he served as Chairman and Chief Executive Officer of Inbrand Corp. (manufacturer of personal absorbent products, 1990-1997). He also served as President (1986-1990) of Inbrand Corp. Prior to his employment with Inbrand Corp., he was employed by a retail fabric chain and North Carolina National Bank. In addition, Mr. Smith is a board member of the Jackson Hole Land Trust (2009-present). |
Kenneth B. Robins (43) |
| Year of Election or Appointment: 2008 President and Treasurer of Fidelity's Equity and High Income Funds. Mr. Robins also serves as President and Treasurer (2010-present) and Assistant Treasurer (2009-present) of other Fidelity funds and is an employee of Fidelity Investments (2004-present). Previously, Mr. Robins served as Deputy Treasurer of the Fidelity funds (2005-2008) and Treasurer and Chief Financial Officer of The North Carolina Capital Management Trust: Cash and Term Portfolios (2006-2008). |
Bruce T. Herring (47) |
| Year of Election or Appointment: 2006 Vice President of certain Equity Funds. Mr. Herring also serves as President of Fidelity Research & Analysis Company (2010-present), Chief Investment Officer and Director of Fidelity Management & Research (U.K.) Inc. (2010-present) and Group Chief Investment Officer of FMR. Previously, Mr. Herring served as Vice President (2005-2006) and Senior Vice President (2006-2007) of Fidelity Management & Research Company, Vice President of FMR Co., Inc. (2001-2007) and as a portfolio manager for Fidelity U.S. Equity Funds. |
Brian B. Hogan (48) |
| Year of Election or Appointment: 2009 Vice President of Equity and High Income Funds. Mr. Hogan also serves as President of FMR's Equity Division (2009-present). Previously, Mr. Hogan served as Senior Vice President, Equity Research of FMR (2006-2009) and as a portfolio manager. |
Scott C. Goebel (44) |
| Year of Election or Appointment: 2008 Secretary and Chief Legal Officer (CLO) of the Fidelity funds. Mr. Goebel also serves as Secretary of Fidelity Investments Money Management, Inc. (FIMM) (2010-present) and Fidelity Research and Analysis Company (FRAC) (2010-present); Secretary and CLO of The North Carolina Capital Management Trust: Cash and Term Portfolios (2008-present); General Counsel, Secretary, and Senior Vice President of FMR (2008-present) and FMR Co., Inc. (2008-present); employed by FMR LLC or an affiliate (2001-present); Chief Legal Officer of Fidelity Management & Research (Hong Kong) Limited (2008-present) and Assistant Secretary of Fidelity Management & Research (Japan) Inc. (2008-present), and Fidelity Management & Research (U.K.) Inc. (2008-present). Previously, Mr. Goebel served as Assistant Secretary of FIMM (2008-2010), FRAC (2008-2010), and the Funds (2007-2008) and as Vice President and Secretary of Fidelity Distributors Corporation (FDC) (2005-2007). |
William C. Coffey (43) |
| Year of Election or Appointment: 2009 Assistant Secretary of Fidelity's Equity and High Income Funds. Mr. Coffey also serves as Senior Vice President and Deputy General Counsel of FMR LLC (2010-present), and is an employee of Fidelity Investments. Previously, Mr. Coffey served as Vice President and Associate General Counsel of FMR LLC (2005-2009). |
Elizabeth Paige Baumann (44) |
| Year of Election or Appointment: 2012 Anti-Money Laundering (AML) Officer of the Fidelity funds. Ms. Baumann also serves as AML Officer of The North Carolina Capital Management Trust: Cash and Term Portfolios (2012-present), Chief AML Officer of FMR LLC (2012-present), and is an employee of Fidelity Investments. Previously, Ms. Baumann served as Vice President and Deputy Anti-Money Laundering Officer (2007-2012). |
Christine Reynolds (54) |
| Year of Election or Appointment: 2008 Chief Financial Officer of the Fidelity funds. Ms. Reynolds became President of Fidelity Pricing and Cash Management Services (FPCMS) in August 2008. Ms. Reynolds served as Chief Operating Officer of FPCMS (2007-2008). Previously, Ms. Reynolds served as President, Treasurer, and Anti-Money Laundering officer of the Fidelity funds (2004-2007). |
Joseph A. Hanlon (44) |
| Year of Election or Appointment: 2012 Chief Compliance Officer of Fidelity's Equity and High Income Funds. Mr. Hanlon serves as Compliance Officer of FMR, FMR Co., Inc., Fidelity Investments Money Management, Inc. (FIMM), Fidelity Research and Analysis Company (FRAC), Fidelity Management & Research (Japan) Inc., Fidelity Management & Research (U.K.) Inc., Fidelity Management & Research (Hong Kong), and Strategic Advisers, Inc. (2009-present), as Senior Vice President of the Fidelity Asset Management Division (2009-present), and is an employee of Fidelity Investments. |
Joseph F. Zambello (55) |
| Year of Election or Appointment: 2011 Deputy Treasurer of the Fidelity funds. Mr. Zambello is an employee of Fidelity Investments. Previously, Mr. Zambello served as Vice President of FMR's Program Management Group (2009-2011) and Vice President of the Transfer Agent Oversight Group (2005-2009). |
Adrien E. Deberghes (45) |
| Year of Election or Appointment: 2008 Deputy Treasurer of Fidelity's Equity and High Income Funds. Mr. Deberghes also serves as Vice President (2011-present) and Assistant Treasurer (2010-present) of other Fidelity funds, and is an employee of Fidelity Investments (2008-present). Previously, Mr. Deberghes served as Senior Vice President of Mutual Fund Administration at State Street Corporation (2007-2008), Senior Director of Mutual Fund Administration at Investors Bank & Trust (2005-2007), and Director of Finance for Dunkin' Brands (2000-2005). |
Stephen Sadoski (41) |
| Year of Election or Appointment: 2012 Deputy Treasurer of Fidelity's Equity and High Income Funds. Mr. Sadoski also serves as Assistant Treasurer of other Fidelity funds (2012-present) and is an employee of Fidelity Investments (2012-present). Previously, Mr. Sadoski served as an assistant chief accountant in the Division of Investment Management of the Securities and Exchange Commission (SEC) (2009-2012) and as a senior manager at Deloitte & Touche (1997-2009). |
Stephanie J. Dorsey (43) |
| Year of Election or Appointment: 2010 Assistant Treasurer of Fidelity's Equity and High Income Funds. Ms. Dorsey also serves as Deputy Treasurer of other Fidelity funds (2008-present) and is an employee of Fidelity Investments (2008-present). Previously, Ms. Dorsey served as Treasurer (2004-2008) of the JPMorgan Mutual Funds and Vice President (2004-2008) of JPMorgan Chase Bank. |
John R. Hebble (54) |
| Year of Election or Appointment: 2009 Assistant Treasurer of Fidelity's Equity and High Income Funds. Mr. Hebble also serves as President (2011-present), Treasurer, and Chief Financial Officer of The North Carolina Capital Management Trust: Cash and Term Portfolios (2008-present), President and Treasurer of other Fidelity funds (2008-present) and is an employee of Fidelity Investments. |
Gary W. Ryan (54) |
| Year of Election or Appointment: 2005 Assistant Treasurer of the Fidelity funds. Mr. Ryan is an employee of Fidelity Investments. Previously, Mr. Ryan served as Vice President of Fund Reporting in Fidelity Pricing and Cash Management Services (FPCMS) (1999-2005). |
Jonathan Davis (44) |
| Year of Election or Appointment: 2010 Assistant Treasurer of the Fidelity funds. Mr. Davis is also Assistant Treasurer of Fidelity Rutland Square Trust II and Fidelity Commonwealth Trust II. Mr. Davis is an employee of Fidelity Investments. Previously, Mr. Davis served as Vice President and Associate General Counsel of FMR LLC (2003-2010). |
Annual Report
Distributions (Unaudited)
The Board of Trustees of Advisor International Small Cap Fund voted to pay to shareholders of record at the opening of business on record date, the following distributions per share derived from capital gains realized from sales of portfolio securities, and dividends derived from net investment income:
| Pay Date | Record Date | Dividends | Capital Gains |
Class A | 12/10/12 | 12/07/12 | $0.074 | $0.327 |
| | | | |
Class T | 12/10/12 | 12/07/12 | $0.000 | $0.321 |
| | | | |
Class B | 12/10/12 | 12/07/12 | $0.000 | $0.078 |
| | | | |
Class C | 12/10/12 | 12/07/12 | $0.000 | $0.180 |
Class A designates 1%, Class T designates 1%, Class B designates 2%, and Class C designates 1% of the dividend distributed in December 2011 as indicated in the Corporate Qualifying memo distributed by the Tax department, during the fiscal year as qualifying for the dividends-received deduction for corporate shareholders.
Class A designates 79%, Class T designates 98%, Class B designates 100%, and Class C designates 100% of the dividends distributed during the fiscal year as amounts which may be taken into account as a dividend for purposes of the maximum rate under section 1(h)(11) of the Internal Revenue Code.
The amounts per share which represent income derived from sources within, and taxes paid to, foreign countries or possessions of the United States are as follows:
| Pay Date | Income | Taxes |
Class A | 12/05/2011 | $0.209 | $0.0215 |
Class T | 12/05/2011 | $0.168 | $0.0215 |
Class B | 12/05/2011 | $0.088 | $0.0215 |
Class C | 12/05/2011 | $0.108 | $0.0215 |
The fund will notify shareholders in January 2013 of amounts for use in preparing 2012 income tax returns.
Annual Report
Board Approval of Investment Advisory Contracts and Management Fees
Fidelity International Small Cap Fund
Each year, the Board of Trustees, including the Independent Trustees (together, the Board), votes on the renewal of the management contract and sub-advisory agreements (together, the Advisory Contracts) for the fund. The Board, assisted by the advice of fund counsel and Independent Trustees' counsel, requests and considers a broad range of information relevant to the renewal of the Advisory Contracts throughout the year.
The Board meets regularly and, at each of its meetings, considers factors that are relevant to its annual consideration of the renewal of the fund's Advisory Contracts, including the services and support provided to the fund and its shareholders. The Board has established various standing committees, each composed of and chaired by Independent Trustees with varying backgrounds, to which the Board has assigned specific subject matter responsibilities in order to enhance effective decision-making by the Board. The Board, acting directly and through its Committees, requests and receives information concerning the annual consideration of the renewal of the fund's Advisory Contracts. The Board also meets as needed to consider matters specifically related to the Board's annual consideration of the renewal of Advisory Contracts. Members of the Board may also meet with trustees of other Fidelity funds through ad hoc joint committees to discuss certain matters relevant to the Fidelity funds.
At its July 2012 meeting, the Board of Trustees, including the Independent Trustees, unanimously determined to renew the fund's Advisory Contracts. In reaching its determination, the Board considered all factors it believed relevant, including (i) the nature, extent, and quality of the services to be provided to the fund and its shareholders (including the investment performance of the fund); (ii) the competitiveness of the fund's management fee and total expense ratio relative to peer funds; (iii) the total costs of the services to be provided by and the profits to be realized by Fidelity from its relationship with the fund; (iv) the extent to which economies of scale exist and would be realized as the fund grows; and (v) whether fee levels reflect these economies of scale, if any, for the benefit of fund shareholders.
In considering whether to renew the Advisory Contracts for the fund, the Board reached a determination, with the assistance of fund counsel and Independent Trustees' counsel and through the exercise of its business judgment, that the renewal of the Advisory Contracts is in the best interests of the fund and its shareholders and that the compensation payable under the Advisory Contracts is fair and reasonable. The Board's decision to renew the Advisory Contracts was not based on any single factor, but rather was based on a comprehensive consideration of all the information provided to the Board at its meetings throughout the year. The Board, in reaching its determination to renew the Advisory Contracts, is aware that shareholders in the fund have a broad range of investment choices available to them, including a wide choice among mutual funds offered by Fidelity's competitors, and that the fund's shareholders, who have the opportunity to review and weigh the disclosure provided by the fund in its prospectus and other public disclosures, have chosen to invest in this fund, managed by Fidelity.
Annual Report
Board Approval of Investment Advisory Contracts and
Management Fees - continued
Nature, Extent, and Quality of Services Provided. The Board considered the staffing within the investment adviser, FMR, and the sub-advisers (together, the Investment Advisers), including the backgrounds of the fund's investment personnel, and also considered the fund's investment objective, strategies, and related investment philosophy. The Independent Trustees also had discussions with senior management of Fidelity's investment operations and investment groups. The Board considered the structure of the portfolio manager compensation program and whether this structure provides appropriate incentives to act in the best interests of the fund.
Resources Dedicated to Investment Management and Support Services. The Board and the Fund Oversight and Research Committees reviewed the general qualifications and capabilities of the Investment Advisers' investment staff, including its size, education, experience, and resources, as well as the Investment Advisers' approach to recruiting, training, managing, and compensating investment personnel. The Board also noted that FMR has continued to increase the resources devoted to non-U.S. offices, including expansion of Fidelity's global investment organization. The Board noted that Fidelity's analysts have extensive resources, tools and capabilities that allow them to conduct sophisticated quantitative and fundamental analysis, as well as credit analysis of issuers, counterparties and guarantors. The Board also believes that Fidelity's investment professionals have sufficient access to global information and data so as to provide competitive investment results over time, and that those professionals also have access to sophisticated tools that permit them to assess portfolio construction and risk and performance attribution characteristics continuously, as well as to transmit new information and research conclusions rapidly around the world. Additionally, in its deliberations, the Board considered the Investment Advisers' trading and risk management capabilities and resources, which are an integral part of the investment management process.
Shareholder and Administrative Services. The Board considered (i) the nature, extent, quality, and cost of advisory, administrative, and shareholder services performed by the Investment Advisers and their affiliates under the Advisory Contracts and under separate agreements covering transfer agency, pricing and bookkeeping, and securities lending services for the fund; (ii) the nature and extent of the supervision of third party service providers, principally custodians and subcustodians; and (iii) the resources devoted to, and the record of compliance with, the fund's compliance policies and procedures. The Board also reviewed the allocation of fund brokerage, including allocations to brokers affiliated with the Investment Advisers, the use of brokerage commissions to pay fund expenses, and the use of "soft" commission dollars to pay for research services.
Annual Report
The Board noted that the growth of fund assets over time across the complex allows Fidelity to reinvest in the development of services designed to enhance the value or convenience of the Fidelity funds as investment vehicles. These services include 24-hour access to account information and market information through telephone representatives and over the Internet, investor education materials and asset allocation tools, and the expanded availability of Fidelity Investor Centers.
Investment in a Large Fund Family. The Board considered the benefits to shareholders of investing in a Fidelity fund, including the benefits of investing in a fund that is part of a large family of funds offering a variety of investment disciplines and providing a large variety of mutual fund investor services. The Board noted that Fidelity had taken, or had made recommendations that resulted in the Fidelity funds taking, a number of actions over the previous year that benefited particular funds, including (i) continuing to dedicate additional resources to investment research and support of the senior management team that oversees asset management; (ii) persisting in efforts to enhance Fidelity's research capabilities, in particular, international research; (iii) launching new funds and making other enhancements to meet client needs for global and income-oriented solutions; (iv) continuing to launch dedicated lower cost underlying funds to meet investment management's portfolio construction needs related to expanding underlying fund options, specifically for the Freedom Fund product lines; (v) adopting a "Stock Selector" sector neutral investment approach and employing a team of portfolio managers who are sector specialists to manage certain funds; (vi) rationalizing product lines and gaining increased efficiencies through the mergers of several funds into other funds; (vii) strengthening the Spartan Index Fund product line by adding new funds and/or new low-cost institutional share classes, restructuring fund expenses to accommodate new classes, and reducing investment minimums for certain classes of shares; (viii) modifying the eligibility criteria for Institutional Class shares to increase their appeal to government entities and charitable investors; and (ix) reducing certain transfer agent fee rates.
Investment Performance. The Board considered whether the fund has operated in accordance with its investment objective, as well as its record of compliance with its investment restrictions. It also reviewed the fund's absolute investment performance for each class, as well as the fund's relative investment performance for each class measured over multiple periods against (i) a broad-based securities market index, and (ii) a peer group of mutual funds deemed appropriate by Fidelity and reviewed by the Board. The following charts considered by the Board show, over the one-, three-, and five-year periods ended December 31, 2011, the cumulative total returns of Institutional Class (Class I) and Class B of the fund, the cumulative total returns of a broad-based securities market index ("benchmark"), and a range of cumulative total returns of a peer group of mutual funds identified by Lipper Inc. as having an investment objective similar to that of the fund. The returns of Institutional Class (Class I) and Class B show the performance of the highest and lowest performing classes, respectively (based on five-year performance). The box within each chart shows the 25th percentile return (top of box) and the 75th percentile return (bottom of box) of the peer group. Returns shown above the box are in the first quartile and returns shown below the box are in the fourth quartile. The percentage beaten numbers noted below each chart correspond to the percentile box and represent the percentage of funds in the peer group whose performance was equal to or lower than that of the class indicated.
Annual Report
Board Approval of Investment Advisory Contracts and
Management Fees - continued
Fidelity International Small Cap Fund
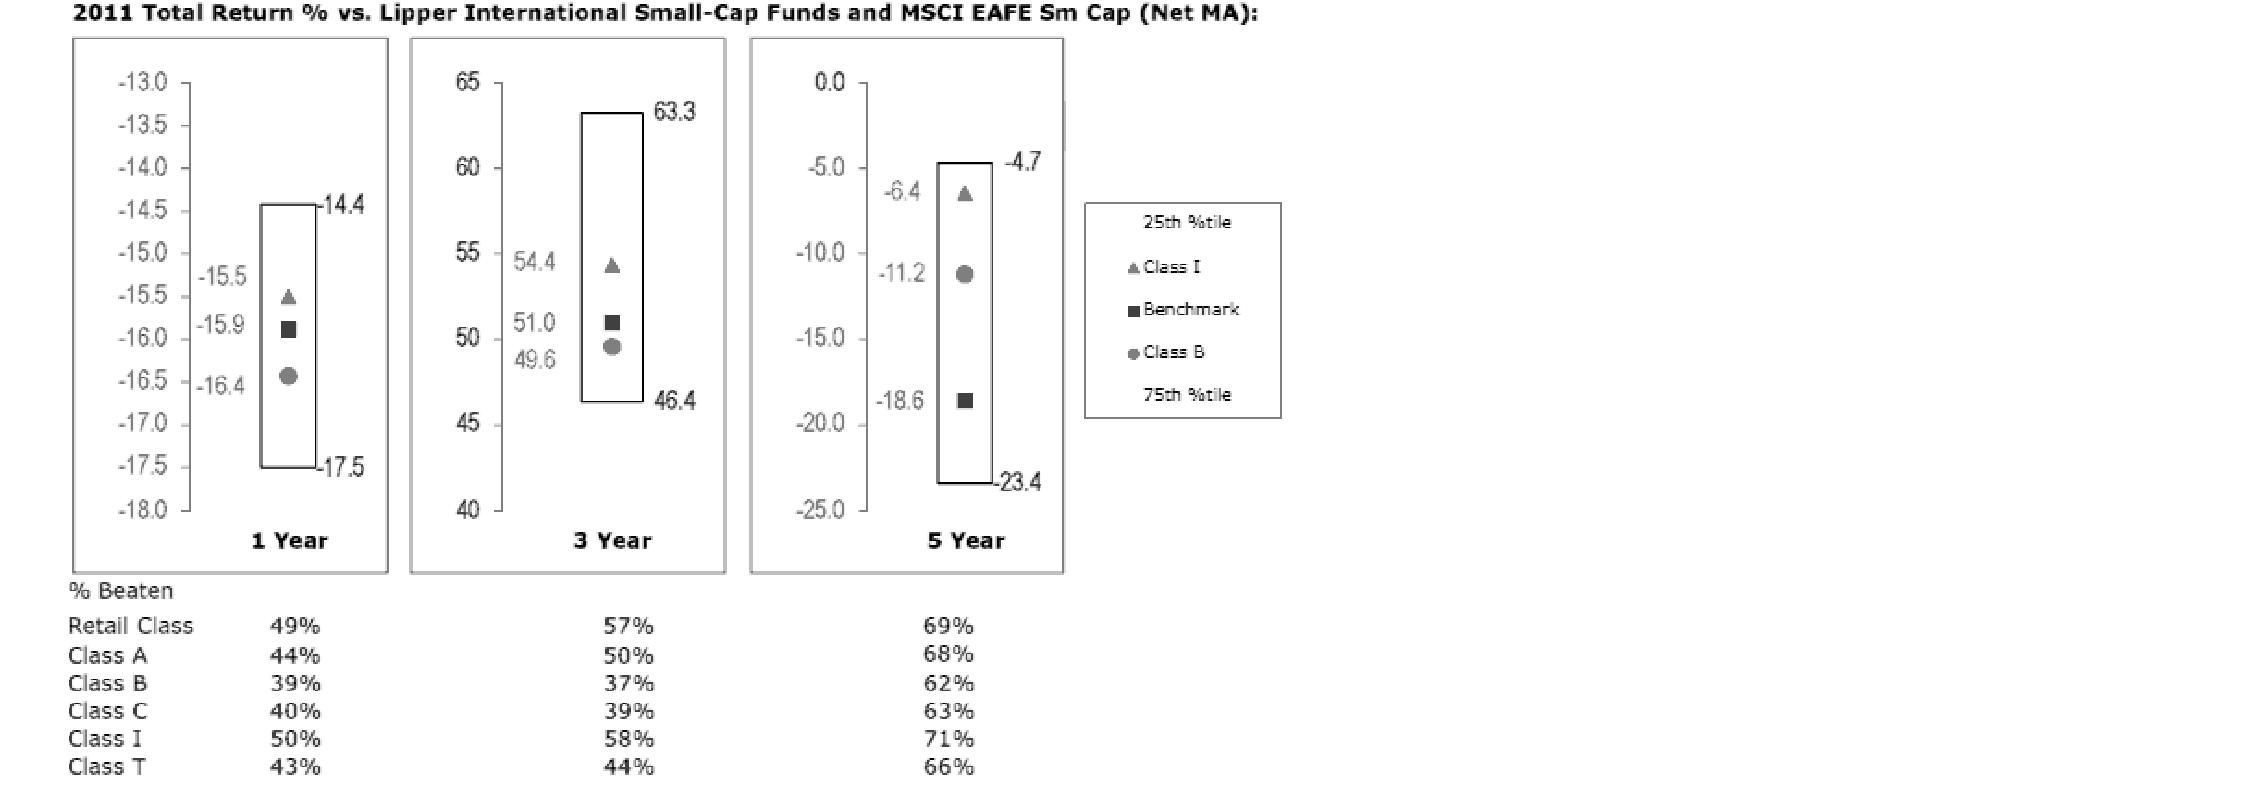
The Board reviewed the fund's relative investment performance against its peer group and noted that the performance of Institutional Class (Class I) of the fund was in the second quartile for all the periods shown. The Board also noted that the investment performance of Institutional Class (Class I) of the fund compared favorably to its benchmark for all the periods shown. The Board considered that the variations in performance among the fund's classes reflect the variations in class expenses, which result in lower performance for higher expense classes. The Board noted that there was a portfolio management change for the fund in November 2011. The Board also reviewed the fund's performance since inception as well as performance in the current year.
The Board also considered that the fund's management fee is subject to upward or downward adjustment depending upon whether, and to what extent, the fund's investment performance for the performance period exceeds, or is exceeded by, the record (over the same period) of a Board-approved performance adjustment index. The Board noted that the performance adjustment provides FMR with a strong economic incentive to seek to achieve superior performance for the fund's shareholders and helps to more closely align the interests of FMR and the fund's shareholders.
Annual Report
Based on its review, the Board concluded that the nature, extent, and quality of services provided to the fund under the Advisory Contracts should benefit the fund's shareholders.
Competitiveness of Management Fee and Total Expense Ratio. The Board considered the fund's management fee and total expense ratio compared to "mapped groups" of competitive funds and classes. Fidelity creates "mapped groups" by combining similar Lipper investment objective categories that have comparable management fee characteristics. Combining Lipper investment objective categories aids the Board's management fee and total expense ratio comparisons by broadening the competitive group used for comparison and by reducing the number of universes to which various Fidelity funds are compared.
Management Fee. The Board considered two proprietary management fee comparisons for the 12-month periods shown in the chart below. The group of Lipper funds used by the Board for management fee comparisons is referred to below as the "Total Mapped Group." The Total Mapped Group is broader than the Lipper peer group used by the Board for performance comparisons because the Total Mapped Group combines several Lipper investment objective categories while the Lipper peer group does not. The Total Mapped Group comparison focuses on a fund's standing relative to the total universe of comparable funds available to investors in terms of gross management fees before expense reimbursements or caps, and without giving effect to the fund's performance adjustment. "TMG %" represents the percentage of funds in the Total Mapped Group that had management fees that were lower than the fund's. For example, a TMG % of 19% means that 81% of the funds in the Total Mapped Group had higher management fees than the fund. The "Asset-Size Peer Group" (ASPG) comparison focuses on a fund's standing relative to non-Fidelity funds similar in size to the fund within the Total Mapped Group. The ASPG represents at least 15% of the funds in the Total Mapped Group with comparable asset size and management fee characteristics, subject to a minimum of 50 funds (or all funds in the Total Mapped Group if fewer than 50). Additional information, such as the ASPG quartile in which the fund's management fee ranked and the impact of the fund's performance adjustment, is also included in the chart and considered by the Board.
Annual Report
Board Approval of Investment Advisory Contracts and
Management Fees - continued
Fidelity International Small Cap Fund
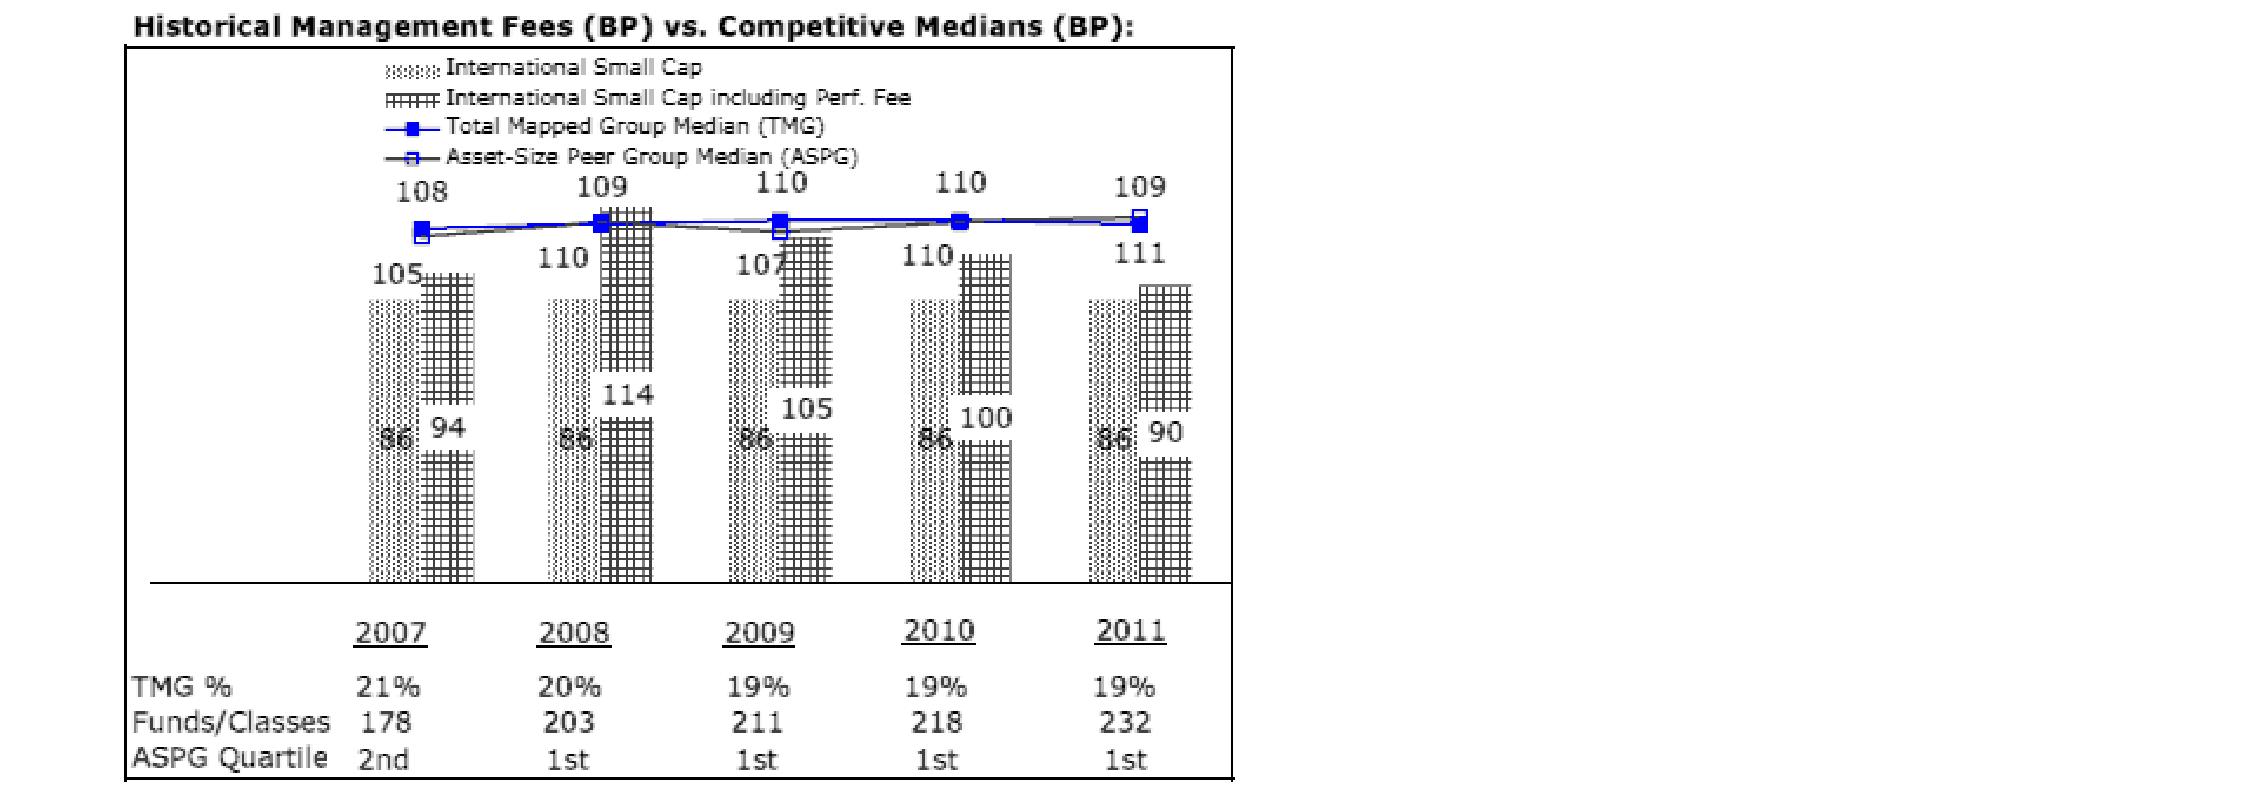
The Board noted that the fund's management fee ranked below the median of its Total Mapped Group and below the median of its ASPG for 2011. The Board also noted the effect of the fund's positive performance adjustment on the fund's management fee ranking. The Board noted that the performance adjustment for each year represents calculations for performance periods that differ from the periods shown in the performance charts above.
Based on its review, the Board concluded that the fund's management fee is fair and reasonable in light of the services that the fund receives and the other factors considered.
Total Expense Ratio. In its review of each class's total expense ratio, the Board considered the fund's management fee as well as other fund or class expenses, as applicable, such as transfer agent fees, pricing and bookkeeping fees, fund-paid 12b-1 fees, and custodial, legal, and audit fees. The Board also noted the effects of any waivers and reimbursements on fees and expenses, as well as the impact of the fund's performance adjustment. As part of its review, the Board also considered the current and historical total expense ratios of each class of the fund compared to competitive fund median expenses. Each class of the fund is compared to those funds and classes in the Total Mapped Group (used by the Board for management fee comparisons) that have a similar sales load structure.
The Board noted that the total expense ratio of each of Class A, Class B, Class C, Institutional Class, and the retail class ranked below its competitive median for 2011 and the total expense ratio of Class T ranked above its competitive median for 2011. The Board considered that various factors, including 12b-1 fees, positive or negative performance adjustments, and relatively higher other expenses in the case of small fund size, can affect total expense ratios. The Board noted that the total expense ratio of Class T was above the competitive median primarily because of higher 12b-1 fees on Class T. Class T has a higher 12b-1 fee, but a lower front-end sales charge, than traditionally priced front-end sales charge classes. The Board considered that Class T is primarily sold load-waived in the retirement plan market where its 0.50% 12b-1 fee is comparable to competing no-load, higher 12b-1 fee classes designed specifically for retirement plans. The Board noted that the fund offers multiple classes, each of which has a different sales load and 12b-1 fee structure, and that the multiple structures are intended to offer a range of pricing options for the intermediary market. The Board also noted that the total expense ratios of the classes vary primarily by the level of their 12b-1 fees, although differences in transfer agent fees may also cause expenses to vary from class to class.
Annual Report
Fees Charged to Other Fidelity Clients. The Board also considered Fidelity fee structures and other information with respect to clients of FMR and its affiliates, such as other mutual funds advised or subadvised by FMR or its affiliates, pension plan clients, and other institutional clients. The Board noted the findings of the 2010 ad hoc joint committee (created with the board of other Fidelity funds), which reviewed and compared Fidelity's institutional investment advisory business with its business of providing services to the Fidelity funds, including the differences in services provided, fees charged, and costs incurred, as well as competition in their respective marketplaces.
Based on its review of total expense ratios and fees charged to other Fidelity clients, the Board concluded that the total expense ratio of each class of the fund was reasonable, although Class T was above the median of the universe presented for comparison, in light of the services that the fund and its shareholders receive and the other factors considered.
Costs of the Services and Profitability. The Board considered the revenues earned and the expenses incurred by Fidelity in conducting the business of developing, marketing, distributing, managing, administering and servicing the fund and its shareholders. The Board also considered the level of Fidelity's profits in respect of all the Fidelity funds.
On an annual basis, FMR presents to the Board Fidelity's profitability for the fund. Fidelity calculates the profitability for each fund, as well as aggregate profitability for groups of Fidelity funds and all Fidelity funds, using a series of detailed revenue and cost allocation methodologies which originate with the books and records of Fidelity on which Fidelity's audited financial statements are based. The Audit Committee of the Board reviews any significant changes from the prior year's methodologies.
PricewaterhouseCoopers LLP (PwC), independent registered public accounting firm and auditor to Fidelity and certain Fidelity funds, has been engaged annually by the Board as part of the Board's assessment of Fidelity's profitability analysis. PwC's engagement includes the review and assessment of Fidelity's methodologies used in determining the revenues and expenses attributable to Fidelity's mutual fund business, and completion of agreed-upon procedures surrounding the mathematical accuracy of fund profitability and its conformity to allocation methodologies. After considering PwC's reports issued under the engagement and information provided by Fidelity, the Board concluded that while other allocation methods may also be reasonable, Fidelity's profitability methodologies are reasonable in all material respects.
Annual Report
Board Approval of Investment Advisory Contracts and
Management Fees - continued
The Board also reviewed Fidelity's non-fund businesses and fall-out benefits related to the mutual fund business as well as cases where Fidelity's affiliates may benefit from or be related to the fund's business.
The Board considered the costs of the services provided by and the profits realized by Fidelity in connection with the operation of the fund and was satisfied that the profitability was not excessive in the circumstances.
Economies of Scale. The Board considered whether there have been economies of scale in respect of the management of the Fidelity funds, whether the Fidelity funds (including the fund) have appropriately benefited from any such economies of scale, and whether there is potential for realization of any further economies of scale. The Board considered the extent to which the fund will benefit from economies of scale through increased services to the fund, through waivers or reimbursements, or through fee or expense reductions. The Board also noted that in 2009, it and the board of other Fidelity funds created an ad hoc committee (the Economies of Scale Committee) to analyze whether FMR attains economies of scale in respect of the management and servicing of the Fidelity funds, whether the Fidelity funds have appropriately benefited from such economies of scale, and whether there is potential for realization of any further economies of scale.
The Board recognized that the fund's management contract incorporates a "group fee" structure, which provides for lower group fee rates as total fund assets under FMR's management increase, and for higher group fee rates as total fund assets under FMR's management decrease. FMR calculates the group fee rates based on a tiered asset "breakpoint" schedule that varies based on asset class. The Board considered that the group fee is designed to deliver the benefits of economies of scale to fund shareholders when total Fidelity fund assets increase, even if assets of any particular fund are unchanged or have declined, because some portion of Fidelity's costs are attributable to services provided to all Fidelity funds, and all funds benefit if those costs can be allocated among more assets. The Board concluded that, given the group fee structure, fund shareholders will benefit from lower management fees as assets under FMR's management increase at the fund complex level, regardless of whether Fidelity achieves any such economies of scale.
Annual Report
The Board concluded, taking into account the analysis of the Economies of Scale Committee, that economies of scale, if any, are being appropriately shared between fund shareholders and Fidelity.
Additional Information Requested by the Board. In order to develop fully the factual basis for consideration of the Fidelity funds' Advisory Contracts, the Board requested and received additional information on certain topics, including (i) fund performance trends, actions to be taken by FMR to improve certain funds' overall performance, and Fidelity's long-term strategies for certain funds; (ii) the potential to further rationalize the Fidelity fund lineup with the possibility of achieving savings for the funds and Fidelity; (iii) Fidelity's compensation structure for portfolio managers and other key investment personnel; (iv) the amount of the investment that each portfolio manager has made in the Fidelity fund(s) that he or she manages; (v) the realization of fall-out benefits in certain Fidelity business units; (vi) Fidelity's group fee structures, the potential impact of regulatory changes on such structures, and the rationale for the individual fee rates of certain funds; (vii) fund profitability methodology, including Fidelity's cost allocation methodology, and the impact of certain factors on fund profitability results; (viii) trends regarding industry use of performance fee structures and the possibility of implementing performance fee structures for additional funds; and (ix) the impact of net redemptions from the Fidelity funds.
Based on its evaluation of all of the conclusions noted above, and after considering all factors it believed relevant, the Board ultimately concluded that the advisory fee structures are fair and reasonable, and that the fund's Advisory Contracts should be renewed.
Annual Report
Investment Adviser
Fidelity Management & Research Company
Boston, MA
Investment Sub-Advisers
FMR Co., Inc.
Fidelity Management & Research
(U.K.) Inc.
FIL Investment Advisors
FIL Investments (Japan) Limited
FIL Investment Advisors (UK) Ltd.
Fidelity Management & Research
(Hong Kong) Limited
Fidelity Management & Research
(Japan) Inc.
General Distributor
Fidelity Distributors Corporation
Smithfield, RI
Transfer and Service Agents
Fidelity Investments Institutional Operations Company, Inc.
Boston, MA
Fidelity Service Company, Inc.
Boston, MA
Custodian
The Bank of New York Mellon
New York, NY
(Fidelity Investment logo)(registered trademark)
AISC-UANN-1212
1.793568.109
(Fidelity Investment logo)(registered trademark)
Fidelity Advisor®
International Small Cap
Fund - Institutional Class
Annual Report
October 31, 2012
(Fidelity Cover Art)
Institutional Class is a class of
Fidelity® International Small Cap Fund
Contents
Performance | 4 | How the fund has done over time. |
Management's Discussion of Fund Performance | 5 | The Portfolio Managers' review of fund performance and strategy. |
Shareholder Expense Example | 6 | An example of shareholder expenses. |
Investment Changes | 8 | A summary of major shifts in the fund's investments over the past six months. |
Investments | 10 | A complete list of the fund's investments with their market values. |
Financial Statements | 25 | Statements of assets and liabilities, operations, and changes in net assets, as well as financial highlights. |
Notes | 35 | Notes to financial statements. |
Report of Independent Registered Public Accounting Firm | 48 | |
Trustees and Officers | 49 | |
Distributions | 61 | |
Board Approval of Investment Advisory Contracts and Management Fees | 61 | |
To view a fund's proxy voting guidelines and proxy voting record for the 12-month period ended June 30, visit http://www.fidelity.com/proxyvotingresults or visit the Securities and Exchange Commission's (SEC) web site at http://www.sec.gov. You may also call 1-877-208-0098 to request a free copy of the proxy voting guidelines.
Standard & Poor's, S&P and S&P 500 are registered service marks of The McGraw-Hill Companies, Inc. and have been licensed for use by Fidelity Distributors Corporation.
Other third party marks appearing herein are the property of their respective owners.
All other marks appearing herein are registered or unregistered trademarks or service marks of FMR LLC or an affiliated company. © 2012 FMR LLC. All rights reserved.
Annual Report
This report and the financial statements contained herein are submitted for the general information of the shareholders of the fund. This report is not authorized for distribution to prospective investors in the fund unless preceded or accompanied by an effective prospectus.
A fund files its complete schedule of portfolio holdings with the SEC for the first and third quarters of each fiscal year on Form N-Q. Forms N-Q are available on the SEC's web site at http://www.sec.gov. A fund's Forms N-Q may be reviewed and copied at the SEC's Public Reference Room in Washington, DC. Information regarding the operation of the SEC's Public Reference Room may be obtained by calling 1-800-SEC-0330. For a complete list of a fund's portfolio holdings, view the most recent holdings listing, semiannual report, or annual report on Fidelity's web site at http://www.fidelity.com, http://www.advisor.fidelity.com, or http://www.401k.com, as applicable.
NOT FDIC INSURED • MAY LOSE VALUE • NO BANK GUARANTEE
Neither the fund nor Fidelity Distributors Corporation is a bank.
Annual Report
Performance: The Bottom Line
Average annual total return reflects the change in the value of an investment, assuming reinvestment of the class' distributions from dividend income and capital gains (the profits earned upon the sale of securities that have grown in value, if any) and assuming a constant rate of performance each year. The $10,000 table and the fund's returns do not reflect the deduction of taxes that a shareholder would pay on fund distributions or the redemption of fund shares. During periods of reimbursement by Fidelity, a fund's total return will be greater than it would be had the reimbursement not occurred. How a fund did yesterday is no guarantee of how it will do tomorrow.
Average Annual Total Returns
Periods ended October 31, 2012 | Past 1
year | Past 5
years | Past 10
years |
Institutional Class A | 6.65% | -3.26% | 14.72% |
A The initial offering of Institutional Class shares took place on May 27, 2003. Returns prior to May 27, 2003 are those of Fidelity® International Small Cap Fund, the original class of the fund.
$10,000 Over 10 Years
Let's say hypothetically that $10,000 was invested in Fidelity Advisor® International Small Cap Fund - Institutional Class on October 31, 2002. The chart shows how the value of your investment would have changed, and also shows how the MSCI® EAFE® Small Cap Index performed over the same period. The initial offering of Institutional Class took place on May 27, 2003. See above for additional information regarding the performance of Institutional Class.
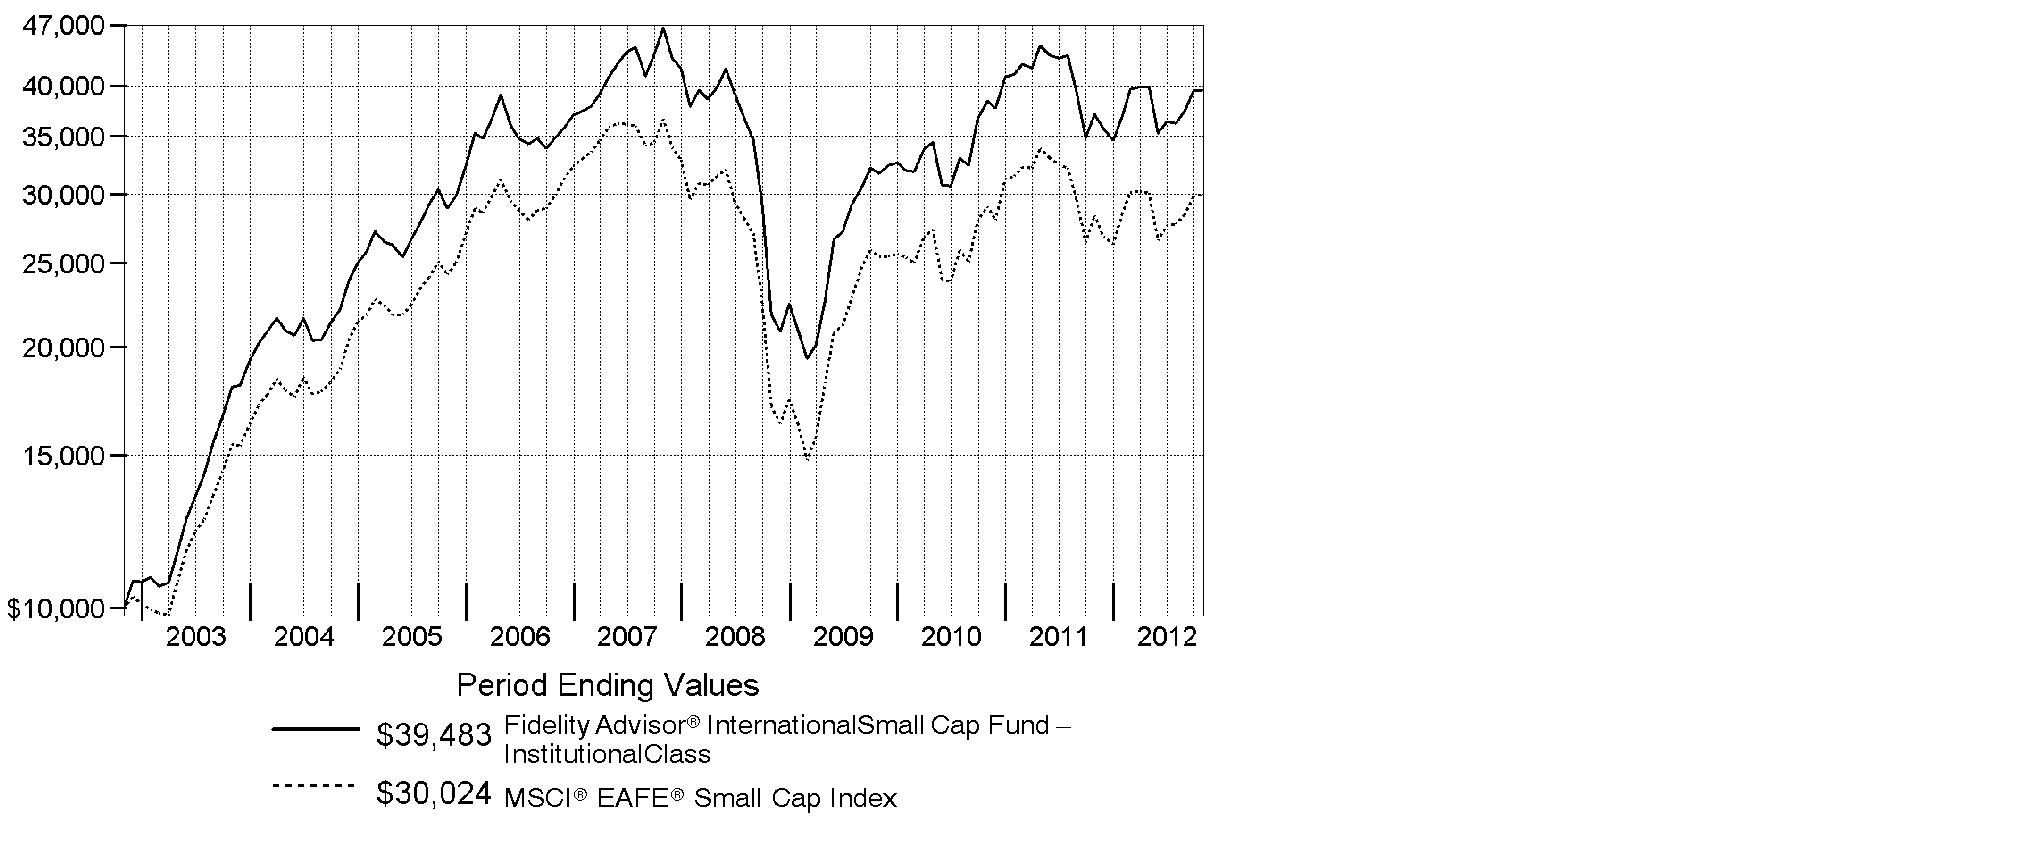
Annual Report
Management's Discussion of Fund Performance
Market Recap: International stocks experienced pendulum-like swings during the 12 months ending October 31, 2012, finishing the period with a modest advance. The market faced periodic bouts of volatility this past year, as a number of macroeconomic concerns - including the eurozone debt crisis, the strength and pace of the U.S. economic recovery, and a slowdown in China's once-blistering growth - dominated headlines and weighed on investors. While a stronger U.S. dollar provided an additional head wind, foreign developed- and emerging-markets stocks still managed a gain for the 12 months, as the MSCI® ACWI® (All Country World Index) ex USA Index rose 4.11%, largely buttressed in the summertime by pledges of accommodative monetary action from eurozone officials, as well as signs that the U.S. housing market was on the mend. Within the index, Asia-Pacific ex Japan showed the most impressive gains, advancing roughly 11%. A number of core European components, most notably Germany (+11%), Switzerland (+10%) and the U.K. (+9%), benefited from optimism about the eurozone's ability to resolve its debt woes, which also helped the region outpace the index overall. Elsewhere, results from Canada (+3%) and the generally more volatile emerging markets (+2%) each fell short of MSCI index, while Japan was among the few benchmark constituents to finish in the red, returning about -3%.
Comments from Colin Stone, Dale Nicholls and Nicholas Price, Co-Portfolio Managers of Fidelity Advisor® International Small Cap Fund: For the year, the fund's Institutional Class shares returned 6.65%, topping the 5.99% gain of the MSCI® EAFE® Small Cap Index. Stock selection in the Netherlands and France aided relative performance, while our choices in the U.K., Australia and Singapore hampered results. The Europe/Middle East/Africa subportfolio handily outperformed its benchmark's low double-digit gain. One key contributor was crude oil exploration and production holding Amerisur Resources, while performance was hampered by London Mining, an iron ore and coal developer. The Asia-Pacific ex Japan subportfolio fell short of its benchmark's modest gain. An out-of-benchmark stake in Singapore-based consumer electronics retailer Pertama Holdings, the subportfolio's largest position during the period, detracted. Performance was aided by Toyo-Thai, a Thailand-based construction and engineering firm. The Japanese subportfolio outpaced its benchmark, which declined slightly. A sizable overweighting in Pigeon, a leading producer and retailer of infant products, helped, while a large non-benchmark stake in online social gaming company GREE fared poorly.
The views expressed above reflect those of the portfolio manager(s) only through the end of the period as stated on the cover of this report and do not necessarily represent the views of Fidelity or any other person in the Fidelity organization. Any such views are subject to change at any time based upon market or other conditions and Fidelity disclaims any responsibility to update such views. These views may not be relied on as investment advice and, because investment decisions for a Fidelity fund are based on numerous factors, may not be relied on as an indication of trading intent on behalf of any Fidelity fund.
Annual Report
Shareholder Expense Example
As a shareholder of the Fund, you incur two types of costs: (1) transaction costs, including sales charges (loads) on purchase payments or redemption proceeds, redemption fees and (2) ongoing costs, including management fees, distribution and/or service (12b-1) fees and other Fund expenses. This Example is intended to help you understand your ongoing costs (in dollars) of investing in the Fund and to compare these costs with the ongoing costs of investing in other mutual funds.
The Example is based on an investment of $1,000 invested at the beginning of the period and held for the entire period (May 1, 2012 to October 31, 2012).
Actual Expenses
The first line of the accompanying table for each class of the Fund provides information about actual account values and actual expenses. You may use the information in this line, together with the amount you invested, to estimate the expenses that you paid over the period. Simply divide your account value by $1,000.00 (for example, an $8,600 account value divided by $1,000.00 = 8.6), then multiply the result by the number in the first line for a class of the Fund under the heading entitled "Expenses Paid During Period" to estimate the expenses you paid on your account during this period. A small balance maintenance fee of $12.00 that is charged once a year may apply for certain accounts with a value of less than $2,000. This fee is not included in the table below. If it was, the estimate of expenses you paid during the period would be higher, and your ending account value lower, by this amount. In addition, the Fund, as a shareholder in the underlying Fidelity Central Funds, will indirectly bear its pro-rata share of the fees and expenses incurred by the underlying Fidelity Central Funds. These fees and expenses are not included in the Fund's annualized expense ratio used to calculate the expense estimate in the table below.
Hypothetical Example for Comparison Purposes
The second line of the accompanying table for each class of the Fund provides information about hypothetical account values and hypothetical expenses based on a Class' actual expense ratio and an assumed rate of return of 5% per year before expenses, which is not the Class' actual return. The hypothetical account values and expenses may not be used to estimate the actual ending account balance or expenses you paid for the period. You may use this information to compare the ongoing costs of investing in the Fund and other funds. To do so, compare this 5% hypothetical example with the 5% hypothetical examples that appear in the shareholder reports of the other funds. A small balance maintenance fee of $12.00 that is charged once a year may apply for certain accounts with a value of less than $2,000. This fee is not included in the table below. If it was, the estimate of expenses you paid during the period would be higher, and your ending account value lower, by this amount. In addition, the Fund, as a shareholder in the underlying Fidelity Central Funds, will indirectly bear its pro-rata share of the fees and expenses incurred by the underlying Fidelity Central Funds. These fees and expenses are not included in the Fund's annualized expense ratio used to calculate the expense estimate in the table below.
Please note that the expenses shown in the table are meant to highlight your ongoing costs only and do not reflect any transaction costs. Therefore, the second line of the table is useful in comparing ongoing costs only, and will not help you determine the relative total costs of owning different funds. In addition, if these transactional costs were included, your costs would have been higher.
Annual Report
| Annualized Expense Ratio | Beginning
Account Value
May 1, 2012 | Ending
Account Value
October 31, 2012 | Expenses Paid
During Period*
May 1, 2012 to October 31, 2012 |
Class A | 1.64% | | | |
Actual | | $ 1,000.00 | $ 988.50 | $ 8.20 |
HypotheticalA | | $ 1,000.00 | $ 1,016.89 | $ 8.31 |
Class T | 1.89% | | | |
Actual | | $ 1,000.00 | $ 987.40 | $ 9.44 |
HypotheticalA | | $ 1,000.00 | $ 1,015.63 | $ 9.58 |
Class B | 2.37% | | | |
Actual | | $ 1,000.00 | $ 985.10 | $ 11.83 |
HypotheticalA | | $ 1,000.00 | $ 1,013.22 | $ 11.99 |
Class C | 2.39% | | | |
Actual | | $ 1,000.00 | $ 985.10 | $ 11.93 |
HypotheticalA | | $ 1,000.00 | $ 1,013.12 | $ 12.09 |
International Small Cap | 1.37% | | | |
Actual | | $ 1,000.00 | $ 990.10 | $ 6.85 |
HypotheticalA | | $ 1,000.00 | $ 1,018.25 | $ 6.95 |
Institutional Class | 1.24% | | | |
Actual | | $ 1,000.00 | $ 990.60 | $ 6.20 |
HypotheticalA | | $ 1,000.00 | $ 1,018.90 | $ 6.29 |
A 5% return per year before expenses
* Expenses are equal to each Class' annualized expense ratio, multiplied by the average account value over the period, multiplied by 184/366 (to reflect the one-half year period).
Annual Report
Investment Changes (Unaudited)
Geographic Diversification (% of fund's net assets) |
As of October 31, 2012 |
 | Japan 26.4% | |
 | United Kingdom 20.6% | |
 | Germany 7.6% | |
 | Australia 6.0% | |
 | France 4.2% | |
 | United States of America 3.8% | |
 | Cayman Islands 3.4% | |
 | Singapore 2.9% | |
 | Ireland 2.6% | |
| Other 22.5% | |

Percentages are based on country or territory of incorporation and are adjusted for the effect of futures contracts, if applicable. |
As of April 30, 2012 |
| Japan 27.2% | |
| United Kingdom 19.8% | |
| Germany 9.0% | |
| Australia 6.1% | |
| France 4.4% | |
| United States of America 3.2% | |
| Cayman Islands 3.2% | |
| Ireland 2.9% | |
| Bermuda 2.8% | |
| Other 21.4% | |

Percentages are based on country or territory of incorporation and are adjusted for the effect of futures contracts, if applicable. |
Asset Allocation |
| % of fund's
net assets | % of fund's net assets
6 months ago |
Stocks and Equity Futures | 96.2 | 97.4 |
Bonds | 0.2 | 0.1 |
Short-Term Investments and Net Other Assets (Liabilities) | 3.6 | 2.5 |
Top Ten Stocks as of October 31, 2012 |
| % of fund's
net assets | % of fund's net assets
6 months ago |
Nintendo Co. Ltd. (Japan, Software) | 2.2 | 1.8 |
ORIX Corp. (Japan, Diversified Financial Services) | 1.8 | 2.0 |
Pigeon Corp. (Japan, Household Products) | 1.8 | 1.3 |
Kakaku.com, Inc. (Japan, Internet Software & Services) | 1.6 | 1.4 |
Eurofins Scientific SA (France, Life Sciences Tools & Services) | 1.3 | 0.8 |
Pertama Holdings Ltd. (Singapore, Specialty Retail) | 1.3 | 1.1 |
AZ Electronic Materials SA (Luxembourg, Chemicals) | 1.1 | 0.9 |
Kubota Corp. (Japan, Machinery) | 1.1 | 1.0 |
IBS Group Holding Ltd. GDR (Reg. S) (Isle of Man, IT Services) | 1.0 | 1.0 |
Playtech Ltd. (Isle of Man, Software) | 1.0 | 0.8 |
| 14.2 | |
Market Sectors as of October 31, 2012 |
| % of fund's
net assets | % of fund's net assets
6 months ago |
Consumer Discretionary | 19.5 | 19.0 |
Information Technology | 19.5 | 17.8 |
Industrials | 13.4 | 14.8 |
Financials | 11.9 | 11.3 |
Materials | 10.3 | 13.2 |
Health Care | 9.7 | 9.3 |
Energy | 7.3 | 7.9 |
Consumer Staples | 3.9 | 2.2 |
Telecommunication Services | 0.6 | 1.1 |
Utilities | 0.3 | 0.3 |
Annual Report
Investments October 31, 2012
Showing Percentage of Net Assets
Common Stocks - 96.2% |
| Shares | | Value |
Australia - 6.0% |
Acrux Ltd. | 381,062 | | $ 1,281,619 |
Alkane Resources Ltd. | 823,400 | | 726,521 |
Ausgold Ltd. (a) | 1,195,693 | | 198,590 |
Austal Ltd. | 508,767 | | 646,954 |
Beach Energy Ltd. | 1,188,831 | | 1,703,011 |
Berkeley Resources Ltd. (a) | 739,724 | | 360,899 |
Carsales.com Ltd. (d) | 338,881 | | 2,624,245 |
Challenger Ltd. | 360,905 | | 1,210,079 |
Clinuvel Pharmaceuticals Ltd. (a) | 143,106 | | 240,653 |
Dart Energy Ltd. (a) | 2,059,222 | | 363,388 |
Goodman Group unit | 253,653 | | 1,166,439 |
Iluka Resources Ltd. | 80,327 | | 827,164 |
Independence Group NL | 189,529 | | 784,995 |
iProperty Group Ltd. (a) | 322,458 | | 307,949 |
Karoon Gas Australia Ltd. (a) | 467,228 | | 2,706,334 |
Linc Energy Ltd. (a)(d) | 508,182 | | 290,135 |
Maverick Drilling & Exploration Ltd. (a)(d) | 781,710 | | 839,855 |
Medusa Mining Ltd. | 198,265 | | 1,255,435 |
Mesoblast Ltd. (a)(d) | 175,066 | | 1,048,566 |
Mineral Deposits Ltd. (a) | 856,877 | | 4,358,458 |
Monto Minerals Ltd. (a) | 273,551 | | 1,988 |
Navitas Ltd. | 286,457 | | 1,225,110 |
New Standard Energy Ltd. (a) | 816,242 | | 266,900 |
Panaust Ltd. | 388,877 | | 1,344,234 |
Papillon Resources Ltd. (a)(d) | 197,313 | | 377,894 |
Ramsay Health Care Ltd. | 18,317 | | 451,772 |
realestate.com.au Ltd. | 61,870 | | 1,107,867 |
SAI Global Ltd. | 316,231 | | 1,332,750 |
SEEK Ltd. | 522,733 | | 3,630,148 |
Silver Lake Resources Ltd. (a)(d) | 211,056 | | 768,994 |
Sino Gas & Energy Ltd. (a) | 8,152,205 | | 634,680 |
SomnoMed Ltd. (a) | 531,849 | | 455,471 |
Spark Infrastructure Group unit | 1,255,671 | | 2,202,829 |
Starpharma Holdings Ltd. (a) | 795,432 | | 1,341,760 |
Sydney Airport unit | 156,262 | | 549,884 |
Tiger Resources Ltd. (a) | 11,335,520 | | 3,647,719 |
Tissue Therapies Ltd. (a) | 819,448 | | 314,732 |
Troy Resources NL | 258,575 | | 1,186,389 |
Universal Biosensors, Inc. (a) | 343,694 | | 328,230 |
TOTAL AUSTRALIA | | 44,110,640 |
Common Stocks - continued |
| Shares | | Value |
Bailiwick of Jersey - 1.1% |
Informa PLC | 854,423 | | $ 5,518,058 |
LXB Retail Properties PLC (a) | 1,387,800 | | 2,575,497 |
TOTAL BAILIWICK OF JERSEY | | 8,093,555 |
Belgium - 0.7% |
EVS Broadcast Equipment SA | 92,900 | | 5,383,636 |
Bermuda - 2.2% |
Asia Satellite Telecommunications Holdings Ltd. | 271,000 | | 863,698 |
Biosensors International Group Ltd. (a) | 1,422,000 | | 1,264,855 |
China Animal Healthcare Ltd. | 2,129,000 | | 453,796 |
China Singyes Solar Tech Holdings Ltd. | 981,600 | | 581,357 |
I.T Ltd. | 1,552,000 | | 616,791 |
Imagi International Holdings Ltd. (a) | 26,792,000 | | 383,728 |
Luk Fook Holdings International Ltd. | 612,000 | | 1,538,282 |
Oakley Capital Investments Ltd. (a) | 1,518,300 | | 3,319,962 |
PAX Global Technology Ltd. (a) | 1,769,000 | | 314,994 |
Petra Diamonds Ltd. (a) | 1,478,632 | | 2,374,212 |
REXLot Holdings Ltd. | 11,800,000 | | 852,640 |
Vostok Nafta Investment Ltd. SDR | 818,000 | | 2,022,524 |
Vtech Holdings Ltd. | 126,000 | | 1,496,545 |
TOTAL BERMUDA | | 16,083,384 |
Brazil - 0.6% |
Alpargatas SA (PN) | 553,200 | | 4,189,073 |
British Virgin Islands - 0.0% |
Kalahari Energy (a)(f) | 1,451,000 | | 15 |
Canada - 1.4% |
AirSea Lines (a)(f) | 1,893,338 | | 25 |
Banro Corp. (a) | 976,700 | | 4,518,001 |
Mood Media Corp. (a) | 175,300 | | 410,715 |
Mood Media Corp. (United Kingdom) (a) | 1,139,822 | | 2,667,112 |
Rock Well Petroleum, Inc. (a)(f) | 770,400 | | 8 |
Teranga Gold Corp. (a) | 1,272,499 | | 2,726,556 |
TOTAL CANADA | | 10,322,417 |
Cayman Islands - 3.4% |
21Vianet Group, Inc. ADR (a) | 42,300 | | 468,684 |
3SBio, Inc. sponsored ADR (a) | 39,000 | | 522,990 |
51job, Inc. sponsored ADR (a) | 19,200 | | 902,976 |
AirMedia Group, Inc. ADR (a) | 272,500 | | 618,575 |
Airtac International Group | 106,000 | | 497,159 |
AMVIG Holdings Ltd. | 764,000 | | 226,734 |
Common Stocks - continued |
| Shares | | Value |
Cayman Islands - continued |
AutoNavi Holdings Ltd. ADR (a) | 34,300 | | $ 368,039 |
Baidu.com, Inc. sponsored ADR (a) | 6,000 | | 639,720 |
Bitauto Holdings Ltd. ADR (a) | 82,500 | | 415,800 |
Changshouhua Food Co. Ltd. | 872,000 | | 450,062 |
China Automation Group Ltd. | 1,872,000 | | 444,446 |
China High Precision Automation Group Ltd. | 712,000 | | 102,527 |
China Lodging Group Ltd. ADR (a)(d) | 26,500 | | 451,030 |
China Medical System Holdings Ltd. | 1,255,000 | | 723,847 |
China Metal International Holdings, Inc. | 2,522,000 | | 439,313 |
China Metal Recycling (Holdings) Ltd. | 436,800 | | 436,797 |
China Outfitters Holdings Ltd. | 1,888,000 | | 321,567 |
China Tianyi Holdings Ltd. (a) | 2,492,000 | | 360,132 |
China ZhengTong Auto Services Holdings Ltd. (a) | 472,000 | | 319,740 |
CNinsure, Inc. ADR (a) | 31,900 | | 187,572 |
Convenience Retail Asia Ltd. | 700,000 | | 437,158 |
EVA Precision Industrial Holdings Ltd. | 9,338,000 | | 988,014 |
Fook Woo Group Holdings Ltd. (a) | 2,055,000 | | 181,634 |
Greatview Aseptic Pack Co. Ltd. | 1,196,000 | | 626,546 |
Haitian International Holdings Ltd. | 338,000 | | 417,373 |
Hop Hing Group Holdings Ltd. (a) | 7,392,000 | | 362,444 |
Hutchison China Meditech Ltd. (a) | 77,117 | | 555,658 |
Kingdee International Software Group Co. Ltd. (a) | 1,178,400 | | 244,802 |
KongZhong Corp. sponsored ADR (a) | 56,200 | | 331,018 |
Lee's Pharmaceutical Holdings Ltd. | 1,085,000 | | 664,996 |
Marwyn Value Investors II Ltd. (a) | 1,875,100 | | 3,820,253 |
Ming Fai International Holdings Ltd. | 9,133,000 | | 824,911 |
Perfect World Co. Ltd. sponsored ADR Class B | 34,900 | | 370,987 |
Royale Furniture Holdings Ltd. | 6,740,958 | | 565,367 |
Shenguan Holdings Group Ltd. | 3,154,000 | | 1,737,741 |
SINA Corp. (a) | 5,000 | | 273,150 |
Sino Prosper State Gold Resources Holdings, Ltd. (a) | 7,495,000 | | 333,646 |
Sitoy Group Holdings Ltd. | 219,000 | | 126,878 |
SouFun Holdings Ltd. ADR (d) | 51,000 | | 921,570 |
Trauson Holdings Co. Ltd. | 1,237,000 | | 646,428 |
VanceInfo Technologies, Inc. ADR (a) | 38,100 | | 290,322 |
VisionChina Media, Inc. ADR (a)(d) | 172,100 | | 37,862 |
VST Holdings Ltd. | 1,858,000 | | 326,047 |
WuXi PharmaTech Cayman, Inc. sponsored ADR (a) | 42,300 | | 600,237 |
Yip's Chemical Holdings Ltd. | 592,000 | | 399,502 |
TOTAL CAYMAN ISLANDS | | 24,982,254 |
Common Stocks - continued |
| Shares | | Value |
China - 0.1% |
NQ Mobile, Inc. ADR (a)(d) | 33,300 | | $ 231,768 |
Travelsky Technology Ltd. (H Shares) | 877,000 | | 452,642 |
TOTAL CHINA | | 684,410 |
Cyprus - 0.6% |
Buried Hill Energy (Cyprus) PCL (a)(f) | 1,947,000 | | 4,380,750 |
France - 4.2% |
Altamir Amboise | 531,000 | | 4,762,729 |
ALTEN | 118,100 | | 3,714,373 |
Audika SA | 113,900 | | 1,353,781 |
Axway Software SA | 4,544 | | 71,089 |
Eurofins Scientific SA | 63,899 | | 9,880,747 |
Ipsos SA | 124,772 | | 4,384,317 |
Sartorius Stedim Biotech | 51,600 | | 4,662,967 |
Sopra Group SA | 39,300 | | 1,854,678 |
TOTAL FRANCE | | 30,684,681 |
Germany - 7.6% |
Bertrandt AG | 64,300 | | 5,379,755 |
Brenntag AG | 40,600 | | 5,117,128 |
CENTROTEC Sustainable AG | 231,049 | | 4,168,680 |
CTS Eventim AG | 193,820 | | 5,752,933 |
GFK AG | 142,601 | | 6,493,158 |
Lanxess AG | 70,485 | | 5,822,318 |
MTU Aero Engines Holdings AG | 67,300 | | 5,650,817 |
Rational AG | 15,520 | | 3,924,680 |
RIB Software AG | 379,800 | | 2,358,011 |
Stroer Out-of-Home Media AG (a) | 14,753 | | 130,030 |
United Internet AG | 200,152 | | 4,004,256 |
Wirecard AG | 289,100 | | 6,606,260 |
TOTAL GERMANY | | 55,408,026 |
Hong Kong - 0.8% |
Dah Sing Financial Holdings Ltd. | 164,261 | | 631,606 |
Guotai Junan International Holdings Ltd. | 1,331,000 | | 395,004 |
Magnificent Estates Ltd. | 29,588,000 | | 1,431,668 |
Singamas Container Holdings Ltd. | 3,164,000 | | 800,181 |
Techtronic Industries Co. Ltd. | 1,053,500 | | 2,006,395 |
YGM Trading Ltd. | 152,000 | | 365,190 |
TOTAL HONG KONG | | 5,630,044 |
Common Stocks - continued |
| Shares | | Value |
Iceland - 0.5% |
Ossur hf (a) | 2,571,700 | | $ 3,395,957 |
India - 1.2% |
Ahluwalia Contracts (India) Ltd. | 230,314 | | 172,077 |
Britannia Industries Ltd. (a) | 31,695 | | 284,904 |
Educomp Solutions Ltd. | 44,518 | | 121,999 |
Financial Technologies India Ltd. | 23,352 | | 431,972 |
Geodesic Ltd. | 256,340 | | 189,140 |
Manappuram General Finance & Leasing Ltd. | 367,032 | | 251,373 |
MT Educare Ltd. | 146,984 | | 285,472 |
Page Industries Ltd. | 87,661 | | 5,462,255 |
PI Industries Ltd. | 37,878 | | 351,993 |
Shriram City Union Finance Ltd. (a) | 739 | | 10,725 |
Thangamayil Jewellery Ltd. | 253,192 | | 1,178,316 |
WABCO India Ltd. | 10,191 | | 303,779 |
TOTAL INDIA | | 9,044,005 |
Indonesia - 1.0% |
PT Clipan Finance Indonesia Tbk | 13,895,400 | | 578,671 |
PT Clipan Finance Indonesia Tbk warrants 10/7/14 (a) | 2,275,700 | | 12,320 |
PT Mayora Indah Tbk | 352,000 | | 866,712 |
PT Media Nusantara Citra Tbk | 8,838,500 | | 2,599,548 |
PT Mitra Adiperkasa Tbk | 588,000 | | 400,977 |
PT MNC Sky Vision Tbk | 1,805,500 | | 408,844 |
PT Nippon Indosari Corpindo Tbk | 1,225,000 | | 765,223 |
PT Pembangunan Perumahan Persero Tbk | 4,982,500 | | 399,428 |
PT Tiga Pilar Sejahtera Food Tbk | 5,685,000 | | 532,689 |
PT Tower Bersama Infrastructure Tbk (a) | 1,383,000 | | 719,934 |
TOTAL INDONESIA | | 7,284,346 |
Ireland - 2.6% |
Glanbia PLC | 281,700 | | 2,672,718 |
Kenmare Resources PLC (a) | 11,137,400 | | 7,083,151 |
Paddy Power PLC (Ireland) | 88,784 | | 6,552,506 |
Petroceltic International PLC (a) | 22,766,000 | | 2,531,292 |
TOTAL IRELAND | | 18,839,667 |
Isle of Man - 2.4% |
Exillon Energy PLC (a) | 1,067,800 | | 2,683,825 |
IBS Group Holding Ltd. GDR (Reg. S) (a) | 336,400 | | 7,586,833 |
Playtech Ltd. | 1,083,636 | | 7,407,568 |
TOTAL ISLE OF MAN | | 17,678,226 |
Common Stocks - continued |
| Shares | | Value |
Israel - 0.1% |
Sarin Technologies Ltd. | 957,750 | | $ 773,392 |
Italy - 1.1% |
Brunello Cucinelli SpA (d) | 172,000 | | 3,043,101 |
Salvatore Ferragamo Italia SpA (d) | 244,915 | | 4,974,388 |
TOTAL ITALY | | 8,017,489 |
Japan - 26.4% |
ACOM Co. Ltd. (a) | 60,890 | | 1,797,792 |
Aeon Credit Service Co. Ltd. | 344,600 | | 7,312,444 |
Aeon Mall Co. Ltd. | 45,300 | | 1,175,201 |
Ajinomoto Co., Inc. | 125,000 | | 1,908,744 |
ARNEST ONE Corp. | 39,700 | | 589,309 |
Asahi Holdings, Inc. | 65,300 | | 1,101,012 |
ASAHI INTECC Co. Ltd. (d) | 109,500 | | 3,249,474 |
Avex Group Holdings, Inc. | 118,100 | | 2,334,483 |
CAC Corp. | 44,800 | | 377,121 |
Chiyoda Co. Ltd. | 66,700 | | 1,908,340 |
Citizen Holdings Co. Ltd. | 692,900 | | 3,515,276 |
CyberAgent, Inc. (d) | 3,280 | | 6,557,535 |
DeNA Co. Ltd. (d) | 107,500 | | 3,354,409 |
Enigmo, Inc. | 25,300 | | 2,383,264 |
Fields Corp. | 72,300 | | 1,039,714 |
Fuji Corp. | 35,700 | | 522,777 |
Fuji Spinning Co. Ltd. | 679,000 | | 2,806,840 |
GMO Internet, Inc. | 191,800 | | 1,340,654 |
GOLDWIN, Inc. (d) | 204,000 | | 1,249,605 |
GREE, Inc. (d) | 170,100 | | 2,966,043 |
Hajime Construction Co. Ltd. | 52,500 | | 1,653,326 |
Hitachi Chemical Co. Ltd. | 182,500 | | 2,571,871 |
Hitachi Metals Ltd. | 339,000 | | 3,172,153 |
Hitachi Transport System Ltd. | 97,000 | | 1,454,453 |
Honda Motor Co. Ltd. | 181,900 | | 5,468,505 |
Hoshizaki Electric Co. Ltd. | 128,800 | | 3,505,980 |
Iida Home Max Co., Ltd. | 125,000 | | 1,102,342 |
ITC Networks Corp. | 27,300 | | 218,865 |
Iwatsuka Confectionary Co. Ltd. | 11,600 | | 434,183 |
JSP Corp. | 59,400 | | 767,892 |
K'S Denki Corp. (d) | 52,300 | | 1,400,039 |
Kakaku.com, Inc. (d) | 338,200 | | 11,586,834 |
Kao Corp. | 35,000 | | 982,964 |
KAWAI Musical Instruments Manufacturing Co. Ltd. | 693,000 | | 1,449,718 |
Kitz Corp. | 44,900 | | 189,544 |
Common Stocks - continued |
| Shares | | Value |
Japan - continued |
Kobe Bussan Co. Ltd. | 7,300 | | $ 191,942 |
Koshidaka Holdings Co. Ltd. | 41,900 | | 1,149,455 |
Kubota Corp. | 761,000 | | 7,778,730 |
Makita Corp. | 92,500 | | 3,655,737 |
Maruwa Ceramic Co. Ltd. (d) | 9,900 | | 291,432 |
Megachips Corp. | 88,200 | | 1,968,839 |
Mitsubishi Gas Chemical Co., Inc. | 9,000 | | 44,419 |
Mizuho Financial Group, Inc. | 302,700 | | 473,629 |
Nichias Corp. (d) | 417,000 | | 2,042,428 |
Nikkiso Co. Ltd. | 525,000 | | 6,254,228 |
Nintendo Co. Ltd. | 127,900 | | 16,470,142 |
Nippon Seiki Co. Ltd. | 33,000 | | 317,061 |
Nitta Corp. | 153,100 | | 2,355,090 |
Nitta Gelatin, Inc. | 116,400 | | 944,848 |
NSD Co. Ltd. | 24,900 | | 238,301 |
Olympus Corp. (a)(d) | 204,500 | | 3,571,001 |
Origin Electric Co. Ltd. | 332,000 | | 1,285,081 |
ORIX Corp. | 130,390 | | 13,393,436 |
Pacific Metals Co. Ltd. | 166,000 | | 563,522 |
Pal Co. Ltd. | 35,250 | | 1,799,371 |
Pigeon Corp. | 284,300 | | 13,105,649 |
Rohto Pharmaceutical Co. Ltd. | 176,000 | | 2,429,563 |
Round One Corp. | 62,800 | | 317,815 |
Ryohin Keikaku Co. Ltd. | 5,800 | | 384,342 |
Sawada Holdings Co. Ltd. (a) | 271,700 | | 1,494,129 |
Seven & i Holdings Co., Ltd. | 6,800 | | 209,716 |
Shimadzu Corp. | 293,000 | | 1,970,951 |
SHIMANO, Inc. | 11,600 | | 730,903 |
Shin-Etsu Chemical Co., Ltd. | 3,300 | | 186,020 |
Shinko Kogyo Co. Ltd. | 239,200 | | 1,246,489 |
Shinko Shoji Co. Ltd. | 2,800 | | 24,237 |
Sosei Group Corp. (a) | 1,170 | | 3,231,680 |
Stanley Electric Co. Ltd. | 245,000 | | 3,375,924 |
STELLA CHEMIFA Corp. | 9,700 | | 182,262 |
Sugi Holdings Co. Ltd. | 600 | | 21,684 |
Sumitomo Chemical Co. Ltd. | 68,000 | | 190,805 |
Sumitomo Metal Mining Co. Ltd. | 88,000 | | 1,158,562 |
Sysmex Corp. | 500 | | 23,519 |
Taiheiyo Cement Corp. | 345,000 | | 734,686 |
Takara Leben Co. Ltd. | 445,200 | | 4,768,207 |
Toho Real Estate Co. Ltd. | 3,000 | | 16,385 |
Tokyu Land Corp. | 85,000 | | 477,014 |
Common Stocks - continued |
| Shares | | Value |
Japan - continued |
Topcon Corp. (d) | 421,500 | | $ 1,995,829 |
Toyo Engineering Corp. | 713,000 | | 2,947,388 |
Toyo Kanetsu KK | 398,000 | | 772,767 |
Tsukui Corp. | 26,500 | | 615,777 |
Uchiyama Holdings Co. Ltd. | 7,100 | | 129,851 |
Unicharm Corp. | 1,700 | | 91,995 |
WebCrew, Inc. | 90,300 | | 565,577 |
West Holdings Corp. (d) | 10,700 | | 135,911 |
Yamato Kogyo Co. Ltd. | 40,200 | | 1,128,501 |
Yamaya Corp. | 44,700 | | 641,691 |
TOTAL JAPAN | | 193,543,227 |
Korea (South) - 0.5% |
Daou Technology, Inc. | 87,960 | | 1,250,440 |
Genic Co. Ltd. (a) | 9,627 | | 523,590 |
Korea Plant Service & Engineering Co. Ltd. | 12,424 | | 683,689 |
SBS Contents Hub Co. Ltd. | 35,022 | | 525,176 |
Soulbrain Co. Ltd. | 11,656 | | 469,310 |
TOTAL KOREA (SOUTH) | | 3,452,205 |
Luxembourg - 1.1% |
AZ Electronic Materials SA | 1,467,500 | | 8,395,191 |
Malaysia - 0.1% |
JobStreet Corp. Bhd | 1,223,100 | | 915,518 |
Netherlands - 1.3% |
Gemalto NV | 81,831 | | 7,384,263 |
Ichor Coal NV (a) | 355,000 | | 1,932,560 |
TOTAL NETHERLANDS | | 9,316,823 |
Norway - 2.2% |
Aker Solutions ASA | 357,100 | | 7,015,102 |
Schibsted ASA (B Shares) | 195,600 | | 7,324,750 |
Sevan Drilling ASA (a)(d) | 2,185,100 | | 1,694,025 |
TOTAL NORWAY | | 16,033,877 |
Singapore - 2.9% |
Amtek Engineering Ltd. | 2,949,000 | | 1,450,566 |
CSE Global Ltd. | 1,069,000 | | 758,063 |
First Resources Ltd. | 71,000 | | 119,323 |
Goodpack Ltd. | 1,220,000 | | 1,940,318 |
Mapletree Industrial (REIT) | 1,424,000 | | 1,634,366 |
OSIM International Ltd. | 1,092,000 | | 1,454,747 |
Common Stocks - continued |
| Shares | | Value |
Singapore - continued |
Pertama Holdings Ltd. (e) | 23,060,000 | | $ 9,679,226 |
Petra Foods Ltd. | 370,000 | | 794,720 |
Phorm Corp. Ltd. (a) | 1,308,800 | | 1,520,695 |
Raffles Medical Group Ltd. | 368,205 | | 739,549 |
Sino Grandness Food Industry Group Ltd. (a) | 310,000 | | 121,987 |
Venture Corp. Ltd. | 212,000 | | 1,329,562 |
TOTAL SINGAPORE | | 21,543,122 |
South Africa - 0.3% |
Blue Label Telecoms Ltd. | 3,094,900 | | 2,405,774 |
Sweden - 0.9% |
Avanza Bank Holding AB | 162,600 | | 3,192,970 |
Elekta AB (B Shares) | 266,400 | | 3,795,444 |
TOTAL SWEDEN | | 6,988,414 |
Switzerland - 1.3% |
Sika AG (Bearer) | 1,610 | | 3,358,993 |
VZ Holding AG | 51,930 | | 6,189,445 |
TOTAL SWITZERLAND | | 9,548,438 |
Taiwan - 0.2% |
Pacific Hospital Supply Co. Ltd. | 114,400 | | 333,291 |
Tong Hsing Electronics Industries Ltd. | 158,721 | | 551,530 |
Topoint Technology Co. Ltd. | 571,927 | | 322,088 |
TOTAL TAIWAN | | 1,206,909 |
Thailand - 0.6% |
Toyo-Thai Corp. PCL | 5,276,700 | | 4,688,297 |
United Kingdom - 20.6% |
Aberdeen Asset Management PLC | 1,183,800 | | 6,199,109 |
Amerisur Resources PLC (a)(d) | 7,753,224 | | 5,880,530 |
Ashmore Group PLC | 897,400 | | 5,267,028 |
ASOS PLC (a)(d) | 188,176 | | 6,847,736 |
Avanti Communications Group PLC (a)(d) | 659,800 | | 2,842,889 |
Aveva Group PLC | 186,000 | | 5,973,134 |
Bond International Software PLC | 843,266 | | 700,823 |
Brammer PLC | 1,267,600 | | 4,914,529 |
Central Asia Metals PLC (a) | 1,336,700 | | 2,113,958 |
Craneware PLC | 791,600 | | 5,528,141 |
Faroe Petroleum PLC (a) | 480,947 | | 1,179,715 |
Hunting PLC | 194,900 | | 2,354,181 |
IG Group Holdings PLC | 719,702 | | 5,057,980 |
Common Stocks - continued |
| Shares | | Value |
United Kingdom - continued |
International Personal Finance PLC | 1,298,800 | | $ 7,272,907 |
John Wood Group PLC | 383,900 | | 5,262,811 |
Johnson Matthey PLC | 106,195 | | 3,854,160 |
Keronite PLC (a)(f) | 13,620,267 | | 220 |
London Mining PLC (a)(d) | 1,460,045 | | 3,593,125 |
Moneysupermarket.com Group PLC | 2,714,800 | | 5,870,551 |
Monitise PLC (a) | 11,841,415 | | 7,070,361 |
Mothercare PLC | 327,400 | | 1,466,148 |
NCC Group Ltd. | 218,315 | | 3,170,753 |
Ocado Group PLC (a)(d) | 1,088,800 | | 1,133,298 |
Ophir Energy PLC (a) | 616,500 | | 5,516,592 |
Optos PLC (a) | 478,181 | | 1,572,267 |
Pureprofile Media PLC (a)(f) | 1,108,572 | | 626,135 |
Regenersis PLC | 1,198,700 | | 2,548,575 |
Rockhopper Exploration PLC (a) | 1,054,900 | | 2,681,193 |
Salamander Energy PLC (a) | 632,400 | | 1,964,531 |
SDL PLC | 448,762 | | 3,841,826 |
Serco Group PLC | 339,746 | | 3,105,922 |
Silverdell PLC (a) | 12,644,400 | | 2,678,143 |
Sinclair Pharma PLC (a) | 4,146,298 | | 1,898,596 |
Sphere Medical Holding PLC | 817,054 | | 955,928 |
Sportingbet PLC | 5,292,800 | | 4,569,572 |
Sthree PLC | 1,031,809 | | 4,999,408 |
Synergy Health PLC | 284,953 | | 4,271,941 |
Ted Baker PLC | 462,675 | | 7,078,164 |
TMO Renewables Ltd. (a)(f) | 1,000,000 | | 403,438 |
Travis Perkins PLC | 313,000 | | 5,455,121 |
Wolfson Microelectronics PLC (a) | 939,800 | | 3,154,533 |
Zenergy Power PLC (a) | 32,776 | | 44,430 |
TOTAL UNITED KINGDOM | | 150,920,402 |
United States of America - 0.2% |
CTC Media, Inc. | 4,300 | | 36,077 |
GI Dynamics, Inc. CDI (a) | 690,238 | | 429,901 |
Mudalla Technology, Inc. (Reg. S) (a) | 996,527 | | 16 |
YOU On Demand Holdings, Inc. (a) | 86,974 | | 301,800 |
YOU On Demand Holdings, Inc. (f) | 27,500 | | 85,883 |
Common Stocks - continued |
| Shares | | Value |
United States of America - continued |
YOU On Demand Holdings, Inc. warrants 8/30/17 (a)(f) | 27,500 | | $ 2,693 |
Zhongpin, Inc. (a) | 40,200 | | 463,104 |
TOTAL UNITED STATES OF AMERICA | | 1,319,474 |
TOTAL COMMON STOCKS (Cost $657,977,485) |
705,263,638
|
Convertible Bonds - 0.2% |
| Principal Amount | | |
Canada - 0.2% |
Griffiths Energy International, Inc. 12% 9/1/17 (f)
(Cost $1,400,000) | | $ 1,400,000 | |
1,400,000
|
Money Market Funds - 9.5% |
| Shares | | |
Fidelity Cash Central Fund, 0.19% (b) | 27,463,856 | | 27,463,856 |
Fidelity Securities Lending Cash Central Fund, 0.19% (b)(c) | 42,020,618 | | 42,020,618 |
TOTAL MONEY MARKET FUNDS (Cost $69,484,474) |
69,484,474
|
TOTAL INVESTMENT PORTFOLIO - 105.9% (Cost $728,861,959) | 776,148,112 |
NET OTHER ASSETS (LIABILITIES) - (5.9)% | (42,900,112) |
NET ASSETS - 100% | $ 733,248,000 |
Legend |
(a) Non-income producing |
(b) Affiliated fund that is available only to investment companies and other accounts managed by Fidelity Investments. The rate quoted is the annualized seven-day yield of the fund at period end. A complete unaudited listing of the fund's holdings as of its most recent quarter end is available upon request. In addition, each Fidelity Central Fund's financial statements, which are not covered by the Fund's Report of Independent Registered Public Accounting Firm, are available on the SEC's website or upon request. |
(c) Investment made with cash collateral received from securities on loan. |
(d) Security or a portion of the security is on loan at period end. |
(e) Affiliated company |
(f) Restricted securities - Investment in securities not registered under the Securities Act of 1933 (excluding 144A issues). At the end of the period, the value of restricted securities (excluding 144A issues) amounted to $6,899,165 or 0.9% of net assets. |
Additional information on each restricted holding is as follows: |
Security | Acquisition Date | Acquisition Cost |
AirSea Lines | 8/4/06 | $ 1,199,182 |
Buried Hill Energy (Cyprus) PCL | 8/18/06 | $ 2,141,700 |
Griffiths Energy International, Inc. 12% 9/1/17 | 9/12/12 | $ 1,400,000 |
Kalahari Energy | 9/1/06 | $ 1,813,750 |
Keronite PLC | 8/16/06 | $ 1,548,992 |
Pureprofile Media PLC | 5/3/05 - 1/11/06 | $ 1,173,341 |
Rock Well Petroleum, Inc. | 4/13/06 | $ 1,004,171 |
TMO Renewables Ltd. | 10/27/05 | $ 535,065 |
YOU On Demand Holdings, Inc. | 8/29/12 | $ 110,000 |
YOU On Demand Holdings, Inc. warrants 8/30/17 | 9/14/12 | $ 0 |
Affiliated Central Funds |
Information regarding fiscal year to date income earned by the Fund from investments in Fidelity Central Funds is as follows: |
Fund | Income earned |
Fidelity Cash Central Fund | $ 27,191 |
Fidelity Securities Lending Cash Central Fund | 1,033,335 |
Total | $ 1,060,526 |
Other Affiliated Issuers |
An affiliated company is a company in which the Fund has ownership of at least 5% of the voting securities. Fiscal year to date transactions with companies which are or were affiliates are as follows: |
Affiliate | Value, beginning of period | Purchases | Sales Proceeds | Dividend Income | Value,
end of
period |
Pertama Holdings Ltd. | $ 11,809,703 | $ - | $ - | $ 146,001 | $ 9,679,226 |
Other Information |
Categorizations in the Schedule of Investments are based on country or territory of incorporation. |
The following is a summary of the inputs used, as of October 31, 2012, involving the Fund's assets and liabilities carried at fair value. The inputs or methodology used for valuing securities may not be an indication of the risk associated with investing in those securities. For more information on valuation inputs, and their aggregation into the levels used in the tables below, please refer to the Security Valuation section in the accompanying Notes to Financial Statements. |
Valuation Inputs at Reporting Date: |
Description | Total | Level 1 | Level 2 | Level 3 |
Investments in Securities: | | | | |
Equities: | | | | |
Consumer Discretionary | $ 143,537,049 | $ 128,300,726 | $ 5,557,081 | $ 9,679,242 |
Consumer Staples | 28,905,986 | 28,905,986 | - | - |
Energy | 53,015,099 | 48,634,326 | - | 4,380,773 |
Financials | 87,769,138 | 87,295,509 | 473,629 | - |
Health Care | 69,622,651 | 69,219,213 | - | 403,438 |
Industrials | 98,004,520 | 97,822,641 | - | 181,879 |
Information Technology | 142,870,718 | 142,142,056 | - | 728,662 |
Materials | 74,909,127 | 74,575,481 | - | 333,646 |
Telecommunication Services | 4,426,521 | 4,426,521 | - | - |
Utilities | 2,202,829 | 2,202,829 | - | - |
Corporate Bonds | 1,400,000 | - | - | 1,400,000 |
Money Market Funds | 69,484,474 | 69,484,474 | - | - |
Total Investments in Securities: | $ 776,148,112 | $ 753,009,762 | $ 6,030,710 | $ 17,107,640 |
The following is a summary of transfers between Level 1 and Level 2 for the period ended October 31, 2012. Transfers are assumed to have occurred at the beginning of the period, and are primarily attributable to the valuation techniques used for foreign equity securities, as discussed in the accompanying Notes to Financial Statements: |
Transfers | Total |
Level 1 to Level 2 | $ 0 |
Level 2 to Level 1 | $ 131,002,515 |
Valuation Inputs at Reporting Date: |
The following is a reconciliation of Investments in Securities for which Level 3 inputs were used in determining value: |
Investments in Securities: | |
Equities - Consumer Discretionary | |
Beginning Balance | $ 16 |
Total Realized Gain (Loss) | - |
Total Unrealized Gain (Loss) | (2,130,470) |
Cost of Purchases | - |
Proceeds of Sales | - |
Amortization/Accretion | - |
Transfers in to Level 3 | 11,809,696 |
Transfers out of Level 3 | - |
Ending Balance | $ 9,679,242 |
The change in unrealized gain (loss) for the period attributable to Level 3 securities held at October 31, 2012 | $ (2,130,470) |
Other Investments in Securities | |
Beginning Balance | $ 8,345,313 |
Total Realized Gain (Loss) | (6,001,770) |
Total Unrealized Gain (Loss) | 4,079,700 |
Cost of Purchases | 1,400,000 |
Proceeds of Sales | (2,051,934) |
Amortization/Accretion | - |
Transfers in to Level 3 | 1,657,089 |
Transfers out of Level 3 | - |
Ending Balance | $ 7,428,398 |
The change in unrealized gain (loss) for the period attributable to Level 3 securities held at October 31, 2012 | $ (2,023,569) |
The information used in the above reconciliations represents fiscal year to date activity for any Investments in Securities identified as using Level 3 inputs at either the beginning or the end of the current fiscal period. Transfers into Level 3 were attributable to a lack of observable market data resulting from decreases in market activity, decreases in liquidity, security restructurings or corporate actions. Transfers out of Level 3 were attributable to observable market data becoming available for those securities. Transfers in or out of Level 3 represent the beginning value of any Security or Instrument where a change in the pricing level occurred from the beginning to the end of the period. The cost of purchases and the proceeds of sales may include securities received or delivered through corporate actions or exchanges. Realized and unrealized gains (losses) disclosed in the reconciliations are included in Net Gain (Loss) on the Fund's Statement of Operations. |
See accompanying notes which are an integral part of the financial statements.
Annual Report
Financial Statements
Statement of Assets and Liabilities
| October 31, 2012 |
| | |
Assets | | |
Investment in securities, at value (including securities loaned of $39,538,303) - See accompanying schedule: Unaffiliated issuers (cost $652,965,199) | $ 696,984,412 | |
Fidelity Central Funds (cost $69,484,474) | 69,484,474 | |
Other affiliated issuers (cost $6,412,286) | 9,679,226 | |
Total Investments (cost $728,861,959) | | $ 776,148,112 |
Foreign currency held at value (cost $33,857) | | 33,838 |
Receivable for investments sold | | 2,827,704 |
Receivable for fund shares sold | | 709,719 |
Dividends receivable | | 1,714,617 |
Interest receivable | | 22,702 |
Distributions receivable from Fidelity Central Funds | | 108,952 |
Other receivables | | 50,490 |
Total assets | | 781,616,134 |
| | |
Liabilities | | |
Payable to custodian bank | $ 400,266 | |
Payable for investments purchased | 3,347,180 | |
Payable for fund shares redeemed | 1,443,678 | |
Accrued management fee | 613,770 | |
Distribution and service plan fees payable | 13,250 | |
Other affiliated payables | 200,735 | |
Other payables and accrued expenses | 328,637 | |
Collateral on securities loaned, at value | 42,020,618 | |
Total liabilities | | 48,368,134 |
| | |
Net Assets | | $ 733,248,000 |
Net Assets consist of: | | |
Paid in capital | | $ 777,008,696 |
Undistributed net investment income | | 4,511,102 |
Accumulated undistributed net realized gain (loss) on investments and foreign currency transactions | | (95,349,581) |
Net unrealized appreciation (depreciation) on investments and assets and liabilities in foreign currencies | | 47,077,783 |
Net Assets | | $ 733,248,000 |
See accompanying notes which are an integral part of the financial statements.
Annual Report
Financial Statements - continued
Statement of Assets and Liabilities - continued
| October 31, 2012 |
| | |
Calculation of Maximum Offering Price
Class A:
Net Asset Value and redemption price per share
($14,124,535 ÷ 715,414 shares) | | $ 19.74 |
| | |
Maximum offering price per share (100/94.25 of $19.74) | | $ 20.94 |
Class T:
Net Asset Value and redemption price per share ($9,262,276 ÷ 472,720 shares) | | $ 19.59 |
| | |
Maximum offering price per share (100/96.50 of $19.59) | | $ 20.30 |
Class B:
Net Asset Value and offering price per share ($789,979 ÷ 41,097 shares)A | | $ 19.22 |
| | |
Class C:
Net Asset Value and offering price per share ($6,798,784 ÷ 354,409 shares)A | | $ 19.18 |
| | |
International Small Cap:
Net Asset Value, offering price and redemption price per share ($692,769,335 ÷ 34,653,723 shares) | | $ 19.99 |
| | |
Institutional Class:
Net Asset Value, offering price and redemption price per share ($9,503,091 ÷ 475,117 shares) | | $ 20.00 |
A Redemption price per share is equal to net asset value less any applicable contingent deferred sales charge.
See accompanying notes which are an integral part of the financial statements.
Annual Report
Statement of Operations
| Year ended October 31, 2012 |
| | |
Investment Income | | |
Dividends (including $146,001 earned from other affiliated issuers) | | $ 14,934,160 |
Interest | | 35,091 |
Income from Fidelity Central Funds (including $1,033,335 from security lending) | | 1,060,526 |
Income before foreign taxes withheld | | 16,029,777 |
Less foreign taxes withheld | | (830,680) |
Total income | | 15,199,097 |
| | |
Expenses | | |
Management fee
Basic fee | $ 6,793,958 | |
Performance adjustment | 794,505 | |
Transfer agent fees | 2,203,397 | |
Distribution and service plan fees | 185,199 | |
Accounting and security lending fees | 390,539 | |
Custodian fees and expenses | 266,235 | |
Independent trustees' compensation | 5,334 | |
Registration fees | 89,380 | |
Audit | 149,081 | |
Legal | 4,272 | |
Miscellaneous | 10,991 | |
Total expenses before reductions | 10,892,891 | |
Expense reductions | (204,895) | 10,687,996 |
Net investment income (loss) | | 4,511,101 |
Realized and Unrealized Gain (Loss) Net realized gain (loss) on: | | |
Investment securities: | | |
Unaffiliated issuers (net of foreign taxes of $2,323) | (4,623,160) | |
Foreign currency transactions | (136,906) | |
Futures contracts | 617,111 | |
Total net realized gain (loss) | | (4,142,955) |
Change in net unrealized appreciation (depreciation) on: Investment securities (net of increase in deferred foreign taxes of $187,847) | 42,478,383 | |
Assets and liabilities in foreign currencies | (17,086) | |
Futures contracts | 113,279 | |
Total change in net unrealized appreciation (depreciation) | | 42,574,576 |
Net gain (loss) | | 38,431,621 |
Net increase (decrease) in net assets resulting from operations | | $ 42,942,722 |
See accompanying notes which are an integral part of the financial statements.
Annual Report
Financial Statements - continued
Statement of Changes in Net Assets
| Year ended
October 31,
2012 | Year ended
October 31,
2011 |
Increase (Decrease) in Net Assets | | |
Operations | | |
Net investment income (loss) | $ 4,511,101 | $ 8,017,121 |
Net realized gain (loss) | (4,142,955) | 35,260,441 |
Change in net unrealized appreciation (depreciation) | 42,574,576 | (96,830,627) |
Net increase (decrease) in net assets resulting
from operations | 42,942,722 | (53,553,065) |
Distributions to shareholders from net investment income | (8,016,423) | (2,430,566) |
Distributions to shareholders from net realized gain | (12,577,679) | (28,246,937) |
Total distributions | (20,594,102) | (30,677,503) |
Share transactions - net increase (decrease) | (204,187,386) | 129,451,482 |
Redemption fees | 102,611 | 283,575 |
Total increase (decrease) in net assets | (181,736,155) | 45,504,489 |
| | |
Net Assets | | |
Beginning of period | 914,984,155 | 869,479,666 |
End of period (including undistributed net investment income of $4,511,102 and undistributed net investment income of $8,017,124, respectively) | $ 733,248,000 | $ 914,984,155 |
See accompanying notes which are an integral part of the financial statements.
Annual Report
Financial Highlights - Class A
Years ended October 31, | 2012 | 2011 | 2010 | 2009 | 2008 |
Selected Per-Share Data | | | | | |
Net asset value, beginning of period | $ 18.97 | $ 20.42 | $ 17.28 | $ 11.91 | $ 31.14 |
Income from Investment Operations | | | | | |
Net investment income (loss) C | .06 | .10 | .03 | .06 | - H |
Net realized and unrealized gain (loss) | 1.09 | (.88) | 3.51 | 5.31 | (14.03) |
Total from investment operations | 1.15 | (.78) | 3.54 | 5.37 | (14.03) |
Distributions from net investment income | (.11) | (.02) | (.06) | - | (.03) |
Distributions from net realized gain | (.27) | (.66) | (.34) | - | (5.18) |
Total distributions | (.38) | (.68) | (.40) | - | (5.20) I |
Redemption fees added to paid in capital C | - H | .01 | - H | - H | - H |
Net asset value, end of period | $ 19.74 | $ 18.97 | $ 20.42 | $ 17.28 | $ 11.91 |
Total Return A,B | 6.28% | (4.00)% | 20.85% | 45.09% | (53.35)% |
Ratios to Average Net Assets D,G | | | | | |
Expenses before reductions | 1.63% | 1.56% | 1.71% | 1.75% | 1.82% |
Expenses net of fee waivers, if any | 1.63% | 1.55% | 1.65% | 1.65% | 1.65% |
Expenses net of all reductions | 1.60% | 1.54% | 1.63% | 1.62% | 1.60% |
Net investment income (loss) | .32% | .49% | .16% | .41% | -% F |
Supplemental Data | | | | | |
Net assets, end of period (000 omitted) | $ 14,125 | $ 17,185 | $ 19,720 | $ 17,590 | $ 13,561 |
Portfolio turnover rate E | 68% | 47% | 66% | 81% | 113% |
A Total returns would have been lower if certain expenses had not been reduced during the applicable periods shown.
B Total returns do not include the effect of the sales charges.
C Calculated based on average shares outstanding during the period.
D Fees and expenses of any underlying Fidelity Central Funds are not included in the Fund's expense ratio. The Fund indirectly bears its proportionate share of the expenses of any underlying Fidelity Central Funds.
E Amount does not include the portfolio activity of any underlying Fidelity Central Funds.
F Amount represents less than .01%.
G Expense ratios reflect operating expenses of the class. Expenses before reductions do not reflect amounts reimbursed by the investment adviser or reductions from brokerage service arrangements or reductions from other expense offset arrangements and do not represent the amount paid by the class during periods when reimbursements or reductions occur. Expenses net of fee waivers reflect expenses after reimbursement by the investment adviser but prior to reductions from brokerage service arrangements or other expense offset arrangements. Expenses net of all reductions represent the net expenses paid by the class.
H Amount represents less than $.01 per share.
I Total distributions of $5.20 per share is comprised of distributions from net investment income of $.026 and distributions from net realized gain of $5.176 per share.
See accompanying notes which are an integral part of the financial statements.
Annual Report
Financial Highlights - Class T
Years ended October 31, | 2012 | 2011 | 2010 | 2009 | 2008 |
Selected Per-Share Data | | | | | |
Net asset value, beginning of period | $ 18.80 | $ 20.23 | $ 17.14 | $ 11.84 | $ 30.96 |
Income from Investment Operations | | | | | |
Net investment income (loss) C | .01 | .05 | (.02) | .02 | (.05) |
Net realized and unrealized gain (loss) | 1.08 | (.86) | 3.47 | 5.28 | (13.95) |
Total from investment operations | 1.09 | (.81) | 3.45 | 5.30 | (14.00) |
Distributions from net investment income | (.03) | - | (.02) | - | - |
Distributions from net realized gain | (.27) | (.63) | (.34) | - | (5.12) |
Total distributions | (.30) | (.63) | (.36) | - | (5.12) |
Redemption fees added to paid in capital C | - G | .01 | - G | - G | - G |
Net asset value, end of period | $ 19.59 | $ 18.80 | $ 20.23 | $ 17.14 | $ 11.84 |
Total Return A,B | 5.97% | (4.18)% | 20.46% | 44.76% | (53.46)% |
Ratios to Average Net Assets D,F | | | | | |
Expenses before reductions | 1.88% | 1.82% | 1.97% | 2.00% | 2.07% |
Expenses net of fee waivers, if any | 1.88% | 1.81% | 1.90% | 1.90% | 1.90% |
Expenses net of all reductions | 1.85% | 1.79% | 1.88% | 1.86% | 1.86% |
Net investment income (loss) | .07% | .24% | (.09)% | .16% | (.25)% |
Supplemental Data | | | | | |
Net assets, end of period (000 omitted) | $ 9,262 | $ 13,744 | $ 16,092 | $ 15,760 | $ 13,493 |
Portfolio turnover rate E | 68% | 47% | 66% | 81% | 113% |
A Total returns would have been lower if certain expenses had not been reduced during the applicable periods shown.
B Total returns do not include the effect of the sales charges.
C Calculated based on average shares outstanding during the period.
D Fees and expenses of any underlying Fidelity Central Funds are not included in the Fund's expense ratio. The Fund indirectly bears its proportionate share of the expenses of any underlying Fidelity Central Funds.
E Amount does not include the portfolio activity of any underlying Fidelity Central Funds.
F Expense ratios reflect operating expenses of the class. Expenses before reductions do not reflect amounts reimbursed by the investment adviser or reductions from brokerage service arrangements or reductions from other expense offset arrangements and do not represent the amount paid by the class during periods when reimbursements or reductions occur. Expenses net of fee waivers reflect expenses after reimbursement by the investment adviser but prior to reductions from brokerage service arrangements or other expense offset arrangements. Expenses net of all reductions represent the net expenses paid by the class.
G Amount represents less than $.01 per share.
See accompanying notes which are an integral part of the financial statements.
Annual Report
Financial Highlights - Class B
Years ended October 31, | 2012 | 2011 | 2010 | 2009 | 2008 |
Selected Per-Share Data | | | | | |
Net asset value, beginning of period | $ 18.38 | $ 19.79 | $ 16.78 | $ 11.65 | $ 30.49 |
Income from Investment Operations | | | | | |
Net investment income (loss) C | (.08) | (.05) | (.10) | (.04) | (.16) |
Net realized and unrealized gain (loss) | 1.07 | (.85) | 3.39 | 5.17 | (13.73) |
Total from investment operations | .99 | (.90) | 3.29 | 5.13 | (13.89) |
Distributions from net realized gain | (.15) | (.52) | (.28) | - | (4.95) |
Redemption fees added to paid in capital C | - G | .01 | - G | - G | - G |
Net asset value, end of period | $ 19.22 | $ 18.38 | $ 19.79 | $ 16.78 | $ 11.65 |
Total Return A,B | 5.45% | (4.68)% | 19.90% | 44.03% | (53.68)% |
Ratios to Average Net Assets D,F | | | | | |
Expenses before reductions | 2.38% | 2.32% | 2.47% | 2.49% | 2.58% |
Expenses net of fee waivers, if any | 2.38% | 2.30% | 2.40% | 2.40% | 2.40% |
Expenses net of all reductions | 2.35% | 2.29% | 2.38% | 2.36% | 2.36% |
Net investment income (loss) | (.43)% | (.26)% | (.59)% | (.33)% | (.75)% |
Supplemental Data | | | | | |
Net assets, end of period (000 omitted) | $ 790 | $ 2,067 | $ 3,457 | $ 3,601 | $ 3,230 |
Portfolio turnover rate E | 68% | 47% | 66% | 81% | 113% |
A Total returns would have been lower if certain expenses had not been reduced during the applicable periods shown.
B Total returns do not include the effect of the contingent deferred sales charge.
C Calculated based on average shares outstanding during the period.
D Fees and expenses of any underlying Fidelity Central Funds are not included in the Fund's expense ratio. The Fund indirectly bears its proportionate share of the expenses of any underlying Fidelity Central Funds.
E Amount does not include the portfolio activity of any underlying Fidelity Central Funds.
F Expense ratios reflect operating expenses of the class. Expenses before reductions do not reflect amounts reimbursed by the investment adviser or reductions from brokerage service arrangements or reductions from other expense offset arrangements and do not represent the amount paid by the class during periods when reimbursements or reductions occur. Expenses net of fee waivers reflect expenses after reimbursement by the investment adviser but prior to reductions from brokerage service arrangements or other expense offset arrangements. Expenses net of all reductions represent the net expenses paid by the class.
G Amount represents less than $.01 per share.
See accompanying notes which are an integral part of the financial statements.
Annual Report
Financial Highlights - Class C
Years ended October 31, | 2012 | 2011 | 2010 | 2009 | 2008 |
Selected Per-Share Data | | | | | |
Net asset value, beginning of period | $ 18.38 | $ 19.85 | $ 16.85 | $ 11.70 | $ 30.62 |
Income from Investment Operations | | | | | |
Net investment income (loss) C | (.08) | (.04) | (.10) | (.04) | (.16) |
Net realized and unrealized gain (loss) | 1.07 | (.85) | 3.40 | 5.19 | (13.78) |
Total from investment operations | .99 | (.89) | 3.30 | 5.15 | (13.94) |
Distributions from net realized gain | (.19) | (.59) | (.30) | - | (4.98) |
Redemption fees added to paid in capital C | - G | .01 | - G | - G | - G |
Net asset value, end of period | $ 19.18 | $ 18.38 | $ 19.85 | $ 16.85 | $ 11.70 |
Total Return A,B | 5.46% | (4.64)% | 19.86% | 44.02% | (53.67)% |
Ratios to Average Net Assets D,F | | | | | |
Expenses before reductions | 2.38% | 2.27% | 2.42% | 2.49% | 2.57% |
Expenses net of fee waivers, if any | 2.38% | 2.26% | 2.40% | 2.40% | 2.40% |
Expenses net of all reductions | 2.35% | 2.24% | 2.37% | 2.36% | 2.36% |
Net investment income (loss) | (.43)% | (.21)% | (.59)% | (.33)% | (.76)% |
Supplemental Data | | | | | |
Net assets, end of period (000 omitted) | $ 6,799 | $ 9,545 | $ 13,501 | $ 5,814 | $ 5,658 |
Portfolio turnover rate E | 68% | 47% | 66% | 81% | 113% |
A Total returns would have been lower if certain expenses had not been reduced during the applicable periods shown.
B Total returns do not include the effect of the contingent deferred sales charge.
C Calculated based on average shares outstanding during the period.
D Fees and expenses of any underlying Fidelity Central Funds are not included in the Fund's expense ratio. The Fund indirectly bears its proportionate share of the expenses of any underlying Fidelity Central Funds.
E Amount does not include the portfolio activity of any underlying Fidelity Central Funds.
F Expense ratios reflect operating expenses of the class. Expenses before reductions do not reflect amounts reimbursed by the investment adviser or reductions from brokerage service arrangements or reductions from other expense offset arrangements and do not represent the amount paid by the class during periods when reimbursements or reductions occur. Expenses net of fee waivers reflect expenses after reimbursement by the investment adviser but prior to reductions from brokerage service arrangements or other expense offset arrangements. Expenses net of all reductions represent the net expenses paid by the class.
G Amount represents less than $.01 per share.
See accompanying notes which are an integral part of the financial statements.
Annual Report
Financial Highlights - International Small Cap
Years ended October 31, | 2012 | 2011 | 2010 | 2009 | 2008 |
Selected Per-Share Data | | | | | |
Net asset value, beginning of period | $ 19.23 | $ 20.66 | $ 17.48 | $ 12.03 | $ 31.44 |
Income from Investment Operations | | | | | |
Net investment income (loss) B | .11 | .17 | .07 | .08 | .03 |
Net realized and unrealized gain (loss) | 1.10 | (.89) | 3.53 | 5.37 | (14.14) |
Total from investment operations | 1.21 | (.72) | 3.60 | 5.45 | (14.11) |
Distributions from net investment income | (.18) | (.06) | (.08) | - | (.12) |
Distributions from net realized gain | (.27) | (.66) | (.34) | - | (5.18) |
Total distributions | (.45) | (.72) | (.42) | - | (5.30) |
Redemption fees added to paid in capital B | - F | .01 | - F | - F | - F |
Net asset value, end of period | $ 19.99 | $ 19.23 | $ 20.66 | $ 17.48 | $ 12.03 |
Total Return A | 6.55% | (3.65)% | 21.02% | 45.30% | (53.25)% |
Ratios to Average Net Assets C,E | | | | | |
Expenses before reductions | 1.35% | 1.26% | 1.44% | 1.48% | 1.49% |
Expenses net of fee waivers, if any | 1.35% | 1.25% | 1.44% | 1.48% | 1.49% |
Expenses net of all reductions | 1.33% | 1.23% | 1.42% | 1.44% | 1.44% |
Net investment income (loss) | .59% | .80% | .37% | .58% | .16% |
Supplemental Data | | | | | |
Net assets, end of period (000 omitted) | $ 692,769 | $ 856,692 | $ 808,478 | $ 669,035 | $ 536,291 |
Portfolio turnover rate D | 68% | 47% | 66% | 81% | 113% |
A Total returns would have been lower if certain expenses had not been reduced during the applicable periods shown.
B Calculated based on average shares outstanding during the period.
C Fees and expenses of any underlying Fidelity Central Funds are not included in the Fund's expense ratio. The Fund indirectly bears its proportionate share of the expenses of any underlying Fidelity Central Funds.
D Amount does not include the portfolio activity of any underlying Fidelity Central Funds.
E Expense ratios reflect operating expenses of the class. Expenses before reductions do not reflect amounts reimbursed by the investment adviser or reductions from brokerage service arrangements or reductions from other expense offset arrangements and do not represent the amount paid by the class during periods when reimbursements or reductions occur. Expenses net of fee waivers reflect expenses after reimbursement by the investment adviser but prior to reductions from brokerage service arrangements or other expense offset arrangements. Expenses net of all reductions represent the net expenses paid by the class.
F Amount represents less than $.01 per share.
See accompanying notes which are an integral part of the financial statements.
Annual Report
Financial Highlights - Institutional Class
Years ended October 31, | 2012 | 2011 | 2010 | 2009 | 2008 |
Selected Per-Share Data | | | | | |
Net asset value, beginning of period | $ 19.24 | $ 20.66 | $ 17.47 | $ 12.01 | $ 31.38 |
Income from Investment Operations | | | | | |
Net investment income (loss) B | .13 | .18 | .09 | .09 | .05 |
Net realized and unrealized gain (loss) | 1.10 | (.89) | 3.53 | 5.37 | (14.12) |
Total from investment operations | 1.23 | (.71) | 3.62 | 5.46 | (14.07) |
Distributions from net investment income | (.20) | (.06) | (.09) | - | (.12) |
Distributions from net realized gain | (.27) | (.66) | (.34) | - | (5.18) |
Total distributions | (.47) | (.72) | (.43) | - | (5.30) |
Redemption fees added to paid in capital B | - F | .01 | - F | - F | - F |
Net asset value, end of period | $ 20.00 | $ 19.24 | $ 20.66 | $ 17.47 | $ 12.01 |
Total Return A | 6.65% | (3.62)% | 21.15% | 45.46% | (53.22)% |
Ratios to Average Net Assets C,E | | | | | |
Expenses before reductions | 1.25% | 1.22% | 1.34% | 1.45% | 1.49% |
Expenses net of fee waivers, if any | 1.25% | 1.21% | 1.34% | 1.40% | 1.40% |
Expenses net of all reductions | 1.22% | 1.19% | 1.31% | 1.37% | 1.35% |
Net investment income (loss) | .70% | .84% | .47% | .66% | .25% |
Supplemental Data | | | | | |
Net assets, end of period (000 omitted) | $ 9,503 | $ 15,752 | $ 8,231 | $ 2,696 | $ 2,217 |
Portfolio turnover rate D | 68% | 47% | 66% | 81% | 113% |
A Total returns would have been lower if certain expenses had not been reduced during the applicable periods shown.
B Calculated based on average shares outstanding during the period.
C Fees and expenses of any underlying Fidelity Central Funds are not included in the Fund's expense ratio. The Fund indirectly bears its proportionate share of the expenses of any underlying Fidelity Central Funds.
D Amount does not include the portfolio activity of any underlying Fidelity Central Funds.
E Expense ratios reflect operating expenses of the class. Expenses before reductions do not reflect amounts reimbursed by the investment adviser or reductions from brokerage service arrangements or reductions from other expense offset arrangements and do not represent the amount paid by the class during periods when reimbursements or reductions occur. Expenses net of fee waivers reflect expenses after reimbursement by the investment adviser but prior to reductions from brokerage service arrangements or other expense offset arrangements. Expenses net of all reductions represent the net expenses paid by the class.
F Amount represents less than $.01 per share.
See accompanying notes which are an integral part of the financial statements.
Annual Report
Notes to Financial Statements
For the period ended October 31, 2012
1. Organization.
Fidelity International Small Cap Fund (the Fund) is a fund of Fidelity Investment Trust (the Trust) and is authorized to issue an unlimited number of shares. The Trust is registered under the Investment Company Act of 1940, as amended (the 1940 Act), as an open-end management investment company organized as a Massachusetts business trust. The Fund offers Class A, Class T, Class C, International Small Cap and Institutional Class shares, each of which, along with Class B shares, has equal rights as to assets and voting privileges. Effective after the close of business on September 1, 2010, Class B shares were closed to new accounts and additional purchases, except for exchanges and reinvestments. Each class has exclusive voting rights with respect to matters that affect that class. Class B shares will automatically convert to Class A shares after a holding period of seven years from the initial date of purchase. Investment income, realized and unrealized capital gains and losses, the common expenses of the Fund, and certain fund-level expense reductions, if any, are allocated on a pro-rata basis to each class based on the relative net assets of each class to the total net assets of the Fund. Each class differs with respect to transfer agent and distribution and service plan fees incurred. Certain expense reductions may also differ by class. The Fund's investments in emerging markets can be subject to social, economic, regulatory, and political uncertainties and can be extremely volatile.
2. Investments in Fidelity Central Funds.
The Fund invests in Fidelity Central Funds, which are open-end investment companies available only to other investment companies and accounts managed by Fidelity Management & Research Company (FMR) and its affiliates. The Fund's Schedule of Investments lists each of the Fidelity Central Funds held as of period end, as an investment of the Fund, but does not include the underlying holdings of each Fidelity Central Fund. As an Investing Fund, the Fund indirectly bears its proportionate share of the expenses of the underlying Fidelity Central Funds.
The Money Market Central Funds seek preservation of capital and current income and are managed by Fidelity Investments Money Management, Inc. (FIMM), an affiliate of FMR.
A complete unaudited list of holdings for each Fidelity Central Fund is available upon request or at the Securities and Exchange Commission (the SEC) web site at www.sec.gov. In addition, the financial statements of the Fidelity Central Funds, which are not covered by the Fund's Report of Independent Registered Public Accounting Firm, are available on the SEC web site or upon request.
Annual Report
3. Significant Accounting Policies.
The financial statements have been prepared in conformity with accounting principles generally accepted in the United States of America (GAAP), which require management to make certain estimates and assumptions at the date of the financial statements. Actual results could differ from those estimates. Subsequent events, if any, through the date that the financial statements were issued have been evaluated in the preparation of the financial statements. The following summarizes the significant accounting policies of the Fund:
Security Valuation. Investments are valued as of 4:00 p.m. Eastern time on the last calendar day of the period. In accordance with valuation policies and procedures approved by the Board of Trustees (the Board), the Fund attempts to obtain prices from one or more third party pricing vendors or brokers to value its investments. When current market prices, quotations or rates are not readily available or reliable, securities will be fair valued in good faith by the FMR Fair Value Committee (the Committee), in accordance with procedures adopted by the Fund's Board. Factors used in determining fair value vary by security type and may include market or security specific events, changes in interest rates and credit quality. The frequency with which these procedures are used cannot be predicted and they may be utilized to a significant extent. The Committee oversees the Fund's valuation policies and procedures and is responsible for approving and reporting to the Board all fair value determinations.
The Fund categorizes the inputs to valuation techniques used to value its investments into a disclosure hierarchy consisting of three levels as shown below:
Level 1 - quoted prices in active markets for identical investments
Level 2 - other significant observable inputs (including quoted prices for similar investments, interest rates, prepayment speeds, etc.)
Level 3 - unobservable inputs (including the Fund's own assumptions based on the best information available)
Valuation techniques used to value the Fund's investments by major category are as follows:
Equity securities, including restricted securities, for which market quotations are readily available, are valued at the last reported sale price or official closing price as reported by a third party pricing vendor on the primary market or exchange on which they are traded and are categorized as Level 1 in the hierarchy. In the event there were no sales during the day or closing prices are not available, securities are valued at the last quoted bid price or may be valued using the last available price and are generally categorized as Level 2 in the hierarchy. For foreign equity securities, when significant market or security specific events arise, comparisons to the valuation of American Depositary Receipts
Annual Report
Notes to Financial Statements - continued
3. Significant Accounting Policies - continued
Security Valuation - continued
(ADRs), futures contracts, Exchange-Traded Funds (ETFs) and certain indexes as well as quoted prices for similar securities are used and are categorized as Level 2 in the hierarchy. Utilizing these techniques may result in transfers between Level 1 and Level 2. For restricted equity securities and private placements where observable inputs are limited, assumptions about market activity and risk are used and these securities are categorized as Level 3 in the hierarchy.
Debt securities, including restricted securities, are valued based on evaluated prices received from third party pricing vendors or from brokers who make markets in such securities. For corporate bonds, pricing vendors utilize matrix pricing which considers yield or price of bonds of comparable quality, coupon, maturity and type as well as broker-supplied prices and are generally categorized as Level 2 in the hierarchy. When independent prices are unavailable or unreliable, debt securities may be valued utilizing pricing methodologies which consider similar factors that would be used by third party pricing vendors. These are generally categorized as Level 2 in the hierarchy but may be Level 3 depending on the circumstances.
Investments in open-end mutual funds, including the Fidelity Central Funds, are valued at their closing net asset value (NAV) each business day and are categorized as Level 1 in the hierarchy.
The following provides information on Level 3 securities held by the Fund that were valued at period end based on unobservable inputs. These amounts exclude valuations provided by a broker.
Asset Type | Fair Value at 10/31/12 | Valuation Technique (s) | Unobservable Input | Range | Weighted Average |
Common Stocks | $ 15,707,639 | Expected distribution | Recovery rate | 0% | 0% |
| | Market comparable | Discount for lack of marketability | 10% - 50% | 35.57% |
| | | EV/NOPAT multiple | 12.3 | 12.3 |
| | | Transaction price | $ .045 - $2.6 | $ 1.06 |
Corporate Bonds | $ 1,400,000 | Market comparable | Transaction price | $ 100 | $ 100 |
For the unobservable inputs listed in the table above, a significant increase in discount for lack of marketability could result in a significant decrease to the fair value measurement. A significant increase in recovery rates, EV/NOPAT multiples or transaction price could result in a significant increase to the fair value measurement.
Annual Report
3. Significant Accounting Policies - continued
Security Valuation - continued
Changes in valuation techniques may result in transfers in or out of an assigned level within the disclosure hierarchy. The aggregate value of investments by input level, as of October 31, 2012, including information on transfers between Levels 1 and 2, as well as a roll forward of Level 3 securities, is included at the end of the Fund's Schedule of Investments.
Foreign Currency Translation. The Fund may use foreign currency contracts to facilitate transactions in foreign-denominated securities. Gains and losses from these transactions may arise from changes in the value of the foreign currency or if the counterparties do not perform under the contracts' terms.
Foreign-denominated assets, including investment securities, and liabilities are translated into U.S. dollars at the exchange rates at period end. Purchases and sales of investment securities, income and dividends received and expenses denominated in foreign currencies are translated into U.S. dollars at the exchange rate in effect on the transaction date.
The effects of exchange rate fluctuations on investments are included with the net realized and unrealized gain (loss) on investment securities. Other foreign currency transactions resulting in realized and unrealized gain (loss) are disclosed separately.
Investment Transactions and Income. For financial reporting purposes, the Fund's investment holdings and NAV include trades executed through the end of the last business day of the period. The NAV per share for processing shareholder transactions is calculated as of the close of business of the New York Stock Exchange (NYSE), normally 4:00 p.m. Eastern time and includes trades executed through the end of the prior business day. Gains and losses on securities sold are determined on the basis of identified cost. Dividend income is recorded on the ex-dividend date, except for certain dividends from foreign securities where the ex-dividend date may have passed, which are recorded as soon as the Fund is informed of the ex-dividend date. Non-cash dividends included in dividend income, if any, are recorded at the fair market value of the securities received. Interest income and distributions from the Fidelity Central Funds are accrued as earned. Interest income includes coupon interest and amortization of premium and accretion of discount on debt securities. Investment income is recorded net of foreign taxes withheld where recovery of such taxes is uncertain.
Expenses. Expenses directly attributable to a fund are charged to that fund. Expenses attributable to more than one fund are allocated among the respective funds on the basis of relative net assets or other appropriate methods. Expense estimates are accrued in the period to which they relate and adjustments are made when actual amounts are known.
Annual Report
Notes to Financial Statements - continued
3. Significant Accounting Policies - continued
Income Tax Information and Distributions to Shareholders. Each year, the Fund intends to qualify as a regulated investment company under Subchapter M of the Internal Revenue Code, including distributing substantially all of its taxable income and realized gains. As a result, no provision for income taxes is required. As of October 31, 2012, the Fund did not have any unrecognized tax benefits in the financial statements; nor is the Fund aware of any tax positions for which it is reasonably possible that the total amounts of unrecognized tax benefits will significantly change in the next twelve months. The Fund files a U.S. federal tax return, in addition to state and local tax returns as required. A fund's federal income tax returns are subject to examination by the Internal Revenue Service (IRS) for a period of three fiscal years after they are filed. State and local tax returns may be subject to examination for an additional fiscal year depending on the jurisdiction. Foreign taxes are provided for based on the Fund's understanding of the tax rules and rates that exist in the foreign markets in which it invests. The Fund is subject to a tax imposed on capital gains by certain countries in which it invests. An estimated deferred tax liability for net unrealized appreciation on the applicable securities is included in Other payables and accrued expenses on the Statement of Assets & Liabilities.
Distributions are declared and recorded on the ex-dividend date. Income dividends and capital gain distributions are declared separately for each class. Income and capital gain distributions are determined in accordance with income tax regulations, which may differ from GAAP.
Capital accounts within the financial statements are adjusted for permanent book-tax differences. These adjustments have no impact on net assets or the results of operations. Temporary book-tax differences will reverse in a subsequent period.
Book-tax differences are primarily due futures transactions, foreign currency transactions, certain foreign taxes, passive foreign investment companies (PFIC), market discount, capital loss carryforwards and losses deferred due to wash sales.
The federal tax cost of investment securities and unrealized appreciation (depreciation) as of period end were as follows:
Gross unrealized appreciation | 127,681,860 |
Gross unrealized depreciation | (104,609,169) |
Net unrealized appreciation (depreciation) on securities and other investments | $ 23,072,691 |
| |
Tax Cost | $ 753,075,421 |
Annual Report
3. Significant Accounting Policies - continued
Income Tax Information and Distributions to Shareholders - continued
The tax-based components of distributable earnings as of period end were as follows:
Undistributed ordinary income | $ 16,278,609 |
Capital loss carryforward | $ (82,903,626) |
Net unrealized appreciation (depreciation) | $ 23,049,729 |
Capital loss carryforwards are only available to offset future capital gains of the Fund to the extent provided by regulations and may be limited. Under the Regulated Investment Company Modernization Act of 2010 (the Act), the Fund is permitted to carry forward capital losses incurred in taxable years beginning after December 22, 2010 for an unlimited period and such capital losses are required to be used prior to any losses that expire. Capital loss carryforwards were as follows:
Fiscal year of expiration | |
| |
2017 | $ (65,361,612) |
No expiration | |
Short-term | (13,191,063) |
Long-term | (4,350,951) |
Total no expiration | (17,542,014) |
Total capital loss carryforward | $ (82,903,626) |
| |
The tax character of distributions paid was as follows:
| October 31, 2012 | October 31, 2011 |
Ordinary Income | $ 20,594,102 | $ 30,677,503 |
Short-Term Trading (Redemption) Fees. Shares held by investors in the Fund less than 90 days are subject to a redemption fee equal to 2.00% of the net asset value of shares redeemed. All redemption fees, which reduce the proceeds of the shareholder redemption, are retained by the Fund and accounted for as an addition to paid in capital.
Restricted Securities. The Fund may invest in securities that are subject to legal or contractual restrictions on resale. These securities generally may be resold in transactions exempt from registration or to the public if the securities are registered. Disposal of these securities may involve time-consuming negotiations and expense, and prompt sale at an acceptable price may be difficult. Information regarding restricted securities is included at the end of the Fund's Schedule of Investments.
Annual Report
Notes to Financial Statements - continued
3. Significant Accounting Policies - continued
New Accounting Pronouncement. In December 2011, the Financial Accounting Standards Board issued Accounting Standard Update No. 2011-11, Disclosures about Offsetting Assets and Liabilities. The update creates new disclosure requirements requiring entities to disclose both gross and net information for derivatives and other financial instruments that are either offset in the Statement of Assets and Liabilities or subject to an enforceable master netting arrangement or similar agreement. The disclosure requirements are effective for annual reporting periods beginning on or after January 1, 2013, and interim periods within those annual periods. Management is currently evaluating the impact of the update's adoption on the Fund's financial statement disclosures.
4. Derivative Instruments.
Risk Exposures and the Use of Derivative Instruments. The Fund's investment objective allows the Fund to enter into various types of derivative contracts, including futures contracts. Derivatives are investments whose value is primarily derived from underlying assets, indices or reference rates and may be transacted on an exchange or over-the-counter (OTC). Derivatives may involve a future commitment to buy or sell a specified instrument based on specified terms, to exchange future cash flows at periodic intervals based on a notional principal amount, or for one party to make one or more payments upon the occurrence of specified events in exchange for periodic payments from the other party.
The Fund used derivatives to increase returns and to manage exposure to certain risks as defined below. The success of any strategy involving derivatives depends on analysis of numerous economic factors, and if the strategies for investment do not work as intended, the Fund may not achieve its objectives.
The Fund's use of derivatives increased or decreased its exposure to the following risk:
Equity Risk | Equity risk relates to the fluctuations in the value of financial instruments as a result of changes in market prices (other than those arising from interest rate risk or foreign exchange risk), whether caused by factors specific to an individual investment, its issuer, or all factors affecting all instruments traded in a market or market segment. |
The Fund is also exposed to additional risks from investing in derivatives, such as liquidity risk and counterparty credit risk. Liquidity risk is the risk that the Fund will be unable to close out the derivative in the open market in a timely manner. Counterparty credit risk is the risk that the counterparty will not be able to fulfill its obligation to the Fund. Counterparty credit risk related to exchange-traded futures contracts is minimal because of the protection provided by the exchange on which they trade.
Annual Report
4. Derivative Instruments - continued
Risk Exposures and the Use of Derivative Instruments - continued
Investing in derivatives may involve greater risks than investing in the underlying assets directly and, to varying degrees, may involve risk of loss in excess of any initial investment and collateral received and amounts recognized in the Statement of Assets and Liabilities. In addition, there may be the risk that the change in value of the derivative contract does not correspond to the change in value of the underlying instrument.
Futures Contracts. A futures contract is an agreement between two parties to buy or sell a specified underlying instrument for a fixed price at a specified future date. The Fund used futures contracts to manage its exposure to the stock market.
Upon entering into a futures contract, a fund is required to deposit either cash or securities (initial margin) with a clearing broker in an amount equal to a certain percentage of the face value of the contract. Futures contracts are marked-to-market daily and subsequent payments (variation margin) are made or received by a fund depending on the daily fluctuations in the value of the futures contracts and are recorded as unrealized appreciation or (depreciation). This receivable and/or payable is included in daily variation margin on futures contracts in the Statement of Assets and Liabilities. Realized gain or (loss) is recorded upon the expiration or closing of a futures contract.
Any open futures contracts at period end are shown in the Schedule of Investments under the caption "Futures Contracts." The underlying face amount at value reflects each contract's exposure to the underlying instrument at period end and is representative of activity for the period.
During the period the Fund recognized net realized gain (loss) of $617,111 and a change in net unrealized appreciation (depreciation) of $113,279 related to its investment in futures contracts. These amounts are included in the Statement of Operations.
5. Purchases and Sales of Investments.
Purchases and sales of securities, other than short-term securities, aggregated $526,733,625 and $758,337,261, respectively.
6. Fees and Other Transactions with Affiliates.
Management Fee. FMR and its affiliates provide the Fund with investment management related services for which the Fund pays a monthly management fee. The management fee is the sum of an individual fund fee rate that is based on an annual rate of .60% of the Fund's average net assets and an annualized group fee rate that averaged .26% during the period. The group fee rate is based upon the average net assets of all the
Annual Report
Notes to Financial Statements - continued
6. Fees and Other Transactions with Affiliates - continued
Management Fee - continued
mutual funds advised by FMR. The group fee rate decreases as assets under management increase and increases as assets under management decrease. In addition, the management fee is subject to a performance adjustment (up to a maximum of ± .20% of the Fund's average net assets over a 36 month performance period). The upward or downward adjustment to the management fee is based on the relative investment performance of International Small Cap as compared to an appropriate benchmark index. For the period, the total annual management fee rate, including the performance adjustment, was .96% of the Fund's average net assets.
Distribution and Service Plan Fees. In accordance with Rule 12b-1 of the 1940 Act, the Fund has adopted separate Distribution and Service Plans for each class of shares. Certain classes pay Fidelity Distributors Corporation (FDC), an affiliate of FMR, separate Distribution and Service Fees, each of which is based on an annual percentage of each class' average net assets. In addition, FDC may pay financial intermediaries for selling shares of the Fund and providing shareholder support services. For the period, the Distribution and Service Fee rates, total fees and amounts retained by FDC were as follows:
| Distribution
Fee | Service
Fee | Total Fees | Retained
by FDC |
Class A | -% | .25% | $ 37,801 | $ 382 |
Class T | .25% | .25% | 53,002 | 142 |
Class B | .75% | .25% | 12,735 | 9,557 |
Class C | .75% | .25% | 81,661 | 5,650 |
| | | $ 185,199 | $ 15,731 |
Sales Load. FDC may receive a front-end sales charge of up to 5.75% for selling Class A shares and 3.50% for selling Class T shares, some of which is paid to financial intermediaries for selling shares of the Fund. Depending on the holding period, FDC may receive contingent deferred sales charges levied on Class A, Class T, Class B, and Class C redemptions. The deferred sales charges range from 5.00% to 1.00% for Class B shares, 1.00% for Class C shares, 1.00% for certain purchases of Class A shares and .25% for certain purchases of Class T shares.
For the period, sales charge amounts retained by FDC were as follows:
| Retained
by FDC |
Class A | $ 4,719 |
Class T | 1,996 |
Class B* | 272 |
Class C* | 1,068 |
| $ 8,055 |
* When Class B and Class C shares are initially sold, FDC pays commissions from its own resources to financial intermediaries through which the sales are made.
Annual Report
6. Fees and Other Transactions with Affiliates - continued
Transfer Agent Fees. Fidelity Investments Institutional Operations Company, Inc. (FIIOC), an affiliate of FMR, is the transfer, dividend disbursing and shareholder servicing agent for each class of the Fund. FIIOC receives account fees and asset-based fees that vary according to the account size and type of account of the shareholders of the respective classes of the Fund. FIIOC pays for typesetting, printing and mailing of shareholder reports, except proxy statements. For the period, transfer agent fees for each class were as follows:
| Amount | % of
Average
Net Assets |
Class A | $ 45,432 | .30 |
Class T | 32,311 | .31 |
Class B | 3,797 | .30 |
Class C | 24,474 | .30 |
International Small Cap | 2,079,534 | .28 |
Institutional Class | 17,849 | .17 |
| $ 2,203,397 | |
Accounting and Security Lending Fees. Fidelity Service Company, Inc. (FSC), an affiliate of FMR, maintains the Fund's accounting records. The accounting fee is based on the level of average net assets for each month. Under a separate contract, FSC administers the security lending program. The security lending fee is based on the number and duration of lending transactions.
Brokerage Commissions. The Fund placed a portion of its portfolio transactions with brokerage firms which are affiliates of the investment adviser. The commissions paid to these affiliated firms were $572 for the period.
7. Committed Line of Credit.
The Fund participates with other funds managed by FMR or an affiliate in a $4.25 billion credit facility (the "line of credit") to be utilized for temporary or emergency purposes to fund shareholder redemptions or for other short-term liquidity purposes. The Fund has agreed to pay commitment fees on its pro-rata portion of the line of credit, which amounted to $2,240 and is reflected in Miscellaneous expenses on the Statement of Operations. During the period, there were no borrowings on this line of credit.
Annual Report
Notes to Financial Statements - continued
8. Security Lending.
The Fund lends portfolio securities through a lending agent from time to time in order to earn additional income. For equity securities, a lending agent is used and may loan securities to certain qualified borrowers, including Fidelity Capital Markets (FCM), a broker-dealer affiliated with the Fund. On the settlement date of the loan, the Fund receives collateral (in the form of U.S. Treasury obligations, letters of credit and/or cash) against the loaned securities and maintains collateral in an amount not less than 100% of the market value of the loaned securities during the period of the loan. The market value of the loaned securities is determined at the close of business of the Fund and any additional required collateral is delivered to the Fund on the next business day. If the borrower defaults on its obligation to return the securities loaned because of insolvency or other reasons, a fund could experience delays and costs in recovering the securities loaned or in gaining access to the collateral. Any cash collateral received is invested in the Fidelity Securities Lending Cash Central Fund. The value of loaned securities and cash collateral at period end are disclosed on the Fund's Statement of Assets and Liabilities. At period end, there were no security loans outstanding with FCM. Security lending income represents the income earned on investing cash collateral, less rebates paid to borrowers and any lending agent fees associated with the loan, plus any premium payments received for lending certain types of securities. Security lending income is presented in the Statement of Operations as a component of income from Fidelity Central Funds and includes $32,573 from securities loaned to FCM.
9. Expense Reductions.
Many of the brokers with whom FMR places trades on behalf of the Fund provided services to the Fund in addition to trade execution. These services included payments of certain expenses on behalf of the Fund totaling $204,895 for the period.
10. Distributions to Shareholders.
Distributions to shareholders of each class were as follows:
Years ended October 31, | 2012 | 2011 |
From net investment income | | |
Class A | $ 98,060 | $ 15,709 |
Class T | 18,440 | - |
International Small Cap | 7,747,338 | 2,403,692 |
Institutional Class | 152,585 | 11,165 |
Total | $ 8,016,423 | $ 2,430,566 |
Annual Report
10. Distributions to Shareholders - continued
Years ended October 31, | 2012 | 2011 |
From net realized gain | | |
Class A | $ 246,964 | $ 648,961 |
Class T | 172,958 | 496,268 |
Class B | 15,448 | 87,007 |
Class C | 91,928 | 402,241 |
International Small Cap | 11,838,630 | 26,480,677 |
Institutional Class | 211,751 | 131,783 |
Total | $ 12,577,679 | $ 28,246,937 |
11. Share Transactions.
Transactions for each class of shares were as follows:
| Shares | Dollars |
Years ended October 31, | 2012 | 2011 | 2012 | 2011 |
Class A | | | | |
Shares sold | 190,464 | 472,219 | $ 3,581,689 | $ 10,051,889 |
Reinvestment of distributions | 18,159 | 30,361 | 323,949 | 616,326 |
Shares redeemed | (398,912) | (562,759) | (7,484,565) | (11,902,630) |
Net increase (decrease) | (190,289) | (60,179) | $ (3,578,927) | $ (1,234,415) |
Class T | | | | |
Shares sold | 67,193 | 237,757 | $ 1,245,760 | $ 5,055,416 |
Reinvestment of distributions | 10,478 | 24,155 | 185,991 | 486,714 |
Shares redeemed | (336,074) | (326,059) | (6,220,818) | (6,629,520) |
Net increase (decrease) | (258,403) | (64,147) | $ (4,789,067) | $ (1,087,390) |
Class B | | | | |
Shares sold | 1,171 | 21,873 | $ 21,568 | $ 464,854 |
Reinvestment of distributions | 825 | 4,142 | 14,430 | 81,975 |
Shares redeemed | (73,396) | (88,228) | (1,354,968) | (1,778,852) |
Net increase (decrease) | (71,400) | (62,213) | $ (1,318,970) | $ (1,232,023) |
Class C | | | | |
Shares sold | 95,047 | 128,685 | $ 1,772,779 | $ 2,661,361 |
Reinvestment of distributions | 4,830 | 19,105 | 84,289 | 378,079 |
Shares redeemed | (264,717) | (308,659) | (4,745,500) | (6,253,765) |
Net increase (decrease) | (164,840) | (160,869) | $ (2,888,432) | $ (3,214,325) |
International Small Cap | | | | |
Shares sold | 4,700,621 | 17,502,789 | $ 88,441,440 | $ 375,309,666 |
Reinvestment of distributions | 1,033,828 | 1,321,812 | 18,629,579 | 27,110,370 |
Shares redeemed | (15,631,544) | (13,398,001) | (292,428,231) | (275,580,654) |
Net increase (decrease) | (9,897,095) | 5,426,600 | $ (185,357,212) | $ 126,839,382 |
Annual Report
Notes to Financial Statements - continued
11. Share Transactions - continued
| Shares | Dollars |
Years ended October 31, | 2012 | 2011 | 2012 | 2011 |
Institutional Class | | | | |
Shares sold | 199,584 | 798,910 | $ 3,790,776 | $ 17,190,303 |
Reinvestment of distributions | 15,793 | 5,609 | 284,438 | 115,044 |
Shares redeemed | (559,093) | (384,085) | (10,329,992) | (7,925,094) |
Net increase (decrease) | (343,716) | 420,434 | $ (6,254,778) | $ 9,380,253 |
12. Other.
The Fund's organizational documents provide former and current trustees and officers with a limited indemnification against liabilities arising in connection with the performance of their duties to the Fund. In the normal course of business, the Fund may also enter into contracts that provide general indemnifications. The Fund's maximum exposure under these arrangements is unknown as this would be dependent on future claims that may be made against the Fund. The risk of material loss from such claims is considered remote.
At the end of the period, FMR or its affiliates were the owners of record of 14% of the total outstanding shares of the Fund.
Annual Report
Report of Independent Registered Public Accounting Firm
To the Trustees of Fidelity Investment Trust and Shareholders of Fidelity International Small Cap Fund:
We have audited the accompanying statement of assets and liabilities of Fidelity International Small Cap Fund (the Fund), a fund of Fidelity Investment Trust, including the schedule of investments, as of October 31, 2012, and the related statement of operations for the year then ended, the statement of changes in net assets for each of the two years in the period then ended, and the financial highlights for each of the five years in the period then ended. These financial statements and financial highlights are the responsibility of the Fund's management. Our responsibility is to express an opinion on these financial statements and financial highlights based on our audits.
We conducted our audits in accordance with the standards of the Public Company Accounting Oversight Board (United States). Those standards require that we plan and perform the audit to obtain reasonable assurance about whether the financial statements and financial highlights are free of material misstatement. The Fund is not required to have, nor were we engaged to perform, an audit of its internal control over financial reporting. Our audits included consideration of internal control over financial reporting as a basis for designing audit procedures that are appropriate in the circumstances, but not for the purpose of expressing an opinion on the effectiveness of the Fund's internal control over financial reporting. Accordingly, we express no such opinion. An audit also includes examining, on a test basis, evidence supporting the amounts and disclosures in the financial statements, assessing the accounting principles used and significant estimates made by management, as well as evaluating the overall financial statement presentation. Our procedures included confirmation of securities owned as of October 31, 2012, by correspondence with the custodians and brokers; where replies were not received from brokers, we performed other auditing procedures. We believe that our audits provide a reasonable basis for our opinion.
In our opinion, the financial statements and financial highlights referred to above present fairly, in all material respects, the financial position of Fidelity International Small Cap Fund as of October 31, 2012, the results of its operations for the year then ended, the changes in its net assets for each of the two years in the period then ended, and the financial highlights for each of the five years in the period then ended, in conformity with accounting principles generally accepted in the United States of America.
DELOITTE & TOUCHE LLP
Boston, Massachusetts
December 18, 2012
Annual Report
Trustees and Officers
The Trustees, Members of the Advisory Board, and executive officers of the trust and fund, as applicable, are listed below. The Board of Trustees governs the fund and is responsible for protecting the interests of shareholders. The Trustees are experienced executives who meet periodically throughout the year to oversee the fund's activities, review contractual arrangements with companies that provide services to the fund, oversee management of the risks associated with such activities and contractual arrangements, and review the fund's performance. Except for James C. Curvey, each of the Trustees oversees 236 funds advised by FMR or an affiliate. Mr. Curvey oversees 443 funds advised by FMR or an affiliate.
The Trustees hold office without limit in time except that (a) any Trustee may resign; (b) any Trustee may be removed by written instrument, signed by at least two-thirds of the number of Trustees prior to such removal; (c) any Trustee who requests to be retired or who has become incapacitated by illness or injury may be retired by written instrument signed by a majority of the other Trustees; and (d) any Trustee may be removed at any special meeting of shareholders by a two-thirds vote of the outstanding voting securities of the trust. Each Trustee who is not an interested person (as defined in the 1940 Act) (Independent Trustee), shall retire not later than the last day of the calendar year in which his or her 75th birthday occurs. The Independent Trustees may waive this mandatory retirement age policy with respect to individual Trustees. The executive officers and Advisory Board Members hold office without limit in time, except that any officer and Advisory Board Member may resign or may be removed by a vote of a majority of the Trustees at any regular meeting or any special meeting of the Trustees. Except as indicated, each individual has held the office shown or other offices in the same company for the past five years.
Experience, Skills, Attributes, and Qualifications of the Fund's Trustees. The Governance and Nominating Committee has adopted a statement of policy that describes the experience, qualifications, attributes, and skills that are necessary and desirable for potential Independent Trustee candidates (Statement of Policy). The Board believes that each Trustee satisfied at the time he or she was initially elected or appointed a Trustee, and continues to satisfy, the standards contemplated by the Statement of Policy. The Governance and Nominating Committee also engages professional search firms to help identify potential Independent Trustee candidates who have the experience, qualifications, attributes, and skills consistent with the Statement of Policy. From time to time, additional criteria based on the composition and skills of the current Independent Trustees, as well as experience or skills that may be appropriate in light of future changes to board composition, business conditions, and regulatory or other developments, have also been considered by the professional search firms and the Governance and Nominating Committee. In addition, the Board takes into account the Trustees' commitment and participation in Board and committee meetings, as well as their leadership of standing and ad hoc committees throughout their tenure.
In determining that a particular Trustee was and continues to be qualified to serve as a Trustee, the Board has considered a variety of criteria, none of which, in isolation, was controlling. The Board believes that, collectively, the Trustees have balanced and diverse experience, qualifications, attributes, and skills, which allow the Board to operate effectively in governing the fund and protecting the interests of shareholders. Information about the specific experience, skills, attributes, and qualifications of each Trustee, which in each case led to the Board's conclusion that the Trustee should serve (or continue to serve) as a trustee of the fund, is provided below.
Annual Report
Board Structure and Oversight Function. James C. Curvey is an interested person (as defined in the 1940 Act) and currently serves as Chairman. The Trustees have determined that an interested Chairman is appropriate and benefits shareholders because an interested Chairman has a personal and professional stake in the quality and continuity of services provided to the fund. Independent Trustees exercise their informed business judgment to appoint an individual of their choosing to serve as Chairman, regardless of whether the Trustee happens to be independent or a member of management. The Independent Trustees have determined that they can act independently and effectively without having an Independent Trustee serve as Chairman and that a key structural component for assuring that they are in a position to do so is for the Independent Trustees to constitute a substantial majority for the Board. The Independent Trustees also regularly meet in executive session. Ned C. Lautenbach serves as Chairman of the Independent Trustees and as such (i) acts as a liaison between the Independent Trustees and management with respect to matters important to the Independent Trustees and (ii) with management prepares agendas for Board meetings.
Fidelity funds are overseen by different Boards of Trustees. The fund's Board oversees Fidelity's equity and high income funds and another Board oversees Fidelity's investment-grade bond, money market, and asset allocation funds. The asset allocation funds may invest in Fidelity funds overseen by the fund's Board. The use of separate Boards, each with its own committee structure, allows the Trustees of each group of Fidelity funds to focus on the unique issues of the funds they oversee, including common research, investment, and operational issues. On occasion, the separate Boards establish joint committees to address issues of overlapping consequences for the Fidelity funds overseen by each Board.
The Trustees operate using a system of committees to facilitate the timely and efficient consideration of all matters of importance to the Trustees, the fund, and fund shareholders and to facilitate compliance with legal and regulatory requirements and oversight of the fund's activities and associated risks. The Board, acting through its committees, has charged FMR and its affiliates with (i) identifying events or circumstances the occurrence of which could have demonstrably adverse effects on the fund's business and/or reputation; (ii) implementing processes and controls to lessen the possibility that such events or circumstances occur or to mitigate the effects of such events or circumstances if they do occur; and (iii) creating and maintaining a system designed to evaluate continuously business and market conditions in order to facilitate the identification and implementation processes described in (i) and (ii) above. Because the day-to-day operations and activities of the fund are carried out by or through FMR, its affiliates and other service providers, the fund's exposure to risks is mitigated but not eliminated by the processes overseen by the Trustees. While each of the Board's committees has responsibility for overseeing different aspects of the fund's activities, oversight is exercised primarily through the Operations, Audit, and Compliance Committees. In addition, the Independent Trustees have worked with FMR to enhance the Board's oversight of investment and financial risks, legal and regulatory risks, technology risks, and operational risks, including the development of additional risk reporting to the Board. For example, a working group comprised of Independent Trustees and FMR has worked and continues to work to review the Fidelity funds' valuation-related activities, reporting and risk management. Appropriate personnel, including but not limited to the fund's Chief Compliance Officer (CCO), FMR's internal auditor, the independent accountants, the fund's Treasurer and portfolio management personnel, make periodic reports to the Board's committees, as appropriate, including an annual review of FMR's risk management program for the Fidelity funds. The responsibilities of each standing committee, including their oversight responsibilities, are described further under "Standing Committees of the Fund's Trustees."
Annual Report
Trustees and Officers - continued
The fund's Statement of Additional Information (SAI) includes more information about the Trustees. To request a free copy, call Fidelity at 1-877-208-0098.
Interested Trustees*:
Correspondence intended for each Trustee who is an interested person may be sent to Fidelity Investments, 82 Devonshire Street, Boston, Massachusetts 02109.
Name, Age; Principal Occupations and Other Relevant Experience+ |
James C. Curvey (77) |
| Year of Election or Appointment: 2007 Mr. Curvey is Trustee and Chairman of the Board of Trustees of certain Trusts. Mr. Curvey also serves as Trustee (2007-present) of other investment companies advised by FMR. Mr. Curvey is a Director of Fidelity Investments Money Management, Inc. (2009-present), Director of Fidelity Research & Analysis Co. (2009-present) and Director of FMR and FMR Co., Inc. (2007-present). Mr. Curvey is also Vice Chairman (2007-present) and Director of FMR LLC. In addition, Mr. Curvey serves as an Overseer for the Boston Symphony Orchestra and a member of the Trustees of Villanova University. Previously, Mr. Curvey was the Vice Chairman (2006-2007) and Director (2000-2007) of FMR Corp. |
Ronald P. O'Hanley (55) |
| Year of Election or Appointment: 2011 Mr. O'Hanley is Director of FMR Co., Inc. (2010-present), Director of Fidelity Investments Money Management, Inc. (2010-present), Director of Fidelity Research & Analysis Company (2010-present), President of Fidelity Asset Management and Corporate Services and a member of Fidelity's Executive Committee (2010-present). Previously, Mr. O'Hanley served as President and Chief Executive Officer of BNY Mellon Asset Management (2007-2010). Mr. O'Hanley also served as Vice Chairman of Bank New York Mellon Corp. and a member of that firm's Executive Committee. Prior to the 2007 merger of The Bank of New York and Mellon Financial Corporation, he was Vice Chairman of Mellon Financial Corporation and President and Chief Executive Officer of Mellon Asset Management. He joined Mellon in February 1997. Mr. O'Hanley currently serves as Chairman of the Boston Public Library Foundation Board of Directors and sits on the Board of Directors of Beth Israel Deaconess Medical Center, the Board of Trustees of the Marine Biological Laboratory and the Advisory Board of the Maxwell School of Citizenship and Public Administration at Syracuse University. Mr. O'Hanley also chairs the Council on Asset Management for the Financial Services Roundtable and is a member of the Board of Directors of Institutional Investor's U.S. Institute. |
* Trustees have been determined to be "Interested Trustees" by virtue of, among other things, their affiliation with the trust or various entities under common control with FMR.
+ The information above includes each Trustee's principal occupation during the last five years and other information relating to the experience, attributes, and skills relevant to each Trustee's qualifications to serve as a Trustee, which led to the conclusion that each Trustee should serve as a Trustee for the fund.
Annual Report
Trustees and Officers - continued
Independent Trustees:
Correspondence intended for each Independent Trustee (that is, the Trustees other than the Interested Trustees) may be sent to Fidelity Investments, P.O. Box 55235, Boston, Massachusetts 02205-5235.
Name, Age; Principal Occupations and Other Relevant Experience+ |
Dennis J. Dirks (64) |
| Year of Election or Appointment: 2005 Prior to his retirement in May 2003, Mr. Dirks was Chief Operating Officer and a member of the Board of The Depository Trust & Clearing Corporation (DTCC). He also served as President, Chief Operating Officer, and Board member of The Depository Trust Company (DTC) and President and Board member of the National Securities Clearing Corporation (NSCC). In addition, Mr. Dirks served as Chief Executive Officer and Board member of the Government Securities Clearing Corporation, Chief Executive Officer and Board member of the Mortgage-Backed Securities Clearing Corporation, as a Trustee and a member of the Finance Committee of Manhattan College (2005-2008), and as a Trustee and a member of the Finance Committee of AHRC of Nassau County (2006-2008). Mr. Dirks is a member of the Independent Directors Council (IDC) Governing Council (2010-present) and Board of Directors for The Brookville Center for Children's Services, Inc. (2009-present). |
Alan J. Lacy (59) |
| Year of Election or Appointment: 2008 Mr. Lacy serves as Senior Adviser (2007-present) of Oak Hill Capital Partners, L.P. (private equity). Mr. Lacy also served as Chief Executive Officer (2000-2005) and Vice Chairman (2005-2006) of Sears Holdings Corporation and Sears, Roebuck and Co. (retail). In addition, Mr. Lacy serves as a member of the Board of Directors of Dave & Buster's Entertainment, Inc. (restaurant and entertainment complexes, 2010-present), Earth Fare, Inc. (retail grocery, 2012-present), The Hillman Companies, Inc. (hardware wholesalers, 2010-present), and Bristol-Myers Squibb Company (global pharmaceuticals, 2008-present). Mr. Lacy is a member of the Board of Trustees of The National Parks Conservation Association (2006-present). Previously, Mr. Lacy served as Chairman of the Board of Trustees of the National Parks Conservation Association (2008-2011) and as a member of the Board of Directors for the Western Union Company (global money transfer, 2006-2011). |
Ned C. Lautenbach (68) |
| Year of Election or Appointment: 2000 Mr. Lautenbach is Chairman of the Independent Trustees of the Equity and High Income Funds (2006-present). Mr. Lautenbach currently serves as the Lead Director of the Eaton Corporation Board of Directors (diversified industrial, 1997-present). Mr. Lautenbach is Chairman of the Board of Directors of the Philharmonic Center for the Arts in Naples, Florida (2012-present) and a member of the Council on Foreign Relations (1994-present). Previously, Mr. Lautenbach was a Partner/Advisory Partner at Clayton, Dubilier & Rice, LLC (private equity investment, 1998-2010), as well as a Director of Sony Corporation (2006-2007). |
Joseph Mauriello (68) |
| Year of Election or Appointment: 2008 Prior to his retirement in January 2006, Mr. Mauriello served in numerous senior management positions including Deputy Chairman and Chief Operating Officer (2004-2005), and Vice Chairman of Financial Services (2002-2004) of KPMG LLP US (professional services, 1965-2005). Mr. Mauriello currently serves as a member of the Board of Directors of XL Group plc. (global insurance and re-insurance, 2006-present). Previously, Mr. Mauriello served as a Director of the Hamilton Funds of the Bank of New York (2006-2007) and of Arcadia Resources Inc. (health care services and products, 2007-2012). |
Robert W. Selander (62) |
| Year of Election or Appointment: 2011 Previously, Mr. Selander served as a Member of the Advisory Board of Fidelity's Equity and High Income Funds (2011), Executive Vice Chairman (2010), Chief Executive Officer (2009-2010), and President and Chief Executive Officer (1997-2009) of Mastercard, Inc. |
Cornelia M. Small (68) |
| Year of Election or Appointment: 2005 Ms. Small is a member of the Board of Directors (2009-present) and Chair of the Investment Committee (2010-present) of the Teagle Foundation. Ms. Small also serves on the Investment Committee of the Berkshire Taconic Community Foundation (2008-present). Previously, Ms. Small served as Chairperson (2002-2008) and a member of the Investment Committee and Chairperson (2008-2012) and a member of the Board of Trustees of Smith College. In addition, Ms. Small served as Chief Investment Officer, Director of Global Equity Investments, and a member of the Board of Directors of Scudder, Stevens & Clark and Scudder Kemper Investments. |
William S. Stavropoulos (73) |
| Year of Election or Appointment: 2001 Mr. Stavropoulos is Vice Chairman of the Independent Trustees of the Equity and High Income Funds (2006-present). Mr. Stavropoulos serves as President and Founder of the Michigan Baseball Foundation, the Great Lakes Loons (2007-present). Mr. Stavropoulos is Chairman Emeritus of the Board of Directors of The Dow Chemical Company, where he previously served in numerous senior management positions, including President, CEO (1995-2000; 2002-2004), Chairman of the Executive Committee (2000-2006), and as a member of the Board of Directors (1990-2006). Currently, Mr. Stavropoulos is a Director of Univar Inc. (global distributor of commodity and specialty chemicals, Chairman from 2010-May 2012 and Lead Director from May 2012-present), Teradata Corporation (data warehousing and technology solutions, 2008-present), Maersk Inc. (industrial conglomerate), and Tyco International, Ltd. (multinational manufacturing and services, 2007-present), and a member of the Advisory Board for Metalmark Capital LLC (private equity investment, 2005-present). Mr. Stavropoulos is an operating advisor to Clayton, Dubilier & Rice, LLC (private equity investment). In addition, Mr. Stavropoulos is a member of the University of Notre Dame Advisory Council for the College of Science, a Trustee of the Rollin L. Gerstacker Foundation, and a Director of the Naples Philharmonic Center for the Arts. Previously, Mr. Stavropoulos served as a Director of Chemical Financial Corporation (bank holding company, 1993-2012). |
David M. Thomas (63) |
| Year of Election or Appointment: 2008 Previously, Mr. Thomas served as Executive Chairman (2005-2006) and Chairman and Chief Executive Officer (2000-2005) of IMS Health, Inc. (pharmaceutical and healthcare information solutions), and a Director of Fortune Brands, Inc. (consumer products, 2000-2011). In addition, Mr. Thomas serves as Non-Executive Chairman of the Board of Directors of Fortune Brands Home and Security (home and security products, 2011-present), and as a member of the Board of Directors of Interpublic Group of Companies, Inc. (marketing communication, 2004-present). |
Michael E. Wiley (62) |
| Year of Election or Appointment: 2008 Mr. Wiley also serves as a Director of Asia Pacific Exploration Consolidated (international oil and gas exploration and production, 2008-present). Mr. Wiley serves as a Director of Tesoro Corporation (independent oil refiner and marketer, 2005-present), and a Director of Bill Barrett Corporation (exploration and production, 2005-present). In addition, Mr. Wiley also serves as a Director of Post Oak Bank (privately-held bank, 2004-present). Previously, Mr. Wiley served as a member of the Board of Trustees of the University of Tulsa (2000-2006; 2007-2010), as a Senior Energy Advisor of Katzenbach Partners, LLC (consulting, 2006-2007), as an Advisory Director of Riverstone Holdings (private investment), Chairman, President, and CEO of Baker Hughes, Inc. (oilfield services, 2000-2004), and as Director of Spinnaker Exploration Company (exploration and production, 2001-2005). |
+ The information above includes each Trustee's principal occupation during the last five years and other information relating to the experience, attributes, and skills relevant to each Trustee's qualifications to serve as a Trustee, which led to the conclusion that each Trustee should serve as a Trustee for the fund.
Advisory Board Members and Executive Officers:
Correspondence intended for David A. Rosow and Garnett A. Smith may be sent to Fidelity Investments, P.O. Box 55235, Boston, Massachusetts 02205-5235. Correspondence intended for each executive officer, Edward C. Johnson 3d, and Peter S. Lynch may be sent to Fidelity Investments, 82 Devonshire Street, Boston, Massachusetts 02109.
Name, Age; Principal Occupation |
Edward C. Johnson 3d (82) |
| Year of Election or Appointment: 2011 Member of the Advisory Board of Fidelity's Equity and High Income Funds. Mr. Johnson serves as Chief Executive Officer, Chairman, and a Director of FMR LLC, and also serves as Chairman and Director of FIL Limited. Previously, Mr. Johnson served as a Trustee and Chairman of the Board of certain Fidelity Trusts, Chairman and a Director of FMR, Chairman and a Director of FMR Co., Inc., and President of FMR LLC (2006-2007). |
Peter S. Lynch (68) |
| Year of Election or Appointment: 2003 Member of the Advisory Board of Fidelity's Equity and High Income Funds. Mr. Lynch is Vice Chairman and a Director of FMR and FMR Co., Inc. In addition, Mr. Lynch serves as a Trustee of Boston College and as the Chairman of the Inner-City Scholarship Fund. Previously, Mr. Lynch served on the Special Olympics International Board of Directors (1997-2006). |
David A. Rosow (70) |
| Year of Election or Appointment: 2012 Member of the Advisory Board of Fidelity's Equity and High Income Funds. Chairman and Chief Executive Officer of International Golf Group, Inc. (golf course development, 1989-present). Previously, Mr. Rosow served as Chairman and Chief Executive Officer of Rosow & Company, Inc. (private investment company, 1989-2011), a Lead Director of Hudson United Bancorp (2001-2006) and as a Director of TD Banknorth (1996-2006). In addition, Mr. Rosow is a member (2008-present) and President (2009-present) of the Town Council of Palm Beach, Florida. |
Garnett A. Smith (65) |
| Year of Election or Appointment: 2012 Member of the Advisory Board of Fidelity's Equity and High Income Funds. Prior to Mr. Smith's retirement, he served as Chairman and Chief Executive Officer of Inbrand Corp. (manufacturer of personal absorbent products, 1990-1997). He also served as President (1986-1990) of Inbrand Corp. Prior to his employment with Inbrand Corp., he was employed by a retail fabric chain and North Carolina National Bank. In addition, Mr. Smith is a board member of the Jackson Hole Land Trust (2009-present). |
Kenneth B. Robins (43) |
| Year of Election or Appointment: 2008 President and Treasurer of Fidelity's Equity and High Income Funds. Mr. Robins also serves as President and Treasurer (2010-present) and Assistant Treasurer (2009-present) of other Fidelity funds and is an employee of Fidelity Investments (2004-present). Previously, Mr. Robins served as Deputy Treasurer of the Fidelity funds (2005-2008) and Treasurer and Chief Financial Officer of The North Carolina Capital Management Trust: Cash and Term Portfolios (2006-2008). |
Bruce T. Herring (47) |
| Year of Election or Appointment: 2006 Vice President of certain Equity Funds. Mr. Herring also serves as President of Fidelity Research & Analysis Company (2010-present), Chief Investment Officer and Director of Fidelity Management & Research (U.K.) Inc. (2010-present) and Group Chief Investment Officer of FMR. Previously, Mr. Herring served as Vice President (2005-2006) and Senior Vice President (2006-2007) of Fidelity Management & Research Company, Vice President of FMR Co., Inc. (2001-2007) and as a portfolio manager for Fidelity U.S. Equity Funds. |
Brian B. Hogan (48) |
| Year of Election or Appointment: 2009 Vice President of Equity and High Income Funds. Mr. Hogan also serves as President of FMR's Equity Division (2009-present). Previously, Mr. Hogan served as Senior Vice President, Equity Research of FMR (2006-2009) and as a portfolio manager. |
Scott C. Goebel (44) |
| Year of Election or Appointment: 2008 Secretary and Chief Legal Officer (CLO) of the Fidelity funds. Mr. Goebel also serves as Secretary of Fidelity Investments Money Management, Inc. (FIMM) (2010-present) and Fidelity Research and Analysis Company (FRAC) (2010-present); Secretary and CLO of The North Carolina Capital Management Trust: Cash and Term Portfolios (2008-present); General Counsel, Secretary, and Senior Vice President of FMR (2008-present) and FMR Co., Inc. (2008-present); employed by FMR LLC or an affiliate (2001-present); Chief Legal Officer of Fidelity Management & Research (Hong Kong) Limited (2008-present) and Assistant Secretary of Fidelity Management & Research (Japan) Inc. (2008-present), and Fidelity Management & Research (U.K.) Inc. (2008-present). Previously, Mr. Goebel served as Assistant Secretary of FIMM (2008-2010), FRAC (2008-2010), and the Funds (2007-2008) and as Vice President and Secretary of Fidelity Distributors Corporation (FDC) (2005-2007). |
William C. Coffey (43) |
| Year of Election or Appointment: 2009 Assistant Secretary of Fidelity's Equity and High Income Funds. Mr. Coffey also serves as Senior Vice President and Deputy General Counsel of FMR LLC (2010-present), and is an employee of Fidelity Investments. Previously, Mr. Coffey served as Vice President and Associate General Counsel of FMR LLC (2005-2009). |
Elizabeth Paige Baumann (44) |
| Year of Election or Appointment: 2012 Anti-Money Laundering (AML) Officer of the Fidelity funds. Ms. Baumann also serves as AML Officer of The North Carolina Capital Management Trust: Cash and Term Portfolios (2012-present), Chief AML Officer of FMR LLC (2012-present), and is an employee of Fidelity Investments. Previously, Ms. Baumann served as Vice President and Deputy Anti-Money Laundering Officer (2007-2012). |
Christine Reynolds (54) |
| Year of Election or Appointment: 2008 Chief Financial Officer of the Fidelity funds. Ms. Reynolds became President of Fidelity Pricing and Cash Management Services (FPCMS) in August 2008. Ms. Reynolds served as Chief Operating Officer of FPCMS (2007-2008). Previously, Ms. Reynolds served as President, Treasurer, and Anti-Money Laundering officer of the Fidelity funds (2004-2007). |
Joseph A. Hanlon (44) |
| Year of Election or Appointment: 2012 Chief Compliance Officer of Fidelity's Equity and High Income Funds. Mr. Hanlon serves as Compliance Officer of FMR, FMR Co., Inc., Fidelity Investments Money Management, Inc. (FIMM), Fidelity Research and Analysis Company (FRAC), Fidelity Management & Research (Japan) Inc., Fidelity Management & Research (U.K.) Inc., Fidelity Management & Research (Hong Kong), and Strategic Advisers, Inc. (2009-present), as Senior Vice President of the Fidelity Asset Management Division (2009-present), and is an employee of Fidelity Investments. |
Joseph F. Zambello (55) |
| Year of Election or Appointment: 2011 Deputy Treasurer of the Fidelity funds. Mr. Zambello is an employee of Fidelity Investments. Previously, Mr. Zambello served as Vice President of FMR's Program Management Group (2009-2011) and Vice President of the Transfer Agent Oversight Group (2005-2009). |
Adrien E. Deberghes (45) |
| Year of Election or Appointment: 2008 Deputy Treasurer of Fidelity's Equity and High Income Funds. Mr. Deberghes also serves as Vice President (2011-present) and Assistant Treasurer (2010-present) of other Fidelity funds, and is an employee of Fidelity Investments (2008-present). Previously, Mr. Deberghes served as Senior Vice President of Mutual Fund Administration at State Street Corporation (2007-2008), Senior Director of Mutual Fund Administration at Investors Bank & Trust (2005-2007), and Director of Finance for Dunkin' Brands (2000-2005). |
Stephen Sadoski (41) |
| Year of Election or Appointment: 2012 Deputy Treasurer of Fidelity's Equity and High Income Funds. Mr. Sadoski also serves as Assistant Treasurer of other Fidelity funds (2012-present) and is an employee of Fidelity Investments (2012-present). Previously, Mr. Sadoski served as an assistant chief accountant in the Division of Investment Management of the Securities and Exchange Commission (SEC) (2009-2012) and as a senior manager at Deloitte & Touche (1997-2009). |
Stephanie J. Dorsey (43) |
| Year of Election or Appointment: 2010 Assistant Treasurer of Fidelity's Equity and High Income Funds. Ms. Dorsey also serves as Deputy Treasurer of other Fidelity funds (2008-present) and is an employee of Fidelity Investments (2008-present). Previously, Ms. Dorsey served as Treasurer (2004-2008) of the JPMorgan Mutual Funds and Vice President (2004-2008) of JPMorgan Chase Bank. |
John R. Hebble (54) |
| Year of Election or Appointment: 2009 Assistant Treasurer of Fidelity's Equity and High Income Funds. Mr. Hebble also serves as President (2011-present), Treasurer, and Chief Financial Officer of The North Carolina Capital Management Trust: Cash and Term Portfolios (2008-present), President and Treasurer of other Fidelity funds (2008-present) and is an employee of Fidelity Investments. |
Gary W. Ryan (54) |
| Year of Election or Appointment: 2005 Assistant Treasurer of the Fidelity funds. Mr. Ryan is an employee of Fidelity Investments. Previously, Mr. Ryan served as Vice President of Fund Reporting in Fidelity Pricing and Cash Management Services (FPCMS) (1999-2005). |
Jonathan Davis (44) |
| Year of Election or Appointment: 2010 Assistant Treasurer of the Fidelity funds. Mr. Davis is also Assistant Treasurer of Fidelity Rutland Square Trust II and Fidelity Commonwealth Trust II. Mr. Davis is an employee of Fidelity Investments. Previously, Mr. Davis served as Vice President and Associate General Counsel of FMR LLC (2003-2010). |
Annual Report
Distributions
The Board of Trustees of Advisor International Small Cap Fund voted to pay to shareholders of record at the opening of business on record date, the following distributions per share derived from capital gains realized from sales of portfolio securities, and dividends derived from net investment income:
| Pay Date | Record Date | Dividends | Capital Gains |
Institutional Class | 12/10/12 | 12/07/12 | $0.164 | $0.327 |
Institutional Class designates 1% of the dividend distributed during the fiscal year as qualifying for the dividends-received deduction for corporate shareholders.
Institutional Class designates 65% of the dividend distributed during the fiscal year as amounts which may be taken into account as a dividend for purposes of the maximum rate under section 1(h)(11) of the Internal Revenue Code.
The amounts per share which represent income derived from sources within, and taxes paid to, foreign countries or possessions of the United States are as follows:
| Pay Date | Income | Taxes |
Institutional Class | 12/05/2011 | $0.255 | $0.0215 |
The fund will notify shareholders in January 2013 of amounts for use in preparing 2012 income tax returns.
Annual Report
Board Approval of Investment Advisory Contracts and Management Fees
Fidelity International Small Cap Fund
Each year, the Board of Trustees, including the Independent Trustees (together, the Board), votes on the renewal of the management contract and sub-advisory agreements (together, the Advisory Contracts) for the fund. The Board, assisted by the advice of fund counsel and Independent Trustees' counsel, requests and considers a broad range of information relevant to the renewal of the Advisory Contracts throughout the year.
The Board meets regularly and, at each of its meetings, considers factors that are relevant to its annual consideration of the renewal of the fund's Advisory Contracts, including the services and support provided to the fund and its shareholders. The Board has established various standing committees, each composed of and chaired by Independent Trustees with varying backgrounds, to which the Board has assigned specific subject matter responsibilities in order to enhance effective decision-making by the Board. The Board, acting directly and through its Committees, requests and receives information concerning the annual consideration of the renewal of the fund's Advisory Contracts. The Board also meets as needed to consider matters specifically related to the Board's annual consideration of the renewal of Advisory Contracts. Members of the Board may also meet with trustees of other Fidelity funds through ad hoc joint committees to discuss certain matters relevant to the Fidelity funds.
At its July 2012 meeting, the Board of Trustees, including the Independent Trustees, unanimously determined to renew the fund's Advisory Contracts. In reaching its determination, the Board considered all factors it believed relevant, including (i) the nature, extent, and quality of the services to be provided to the fund and its shareholders (including the investment performance of the fund); (ii) the competitiveness of the fund's management fee and total expense ratio relative to peer funds; (iii) the total costs of the services to be provided by and the profits to be realized by Fidelity from its relationship with the fund; (iv) the extent to which economies of scale exist and would be realized as the fund grows; and (v) whether fee levels reflect these economies of scale, if any, for the benefit of fund shareholders.
In considering whether to renew the Advisory Contracts for the fund, the Board reached a determination, with the assistance of fund counsel and Independent Trustees' counsel and through the exercise of its business judgment, that the renewal of the Advisory Contracts is in the best interests of the fund and its shareholders and that the compensation payable under the Advisory Contracts is fair and reasonable. The Board's decision to renew the Advisory Contracts was not based on any single factor, but rather was based on a comprehensive consideration of all the information provided to the Board at its meetings throughout the year. The Board, in reaching its determination to renew the Advisory Contracts, is aware that shareholders in the fund have a broad range of investment choices available to them, including a wide choice among mutual funds offered by Fidelity's competitors, and that the fund's shareholders, who have the opportunity to review and weigh the disclosure provided by the fund in its prospectus and other public disclosures, have chosen to invest in this fund, managed by Fidelity.
Annual Report
Board Approval of Investment Advisory Contracts and
Management Fees - continued
Nature, Extent, and Quality of Services Provided. The Board considered the staffing within the investment adviser, FMR, and the sub-advisers (together, the Investment Advisers), including the backgrounds of the fund's investment personnel, and also considered the fund's investment objective, strategies, and related investment philosophy. The Independent Trustees also had discussions with senior management of Fidelity's investment operations and investment groups. The Board considered the structure of the portfolio manager compensation program and whether this structure provides appropriate incentives to act in the best interests of the fund.
Resources Dedicated to Investment Management and Support Services. The Board and the Fund Oversight and Research Committees reviewed the general qualifications and capabilities of the Investment Advisers' investment staff, including its size, education, experience, and resources, as well as the Investment Advisers' approach to recruiting, training, managing, and compensating investment personnel. The Board also noted that FMR has continued to increase the resources devoted to non-U.S. offices, including expansion of Fidelity's global investment organization. The Board noted that Fidelity's analysts have extensive resources, tools and capabilities that allow them to conduct sophisticated quantitative and fundamental analysis, as well as credit analysis of issuers, counterparties and guarantors. The Board also believes that Fidelity's investment professionals have sufficient access to global information and data so as to provide competitive investment results over time, and that those professionals also have access to sophisticated tools that permit them to assess portfolio construction and risk and performance attribution characteristics continuously, as well as to transmit new information and research conclusions rapidly around the world. Additionally, in its deliberations, the Board considered the Investment Advisers' trading and risk management capabilities and resources, which are an integral part of the investment management process.
Shareholder and Administrative Services. The Board considered (i) the nature, extent, quality, and cost of advisory, administrative, and shareholder services performed by the Investment Advisers and their affiliates under the Advisory Contracts and under separate agreements covering transfer agency, pricing and bookkeeping, and securities lending services for the fund; (ii) the nature and extent of the supervision of third party service providers, principally custodians and subcustodians; and (iii) the resources devoted to, and the record of compliance with, the fund's compliance policies and procedures. The Board also reviewed the allocation of fund brokerage, including allocations to brokers affiliated with the Investment Advisers, the use of brokerage commissions to pay fund expenses, and the use of "soft" commission dollars to pay for research services.
Annual Report
The Board noted that the growth of fund assets over time across the complex allows Fidelity to reinvest in the development of services designed to enhance the value or convenience of the Fidelity funds as investment vehicles. These services include 24-hour access to account information and market information through telephone representatives and over the Internet, investor education materials and asset allocation tools, and the expanded availability of Fidelity Investor Centers.
Investment in a Large Fund Family. The Board considered the benefits to shareholders of investing in a Fidelity fund, including the benefits of investing in a fund that is part of a large family of funds offering a variety of investment disciplines and providing a large variety of mutual fund investor services. The Board noted that Fidelity had taken, or had made recommendations that resulted in the Fidelity funds taking, a number of actions over the previous year that benefited particular funds, including (i) continuing to dedicate additional resources to investment research and support of the senior management team that oversees asset management; (ii) persisting in efforts to enhance Fidelity's research capabilities, in particular, international research; (iii) launching new funds and making other enhancements to meet client needs for global and income-oriented solutions; (iv) continuing to launch dedicated lower cost underlying funds to meet investment management's portfolio construction needs related to expanding underlying fund options, specifically for the Freedom Fund product lines; (v) adopting a "Stock Selector" sector neutral investment approach and employing a team of portfolio managers who are sector specialists to manage certain funds; (vi) rationalizing product lines and gaining increased efficiencies through the mergers of several funds into other funds; (vii) strengthening the Spartan Index Fund product line by adding new funds and/or new low-cost institutional share classes, restructuring fund expenses to accommodate new classes, and reducing investment minimums for certain classes of shares; (viii) modifying the eligibility criteria for Institutional Class shares to increase their appeal to government entities and charitable investors; and (ix) reducing certain transfer agent fee rates.
Investment Performance. The Board considered whether the fund has operated in accordance with its investment objective, as well as its record of compliance with its investment restrictions. It also reviewed the fund's absolute investment performance for each class, as well as the fund's relative investment performance for each class measured over multiple periods against (i) a broad-based securities market index, and (ii) a peer group of mutual funds deemed appropriate by Fidelity and reviewed by the Board. The following charts considered by the Board show, over the one-, three-, and five-year periods ended December 31, 2011, the cumulative total returns of Institutional Class (Class I) and Class B of the fund, the cumulative total returns of a broad-based securities market index ("benchmark"), and a range of cumulative total returns of a peer group of mutual funds identified by Lipper Inc. as having an investment objective similar to that of the fund. The returns of Institutional Class (Class I) and Class B show the performance of the highest and lowest performing classes, respectively (based on five-year performance). The box within each chart shows the 25th percentile return (top of box) and the 75th percentile return (bottom of box) of the peer group. Returns shown above the box are in the first quartile and returns shown below the box are in the fourth quartile. The percentage beaten numbers noted below each chart correspond to the percentile box and represent the percentage of funds in the peer group whose performance was equal to or lower than that of the class indicated.
Annual Report
Board Approval of Investment Advisory Contracts and
Management Fees - continued
Fidelity International Small Cap Fund

The Board reviewed the fund's relative investment performance against its peer group and noted that the performance of Institutional Class (Class I) of the fund was in the second quartile for all the periods shown. The Board also noted that the investment performance of Institutional Class (Class I) of the fund compared favorably to its benchmark for all the periods shown. The Board considered that the variations in performance among the fund's classes reflect the variations in class expenses, which result in lower performance for higher expense classes. The Board noted that there was a portfolio management change for the fund in November 2011. The Board also reviewed the fund's performance since inception as well as performance in the current year.
The Board also considered that the fund's management fee is subject to upward or downward adjustment depending upon whether, and to what extent, the fund's investment performance for the performance period exceeds, or is exceeded by, the record (over the same period) of a Board-approved performance adjustment index. The Board noted that the performance adjustment provides FMR with a strong economic incentive to seek to achieve superior performance for the fund's shareholders and helps to more closely align the interests of FMR and the fund's shareholders.
Annual Report
Based on its review, the Board concluded that the nature, extent, and quality of services provided to the fund under the Advisory Contracts should benefit the fund's shareholders.
Competitiveness of Management Fee and Total Expense Ratio. The Board considered the fund's management fee and total expense ratio compared to "mapped groups" of competitive funds and classes. Fidelity creates "mapped groups" by combining similar Lipper investment objective categories that have comparable management fee characteristics. Combining Lipper investment objective categories aids the Board's management fee and total expense ratio comparisons by broadening the competitive group used for comparison and by reducing the number of universes to which various Fidelity funds are compared.
Management Fee. The Board considered two proprietary management fee comparisons for the 12-month periods shown in the chart below. The group of Lipper funds used by the Board for management fee comparisons is referred to below as the "Total Mapped Group." The Total Mapped Group is broader than the Lipper peer group used by the Board for performance comparisons because the Total Mapped Group combines several Lipper investment objective categories while the Lipper peer group does not. The Total Mapped Group comparison focuses on a fund's standing relative to the total universe of comparable funds available to investors in terms of gross management fees before expense reimbursements or caps, and without giving effect to the fund's performance adjustment. "TMG %" represents the percentage of funds in the Total Mapped Group that had management fees that were lower than the fund's. For example, a TMG % of 19% means that 81% of the funds in the Total Mapped Group had higher management fees than the fund. The "Asset-Size Peer Group" (ASPG) comparison focuses on a fund's standing relative to non-Fidelity funds similar in size to the fund within the Total Mapped Group. The ASPG represents at least 15% of the funds in the Total Mapped Group with comparable asset size and management fee characteristics, subject to a minimum of 50 funds (or all funds in the Total Mapped Group if fewer than 50). Additional information, such as the ASPG quartile in which the fund's management fee ranked and the impact of the fund's performance adjustment, is also included in the chart and considered by the Board.
Annual Report
Board Approval of Investment Advisory Contracts and
Management Fees - continued
Fidelity International Small Cap Fund

The Board noted that the fund's management fee ranked below the median of its Total Mapped Group and below the median of its ASPG for 2011. The Board also noted the effect of the fund's positive performance adjustment on the fund's management fee ranking. The Board noted that the performance adjustment for each year represents calculations for performance periods that differ from the periods shown in the performance charts above.
Based on its review, the Board concluded that the fund's management fee is fair and reasonable in light of the services that the fund receives and the other factors considered.
Total Expense Ratio. In its review of each class's total expense ratio, the Board considered the fund's management fee as well as other fund or class expenses, as applicable, such as transfer agent fees, pricing and bookkeeping fees, fund-paid 12b-1 fees, and custodial, legal, and audit fees. The Board also noted the effects of any waivers and reimbursements on fees and expenses, as well as the impact of the fund's performance adjustment. As part of its review, the Board also considered the current and historical total expense ratios of each class of the fund compared to competitive fund median expenses. Each class of the fund is compared to those funds and classes in the Total Mapped Group (used by the Board for management fee comparisons) that have a similar sales load structure.
The Board noted that the total expense ratio of each of Class A, Class B, Class C, Institutional Class, and the retail class ranked below its competitive median for 2011 and the total expense ratio of Class T ranked above its competitive median for 2011. The Board considered that various factors, including 12b-1 fees, positive or negative performance adjustments, and relatively higher other expenses in the case of small fund size, can affect total expense ratios. The Board noted that the total expense ratio of Class T was above the competitive median primarily because of higher 12b-1 fees on Class T. Class T has a higher 12b-1 fee, but a lower front-end sales charge, than traditionally priced front-end sales charge classes. The Board considered that Class T is primarily sold load-waived in the retirement plan market where its 0.50% 12b-1 fee is comparable to competing no-load, higher 12b-1 fee classes designed specifically for retirement plans. The Board noted that the fund offers multiple classes, each of which has a different sales load and 12b-1 fee structure, and that the multiple structures are intended to offer a range of pricing options for the intermediary market. The Board also noted that the total expense ratios of the classes vary primarily by the level of their 12b-1 fees, although differences in transfer agent fees may also cause expenses to vary from class to class.
Annual Report
Fees Charged to Other Fidelity Clients. The Board also considered Fidelity fee structures and other information with respect to clients of FMR and its affiliates, such as other mutual funds advised or subadvised by FMR or its affiliates, pension plan clients, and other institutional clients. The Board noted the findings of the 2010 ad hoc joint committee (created with the board of other Fidelity funds), which reviewed and compared Fidelity's institutional investment advisory business with its business of providing services to the Fidelity funds, including the differences in services provided, fees charged, and costs incurred, as well as competition in their respective marketplaces.
Based on its review of total expense ratios and fees charged to other Fidelity clients, the Board concluded that the total expense ratio of each class of the fund was reasonable, although Class T was above the median of the universe presented for comparison, in light of the services that the fund and its shareholders receive and the other factors considered.
Costs of the Services and Profitability. The Board considered the revenues earned and the expenses incurred by Fidelity in conducting the business of developing, marketing, distributing, managing, administering and servicing the fund and its shareholders. The Board also considered the level of Fidelity's profits in respect of all the Fidelity funds.
On an annual basis, FMR presents to the Board Fidelity's profitability for the fund. Fidelity calculates the profitability for each fund, as well as aggregate profitability for groups of Fidelity funds and all Fidelity funds, using a series of detailed revenue and cost allocation methodologies which originate with the books and records of Fidelity on which Fidelity's audited financial statements are based. The Audit Committee of the Board reviews any significant changes from the prior year's methodologies.
PricewaterhouseCoopers LLP (PwC), independent registered public accounting firm and auditor to Fidelity and certain Fidelity funds, has been engaged annually by the Board as part of the Board's assessment of Fidelity's profitability analysis. PwC's engagement includes the review and assessment of Fidelity's methodologies used in determining the revenues and expenses attributable to Fidelity's mutual fund business, and completion of agreed-upon procedures surrounding the mathematical accuracy of fund profitability and its conformity to allocation methodologies. After considering PwC's reports issued under the engagement and information provided by Fidelity, the Board concluded that while other allocation methods may also be reasonable, Fidelity's profitability methodologies are reasonable in all material respects.
Annual Report
Board Approval of Investment Advisory Contracts and
Management Fees - continued
The Board also reviewed Fidelity's non-fund businesses and fall-out benefits related to the mutual fund business as well as cases where Fidelity's affiliates may benefit from or be related to the fund's business.
The Board considered the costs of the services provided by and the profits realized by Fidelity in connection with the operation of the fund and was satisfied that the profitability was not excessive in the circumstances.
Economies of Scale. The Board considered whether there have been economies of scale in respect of the management of the Fidelity funds, whether the Fidelity funds (including the fund) have appropriately benefited from any such economies of scale, and whether there is potential for realization of any further economies of scale. The Board considered the extent to which the fund will benefit from economies of scale through increased services to the fund, through waivers or reimbursements, or through fee or expense reductions. The Board also noted that in 2009, it and the board of other Fidelity funds created an ad hoc committee (the Economies of Scale Committee) to analyze whether FMR attains economies of scale in respect of the management and servicing of the Fidelity funds, whether the Fidelity funds have appropriately benefited from such economies of scale, and whether there is potential for realization of any further economies of scale.
The Board recognized that the fund's management contract incorporates a "group fee" structure, which provides for lower group fee rates as total fund assets under FMR's management increase, and for higher group fee rates as total fund assets under FMR's management decrease. FMR calculates the group fee rates based on a tiered asset "breakpoint" schedule that varies based on asset class. The Board considered that the group fee is designed to deliver the benefits of economies of scale to fund shareholders when total Fidelity fund assets increase, even if assets of any particular fund are unchanged or have declined, because some portion of Fidelity's costs are attributable to services provided to all Fidelity funds, and all funds benefit if those costs can be allocated among more assets. The Board concluded that, given the group fee structure, fund shareholders will benefit from lower management fees as assets under FMR's management increase at the fund complex level, regardless of whether Fidelity achieves any such economies of scale.
Annual Report
The Board concluded, taking into account the analysis of the Economies of Scale Committee, that economies of scale, if any, are being appropriately shared between fund shareholders and Fidelity.
Additional Information Requested by the Board. In order to develop fully the factual basis for consideration of the Fidelity funds' Advisory Contracts, the Board requested and received additional information on certain topics, including (i) fund performance trends, actions to be taken by FMR to improve certain funds' overall performance, and Fidelity's long-term strategies for certain funds; (ii) the potential to further rationalize the Fidelity fund lineup with the possibility of achieving savings for the funds and Fidelity; (iii) Fidelity's compensation structure for portfolio managers and other key investment personnel; (iv) the amount of the investment that each portfolio manager has made in the Fidelity fund(s) that he or she manages; (v) the realization of fall-out benefits in certain Fidelity business units; (vi) Fidelity's group fee structures, the potential impact of regulatory changes on such structures, and the rationale for the individual fee rates of certain funds; (vii) fund profitability methodology, including Fidelity's cost allocation methodology, and the impact of certain factors on fund profitability results; (viii) trends regarding industry use of performance fee structures and the possibility of implementing performance fee structures for additional funds; and (ix) the impact of net redemptions from the Fidelity funds.
Based on its evaluation of all of the conclusions noted above, and after considering all factors it believed relevant, the Board ultimately concluded that the advisory fee structures are fair and reasonable, and that the fund's Advisory Contracts should be renewed.
Annual Report
Investment Adviser
Fidelity Management & Research Company
Boston, MA
Investment Sub-Advisers
FMR Co., Inc.
Fidelity Management & Research
(U.K.) Inc.
FIL Investment Advisors
FIL Investments (Japan) Limited
FIL Investment Advisors (UK) Ltd.
Fidelity Management & Research
(Hong Kong) Limited
Fidelity Management & Research
(Japan) Inc.
General Distributor
Fidelity Distributors Corporation
Smithfield, RI
Transfer and Service Agents
Fidelity Investments Institutional Operations Company, Inc.
Boston, MA
Fidelity Service Company, Inc.
Boston, MA
Custodian
The Bank of New York Mellon
New York, NY
(Fidelity Investment logo)(registered trademark)
AISCI-UANN-1212
1.793572.109
Fidelity®
International Small Cap
Fund
Annual Report
October 31, 2012
(Fidelity Cover Art)
Contents
Performance | 4 | How the fund has done over time. |
Management's Discussion of Fund Performance | 5 | The Portfolio Managers' review of fund performance and strategy. |
Shareholder Expense Example | 6 | An example of shareholder expenses. |
Investment Changes | 8 | A summary of major shifts in the fund's investments over the past six months. |
Investments | 10 | A complete list of the fund's investments with their market values. |
Financial Statements | 25 | Statements of assets and liabilities, operations, and changes in net assets, as well as financial highlights. |
Notes | 35 | Notes to financial statements. |
Report of Independent Registered Public Accounting Firm | 48 | |
Trustees and Officers | 49 | |
Distributions | 61 | |
Board Approval of Investment Advisory Contracts and Management Fees | 62 | |
To view a fund's proxy voting guidelines and proxy voting record for the 12-month period ended June 30, visit http://www.fidelity.com/proxyvotingresults or visit the Securities and Exchange Commission's (SEC) web site at http://www.sec.gov. You may also call 1-800-544-8544 to request a free copy of the proxy voting guidelines.
Standard & Poor's, S&P and S&P 500 are registered service marks of The McGraw-Hill Companies, Inc. and have been licensed for use by Fidelity Distributors Corporation.
Other third party marks appearing herein are the property of their respective owners.
All other marks appearing herein are registered or unregistered trademarks or service marks of FMR LLC or an affiliated company. © 2012 FMR LLC. All rights reserved.
Annual Report
This report and the financial statements contained herein are submitted for the general information of the shareholders of the fund. This report is not authorized for distribution to prospective investors in the fund unless preceded or accompanied by an effective prospectus.
A fund files its complete schedule of portfolio holdings with the SEC for the first and third quarters of each fiscal year on Form N-Q. Forms N-Q are available on the SEC's web site at http://www.sec.gov. A fund's Forms N-Q may be reviewed and copied at the SEC's Public Reference Room in Washington, DC. Information regarding the operation of the SEC's Public Reference Room may be obtained by calling 1-800-SEC-0330. For a complete list of a fund's portfolio holdings, view the most recent holdings listing, semiannual report, or annual report on Fidelity's web site at http://www.fidelity.com, http://www.advisor.fidelity.com, or http://www.401k.com, as applicable.
NOT FDIC INSURED • MAY LOSE VALUE • NO BANK GUARANTEE
Neither the fund nor Fidelity Distributors Corporation is a bank.
Annual Report
Performance: The Bottom Line
Average annual total return reflects the change in the value of an investment, assuming reinvestment of the class' distributions from dividend income and capital gains (the profits earned upon the sale of securities that have grown in value, if any) and assuming a constant rate of performance each year. The $10,000 table and the fund's returns do not reflect the deduction of taxes that a shareholder would pay on fund distributions or the redemption of fund shares. During periods of reimbursement by Fidelity, a fund's total return will be greater than it would be had the reimbursement not occurred. How a fund did yesterday is no guarantee of how it will do tomorrow.
Average Annual Total Returns
Periods ended October 31, 2012 | Past 1
year | Past 5
years | Past 10
years |
Fidelity® International Small Cap Fund | 6.55% | -3.34% | 14.67% |
$10,000 Over 10 Years
Let's say hypothetically that $10,000 was invested in Fidelity® International Small Cap Fund, a class of the fund, on October 31, 2002. The chart shows how the value of your investment would have changed, and also shows how the MSCI® EAFE® Small Cap Index performed over the same period.
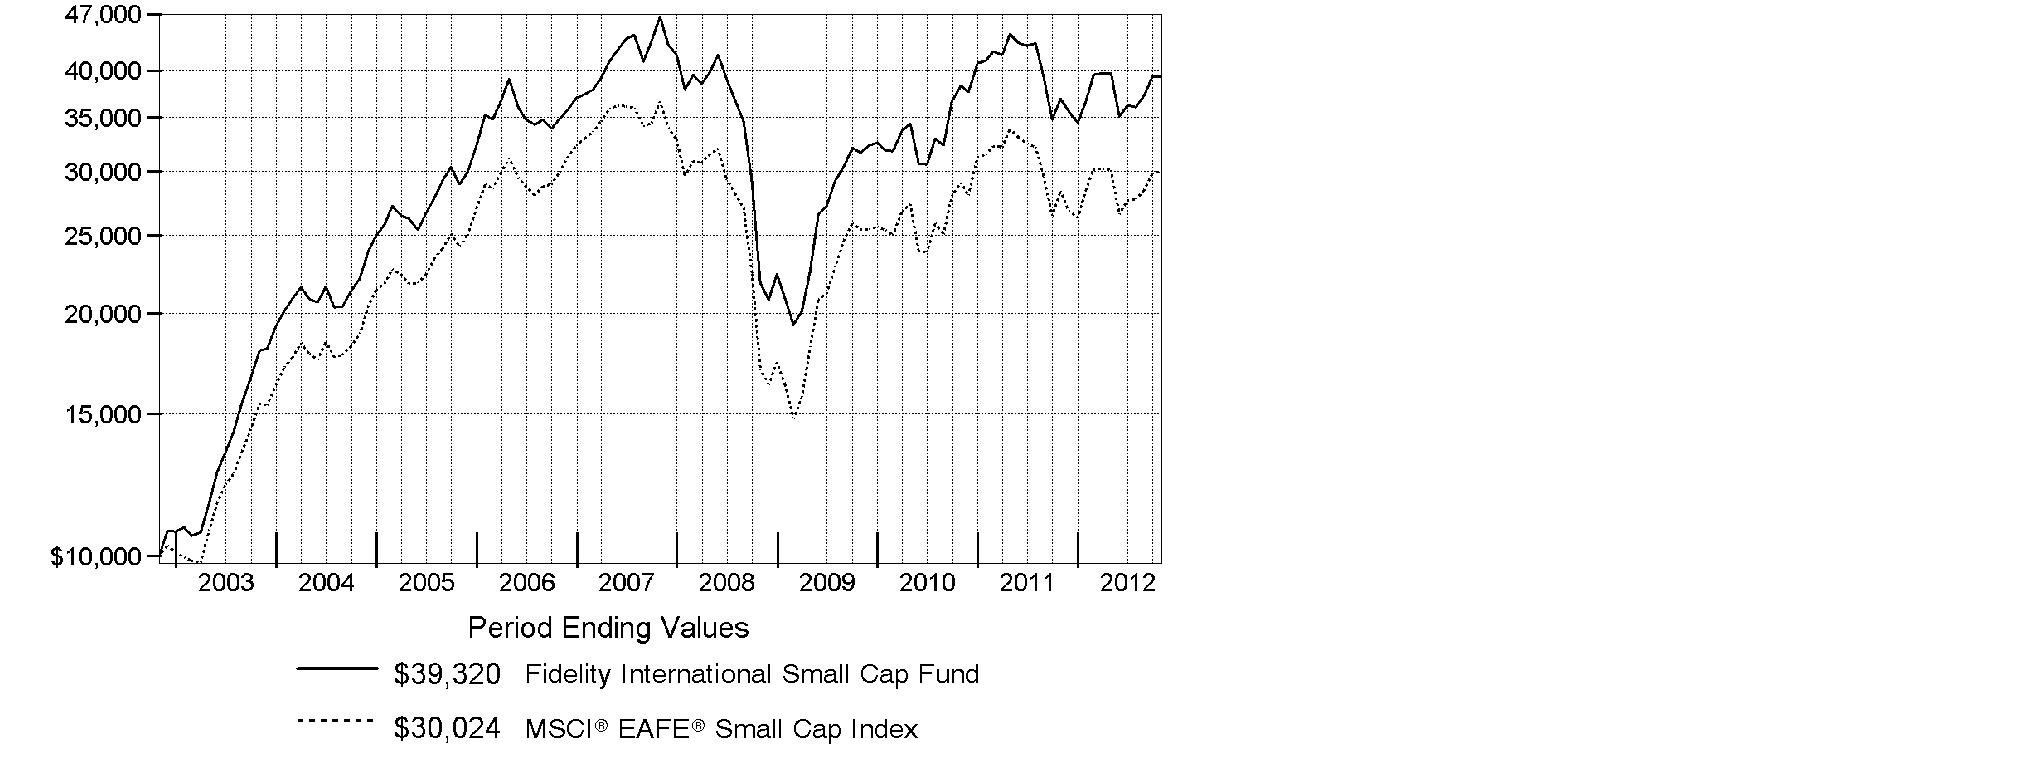
Annual Report
Management's Discussion of Fund Performance
Market Recap: International stocks experienced pendulum-like swings during the 12 months ending October 31, 2012, finishing the period with a modest advance. The market faced periodic bouts of volatility this past year, as a number of macroeconomic concerns - including the eurozone debt crisis, the strength and pace of the U.S. economic recovery, and a slowdown in China's once-blistering growth - dominated headlines and weighed on investors. While a stronger U.S. dollar provided an additional head wind, foreign developed- and emerging-markets stocks still managed a gain for the 12 months, as the MSCI® ACWI® (All Country World Index) ex USA Index rose 4.11%, largely buttressed in the summertime by pledges of accommodative monetary action from eurozone officials, as well as signs that the U.S. housing market was on the mend. Within the index, Asia-Pacific ex Japan showed the most impressive gains, advancing roughly 11%. A number of core European components, most notably Germany (+11%), Switzerland (+10%) and the U.K. (+9%), benefited from optimism about the eurozone's ability to resolve its debt woes, which also helped the region outpace the index overall. Elsewhere, results from Canada (+3%) and the generally more volatile emerging markets (+2%) each fell short of MSCI index, while Japan was among the few benchmark constituents to finish in the red, returning about -3%.
Comments from Colin Stone, Dale Nicholls and Nicholas Price, Co-Portfolio Managers of Fidelity® International Small Cap Fund: For the year, the fund's Retail Class shares returned 6.55%, topping the 5.99% gain of the MSCI® EAFE® Small Cap Index. Stock selection in the Netherlands and France aided relative performance, while our choices in the U.K., Australia and Singapore hampered results. The Europe/Middle East/Africa subportfolio handily outperformed its benchmark's low double-digit gain. One key contributor was crude oil exploration and production holding Amerisur Resources, while performance was hampered by London Mining, an iron ore and coal developer. The Asia-Pacific ex Japan subportfolio fell short of its benchmark's modest gain. An out-of-benchmark stake in Singapore-based consumer electronics retailer Pertama Holdings, the subportfolio's largest position during the period, detracted. Performance was aided by Toyo-Thai, a Thailand-based construction and engineering firm. The Japanese subportfolio outpaced its benchmark, which declined slightly. A sizable overweighting in Pigeon, a leading producer and retailer of infant products, helped, while a large non-benchmark stake in online social gaming company GREE fared poorly.
The views expressed above reflect those of the portfolio manager(s) only through the end of the period as stated on the cover of this report and do not necessarily represent the views of Fidelity or any other person in the Fidelity organization. Any such views are subject to change at any time based upon market or other conditions and Fidelity disclaims any responsibility to update such views. These views may not be relied on as investment advice and, because investment decisions for a Fidelity fund are based on numerous factors, may not be relied on as an indication of trading intent on behalf of any Fidelity fund.
Annual Report
Shareholder Expense Example
As a shareholder of the Fund, you incur two types of costs: (1) transaction costs, including sales charges (loads) on purchase payments or redemption proceeds, redemption fees and (2) ongoing costs, including management fees, distribution and/or service (12b-1) fees and other Fund expenses. This Example is intended to help you understand your ongoing costs (in dollars) of investing in the Fund and to compare these costs with the ongoing costs of investing in other mutual funds.
The Example is based on an investment of $1,000 invested at the beginning of the period and held for the entire period (May 1, 2012 to October 31, 2012).
Actual Expenses
The first line of the accompanying table for each class of the Fund provides information about actual account values and actual expenses. You may use the information in this line, together with the amount you invested, to estimate the expenses that you paid over the period. Simply divide your account value by $1,000.00 (for example, an $8,600 account value divided by $1,000.00 = 8.6), then multiply the result by the number in the first line for a class of the Fund under the heading entitled "Expenses Paid During Period" to estimate the expenses you paid on your account during this period. A small balance maintenance fee of $12.00 that is charged once a year may apply for certain accounts with a value of less than $2,000. This fee is not included in the table below. If it was, the estimate of expenses you paid during the period would be higher, and your ending account value lower, by this amount. In addition, the Fund, as a shareholder in the underlying Fidelity Central Funds, will indirectly bear its pro-rata share of the fees and expenses incurred by the underlying Fidelity Central Funds. These fees and expenses are not included in the Fund's annualized expense ratio used to calculate the expense estimate in the table below.
Hypothetical Example for Comparison Purposes
The second line of the accompanying table for each class of the Fund provides information about hypothetical account values and hypothetical expenses based on a Class' actual expense ratio and an assumed rate of return of 5% per year before expenses, which is not the Class' actual return. The hypothetical account values and expenses may not be used to estimate the actual ending account balance or expenses you paid for the period. You may use this information to compare the ongoing costs of investing in the Fund and other funds. To do so, compare this 5% hypothetical example with the 5% hypothetical examples that appear in the shareholder reports of the other funds. A small balance maintenance fee of $12.00 that is charged once a year may apply for certain accounts with a value of less than $2,000. This fee is not included in the table below. If it was, the estimate of expenses you paid during the period would be higher, and your ending account value lower, by this amount. In addition, the Fund, as a shareholder in the underlying Fidelity Central Funds, will indirectly bear its pro-rata share of the fees and expenses incurred by the underlying Fidelity Central Funds. These fees and expenses are not included in the Fund's annualized expense ratio used to calculate the expense estimate in the table below.
Please note that the expenses shown in the table are meant to highlight your ongoing costs only and do not reflect any transaction costs. Therefore, the second line of the table is useful in comparing ongoing costs only, and will not help you determine the relative total costs of owning different funds. In addition, if these transactional costs were included, your costs would have been higher.
Annual Report
Shareholder Expense Example - continued
| Annualized Expense Ratio | Beginning
Account Value
May 1, 2012 | Ending
Account Value
October 31, 2012 | Expenses Paid
During Period*
May 1, 2012 to October 31, 2012 |
Class A | 1.64% | | | |
Actual | | $ 1,000.00 | $ 988.50 | $ 8.20 |
HypotheticalA | | $ 1,000.00 | $ 1,016.89 | $ 8.31 |
Class T | 1.89% | | | |
Actual | | $ 1,000.00 | $ 987.40 | $ 9.44 |
HypotheticalA | | $ 1,000.00 | $ 1,015.63 | $ 9.58 |
Class B | 2.37% | | | |
Actual | | $ 1,000.00 | $ 985.10 | $ 11.83 |
HypotheticalA | | $ 1,000.00 | $ 1,013.22 | $ 11.99 |
Class C | 2.39% | | | |
Actual | | $ 1,000.00 | $ 985.10 | $ 11.93 |
HypotheticalA | | $ 1,000.00 | $ 1,013.12 | $ 12.09 |
International Small Cap | 1.37% | | | |
Actual | | $ 1,000.00 | $ 990.10 | $ 6.85 |
HypotheticalA | | $ 1,000.00 | $ 1,018.25 | $ 6.95 |
Institutional Class | 1.24% | | | |
Actual | | $ 1,000.00 | $ 990.60 | $ 6.20 |
HypotheticalA | | $ 1,000.00 | $ 1,018.90 | $ 6.29 |
A 5% return per year before expenses
* Expenses are equal to each Class' annualized expense ratio, multiplied by the average account value over the period, multiplied by 184/366 (to reflect the one-half year period).
Annual Report
Investment Changes (Unaudited)
Geographic Diversification (% of fund's net assets) |
As of October 31, 2012 |
 | Japan 26.4% | |
 | United Kingdom 20.6% | |
 | Germany 7.6% | |
 | Australia 6.0% | |
 | France 4.2% | |
 | United States of America 3.8% | |
 | Cayman Islands 3.4% | |
 | Singapore 2.9% | |
 | Ireland 2.6% | |
| Other 22.5% | |

Percentages are based on country or territory of incorporation and are adjusted for the effect of futures contracts, if applicable. |
As of April 30, 2012 |
| Japan 27.2% | |
| United Kingdom 19.8% | |
| Germany 9.0% | |
| Australia 6.1% | |
| France 4.4% | |
| United States of America 3.2% | |
| Cayman Islands 3.2% | |
| Ireland 2.9% | |
| Bermuda 2.8% | |
| Other 21.4% | |

Percentages are based on country or territory of incorporation and are adjusted for the effect of futures contracts, if applicable. |
Asset Allocation |
| % of fund's
net assets | % of fund's net assets
6 months ago |
Stocks and Equity Futures | 96.2 | 97.4 |
Bonds | 0.2 | 0.1 |
Short-Term Investments and Net Other Assets (Liabilities) | 3.6 | 2.5 |
Top Ten Stocks as of October 31, 2012 |
| % of fund's
net assets | % of fund's net assets
6 months ago |
Nintendo Co. Ltd. (Japan, Software) | 2.2 | 1.8 |
ORIX Corp. (Japan, Diversified Financial Services) | 1.8 | 2.0 |
Pigeon Corp. (Japan, Household Products) | 1.8 | 1.3 |
Kakaku.com, Inc. (Japan, Internet Software & Services) | 1.6 | 1.4 |
Eurofins Scientific SA (France, Life Sciences Tools & Services) | 1.3 | 0.8 |
Pertama Holdings Ltd. (Singapore, Specialty Retail) | 1.3 | 1.1 |
AZ Electronic Materials SA (Luxembourg, Chemicals) | 1.1 | 0.9 |
Kubota Corp. (Japan, Machinery) | 1.1 | 1.0 |
IBS Group Holding Ltd. GDR (Reg. S) (Isle of Man, IT Services) | 1.0 | 1.0 |
Playtech Ltd. (Isle of Man, Software) | 1.0 | 0.8 |
| 14.2 | |
Market Sectors as of October 31, 2012 |
| % of fund's
net assets | % of fund's net assets
6 months ago |
Consumer Discretionary | 19.5 | 19.0 |
Information Technology | 19.5 | 17.8 |
Industrials | 13.4 | 14.8 |
Financials | 11.9 | 11.3 |
Materials | 10.3 | 13.2 |
Health Care | 9.7 | 9.3 |
Energy | 7.3 | 7.9 |
Consumer Staples | 3.9 | 2.2 |
Telecommunication Services | 0.6 | 1.1 |
Utilities | 0.3 | 0.3 |
Annual Report
Investments October 31, 2012
Showing Percentage of Net Assets
Common Stocks - 96.2% |
| Shares | | Value |
Australia - 6.0% |
Acrux Ltd. | 381,062 | | $ 1,281,619 |
Alkane Resources Ltd. | 823,400 | | 726,521 |
Ausgold Ltd. (a) | 1,195,693 | | 198,590 |
Austal Ltd. | 508,767 | | 646,954 |
Beach Energy Ltd. | 1,188,831 | | 1,703,011 |
Berkeley Resources Ltd. (a) | 739,724 | | 360,899 |
Carsales.com Ltd. (d) | 338,881 | | 2,624,245 |
Challenger Ltd. | 360,905 | | 1,210,079 |
Clinuvel Pharmaceuticals Ltd. (a) | 143,106 | | 240,653 |
Dart Energy Ltd. (a) | 2,059,222 | | 363,388 |
Goodman Group unit | 253,653 | | 1,166,439 |
Iluka Resources Ltd. | 80,327 | | 827,164 |
Independence Group NL | 189,529 | | 784,995 |
iProperty Group Ltd. (a) | 322,458 | | 307,949 |
Karoon Gas Australia Ltd. (a) | 467,228 | | 2,706,334 |
Linc Energy Ltd. (a)(d) | 508,182 | | 290,135 |
Maverick Drilling & Exploration Ltd. (a)(d) | 781,710 | | 839,855 |
Medusa Mining Ltd. | 198,265 | | 1,255,435 |
Mesoblast Ltd. (a)(d) | 175,066 | | 1,048,566 |
Mineral Deposits Ltd. (a) | 856,877 | | 4,358,458 |
Monto Minerals Ltd. (a) | 273,551 | | 1,988 |
Navitas Ltd. | 286,457 | | 1,225,110 |
New Standard Energy Ltd. (a) | 816,242 | | 266,900 |
Panaust Ltd. | 388,877 | | 1,344,234 |
Papillon Resources Ltd. (a)(d) | 197,313 | | 377,894 |
Ramsay Health Care Ltd. | 18,317 | | 451,772 |
realestate.com.au Ltd. | 61,870 | | 1,107,867 |
SAI Global Ltd. | 316,231 | | 1,332,750 |
SEEK Ltd. | 522,733 | | 3,630,148 |
Silver Lake Resources Ltd. (a)(d) | 211,056 | | 768,994 |
Sino Gas & Energy Ltd. (a) | 8,152,205 | | 634,680 |
SomnoMed Ltd. (a) | 531,849 | | 455,471 |
Spark Infrastructure Group unit | 1,255,671 | | 2,202,829 |
Starpharma Holdings Ltd. (a) | 795,432 | | 1,341,760 |
Sydney Airport unit | 156,262 | | 549,884 |
Tiger Resources Ltd. (a) | 11,335,520 | | 3,647,719 |
Tissue Therapies Ltd. (a) | 819,448 | | 314,732 |
Troy Resources NL | 258,575 | | 1,186,389 |
Universal Biosensors, Inc. (a) | 343,694 | | 328,230 |
TOTAL AUSTRALIA | | 44,110,640 |
Common Stocks - continued |
| Shares | | Value |
Bailiwick of Jersey - 1.1% |
Informa PLC | 854,423 | | $ 5,518,058 |
LXB Retail Properties PLC (a) | 1,387,800 | | 2,575,497 |
TOTAL BAILIWICK OF JERSEY | | 8,093,555 |
Belgium - 0.7% |
EVS Broadcast Equipment SA | 92,900 | | 5,383,636 |
Bermuda - 2.2% |
Asia Satellite Telecommunications Holdings Ltd. | 271,000 | | 863,698 |
Biosensors International Group Ltd. (a) | 1,422,000 | | 1,264,855 |
China Animal Healthcare Ltd. | 2,129,000 | | 453,796 |
China Singyes Solar Tech Holdings Ltd. | 981,600 | | 581,357 |
I.T Ltd. | 1,552,000 | | 616,791 |
Imagi International Holdings Ltd. (a) | 26,792,000 | | 383,728 |
Luk Fook Holdings International Ltd. | 612,000 | | 1,538,282 |
Oakley Capital Investments Ltd. (a) | 1,518,300 | | 3,319,962 |
PAX Global Technology Ltd. (a) | 1,769,000 | | 314,994 |
Petra Diamonds Ltd. (a) | 1,478,632 | | 2,374,212 |
REXLot Holdings Ltd. | 11,800,000 | | 852,640 |
Vostok Nafta Investment Ltd. SDR | 818,000 | | 2,022,524 |
Vtech Holdings Ltd. | 126,000 | | 1,496,545 |
TOTAL BERMUDA | | 16,083,384 |
Brazil - 0.6% |
Alpargatas SA (PN) | 553,200 | | 4,189,073 |
British Virgin Islands - 0.0% |
Kalahari Energy (a)(f) | 1,451,000 | | 15 |
Canada - 1.4% |
AirSea Lines (a)(f) | 1,893,338 | | 25 |
Banro Corp. (a) | 976,700 | | 4,518,001 |
Mood Media Corp. (a) | 175,300 | | 410,715 |
Mood Media Corp. (United Kingdom) (a) | 1,139,822 | | 2,667,112 |
Rock Well Petroleum, Inc. (a)(f) | 770,400 | | 8 |
Teranga Gold Corp. (a) | 1,272,499 | | 2,726,556 |
TOTAL CANADA | | 10,322,417 |
Cayman Islands - 3.4% |
21Vianet Group, Inc. ADR (a) | 42,300 | | 468,684 |
3SBio, Inc. sponsored ADR (a) | 39,000 | | 522,990 |
51job, Inc. sponsored ADR (a) | 19,200 | | 902,976 |
AirMedia Group, Inc. ADR (a) | 272,500 | | 618,575 |
Airtac International Group | 106,000 | | 497,159 |
AMVIG Holdings Ltd. | 764,000 | | 226,734 |
Common Stocks - continued |
| Shares | | Value |
Cayman Islands - continued |
AutoNavi Holdings Ltd. ADR (a) | 34,300 | | $ 368,039 |
Baidu.com, Inc. sponsored ADR (a) | 6,000 | | 639,720 |
Bitauto Holdings Ltd. ADR (a) | 82,500 | | 415,800 |
Changshouhua Food Co. Ltd. | 872,000 | | 450,062 |
China Automation Group Ltd. | 1,872,000 | | 444,446 |
China High Precision Automation Group Ltd. | 712,000 | | 102,527 |
China Lodging Group Ltd. ADR (a)(d) | 26,500 | | 451,030 |
China Medical System Holdings Ltd. | 1,255,000 | | 723,847 |
China Metal International Holdings, Inc. | 2,522,000 | | 439,313 |
China Metal Recycling (Holdings) Ltd. | 436,800 | | 436,797 |
China Outfitters Holdings Ltd. | 1,888,000 | | 321,567 |
China Tianyi Holdings Ltd. (a) | 2,492,000 | | 360,132 |
China ZhengTong Auto Services Holdings Ltd. (a) | 472,000 | | 319,740 |
CNinsure, Inc. ADR (a) | 31,900 | | 187,572 |
Convenience Retail Asia Ltd. | 700,000 | | 437,158 |
EVA Precision Industrial Holdings Ltd. | 9,338,000 | | 988,014 |
Fook Woo Group Holdings Ltd. (a) | 2,055,000 | | 181,634 |
Greatview Aseptic Pack Co. Ltd. | 1,196,000 | | 626,546 |
Haitian International Holdings Ltd. | 338,000 | | 417,373 |
Hop Hing Group Holdings Ltd. (a) | 7,392,000 | | 362,444 |
Hutchison China Meditech Ltd. (a) | 77,117 | | 555,658 |
Kingdee International Software Group Co. Ltd. (a) | 1,178,400 | | 244,802 |
KongZhong Corp. sponsored ADR (a) | 56,200 | | 331,018 |
Lee's Pharmaceutical Holdings Ltd. | 1,085,000 | | 664,996 |
Marwyn Value Investors II Ltd. (a) | 1,875,100 | | 3,820,253 |
Ming Fai International Holdings Ltd. | 9,133,000 | | 824,911 |
Perfect World Co. Ltd. sponsored ADR Class B | 34,900 | | 370,987 |
Royale Furniture Holdings Ltd. | 6,740,958 | | 565,367 |
Shenguan Holdings Group Ltd. | 3,154,000 | | 1,737,741 |
SINA Corp. (a) | 5,000 | | 273,150 |
Sino Prosper State Gold Resources Holdings, Ltd. (a) | 7,495,000 | | 333,646 |
Sitoy Group Holdings Ltd. | 219,000 | | 126,878 |
SouFun Holdings Ltd. ADR (d) | 51,000 | | 921,570 |
Trauson Holdings Co. Ltd. | 1,237,000 | | 646,428 |
VanceInfo Technologies, Inc. ADR (a) | 38,100 | | 290,322 |
VisionChina Media, Inc. ADR (a)(d) | 172,100 | | 37,862 |
VST Holdings Ltd. | 1,858,000 | | 326,047 |
WuXi PharmaTech Cayman, Inc. sponsored ADR (a) | 42,300 | | 600,237 |
Yip's Chemical Holdings Ltd. | 592,000 | | 399,502 |
TOTAL CAYMAN ISLANDS | | 24,982,254 |
Common Stocks - continued |
| Shares | | Value |
China - 0.1% |
NQ Mobile, Inc. ADR (a)(d) | 33,300 | | $ 231,768 |
Travelsky Technology Ltd. (H Shares) | 877,000 | | 452,642 |
TOTAL CHINA | | 684,410 |
Cyprus - 0.6% |
Buried Hill Energy (Cyprus) PCL (a)(f) | 1,947,000 | | 4,380,750 |
France - 4.2% |
Altamir Amboise | 531,000 | | 4,762,729 |
ALTEN | 118,100 | | 3,714,373 |
Audika SA | 113,900 | | 1,353,781 |
Axway Software SA | 4,544 | | 71,089 |
Eurofins Scientific SA | 63,899 | | 9,880,747 |
Ipsos SA | 124,772 | | 4,384,317 |
Sartorius Stedim Biotech | 51,600 | | 4,662,967 |
Sopra Group SA | 39,300 | | 1,854,678 |
TOTAL FRANCE | | 30,684,681 |
Germany - 7.6% |
Bertrandt AG | 64,300 | | 5,379,755 |
Brenntag AG | 40,600 | | 5,117,128 |
CENTROTEC Sustainable AG | 231,049 | | 4,168,680 |
CTS Eventim AG | 193,820 | | 5,752,933 |
GFK AG | 142,601 | | 6,493,158 |
Lanxess AG | 70,485 | | 5,822,318 |
MTU Aero Engines Holdings AG | 67,300 | | 5,650,817 |
Rational AG | 15,520 | | 3,924,680 |
RIB Software AG | 379,800 | | 2,358,011 |
Stroer Out-of-Home Media AG (a) | 14,753 | | 130,030 |
United Internet AG | 200,152 | | 4,004,256 |
Wirecard AG | 289,100 | | 6,606,260 |
TOTAL GERMANY | | 55,408,026 |
Hong Kong - 0.8% |
Dah Sing Financial Holdings Ltd. | 164,261 | | 631,606 |
Guotai Junan International Holdings Ltd. | 1,331,000 | | 395,004 |
Magnificent Estates Ltd. | 29,588,000 | | 1,431,668 |
Singamas Container Holdings Ltd. | 3,164,000 | | 800,181 |
Techtronic Industries Co. Ltd. | 1,053,500 | | 2,006,395 |
YGM Trading Ltd. | 152,000 | | 365,190 |
TOTAL HONG KONG | | 5,630,044 |
Common Stocks - continued |
| Shares | | Value |
Iceland - 0.5% |
Ossur hf (a) | 2,571,700 | | $ 3,395,957 |
India - 1.2% |
Ahluwalia Contracts (India) Ltd. | 230,314 | | 172,077 |
Britannia Industries Ltd. (a) | 31,695 | | 284,904 |
Educomp Solutions Ltd. | 44,518 | | 121,999 |
Financial Technologies India Ltd. | 23,352 | | 431,972 |
Geodesic Ltd. | 256,340 | | 189,140 |
Manappuram General Finance & Leasing Ltd. | 367,032 | | 251,373 |
MT Educare Ltd. | 146,984 | | 285,472 |
Page Industries Ltd. | 87,661 | | 5,462,255 |
PI Industries Ltd. | 37,878 | | 351,993 |
Shriram City Union Finance Ltd. (a) | 739 | | 10,725 |
Thangamayil Jewellery Ltd. | 253,192 | | 1,178,316 |
WABCO India Ltd. | 10,191 | | 303,779 |
TOTAL INDIA | | 9,044,005 |
Indonesia - 1.0% |
PT Clipan Finance Indonesia Tbk | 13,895,400 | | 578,671 |
PT Clipan Finance Indonesia Tbk warrants 10/7/14 (a) | 2,275,700 | | 12,320 |
PT Mayora Indah Tbk | 352,000 | | 866,712 |
PT Media Nusantara Citra Tbk | 8,838,500 | | 2,599,548 |
PT Mitra Adiperkasa Tbk | 588,000 | | 400,977 |
PT MNC Sky Vision Tbk | 1,805,500 | | 408,844 |
PT Nippon Indosari Corpindo Tbk | 1,225,000 | | 765,223 |
PT Pembangunan Perumahan Persero Tbk | 4,982,500 | | 399,428 |
PT Tiga Pilar Sejahtera Food Tbk | 5,685,000 | | 532,689 |
PT Tower Bersama Infrastructure Tbk (a) | 1,383,000 | | 719,934 |
TOTAL INDONESIA | | 7,284,346 |
Ireland - 2.6% |
Glanbia PLC | 281,700 | | 2,672,718 |
Kenmare Resources PLC (a) | 11,137,400 | | 7,083,151 |
Paddy Power PLC (Ireland) | 88,784 | | 6,552,506 |
Petroceltic International PLC (a) | 22,766,000 | | 2,531,292 |
TOTAL IRELAND | | 18,839,667 |
Isle of Man - 2.4% |
Exillon Energy PLC (a) | 1,067,800 | | 2,683,825 |
IBS Group Holding Ltd. GDR (Reg. S) (a) | 336,400 | | 7,586,833 |
Playtech Ltd. | 1,083,636 | | 7,407,568 |
TOTAL ISLE OF MAN | | 17,678,226 |
Common Stocks - continued |
| Shares | | Value |
Israel - 0.1% |
Sarin Technologies Ltd. | 957,750 | | $ 773,392 |
Italy - 1.1% |
Brunello Cucinelli SpA (d) | 172,000 | | 3,043,101 |
Salvatore Ferragamo Italia SpA (d) | 244,915 | | 4,974,388 |
TOTAL ITALY | | 8,017,489 |
Japan - 26.4% |
ACOM Co. Ltd. (a) | 60,890 | | 1,797,792 |
Aeon Credit Service Co. Ltd. | 344,600 | | 7,312,444 |
Aeon Mall Co. Ltd. | 45,300 | | 1,175,201 |
Ajinomoto Co., Inc. | 125,000 | | 1,908,744 |
ARNEST ONE Corp. | 39,700 | | 589,309 |
Asahi Holdings, Inc. | 65,300 | | 1,101,012 |
ASAHI INTECC Co. Ltd. (d) | 109,500 | | 3,249,474 |
Avex Group Holdings, Inc. | 118,100 | | 2,334,483 |
CAC Corp. | 44,800 | | 377,121 |
Chiyoda Co. Ltd. | 66,700 | | 1,908,340 |
Citizen Holdings Co. Ltd. | 692,900 | | 3,515,276 |
CyberAgent, Inc. (d) | 3,280 | | 6,557,535 |
DeNA Co. Ltd. (d) | 107,500 | | 3,354,409 |
Enigmo, Inc. | 25,300 | | 2,383,264 |
Fields Corp. | 72,300 | | 1,039,714 |
Fuji Corp. | 35,700 | | 522,777 |
Fuji Spinning Co. Ltd. | 679,000 | | 2,806,840 |
GMO Internet, Inc. | 191,800 | | 1,340,654 |
GOLDWIN, Inc. (d) | 204,000 | | 1,249,605 |
GREE, Inc. (d) | 170,100 | | 2,966,043 |
Hajime Construction Co. Ltd. | 52,500 | | 1,653,326 |
Hitachi Chemical Co. Ltd. | 182,500 | | 2,571,871 |
Hitachi Metals Ltd. | 339,000 | | 3,172,153 |
Hitachi Transport System Ltd. | 97,000 | | 1,454,453 |
Honda Motor Co. Ltd. | 181,900 | | 5,468,505 |
Hoshizaki Electric Co. Ltd. | 128,800 | | 3,505,980 |
Iida Home Max Co., Ltd. | 125,000 | | 1,102,342 |
ITC Networks Corp. | 27,300 | | 218,865 |
Iwatsuka Confectionary Co. Ltd. | 11,600 | | 434,183 |
JSP Corp. | 59,400 | | 767,892 |
K'S Denki Corp. (d) | 52,300 | | 1,400,039 |
Kakaku.com, Inc. (d) | 338,200 | | 11,586,834 |
Kao Corp. | 35,000 | | 982,964 |
KAWAI Musical Instruments Manufacturing Co. Ltd. | 693,000 | | 1,449,718 |
Kitz Corp. | 44,900 | | 189,544 |
Common Stocks - continued |
| Shares | | Value |
Japan - continued |
Kobe Bussan Co. Ltd. | 7,300 | | $ 191,942 |
Koshidaka Holdings Co. Ltd. | 41,900 | | 1,149,455 |
Kubota Corp. | 761,000 | | 7,778,730 |
Makita Corp. | 92,500 | | 3,655,737 |
Maruwa Ceramic Co. Ltd. (d) | 9,900 | | 291,432 |
Megachips Corp. | 88,200 | | 1,968,839 |
Mitsubishi Gas Chemical Co., Inc. | 9,000 | | 44,419 |
Mizuho Financial Group, Inc. | 302,700 | | 473,629 |
Nichias Corp. (d) | 417,000 | | 2,042,428 |
Nikkiso Co. Ltd. | 525,000 | | 6,254,228 |
Nintendo Co. Ltd. | 127,900 | | 16,470,142 |
Nippon Seiki Co. Ltd. | 33,000 | | 317,061 |
Nitta Corp. | 153,100 | | 2,355,090 |
Nitta Gelatin, Inc. | 116,400 | | 944,848 |
NSD Co. Ltd. | 24,900 | | 238,301 |
Olympus Corp. (a)(d) | 204,500 | | 3,571,001 |
Origin Electric Co. Ltd. | 332,000 | | 1,285,081 |
ORIX Corp. | 130,390 | | 13,393,436 |
Pacific Metals Co. Ltd. | 166,000 | | 563,522 |
Pal Co. Ltd. | 35,250 | | 1,799,371 |
Pigeon Corp. | 284,300 | | 13,105,649 |
Rohto Pharmaceutical Co. Ltd. | 176,000 | | 2,429,563 |
Round One Corp. | 62,800 | | 317,815 |
Ryohin Keikaku Co. Ltd. | 5,800 | | 384,342 |
Sawada Holdings Co. Ltd. (a) | 271,700 | | 1,494,129 |
Seven & i Holdings Co., Ltd. | 6,800 | | 209,716 |
Shimadzu Corp. | 293,000 | | 1,970,951 |
SHIMANO, Inc. | 11,600 | | 730,903 |
Shin-Etsu Chemical Co., Ltd. | 3,300 | | 186,020 |
Shinko Kogyo Co. Ltd. | 239,200 | | 1,246,489 |
Shinko Shoji Co. Ltd. | 2,800 | | 24,237 |
Sosei Group Corp. (a) | 1,170 | | 3,231,680 |
Stanley Electric Co. Ltd. | 245,000 | | 3,375,924 |
STELLA CHEMIFA Corp. | 9,700 | | 182,262 |
Sugi Holdings Co. Ltd. | 600 | | 21,684 |
Sumitomo Chemical Co. Ltd. | 68,000 | | 190,805 |
Sumitomo Metal Mining Co. Ltd. | 88,000 | | 1,158,562 |
Sysmex Corp. | 500 | | 23,519 |
Taiheiyo Cement Corp. | 345,000 | | 734,686 |
Takara Leben Co. Ltd. | 445,200 | | 4,768,207 |
Toho Real Estate Co. Ltd. | 3,000 | | 16,385 |
Tokyu Land Corp. | 85,000 | | 477,014 |
Common Stocks - continued |
| Shares | | Value |
Japan - continued |
Topcon Corp. (d) | 421,500 | | $ 1,995,829 |
Toyo Engineering Corp. | 713,000 | | 2,947,388 |
Toyo Kanetsu KK | 398,000 | | 772,767 |
Tsukui Corp. | 26,500 | | 615,777 |
Uchiyama Holdings Co. Ltd. | 7,100 | | 129,851 |
Unicharm Corp. | 1,700 | | 91,995 |
WebCrew, Inc. | 90,300 | | 565,577 |
West Holdings Corp. (d) | 10,700 | | 135,911 |
Yamato Kogyo Co. Ltd. | 40,200 | | 1,128,501 |
Yamaya Corp. | 44,700 | | 641,691 |
TOTAL JAPAN | | 193,543,227 |
Korea (South) - 0.5% |
Daou Technology, Inc. | 87,960 | | 1,250,440 |
Genic Co. Ltd. (a) | 9,627 | | 523,590 |
Korea Plant Service & Engineering Co. Ltd. | 12,424 | | 683,689 |
SBS Contents Hub Co. Ltd. | 35,022 | | 525,176 |
Soulbrain Co. Ltd. | 11,656 | | 469,310 |
TOTAL KOREA (SOUTH) | | 3,452,205 |
Luxembourg - 1.1% |
AZ Electronic Materials SA | 1,467,500 | | 8,395,191 |
Malaysia - 0.1% |
JobStreet Corp. Bhd | 1,223,100 | | 915,518 |
Netherlands - 1.3% |
Gemalto NV | 81,831 | | 7,384,263 |
Ichor Coal NV (a) | 355,000 | | 1,932,560 |
TOTAL NETHERLANDS | | 9,316,823 |
Norway - 2.2% |
Aker Solutions ASA | 357,100 | | 7,015,102 |
Schibsted ASA (B Shares) | 195,600 | | 7,324,750 |
Sevan Drilling ASA (a)(d) | 2,185,100 | | 1,694,025 |
TOTAL NORWAY | | 16,033,877 |
Singapore - 2.9% |
Amtek Engineering Ltd. | 2,949,000 | | 1,450,566 |
CSE Global Ltd. | 1,069,000 | | 758,063 |
First Resources Ltd. | 71,000 | | 119,323 |
Goodpack Ltd. | 1,220,000 | | 1,940,318 |
Mapletree Industrial (REIT) | 1,424,000 | | 1,634,366 |
OSIM International Ltd. | 1,092,000 | | 1,454,747 |
Common Stocks - continued |
| Shares | | Value |
Singapore - continued |
Pertama Holdings Ltd. (e) | 23,060,000 | | $ 9,679,226 |
Petra Foods Ltd. | 370,000 | | 794,720 |
Phorm Corp. Ltd. (a) | 1,308,800 | | 1,520,695 |
Raffles Medical Group Ltd. | 368,205 | | 739,549 |
Sino Grandness Food Industry Group Ltd. (a) | 310,000 | | 121,987 |
Venture Corp. Ltd. | 212,000 | | 1,329,562 |
TOTAL SINGAPORE | | 21,543,122 |
South Africa - 0.3% |
Blue Label Telecoms Ltd. | 3,094,900 | | 2,405,774 |
Sweden - 0.9% |
Avanza Bank Holding AB | 162,600 | | 3,192,970 |
Elekta AB (B Shares) | 266,400 | | 3,795,444 |
TOTAL SWEDEN | | 6,988,414 |
Switzerland - 1.3% |
Sika AG (Bearer) | 1,610 | | 3,358,993 |
VZ Holding AG | 51,930 | | 6,189,445 |
TOTAL SWITZERLAND | | 9,548,438 |
Taiwan - 0.2% |
Pacific Hospital Supply Co. Ltd. | 114,400 | | 333,291 |
Tong Hsing Electronics Industries Ltd. | 158,721 | | 551,530 |
Topoint Technology Co. Ltd. | 571,927 | | 322,088 |
TOTAL TAIWAN | | 1,206,909 |
Thailand - 0.6% |
Toyo-Thai Corp. PCL | 5,276,700 | | 4,688,297 |
United Kingdom - 20.6% |
Aberdeen Asset Management PLC | 1,183,800 | | 6,199,109 |
Amerisur Resources PLC (a)(d) | 7,753,224 | | 5,880,530 |
Ashmore Group PLC | 897,400 | | 5,267,028 |
ASOS PLC (a)(d) | 188,176 | | 6,847,736 |
Avanti Communications Group PLC (a)(d) | 659,800 | | 2,842,889 |
Aveva Group PLC | 186,000 | | 5,973,134 |
Bond International Software PLC | 843,266 | | 700,823 |
Brammer PLC | 1,267,600 | | 4,914,529 |
Central Asia Metals PLC (a) | 1,336,700 | | 2,113,958 |
Craneware PLC | 791,600 | | 5,528,141 |
Faroe Petroleum PLC (a) | 480,947 | | 1,179,715 |
Hunting PLC | 194,900 | | 2,354,181 |
IG Group Holdings PLC | 719,702 | | 5,057,980 |
Common Stocks - continued |
| Shares | | Value |
United Kingdom - continued |
International Personal Finance PLC | 1,298,800 | | $ 7,272,907 |
John Wood Group PLC | 383,900 | | 5,262,811 |
Johnson Matthey PLC | 106,195 | | 3,854,160 |
Keronite PLC (a)(f) | 13,620,267 | | 220 |
London Mining PLC (a)(d) | 1,460,045 | | 3,593,125 |
Moneysupermarket.com Group PLC | 2,714,800 | | 5,870,551 |
Monitise PLC (a) | 11,841,415 | | 7,070,361 |
Mothercare PLC | 327,400 | | 1,466,148 |
NCC Group Ltd. | 218,315 | | 3,170,753 |
Ocado Group PLC (a)(d) | 1,088,800 | | 1,133,298 |
Ophir Energy PLC (a) | 616,500 | | 5,516,592 |
Optos PLC (a) | 478,181 | | 1,572,267 |
Pureprofile Media PLC (a)(f) | 1,108,572 | | 626,135 |
Regenersis PLC | 1,198,700 | | 2,548,575 |
Rockhopper Exploration PLC (a) | 1,054,900 | | 2,681,193 |
Salamander Energy PLC (a) | 632,400 | | 1,964,531 |
SDL PLC | 448,762 | | 3,841,826 |
Serco Group PLC | 339,746 | | 3,105,922 |
Silverdell PLC (a) | 12,644,400 | | 2,678,143 |
Sinclair Pharma PLC (a) | 4,146,298 | | 1,898,596 |
Sphere Medical Holding PLC | 817,054 | | 955,928 |
Sportingbet PLC | 5,292,800 | | 4,569,572 |
Sthree PLC | 1,031,809 | | 4,999,408 |
Synergy Health PLC | 284,953 | | 4,271,941 |
Ted Baker PLC | 462,675 | | 7,078,164 |
TMO Renewables Ltd. (a)(f) | 1,000,000 | | 403,438 |
Travis Perkins PLC | 313,000 | | 5,455,121 |
Wolfson Microelectronics PLC (a) | 939,800 | | 3,154,533 |
Zenergy Power PLC (a) | 32,776 | | 44,430 |
TOTAL UNITED KINGDOM | | 150,920,402 |
United States of America - 0.2% |
CTC Media, Inc. | 4,300 | | 36,077 |
GI Dynamics, Inc. CDI (a) | 690,238 | | 429,901 |
Mudalla Technology, Inc. (Reg. S) (a) | 996,527 | | 16 |
YOU On Demand Holdings, Inc. (a) | 86,974 | | 301,800 |
YOU On Demand Holdings, Inc. (f) | 27,500 | | 85,883 |
Common Stocks - continued |
| Shares | | Value |
United States of America - continued |
YOU On Demand Holdings, Inc. warrants 8/30/17 (a)(f) | 27,500 | | $ 2,693 |
Zhongpin, Inc. (a) | 40,200 | | 463,104 |
TOTAL UNITED STATES OF AMERICA | | 1,319,474 |
TOTAL COMMON STOCKS (Cost $657,977,485) |
705,263,638
|
Convertible Bonds - 0.2% |
| Principal Amount | | |
Canada - 0.2% |
Griffiths Energy International, Inc. 12% 9/1/17 (f)
(Cost $1,400,000) | | $ 1,400,000 | |
1,400,000
|
Money Market Funds - 9.5% |
| Shares | | |
Fidelity Cash Central Fund, 0.19% (b) | 27,463,856 | | 27,463,856 |
Fidelity Securities Lending Cash Central Fund, 0.19% (b)(c) | 42,020,618 | | 42,020,618 |
TOTAL MONEY MARKET FUNDS (Cost $69,484,474) |
69,484,474
|
TOTAL INVESTMENT PORTFOLIO - 105.9% (Cost $728,861,959) | 776,148,112 |
NET OTHER ASSETS (LIABILITIES) - (5.9)% | (42,900,112) |
NET ASSETS - 100% | $ 733,248,000 |
Legend |
(a) Non-income producing |
(b) Affiliated fund that is available only to investment companies and other accounts managed by Fidelity Investments. The rate quoted is the annualized seven-day yield of the fund at period end. A complete unaudited listing of the fund's holdings as of its most recent quarter end is available upon request. In addition, each Fidelity Central Fund's financial statements, which are not covered by the Fund's Report of Independent Registered Public Accounting Firm, are available on the SEC's website or upon request. |
(c) Investment made with cash collateral received from securities on loan. |
(d) Security or a portion of the security is on loan at period end. |
(e) Affiliated company |
(f) Restricted securities - Investment in securities not registered under the Securities Act of 1933 (excluding 144A issues). At the end of the period, the value of restricted securities (excluding 144A issues) amounted to $6,899,165 or 0.9% of net assets. |
Additional information on each restricted holding is as follows: |
Security | Acquisition Date | Acquisition Cost |
AirSea Lines | 8/4/06 | $ 1,199,182 |
Buried Hill Energy (Cyprus) PCL | 8/18/06 | $ 2,141,700 |
Griffiths Energy International, Inc. 12% 9/1/17 | 9/12/12 | $ 1,400,000 |
Kalahari Energy | 9/1/06 | $ 1,813,750 |
Keronite PLC | 8/16/06 | $ 1,548,992 |
Pureprofile Media PLC | 5/3/05 - 1/11/06 | $ 1,173,341 |
Rock Well Petroleum, Inc. | 4/13/06 | $ 1,004,171 |
TMO Renewables Ltd. | 10/27/05 | $ 535,065 |
YOU On Demand Holdings, Inc. | 8/29/12 | $ 110,000 |
YOU On Demand Holdings, Inc. warrants 8/30/17 | 9/14/12 | $ 0 |
Affiliated Central Funds |
Information regarding fiscal year to date income earned by the Fund from investments in Fidelity Central Funds is as follows: |
Fund | Income earned |
Fidelity Cash Central Fund | $ 27,191 |
Fidelity Securities Lending Cash Central Fund | 1,033,335 |
Total | $ 1,060,526 |
Other Affiliated Issuers |
An affiliated company is a company in which the Fund has ownership of at least 5% of the voting securities. Fiscal year to date transactions with companies which are or were affiliates are as follows: |
Affiliate | Value, beginning of period | Purchases | Sales Proceeds | Dividend Income | Value,
end of
period |
Pertama Holdings Ltd. | $ 11,809,703 | $ - | $ - | $ 146,001 | $ 9,679,226 |
Other Information |
Categorizations in the Schedule of Investments are based on country or territory of incorporation. |
The following is a summary of the inputs used, as of October 31, 2012, involving the Fund's assets and liabilities carried at fair value. The inputs or methodology used for valuing securities may not be an indication of the risk associated with investing in those securities. For more information on valuation inputs, and their aggregation into the levels used in the tables below, please refer to the Security Valuation section in the accompanying Notes to Financial Statements. |
Valuation Inputs at Reporting Date: |
Description | Total | Level 1 | Level 2 | Level 3 |
Investments in Securities: | | | | |
Equities: | | | | |
Consumer Discretionary | $ 143,537,049 | $ 128,300,726 | $ 5,557,081 | $ 9,679,242 |
Consumer Staples | 28,905,986 | 28,905,986 | - | - |
Energy | 53,015,099 | 48,634,326 | - | 4,380,773 |
Financials | 87,769,138 | 87,295,509 | 473,629 | - |
Health Care | 69,622,651 | 69,219,213 | - | 403,438 |
Industrials | 98,004,520 | 97,822,641 | - | 181,879 |
Information Technology | 142,870,718 | 142,142,056 | - | 728,662 |
Materials | 74,909,127 | 74,575,481 | - | 333,646 |
Telecommunication Services | 4,426,521 | 4,426,521 | - | - |
Utilities | 2,202,829 | 2,202,829 | - | - |
Corporate Bonds | 1,400,000 | - | - | 1,400,000 |
Money Market Funds | 69,484,474 | 69,484,474 | - | - |
Total Investments in Securities: | $ 776,148,112 | $ 753,009,762 | $ 6,030,710 | $ 17,107,640 |
The following is a summary of transfers between Level 1 and Level 2 for the period ended October 31, 2012. Transfers are assumed to have occurred at the beginning of the period, and are primarily attributable to the valuation techniques used for foreign equity securities, as discussed in the accompanying Notes to Financial Statements: |
Transfers | Total |
Level 1 to Level 2 | $ 0 |
Level 2 to Level 1 | $ 131,002,515 |
Valuation Inputs at Reporting Date: |
The following is a reconciliation of Investments in Securities for which Level 3 inputs were used in determining value: |
Investments in Securities: | |
Equities - Consumer Discretionary | |
Beginning Balance | $ 16 |
Total Realized Gain (Loss) | - |
Total Unrealized Gain (Loss) | (2,130,470) |
Cost of Purchases | - |
Proceeds of Sales | - |
Amortization/Accretion | - |
Transfers in to Level 3 | 11,809,696 |
Transfers out of Level 3 | - |
Ending Balance | $ 9,679,242 |
The change in unrealized gain (loss) for the period attributable to Level 3 securities held at October 31, 2012 | $ (2,130,470) |
Other Investments in Securities | |
Beginning Balance | $ 8,345,313 |
Total Realized Gain (Loss) | (6,001,770) |
Total Unrealized Gain (Loss) | 4,079,700 |
Cost of Purchases | 1,400,000 |
Proceeds of Sales | (2,051,934) |
Amortization/Accretion | - |
Transfers in to Level 3 | 1,657,089 |
Transfers out of Level 3 | - |
Ending Balance | $ 7,428,398 |
The change in unrealized gain (loss) for the period attributable to Level 3 securities held at October 31, 2012 | $ (2,023,569) |
The information used in the above reconciliations represents fiscal year to date activity for any Investments in Securities identified as using Level 3 inputs at either the beginning or the end of the current fiscal period. Transfers into Level 3 were attributable to a lack of observable market data resulting from decreases in market activity, decreases in liquidity, security restructurings or corporate actions. Transfers out of Level 3 were attributable to observable market data becoming available for those securities. Transfers in or out of Level 3 represent the beginning value of any Security or Instrument where a change in the pricing level occurred from the beginning to the end of the period. The cost of purchases and the proceeds of sales may include securities received or delivered through corporate actions or exchanges. Realized and unrealized gains (losses) disclosed in the reconciliations are included in Net Gain (Loss) on the Fund's Statement of Operations. |
See accompanying notes which are an integral part of the financial statements.
Annual Report
Financial Statements
Statement of Assets and Liabilities
| October 31, 2012 |
| | |
Assets | | |
Investment in securities, at value (including securities loaned of $39,538,303) - See accompanying schedule: Unaffiliated issuers (cost $652,965,199) | $ 696,984,412 | |
Fidelity Central Funds (cost $69,484,474) | 69,484,474 | |
Other affiliated issuers (cost $6,412,286) | 9,679,226 | |
Total Investments (cost $728,861,959) | | $ 776,148,112 |
Foreign currency held at value (cost $33,857) | | 33,838 |
Receivable for investments sold | | 2,827,704 |
Receivable for fund shares sold | | 709,719 |
Dividends receivable | | 1,714,617 |
Interest receivable | | 22,702 |
Distributions receivable from Fidelity Central Funds | | 108,952 |
Other receivables | | 50,490 |
Total assets | | 781,616,134 |
| | |
Liabilities | | |
Payable to custodian bank | $ 400,266 | |
Payable for investments purchased | 3,347,180 | |
Payable for fund shares redeemed | 1,443,678 | |
Accrued management fee | 613,770 | |
Distribution and service plan fees payable | 13,250 | |
Other affiliated payables | 200,735 | |
Other payables and accrued expenses | 328,637 | |
Collateral on securities loaned, at value | 42,020,618 | |
Total liabilities | | 48,368,134 |
| | |
Net Assets | | $ 733,248,000 |
Net Assets consist of: | | |
Paid in capital | | $ 777,008,696 |
Undistributed net investment income | | 4,511,102 |
Accumulated undistributed net realized gain (loss) on investments and foreign currency transactions | | (95,349,581) |
Net unrealized appreciation (depreciation) on investments and assets and liabilities in foreign currencies | | 47,077,783 |
Net Assets | | $ 733,248,000 |
See accompanying notes which are an integral part of the financial statements.
Annual Report
Statement of Assets and Liabilities - continued
| October 31, 2012 |
| | |
Calculation of Maximum Offering Price
Class A:
Net Asset Value and redemption price per share
($14,124,535 ÷ 715,414 shares) | | $ 19.74 |
| | |
Maximum offering price per share (100/94.25 of $19.74) | | $ 20.94 |
Class T:
Net Asset Value and redemption price per share ($9,262,276 ÷ 472,720 shares) | | $ 19.59 |
| | |
Maximum offering price per share (100/96.50 of $19.59) | | $ 20.30 |
Class B:
Net Asset Value and offering price per share ($789,979 ÷ 41,097 shares)A | | $ 19.22 |
| | |
Class C:
Net Asset Value and offering price per share ($6,798,784 ÷ 354,409 shares)A | | $ 19.18 |
| | |
International Small Cap:
Net Asset Value, offering price and redemption price per share ($692,769,335 ÷ 34,653,723 shares) | | $ 19.99 |
| | |
Institutional Class:
Net Asset Value, offering price and redemption price per share ($9,503,091 ÷ 475,117 shares) | | $ 20.00 |
A Redemption price per share is equal to net asset value less any applicable contingent deferred sales charge.
See accompanying notes which are an integral part of the financial statements.
Annual Report
Financial Statements - continued
Statement of Operations
| Year ended October 31, 2012 |
| | |
Investment Income | | |
Dividends (including $146,001 earned from other affiliated issuers) | | $ 14,934,160 |
Interest | | 35,091 |
Income from Fidelity Central Funds (including $1,033,335 from security lending) | | 1,060,526 |
Income before foreign taxes withheld | | 16,029,777 |
Less foreign taxes withheld | | (830,680) |
Total income | | 15,199,097 |
| | |
Expenses | | |
Management fee
Basic fee | $ 6,793,958 | |
Performance adjustment | 794,505 | |
Transfer agent fees | 2,203,397 | |
Distribution and service plan fees | 185,199 | |
Accounting and security lending fees | 390,539 | |
Custodian fees and expenses | 266,235 | |
Independent trustees' compensation | 5,334 | |
Registration fees | 89,380 | |
Audit | 149,081 | |
Legal | 4,272 | |
Miscellaneous | 10,991 | |
Total expenses before reductions | 10,892,891 | |
Expense reductions | (204,895) | 10,687,996 |
Net investment income (loss) | | 4,511,101 |
Realized and Unrealized Gain (Loss) Net realized gain (loss) on: | | |
Investment securities: | | |
Unaffiliated issuers (net of foreign taxes of $2,323) | (4,623,160) | |
Foreign currency transactions | (136,906) | |
Futures contracts | 617,111 | |
Total net realized gain (loss) | | (4,142,955) |
Change in net unrealized appreciation (depreciation) on: Investment securities (net of increase in deferred foreign taxes of $187,847) | 42,478,383 | |
Assets and liabilities in foreign currencies | (17,086) | |
Futures contracts | 113,279 | |
Total change in net unrealized appreciation (depreciation) | | 42,574,576 |
Net gain (loss) | | 38,431,621 |
Net increase (decrease) in net assets resulting from operations | | $ 42,942,722 |
See accompanying notes which are an integral part of the financial statements.
Annual Report
Statement of Changes in Net Assets
| Year ended
October 31,
2012 | Year ended
October 31,
2011 |
Increase (Decrease) in Net Assets | | |
Operations | | |
Net investment income (loss) | $ 4,511,101 | $ 8,017,121 |
Net realized gain (loss) | (4,142,955) | 35,260,441 |
Change in net unrealized appreciation (depreciation) | 42,574,576 | (96,830,627) |
Net increase (decrease) in net assets resulting
from operations | 42,942,722 | (53,553,065) |
Distributions to shareholders from net investment income | (8,016,423) | (2,430,566) |
Distributions to shareholders from net realized gain | (12,577,679) | (28,246,937) |
Total distributions | (20,594,102) | (30,677,503) |
Share transactions - net increase (decrease) | (204,187,386) | 129,451,482 |
Redemption fees | 102,611 | 283,575 |
Total increase (decrease) in net assets | (181,736,155) | 45,504,489 |
| | |
Net Assets | | |
Beginning of period | 914,984,155 | 869,479,666 |
End of period (including undistributed net investment income of $4,511,102 and undistributed net investment income of $8,017,124, respectively) | $ 733,248,000 | $ 914,984,155 |
See accompanying notes which are an integral part of the financial statements.
Annual Report
Financial Highlights - Class A
Years ended October 31, | 2012 | 2011 | 2010 | 2009 | 2008 |
Selected Per-Share Data | | | | | |
Net asset value, beginning of period | $ 18.97 | $ 20.42 | $ 17.28 | $ 11.91 | $ 31.14 |
Income from Investment Operations | | | | | |
Net investment income (loss) C | .06 | .10 | .03 | .06 | - H |
Net realized and unrealized gain (loss) | 1.09 | (.88) | 3.51 | 5.31 | (14.03) |
Total from investment operations | 1.15 | (.78) | 3.54 | 5.37 | (14.03) |
Distributions from net investment income | (.11) | (.02) | (.06) | - | (.03) |
Distributions from net realized gain | (.27) | (.66) | (.34) | - | (5.18) |
Total distributions | (.38) | (.68) | (.40) | - | (5.20) I |
Redemption fees added to paid in capital C | - H | .01 | - H | - H | - H |
Net asset value, end of period | $ 19.74 | $ 18.97 | $ 20.42 | $ 17.28 | $ 11.91 |
Total Return A,B | 6.28% | (4.00)% | 20.85% | 45.09% | (53.35)% |
Ratios to Average Net Assets D,G | | | | | |
Expenses before reductions | 1.63% | 1.56% | 1.71% | 1.75% | 1.82% |
Expenses net of fee waivers, if any | 1.63% | 1.55% | 1.65% | 1.65% | 1.65% |
Expenses net of all reductions | 1.60% | 1.54% | 1.63% | 1.62% | 1.60% |
Net investment income (loss) | .32% | .49% | .16% | .41% | -% F |
Supplemental Data | | | | | |
Net assets, end of period (000 omitted) | $ 14,125 | $ 17,185 | $ 19,720 | $ 17,590 | $ 13,561 |
Portfolio turnover rate E | 68% | 47% | 66% | 81% | 113% |
A Total returns would have been lower if certain expenses had not been reduced during the applicable periods shown.
B Total returns do not include the effect of the sales charges.
C Calculated based on average shares outstanding during the period.
D Fees and expenses of any underlying Fidelity Central Funds are not included in the Fund's expense ratio. The Fund indirectly bears its proportionate share of the expenses of any underlying Fidelity Central Funds.
E Amount does not include the portfolio activity of any underlying Fidelity Central Funds.
F Amount represents less than .01%.
G Expense ratios reflect operating expenses of the class. Expenses before reductions do not reflect amounts reimbursed by the investment adviser or reductions from brokerage service arrangements or reductions from other expense offset arrangements and do not represent the amount paid by the class during periods when reimbursements or reductions occur. Expenses net of fee waivers reflect expenses after reimbursement by the investment adviser but prior to reductions from brokerage service arrangements or other expense offset arrangements. Expenses net of all reductions represent the net expenses paid by the class.
H Amount represents less than $.01 per share.
I Total distributions of $5.20 per share is comprised of distributions from net investment income of $.026 and distributions from net realized gain of $5.176 per share.
See accompanying notes which are an integral part of the financial statements.
Annual Report
Financial Highlights - Class T
Years ended October 31, | 2012 | 2011 | 2010 | 2009 | 2008 |
Selected Per-Share Data | | | | | |
Net asset value, beginning of period | $ 18.80 | $ 20.23 | $ 17.14 | $ 11.84 | $ 30.96 |
Income from Investment Operations | | | | | |
Net investment income (loss) C | .01 | .05 | (.02) | .02 | (.05) |
Net realized and unrealized gain (loss) | 1.08 | (.86) | 3.47 | 5.28 | (13.95) |
Total from investment operations | 1.09 | (.81) | 3.45 | 5.30 | (14.00) |
Distributions from net investment income | (.03) | - | (.02) | - | - |
Distributions from net realized gain | (.27) | (.63) | (.34) | - | (5.12) |
Total distributions | (.30) | (.63) | (.36) | - | (5.12) |
Redemption fees added to paid in capital C | - G | .01 | - G | - G | - G |
Net asset value, end of period | $ 19.59 | $ 18.80 | $ 20.23 | $ 17.14 | $ 11.84 |
Total Return A,B | 5.97% | (4.18)% | 20.46% | 44.76% | (53.46)% |
Ratios to Average Net Assets D,F | | | | | |
Expenses before reductions | 1.88% | 1.82% | 1.97% | 2.00% | 2.07% |
Expenses net of fee waivers, if any | 1.88% | 1.81% | 1.90% | 1.90% | 1.90% |
Expenses net of all reductions | 1.85% | 1.79% | 1.88% | 1.86% | 1.86% |
Net investment income (loss) | .07% | .24% | (.09)% | .16% | (.25)% |
Supplemental Data | | | | | |
Net assets, end of period (000 omitted) | $ 9,262 | $ 13,744 | $ 16,092 | $ 15,760 | $ 13,493 |
Portfolio turnover rate E | 68% | 47% | 66% | 81% | 113% |
A Total returns would have been lower if certain expenses had not been reduced during the applicable periods shown.
B Total returns do not include the effect of the sales charges.
C Calculated based on average shares outstanding during the period.
D Fees and expenses of any underlying Fidelity Central Funds are not included in the Fund's expense ratio. The Fund indirectly bears its proportionate share of the expenses of any underlying Fidelity Central Funds.
E Amount does not include the portfolio activity of any underlying Fidelity Central Funds.
F Expense ratios reflect operating expenses of the class. Expenses before reductions do not reflect amounts reimbursed by the investment adviser or reductions from brokerage service arrangements or reductions from other expense offset arrangements and do not represent the amount paid by the class during periods when reimbursements or reductions occur. Expenses net of fee waivers reflect expenses after reimbursement by the investment adviser but prior to reductions from brokerage service arrangements or other expense offset arrangements. Expenses net of all reductions represent the net expenses paid by the class.
G Amount represents less than $.01 per share.
See accompanying notes which are an integral part of the financial statements.
Annual Report
Financial Highlights - Class B
Years ended October 31, | 2012 | 2011 | 2010 | 2009 | 2008 |
Selected Per-Share Data | | | | | |
Net asset value, beginning of period | $ 18.38 | $ 19.79 | $ 16.78 | $ 11.65 | $ 30.49 |
Income from Investment Operations | | | | | |
Net investment income (loss) C | (.08) | (.05) | (.10) | (.04) | (.16) |
Net realized and unrealized gain (loss) | 1.07 | (.85) | 3.39 | 5.17 | (13.73) |
Total from investment operations | .99 | (.90) | 3.29 | 5.13 | (13.89) |
Distributions from net realized gain | (.15) | (.52) | (.28) | - | (4.95) |
Redemption fees added to paid in capital C | - G | .01 | - G | - G | - G |
Net asset value, end of period | $ 19.22 | $ 18.38 | $ 19.79 | $ 16.78 | $ 11.65 |
Total Return A,B | 5.45% | (4.68)% | 19.90% | 44.03% | (53.68)% |
Ratios to Average Net Assets D,F | | | | | |
Expenses before reductions | 2.38% | 2.32% | 2.47% | 2.49% | 2.58% |
Expenses net of fee waivers, if any | 2.38% | 2.30% | 2.40% | 2.40% | 2.40% |
Expenses net of all reductions | 2.35% | 2.29% | 2.38% | 2.36% | 2.36% |
Net investment income (loss) | (.43)% | (.26)% | (.59)% | (.33)% | (.75)% |
Supplemental Data | | | | | |
Net assets, end of period (000 omitted) | $ 790 | $ 2,067 | $ 3,457 | $ 3,601 | $ 3,230 |
Portfolio turnover rate E | 68% | 47% | 66% | 81% | 113% |
A Total returns would have been lower if certain expenses had not been reduced during the applicable periods shown.
B Total returns do not include the effect of the contingent deferred sales charge.
C Calculated based on average shares outstanding during the period.
D Fees and expenses of any underlying Fidelity Central Funds are not included in the Fund's expense ratio. The Fund indirectly bears its proportionate share of the expenses of any underlying Fidelity Central Funds.
E Amount does not include the portfolio activity of any underlying Fidelity Central Funds.
F Expense ratios reflect operating expenses of the class. Expenses before reductions do not reflect amounts reimbursed by the investment adviser or reductions from brokerage service arrangements or reductions from other expense offset arrangements and do not represent the amount paid by the class during periods when reimbursements or reductions occur. Expenses net of fee waivers reflect expenses after reimbursement by the investment adviser but prior to reductions from brokerage service arrangements or other expense offset arrangements. Expenses net of all reductions represent the net expenses paid by the class.
G Amount represents less than $.01 per share.
See accompanying notes which are an integral part of the financial statements.
Annual Report
Financial Highlights - Class C
Years ended October 31, | 2012 | 2011 | 2010 | 2009 | 2008 |
Selected Per-Share Data | | | | | |
Net asset value, beginning of period | $ 18.38 | $ 19.85 | $ 16.85 | $ 11.70 | $ 30.62 |
Income from Investment Operations | | | | | |
Net investment income (loss) C | (.08) | (.04) | (.10) | (.04) | (.16) |
Net realized and unrealized gain (loss) | 1.07 | (.85) | 3.40 | 5.19 | (13.78) |
Total from investment operations | .99 | (.89) | 3.30 | 5.15 | (13.94) |
Distributions from net realized gain | (.19) | (.59) | (.30) | - | (4.98) |
Redemption fees added to paid in capital C | - G | .01 | - G | - G | - G |
Net asset value, end of period | $ 19.18 | $ 18.38 | $ 19.85 | $ 16.85 | $ 11.70 |
Total Return A,B | 5.46% | (4.64)% | 19.86% | 44.02% | (53.67)% |
Ratios to Average Net Assets D,F | | | | | |
Expenses before reductions | 2.38% | 2.27% | 2.42% | 2.49% | 2.57% |
Expenses net of fee waivers, if any | 2.38% | 2.26% | 2.40% | 2.40% | 2.40% |
Expenses net of all reductions | 2.35% | 2.24% | 2.37% | 2.36% | 2.36% |
Net investment income (loss) | (.43)% | (.21)% | (.59)% | (.33)% | (.76)% |
Supplemental Data | | | | | |
Net assets, end of period (000 omitted) | $ 6,799 | $ 9,545 | $ 13,501 | $ 5,814 | $ 5,658 |
Portfolio turnover rate E | 68% | 47% | 66% | 81% | 113% |
A Total returns would have been lower if certain expenses had not been reduced during the applicable periods shown.
B Total returns do not include the effect of the contingent deferred sales charge.
C Calculated based on average shares outstanding during the period.
D Fees and expenses of any underlying Fidelity Central Funds are not included in the Fund's expense ratio. The Fund indirectly bears its proportionate share of the expenses of any underlying Fidelity Central Funds.
E Amount does not include the portfolio activity of any underlying Fidelity Central Funds.
F Expense ratios reflect operating expenses of the class. Expenses before reductions do not reflect amounts reimbursed by the investment adviser or reductions from brokerage service arrangements or reductions from other expense offset arrangements and do not represent the amount paid by the class during periods when reimbursements or reductions occur. Expenses net of fee waivers reflect expenses after reimbursement by the investment adviser but prior to reductions from brokerage service arrangements or other expense offset arrangements. Expenses net of all reductions represent the net expenses paid by the class.
G Amount represents less than $.01 per share.
See accompanying notes which are an integral part of the financial statements.
Annual Report
Financial Highlights - International Small Cap
Years ended October 31, | 2012 | 2011 | 2010 | 2009 | 2008 |
Selected Per-Share Data | | | | | |
Net asset value, beginning of period | $ 19.23 | $ 20.66 | $ 17.48 | $ 12.03 | $ 31.44 |
Income from Investment Operations | | | | | |
Net investment income (loss) B | .11 | .17 | .07 | .08 | .03 |
Net realized and unrealized gain (loss) | 1.10 | (.89) | 3.53 | 5.37 | (14.14) |
Total from investment operations | 1.21 | (.72) | 3.60 | 5.45 | (14.11) |
Distributions from net investment income | (.18) | (.06) | (.08) | - | (.12) |
Distributions from net realized gain | (.27) | (.66) | (.34) | - | (5.18) |
Total distributions | (.45) | (.72) | (.42) | - | (5.30) |
Redemption fees added to paid in capital B | - F | .01 | - F | - F | - F |
Net asset value, end of period | $ 19.99 | $ 19.23 | $ 20.66 | $ 17.48 | $ 12.03 |
Total Return A | 6.55% | (3.65)% | 21.02% | 45.30% | (53.25)% |
Ratios to Average Net Assets C,E | | | | | |
Expenses before reductions | 1.35% | 1.26% | 1.44% | 1.48% | 1.49% |
Expenses net of fee waivers, if any | 1.35% | 1.25% | 1.44% | 1.48% | 1.49% |
Expenses net of all reductions | 1.33% | 1.23% | 1.42% | 1.44% | 1.44% |
Net investment income (loss) | .59% | .80% | .37% | .58% | .16% |
Supplemental Data | | | | | |
Net assets, end of period (000 omitted) | $ 692,769 | $ 856,692 | $ 808,478 | $ 669,035 | $ 536,291 |
Portfolio turnover rate D | 68% | 47% | 66% | 81% | 113% |
A Total returns would have been lower if certain expenses had not been reduced during the applicable periods shown.
B Calculated based on average shares outstanding during the period.
C Fees and expenses of any underlying Fidelity Central Funds are not included in the Fund's expense ratio. The Fund indirectly bears its proportionate share of the expenses of any underlying Fidelity Central Funds.
D Amount does not include the portfolio activity of any underlying Fidelity Central Funds.
E Expense ratios reflect operating expenses of the class. Expenses before reductions do not reflect amounts reimbursed by the investment adviser or reductions from brokerage service arrangements or reductions from other expense offset arrangements and do not represent the amount paid by the class during periods when reimbursements or reductions occur. Expenses net of fee waivers reflect expenses after reimbursement by the investment adviser but prior to reductions from brokerage service arrangements or other expense offset arrangements. Expenses net of all reductions represent the net expenses paid by the class.
F Amount represents less than $.01 per share.
See accompanying notes which are an integral part of the financial statements.
Annual Report
Financial Highlights - Institutional Class
Years ended October 31, | 2012 | 2011 | 2010 | 2009 | 2008 |
Selected Per-Share Data | | | | | |
Net asset value, beginning of period | $ 19.24 | $ 20.66 | $ 17.47 | $ 12.01 | $ 31.38 |
Income from Investment Operations | | | | | |
Net investment income (loss) B | .13 | .18 | .09 | .09 | .05 |
Net realized and unrealized gain (loss) | 1.10 | (.89) | 3.53 | 5.37 | (14.12) |
Total from investment operations | 1.23 | (.71) | 3.62 | 5.46 | (14.07) |
Distributions from net investment income | (.20) | (.06) | (.09) | - | (.12) |
Distributions from net realized gain | (.27) | (.66) | (.34) | - | (5.18) |
Total distributions | (.47) | (.72) | (.43) | - | (5.30) |
Redemption fees added to paid in capital B | - F | .01 | - F | - F | - F |
Net asset value, end of period | $ 20.00 | $ 19.24 | $ 20.66 | $ 17.47 | $ 12.01 |
Total Return A | 6.65% | (3.62)% | 21.15% | 45.46% | (53.22)% |
Ratios to Average Net Assets C,E | | | | | |
Expenses before reductions | 1.25% | 1.22% | 1.34% | 1.45% | 1.49% |
Expenses net of fee waivers, if any | 1.25% | 1.21% | 1.34% | 1.40% | 1.40% |
Expenses net of all reductions | 1.22% | 1.19% | 1.31% | 1.37% | 1.35% |
Net investment income (loss) | .70% | .84% | .47% | .66% | .25% |
Supplemental Data | | | | | |
Net assets, end of period (000 omitted) | $ 9,503 | $ 15,752 | $ 8,231 | $ 2,696 | $ 2,217 |
Portfolio turnover rate D | 68% | 47% | 66% | 81% | 113% |
A Total returns would have been lower if certain expenses had not been reduced during the applicable periods shown.
B Calculated based on average shares outstanding during the period.
C Fees and expenses of any underlying Fidelity Central Funds are not included in the Fund's expense ratio. The Fund indirectly bears its proportionate share of the expenses of any underlying Fidelity Central Funds.
D Amount does not include the portfolio activity of any underlying Fidelity Central Funds.
E Expense ratios reflect operating expenses of the class. Expenses before reductions do not reflect amounts reimbursed by the investment adviser or reductions from brokerage service arrangements or reductions from other expense offset arrangements and do not represent the amount paid by the class during periods when reimbursements or reductions occur. Expenses net of fee waivers reflect expenses after reimbursement by the investment adviser but prior to reductions from brokerage service arrangements or other expense offset arrangements. Expenses net of all reductions represent the net expenses paid by the class.
F Amount represents less than $.01 per share.
See accompanying notes which are an integral part of the financial statements.
Annual Report
Notes to Financial Statements
For the period ended October 31, 2012
1. Organization.
Fidelity International Small Cap Fund (the Fund) is a fund of Fidelity Investment Trust (the Trust) and is authorized to issue an unlimited number of shares. The Trust is registered under the Investment Company Act of 1940, as amended (the 1940 Act), as an open-end management investment company organized as a Massachusetts business trust. The Fund offers Class A, Class T, Class C, International Small Cap and Institutional Class shares, each of which, along with Class B shares, has equal rights as to assets and voting privileges. Effective after the close of business on September 1, 2010, Class B shares were closed to new accounts and additional purchases, except for exchanges and reinvestments. Each class has exclusive voting rights with respect to matters that affect that class. Class B shares will automatically convert to Class A shares after a holding period of seven years from the initial date of purchase. Investment income, realized and unrealized capital gains and losses, the common expenses of the Fund, and certain fund-level expense reductions, if any, are allocated on a pro-rata basis to each class based on the relative net assets of each class to the total net assets of the Fund. Each class differs with respect to transfer agent and distribution and service plan fees incurred. Certain expense reductions may also differ by class. The Fund's investments in emerging markets can be subject to social, economic, regulatory, and political uncertainties and can be extremely volatile.
2. Investments in Fidelity Central Funds.
The Fund invests in Fidelity Central Funds, which are open-end investment companies available only to other investment companies and accounts managed by Fidelity Management & Research Company (FMR) and its affiliates. The Fund's Schedule of Investments lists each of the Fidelity Central Funds held as of period end, as an investment of the Fund, but does not include the underlying holdings of each Fidelity Central Fund. As an Investing Fund, the Fund indirectly bears its proportionate share of the expenses of the underlying Fidelity Central Funds.
The Money Market Central Funds seek preservation of capital and current income and are managed by Fidelity Investments Money Management, Inc. (FIMM), an affiliate of FMR.
A complete unaudited list of holdings for each Fidelity Central Fund is available upon request or at the Securities and Exchange Commission (the SEC) web site at www.sec.gov. In addition, the financial statements of the Fidelity Central Funds, which are not covered by the Fund's Report of Independent Registered Public Accounting Firm, are available on the SEC web site or upon request.
Annual Report
3. Significant Accounting Policies.
The financial statements have been prepared in conformity with accounting principles generally accepted in the United States of America (GAAP), which require management to make certain estimates and assumptions at the date of the financial statements. Actual results could differ from those estimates. Subsequent events, if any, through the date that the financial statements were issued have been evaluated in the preparation of the financial statements. The following summarizes the significant accounting policies of the Fund:
Security Valuation. Investments are valued as of 4:00 p.m. Eastern time on the last calendar day of the period. In accordance with valuation policies and procedures approved by the Board of Trustees (the Board), the Fund attempts to obtain prices from one or more third party pricing vendors or brokers to value its investments. When current market prices, quotations or rates are not readily available or reliable, securities will be fair valued in good faith by the FMR Fair Value Committee (the Committee), in accordance with procedures adopted by the Fund's Board. Factors used in determining fair value vary by security type and may include market or security specific events, changes in interest rates and credit quality. The frequency with which these procedures are used cannot be predicted and they may be utilized to a significant extent. The Committee oversees the Fund's valuation policies and procedures and is responsible for approving and reporting to the Board all fair value determinations.
The Fund categorizes the inputs to valuation techniques used to value its investments into a disclosure hierarchy consisting of three levels as shown below:
Level 1 - quoted prices in active markets for identical investments
Level 2 - other significant observable inputs (including quoted prices for similar investments, interest rates, prepayment speeds, etc.)
Level 3 - unobservable inputs (including the Fund's own assumptions based on the best information available)
Valuation techniques used to value the Fund's investments by major category are as follows:
Equity securities, including restricted securities, for which market quotations are readily available, are valued at the last reported sale price or official closing price as reported by a third party pricing vendor on the primary market or exchange on which they are traded and are categorized as Level 1 in the hierarchy. In the event there were no sales during the day or closing prices are not available, securities are valued at the last quoted bid price or may be valued using the last available price and are generally categorized as Level 2 in the hierarchy. For foreign equity securities, when significant market or security specific events arise, comparisons to the valuation of American Depositary Receipts
Annual Report
Notes to Financial Statements - continued
3. Significant Accounting Policies - continued
Security Valuation - continued
(ADRs), futures contracts, Exchange-Traded Funds (ETFs) and certain indexes as well as quoted prices for similar securities are used and are categorized as Level 2 in the hierarchy. Utilizing these techniques may result in transfers between Level 1 and Level 2. For restricted equity securities and private placements where observable inputs are limited, assumptions about market activity and risk are used and these securities are categorized as Level 3 in the hierarchy.
Debt securities, including restricted securities, are valued based on evaluated prices received from third party pricing vendors or from brokers who make markets in such securities. For corporate bonds, pricing vendors utilize matrix pricing which considers yield or price of bonds of comparable quality, coupon, maturity and type as well as broker-supplied prices and are generally categorized as Level 2 in the hierarchy. When independent prices are unavailable or unreliable, debt securities may be valued utilizing pricing methodologies which consider similar factors that would be used by third party pricing vendors. These are generally categorized as Level 2 in the hierarchy but may be Level 3 depending on the circumstances.
Investments in open-end mutual funds, including the Fidelity Central Funds, are valued at their closing net asset value (NAV) each business day and are categorized as Level 1 in the hierarchy.
The following provides information on Level 3 securities held by the Fund that were valued at period end based on unobservable inputs. These amounts exclude valuations provided by a broker.
Asset Type | Fair Value at 10/31/12 | Valuation Technique (s) | Unobservable Input | Range | Weighted Average |
Common Stocks | $ 15,707,639 | Expected distribution | Recovery rate | 0% | 0% |
| | Market comparable | Discount for lack of marketability | 10% - 50% | 35.57% |
| | | EV/NOPAT multiple | 12.3 | 12.3 |
| | | Transaction price | $ .045 - $2.6 | $ 1.06 |
Corporate Bonds | $ 1,400,000 | Market comparable | Transaction price | $ 100 | $ 100 |
For the unobservable inputs listed in the table above, a significant increase in discount for lack of marketability could result in a significant decrease to the fair value measurement. A significant increase in recovery rates, EV/NOPAT multiples or transaction price could result in a significant increase to the fair value measurement.
Annual Report
3. Significant Accounting Policies - continued
Security Valuation - continued
Changes in valuation techniques may result in transfers in or out of an assigned level within the disclosure hierarchy. The aggregate value of investments by input level, as of October 31, 2012, including information on transfers between Levels 1 and 2, as well as a roll forward of Level 3 securities, is included at the end of the Fund's Schedule of Investments.
Foreign Currency Translation. The Fund may use foreign currency contracts to facilitate transactions in foreign-denominated securities. Gains and losses from these transactions may arise from changes in the value of the foreign currency or if the counterparties do not perform under the contracts' terms.
Foreign-denominated assets, including investment securities, and liabilities are translated into U.S. dollars at the exchange rates at period end. Purchases and sales of investment securities, income and dividends received and expenses denominated in foreign currencies are translated into U.S. dollars at the exchange rate in effect on the transaction date.
The effects of exchange rate fluctuations on investments are included with the net realized and unrealized gain (loss) on investment securities. Other foreign currency transactions resulting in realized and unrealized gain (loss) are disclosed separately.
Investment Transactions and Income. For financial reporting purposes, the Fund's investment holdings and NAV include trades executed through the end of the last business day of the period. The NAV per share for processing shareholder transactions is calculated as of the close of business of the New York Stock Exchange (NYSE), normally 4:00 p.m. Eastern time and includes trades executed through the end of the prior business day. Gains and losses on securities sold are determined on the basis of identified cost. Dividend income is recorded on the ex-dividend date, except for certain dividends from foreign securities where the ex-dividend date may have passed, which are recorded as soon as the Fund is informed of the ex-dividend date. Non-cash dividends included in dividend income, if any, are recorded at the fair market value of the securities received. Interest income and distributions from the Fidelity Central Funds are accrued as earned. Interest income includes coupon interest and amortization of premium and accretion of discount on debt securities. Investment income is recorded net of foreign taxes withheld where recovery of such taxes is uncertain.
Expenses. Expenses directly attributable to a fund are charged to that fund. Expenses attributable to more than one fund are allocated among the respective funds on the basis of relative net assets or other appropriate methods. Expense estimates are accrued in the period to which they relate and adjustments are made when actual amounts are known.
Annual Report
Notes to Financial Statements - continued
3. Significant Accounting Policies - continued
Income Tax Information and Distributions to Shareholders. Each year, the Fund intends to qualify as a regulated investment company under Subchapter M of the Internal Revenue Code, including distributing substantially all of its taxable income and realized gains. As a result, no provision for income taxes is required. As of October 31, 2012, the Fund did not have any unrecognized tax benefits in the financial statements; nor is the Fund aware of any tax positions for which it is reasonably possible that the total amounts of unrecognized tax benefits will significantly change in the next twelve months. The Fund files a U.S. federal tax return, in addition to state and local tax returns as required. A fund's federal income tax returns are subject to examination by the Internal Revenue Service (IRS) for a period of three fiscal years after they are filed. State and local tax returns may be subject to examination for an additional fiscal year depending on the jurisdiction. Foreign taxes are provided for based on the Fund's understanding of the tax rules and rates that exist in the foreign markets in which it invests. The Fund is subject to a tax imposed on capital gains by certain countries in which it invests. An estimated deferred tax liability for net unrealized appreciation on the applicable securities is included in Other payables and accrued expenses on the Statement of Assets & Liabilities.
Distributions are declared and recorded on the ex-dividend date. Income dividends and capital gain distributions are declared separately for each class. Income and capital gain distributions are determined in accordance with income tax regulations, which may differ from GAAP.
Capital accounts within the financial statements are adjusted for permanent book-tax differences. These adjustments have no impact on net assets or the results of operations. Temporary book-tax differences will reverse in a subsequent period.
Book-tax differences are primarily due futures transactions, foreign currency transactions, certain foreign taxes, passive foreign investment companies (PFIC), market discount, capital loss carryforwards and losses deferred due to wash sales.
The federal tax cost of investment securities and unrealized appreciation (depreciation) as of period end were as follows:
Gross unrealized appreciation | 127,681,860 |
Gross unrealized depreciation | (104,609,169) |
Net unrealized appreciation (depreciation) on securities and other investments | $ 23,072,691 |
| |
Tax Cost | $ 753,075,421 |
Annual Report
3. Significant Accounting Policies - continued
Income Tax Information and Distributions to Shareholders - continued
The tax-based components of distributable earnings as of period end were as follows:
Undistributed ordinary income | $ 16,278,609 |
Capital loss carryforward | $ (82,903,626) |
Net unrealized appreciation (depreciation) | $ 23,049,729 |
Capital loss carryforwards are only available to offset future capital gains of the Fund to the extent provided by regulations and may be limited. Under the Regulated Investment Company Modernization Act of 2010 (the Act), the Fund is permitted to carry forward capital losses incurred in taxable years beginning after December 22, 2010 for an unlimited period and such capital losses are required to be used prior to any losses that expire. Capital loss carryforwards were as follows:
Fiscal year of expiration | |
| |
2017 | $ (65,361,612) |
No expiration | |
Short-term | (13,191,063) |
Long-term | (4,350,951) |
Total no expiration | (17,542,014) |
Total capital loss carryforward | $ (82,903,626) |
| |
The tax character of distributions paid was as follows:
| October 31, 2012 | October 31, 2011 |
Ordinary Income | $ 20,594,102 | $ 30,677,503 |
Short-Term Trading (Redemption) Fees. Shares held by investors in the Fund less than 90 days are subject to a redemption fee equal to 2.00% of the net asset value of shares redeemed. All redemption fees, which reduce the proceeds of the shareholder redemption, are retained by the Fund and accounted for as an addition to paid in capital.
Restricted Securities. The Fund may invest in securities that are subject to legal or contractual restrictions on resale. These securities generally may be resold in transactions exempt from registration or to the public if the securities are registered. Disposal of these securities may involve time-consuming negotiations and expense, and prompt sale at an acceptable price may be difficult. Information regarding restricted securities is included at the end of the Fund's Schedule of Investments.
Annual Report
Notes to Financial Statements - continued
3. Significant Accounting Policies - continued
New Accounting Pronouncement. In December 2011, the Financial Accounting Standards Board issued Accounting Standard Update No. 2011-11, Disclosures about Offsetting Assets and Liabilities. The update creates new disclosure requirements requiring entities to disclose both gross and net information for derivatives and other financial instruments that are either offset in the Statement of Assets and Liabilities or subject to an enforceable master netting arrangement or similar agreement. The disclosure requirements are effective for annual reporting periods beginning on or after January 1, 2013, and interim periods within those annual periods. Management is currently evaluating the impact of the update's adoption on the Fund's financial statement disclosures.
4. Derivative Instruments.
Risk Exposures and the Use of Derivative Instruments. The Fund's investment objective allows the Fund to enter into various types of derivative contracts, including futures contracts. Derivatives are investments whose value is primarily derived from underlying assets, indices or reference rates and may be transacted on an exchange or over-the-counter (OTC). Derivatives may involve a future commitment to buy or sell a specified instrument based on specified terms, to exchange future cash flows at periodic intervals based on a notional principal amount, or for one party to make one or more payments upon the occurrence of specified events in exchange for periodic payments from the other party.
The Fund used derivatives to increase returns and to manage exposure to certain risks as defined below. The success of any strategy involving derivatives depends on analysis of numerous economic factors, and if the strategies for investment do not work as intended, the Fund may not achieve its objectives.
The Fund's use of derivatives increased or decreased its exposure to the following risk:
Equity Risk | Equity risk relates to the fluctuations in the value of financial instruments as a result of changes in market prices (other than those arising from interest rate risk or foreign exchange risk), whether caused by factors specific to an individual investment, its issuer, or all factors affecting all instruments traded in a market or market segment. |
The Fund is also exposed to additional risks from investing in derivatives, such as liquidity risk and counterparty credit risk. Liquidity risk is the risk that the Fund will be unable to close out the derivative in the open market in a timely manner. Counterparty credit risk is the risk that the counterparty will not be able to fulfill its obligation to the Fund. Counterparty credit risk related to exchange-traded futures contracts is minimal because of the protection provided by the exchange on which they trade.
Annual Report
4. Derivative Instruments - continued
Risk Exposures and the Use of Derivative Instruments - continued
Investing in derivatives may involve greater risks than investing in the underlying assets directly and, to varying degrees, may involve risk of loss in excess of any initial investment and collateral received and amounts recognized in the Statement of Assets and Liabilities. In addition, there may be the risk that the change in value of the derivative contract does not correspond to the change in value of the underlying instrument.
Futures Contracts. A futures contract is an agreement between two parties to buy or sell a specified underlying instrument for a fixed price at a specified future date. The Fund used futures contracts to manage its exposure to the stock market.
Upon entering into a futures contract, a fund is required to deposit either cash or securities (initial margin) with a clearing broker in an amount equal to a certain percentage of the face value of the contract. Futures contracts are marked-to-market daily and subsequent payments (variation margin) are made or received by a fund depending on the daily fluctuations in the value of the futures contracts and are recorded as unrealized appreciation or (depreciation). This receivable and/or payable is included in daily variation margin on futures contracts in the Statement of Assets and Liabilities. Realized gain or (loss) is recorded upon the expiration or closing of a futures contract.
Any open futures contracts at period end are shown in the Schedule of Investments under the caption "Futures Contracts." The underlying face amount at value reflects each contract's exposure to the underlying instrument at period end and is representative of activity for the period.
During the period the Fund recognized net realized gain (loss) of $617,111 and a change in net unrealized appreciation (depreciation) of $113,279 related to its investment in futures contracts. These amounts are included in the Statement of Operations.
5. Purchases and Sales of Investments.
Purchases and sales of securities, other than short-term securities, aggregated $526,733,625 and $758,337,261, respectively.
6. Fees and Other Transactions with Affiliates.
Management Fee. FMR and its affiliates provide the Fund with investment management related services for which the Fund pays a monthly management fee. The management fee is the sum of an individual fund fee rate that is based on an annual rate of .60% of the Fund's average net assets and an annualized group fee rate that averaged .26% during the period. The group fee rate is based upon the average net assets of all the
Annual Report
Notes to Financial Statements - continued
6. Fees and Other Transactions with Affiliates - continued
Management Fee - continued
mutual funds advised by FMR. The group fee rate decreases as assets under management increase and increases as assets under management decrease. In addition, the management fee is subject to a performance adjustment (up to a maximum of ± .20% of the Fund's average net assets over a 36 month performance period). The upward or downward adjustment to the management fee is based on the relative investment performance of International Small Cap as compared to an appropriate benchmark index. For the period, the total annual management fee rate, including the performance adjustment, was .96% of the Fund's average net assets.
Distribution and Service Plan Fees. In accordance with Rule 12b-1 of the 1940 Act, the Fund has adopted separate Distribution and Service Plans for each class of shares. Certain classes pay Fidelity Distributors Corporation (FDC), an affiliate of FMR, separate Distribution and Service Fees, each of which is based on an annual percentage of each class' average net assets. In addition, FDC may pay financial intermediaries for selling shares of the Fund and providing shareholder support services. For the period, the Distribution and Service Fee rates, total fees and amounts retained by FDC were as follows:
| Distribution
Fee | Service
Fee | Total Fees | Retained
by FDC |
Class A | -% | .25% | $ 37,801 | $ 382 |
Class T | .25% | .25% | 53,002 | 142 |
Class B | .75% | .25% | 12,735 | 9,557 |
Class C | .75% | .25% | 81,661 | 5,650 |
| | | $ 185,199 | $ 15,731 |
Sales Load. FDC may receive a front-end sales charge of up to 5.75% for selling Class A shares and 3.50% for selling Class T shares, some of which is paid to financial intermediaries for selling shares of the Fund. Depending on the holding period, FDC may receive contingent deferred sales charges levied on Class A, Class T, Class B, and Class C redemptions. The deferred sales charges range from 5.00% to 1.00% for Class B shares, 1.00% for Class C shares, 1.00% for certain purchases of Class A shares and .25% for certain purchases of Class T shares.
For the period, sales charge amounts retained by FDC were as follows:
| Retained
by FDC |
Class A | $ 4,719 |
Class T | 1,996 |
Class B* | 272 |
Class C* | 1,068 |
| $ 8,055 |
* When Class B and Class C shares are initially sold, FDC pays commissions from its own resources to financial intermediaries through which the sales are made.
Annual Report
6. Fees and Other Transactions with Affiliates - continued
Transfer Agent Fees. Fidelity Investments Institutional Operations Company, Inc. (FIIOC), an affiliate of FMR, is the transfer, dividend disbursing and shareholder servicing agent for each class of the Fund. FIIOC receives account fees and asset-based fees that vary according to the account size and type of account of the shareholders of the respective classes of the Fund. FIIOC pays for typesetting, printing and mailing of shareholder reports, except proxy statements. For the period, transfer agent fees for each class were as follows:
| Amount | % of
Average
Net Assets |
Class A | $ 45,432 | .30 |
Class T | 32,311 | .31 |
Class B | 3,797 | .30 |
Class C | 24,474 | .30 |
International Small Cap | 2,079,534 | .28 |
Institutional Class | 17,849 | .17 |
| $ 2,203,397 | |
Accounting and Security Lending Fees. Fidelity Service Company, Inc. (FSC), an affiliate of FMR, maintains the Fund's accounting records. The accounting fee is based on the level of average net assets for each month. Under a separate contract, FSC administers the security lending program. The security lending fee is based on the number and duration of lending transactions.
Brokerage Commissions. The Fund placed a portion of its portfolio transactions with brokerage firms which are affiliates of the investment adviser. The commissions paid to these affiliated firms were $572 for the period.
7. Committed Line of Credit.
The Fund participates with other funds managed by FMR or an affiliate in a $4.25 billion credit facility (the "line of credit") to be utilized for temporary or emergency purposes to fund shareholder redemptions or for other short-term liquidity purposes. The Fund has agreed to pay commitment fees on its pro-rata portion of the line of credit, which amounted to $2,240 and is reflected in Miscellaneous expenses on the Statement of Operations. During the period, there were no borrowings on this line of credit.
Annual Report
Notes to Financial Statements - continued
8. Security Lending.
The Fund lends portfolio securities through a lending agent from time to time in order to earn additional income. For equity securities, a lending agent is used and may loan securities to certain qualified borrowers, including Fidelity Capital Markets (FCM), a broker-dealer affiliated with the Fund. On the settlement date of the loan, the Fund receives collateral (in the form of U.S. Treasury obligations, letters of credit and/or cash) against the loaned securities and maintains collateral in an amount not less than 100% of the market value of the loaned securities during the period of the loan. The market value of the loaned securities is determined at the close of business of the Fund and any additional required collateral is delivered to the Fund on the next business day. If the borrower defaults on its obligation to return the securities loaned because of insolvency or other reasons, a fund could experience delays and costs in recovering the securities loaned or in gaining access to the collateral. Any cash collateral received is invested in the Fidelity Securities Lending Cash Central Fund. The value of loaned securities and cash collateral at period end are disclosed on the Fund's Statement of Assets and Liabilities. At period end, there were no security loans outstanding with FCM. Security lending income represents the income earned on investing cash collateral, less rebates paid to borrowers and any lending agent fees associated with the loan, plus any premium payments received for lending certain types of securities. Security lending income is presented in the Statement of Operations as a component of income from Fidelity Central Funds and includes $32,573 from securities loaned to FCM.
9. Expense Reductions.
Many of the brokers with whom FMR places trades on behalf of the Fund provided services to the Fund in addition to trade execution. These services included payments of certain expenses on behalf of the Fund totaling $204,895 for the period.
10. Distributions to Shareholders.
Distributions to shareholders of each class were as follows:
Years ended October 31, | 2012 | 2011 |
From net investment income | | |
Class A | $ 98,060 | $ 15,709 |
Class T | 18,440 | - |
International Small Cap | 7,747,338 | 2,403,692 |
Institutional Class | 152,585 | 11,165 |
Total | $ 8,016,423 | $ 2,430,566 |
Annual Report
10. Distributions to Shareholders - continued
Years ended October 31, | 2012 | 2011 |
From net realized gain | | |
Class A | $ 246,964 | $ 648,961 |
Class T | 172,958 | 496,268 |
Class B | 15,448 | 87,007 |
Class C | 91,928 | 402,241 |
International Small Cap | 11,838,630 | 26,480,677 |
Institutional Class | 211,751 | 131,783 |
Total | $ 12,577,679 | $ 28,246,937 |
11. Share Transactions.
Transactions for each class of shares were as follows:
| Shares | Dollars |
Years ended October 31, | 2012 | 2011 | 2012 | 2011 |
Class A | | | | |
Shares sold | 190,464 | 472,219 | $ 3,581,689 | $ 10,051,889 |
Reinvestment of distributions | 18,159 | 30,361 | 323,949 | 616,326 |
Shares redeemed | (398,912) | (562,759) | (7,484,565) | (11,902,630) |
Net increase (decrease) | (190,289) | (60,179) | $ (3,578,927) | $ (1,234,415) |
Class T | | | | |
Shares sold | 67,193 | 237,757 | $ 1,245,760 | $ 5,055,416 |
Reinvestment of distributions | 10,478 | 24,155 | 185,991 | 486,714 |
Shares redeemed | (336,074) | (326,059) | (6,220,818) | (6,629,520) |
Net increase (decrease) | (258,403) | (64,147) | $ (4,789,067) | $ (1,087,390) |
Class B | | | | |
Shares sold | 1,171 | 21,873 | $ 21,568 | $ 464,854 |
Reinvestment of distributions | 825 | 4,142 | 14,430 | 81,975 |
Shares redeemed | (73,396) | (88,228) | (1,354,968) | (1,778,852) |
Net increase (decrease) | (71,400) | (62,213) | $ (1,318,970) | $ (1,232,023) |
Class C | | | | |
Shares sold | 95,047 | 128,685 | $ 1,772,779 | $ 2,661,361 |
Reinvestment of distributions | 4,830 | 19,105 | 84,289 | 378,079 |
Shares redeemed | (264,717) | (308,659) | (4,745,500) | (6,253,765) |
Net increase (decrease) | (164,840) | (160,869) | $ (2,888,432) | $ (3,214,325) |
International Small Cap | | | | |
Shares sold | 4,700,621 | 17,502,789 | $ 88,441,440 | $ 375,309,666 |
Reinvestment of distributions | 1,033,828 | 1,321,812 | 18,629,579 | 27,110,370 |
Shares redeemed | (15,631,544) | (13,398,001) | (292,428,231) | (275,580,654) |
Net increase (decrease) | (9,897,095) | 5,426,600 | $ (185,357,212) | $ 126,839,382 |
Annual Report
Notes to Financial Statements - continued
11. Share Transactions - continued
| Shares | Dollars |
Years ended October 31, | 2012 | 2011 | 2012 | 2011 |
Institutional Class | | | | |
Shares sold | 199,584 | 798,910 | $ 3,790,776 | $ 17,190,303 |
Reinvestment of distributions | 15,793 | 5,609 | 284,438 | 115,044 |
Shares redeemed | (559,093) | (384,085) | (10,329,992) | (7,925,094) |
Net increase (decrease) | (343,716) | 420,434 | $ (6,254,778) | $ 9,380,253 |
12. Other.
The Fund's organizational documents provide former and current trustees and officers with a limited indemnification against liabilities arising in connection with the performance of their duties to the Fund. In the normal course of business, the Fund may also enter into contracts that provide general indemnifications. The Fund's maximum exposure under these arrangements is unknown as this would be dependent on future claims that may be made against the Fund. The risk of material loss from such claims is considered remote.
At the end of the period, FMR or its affiliates were the owners of record of 14% of the total outstanding shares of the Fund.
Annual Report
Report of Independent Registered Public Accounting Firm
To the Trustees of Fidelity Investment Trust and Shareholders of Fidelity International Small Cap Fund:
We have audited the accompanying statement of assets and liabilities of Fidelity International Small Cap Fund (the Fund), a fund of Fidelity Investment Trust, including the schedule of investments, as of October 31, 2012, and the related statement of operations for the year then ended, the statement of changes in net assets for each of the two years in the period then ended, and the financial highlights for each of the five years in the period then ended. These financial statements and financial highlights are the responsibility of the Fund's management. Our responsibility is to express an opinion on these financial statements and financial highlights based on our audits.
We conducted our audits in accordance with the standards of the Public Company Accounting Oversight Board (United States). Those standards require that we plan and perform the audit to obtain reasonable assurance about whether the financial statements and financial highlights are free of material misstatement. The Fund is not required to have, nor were we engaged to perform, an audit of its internal control over financial reporting. Our audits included consideration of internal control over financial reporting as a basis for designing audit procedures that are appropriate in the circumstances, but not for the purpose of expressing an opinion on the effectiveness of the Fund's internal control over financial reporting. Accordingly, we express no such opinion. An audit also includes examining, on a test basis, evidence supporting the amounts and disclosures in the financial statements, assessing the accounting principles used and significant estimates made by management, as well as evaluating the overall financial statement presentation. Our procedures included confirmation of securities owned as of October 31, 2012, by correspondence with the custodians and brokers; where replies were not received from brokers, we performed other auditing procedures. We believe that our audits provide a reasonable basis for our opinion.
In our opinion, the financial statements and financial highlights referred to above present fairly, in all material respects, the financial position of Fidelity International Small Cap Fund as of October 31, 2012, the results of its operations for the year then ended, the changes in its net assets for each of the two years in the period then ended, and the financial highlights for each of the five years in the period then ended, in conformity with accounting principles generally accepted in the United States of America.
DELOITTE & TOUCHE LLP
Boston, Massachusetts
December 18, 2012
Annual Report
Trustees and Officers
The Trustees, Members of the Advisory Board, and executive officers of the trust and fund, as applicable, are listed below. The Board of Trustees governs the fund and is responsible for protecting the interests of shareholders. The Trustees are experienced executives who meet periodically throughout the year to oversee the fund's activities, review contractual arrangements with companies that provide services to the fund, oversee management of the risks associated with such activities and contractual arrangements, and review the fund's performance. Except for James C. Curvey, each of the Trustees oversees 236 funds advised by FMR or an affiliate. Mr. Curvey oversees 443 funds advised by FMR or an affiliate.
The Trustees hold office without limit in time except that (a) any Trustee may resign; (b) any Trustee may be removed by written instrument, signed by at least two-thirds of the number of Trustees prior to such removal; (c) any Trustee who requests to be retired or who has become incapacitated by illness or injury may be retired by written instrument signed by a majority of the other Trustees; and (d) any Trustee may be removed at any special meeting of shareholders by a two-thirds vote of the outstanding voting securities of the trust. Each Trustee who is not an interested person (as defined in the 1940 Act) (Independent Trustee), shall retire not later than the last day of the calendar year in which his or her 75th birthday occurs. The Independent Trustees may waive this mandatory retirement age policy with respect to individual Trustees. The executive officers and Advisory Board Members hold office without limit in time, except that any officer and Advisory Board Member may resign or may be removed by a vote of a majority of the Trustees at any regular meeting or any special meeting of the Trustees. Except as indicated, each individual has held the office shown or other offices in the same company for the past five years.
Experience, Skills, Attributes, and Qualifications of the Fund's Trustees. The Governance and Nominating Committee has adopted a statement of policy that describes the experience, qualifications, attributes, and skills that are necessary and desirable for potential Independent Trustee candidates (Statement of Policy). The Board believes that each Trustee satisfied at the time he or she was initially elected or appointed a Trustee, and continues to satisfy, the standards contemplated by the Statement of Policy. The Governance and Nominating Committee also engages professional search firms to help identify potential Independent Trustee candidates who have the experience, qualifications, attributes, and skills consistent with the Statement of Policy. From time to time, additional criteria based on the composition and skills of the current Independent Trustees, as well as experience or skills that may be appropriate in light of future changes to board composition, business conditions, and regulatory or other developments, have also been considered by the professional search firms and the Governance and Nominating Committee. In addition, the Board takes into account the Trustees' commitment and participation in Board and committee meetings, as well as their leadership of standing and ad hoc committees throughout their tenure.
In determining that a particular Trustee was and continues to be qualified to serve as a Trustee, the Board has considered a variety of criteria, none of which, in isolation, was controlling. The Board believes that, collectively, the Trustees have balanced and diverse experience, qualifications, attributes, and skills, which allow the Board to operate effectively in governing the fund and protecting the interests of shareholders. Information about the specific experience, skills, attributes, and qualifications of each Trustee, which in each case led to the Board's conclusion that the Trustee should serve (or continue to serve) as a trustee of the fund, is provided below.
Annual Report
Board Structure and Oversight Function. James C. Curvey is an interested person (as defined in the 1940 Act) and currently serves as Chairman. The Trustees have determined that an interested Chairman is appropriate and benefits shareholders because an interested Chairman has a personal and professional stake in the quality and continuity of services provided to the fund. Independent Trustees exercise their informed business judgment to appoint an individual of their choosing to serve as Chairman, regardless of whether the Trustee happens to be independent or a member of management. The Independent Trustees have determined that they can act independently and effectively without having an Independent Trustee serve as Chairman and that a key structural component for assuring that they are in a position to do so is for the Independent Trustees to constitute a substantial majority for the Board. The Independent Trustees also regularly meet in executive session. Ned C. Lautenbach serves as Chairman of the Independent Trustees and as such (i) acts as a liaison between the Independent Trustees and management with respect to matters important to the Independent Trustees and (ii) with management prepares agendas for Board meetings.
Fidelity funds are overseen by different Boards of Trustees. The fund's Board oversees Fidelity's equity and high income funds and another Board oversees Fidelity's investment-grade bond, money market, and asset allocation funds. The asset allocation funds may invest in Fidelity funds overseen by the fund's Board. The use of separate Boards, each with its own committee structure, allows the Trustees of each group of Fidelity funds to focus on the unique issues of the funds they oversee, including common research, investment, and operational issues. On occasion, the separate Boards establish joint committees to address issues of overlapping consequences for the Fidelity funds overseen by each Board.
The Trustees operate using a system of committees to facilitate the timely and efficient consideration of all matters of importance to the Trustees, the fund, and fund shareholders and to facilitate compliance with legal and regulatory requirements and oversight of the fund's activities and associated risks. The Board, acting through its committees, has charged FMR and its affiliates with (i) identifying events or circumstances the occurrence of which could have demonstrably adverse effects on the fund's business and/or reputation; (ii) implementing processes and controls to lessen the possibility that such events or circumstances occur or to mitigate the effects of such events or circumstances if they do occur; and (iii) creating and maintaining a system designed to evaluate continuously business and market conditions in order to facilitate the identification and implementation processes described in (i) and (ii) above. Because the day-to-day operations and activities of the fund are carried out by or through FMR, its affiliates and other service providers, the fund's exposure to risks is mitigated but not eliminated by the processes overseen by the Trustees. While each of the Board's committees has responsibility for overseeing different aspects of the fund's activities, oversight is exercised primarily through the Operations, Audit, and Compliance Committees. In addition, the Independent Trustees have worked with FMR to enhance the Board's oversight of investment and financial risks, legal and regulatory risks, technology risks, and operational risks, including the development of additional risk reporting to the Board. For example, a working group comprised of Independent Trustees and FMR has worked and continues to work to review the Fidelity funds' valuation-related activities, reporting and risk management. Appropriate personnel, including but not limited to the fund's Chief Compliance Officer (CCO), FMR's internal auditor, the independent accountants, the fund's Treasurer and portfolio management personnel, make periodic reports to the Board's committees, as appropriate, including an annual review of FMR's risk management program for the Fidelity funds. The responsibilities of each standing committee, including their oversight responsibilities, are described further under "Standing Committees of the Fund's Trustees."
Annual Report
Trustees and Officers - continued
The fund's Statement of Additional Information (SAI) includes more information about the Trustees. To request a free copy, call Fidelity at 1-800-544-8544.
Interested Trustees*:
Correspondence intended for each Trustee who is an interested person may be sent to Fidelity Investments, 82 Devonshire Street, Boston, Massachusetts 02109.
Name, Age; Principal Occupations and Other Relevant Experience+ |
James C. Curvey (77) |
| Year of Election or Appointment: 2007 Mr. Curvey is Trustee and Chairman of the Board of Trustees of certain Trusts. Mr. Curvey also serves as Trustee (2007-present) of other investment companies advised by FMR. Mr. Curvey is a Director of Fidelity Investments Money Management, Inc. (2009-present), Director of Fidelity Research & Analysis Co. (2009-present) and Director of FMR and FMR Co., Inc. (2007-present). Mr. Curvey is also Vice Chairman (2007-present) and Director of FMR LLC. In addition, Mr. Curvey serves as an Overseer for the Boston Symphony Orchestra and a member of the Trustees of Villanova University. Previously, Mr. Curvey was the Vice Chairman (2006-2007) and Director (2000-2007) of FMR Corp. |
Ronald P. O'Hanley (55) |
| Year of Election or Appointment: 2011 Mr. O'Hanley is Director of FMR Co., Inc. (2010-present), Director of Fidelity Investments Money Management, Inc. (2010-present), Director of Fidelity Research & Analysis Company (2010-present), President of Fidelity Asset Management and Corporate Services and a member of Fidelity's Executive Committee (2010-present). Previously, Mr. O'Hanley served as President and Chief Executive Officer of BNY Mellon Asset Management (2007-2010). Mr. O'Hanley also served as Vice Chairman of Bank New York Mellon Corp. and a member of that firm's Executive Committee. Prior to the 2007 merger of The Bank of New York and Mellon Financial Corporation, he was Vice Chairman of Mellon Financial Corporation and President and Chief Executive Officer of Mellon Asset Management. He joined Mellon in February 1997. Mr. O'Hanley currently serves as Chairman of the Boston Public Library Foundation Board of Directors and sits on the Board of Directors of Beth Israel Deaconess Medical Center, the Board of Trustees of the Marine Biological Laboratory and the Advisory Board of the Maxwell School of Citizenship and Public Administration at Syracuse University. Mr. O'Hanley also chairs the Council on Asset Management for the Financial Services Roundtable and is a member of the Board of Directors of Institutional Investor's U.S. Institute. |
* Trustees have been determined to be "Interested Trustees" by virtue of, among other things, their affiliation with the trust or various entities under common control with FMR.
+ The information above includes each Trustee's principal occupation during the last five years and other information relating to the experience, attributes, and skills relevant to each Trustee's qualifications to serve as a Trustee, which led to the conclusion that each Trustee should serve as a Trustee for the fund.
Annual Report
Trustees and Officers - continued
Independent Trustees:
Correspondence intended for each Independent Trustee (that is, the Trustees other than the Interested Trustees) may be sent to Fidelity Investments, P.O. Box 55235, Boston, Massachusetts 02205-5235.
Name, Age; Principal Occupations and Other Relevant Experience+ |
Dennis J. Dirks (64) |
| Year of Election or Appointment: 2005 Prior to his retirement in May 2003, Mr. Dirks was Chief Operating Officer and a member of the Board of The Depository Trust & Clearing Corporation (DTCC). He also served as President, Chief Operating Officer, and Board member of The Depository Trust Company (DTC) and President and Board member of the National Securities Clearing Corporation (NSCC). In addition, Mr. Dirks served as Chief Executive Officer and Board member of the Government Securities Clearing Corporation, Chief Executive Officer and Board member of the Mortgage-Backed Securities Clearing Corporation, as a Trustee and a member of the Finance Committee of Manhattan College (2005-2008), and as a Trustee and a member of the Finance Committee of AHRC of Nassau County (2006-2008). Mr. Dirks is a member of the Independent Directors Council (IDC) Governing Council (2010-present) and Board of Directors for The Brookville Center for Children's Services, Inc. (2009-present). |
Alan J. Lacy (59) |
| Year of Election or Appointment: 2008 Mr. Lacy serves as Senior Adviser (2007-present) of Oak Hill Capital Partners, L.P. (private equity). Mr. Lacy also served as Chief Executive Officer (2000-2005) and Vice Chairman (2005-2006) of Sears Holdings Corporation and Sears, Roebuck and Co. (retail). In addition, Mr. Lacy serves as a member of the Board of Directors of Dave & Buster's Entertainment, Inc. (restaurant and entertainment complexes, 2010-present), Earth Fare, Inc. (retail grocery, 2012-present), The Hillman Companies, Inc. (hardware wholesalers, 2010-present), and Bristol-Myers Squibb Company (global pharmaceuticals, 2008-present). Mr. Lacy is a member of the Board of Trustees of The National Parks Conservation Association (2006-present). Previously, Mr. Lacy served as Chairman of the Board of Trustees of the National Parks Conservation Association (2008-2011) and as a member of the Board of Directors for the Western Union Company (global money transfer, 2006-2011). |
Ned C. Lautenbach (68) |
| Year of Election or Appointment: 2000 Mr. Lautenbach is Chairman of the Independent Trustees of the Equity and High Income Funds (2006-present). Mr. Lautenbach currently serves as the Lead Director of the Eaton Corporation Board of Directors (diversified industrial, 1997-present). Mr. Lautenbach is Chairman of the Board of Directors of the Philharmonic Center for the Arts in Naples, Florida (2012-present) and a member of the Council on Foreign Relations (1994-present). Previously, Mr. Lautenbach was a Partner/Advisory Partner at Clayton, Dubilier & Rice, LLC (private equity investment, 1998-2010), as well as a Director of Sony Corporation (2006-2007). |
Joseph Mauriello (68) |
| Year of Election or Appointment: 2008 Prior to his retirement in January 2006, Mr. Mauriello served in numerous senior management positions including Deputy Chairman and Chief Operating Officer (2004-2005), and Vice Chairman of Financial Services (2002-2004) of KPMG LLP US (professional services, 1965-2005). Mr. Mauriello currently serves as a member of the Board of Directors of XL Group plc. (global insurance and re-insurance, 2006-present). Previously, Mr. Mauriello served as a Director of the Hamilton Funds of the Bank of New York (2006-2007) and of Arcadia Resources Inc. (health care services and products, 2007-2012). |
Robert W. Selander (62) |
| Year of Election or Appointment: 2011 Previously, Mr. Selander served as a Member of the Advisory Board of Fidelity's Equity and High Income Funds (2011), Executive Vice Chairman (2010), Chief Executive Officer (2009-2010), and President and Chief Executive Officer (1997-2009) of Mastercard, Inc. |
Cornelia M. Small (68) |
| Year of Election or Appointment: 2005 Ms. Small is a member of the Board of Directors (2009-present) and Chair of the Investment Committee (2010-present) of the Teagle Foundation. Ms. Small also serves on the Investment Committee of the Berkshire Taconic Community Foundation (2008-present). Previously, Ms. Small served as Chairperson (2002-2008) and a member of the Investment Committee and Chairperson (2008-2012) and a member of the Board of Trustees of Smith College. In addition, Ms. Small served as Chief Investment Officer, Director of Global Equity Investments, and a member of the Board of Directors of Scudder, Stevens & Clark and Scudder Kemper Investments. |
William S. Stavropoulos (73) |
| Year of Election or Appointment: 2001 Mr. Stavropoulos is Vice Chairman of the Independent Trustees of the Equity and High Income Funds (2006-present). Mr. Stavropoulos serves as President and Founder of the Michigan Baseball Foundation, the Great Lakes Loons (2007-present). Mr. Stavropoulos is Chairman Emeritus of the Board of Directors of The Dow Chemical Company, where he previously served in numerous senior management positions, including President, CEO (1995-2000; 2002-2004), Chairman of the Executive Committee (2000-2006), and as a member of the Board of Directors (1990-2006). Currently, Mr. Stavropoulos is a Director of Univar Inc. (global distributor of commodity and specialty chemicals, Chairman from 2010-May 2012 and Lead Director from May 2012-present), Teradata Corporation (data warehousing and technology solutions, 2008-present), Maersk Inc. (industrial conglomerate), and Tyco International, Ltd. (multinational manufacturing and services, 2007-present), and a member of the Advisory Board for Metalmark Capital LLC (private equity investment, 2005-present). Mr. Stavropoulos is an operating advisor to Clayton, Dubilier & Rice, LLC (private equity investment). In addition, Mr. Stavropoulos is a member of the University of Notre Dame Advisory Council for the College of Science, a Trustee of the Rollin L. Gerstacker Foundation, and a Director of the Naples Philharmonic Center for the Arts. Previously, Mr. Stavropoulos served as a Director of Chemical Financial Corporation (bank holding company, 1993-2012). |
David M. Thomas (63) |
| Year of Election or Appointment: 2008 Previously, Mr. Thomas served as Executive Chairman (2005-2006) and Chairman and Chief Executive Officer (2000-2005) of IMS Health, Inc. (pharmaceutical and healthcare information solutions), and a Director of Fortune Brands, Inc. (consumer products, 2000-2011). In addition, Mr. Thomas serves as Non-Executive Chairman of the Board of Directors of Fortune Brands Home and Security (home and security products, 2011-present), and as a member of the Board of Directors of Interpublic Group of Companies, Inc. (marketing communication, 2004-present). |
Michael E. Wiley (62) |
| Year of Election or Appointment: 2008 Mr. Wiley also serves as a Director of Asia Pacific Exploration Consolidated (international oil and gas exploration and production, 2008-present). Mr. Wiley serves as a Director of Tesoro Corporation (independent oil refiner and marketer, 2005-present), and a Director of Bill Barrett Corporation (exploration and production, 2005-present). In addition, Mr. Wiley also serves as a Director of Post Oak Bank (privately-held bank, 2004-present). Previously, Mr. Wiley served as a member of the Board of Trustees of the University of Tulsa (2000-2006; 2007-2010), as a Senior Energy Advisor of Katzenbach Partners, LLC (consulting, 2006-2007), as an Advisory Director of Riverstone Holdings (private investment), Chairman, President, and CEO of Baker Hughes, Inc. (oilfield services, 2000-2004), and as Director of Spinnaker Exploration Company (exploration and production, 2001-2005). |
+ The information above includes each Trustee's principal occupation during the last five years and other information relating to the experience, attributes, and skills relevant to each Trustee's qualifications to serve as a Trustee, which led to the conclusion that each Trustee should serve as a Trustee for the fund.
Advisory Board Members and Executive Officers:
Correspondence intended for David A. Rosow and Garnett A. Smith may be sent to Fidelity Investments, P.O. Box 55235, Boston, Massachusetts 02205-5235. Correspondence intended for each executive officer, Edward C. Johnson 3d, and Peter S. Lynch may be sent to Fidelity Investments, 82 Devonshire Street, Boston, Massachusetts 02109.
Name, Age; Principal Occupation |
Edward C. Johnson 3d (82) |
| Year of Election or Appointment: 2011 Member of the Advisory Board of Fidelity's Equity and High Income Funds. Mr. Johnson serves as Chief Executive Officer, Chairman, and a Director of FMR LLC, and also serves as Chairman and Director of FIL Limited. Previously, Mr. Johnson served as a Trustee and Chairman of the Board of certain Fidelity Trusts, Chairman and a Director of FMR, Chairman and a Director of FMR Co., Inc., and President of FMR LLC (2006-2007). |
Peter S. Lynch (68) |
| Year of Election or Appointment: 2003 Member of the Advisory Board of Fidelity's Equity and High Income Funds. Mr. Lynch is Vice Chairman and a Director of FMR and FMR Co., Inc. In addition, Mr. Lynch serves as a Trustee of Boston College and as the Chairman of the Inner-City Scholarship Fund. Previously, Mr. Lynch served on the Special Olympics International Board of Directors (1997-2006). |
David A. Rosow (70) |
| Year of Election or Appointment: 2012 Member of the Advisory Board of Fidelity's Equity and High Income Funds. Chairman and Chief Executive Officer of International Golf Group, Inc. (golf course development, 1989-present). Previously, Mr. Rosow served as Chairman and Chief Executive Officer of Rosow & Company, Inc. (private investment company, 1989-2011), a Lead Director of Hudson United Bancorp (2001-2006) and as a Director of TD Banknorth (1996-2006). In addition, Mr. Rosow is a member (2008-present) and President (2009-present) of the Town Council of Palm Beach, Florida. |
Garnett A. Smith (65) |
| Year of Election or Appointment: 2012 Member of the Advisory Board of Fidelity's Equity and High Income Funds. Prior to Mr. Smith's retirement, he served as Chairman and Chief Executive Officer of Inbrand Corp. (manufacturer of personal absorbent products, 1990-1997). He also served as President (1986-1990) of Inbrand Corp. Prior to his employment with Inbrand Corp., he was employed by a retail fabric chain and North Carolina National Bank. In addition, Mr. Smith is a board member of the Jackson Hole Land Trust (2009-present). |
Kenneth B. Robins (43) |
| Year of Election or Appointment: 2008 President and Treasurer of Fidelity's Equity and High Income Funds. Mr. Robins also serves as President and Treasurer (2010-present) and Assistant Treasurer (2009-present) of other Fidelity funds and is an employee of Fidelity Investments (2004-present). Previously, Mr. Robins served as Deputy Treasurer of the Fidelity funds (2005-2008) and Treasurer and Chief Financial Officer of The North Carolina Capital Management Trust: Cash and Term Portfolios (2006-2008). |
Bruce T. Herring (47) |
| Year of Election or Appointment: 2006 Vice President of certain Equity Funds. Mr. Herring also serves as President of Fidelity Research & Analysis Company (2010-present), Chief Investment Officer and Director of Fidelity Management & Research (U.K.) Inc. (2010-present) and Group Chief Investment Officer of FMR. Previously, Mr. Herring served as Vice President (2005-2006) and Senior Vice President (2006-2007) of Fidelity Management & Research Company, Vice President of FMR Co., Inc. (2001-2007) and as a portfolio manager for Fidelity U.S. Equity Funds. |
Brian B. Hogan (48) |
| Year of Election or Appointment: 2009 Vice President of Equity and High Income Funds. Mr. Hogan also serves as President of FMR's Equity Division (2009-present). Previously, Mr. Hogan served as Senior Vice President, Equity Research of FMR (2006-2009) and as a portfolio manager. |
Scott C. Goebel (44) |
| Year of Election or Appointment: 2008 Secretary and Chief Legal Officer (CLO) of the Fidelity funds. Mr. Goebel also serves as Secretary of Fidelity Investments Money Management, Inc. (FIMM) (2010-present) and Fidelity Research and Analysis Company (FRAC) (2010-present); Secretary and CLO of The North Carolina Capital Management Trust: Cash and Term Portfolios (2008-present); General Counsel, Secretary, and Senior Vice President of FMR (2008-present) and FMR Co., Inc. (2008-present); employed by FMR LLC or an affiliate (2001-present); Chief Legal Officer of Fidelity Management & Research (Hong Kong) Limited (2008-present) and Assistant Secretary of Fidelity Management & Research (Japan) Inc. (2008-present), and Fidelity Management & Research (U.K.) Inc. (2008-present). Previously, Mr. Goebel served as Assistant Secretary of FIMM (2008-2010), FRAC (2008-2010), and the Funds (2007-2008) and as Vice President and Secretary of Fidelity Distributors Corporation (FDC) (2005-2007). |
William C. Coffey (43) |
| Year of Election or Appointment: 2009 Assistant Secretary of Fidelity's Equity and High Income Funds. Mr. Coffey also serves as Senior Vice President and Deputy General Counsel of FMR LLC (2010-present), and is an employee of Fidelity Investments. Previously, Mr. Coffey served as Vice President and Associate General Counsel of FMR LLC (2005-2009). |
Elizabeth Paige Baumann (44) |
| Year of Election or Appointment: 2012 Anti-Money Laundering (AML) Officer of the Fidelity funds. Ms. Baumann also serves as AML Officer of The North Carolina Capital Management Trust: Cash and Term Portfolios (2012-present), Chief AML Officer of FMR LLC (2012-present), and is an employee of Fidelity Investments. Previously, Ms. Baumann served as Vice President and Deputy Anti-Money Laundering Officer (2007-2012). |
Christine Reynolds (54) |
| Year of Election or Appointment: 2008 Chief Financial Officer of the Fidelity funds. Ms. Reynolds became President of Fidelity Pricing and Cash Management Services (FPCMS) in August 2008. Ms. Reynolds served as Chief Operating Officer of FPCMS (2007-2008). Previously, Ms. Reynolds served as President, Treasurer, and Anti-Money Laundering officer of the Fidelity funds (2004-2007). |
Joseph A. Hanlon (44) |
| Year of Election or Appointment: 2012 Chief Compliance Officer of Fidelity's Equity and High Income Funds. Mr. Hanlon serves as Compliance Officer of FMR, FMR Co., Inc., Fidelity Investments Money Management, Inc. (FIMM), Fidelity Research and Analysis Company (FRAC), Fidelity Management & Research (Japan) Inc., Fidelity Management & Research (U.K.) Inc., Fidelity Management & Research (Hong Kong), and Strategic Advisers, Inc. (2009-present), as Senior Vice President of the Fidelity Asset Management Division (2009-present), and is an employee of Fidelity Investments. |
Joseph F. Zambello (55) |
| Year of Election or Appointment: 2011 Deputy Treasurer of the Fidelity funds. Mr. Zambello is an employee of Fidelity Investments. Previously, Mr. Zambello served as Vice President of FMR's Program Management Group (2009-2011) and Vice President of the Transfer Agent Oversight Group (2005-2009). |
Adrien E. Deberghes (45) |
| Year of Election or Appointment: 2008 Deputy Treasurer of Fidelity's Equity and High Income Funds. Mr. Deberghes also serves as Vice President (2011-present) and Assistant Treasurer (2010-present) of other Fidelity funds, and is an employee of Fidelity Investments (2008-present). Previously, Mr. Deberghes served as Senior Vice President of Mutual Fund Administration at State Street Corporation (2007-2008), Senior Director of Mutual Fund Administration at Investors Bank & Trust (2005-2007), and Director of Finance for Dunkin' Brands (2000-2005). |
Stephen Sadoski (41) |
| Year of Election or Appointment: 2012 Deputy Treasurer of Fidelity's Equity and High Income Funds. Mr. Sadoski also serves as Assistant Treasurer of other Fidelity funds (2012-present) and is an employee of Fidelity Investments (2012-present). Previously, Mr. Sadoski served as an assistant chief accountant in the Division of Investment Management of the Securities and Exchange Commission (SEC) (2009-2012) and as a senior manager at Deloitte & Touche (1997-2009). |
Stephanie J. Dorsey (43) |
| Year of Election or Appointment: 2010 Assistant Treasurer of Fidelity's Equity and High Income Funds. Ms. Dorsey also serves as Deputy Treasurer of other Fidelity funds (2008-present) and is an employee of Fidelity Investments (2008-present). Previously, Ms. Dorsey served as Treasurer (2004-2008) of the JPMorgan Mutual Funds and Vice President (2004-2008) of JPMorgan Chase Bank. |
John R. Hebble (54) |
| Year of Election or Appointment: 2009 Assistant Treasurer of Fidelity's Equity and High Income Funds. Mr. Hebble also serves as President (2011-present), Treasurer, and Chief Financial Officer of The North Carolina Capital Management Trust: Cash and Term Portfolios (2008-present), President and Treasurer of other Fidelity funds (2008-present) and is an employee of Fidelity Investments. |
Gary W. Ryan (54) |
| Year of Election or Appointment: 2005 Assistant Treasurer of the Fidelity funds. Mr. Ryan is an employee of Fidelity Investments. Previously, Mr. Ryan served as Vice President of Fund Reporting in Fidelity Pricing and Cash Management Services (FPCMS) (1999-2005). |
Jonathan Davis (44) |
| Year of Election or Appointment: 2010 Assistant Treasurer of the Fidelity funds. Mr. Davis is also Assistant Treasurer of Fidelity Rutland Square Trust II and Fidelity Commonwealth Trust II. Mr. Davis is an employee of Fidelity Investments. Previously, Mr. Davis served as Vice President and Associate General Counsel of FMR LLC (2003-2010). |
Annual Report
Distributions
The Board of Trustees of Fidelity International Small Cap Fund voted to pay to shareholders of record at the opening of business on record date, the following distributions per share derived from capital gains realized from sales of portfolio securities, and dividends derived from net investment income:
| Pay Date | Record Date | Dividends | Capital Gains |
International Small Cap Fund | 12/10/12 | 12/07/12 | $0.136 | $0.327 |
International Small Cap Fund designates 1% of the dividend distributed during the fiscal year as qualifying for the dividends-received deduction for corporate shareholders.
International Small Cap Fund designates 67% of the dividend distributed during the fiscal year as amounts which may be taken into account as a dividend for purposes of the maximum rate under section 1(h)(11) of the Internal Revenue Code.
The amounts per share which represent income derived from sources within, and taxes paid to, foreign countries or possessions of the United States are as follows:
| Pay Date | Income | Taxes |
International Small Cap Fund | 12/05/2011 | $0.246 | $0.0215 |
The fund will notify shareholders in January 2013 of amounts for use in preparing 2012 income tax returns.
Annual Report
Board Approval of Investment Advisory Contracts and Management Fees
Fidelity International Small Cap Fund
Each year, the Board of Trustees, including the Independent Trustees (together, the Board), votes on the renewal of the management contract and sub-advisory agreements (together, the Advisory Contracts) for the fund. The Board, assisted by the advice of fund counsel and Independent Trustees' counsel, requests and considers a broad range of information relevant to the renewal of the Advisory Contracts throughout the year.
The Board meets regularly and, at each of its meetings, considers factors that are relevant to its annual consideration of the renewal of the fund's Advisory Contracts, including the services and support provided to the fund and its shareholders. The Board has established various standing committees, each composed of and chaired by Independent Trustees with varying backgrounds, to which the Board has assigned specific subject matter responsibilities in order to enhance effective decision-making by the Board. The Board, acting directly and through its Committees, requests and receives information concerning the annual consideration of the renewal of the fund's Advisory Contracts. The Board also meets as needed to consider matters specifically related to the Board's annual consideration of the renewal of Advisory Contracts. Members of the Board may also meet with trustees of other Fidelity funds through ad hoc joint committees to discuss certain matters relevant to the Fidelity funds.
At its July 2012 meeting, the Board of Trustees, including the Independent Trustees, unanimously determined to renew the fund's Advisory Contracts. In reaching its determination, the Board considered all factors it believed relevant, including (i) the nature, extent, and quality of the services to be provided to the fund and its shareholders (including the investment performance of the fund); (ii) the competitiveness of the fund's management fee and total expense ratio relative to peer funds; (iii) the total costs of the services to be provided by and the profits to be realized by Fidelity from its relationship with the fund; (iv) the extent to which economies of scale exist and would be realized as the fund grows; and (v) whether fee levels reflect these economies of scale, if any, for the benefit of fund shareholders.
In considering whether to renew the Advisory Contracts for the fund, the Board reached a determination, with the assistance of fund counsel and Independent Trustees' counsel and through the exercise of its business judgment, that the renewal of the Advisory Contracts is in the best interests of the fund and its shareholders and that the compensation payable under the Advisory Contracts is fair and reasonable. The Board's decision to renew the Advisory Contracts was not based on any single factor, but rather was based on a comprehensive consideration of all the information provided to the Board at its meetings throughout the year. The Board, in reaching its determination to renew the Advisory Contracts, is aware that shareholders in the fund have a broad range of investment choices available to them, including a wide choice among mutual funds offered by Fidelity's competitors, and that the fund's shareholders, who have the opportunity to review and weigh the disclosure provided by the fund in its prospectus and other public disclosures, have chosen to invest in this fund, managed by Fidelity.
Annual Report
Board Approval of Investment Advisory Contracts and
Management Fees - continued
Nature, Extent, and Quality of Services Provided. The Board considered the staffing within the investment adviser, FMR, and the sub-advisers (together, the Investment Advisers), including the backgrounds of the fund's investment personnel, and also considered the fund's investment objective, strategies, and related investment philosophy. The Independent Trustees also had discussions with senior management of Fidelity's investment operations and investment groups. The Board considered the structure of the portfolio manager compensation program and whether this structure provides appropriate incentives to act in the best interests of the fund.
Resources Dedicated to Investment Management and Support Services. The Board and the Fund Oversight and Research Committees reviewed the general qualifications and capabilities of the Investment Advisers' investment staff, including its size, education, experience, and resources, as well as the Investment Advisers' approach to recruiting, training, managing, and compensating investment personnel. The Board also noted that FMR has continued to increase the resources devoted to non-U.S. offices, including expansion of Fidelity's global investment organization. The Board noted that Fidelity's analysts have extensive resources, tools and capabilities that allow them to conduct sophisticated quantitative and fundamental analysis, as well as credit analysis of issuers, counterparties and guarantors. The Board also believes that Fidelity's investment professionals have sufficient access to global information and data so as to provide competitive investment results over time, and that those professionals also have access to sophisticated tools that permit them to assess portfolio construction and risk and performance attribution characteristics continuously, as well as to transmit new information and research conclusions rapidly around the world. Additionally, in its deliberations, the Board considered the Investment Advisers' trading and risk management capabilities and resources, which are an integral part of the investment management process.
Shareholder and Administrative Services. The Board considered (i) the nature, extent, quality, and cost of advisory, administrative, and shareholder services performed by the Investment Advisers and their affiliates under the Advisory Contracts and under separate agreements covering transfer agency, pricing and bookkeeping, and securities lending services for the fund; (ii) the nature and extent of the supervision of third party service providers, principally custodians and subcustodians; and (iii) the resources devoted to, and the record of compliance with, the fund's compliance policies and procedures. The Board also reviewed the allocation of fund brokerage, including allocations to brokers affiliated with the Investment Advisers, the use of brokerage commissions to pay fund expenses, and the use of "soft" commission dollars to pay for research services.
Annual Report
The Board noted that the growth of fund assets over time across the complex allows Fidelity to reinvest in the development of services designed to enhance the value or convenience of the Fidelity funds as investment vehicles. These services include 24-hour access to account information and market information through telephone representatives and over the Internet, investor education materials and asset allocation tools, and the expanded availability of Fidelity Investor Centers.
Investment in a Large Fund Family. The Board considered the benefits to shareholders of investing in a Fidelity fund, including the benefits of investing in a fund that is part of a large family of funds offering a variety of investment disciplines and providing a large variety of mutual fund investor services. The Board noted that Fidelity had taken, or had made recommendations that resulted in the Fidelity funds taking, a number of actions over the previous year that benefited particular funds, including (i) continuing to dedicate additional resources to investment research and support of the senior management team that oversees asset management; (ii) persisting in efforts to enhance Fidelity's research capabilities, in particular, international research; (iii) launching new funds and making other enhancements to meet client needs for global and income-oriented solutions; (iv) continuing to launch dedicated lower cost underlying funds to meet investment management's portfolio construction needs related to expanding underlying fund options, specifically for the Freedom Fund product lines; (v) adopting a "Stock Selector" sector neutral investment approach and employing a team of portfolio managers who are sector specialists to manage certain funds; (vi) rationalizing product lines and gaining increased efficiencies through the mergers of several funds into other funds; (vii) strengthening the Spartan Index Fund product line by adding new funds and/or new low-cost institutional share classes, restructuring fund expenses to accommodate new classes, and reducing investment minimums for certain classes of shares; (viii) modifying the eligibility criteria for Institutional Class shares to increase their appeal to government entities and charitable investors; and (ix) reducing certain transfer agent fee rates.
Investment Performance. The Board considered whether the fund has operated in accordance with its investment objective, as well as its record of compliance with its investment restrictions. It also reviewed the fund's absolute investment performance for each class, as well as the fund's relative investment performance for each class measured over multiple periods against (i) a broad-based securities market index, and (ii) a peer group of mutual funds deemed appropriate by Fidelity and reviewed by the Board. The following charts considered by the Board show, over the one-, three-, and five-year periods ended December 31, 2011, the cumulative total returns of Institutional Class (Class I) and Class B of the fund, the cumulative total returns of a broad-based securities market index ("benchmark"), and a range of cumulative total returns of a peer group of mutual funds identified by Lipper Inc. as having an investment objective similar to that of the fund. The returns of Institutional Class (Class I) and Class B show the performance of the highest and lowest performing classes, respectively (based on five-year performance). The box within each chart shows the 25th percentile return (top of box) and the 75th percentile return (bottom of box) of the peer group. Returns shown above the box are in the first quartile and returns shown below the box are in the fourth quartile. The percentage beaten numbers noted below each chart correspond to the percentile box and represent the percentage of funds in the peer group whose performance was equal to or lower than that of the class indicated.
Annual Report
Board Approval of Investment Advisory Contracts and
Management Fees - continued
Fidelity International Small Cap Fund

The Board reviewed the fund's relative investment performance against its peer group and noted that the performance of Institutional Class (Class I) of the fund was in the second quartile for all the periods shown. The Board also noted that the investment performance of Institutional Class (Class I) of the fund compared favorably to its benchmark for all the periods shown. The Board considered that the variations in performance among the fund's classes reflect the variations in class expenses, which result in lower performance for higher expense classes. The Board noted that there was a portfolio management change for the fund in November 2011. The Board also reviewed the fund's performance since inception as well as performance in the current year.
The Board also considered that the fund's management fee is subject to upward or downward adjustment depending upon whether, and to what extent, the fund's investment performance for the performance period exceeds, or is exceeded by, the record (over the same period) of a Board-approved performance adjustment index. The Board noted that the performance adjustment provides FMR with a strong economic incentive to seek to achieve superior performance for the fund's shareholders and helps to more closely align the interests of FMR and the fund's shareholders.
Annual Report
Based on its review, the Board concluded that the nature, extent, and quality of services provided to the fund under the Advisory Contracts should benefit the fund's shareholders.
Competitiveness of Management Fee and Total Expense Ratio. The Board considered the fund's management fee and total expense ratio compared to "mapped groups" of competitive funds and classes. Fidelity creates "mapped groups" by combining similar Lipper investment objective categories that have comparable management fee characteristics. Combining Lipper investment objective categories aids the Board's management fee and total expense ratio comparisons by broadening the competitive group used for comparison and by reducing the number of universes to which various Fidelity funds are compared.
Management Fee. The Board considered two proprietary management fee comparisons for the 12-month periods shown in the chart below. The group of Lipper funds used by the Board for management fee comparisons is referred to below as the "Total Mapped Group." The Total Mapped Group is broader than the Lipper peer group used by the Board for performance comparisons because the Total Mapped Group combines several Lipper investment objective categories while the Lipper peer group does not. The Total Mapped Group comparison focuses on a fund's standing relative to the total universe of comparable funds available to investors in terms of gross management fees before expense reimbursements or caps, and without giving effect to the fund's performance adjustment. "TMG %" represents the percentage of funds in the Total Mapped Group that had management fees that were lower than the fund's. For example, a TMG % of 19% means that 81% of the funds in the Total Mapped Group had higher management fees than the fund. The "Asset-Size Peer Group" (ASPG) comparison focuses on a fund's standing relative to non-Fidelity funds similar in size to the fund within the Total Mapped Group. The ASPG represents at least 15% of the funds in the Total Mapped Group with comparable asset size and management fee characteristics, subject to a minimum of 50 funds (or all funds in the Total Mapped Group if fewer than 50). Additional information, such as the ASPG quartile in which the fund's management fee ranked and the impact of the fund's performance adjustment, is also included in the chart and considered by the Board.
Annual Report
Board Approval of Investment Advisory Contracts and
Management Fees - continued
Fidelity International Small Cap Fund

The Board noted that the fund's management fee ranked below the median of its Total Mapped Group and below the median of its ASPG for 2011. The Board also noted the effect of the fund's positive performance adjustment on the fund's management fee ranking. The Board noted that the performance adjustment for each year represents calculations for performance periods that differ from the periods shown in the performance charts above.
Based on its review, the Board concluded that the fund's management fee is fair and reasonable in light of the services that the fund receives and the other factors considered.
Total Expense Ratio. In its review of each class's total expense ratio, the Board considered the fund's management fee as well as other fund or class expenses, as applicable, such as transfer agent fees, pricing and bookkeeping fees, fund-paid 12b-1 fees, and custodial, legal, and audit fees. The Board also noted the effects of any waivers and reimbursements on fees and expenses, as well as the impact of the fund's performance adjustment. As part of its review, the Board also considered the current and historical total expense ratios of each class of the fund compared to competitive fund median expenses. Each class of the fund is compared to those funds and classes in the Total Mapped Group (used by the Board for management fee comparisons) that have a similar sales load structure.
The Board noted that the total expense ratio of each of Class A, Class B, Class C, Institutional Class, and the retail class ranked below its competitive median for 2011 and the total expense ratio of Class T ranked above its competitive median for 2011. The Board considered that various factors, including 12b-1 fees, positive or negative performance adjustments, and relatively higher other expenses in the case of small fund size, can affect total expense ratios. The Board noted that the total expense ratio of Class T was above the competitive median primarily because of higher 12b-1 fees on Class T. Class T has a higher 12b-1 fee, but a lower front-end sales charge, than traditionally priced front-end sales charge classes. The Board considered that Class T is primarily sold load-waived in the retirement plan market where its 0.50% 12b-1 fee is comparable to competing no-load, higher 12b-1 fee classes designed specifically for retirement plans. The Board noted that the fund offers multiple classes, each of which has a different sales load and 12b-1 fee structure, and that the multiple structures are intended to offer a range of pricing options for the intermediary market. The Board also noted that the total expense ratios of the classes vary primarily by the level of their 12b-1 fees, although differences in transfer agent fees may also cause expenses to vary from class to class.
Annual Report
Fees Charged to Other Fidelity Clients. The Board also considered Fidelity fee structures and other information with respect to clients of FMR and its affiliates, such as other mutual funds advised or subadvised by FMR or its affiliates, pension plan clients, and other institutional clients. The Board noted the findings of the 2010 ad hoc joint committee (created with the board of other Fidelity funds), which reviewed and compared Fidelity's institutional investment advisory business with its business of providing services to the Fidelity funds, including the differences in services provided, fees charged, and costs incurred, as well as competition in their respective marketplaces.
Based on its review of total expense ratios and fees charged to other Fidelity clients, the Board concluded that the total expense ratio of each class of the fund was reasonable, although Class T was above the median of the universe presented for comparison, in light of the services that the fund and its shareholders receive and the other factors considered.
Costs of the Services and Profitability. The Board considered the revenues earned and the expenses incurred by Fidelity in conducting the business of developing, marketing, distributing, managing, administering and servicing the fund and its shareholders. The Board also considered the level of Fidelity's profits in respect of all the Fidelity funds.
On an annual basis, FMR presents to the Board Fidelity's profitability for the fund. Fidelity calculates the profitability for each fund, as well as aggregate profitability for groups of Fidelity funds and all Fidelity funds, using a series of detailed revenue and cost allocation methodologies which originate with the books and records of Fidelity on which Fidelity's audited financial statements are based. The Audit Committee of the Board reviews any significant changes from the prior year's methodologies.
PricewaterhouseCoopers LLP (PwC), independent registered public accounting firm and auditor to Fidelity and certain Fidelity funds, has been engaged annually by the Board as part of the Board's assessment of Fidelity's profitability analysis. PwC's engagement includes the review and assessment of Fidelity's methodologies used in determining the revenues and expenses attributable to Fidelity's mutual fund business, and completion of agreed-upon procedures surrounding the mathematical accuracy of fund profitability and its conformity to allocation methodologies. After considering PwC's reports issued under the engagement and information provided by Fidelity, the Board concluded that while other allocation methods may also be reasonable, Fidelity's profitability methodologies are reasonable in all material respects.
Annual Report
Board Approval of Investment Advisory Contracts and
Management Fees - continued
The Board also reviewed Fidelity's non-fund businesses and fall-out benefits related to the mutual fund business as well as cases where Fidelity's affiliates may benefit from or be related to the fund's business.
The Board considered the costs of the services provided by and the profits realized by Fidelity in connection with the operation of the fund and was satisfied that the profitability was not excessive in the circumstances.
Economies of Scale. The Board considered whether there have been economies of scale in respect of the management of the Fidelity funds, whether the Fidelity funds (including the fund) have appropriately benefited from any such economies of scale, and whether there is potential for realization of any further economies of scale. The Board considered the extent to which the fund will benefit from economies of scale through increased services to the fund, through waivers or reimbursements, or through fee or expense reductions. The Board also noted that in 2009, it and the board of other Fidelity funds created an ad hoc committee (the Economies of Scale Committee) to analyze whether FMR attains economies of scale in respect of the management and servicing of the Fidelity funds, whether the Fidelity funds have appropriately benefited from such economies of scale, and whether there is potential for realization of any further economies of scale.
The Board recognized that the fund's management contract incorporates a "group fee" structure, which provides for lower group fee rates as total fund assets under FMR's management increase, and for higher group fee rates as total fund assets under FMR's management decrease. FMR calculates the group fee rates based on a tiered asset "breakpoint" schedule that varies based on asset class. The Board considered that the group fee is designed to deliver the benefits of economies of scale to fund shareholders when total Fidelity fund assets increase, even if assets of any particular fund are unchanged or have declined, because some portion of Fidelity's costs are attributable to services provided to all Fidelity funds, and all funds benefit if those costs can be allocated among more assets. The Board concluded that, given the group fee structure, fund shareholders will benefit from lower management fees as assets under FMR's management increase at the fund complex level, regardless of whether Fidelity achieves any such economies of scale.
Annual Report
The Board concluded, taking into account the analysis of the Economies of Scale Committee, that economies of scale, if any, are being appropriately shared between fund shareholders and Fidelity.
Additional Information Requested by the Board. In order to develop fully the factual basis for consideration of the Fidelity funds' Advisory Contracts, the Board requested and received additional information on certain topics, including (i) fund performance trends, actions to be taken by FMR to improve certain funds' overall performance, and Fidelity's long-term strategies for certain funds; (ii) the potential to further rationalize the Fidelity fund lineup with the possibility of achieving savings for the funds and Fidelity; (iii) Fidelity's compensation structure for portfolio managers and other key investment personnel; (iv) the amount of the investment that each portfolio manager has made in the Fidelity fund(s) that he or she manages; (v) the realization of fall-out benefits in certain Fidelity business units; (vi) Fidelity's group fee structures, the potential impact of regulatory changes on such structures, and the rationale for the individual fee rates of certain funds; (vii) fund profitability methodology, including Fidelity's cost allocation methodology, and the impact of certain factors on fund profitability results; (viii) trends regarding industry use of performance fee structures and the possibility of implementing performance fee structures for additional funds; and (ix) the impact of net redemptions from the Fidelity funds.
Based on its evaluation of all of the conclusions noted above, and after considering all factors it believed relevant, the Board ultimately concluded that the advisory fee structures are fair and reasonable, and that the fund's Advisory Contracts should be renewed.
Annual Report
Investment Adviser
Fidelity Management & Research Company
Boston, MA
Investment Sub-Advisers
FMR Co., Inc.
Fidelity Management & Research
(U.K.) Inc.
FIL Investment Advisors
FIL Investments (Japan) Limited
FIL Investment Advisors (UK) Ltd.
Fidelity Management & Research
(Hong Kong) Limited
Fidelity Management & Research
(Japan) Inc.
General Distributor
Fidelity Distributors Corporation
Smithfield, RI
Transfer and Service Agents
Fidelity Investments Institutional
Operations Company, Inc.
Boston, MA
Fidelity Service Company, Inc.
Boston, MA
Custodian
The Bank of New York Mellon
New York, NY
The Fidelity Telephone Connection
Mutual Fund 24-Hour Service
Exchanges/Redemptions
and Account Assistance 1-800-544-6666
Product Information 1-800-544-8888
Retirement Accounts 1-800-544-4774
(8 a.m. - 9 p.m.)
TDD Service 1-800-544-0118
for the deaf and hearing impaired
(9 a.m. - 9 p.m. Eastern time)
Fidelity Automated Service
Telephone (FAST®) (automated graphic)
1-800-544-5555
(automated graphic)
Automated line for quickest service
(Fidelity Investment logo)(registered trademark)
Corporate Headquarters
82 Devonshire St., Boston, MA 02109
www.fidelity.com
ISC-UANN-1212
1.793584.109
(Fidelity Investment logo)(registered trademark)
Fidelity Advisor®
Total International Equity
Fund - Class A, Class T, Class B
and Class C
Annual Report
October 31, 2012
(Fidelity Cover Art)
Class A, Class T,
Class B, and Class C are
classes of Fidelity® Total
International Equity Fund
Contents
Performance | (Click Here) | How the fund has done over time. |
Management's Discussion of Fund Performance | (Click Here) | The Portfolio Manager's review of fund performance and strategy. |
Shareholder Expense Example | (Click Here) | An example of shareholder expenses. |
Investment Changes | (Click Here) | A summary of major shifts in the fund's investments over the past six months. |
Investments | (Click Here) | A complete list of the fund's investments with their market values. |
Financial Statements | (Click Here) | Statements of assets and liabilities, operations, and changes in net assets, as well as financial highlights. |
Notes | (Click Here) | Notes to the financial statements. |
Report of Independent Registered Public Accounting Firm | (Click Here) | |
Trustees and Officers | (Click Here) | |
Distributions | (Click Here) | |
Board Approval of Investment Advisory Contracts and Management Fees | (Click Here) | |
To view a fund's proxy voting guidelines and proxy voting record for the 12-month period ended June 30, visit http://www.fidelity.com/proxyvotingresults or visit the Securities and Exchange Commission's (SEC) web site at http://www.sec.gov. You may also call 1-877-208-0098 to request a free copy of the proxy voting guidelines.
Standard & Poor's, S&P and S&P 500 are registered service marks of The McGraw-Hill Companies, Inc. and have been licensed for use by Fidelity Distributors Corporation.
Other third party marks appearing herein are the property of their respective owners.
All other marks appearing herein are registered or unregistered trademarks or service marks of FMR LLC or an affiliated company. © 2012 FMR LLC. All rights reserved.
Annual Report
This report and the financial statements contained herein are submitted for the general information of the shareholders of the fund. This report is not authorized for distribution to prospective investors in the fund unless preceded or accompanied by an effective prospectus.
A fund files its complete schedule of portfolio holdings with the SEC for the first and third quarters of each fiscal year on Form N-Q. Forms N-Q are available on the SEC's web site at http://www.sec.gov. A fund's Forms N-Q may be reviewed and copied at the SEC's Public Reference Room in Washington, DC. Information regarding the operation of the SEC's Public Reference Room may be obtained by calling 1-800-SEC-0330. For a complete list of a fund's portfolio holdings, view the most recent holdings listing, semiannual report, or annual report on Fidelity's web site at http://www.fidelity.com, http://www.advisor.fidelity.com, or http://www.401k.com, as applicable.
NOT FDIC INSURED • MAY LOSE VALUE • NO BANK GUARANTEE
Neither the fund nor Fidelity Distributors Corporation is a bank.
Annual Report
Average annual total return reflects the change in the value of an investment, assuming reinvestment of the class' distributions from dividend income and capital gains (the profits earned upon the sale of securities that have grown in value, if any) and assuming a constant rate of performance each year. The $10,000 table and the fund's returns do not reflect the deduction of taxes that a shareholder would pay on fund distributions or the redemption of fund shares. During periods of reimbursement by Fidelity, a fund's total return will be greater than it would be had the reimbursement not occurred. How a fund did yesterday is no guarantee of how it will do tomorrow.
Average Annual Total Returns
Periods ended October 31, 2012 | Past 1
year | Life of
fund A |
Class A (incl. 5.75% sales charge) | 4.51% | -6.03% |
Class T (incl. 3.50% sales charge) | 6.65% | -5.82% |
Class B (incl. contingent deferred sales charge) B | 5.05% | -5.98% |
Class C (incl. contingent deferred sales charge) C | 8.98% | -5.64% |
A From November 1, 2007.
B Class B shares' contingent deferred sales charge included in the past one year and life of fund total return figures are 5% and 2%, respectively.
C Class C shares' contingent deferred sales charge included in the past one year and life of fund total return figures are 1% and 0%, respectively.
Annual Report
$10,000 Over Life of Fund
Let's say hypothetically that $10,000 was invested in Fidelity Advisor® Total International Equity Fund - Class A on November 1, 2007, when the fund started, and the current 5.75% sales charge was paid. The chart shows how the value of your investment would have changed, and also shows how the MSCI® ACWI® (All Country World Index) ex USA Index performed over the same period.
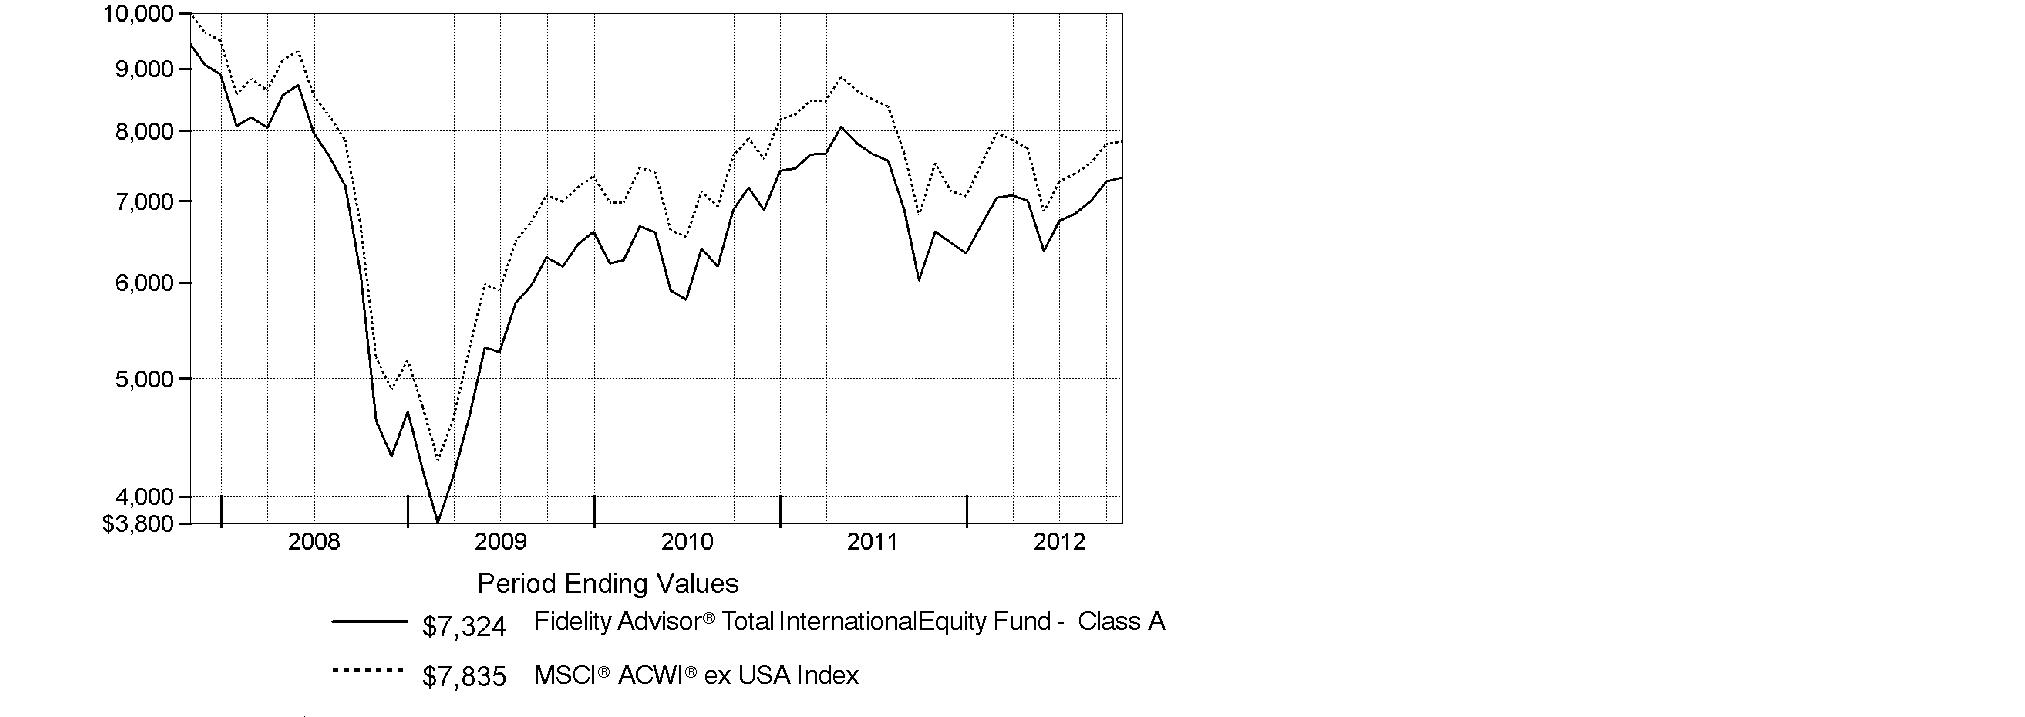
Annual Report
Market Recap: International stocks experienced pendulum-like swings during the 12 months ending October 31, 2012, finishing the period with a modest advance. The market faced periodic bouts of volatility this past year, as a number of macroeconomic concerns - including the eurozone debt crisis, the strength and pace of the U.S. economic recovery, and a slowdown in China's once-blistering growth - dominated headlines and weighed on investors. While a stronger U.S. dollar provided an additional head wind, foreign developed- and emerging-markets stocks still managed a gain for the 12 months, as the MSCI® ACWI® (All Country World Index) ex USA Index rose 4.11%, largely buttressed in the summertime by pledges of accommodative monetary action from eurozone officials, as well as signs that the U.S. housing market was on the mend. Within the index, Asia-Pacific ex Japan showed the most impressive gains, advancing roughly 11%. A number of core European components, most notably Germany (+11%), Switzerland (+10%) and the U.K. (+9%), benefited from optimism about the eurozone's ability to resolve its debt woes, which also helped the region outpace the index overall. Elsewhere, results from Canada (+3%) and the generally more volatile emerging markets (+2%) each fell short of the MSCI index, while Japan was among the few benchmark constituents to finish in the red, returning about -3%.
Comments from Alex Zavratsky, Co-Portfolio Manager of Fidelity Advisor® Total International Equity Fund: For the year, the fund's Class A, Class T, Class B and Class C shares gained 10.88%, 10.52%, 10.05% and 9.98%, respectively (excluding sales charges), significantly outpacing the MSCI index. The fund benefited from good security selection in emerging markets - especially Brazil, South Korea and Chile - and Japan. Good positioning in Europe overcame negative stock selection specifically in Germany. An out-of-benchmark allocation to U.S. stocks also added, notably credit card network Visa. Conversely, stock picking in Canada modestly hurt. In sector terms, security selection helped in industrials, as did positioning in materials and health care. The top individual contributor was Belgian brewer Anheuser-Busch InBev, while, in health care, Denmark's Novo Nordisk and Australian biotechnology company CSL added value. Not owning Telefonica, a poor-performing Spanish telecom provider and benchmark component, also helped. In contrast, untimely ownership of South Korean electronics maker Samsung Electronics hurt, as did not owning Diageo, a strong-performing U.K.-based spirits company and benchmark component. An overweighting in Repsol, a Spain-based integrated oil and gas company, also detracted. Samsung was not held at period end.
The views expressed above reflect those of the portfolio manager(s) only through the end of the period as stated on the cover of this report and do not necessarily represent the views of Fidelity or any other person in the Fidelity organization. Any such views are subject to change at any time based upon market or other conditions and Fidelity disclaims any responsibility to update such views. These views may not be relied on as investment advice and, because investment decisions for a Fidelity fund are based on numerous factors, may not be relied on as an indication of trading intent on behalf of any Fidelity fund.
Annual Report
Shareholder Expense Example
As a shareholder of the Fund, you incur two types of costs: (1) transaction costs, including sales charges (loads) on purchase payments or redemption proceeds, redemption fees and (2) ongoing costs, including management fees, distribution and/or service (12b-1) fees and other Fund expenses. This Example is intended to help you understand your ongoing costs (in dollars) of investing in the Fund and to compare these costs with the ongoing costs of investing in other mutual funds.
The Example is based on an investment of $1,000 invested at the beginning of the period and held for the entire period (May 1, 2012 to October 31, 2012).
Actual Expenses
The first line of the accompanying table for each class of the Fund provides information about actual account values and actual expenses. You may use the information in this line, together with the amount you invested, to estimate the expenses that you paid over the period. Simply divide your account value by $1,000.00 (for example, an $8,600 account value divided by $1,000.00 = 8.6), then multiply the result by the number in the first line for a class of the Fund under the heading entitled "Expenses Paid During Period" to estimate the expenses you paid on your account during this period. A small balance maintenance fee of $12.00 that is charged once a year may apply for certain accounts with a value of less than $2,000. This fee is not included in the table below. If it was, the estimate of expenses you paid during the period would be higher, and your ending account value lower, by this amount. In addition, the Fund, as a shareholder in the underlying Fidelity Central Funds, will indirectly bear its pro-rata share of the fees and expenses incurred by the underlying Fidelity Central Funds. These fees and expenses are not included in the Fund's annualized expense ratio used to calculate the expense estimate in the table below.
Hypothetical Example for Comparison Purposes
The second line of the accompanying table for each class of the Fund provides information about hypothetical account values and hypothetical expenses based on a Class' actual expense ratio and an assumed rate of return of 5% per year before expenses, which is not the Class' actual return. The hypothetical account values and expenses may not be used to estimate the actual ending account balance or expenses you paid for the period. You may use this information to compare the ongoing costs of investing in the Fund and other funds. To do so, compare this 5% hypothetical example with the 5% hypothetical examples that appear in the shareholder reports of the other funds. A small balance maintenance fee of $12.00 that is charged once a year may apply for certain accounts with a value of less than $2,000. This fee is not included in the table below. If it was, the estimate of expenses you paid during the period would be higher, and your ending account value lower, by this amount. In addition, the Fund, as a shareholder in the underlying Fidelity Central Funds, will indirectly bear its pro-rata share of the fees and expenses incurred by the underlying Fidelity Central Funds. These fees and expenses are not included in the Fund's annualized expense ratio used to calculate the expense estimate in the table below.
Please note that the expenses shown in the table are meant to highlight your ongoing costs only and do not reflect any transaction costs. Therefore, the second line of the table is useful in comparing ongoing costs only, and will not help you determine the relative total costs of owning different funds. In addition, if these transactional costs were included, your costs would have been higher.
Annual Report
| Annualized
Expense Ratio | Beginning
Account Value
May 1, 2012 | Ending
Account Value
October 31, 2012 | Expenses Paid
During Period*
May 1, 2012 to
October 31, 2012 |
Class A | 1.45% | | | |
Actual | | $ 1,000.00 | $ 1,045.80 | $ 7.46 |
HypotheticalA | | $ 1,000.00 | $ 1,017.85 | $ 7.35 |
Class T | 1.70% | | | |
Actual | | $ 1,000.00 | $ 1,043.90 | $ 8.73 |
HypotheticalA | | $ 1,000.00 | $ 1,016.59 | $ 8.62 |
Class B | 2.20% | | | |
Actual | | $ 1,000.00 | $ 1,042.70 | $ 11.30 |
HypotheticalA | | $ 1,000.00 | $ 1,014.08 | $ 11.14 |
Class C | 2.20% | | | |
Actual | | $ 1,000.00 | $ 1,041.30 | $ 11.29 |
HypotheticalA | | $ 1,000.00 | $ 1,014.08 | $ 11.14 |
Total International Equity | 1.14% | | | |
Actual | | $ 1,000.00 | $ 1,047.20 | $ 5.87 |
HypotheticalA | | $ 1,000.00 | $ 1,019.41 | $ 5.79 |
Institutional Class | 1.20% | | | |
Actual | | $ 1,000.00 | $ 1,047.30 | $ 6.18 |
HypotheticalA | | $ 1,000.00 | $ 1,019.10 | $ 6.09 |
A 5% return per year before expenses
* Expenses are equal to each Class' annualized expense ratio, multiplied by the average account value over the period, multiplied by 184/366 (to reflect the one-half year period).
Annual Report
Investment Changes (Unaudited)
Geographic Diversification (% of fund's net assets) |
As of October 31, 2012 |
 | United Kingdom 16.8% | |
 | Japan 10.8% | |
 | United States of America 7.2% | |
 | Switzerland 6.9% | |
 | Germany 5.1% | |
 | France 5.0% | |
 | Australia 4.8% | |
 | Taiwan 3.7% | |
 | Korea (South) 2.9% | |
| Other 36.8% | |

Percentages are based on country or territory of incorporation and are adjusted for the effect of futures contracts, if applicable. |
As of April 30, 2012 |
| United Kingdom 18.1% | |
| Japan 13.5% | |
| Switzerland 7.0% | |
| United States of America 6.4% | |
| Germany 5.7% | |
| Australia 4.4% | |
| France 4.3% | |
| Taiwan 3.0% | |
| India 2.6% | |
| Other 35.0% | |

Percentages are based on country or territory of incorporation and are adjusted for the effect of futures contracts, if applicable. |
Asset Allocation |
| % of fund's
net assets | % of fund's net assets
6 months ago |
Stocks | 98.4 | 98.8 |
Short-Term Investments and Net Other Assets (Liabilities) | 1.6 | 1.2 |
Top Ten Stocks as of October 31, 2012 |
| % of fund's
net assets | % of fund's net assets
6 months ago |
Nestle SA (Switzerland, Food Products) | 2.3 | 2.4 |
Roche Holding AG (participation certificate) (Switzerland, Pharmaceuticals) | 1.8 | 2.2 |
Royal Dutch Shell PLC Class A sponsored ADR (United Kingdom, Oil, Gas & Consumable Fuels) | 1.8 | 2.2 |
Sanofi SA (France, Pharmaceuticals) | 1.4 | 1.4 |
BHP Billiton PLC (United Kingdom, Metals & Mining) | 1.3 | 1.0 |
GlaxoSmithKline PLC sponsored ADR (United Kingdom, Pharmaceuticals) | 1.2 | 1.6 |
Vodafone Group PLC sponsored ADR (United Kingdom, Wireless Telecommunication Services) | 1.2 | 1.4 |
Anheuser-Busch InBev SA NV (Belgium, Beverages) | 1.2 | 1.0 |
HSBC Holdings PLC sponsored ADR (United Kingdom, Commercial Banks) | 1.0 | 0.9 |
Commonwealth Bank of Australia (Australia, Commercial Banks) | 1.0 | 1.0 |
| 14.2 | |
Market Sectors as of October 31, 2012 |
| % of fund's
net assets | % of fund's net assets
6 months ago |
Financials | 21.4 | 19.8 |
Consumer Staples | 14.4 | 14.7 |
Industrials | 12.2 | 11.7 |
Consumer Discretionary | 10.2 | 11.6 |
Health Care | 9.8 | 10.6 |
Materials | 8.7 | 7.4 |
Energy | 7.4 | 7.6 |
Information Technology | 6.3 | 6.0 |
Telecommunication Services | 4.1 | 5.4 |
Utilities | 3.9 | 4.0 |
Annual Report
Investments October 31, 2012
Showing Percentage of Net Assets
Common Stocks - 97.9% |
| Shares | | Value |
Australia - 4.8% |
Australia & New Zealand Banking Group Ltd. | 91,182 | | $ 2,408,879 |
Coca-Cola Amatil Ltd. | 58,234 | | 813,050 |
Commonwealth Bank of Australia | 47,936 | | 2,873,638 |
CSL Ltd. | 35,275 | | 1,739,318 |
Newcrest Mining Ltd. | 19,905 | | 546,107 |
Origin Energy Ltd. | 38,131 | | 449,650 |
Ramsay Health Care Ltd. | 2,082 | | 51,351 |
Sydney Airport unit | 284,317 | | 1,000,509 |
Telstra Corp. Ltd. | 234,394 | | 1,007,315 |
Transurban Group unit | 73,700 | | 465,146 |
Westfield Group unit | 112,623 | | 1,246,243 |
Woodside Petroleum Ltd. | 18,232 | | 651,045 |
Woolworths Ltd. | 14,358 | | 438,336 |
WorleyParsons Ltd. | 22,067 | | 565,107 |
TOTAL AUSTRALIA | | 14,255,694 |
Austria - 0.4% |
Andritz AG | 18,358 | | 1,105,741 |
Zumtobel AG | 5,000 | | 53,421 |
TOTAL AUSTRIA | | 1,159,162 |
Bailiwick of Jersey - 0.8% |
Atrium European Real Estate Ltd. | 134,051 | | 757,725 |
Informa PLC | 52,073 | | 336,299 |
Randgold Resources Ltd. sponsored ADR | 6,760 | | 808,428 |
Wolseley PLC | 13,367 | | 584,358 |
TOTAL BAILIWICK OF JERSEY | | 2,486,810 |
Belgium - 1.6% |
Anheuser-Busch InBev SA NV | 40,471 | | 3,384,637 |
Gimv NV | 1,703 | | 82,312 |
KBC Groupe SA | 9,918 | | 232,808 |
Umicore SA | 19,051 | | 977,718 |
TOTAL BELGIUM | | 4,677,475 |
Bermuda - 2.0% |
Cheung Kong Infrastructure Holdings Ltd. | 70,000 | | 410,062 |
First Pacific Co. Ltd. | 764,000 | | 850,745 |
GP Investments Ltd. (depositary receipt) (a) | 12,300 | | 28,403 |
Lazard Ltd. Class A | 8,770 | | 258,364 |
Li & Fung Ltd. | 234,000 | | 392,514 |
Pacific Basin Shipping Ltd. | 1,704,000 | | 912,459 |
Texwinca Holdings Ltd. | 860,000 | | 684,667 |
Common Stocks - continued |
| Shares | | Value |
Bermuda - continued |
Trinity Ltd. | 964,000 | | $ 675,418 |
Vtech Holdings Ltd. | 65,900 | | 782,717 |
Yue Yuen Industrial (Holdings) Ltd. | 222,000 | | 766,253 |
TOTAL BERMUDA | | 5,761,602 |
Brazil - 2.4% |
Arezzo Industria e Comercio SA | 15,600 | | 278,427 |
Banco Bradesco SA | 123,000 | | 1,618,764 |
Banco Pine SA | 7,106 | | 49,681 |
Duratex SA | 98,200 | | 683,177 |
Iguatemi Empresa de Shopping Centers SA | 20,600 | | 261,677 |
LPS Brasil Consultoria de Imoveis SA | 30,100 | | 517,215 |
Multiplan Empreendimentos Imobiliarios SA | 16,100 | | 471,653 |
Oi SA | 123,916 | | 585,704 |
Porto Seguro SA | 73,000 | | 776,347 |
Tractebel Energia SA | 51,300 | | 884,026 |
Weg SA | 63,000 | | 723,660 |
TOTAL BRAZIL | | 6,850,331 |
British Virgin Islands - 0.0% |
Gem Diamonds Ltd. (a) | 10,228 | | 27,853 |
Canada - 0.9% |
Agnico-Eagle Mines Ltd. (Canada) | 6,440 | | 363,606 |
Baytex Energy Corp. | 700 | | 31,855 |
Copper Mountain Mining Corp. (a) | 6,600 | | 26,697 |
Eldorado Gold Corp. | 3,800 | | 56,158 |
Fairfax Financial Holdings Ltd. (sub. vtg.) | 705 | | 261,536 |
First Quantum Minerals Ltd. | 10,585 | | 237,931 |
Goldcorp, Inc. | 12,994 | | 587,413 |
Open Text Corp. (a) | 5,150 | | 276,798 |
Painted Pony Petroleum Ltd. Class A (a) | 3,200 | | 34,603 |
Pason Systems, Inc. | 3,700 | | 60,274 |
Petrominerales Ltd. | 3,125 | | 25,063 |
Suncor Energy, Inc. | 17,300 | | 580,622 |
TAG Oil Ltd. (a) | 4,700 | | 32,941 |
TOTAL CANADA | | 2,575,497 |
Cayman Islands - 1.8% |
ASM Pacific Technology Ltd. | 53,400 | | 595,320 |
Baidu.com, Inc. sponsored ADR (a) | 3,500 | | 373,170 |
ENN Energy Holdings Ltd. | 122,000 | | 507,674 |
Common Stocks - continued |
| Shares | | Value |
Cayman Islands - continued |
Haitian International Holdings Ltd. | 512,000 | | $ 632,233 |
Kingboard Chemical Holdings Ltd. | 213,000 | | 633,499 |
Lee & Man Paper Manufacturing Ltd. | 1,489,000 | | 781,960 |
Sands China Ltd. | 290,600 | | 1,093,024 |
Vantage Drilling Co. (a) | 15,200 | | 27,968 |
Yingde Gases Group Co. Ltd. | 750,500 | | 711,760 |
TOTAL CAYMAN ISLANDS | | 5,356,608 |
Chile - 2.1% |
Cencosud SA | 120,432 | | 657,289 |
Compania Cervecerias Unidas SA sponsored ADR | 11,400 | | 808,602 |
Embotelladora Andina SA sponsored ADR | 18,600 | | 704,568 |
Inversiones Aguas Metropolitanas SA | 437,696 | | 814,170 |
Isapre CruzBlanca SA | 637,596 | | 834,580 |
Parque Arauco SA | 402,367 | | 919,051 |
Quinenco SA | 315,548 | | 898,474 |
Sociedad Matriz SAAM SA | 4,670,971 | | 546,071 |
TOTAL CHILE | | 6,182,805 |
China - 1.1% |
China BlueChemical Ltd. (H Shares) | 1,336,000 | | 846,415 |
China Oilfield Services Ltd. (H Shares) | 430,000 | | 815,608 |
China Shipping Development Co. Ltd. (H Shares) | 1,472,000 | | 773,032 |
Dongfeng Motor Group Co. Ltd. (H Shares) | 544,000 | | 673,854 |
TOTAL CHINA | | 3,108,909 |
Colombia - 0.3% |
BanColombia SA sponsored ADR | 11,500 | | 736,230 |
Curacao - 0.2% |
Schlumberger Ltd. | 8,600 | | 597,958 |
Denmark - 0.9% |
Novo Nordisk A/S Series B sponsored ADR | 15,200 | | 2,436,408 |
William Demant Holding A/S (a) | 4,110 | | 353,488 |
TOTAL DENMARK | | 2,789,896 |
Finland - 0.8% |
Nokian Tyres PLC | 29,202 | | 1,211,206 |
Outotec Oyj | 6,412 | | 312,241 |
Sampo OYJ (A Shares) | 27,199 | | 852,441 |
TOTAL FINLAND | | 2,375,888 |
Common Stocks - continued |
| Shares | | Value |
France - 5.0% |
Alstom SA | 22,162 | | $ 756,911 |
Arkema SA | 7,560 | | 689,254 |
Atos Origin SA | 10,510 | | 705,784 |
BNP Paribas SA | 42,351 | | 2,130,407 |
Compagnie de St. Gobain | 16,600 | | 585,022 |
Danone SA | 20,380 | | 1,252,757 |
GDF Suez | 39,743 | | 912,036 |
Laurent-Perrier Group | 859 | | 73,261 |
Pernod Ricard SA | 5,500 | | 591,906 |
PPR SA | 3,083 | | 542,062 |
Remy Cointreau SA | 5,281 | | 547,734 |
Safran SA | 15,114 | | 601,315 |
Saft Groupe SA | 2,629 | | 58,457 |
Sanofi SA | 46,258 | | 4,062,723 |
Schneider Electric SA | 6,245 | | 390,436 |
Unibail-Rodamco | 2,908 | | 655,276 |
Vetoquinol SA | 1,200 | | 40,129 |
Virbac SA | 520 | | 90,653 |
TOTAL FRANCE | | 14,686,123 |
Germany - 4.6% |
Allianz AG | 15,953 | | 1,978,008 |
alstria office REIT-AG | 5,100 | | 61,595 |
BASF AG | 8,181 | | 677,901 |
Bayer AG | 24,293 | | 2,115,637 |
Bilfinger Berger AG | 1,167 | | 114,187 |
CompuGROUP Holding AG | 3,446 | | 62,531 |
CTS Eventim AG | 4,250 | | 126,148 |
Daimler AG (Germany) | 22,353 | | 1,043,747 |
Deutsche Post AG | 40,282 | | 798,575 |
Fielmann AG | 1,079 | | 105,031 |
Fresenius SE & Co. KGaA | 5,800 | | 661,555 |
HeidelbergCement Finance AG | 10,700 | | 567,095 |
Linde AG | 13,449 | | 2,261,792 |
RWE AG | 23,200 | | 1,060,142 |
Siemens AG | 13,786 | | 1,389,063 |
Siemens AG sponsored ADR | 5,669 | | 572,059 |
Software AG (Bearer) | 1,959 | | 78,485 |
TOTAL GERMANY | | 13,673,551 |
Hong Kong - 2.5% |
Cathay Pacific Airways Ltd. | 393,000 | | 711,959 |
Common Stocks - continued |
| Shares | | Value |
Hong Kong - continued |
Cheung Kong Holdings Ltd. | 78,000 | | $ 1,152,380 |
China Insurance International Holdings Co. Ltd. (a) | 608,800 | | 1,043,201 |
China Merchant Holdings International Co. Ltd. | 234,000 | | 775,969 |
China Resources Enterprise Ltd. | 284,000 | | 923,452 |
China Resources Power Holdings Co. Ltd. | 250,000 | | 535,480 |
Dah Chong Hong Holdings Ltd. | 687,000 | | 647,992 |
Hopewell Holdings Ltd. | 163,500 | | 589,651 |
Hysan Development Co. Ltd. | 28,000 | | 123,741 |
Television Broadcasts Ltd. | 129,000 | | 961,252 |
TOTAL HONG KONG | | 7,465,077 |
Hungary - 0.2% |
Richter Gedeon PLC | 3,700 | | 690,100 |
India - 2.4% |
Bharti Airtel Ltd. | 173,106 | | 867,541 |
Cipla Ltd. | 79,925 | | 539,666 |
Container Corp. of India Ltd. | 33,774 | | 630,253 |
Housing Development Finance Corp. Ltd. (a) | 94,893 | | 1,344,516 |
Jyothy Laboratories Ltd. | 24,138 | | 79,563 |
Max India Ltd. (a) | 171,991 | | 773,888 |
Piramal Enterprises Ltd. | 58,571 | | 540,588 |
Punjab National Bank | 51,513 | | 730,982 |
Satyam Computer Services Ltd. (a) | 418,989 | | 850,360 |
Tata Power Co. Ltd. | 427,422 | | 842,451 |
TOTAL INDIA | | 7,199,808 |
Indonesia - 0.2% |
PT Kalbe Farma Tbk | 6,357,000 | | 641,985 |
Ireland - 0.6% |
CRH PLC sponsored ADR | 31,200 | | 581,880 |
Elan Corp. PLC sponsored ADR (a) | 28,485 | | 307,638 |
FBD Holdings PLC | 2,500 | | 31,270 |
James Hardie Industries NV: | | | |
CDI | 1,000 | | 9,581 |
sponsored ADR | 16,845 | | 810,076 |
TOTAL IRELAND | | 1,740,445 |
Israel - 0.1% |
Azrieli Group | 11,296 | | 252,176 |
Common Stocks - continued |
| Shares | | Value |
Israel - continued |
Ituran Location & Control Ltd. | 4,361 | | $ 53,902 |
Strauss Group Ltd. | 659 | | 7,446 |
TOTAL ISRAEL | | 313,524 |
Italy - 1.6% |
Azimut Holding SpA | 7,614 | | 96,419 |
ENI SpA | 123,700 | | 2,846,452 |
Fiat Industrial SpA | 81,628 | | 883,977 |
Interpump Group SpA | 51,091 | | 388,059 |
Saipem SpA | 13,530 | | 607,829 |
TOTAL ITALY | | 4,822,736 |
Japan - 10.8% |
Aeon Credit Service Co. Ltd. | 33,700 | | 715,117 |
Air Water, Inc. | 49,000 | | 613,804 |
Aozora Bank Ltd. | 158,000 | | 445,321 |
Asahi Co. Ltd. | 3,000 | | 45,171 |
Astellas Pharma, Inc. | 27,400 | | 1,360,904 |
Autobacs Seven Co. Ltd. | 11,900 | | 488,194 |
Azbil Corp. | 2,100 | | 42,958 |
Chubu Electric Power Co., Inc. | 36,200 | | 373,201 |
Cosmos Pharmaceutical Corp. | 400 | | 39,434 |
Credit Saison Co. Ltd. | 24,500 | | 537,999 |
Daikoku Denki Co. Ltd. | 1,000 | | 25,304 |
Daikokutenbussan Co. Ltd. | 3,800 | | 120,812 |
Denso Corp. | 64,500 | | 2,019,109 |
Fanuc Corp. | 7,700 | | 1,225,943 |
Fast Retailing Co. Ltd. | 3,400 | | 757,259 |
FCC Co. Ltd. | 5,500 | | 98,866 |
Fields Corp. | 2,000 | | 28,761 |
GCA Savvian Group Corp. | 44 | | 52,251 |
Glory Ltd. | 2,900 | | 70,402 |
Goldcrest Co. Ltd. | 3,280 | | 49,346 |
Hitachi Ltd. | 161,000 | | 853,100 |
Honda Motor Co. Ltd. | 50,100 | | 1,506,169 |
INPEX Corp. | 67 | | 381,874 |
Itochu Corp. | 60,800 | | 608,533 |
Iwatsuka Confectionary Co. Ltd. | 1,000 | | 37,430 |
Japan Retail Fund Investment Corp. | 257 | | 468,414 |
Japan Tobacco, Inc. | 53,900 | | 1,489,458 |
JS Group Corp. | 13,600 | | 300,689 |
JSR Corp. | 28,500 | | 488,388 |
Common Stocks - continued |
| Shares | | Value |
Japan - continued |
Kamigumi Co. Ltd. | 7,000 | | $ 56,470 |
Keyence Corp. | 4,321 | | 1,146,421 |
Kobayashi Pharmaceutical Co. Ltd. | 10,700 | | 564,957 |
Kyoto Kimono Yuzen Co. Ltd. | 3,800 | | 45,935 |
Meiko Network Japan Co. Ltd. | 3,700 | | 37,542 |
Miraial Co. Ltd. | 300 | | 5,712 |
Mitsubishi Corp. | 43,100 | | 769,354 |
Mitsubishi Estate Co. Ltd. | 47,000 | | 929,638 |
Mitsui Fudosan Co. Ltd. | 27,000 | | 545,547 |
Nabtesco Corp. | 3,600 | | 67,012 |
Nagaileben Co. Ltd. | 3,700 | | 54,320 |
Nihon M&A Center, Inc. | 4,000 | | 120,005 |
Nihon Parkerizing Co. Ltd. | 5,000 | | 75,473 |
Nintendo Co. Ltd. | 3,600 | | 463,585 |
Nippon Seiki Co. Ltd. | 6,000 | | 57,648 |
Nippon Telegraph & Telephone Corp. | 12,000 | | 548,738 |
Nippon Thompson Co. Ltd. | 14,000 | | 48,403 |
NS Tool Co., Ltd. | 1,600 | | 27,258 |
Obic Co. Ltd. | 310 | | 63,802 |
ORIX Corp. | 6,400 | | 657,397 |
Osaka Securities Exchange Co. Ltd. | 14 | | 52,173 |
OSG Corp. | 5,200 | | 68,070 |
Santen Pharmaceutical Co. Ltd. | 13,300 | | 582,281 |
Seven & i Holdings Co., Ltd. | 50,600 | | 1,560,531 |
Seven Bank Ltd. | 232,500 | | 664,036 |
SHO-BOND Holdings Co. Ltd. | 12,400 | | 374,811 |
Shoei Co. Ltd. | 3,900 | | 21,251 |
SMC Corp. | 2,200 | | 346,687 |
Softbank Corp. | 19,900 | | 629,930 |
Sumitomo Mitsui Financial Group, Inc. | 64,700 | | 1,977,038 |
Sumitomo Realty & Development Co. Ltd. | 20,000 | | 552,173 |
The Nippon Synthetic Chemical Industry Co. Ltd. | 10,000 | | 65,640 |
Tocalo Co. Ltd. | 2,000 | | 29,037 |
Toyo Suisan Kaisha Ltd. | 16,000 | | 398,647 |
Tsutsumi Jewelry Co. Ltd. | 1,200 | | 27,523 |
Unicharm Corp. | 10,100 | | 546,561 |
USS Co. Ltd. | 15,840 | | 1,664,758 |
Yamato Kogyo Co. Ltd. | 23,200 | | 651,274 |
TOTAL JAPAN | | 31,741,849 |
Korea (South) - 2.9% |
AMOREPACIFIC Corp. | 595 | | 676,682 |
Common Stocks - continued |
| Shares | | Value |
Korea (South) - continued |
BS Financial Group, Inc. | 91,770 | | $ 1,039,474 |
E-Mart Co. Ltd. | 3,360 | | 728,814 |
Kiwoom Securities Co. Ltd. | 11,170 | | 565,507 |
LG Corp. | 21,485 | | 1,312,368 |
LG Household & Health Care Ltd. | 1,406 | | 826,589 |
NICE Holdings Co. Ltd. | 600 | | 31,862 |
NICE Information Service Co. Ltd. | 7,500 | | 33,018 |
S1 Corp. | 10,741 | | 648,211 |
Samsung Fire & Marine Insurance Co. Ltd. | 4,109 | | 898,816 |
Shinsegae Co. Ltd. | 4,287 | | 766,715 |
Woongjin Coway Co. Ltd. | 1,880 | | 68,453 |
Yuhan Corp. | 4,588 | | 793,197 |
TOTAL KOREA (SOUTH) | | 8,389,706 |
Malaysia - 0.5% |
Axiata Group Bhd | 381,100 | | 817,000 |
Top Glove Corp. Bhd | 393,700 | | 691,495 |
TOTAL MALAYSIA | | 1,508,495 |
Mexico - 0.5% |
Bolsa Mexicana de Valores SA de CV | 406,600 | | 900,209 |
Urbi, Desarrollos Urbanos, SA de CV (a) | 892,000 | | 556,563 |
TOTAL MEXICO | | 1,456,772 |
Netherlands - 1.9% |
Aalberts Industries NV | 6,400 | | 116,135 |
ASM International NV unit | 2,250 | | 71,370 |
ASML Holding NV | 28,800 | | 1,583,136 |
D.E. Master Blenders 1753 NV (a) | 29,200 | | 356,865 |
Heijmans NV unit | 3,381 | | 28,629 |
ING Groep NV (Certificaten Van Aandelen) (a) | 152,478 | | 1,356,770 |
Koninklijke Philips Electronics NV | 36,839 | | 922,672 |
QIAGEN NV (a) | 3,000 | | 52,350 |
Unilever NV (Certificaten Van Aandelen) (Bearer) | 27,200 | | 999,726 |
TOTAL NETHERLANDS | | 5,487,653 |
Norway - 0.5% |
Orkla ASA (A Shares) | 53,082 | | 419,904 |
Telenor ASA | 45,711 | | 898,778 |
TOTAL NORWAY | | 1,318,682 |
Papua New Guinea - 0.3% |
Oil Search Ltd. ADR | 107,827 | | 832,758 |
Common Stocks - continued |
| Shares | | Value |
Philippines - 0.6% |
BDO Unibank, Inc. | 666,132 | | $ 1,037,286 |
Jollibee Food Corp. | 26,900 | | 69,181 |
Manila Water Co., Inc. | 1,106,700 | | 780,883 |
TOTAL PHILIPPINES | | 1,887,350 |
Poland - 0.2% |
Warsaw Stock Exchange | 54,438 | | 639,414 |
Portugal - 0.4% |
Jeronimo Martins SGPS SA | 64,569 | | 1,129,830 |
Singapore - 1.9% |
Ascendas India Trust | 931,000 | | 580,062 |
Ascendas Real Estate Investment Trust | 310,000 | | 599,770 |
Bumitama Agri Ltd. | 859,000 | | 707,735 |
ComfortDelgro Corp. Ltd. | 266,000 | | 368,536 |
Ezra Holdings Ltd. | 687,000 | | 627,976 |
Global Logistic Properties Ltd. | 372,000 | | 783,768 |
Singapore Telecommunications Ltd. | 267,000 | | 704,820 |
United Overseas Bank Ltd. | 77,746 | | 1,164,469 |
TOTAL SINGAPORE | | 5,537,136 |
South Africa - 2.8% |
African Rainbow Minerals Ltd. | 2,600 | | 54,425 |
AngloGold Ashanti Ltd. | 27,700 | | 935,854 |
Bidvest Group Ltd. | 29,400 | | 701,716 |
City Lodge Hotels Ltd. | 2,500 | | 26,526 |
Clicks Group Ltd. | 69,625 | | 480,031 |
Impala Platinum Holdings Ltd. | 46,100 | | 829,419 |
Mr Price Group Ltd. | 3,100 | | 47,891 |
MTN Group Ltd. | 60,100 | | 1,083,660 |
Nampak Ltd. | 176,100 | | 586,956 |
Reunert Ltd. | 63,000 | | 554,969 |
Sasol Ltd. | 25,800 | | 1,099,082 |
Standard Bank Group Ltd. | 82,600 | | 1,020,372 |
Tiger Brands Ltd. | 28,600 | | 909,062 |
TOTAL SOUTH AFRICA | | 8,329,963 |
Spain - 1.4% |
Banco Bilbao Vizcaya Argentaria SA sponsored ADR | 194,128 | | 1,611,262 |
Grifols SA (a) | 1,546 | | 53,623 |
Inditex SA | 8,110 | | 1,034,779 |
Common Stocks - continued |
| Shares | | Value |
Spain - continued |
Prosegur Compania de Seguridad SA (Reg.) | 96,376 | | $ 524,655 |
Repsol YPF SA | 42,765 | | 854,728 |
TOTAL SPAIN | | 4,079,047 |
Sweden - 1.5% |
ASSA ABLOY AB (B Shares) | 19,600 | | 653,343 |
Fagerhult AB | 11,100 | | 274,450 |
H&M Hennes & Mauritz AB (B Shares) | 33,386 | | 1,129,997 |
Intrum Justitia AB | 23,463 | | 339,587 |
Svenska Handelsbanken AB (A Shares) | 32,600 | | 1,116,664 |
Swedish Match Co. AB | 25,950 | | 884,183 |
TOTAL SWEDEN | | 4,398,224 |
Switzerland - 6.9% |
Holcim Ltd. (Reg.) | 13,460 | | 918,483 |
Nestle SA | 105,629 | | 6,703,182 |
Roche Holding AG (participation certificate) | 28,367 | | 5,455,309 |
Schindler Holding AG: | | | |
(participation certificate) | 3,536 | | 465,873 |
(Reg.) | 820 | | 106,099 |
Swatch Group AG (Bearer) | 1,230 | | 509,011 |
Swisscom AG | 1,648 | | 684,646 |
Syngenta AG (Switzerland) | 3,135 | | 1,222,304 |
UBS AG (NY Shares) | 169,037 | | 2,538,936 |
Zehnder Group AG | 993 | | 58,484 |
Zurich Financial Services AG | 6,802 | | 1,676,215 |
TOTAL SWITZERLAND | | 20,338,542 |
Taiwan - 3.7% |
Chinatrust Financial Holding Co. Ltd. | 2,114 | | 1,165 |
Chroma ATE, Inc. | 264,116 | | 502,734 |
CTCI Corp. | 248,000 | | 493,283 |
Delta Electronics, Inc. | 229,000 | | 782,410 |
E Sun Financial Holdings Co. Ltd. | 1,187,350 | | 595,504 |
Motech Industries, Inc. (a) | 458,000 | | 352,790 |
Powertech Technology, Inc. | 358,000 | | 556,426 |
President Chain Store Corp. | 126,000 | | 623,314 |
SIMPLO Technology Co. Ltd. | 88,300 | | 435,303 |
St. Shine Optical Co. Ltd. | 57,000 | | 743,478 |
Synnex Technology International Corp. | 286,000 | | 605,094 |
Taiwan Hon Chuan Enterprise Co. Ltd. | 258,000 | | 549,387 |
Taiwan Mobile Co. Ltd. | 219,000 | | 764,738 |
Taiwan Semiconductor Manufacturing Co. Ltd. | 444,035 | | 1,353,117 |
Common Stocks - continued |
| Shares | | Value |
Taiwan - continued |
Unified-President Enterprises Corp. | 684,800 | | $ 1,209,712 |
Wistron Corp. | 540,000 | | 518,555 |
WPG Holding Co. Ltd. | 558,000 | | 674,338 |
TOTAL TAIWAN | | 10,761,348 |
Turkey - 1.2% |
Albaraka Turk Katilim Bankasi A/S | 89,303 | | 70,745 |
Anadolu Efes Biracilik Ve Malt Sanayii A/S | 73,000 | | 1,095,509 |
Boyner Buyuk Magazacilik A/S (a) | 42,049 | | 96,648 |
Coca-Cola Icecek A/S | 39,789 | | 772,473 |
Enka Insaat ve Sanayi A/S | 224,680 | | 596,640 |
Turkiye Garanti Bankasi A/S | 121,500 | | 580,218 |
Turkiye Petrol Rafinerile A/S | 15,313 | | 374,175 |
TOTAL TURKEY | | 3,586,408 |
United Arab Emirates - 0.2% |
First Gulf Bank PJSC | 214,355 | | 609,858 |
United Kingdom - 16.8% |
AMEC PLC | 3,189 | | 54,550 |
Anglo American PLC (United Kingdom) | 12,500 | | 383,871 |
Babcock International Group PLC | 40,500 | | 639,190 |
Barclays PLC | 409,903 | | 1,515,713 |
Bellway PLC | 6,228 | | 101,610 |
Berendsen PLC | 5,246 | | 47,662 |
BG Group PLC | 113,677 | | 2,105,046 |
BHP Billiton PLC | 67,335 | | 2,158,171 |
BHP Billiton PLC ADR | 26,900 | | 1,721,062 |
BP PLC sponsored ADR | 42,587 | | 1,826,556 |
British American Tobacco PLC (United Kingdom) | 17,153 | | 850,782 |
British Land Co. PLC | 85,777 | | 731,564 |
Britvic PLC | 13,800 | | 79,993 |
Bunzl PLC | 43,757 | | 723,782 |
Centrica PLC | 199,975 | | 1,045,902 |
Compass Group PLC | 94,000 | | 1,031,509 |
Dechra Pharmaceuticals PLC | 8,600 | | 85,629 |
Derwent London PLC | 1,800 | | 59,896 |
Elementis PLC | 12,790 | | 43,199 |
GlaxoSmithKline PLC sponsored ADR | 79,097 | | 3,551,455 |
Great Portland Estates PLC | 15,772 | | 119,014 |
H&T Group PLC | 7,014 | | 32,542 |
HSBC Holdings PLC sponsored ADR | 61,131 | | 3,017,426 |
Imperial Tobacco Group PLC | 12,777 | | 482,482 |
Common Stocks - continued |
| Shares | | Value |
United Kingdom - continued |
InterContinental Hotel Group PLC ADR | 42,777 | | $ 1,053,170 |
Johnson Matthey PLC | 23,377 | | 848,427 |
Kingfisher PLC | 116,601 | | 544,737 |
Legal & General Group PLC | 464,777 | | 1,005,045 |
Meggitt PLC | 25,298 | | 157,583 |
National Grid PLC | 139,691 | | 1,593,114 |
Next PLC | 9,400 | | 540,935 |
Persimmon PLC | 6,137 | | 78,733 |
Prudential PLC | 68,427 | | 939,749 |
PZ Cussons PLC Class L | 157,519 | | 860,454 |
Reckitt Benckiser Group PLC | 22,851 | | 1,382,843 |
Reed Elsevier PLC | 107,134 | | 1,047,698 |
Rexam PLC | 59,209 | | 426,815 |
Rolls-Royce Group PLC | 67,452 | | 930,129 |
Rolls-Royce Group PLC Class C | 5,126,352 | | 8,273 |
Rotork PLC | 18,503 | | 680,193 |
Royal Dutch Shell PLC Class A sponsored ADR | 76,315 | | 5,226,051 |
SABMiller PLC | 31,063 | | 1,330,646 |
Scottish & Southern Energy PLC | 50,824 | | 1,187,609 |
Serco Group PLC | 68,159 | | 623,102 |
Shaftesbury PLC | 40,537 | | 358,483 |
Spectris PLC | 4,170 | | 116,283 |
Spirax-Sarco Engineering PLC | 5,404 | | 168,746 |
Standard Chartered PLC (United Kingdom) | 73,695 | | 1,740,472 |
Ted Baker PLC | 3,775 | | 57,751 |
Ultra Electronics Holdings PLC | 4,101 | | 112,043 |
Unite Group PLC | 91,702 | | 418,943 |
Victrex PLC | 4,718 | | 108,495 |
Vodafone Group PLC sponsored ADR | 127,532 | | 3,471,421 |
TOTAL UNITED KINGDOM | | 49,426,549 |
United States of America - 5.6% |
Allergan, Inc. | 6,500 | | 584,480 |
Amazon.com, Inc. (a) | 2,399 | | 558,535 |
ANSYS, Inc. (a) | 500 | | 35,440 |
Autoliv, Inc. | 16,910 | | 974,016 |
Berkshire Hathaway, Inc. Class B (a) | 9,945 | | 858,751 |
BorgWarner, Inc. (a) | 8,997 | | 592,183 |
BPZ Energy, Inc. (a) | 9,388 | | 27,037 |
Broadridge Financial Solutions, Inc. | 1,990 | | 45,671 |
CME Group, Inc. | 6,400 | | 357,952 |
Cummins, Inc. | 3,300 | | 308,814 |
Common Stocks - continued |
| Shares | | Value |
United States of America - continued |
Cymer, Inc. (a) | 6,083 | | $ 484,754 |
Dril-Quip, Inc. (a) | 1,210 | | 83,805 |
Evercore Partners, Inc. Class A | 1,860 | | 51,894 |
FMC Technologies, Inc. (a) | 10,803 | | 441,843 |
Freeport-McMoRan Copper & Gold, Inc. | 6,100 | | 237,168 |
Greenhill & Co., Inc. | 1,270 | | 60,604 |
Kansas City Southern | 1,420 | | 114,253 |
Martin Marietta Materials, Inc. | 3,690 | | 303,724 |
MasterCard, Inc. Class A | 3,609 | | 1,663,496 |
Mead Johnson Nutrition Co. Class A | 14,000 | | 863,240 |
Mohawk Industries, Inc. (a) | 6,805 | | 568,013 |
National Oilwell Varco, Inc. | 8,900 | | 655,930 |
Oceaneering International, Inc. | 1,680 | | 87,914 |
Philip Morris International, Inc. | 21,100 | | 1,868,616 |
PriceSmart, Inc. | 6,850 | | 568,482 |
ResMed, Inc. | 15,140 | | 604,692 |
Solera Holdings, Inc. | 7,202 | | 337,126 |
SS&C Technologies Holdings, Inc. (a) | 11,854 | | 284,852 |
Union Pacific Corp. | 7,900 | | 971,937 |
Virgin Media, Inc. | 22,733 | | 746,914 |
Visa, Inc. Class A | 9,301 | | 1,290,607 |
TOTAL UNITED STATES OF AMERICA | | 16,632,743 |
TOTAL COMMON STOCKS (Cost $273,143,791) |
288,268,394
|
Nonconvertible Preferred Stocks - 0.5% |
| | | |
Brazil - 0.0% |
Banco ABC Brasil SA | 13,794 | | 78,375 |
Germany - 0.5% |
ProSiebenSat.1 Media AG | 20,800 | | 579,638 |
Volkswagen AG | 4,434 | | 917,242 |
TOTAL NONCONVERTIBLE PREFERRED STOCKS (Cost $1,351,389) |
1,575,255
|
Money Market Funds - 2.1% |
| Shares | | Value |
Fidelity Cash Central Fund, 0.19% (b)
(Cost $6,092,586) | 6,092,586 | | $ 6,092,586 |
TOTAL INVESTMENT PORTFOLIO - 100.5% (Cost $280,587,766) | | 295,936,235 |
NET OTHER ASSETS (LIABILITIES) - (0.5)% | | (1,370,438) |
NET ASSETS - 100% | $ 294,565,797 |
Legend |
(a) Non-income producing |
(b) Affiliated fund that is available only to investment companies and other accounts managed by Fidelity Investments. The rate quoted is the annualized seven-day yield of the fund at period end. A complete unaudited listing of the fund's holdings as of its most recent quarter end is available upon request. In addition, each Fidelity Central Fund's financial statements, which are not covered by the Fund's Report of Independent Registered Public Accounting Firm, are available on the SEC's website or upon request. |
Affiliated Central Funds |
Information regarding fiscal year to date income earned by the Fund from investments in Fidelity Central Funds is as follows: |
Fund | Income earned |
Fidelity Cash Central Fund | $ 6,990 |
Fidelity Securities Lending Cash Central Fund | 151,487 |
Total | $ 158,477 |
Other Information |
Categorizations in the Schedule of Investments are based on country or territory of incorporation. |
The following is a summary of the inputs used, as of October 31, 2012, involving the Fund's assets and liabilities carried at fair value. The inputs or methodology used for valuing securities may not be an indication of the risk associated with investing in those securities. For more information on valuation inputs, and their aggregation into the levels used in the tables below, please refer to the Security Valuation section in the accompanying Notes to Financial Statements. |
Valuation Inputs at Reporting Date: |
Description | Total | Level 1 | Level 2 | Level 3 |
Investments in Securities: | | | | |
Equities: | | | | |
Consumer Discretionary | $ 30,059,832 | $ 28,553,663 | $ 1,506,169 | $ - |
Consumer Staples | 41,431,676 | 36,196,531 | 5,235,145 | - |
Energy | 22,006,300 | 18,060,766 | 3,945,534 | - |
Financials | 63,247,920 | 56,727,668 | 6,520,252 | - |
Health Care | 29,781,563 | 25,718,840 | 4,062,723 | - |
Industrials | 36,211,061 | 33,899,326 | 2,311,735 | - |
Information Technology | 18,619,115 | 17,265,998 | 1,353,117 | - |
Materials | 25,475,141 | 21,158,812 | 4,316,329 | - |
Telecommunication Services | 12,064,291 | 11,515,553 | 548,738 | - |
Utilities | 10,946,750 | 9,353,636 | 1,593,114 | - |
Money Market Funds | 6,092,586 | 6,092,586 | - | - |
Total Investments in Securities: | $ 295,936,235 | $ 264,543,379 | $ 31,392,856 | $ - |
The following is a summary of transfers between Level 1 and Level 2 for the period ended October 31, 2012. Transfers are assumed to have occurred at the beginning of the period, and are primarily attributable to the valuation techniques used for foreign equity securities, as discussed in the accompanying Notes to Financial Statements: |
Transfers | Total |
Level 1 to Level 2 | $ 0 |
Level 2 to Level 1 | $ 19,846,441 |
See accompanying notes which are an integral part of the financial statements.
Annual Report
Statement of Assets and Liabilities
| October 31, 2012 |
| | |
Assets | | |
Investment in securities, at value - See accompanying schedule: Unaffiliated issuers (cost $274,495,180) | $ 289,843,649 | |
Fidelity Central Funds (cost $6,092,586) | 6,092,586 | |
Total Investments (cost $280,587,766) | | $ 295,936,235 |
Foreign currency held at value (cost $23,243) | | 23,223 |
Receivable for investments sold | | 526,923 |
Receivable for fund shares sold | | 122,914 |
Dividends receivable | | 650,136 |
Distributions receivable from Fidelity Central Funds | | 4,446 |
Receivable from investment adviser for expense reductions | | 1,586 |
Other receivables | | 26,309 |
Total assets | | 297,291,772 |
| | |
Liabilities | | |
Payable to custodian bank | $ 472,489 | |
Payable for investments purchased | 806,751 | |
Payable for fund shares redeemed | 1,068,841 | |
Accrued management fee | 194,059 | |
Distribution and service plan fees payable | 4,561 | |
Other affiliated payables | 48,559 | |
Other payables and accrued expenses | 130,715 | |
Total liabilities | | 2,725,975 |
| | |
Net Assets | | $ 294,565,797 |
Net Assets consist of: | | |
Paid in capital | | $ 297,394,209 |
Undistributed net investment income | | 5,300,982 |
Accumulated undistributed net realized gain (loss) on investments and foreign currency transactions | | (23,430,376) |
Net unrealized appreciation (depreciation) on investments and assets and liabilities in foreign currencies | | 15,300,982 |
Net Assets | | $ 294,565,797 |
See accompanying notes which are an integral part of the financial statements.
Annual Report
Financial Statements - continued
Statement of Assets and Liabilities - continued
| October 31, 2012 |
| | |
Calculation of Maximum Offering Price Class A:
Net Asset Value and redemption price per share ($5,766,838 ÷ 789,026 shares) | | $ 7.31 |
| | |
Maximum offering price per share (100/94.25 of $7.31) | | $ 7.76 |
Class T:
Net Asset Value and redemption price per share ($2,348,287 ÷ 318,734 shares) | | $ 7.37 |
| | |
Maximum offering price per share (100/96.50 of $7.37) | | $ 7.64 |
Class B:
Net Asset Value and offering price per share ($219,813 ÷ 30,007 shares)A | | $ 7.33 |
| | |
Class C:
Net Asset Value and offering price per share ($2,737,321 ÷ 374,276 shares)A | | $ 7.31 |
| | |
Total International Equity:
Net Asset Value, offering price and redemption price per share ($281,979,071 ÷ 38,522,819 shares) | | $ 7.32 |
| | |
Institutional Class:
Net Asset Value, offering price and redemption price per share ($1,514,467 ÷ 207,475 shares) | | $ 7.30 |
A Redemption price per share is equal to net asset value less any applicable contingent deferred sales charge.
See accompanying notes which are an integral part of the financial statements.
Annual Report
Statement of Operations
| Year ended October 31, 2012 |
| | |
Investment Income | | |
Dividends | | $ 9,170,980 |
Interest | | 243 |
Income from Fidelity Central Funds | | 158,477 |
Income before foreign taxes withheld | | 9,329,700 |
Less foreign taxes withheld | | (704,106) |
Total income | | 8,625,594 |
| | |
Expenses | | |
Management fee
Basic fee | $ 1,851,948 | |
Performance adjustment | 105,713 | |
Transfer agent fees | 404,702 | |
Distribution and service plan fees | 44,605 | |
Accounting and security lending fees | 136,093 | |
Custodian fees and expenses | 312,577 | |
Independent trustees' compensation | 1,628 | |
Registration fees | 155,663 | |
Audit | 90,778 | |
Legal | 1,181 | |
Interest | 212 | |
Miscellaneous | 1,695 | |
Total expenses before reductions | 3,106,795 | |
Expense reductions | (96,572) | 3,010,223 |
Net investment income (loss) | | 5,615,371 |
Realized and Unrealized Gain (Loss) Net realized gain (loss) on: | | |
Investment securities: | | |
Unaffiliated issuers | 9,404,014 | |
Foreign currency transactions | (263,621) | |
Total net realized gain (loss) | | 9,140,393 |
Change in net unrealized appreciation (depreciation) on: Investment securities (net of increase in deferred foreign taxes of $35,138) | 20,557,485 | |
Assets and liabilities in foreign currencies | (20,296) | |
Total change in net unrealized appreciation (depreciation) | | 20,537,189 |
Net gain (loss) | | 29,677,582 |
Net increase (decrease) in net assets resulting from operations | | $ 35,292,953 |
See accompanying notes which are an integral part of the financial statements.
Annual Report
Financial Statements - continued
Statement of Changes in Net Assets
| Year ended
October 31,
2012 | Year ended
October 31,
2011 |
Increase (Decrease) in Net Assets | | |
Operations | | |
Net investment income (loss) | $ 5,615,371 | $ 1,864,848 |
Net realized gain (loss) | 9,140,393 | (8,998,027) |
Change in net unrealized appreciation (depreciation) | 20,537,189 | (8,597,909) |
Net increase (decrease) in net assets resulting
from operations | 35,292,953 | (15,731,088) |
Distributions to shareholders from net investment income | (1,867,192) | (953,041) |
Distributions to shareholders from net realized gain | - | (220,294) |
Total distributions | (1,867,192) | (1,173,335) |
Share transactions - net increase (decrease) | 122,647,348 | 86,742,563 |
Redemption fees | 3,128 | 14,195 |
Total increase (decrease) in net assets | 156,076,237 | 69,852,335 |
| | |
Net Assets | | |
Beginning of period | 138,489,560 | 68,637,225 |
End of period (including undistributed net investment income of $5,300,982 and undistributed net investment income of $1,552,849, respectively) | $ 294,565,797 | $ 138,489,560 |
See accompanying notes which are an integral part of the financial statements.
Annual Report
Financial Highlights - Class A
Years ended October 31, | 2012 | 2011 | 2010 | 2009 | 2008 F |
Selected Per-Share Data | | | | |
Net asset value, beginning of period | $ 6.67 | $ 7.36 | $ 6.40 | $ 4.90 | $ 10.00 |
Income from Investment Operations | | | | | |
Net investment income (loss) C | .13 | .11 | .08 | .06 | .11 |
Net realized and unrealized gain (loss) | .59 | (.69) | .95 | 1.55 | (5.21) |
Total from investment operations | .72 | (.58) | 1.03 | 1.61 | (5.10) |
Distributions from net investment income | (.08) | (.09) | (.04) | (.11) | - |
Distributions from net realized gain | - | (.02) | (.03) | - | - |
Total distributions | (.08) | (.11) | (.07) | (.11) | - |
Redemption fees added to paid in capital C, H | - | - | - | - | - |
Net asset value, end of period | $ 7.31 | $ 6.67 | $ 7.36 | $ 6.40 | $ 4.90 |
Total Return A, B | 10.88% | (8.03)% | 16.17% | 33.87% | (51.00)% |
Ratios to Average Net Assets D, G | | | | |
Expenses before reductions | 1.57% | 1.73% | 2.02% | 2.09% | 2.00% |
Expenses net of fee waivers, if any | 1.45% | 1.45% | 1.50% | 1.50% | 1.50% |
Expenses net of all reductions | 1.42% | 1.42% | 1.47% | 1.47% | 1.48% |
Net investment income (loss) | 1.88% | 1.44% | 1.15% | 1.13% | 1.35% |
Supplemental Data | | | | |
Net assets, end of period (000 omitted) | $ 5,767 | $ 4,307 | $ 5,029 | $ 3,727 | $ 5,944 |
Portfolio turnover rate E | 110% | 75% | 67% | 98% | 91% |
A Total returns would have been lower if certain expenses had not been reduced during the applicable periods shown.
B Total returns do not include the effect of the sales charges.
C Calculated based on average shares outstanding during the period.
D Fees and expenses of any underlying Fidelity Central Funds are not included in the Fund's expense ratio. The Fund indirectly bears its proportionate share of the expenses of any underlying Fidelity Central Funds.
E Amount does not include the portfolio activity of any underlying Fidelity Central Funds.
F For the period November 1, 2007 (commencement of operations) to October 31, 2008.
G Expense ratios reflect operating expenses of the class. Expenses before reductions do not reflect amounts reimbursed by the investment adviser or reductions from brokerage service arrangements or reductions from other expense offset arrangements and do not represent the amount paid by the class during periods when reimbursements or reductions occur. Expense ratios before reductions for start-up periods may not be representative of longer-term operating periods. Expenses net of fee waivers reflect expenses after reimbursement by the investment adviser but prior to reductions from brokerage service arrangements or other expense offset arrangements. Expenses net of all reductions represent the net expenses paid by the class.
H Amount represents less than $.01 per share.
See accompanying notes which are an integral part of the financial statements.
Annual Report
Financial Highlights - Class T
Years ended October 31, | 2012 | 2011 | 2010 | 2009 | 2008 F |
Selected Per-Share Data | | | | |
Net asset value, beginning of period | $ 6.73 | $ 7.41 | $ 6.40 | $ 4.88 | $ 10.00 |
Income from Investment Operations | | | | | |
Net investment income (loss) C | .11 | .09 | .06 | .04 | .09 |
Net realized and unrealized gain (loss) | .59 | (.68) | .95 | 1.57 | (5.21) |
Total from investment operations | .70 | (.59) | 1.01 | 1.61 | (5.12) |
Distributions from net investment income | (.06) | (.07) | - | (.09) | - |
Distributions from net realized gain | - | (.02) | - | - | - |
Total distributions | (.06) | (.09) | - | (.09) | - |
Redemption fees added to paid in capital C, H | - | - | - | - | - |
Net asset value, end of period | $ 7.37 | $ 6.73 | $ 7.41 | $ 6.40 | $ 4.88 |
Total Return A, B | 10.52% | (8.08)% | 15.78% | 33.74% | (51.20)% |
Ratios to Average Net Assets D, G | | | | |
Expenses before reductions | 1.84% | 2.02% | 2.31% | 2.34% | 2.42% |
Expenses net of fee waivers, if any | 1.70% | 1.70% | 1.75% | 1.75% | 1.75% |
Expenses net of all reductions | 1.67% | 1.67% | 1.72% | 1.72% | 1.73% |
Net investment income (loss) | 1.63% | 1.19% | .90% | .88% | 1.10% |
Supplemental Data | | | | |
Net assets, end of period (000 omitted) | $ 2,348 | $ 997 | $ 1,004 | $ 1,526 | $ 2,567 |
Portfolio turnover rate E | 110% | 75% | 67% | 98% | 91% |
A Total returns would have been lower if certain expenses had not been reduced during the applicable periods shown.
B Total returns do not include the effect of the sales charges.
C Calculated based on average shares outstanding during the period.
D Fees and expenses of any underlying Fidelity Central Funds are not included in the Fund's expense ratio. The Fund indirectly bears its proportionate share of the expenses of any underlying Fidelity Central Funds.
E Amount does not include the portfolio activity of any underlying Fidelity Central Funds.
F For the period November 1, 2007 (commencement of operations) to October 31, 2008.
G Expense ratios reflect operating expenses of the class. Expenses before reductions do not reflect amounts reimbursed by the investment adviser or reductions from brokerage service arrangements or reductions from other expense offset arrangements and do not represent the amount paid by the class during periods when reimbursements or reductions occur. Expense ratios before reductions for start-up periods may not be representative of longer-term operating periods. Expenses net of fee waivers reflect expenses after reimbursement by the investment adviser but prior to reductions from brokerage service arrangements or other expense offset arrangements. Expenses net of all reductions represent the net expenses paid by the class.
H Amount represents less than $.01 per share.
See accompanying notes which are an integral part of the financial statements.
Annual Report
Financial Highlights - Class B
Years ended October 31, | 2012 | 2011 | 2010 | 2009 | 2008 F |
Selected Per-Share Data | | | | |
Net asset value, beginning of period | $ 6.68 | $ 7.37 | $ 6.39 | $ 4.86 | $ 10.00 |
Income from Investment Operations | | | | | |
Net investment income (loss) C | .08 | .05 | .03 | .02 | .05 |
Net realized and unrealized gain (loss) | .59 | (.68) | .95 | 1.56 | (5.19) |
Total from investment operations | .67 | (.63) | .98 | 1.58 | (5.14) |
Distributions from net investment income | (.02) | (.04) | - | (.05) | - |
Distributions from net realized gain | - | (.02) | - | - | - |
Total distributions | (.02) | (.06) | - | (.05) | - |
Redemption fees added to paid in capital C, H | - | - | - | - | - |
Net asset value, end of period | $ 7.33 | $ 6.68 | $ 7.37 | $ 6.39 | $ 4.86 |
Total Return A, B | 10.05% | (8.66)% | 15.34% | 32.95% | (51.40)% |
Ratios to Average Net Assets D, G | | | | |
Expenses before reductions | 2.34% | 2.51% | 2.81% | 2.82% | 2.92% |
Expenses net of fee waivers, if any | 2.20% | 2.20% | 2.25% | 2.25% | 2.25% |
Expenses net of all reductions | 2.17% | 2.17% | 2.22% | 2.22% | 2.24% |
Net investment income (loss) | 1.13% | .69% | .40% | .38% | .60% |
Supplemental Data | | | | |
Net assets, end of period (000 omitted) | $ 220 | $ 254 | $ 327 | $ 1,337 | $ 2,505 |
Portfolio turnover rate E | 110% | 75% | 67% | 98% | 91% |
A Total returns would have been lower if certain expenses had not been reduced during the applicable periods shown.
B Total returns do not include the effect of the contingent deferred sales charge.
C Calculated based on average shares outstanding during the period.
D Fees and expenses of any underlying Fidelity Central Funds are not included in the Fund's expense ratio. The Fund indirectly bears its proportionate share of the expenses of any underlying Fidelity Central Funds.
E Amount does not include the portfolio activity of any underlying Fidelity Central Funds.
F For the period November 1, 2007 (commencement of operations) to October 31, 2008.
G Expense ratios reflect operating expenses of the class. Expenses before reductions do not reflect amounts reimbursed by the investment adviser or reductions from brokerage service arrangements or reductions from other expense offset arrangements and do not represent the amount paid by the class during periods when reimbursements or reductions occur. Expense ratios before reductions for start-up periods may not be representative of longer-term operating periods. Expenses net of fee waivers reflect expenses after reimbursement by the investment adviser but prior to reductions from brokerage service arrangements or other expense offset arrangements. Expenses net of all reductions represent the net expenses paid by the class.
H Amount represents less than $.01 per share.
See accompanying notes which are an integral part of the financial statements.
Annual Report
Financial Highlights - Class C
Years ended October 31, | 2012 | 2011 | 2010 | 2009 | 2008 F |
Selected Per-Share Data | | | | |
Net asset value, beginning of period | $ 6.67 | $ 7.36 | $ 6.39 | $ 4.86 | $ 10.00 |
Income from Investment Operations | | | | | |
Net investment income (loss) C | .08 | .05 | .03 | .02 | .05 |
Net realized and unrealized gain (loss) | .58 | (.69) | .94 | 1.56 | (5.19) |
Total from investment operations | .66 | (.64) | .97 | 1.58 | (5.14) |
Distributions from net investment income | (.02) | (.03) | - | (.05) | - |
Distributions from net realized gain | - | (.02) | - | - | - |
Total distributions | (.02) | (.05) | - | (.05) | - |
Redemption fees added to paid in capital C, H | - | - | - | - | - |
Net asset value, end of period | $ 7.31 | $ 6.67 | $ 7.36 | $ 6.39 | $ 4.86 |
Total Return A, B | 9.98% | (8.72)% | 15.18% | 33.10% | (51.40)% |
Ratios to Average Net Assets D, G | | | | |
Expenses before reductions | 2.31% | 2.51% | 2.80% | 2.85% | 2.92% |
Expenses net of fee waivers, if any | 2.20% | 2.20% | 2.25% | 2.25% | 2.25% |
Expenses net of all reductions | 2.17% | 2.17% | 2.22% | 2.22% | 2.23% |
Net investment income (loss) | 1.13% | .69% | .40% | .38% | .60% |
Supplemental Data | | | | |
Net assets, end of period (000 omitted) | $ 2,737 | $ 1,396 | $ 1,423 | $ 1,714 | $ 2,787 |
Portfolio turnover rate E | 110% | 75% | 67% | 98% | 91% |
A Total returns would have been lower if certain expenses had not been reduced during the applicable periods shown.
B Total returns do not include the effect of the contingent deferred sales charge.
C Calculated based on average shares outstanding during the period.
D Fees and expenses of any underlying Fidelity Central Funds are not included in the Fund's expense ratio. The Fund indirectly bears its proportionate share of the expenses of any underlying Fidelity Central Funds.
E Amount does not include the portfolio activity of any underlying Fidelity Central Funds.
F For the period November 1, 2007 (commencement of operations) to October 31, 2008.
G Expense ratios reflect operating expenses of the class. Expenses before reductions do not reflect amounts reimbursed by the investment adviser or reductions from brokerage service arrangements or reductions from other expense offset arrangements and do not represent the amount paid by the class during periods when reimbursements or reductions occur. Expense ratios before reductions for start-up periods may not be representative of longer-term operating periods. Expenses net of fee waivers reflect expenses after reimbursement by the investment adviser but prior to reductions from brokerage service arrangements or other expense offset arrangements. Expenses net of all reductions represent the net expenses paid by the class.
H Amount represents less than $.01 per share.
See accompanying notes which are an integral part of the financial statements.
Annual Report
Financial Highlights - Total International Equity
Years ended October 31, | 2012 | 2011 | 2010 | 2009 | 2008 E |
Selected Per-Share Data | | | | |
Net asset value, beginning of period | $ 6.69 | $ 7.37 | $ 6.41 | $ 4.91 | $ 10.00 |
Income from Investment Operations | | | | | |
Net investment income (loss) B | .15 | .12 | .09 | .07 | .13 |
Net realized and unrealized gain (loss) | .58 | (.68) | .96 | 1.55 | (5.21) |
Total from investment operations | .73 | (.56) | 1.05 | 1.62 | (5.08) |
Distributions from net investment income | (.10) | (.10) | (.06) | (.12) | (.01) |
Distributions from net realized gain | - | (.02) | (.03) | - | - |
Total distributions | (.10) | (.12) | (.09) | (.12) | (.01) |
Redemption fees added to paid in capital B, G | - | - | - | - | - |
Net asset value, end of period | $ 7.32 | $ 6.69 | $ 7.37 | $ 6.41 | $ 4.91 |
Total Return A | 11.03% | (7.70)% | 16.45% | 34.23% | (50.87)% |
Ratios to Average Net Assets C, F | | | | |
Expenses before reductions | 1.16% | 1.42% | 1.79% | 1.87% | 1.89% |
Expenses net of fee waivers, if any | 1.16% | 1.20% | 1.25% | 1.25% | 1.25% |
Expenses net of all reductions | 1.13% | 1.17% | 1.22% | 1.22% | 1.23% |
Net investment income (loss) | 2.16% | 1.69% | 1.40% | 1.38% | 1.60% |
Supplemental Data | | | | |
Net assets, end of period (000 omitted) | $ 281,979 | $ 131,338 | $ 60,826 | $ 33,061 | $ 23,226 |
Portfolio turnover rate D | 110% | 75% | 67% | 98% | 91% |
A Total returns would have been lower if certain expenses had not been reduced during the applicable periods shown.
B Calculated based on average shares outstanding during the period.
C Fees and expenses of any underlying Fidelity Central Funds are not included in the Fund's expense ratio. The Fund indirectly bears its proportionate share of the expenses of any underlying Fidelity Central Funds.
D Amount does not include the portfolio activity of any underlying Fidelity Central Funds.
E For the period November 1, 2007 (commencement of operations) to October 31, 2008.
F Expense ratios reflect operating expenses of the class. Expenses before reductions do not reflect amounts reimbursed by the investment adviser or reductions from brokerage service arrangements or reductions from other expense offset arrangements and do not represent the amount paid by the class during periods when reimbursements or reductions occur. Expense ratios before reductions for start-up periods may not be representative of longer-term operating periods. Expenses net of fee waivers reflect expenses after reimbursement by the investment adviser but prior to reductions from brokerage service arrangements or other expense offset arrangements. Expenses net of all reductions represent the net expenses paid by the class.
G Amount represents less than $.01 per share.
See accompanying notes which are an integral part of the financial statements.
Annual Report
Financial Highlights - Institutional Class
Years ended October 31, | 2012 | 2011 | 2010 | 2009 | 2008 E |
Selected Per-Share Data | | | | |
Net asset value, beginning of period | $ 6.67 | $ 7.35 | $ 6.41 | $ 4.91 | $ 10.00 |
Income from Investment Operations | | | | | |
Net investment income (loss) B | .14 | .12 | .10 | .07 | .13 |
Net realized and unrealized gain (loss) | .59 | (.68) | .95 | 1.55 | (5.21) |
Total from investment operations | .73 | (.56) | 1.05 | 1.62 | (5.08) |
Distributions from net investment income | (.10) | (.10) | (.08) | (.12) | (.01) |
Distributions from net realized gain | - | (.02) | (.03) | - | - |
Total distributions | (.10) | (.12) | (.11) | (.12) | (.01) |
Redemption fees added to paid in capital B, G | - | - | - | - | - |
Net asset value, end of period | $ 7.30 | $ 6.67 | $ 7.35 | $ 6.41 | $ 4.91 |
Total Return A | 11.06% | (7.72)% | 16.48% | 34.23% | (50.87)% |
Ratios to Average Net Assets C, F | | | | |
Expenses before reductions | 1.27% | 1.48% | 1.82% | 1.80% | 1.91% |
Expenses net of fee waivers, if any | 1.20% | 1.20% | 1.25% | 1.25% | 1.25% |
Expenses net of all reductions | 1.17% | 1.17% | 1.23% | 1.22% | 1.23% |
Net investment income (loss) | 2.13% | 1.69% | 1.40% | 1.38% | 1.60% |
Supplemental Data | | | | |
Net assets, end of period (000 omitted) | $ 1,514 | $ 197 | $ 28 | $ 1,308 | $ 2,733 |
Portfolio turnover rate D | 110% | 75% | 67% | 98% | 91% |
A Total returns would have been lower if certain expenses had not been reduced during the applicable periods shown.
B Calculated based on average shares outstanding during the period.
C Fees and expenses of any underlying Fidelity Central Funds are not included in the Fund's expense ratio. The Fund indirectly bears its proportionate share of the expenses of any underlying Fidelity Central Funds.
D Amount does not include the portfolio activity of any underlying Fidelity Central Funds.
E For the period November 1, 2007 (commencement of operations) to October 31, 2008.
F Expense ratios reflect operating expenses of the class. Expenses before reductions do not reflect amounts reimbursed by the investment adviser or reductions from brokerage service arrangements or reductions from other expense offset arrangements and do not represent the amount paid by the class during periods when reimbursements or reductions occur. Expense ratios before reductions for start-up periods may not be representative of longer-term operating periods. Expenses net of fee waivers reflect expenses after reimbursement by the investment adviser but prior to reductions from brokerage service arrangements or other expense offset arrangements. Expenses net of all reductions represent the net expenses paid by the class.
G Amount represents less than $.01 per share.
See accompanying notes which are an integral part of the financial statements.
Annual Report
Notes to Financial Statements
For the period ended October 31, 2012
1. Organization.
Fidelity Total International Equity Fund (the Fund) is a fund of Fidelity Investment Trust (the Trust) and is authorized to issue an unlimited number of shares. The Trust is registered under the Investment Company Act of 1940, as amended (the 1940 Act), as an open-end management investment company organized as a Massachusetts business trust. The Fund offers Class A, Class T, Class C, Total International Equity and Institutional Class shares, each of which, along with Class B shares, has equal rights as to assets and voting privileges. Effective after the close of business on September 1, 2010, Class B shares were closed to new accounts and additional purchases, except for exchanges and reinvestments. Each class has exclusive voting rights with respect to matters that affect that class. Class B shares will automatically convert to Class A shares after a holding period of seven years from the initial date of purchase. Investment income, realized and unrealized capital gains and losses, the common expenses of the Fund, and certain fund-level expense reductions, if any, are allocated on a pro-rata basis to each class based on the relative net assets of each class to the total net assets of the Fund. Each class differs with respect to transfer agent and distribution and service plan fees incurred. Certain expense reductions may also differ by class. The Fund's investments in emerging markets can be subject to social, economic, regulatory, and political uncertainties and can be extremely volatile.
2. Investments in Fidelity Central Funds.
The Fund invests in Fidelity Central Funds, which are open-end investment companies available only to other investment companies and accounts managed by Fidelity Management & Research Company (FMR) and its affiliates. The Fund's Schedule of Investments lists each of the Fidelity Central Funds held as of period end, if any, as an investment of the Fund, but does not include the underlying holdings of each Fidelity Central Fund. As an Investing Fund, the Fund indirectly bears its proportionate share of the expenses of the underlying Fidelity Central Funds.
The Money Market Central Funds seek preservation of capital and current income and are managed by Fidelity Investments Money Management, Inc. (FIMM), an affiliate of FMR.
A complete unaudited list of holdings for each Fidelity Central Fund is available upon request or at the Securities and Exchange Commission (the SEC) web site at www.sec.gov. In addition, the financial statements of the Fidelity Central Funds, which are not covered by the Fund's Report of Independent Registered Public Accounting Firm, are available on the SEC web site or upon request.
Annual Report
Notes to Financial Statements - continued
3. Significant Accounting Policies.
The financial statements have been prepared in conformity with accounting principles generally accepted in the United States of America (GAAP), which require management to make certain estimates and assumptions at the date of the financial statements. Actual results could differ from those estimates. Subsequent events, if any, through the date that the financial statements were issued have been evaluated in the preparation of the financial statements. The following summarizes the significant accounting policies of the Fund:
Security Valuation. Investments are valued as of 4:00 p.m. Eastern time on the last calendar day of the period. In accordance with valuation policies and procedures approved by the Board of Trustees (the Board), the Fund attempts to obtain prices from one or more third party pricing vendors or brokers to value its investments. When current market prices, quotations or rates are not readily available or reliable, securities will be fair valued in good faith by the FMR Fair Value Committee (the Committee), in accordance with procedures adopted by the Fund's Board. Factors used in determining fair value vary by security type and may include market or security specific events. The frequency with which these procedures are used cannot be predicted and they may be utilized to a significant extent. The Committee oversees the Fund's valuation policies and procedures and is responsible for approving and reporting to the Board all fair value determinations.
The Fund categorizes the inputs to valuation techniques used to value its investments into a disclosure hierarchy consisting of three levels as shown below:
Level 1 - quoted prices in active markets for identical investments
Level 2 - other significant observable inputs (including quoted prices for similar investments, interest rates, prepayment speeds, etc.)
Level 3 - unobservable inputs (including the Fund's own assumptions based on the best information available)
Valuation techniques used to value the Fund's investments by major category are as follows:
Equity securities, including restricted securities, for which market quotations are readily available, are valued at the last reported sale price or official closing price as reported by a third party pricing vendor on the primary market or exchange on which they are traded and are categorized as Level 1 in the hierarchy. In the event there were no sales during the day or closing prices are not available, securities are valued at the last quoted bid price or may be valued using the last available price and are generally categorized as Level 2 in the hierarchy. For foreign equity securities, when significant market or security specific events arise, comparisons to the valuation of American Depositary Receipts
Annual Report
3. Significant Accounting Policies - continued
Security Valuation - continued
(ADRs), futures contracts, Exchange-Traded Funds (ETFs) and certain indexes as well as quoted prices for similar securities are used and are categorized as Level 2 in the hierarchy. Utilizing these techniques may result in transfers between Level 1 and Level 2.
Investments in open-end mutual funds, including the Fidelity Central Funds, are valued at their closing net asset value (NAV) each business day and are categorized as Level 1 in the hierarchy.
Changes in valuation techniques may result in transfers in or out of an assigned level within the disclosure hierarchy. The aggregate value of investments by input level, as of October 31, 2012, including information on transfers between Levels 1 and 2, is included at the end of the Fund's Schedule of Investments.
Foreign Currency Translation. The Fund may use foreign currency contracts to facilitate transactions in foreign-denominated securities. Gains and losses from these transactions may arise from changes in the value of the foreign currency or if the counterparties do not perform under the contracts' terms.
Foreign-denominated assets, including investment securities, and liabilities are translated into U.S. dollars at the exchange rates at period end. Purchases and sales of investment securities, income and dividends received and expenses denominated in foreign currencies are translated into U.S. dollars at the exchange rate in effect on the transaction date.
The effects of exchange rate fluctuations on investments are included with the net realized and unrealized gain (loss) on investment securities. Other foreign currency transactions resulting in realized and unrealized gain (loss) are disclosed separately.
Investment Transactions and Income. For financial reporting purposes, the Fund's investment holdings and NAV include trades executed through the end of the last business day of the period. The NAV per share for processing shareholder transactions is calculated as of the close of business of the New York Stock Exchange (NYSE), normally 4:00 p.m. Eastern time and includes trades executed through the end of the prior business day. Gains and losses on securities sold are determined on the basis of identified cost and may include proceeds received from litigation. Dividend income is recorded on the ex-dividend date, except for certain dividends from foreign securities where the ex-dividend date may have passed, which are recorded as soon as the Fund is informed of the ex-dividend date. Non-cash dividends included in dividend income, if any, are recorded at the fair market value of the securities received. Distributions received on securities that represent a return of capital or capital gain are recorded as a reduction of cost of investments and/or as a realized gain. The Fund estimates the components of
Annual Report
Notes to Financial Statements - continued
3. Significant Accounting Policies - continued
Investment Transactions and Income - continued
distributions received that may be considered return of capital distributions or capital gain distributions. Interest income and distributions from the Fidelity Central Funds are accrued as earned. Interest income includes coupon interest and amortization of premium and accretion of discount on debt securities. Investment income is recorded net of foreign taxes withheld where recovery of such taxes is uncertain.
Expenses. Expenses directly attributable to a fund are charged to that fund. Expenses attributable to more than one fund are allocated among the respective funds on the basis of relative net assets or other appropriate methods. Expense estimates are accrued in the period to which they relate and adjustments are made when actual amounts are known.
Income Tax Information and Distributions to Shareholders. Each year, the Fund intends to qualify as a regulated investment company under Subchapter M of the Internal Revenue Code, including distributing substantially all of its taxable income and realized gains. As a result, no provision for income taxes is required. As of October 31, 2012, the Fund did not have any unrecognized tax benefits in the financial statements; nor is the Fund aware of any tax positions for which it is reasonably possible that the total amounts of unrecognized tax benefits will significantly change in the next twelve months. The Fund files a U.S. federal tax return, in addition to state and local tax returns as required. A fund's federal income tax returns are subject to examination by the Internal Revenue Service (IRS) for a period of three fiscal years after they are filed. State and local tax returns may be subject to examination for an additional fiscal year depending on the jurisdiction. Foreign taxes are provided for based on the Fund's understanding of the tax rules and rates that exist in the foreign markets in which it invests. The Fund is subject to a tax imposed on capital gains by certain countries in which it invests. An estimated deferred tax liability for net unrealized appreciation on the applicable securities is included in Other payables and accrued expenses on the Statement of Assets & Liabilities.
Distributions are declared and recorded on the ex-dividend date. Income dividends and capital gain distributions are declared separately for each class. Income and capital gain distributions are determined in accordance with income tax regulations, which may differ from GAAP.
Capital accounts within the financial statements are adjusted for permanent book-tax differences. These adjustments have no impact on net assets or the results of operations. Temporary book-tax differences will reverse in a subsequent period.
Book-tax differences are primarily due to foreign currency transactions, passive foreign investment companies (PFIC), partnerships, capital loss carryforwards and losses deferred due to wash sales.
Annual Report
3. Significant Accounting Policies - continued
Income Tax Information and Distributions to Shareholders - continued
The federal tax cost of investment securities and unrealized appreciation (depreciation) as of period end were as follows:
Gross unrealized appreciation | $ 27,195,779 |
Gross unrealized depreciation | (13,448,638) |
Net unrealized appreciation (depreciation) on securities and other investments | $ 13,747,141 |
| |
Tax Cost | $ 282,189,094 |
The tax-based components of distributable earnings as of period end were as follows:
Undistributed ordinary income | $ 14,696,955 |
Undistributed long-term capital gain | $ 309,806 |
Capital loss carryforward | $ (31,534,827) |
Net unrealized appreciation (depreciation) | $ 13,734,792 |
Capital loss carryforwards are only available to offset future capital gains of the Fund to the extent provided by regulations and may be limited. Under the Regulated Investment Company Modernization Act of 2010 (the Act), the Fund is permitted to carry forward capital losses incurred in taxable years beginning after December 22, 2010 for an unlimited period and such capital losses are required to be used prior to any losses that expire. Capital loss carryforwards were as follows:
Fiscal year of expiration | |
2016 | $ (6,969,886) |
2017 | (15,708,944) |
2019 | (8,855,997) |
Total capital loss carryforward | $ (31,534,827) |
As a result of a large subscription in December 2011, the Fund had an "ownership change" under the Internal Revenue Code, which limits capital losses that will be available to offset future capital gains to approximately $4,535,766 per year plus certain gains in the Fund existing at the time of the ownership change. As a result, at least $1,623,551 of the Fund's capital loss carryforward will expire unused and is not included in the capital loss carryforward amounts disclosed above.
The tax character of distributions paid was as follows:
| October 31, 2012 | October 31, 2011 |
Ordinary Income | $ 1,867,192 | $ 1,173,335 |
Annual Report
Notes to Financial Statements - continued
3. Significant Accounting Policies - continued
Short-Term Trading (Redemption) Fees. Shares held by investors in the Fund less than 30 days are subject to a redemption fee equal to 1.00% of the net asset value of shares redeemed. All redemption fees, which reduce the proceeds of the shareholder redemption, are retained by the Fund and accounted for as an addition to paid in capital.
New Accounting Pronouncement. In December 2011, the Financial Accounting Standards Board issued Accounting Standard Update No. 2011-11, Disclosures about Offsetting Assets and Liabilities. The update creates new disclosure requirements requiring entities to disclose both gross and net information for derivatives and other financial instruments that are either offset in the Statement of Assets and Liabilities or subject to an enforceable master netting arrangement or similar agreement. The disclosure requirements are effective for annual reporting periods beginning on or after January 1, 2013, and interim periods within those annual periods. Management is currently evaluating the impact of the update's adoption on the Fund's financial statement disclosures.
4. Purchases and Sales of Investments.
Purchases and sales of securities, other than short-term securities, aggregated $402,947,967 and $277,094,245, respectively.
5. Fees and Other Transactions with Affiliates.
Management Fee. FMR and its affiliates provide the Fund with investment management related services for which the Fund pays a monthly management fee. The management fee is the sum of an individual fund fee rate that is based on an annual rate of .45% of the Fund's average net assets and an annualized group fee rate that averaged .26% during the period. The group fee rate is based upon the average net assets of all the mutual funds advised by FMR. The group fee rate decreases as assets under management increase and increases as assets under management decrease. In addition, the management fee is subject to a performance adjustment (up to a maximum of ± .20% of the Fund's average net assets over a 36 month performance period). The upward or downward adjustment to the management fee is based on the relative investment performance of Total International Equity as compared to an appropriate benchmark index. For the period, the total annual management fee rate, including the performance adjustment, was .75% of the Fund's average net assets.
Distribution and Service Plan Fees. In accordance with Rule 12b-1 of the 1940 Act, the Fund has adopted separate Distribution and Service Plans for each class of shares. Certain classes pay Fidelity Distributors Corporation (FDC), an affiliate of FMR, separate Distribution and Service Fees, each of which is based on an annual percentage of each class' average net assets. In addition, FDC may pay financial intermediaries for
Annual Report
5. Fees and Other Transactions with Affiliates - continued
Distribution and Service Plan Fees - continued
selling shares of the Fund and providing shareholder support services. For the period, the Distribution and Service Fee rates, total fees and amounts retained by FDC were as follows:
| Distribution
Fee | Service
Fee | Total Fees | Retained
by FDC |
Class A | -% | .25% | $ 12,621 | $ 968 |
Class T | .25% | .25% | 6,560 | 86 |
Class B | .75% | .25% | 2,453 | 1,851 |
Class C | .75% | .25% | 22,971 | 2,990 |
| | | $ 44,605 | $ 5,895 |
Sales Load. FDC may receive a front-end sales charge of up to 5.75% for selling Class A shares and 3.50% for selling Class T shares, some of which is paid to financial intermediaries for selling shares of the Fund. Depending on the holding period, FDC may receive contingent deferred sales charges levied on Class A, Class T, Class B, and Class C redemptions. The deferred sales charges range from 5.00% to 1.00% for Class B shares, 1.00% for Class C shares, 1.00% for certain purchases of Class A shares and .25% for certain purchases of Class T shares.
For the period, sales charge amounts retained by FDC were as follows:
| Retained
by FDC |
Class A | $ 3,215 |
Class T | 893 |
Class B* | 362 |
Class C* | 249 |
| $ 4,719 |
* When Class B and Class C shares are initially sold, FDC pays commissions from its own resources to financial intermediaries through which the sales are made.
Transfer Agent Fees. Fidelity Investments Institutional Operations Company, Inc. (FIIOC), an affiliate of FMR, is the transfer, dividend disbursing and shareholder servicing agent for each class of the Fund. FIIOC receives account fees and asset-based fees that vary according to the account size and type of account of the shareholders of the respective classes of the Fund. FIIOC pays for typesetting, printing and mailing of
Annual Report
Notes to Financial Statements - continued
5. Fees and Other Transactions with Affiliates - continued
Transfer Agent Fees - continued
shareholder reports, except proxy statements. For the period, transfer agent fees for each class were as follows:
| Amount | % of
Average
Net Assets |
Class A | $ 15,172 | .30 |
Class T | 4,212 | .32 |
Class B | 743 | .30 |
Class C | 6,965 | .30 |
Total International Equity | 375,719 | .15 |
Institutional Class | 1,891 | .29 |
| $ 404,702 | |
Accounting and Security Lending Fees. Fidelity Service Company, Inc. (FSC), an affiliate of FMR, maintains the Fund's accounting records. The accounting fee is based on the level of average net assets for each month. Under a separate contract, FSC administers the security lending program. The security lending fee is based on the number and duration of lending transactions.
Brokerage Commissions. The Fund placed a portion of its portfolio transactions with brokerage firms which are affiliates of the investment adviser. The commissions paid to these affiliated firms were $1,696 for the period.
Interfund Lending Program. Pursuant to an Exemptive Order issued by the SEC, the Fund, along with other registered investment companies having management contracts with FMR, may participate in an interfund lending program. This program provides an alternative credit facility allowing the funds to borrow from, or lend money to, other participating affiliated funds. At period end, there were no interfund loans outstanding. The Fund's activity in this program during the period for which loans were outstanding was as follows:
Borrower or Lender | Average Loan
Balance | Weighted Average
Interest Rate | Interest
Expense |
Borrower | $ 6,692,667 | .38% | $ 212 |
6. Committed Line of Credit.
The Fund participates with other funds managed by FMR or an affiliate in a $4.25 billion credit facility (the "line of credit") to be utilized for temporary or emergency purposes to fund shareholder redemptions or for other short-term liquidity purposes. The Fund has agreed to pay commitment fees on its pro-rata portion of the line of credit, which
Annual Report
6. Committed Line of Credit - continued
amounted to $670 and is reflected in Miscellaneous expenses on the Statement of Operations. During the period, there were no borrowings on this line of credit.
7. Security Lending.
The Fund lends portfolio securities through a lending agent from time to time in order to earn additional income. For equity securities, a lending agent is used and may loan securities to certain qualified borrowers, including Fidelity Capital Markets (FCM), a broker-dealer affiliated with the Fund. On the settlement date of the loan, the Fund receives collateral (in the form of U.S. Treasury obligations, letters of credit and/or cash) against the loaned securities and maintains collateral in an amount not less than 100% of the market value of the loaned securities during the period of the loan. The market value of the loaned securities is determined at the close of business of the Fund and any additional required collateral is delivered to the Fund on the next business day. If the borrower defaults on its obligation to return the securities loaned because of insolvency or other reasons, a fund could experience delays and costs in recovering the securities loaned or in gaining access to the collateral. Any cash collateral received is invested in the Fidelity Securities Lending Cash Central Fund. Security lending income represents the income earned on investing cash collateral, less rebates paid to borrowers and any lending agent fees associated with the loan, plus any premium payments received for lending certain types of securities. Security lending income is presented in the Statement of Operations as a component of income from Fidelity Central Funds. Total security lending income during the period amounted to $151,487. During the period, there were no securities loaned to FCM.
8. Expense Reductions.
FMR contractually agreed to reimburse each class to the extent annual operating expenses exceeded certain levels of average net assets as noted in the table below. This reimbursement will remain in place through December 31, 2013. Some expenses, for example interest expense, including commitment fees, are excluded from this reimbursement.
The following classes were in reimbursement during the period:
| Expense
Limitations | Reimbursement
from adviser |
Class A | 1.45% | $ 5,921 |
Class T | 1.70% | 1,880 |
Class B | 2.20% | 335 |
Class C | 2.20% | 2,543 |
Institutional Class | 1.20% | 416 |
| | $ 11,095 |
Annual Report
Notes to Financial Statements - continued
8. Expense Reductions - continued
Many of the brokers with whom FMR places trades on behalf of the Fund provided services to the Fund in addition to trade execution. These services included payments of certain expenses on behalf of the Fund totaling $85,477 for the period.
9. Distributions to Shareholders.
Distributions to shareholders of each class were as follows:
Years ended October 31, | 2012 | 2011 |
From net investment income | | |
Class A | $ 48,329 | $ 61,018 |
Class T | 9,062 | 9,414 |
Class B | 714 | 1,488 |
Class C | 4,731 | 6,263 |
Total International Equity | 1,801,469 | 873,280 |
Institutional Class | 2,887 | 1,578 |
Total | $ 1,867,192 | $ 953,041 |
From net realized gain | | |
Class A | $ - | $ 16,196 |
Class T | - | 3,213 |
Class B | - | 1,016 |
Class C | - | 4,485 |
Total International Equity | - | 195,026 |
Institutional Class | - | 358 |
Total | $ - | $ 220,294 |
10. Share Transactions.
Transactions for each class of shares were as follows:
| Shares | Dollars |
Years ended October 31, | 2012 | 2011 | 2012 | 2011 |
Class A | | | | |
Shares sold | 388,955 | 231,083 | $ 2,677,369 | $ 1,708,687 |
Reinvestment of distributions | 7,157 | 10,039 | 46,237 | 74,076 |
Shares redeemed | (252,362) | (279,366) | (1,699,392) | (2,035,449) |
Net increase (decrease) | 143,750 | (38,244) | $ 1,024,214 | $ (252,686) |
Class T | | | | |
Shares sold | 207,939 | 37,121 | $ 1,463,372 | $ 276,509 |
Reinvestment of distributions | 1,377 | 1,678 | 8,993 | 12,524 |
Shares redeemed | (38,757) | (25,970) | (259,817) | (191,826) |
Net increase (decrease) | 170,559 | 12,829 | $ 1,212,548 | $ 97,207 |
Annual Report
10. Share Transactions - continued
| Shares | Dollars |
Years ended October 31, | 2012 | 2011 | 2012 | 2011 |
Class B | | | | |
Shares sold | 4,797 | 3,282 | $ 32,306 | $ 24,631 |
Reinvestment of distributions | 108 | 331 | 705 | 2,469 |
Shares redeemed | (12,955) | (9,973) | (88,815) | (73,676) |
Net increase (decrease) | (8,050) | (6,360) | $ (55,804) | $ (46,576) |
Class C | | | | |
Shares sold | 258,694 | 66,879 | $ 1,733,640 | $ 498,161 |
Reinvestment of distributions | 710 | 1,425 | 4,622 | 10,610 |
Shares redeemed | (94,222) | (52,554) | (638,538) | (388,669) |
Net increase (decrease) | 165,182 | 15,750 | $ 1,099,724 | $ 120,102 |
Total International Equity | | | | |
Shares sold | 32,478,543 | 16,784,298 | $ 209,916,522 | $ 125,543,898 |
Reinvestment of distributions | 266,160 | 135,624 | 1,719,395 | 1,000,533 |
Shares redeemed | (13,867,286) | (5,532,363) | (93,416,780) | (39,913,646) |
Net increase (decrease) | 18,877,417 | 11,387,559 | $ 118,219,137 | $ 86,630,785 |
Institutional Class | | | | |
Shares sold | 198,611 | 26,909 | $ 1,289,078 | $ 202,383 |
Reinvestment of distributions | 448 | 263 | 2,887 | 1,936 |
Shares redeemed | (21,161) | (1,422) | (144,436) | (10,588) |
Net increase (decrease) | 177,898 | 25,750 | $ 1,147,529 | $ 193,731 |
11. Other.
The Fund's organizational documents provide former and current trustees and officers with a limited indemnification against liabilities arising in connection with the performance of their duties to the Fund. In the normal course of business, the Fund may also enter into contracts that provide general indemnifications. The Fund's maximum exposure under these arrangements is unknown as this would be dependent on future claims that may be made against the Fund. The risk of material loss from such claims is considered remote.
At the end of the period, a shareholder of record owned approximately 65% of the total outstanding shares of the Fund.
Annual Report
To the Trustees of Fidelity Investment Trust and Shareholders of Fidelity Total International Equity Fund:
We have audited the accompanying statement of assets and liabilities of Fidelity Total International Equity Fund (the Fund), a fund of Fidelity Investment Trust, including the schedule of investments, as of October 31, 2012, and the related statement of operations for the year then ended, the statement of changes in net assets for each of the two years in the period then ended, and the financial highlights for each of the five years in the period then ended. These financial statements and financial highlights are the responsibility of the Fund's management. Our responsibility is to express an opinion on these financial statements and financial highlights based on our audits.
We conducted our audits in accordance with the standards of the Public Company Accounting Oversight Board (United States). Those standards require that we plan and perform the audit to obtain reasonable assurance about whether the financial statements and financial highlights are free of material misstatement. The Fund is not required to have, nor were we engaged to perform, an audit of its internal control over financial reporting. Our audits included consideration of internal control over financial reporting as a basis for designing audit procedures that are appropriate in the circumstances, but not for the purpose of expressing an opinion on the effectiveness of the Fund's internal control over financial reporting. Accordingly, we express no such opinion. An audit also includes examining, on a test basis, evidence supporting the amounts and disclosures in the financial statements, assessing the accounting principles used and significant estimates made by management, as well as evaluating the overall financial statement presentation. Our procedures included confirmation of securities owned as of October 31, 2012, by correspondence with the custodians and brokers; where replies were not received from brokers, we performed other auditing procedures. We believe that our audits provide a reasonable basis for our opinion.
In our opinion, the financial statements and financial highlights referred to above present fairly, in all material respects, the financial position of Fidelity Total International Equity Fund as of October 31, 2012, the results of its operations for the year then ended, the changes in its net assets for each of the two years in the period then ended, and the financial highlights for each of the five years in the period then ended, in conformity with accounting principles generally accepted in the United States of America.
DELOITTE & TOUCHE LLP
Boston, Massachusetts
December 14, 2012
Annual Report
The Trustees, Members of the Advisory Board, and executive officers of the trust and fund, as applicable, are listed below. The Board of Trustees governs the fund and is responsible for protecting the interests of shareholders. The Trustees are experienced executives who meet periodically throughout the year to oversee the fund's activities, review contractual arrangements with companies that provide services to the fund, oversee management of the risks associated with such activities and contractual arrangements, and review the fund's performance. Except for James C. Curvey, each of the Trustees oversees 236 funds advised by FMR or an affiliate. Mr. Curvey oversees 443 funds advised by FMR or an affiliate.
The Trustees hold office without limit in time except that (a) any Trustee may resign; (b) any Trustee may be removed by written instrument, signed by at least two-thirds of the number of Trustees prior to such removal; (c) any Trustee who requests to be retired or who has become incapacitated by illness or injury may be retired by written instrument signed by a majority of the other Trustees; and (d) any Trustee may be removed at any special meeting of shareholders by a two-thirds vote of the outstanding voting securities of the trust. Each Trustee who is not an interested person (as defined in the 1940 Act) (Independent Trustee), shall retire not later than the last day of the calendar year in which his or her 75th birthday occurs. The Independent Trustees may waive this mandatory retirement age policy with respect to individual Trustees. The executive officers and Advisory Board Members hold office without limit in time, except that any officer and Advisory Board Member may resign or may be removed by a vote of a majority of the Trustees at any regular meeting or any special meeting of the Trustees. Except as indicated, each individual has held the office shown or other offices in the same company for the past five years.
Experience, Skills, Attributes, and Qualifications of the Fund's Trustees. The Governance and Nominating Committee has adopted a statement of policy that describes the experience, qualifications, attributes, and skills that are necessary and desirable for potential Independent Trustee candidates (Statement of Policy). The Board believes that each Trustee satisfied at the time he or she was initially elected or appointed a Trustee, and continues to satisfy, the standards contemplated by the Statement of Policy. The Governance and Nominating Committee also engages professional search firms to help identify potential Independent Trustee candidates who have the experience, qualifications, attributes, and skills consistent with the Statement of Policy. From time to time, additional criteria based on the composition and skills of the current Independent Trustees, as well as experience or skills that may be appropriate in light of future changes to board composition, business conditions, and regulatory or other developments, have also been considered by the professional search firms and the Governance and Nominating Committee. In addition, the Board takes into account the Trustees' commitment and participation in Board and committee meetings, as well as their leadership of standing and ad hoc committees throughout their tenure.
In determining that a particular Trustee was and continues to be qualified to serve as a Trustee, the Board has considered a variety of criteria, none of which, in isolation, was controlling. The Board believes that, collectively, the Trustees have balanced and diverse experience, qualifications, attributes, and skills, which allow the Board to operate effectively in governing the fund and protecting the interests of shareholders. Information about the specific experience, skills, attributes, and qualifications of each Trustee, which in each case led to the Board's conclusion that the Trustee should serve (or continue to serve) as a trustee of the fund, is provided below.
Annual Report
Trustees and Officers - continued
Board Structure and Oversight Function. James C. Curvey is an interested person (as defined in the 1940 Act) and currently serves as Chairman. The Trustees have determined that an interested Chairman is appropriate and benefits shareholders because an interested Chairman has a personal and professional stake in the quality and continuity of services provided to the fund. Independent Trustees exercise their informed business judgment to appoint an individual of their choosing to serve as Chairman, regardless of whether the Trustee happens to be independent or a member of management. The Independent Trustees have determined that they can act independently and effectively without having an Independent Trustee serve as Chairman and that a key structural component for assuring that they are in a position to do so is for the Independent Trustees to constitute a substantial majority for the Board. The Independent Trustees also regularly meet in executive session. Ned C. Lautenbach serves as Chairman of the Independent Trustees and as such (i) acts as a liaison between the Independent Trustees and management with respect to matters important to the Independent Trustees and (ii) with management prepares agendas for Board meetings.
Fidelity funds are overseen by different Boards of Trustees. The fund's Board oversees Fidelity's equity and high income funds and another Board oversees Fidelity's investment-grade bond, money market, and asset allocation funds. The asset allocation funds may invest in Fidelity funds overseen by the fund's Board. The use of separate Boards, each with its own committee structure, allows the Trustees of each group of Fidelity funds to focus on the unique issues of the funds they oversee, including common research, investment, and operational issues. On occasion, the separate Boards establish joint committees to address issues of overlapping consequences for the Fidelity funds overseen by each Board.
The Trustees operate using a system of committees to facilitate the timely and efficient consideration of all matters of importance to the Trustees, the fund, and fund shareholders and to facilitate compliance with legal and regulatory requirements and oversight of the fund's activities and associated risks. The Board, acting through its committees, has charged FMR and its affiliates with (i) identifying events or circumstances the occurrence of which could have demonstrably adverse effects on the fund's business and/or reputation; (ii) implementing processes and controls to lessen the possibility that such events or circumstances occur or to mitigate the effects of such events or circumstances if they do occur; and (iii) creating and maintaining a system designed to evaluate continuously business and market conditions in order to facilitate the identification and implementation processes described in (i) and (ii) above. Because the day-to-day operations and activities of the fund are carried out by or through FMR, its affiliates and other service providers, the fund's exposure to risks is mitigated but not eliminated by the processes overseen by the Trustees. While each of the Board's committees has responsibility for overseeing different aspects of the fund's activities, oversight is exercised primarily through the Operations, Audit, and Compliance Committees. In addition, the Independent Trustees have worked with FMR to enhance the Board's oversight of investment and financial risks, legal and regulatory risks, technology risks, and operational risks, including the development of additional risk reporting to the Board. For example, a working group comprised of Independent Trustees and FMR has worked and continues to work to review the Fidelity funds' valuation-related activities, reporting and risk management. Appropriate personnel, including but not limited to the fund's Chief Compliance Officer (CCO), FMR's internal auditor, the independent accountants, the fund's Treasurer and portfolio management personnel, make periodic reports to the Board's committees, as appropriate, including an annual review of FMR's risk management program for the Fidelity funds. The responsibilities of each standing committee, including their oversight responsibilities, are described further under "Standing Committees of the Fund's Trustees."
Annual Report
The fund's Statement of Additional Information (SAI) includes more information about the Trustees. To request a free copy, call Fidelity at 1-877-208-0098.
Interested Trustees*:
Correspondence intended for each Trustee who is an interested person may be sent to Fidelity Investments, 82 Devonshire Street, Boston, Massachusetts 02109.
Name, Age; Principal Occupations and Other Relevant Experience+ |
James C. Curvey (77) |
| Year of Election or Appointment: 2007 Mr. Curvey is Trustee and Chairman of the Board of Trustees of certain Trusts. Mr. Curvey also serves as Trustee (2007-present) of other investment companies advised by FMR. Mr. Curvey is a Director of Fidelity Investments Money Management, Inc. (2009-present), Director of Fidelity Research & Analysis Co. (2009-present) and Director of FMR and FMR Co., Inc. (2007-present). Mr. Curvey is also Vice Chairman (2007-present) and Director of FMR LLC. In addition, Mr. Curvey serves as an Overseer for the Boston Symphony Orchestra and a member of the Trustees of Villanova University. Previously, Mr. Curvey was the Vice Chairman (2006-2007) and Director (2000-2007) of FMR Corp. |
Ronald P. O'Hanley (55) |
| Year of Election or Appointment: 2011 Mr. O'Hanley is Director of FMR Co., Inc. (2010-present), Director of Fidelity Investments Money Management, Inc. (2010-present), Director of Fidelity Research & Analysis Company (2010-present), President of Fidelity Asset Management and Corporate Services and a member of Fidelity's Executive Committee (2010-present). Previously, Mr. O'Hanley served as President and Chief Executive Officer of BNY Mellon Asset Management (2007-2010). Mr. O'Hanley also served as Vice Chairman of Bank New York Mellon Corp. and a member of that firm's Executive Committee. Prior to the 2007 merger of The Bank of New York and Mellon Financial Corporation, he was Vice Chairman of Mellon Financial Corporation and President and Chief Executive Officer of Mellon Asset Management. He joined Mellon in February 1997. Mr. O'Hanley currently serves as Chairman of the Boston Public Library Foundation Board of Directors and sits on the Board of Directors of Beth Israel Deaconess Medical Center, the Board of Trustees of the Marine Biological Laboratory and the Advisory Board of the Maxwell School of Citizenship and Public Administration at Syracuse University. Mr. O'Hanley also chairs the Council on Asset Management for the Financial Services Roundtable and is a member of the Board of Directors of Institutional Investor's U.S. Institute. |
* Trustees have been determined to be "Interested Trustees" by virtue of, among other things, their affiliation with the trust or various entities under common control with FMR.
+ The information above includes each Trustee's principal occupation during the last five years and other information relating to the experience, attributes, and skills relevant to each Trustee's qualifications to serve as a Trustee, which led to the conclusion that each Trustee should serve as a Trustee for the fund.
Annual Report
Independent Trustees:
Correspondence intended for each Independent Trustee (that is, the Trustees other than the Interested Trustees) may be sent to Fidelity Investments, P.O. Box 55235, Boston, Massachusetts 02205-5235.
Name, Age; Principal Occupations and Other Relevant Experience+ |
Dennis J. Dirks (64) |
| Year of Election or Appointment: 2005 Prior to his retirement in May 2003, Mr. Dirks was Chief Operating Officer and a member of the Board of The Depository Trust & Clearing Corporation (DTCC). He also served as President, Chief Operating Officer, and Board member of The Depository Trust Company (DTC) and President and Board member of the National Securities Clearing Corporation (NSCC). In addition, Mr. Dirks served as Chief Executive Officer and Board member of the Government Securities Clearing Corporation, Chief Executive Officer and Board member of the Mortgage-Backed Securities Clearing Corporation, as a Trustee and a member of the Finance Committee of Manhattan College (2005-2008), and as a Trustee and a member of the Finance Committee of AHRC of Nassau County (2006-2008). Mr. Dirks is a member of the Independent Directors Council (IDC) Governing Council (2010-present) and Board of Directors for The Brookville Center for Children's Services, Inc. (2009-present). |
Alan J. Lacy (59) |
| Year of Election or Appointment: 2008 Mr. Lacy serves as Senior Adviser (2007-present) of Oak Hill Capital Partners, L.P. (private equity). Mr. Lacy also served as Chief Executive Officer (2000-2005) and Vice Chairman (2005-2006) of Sears Holdings Corporation and Sears, Roebuck and Co. (retail). In addition, Mr. Lacy serves as a member of the Board of Directors of Dave & Buster's Entertainment, Inc. (restaurant and entertainment complexes, 2010-present), Earth Fare, Inc. (retail grocery, 2012-present), The Hillman Companies, Inc. (hardware wholesalers, 2010-present), and Bristol-Myers Squibb Company (global pharmaceuticals, 2008-present). Mr. Lacy is a member of the Board of Trustees of The National Parks Conservation Association (2006-present). Previously, Mr. Lacy served as Chairman of the Board of Trustees of the National Parks Conservation Association (2008-2011) and as a member of the Board of Directors for the Western Union Company (global money transfer, 2006-2011). |
Ned C. Lautenbach (68) |
| Year of Election or Appointment: 2000 Mr. Lautenbach is Chairman of the Independent Trustees of the Equity and High Income Funds (2006-present). Mr. Lautenbach currently serves as the Lead Director of the Eaton Corporation Board of Directors (diversified industrial, 1997-present). Mr. Lautenbach is Chairman of the Board of Directors of the Philharmonic Center for the Arts in Naples, Florida (2012-present) and a member of the Council on Foreign Relations (1994-present). Previously, Mr. Lautenbach was a Partner/Advisory Partner at Clayton, Dubilier & Rice, LLC (private equity investment, 1998-2010), as well as a Director of Sony Corporation (2006-2007). |
Joseph Mauriello (68) |
| Year of Election or Appointment: 2008 Prior to his retirement in January 2006, Mr. Mauriello served in numerous senior management positions including Deputy Chairman and Chief Operating Officer (2004-2005), and Vice Chairman of Financial Services (2002-2004) of KPMG LLP US (professional services, 1965-2005). Mr. Mauriello currently serves as a member of the Board of Directors of XL Group plc. (global insurance and re-insurance, 2006-present). Previously, Mr. Mauriello served as a Director of the Hamilton Funds of the Bank of New York (2006-2007) and of Arcadia Resources Inc. (health care services and products, 2007-2012). |
Robert W. Selander (62) |
| Year of Election or Appointment: 2011 Previously, Mr. Selander served as a Member of the Advisory Board of Fidelity's Equity and High Income Funds (2011), Executive Vice Chairman (2010), Chief Executive Officer (2009-2010), and President and Chief Executive Officer (1997-2009) of Mastercard, Inc. |
Cornelia M. Small (68) |
| Year of Election or Appointment: 2005 Ms. Small is a member of the Board of Directors (2009-present) and Chair of the Investment Committee (2010-present) of the Teagle Foundation. Ms. Small also serves on the Investment Committee of the Berkshire Taconic Community Foundation (2008-present). Previously, Ms. Small served as Chairperson (2002-2008) and a member of the Investment Committee and Chairperson (2008-2012) and a member of the Board of Trustees of Smith College. In addition, Ms. Small served as Chief Investment Officer, Director of Global Equity Investments, and a member of the Board of Directors of Scudder, Stevens & Clark and Scudder Kemper Investments. |
William S. Stavropoulos (73) |
| Year of Election or Appointment: 2001 Mr. Stavropoulos is Vice Chairman of the Independent Trustees of the Equity and High Income Funds (2006-present). Mr. Stavropoulos serves as President and Founder of the Michigan Baseball Foundation, the Great Lakes Loons (2007-present). Mr. Stavropoulos is Chairman Emeritus of the Board of Directors of The Dow Chemical Company, where he previously served in numerous senior management positions, including President, CEO (1995-2000; 2002-2004), Chairman of the Executive Committee (2000-2006), and as a member of the Board of Directors (1990-2006). Currently, Mr. Stavropoulos is a Director of Univar Inc. (global distributor of commodity and specialty chemicals, Chairman from 2010-May 2012 and Lead Director from May 2012-present), Teradata Corporation (data warehousing and technology solutions, 2008-present), Maersk Inc. (industrial conglomerate), and Tyco International, Ltd. (multinational manufacturing and services, 2007-present), and a member of the Advisory Board for Metalmark Capital LLC (private equity investment, 2005-present). Mr. Stavropoulos is an operating advisor to Clayton, Dubilier & Rice, LLC (private equity investment). In addition, Mr. Stavropoulos is a member of the University of Notre Dame Advisory Council for the College of Science, a Trustee of the Rollin L. Gerstacker Foundation, and a Director of the Naples Philharmonic Center for the Arts. Previously, Mr. Stavropoulos served as a Director of Chemical Financial Corporation (bank holding company, 1993-2012). |
David M. Thomas (63) |
| Year of Election or Appointment: 2008 Previously, Mr. Thomas served as Executive Chairman (2005-2006) and Chairman and Chief Executive Officer (2000-2005) of IMS Health, Inc. (pharmaceutical and healthcare information solutions), and a Director of Fortune Brands, Inc. (consumer products, 2000-2011). In addition, Mr. Thomas serves as Non-Executive Chairman of the Board of Directors of Fortune Brands Home and Security (home and security products, 2011-present), and as a member of the Board of Directors of Interpublic Group of Companies, Inc. (marketing communication, 2004-present). |
Michael E. Wiley (62) |
| Year of Election or Appointment: 2008 Mr. Wiley also serves as a Director of Asia Pacific Exploration Consolidated (international oil and gas exploration and production, 2008-present). Mr. Wiley serves as a Director of Tesoro Corporation (independent oil refiner and marketer, 2005-present), and a Director of Bill Barrett Corporation (exploration and production, 2005-present). In addition, Mr. Wiley also serves as a Director of Post Oak Bank (privately-held bank, 2004-present). Previously, Mr. Wiley served as a member of the Board of Trustees of the University of Tulsa (2000-2006; 2007-2010), as a Senior Energy Advisor of Katzenbach Partners, LLC (consulting, 2006-2007), as an Advisory Director of Riverstone Holdings (private investment), Chairman, President, and CEO of Baker Hughes, Inc. (oilfield services, 2000-2004), and as Director of Spinnaker Exploration Company (exploration and production, 2001-2005). |
+ The information above includes each Trustee's principal occupation during the last five years and other information relating to the experience, attributes, and skills relevant to each Trustee's qualifications to serve as a Trustee, which led to the conclusion that each Trustee should serve as a Trustee for the fund.
Advisory Board Members and Executive Officers:
Correspondence intended for David A. Rosow and Garnett A. Smith may be sent to Fidelity Investments, P.O. Box 55235, Boston, Massachusetts 02205-5235. Correspondence intended for each executive officer, Edward C. Johnson 3d, and Peter S. Lynch may be sent to Fidelity Investments, 82 Devonshire Street, Boston, Massachusetts 02109.
Name, Age; Principal Occupation |
Edward C. Johnson 3d (82) |
| Year of Election or Appointment: 2011 Member of the Advisory Board of Fidelity's Equity and High Income Funds. Mr. Johnson serves as Chief Executive Officer, Chairman, and a Director of FMR LLC, and also serves as Chairman and Director of FIL Limited. Previously, Mr. Johnson served as a Trustee and Chairman of the Board of certain Fidelity Trusts, Chairman and a Director of FMR, Chairman and a Director of FMR Co., Inc., and President of FMR LLC (2006-2007). |
Peter S. Lynch (68) |
| Year of Election or Appointment: 2003 Member of the Advisory Board of Fidelity's Equity and High Income Funds. Mr. Lynch is Vice Chairman and a Director of FMR and FMR Co., Inc. In addition, Mr. Lynch serves as a Trustee of Boston College and as the Chairman of the Inner-City Scholarship Fund. Previously, Mr. Lynch served on the Special Olympics International Board of Directors (1997-2006). |
David A. Rosow (70) |
| Year of Election or Appointment: 2012 Member of the Advisory Board of Fidelity's Equity and High Income Funds. Chairman and Chief Executive Officer of International Golf Group, Inc. (golf course development, 1989-present). Previously, Mr. Rosow served as Chairman and Chief Executive Officer of Rosow & Company, Inc. (private investment company, 1989-2011), a Lead Director of Hudson United Bancorp (2001-2006) and as a Director of TD Banknorth (1996-2006). In addition, Mr. Rosow is a member (2008-present) and President (2009-present) of the Town Council of Palm Beach, Florida. |
Garnett A. Smith (65) |
| Year of Election or Appointment: 2012 Member of the Advisory Board of Fidelity's Equity and High Income Funds. Prior to Mr. Smith's retirement, he served as Chairman and Chief Executive Officer of Inbrand Corp. (manufacturer of personal absorbent products, 1990-1997). He also served as President (1986-1990) of Inbrand Corp. Prior to his employment with Inbrand Corp., he was employed by a retail fabric chain and North Carolina National Bank. In addition, Mr. Smith is a board member of the Jackson Hole Land Trust (2009-present). |
Kenneth B. Robins (43) |
| Year of Election or Appointment: 2008 President and Treasurer of Fidelity's Equity and High Income Funds. Mr. Robins also serves as President and Treasurer (2010-present) and Assistant Treasurer (2009-present) of other Fidelity funds and is an employee of Fidelity Investments (2004-present). Previously, Mr. Robins served as Deputy Treasurer of the Fidelity funds (2005-2008) and Treasurer and Chief Financial Officer of The North Carolina Capital Management Trust: Cash and Term Portfolios (2006-2008). |
Bruce T. Herring (47) |
| Year of Election or Appointment: 2006 Vice President of certain Equity Funds. Mr. Herring also serves as President of Fidelity Research & Analysis Company (2010-present), Chief Investment Officer and Director of Fidelity Management & Research (U.K.) Inc. (2010-present) and Group Chief Investment Officer of FMR. Previously, Mr. Herring served as Vice President (2005-2006) and Senior Vice President (2006-2007) of Fidelity Management & Research Company, Vice President of FMR Co., Inc. (2001-2007) and as a portfolio manager for Fidelity U.S. Equity Funds. |
Brian B. Hogan (48) |
| Year of Election or Appointment: 2009 Vice President of Equity and High Income Funds. Mr. Hogan also serves as President of FMR's Equity Division (2009-present). Previously, Mr. Hogan served as Senior Vice President, Equity Research of FMR (2006-2009) and as a portfolio manager. |
Scott C. Goebel (44) |
| Year of Election or Appointment: 2008 Secretary and Chief Legal Officer (CLO) of the Fidelity funds. Mr. Goebel also serves as Secretary of Fidelity Investments Money Management, Inc. (FIMM) (2010-present) and Fidelity Research and Analysis Company (FRAC) (2010-present); Secretary and CLO of The North Carolina Capital Management Trust: Cash and Term Portfolios (2008-present); General Counsel, Secretary, and Senior Vice President of FMR (2008-present) and FMR Co., Inc. (2008-present); employed by FMR LLC or an affiliate (2001-present); Chief Legal Officer of Fidelity Management & Research (Hong Kong) Limited (2008-present) and Assistant Secretary of Fidelity Management & Research (Japan) Inc. (2008-present), and Fidelity Management & Research (U.K.) Inc. (2008-present). Previously, Mr. Goebel served as Assistant Secretary of FIMM (2008-2010), FRAC (2008-2010), and the Funds (2007-2008) and as Vice President and Secretary of Fidelity Distributors Corporation (FDC) (2005-2007). |
William C. Coffey (43) |
| Year of Election or Appointment: 2009 Assistant Secretary of Fidelity's Equity and High Income Funds. Mr. Coffey also serves as Senior Vice President and Deputy General Counsel of FMR LLC (2010-present), and is an employee of Fidelity Investments. Previously, Mr. Coffey served as Vice President and Associate General Counsel of FMR LLC (2005-2009). |
Elizabeth Paige Baumann (44) |
| Year of Election or Appointment: 2012 Anti-Money Laundering (AML) Officer of the Fidelity funds. Ms. Baumann also serves as AML Officer of The North Carolina Capital Management Trust: Cash and Term Portfolios (2012-present), Chief AML Officer of FMR LLC (2012-present), and is an employee of Fidelity Investments. Previously, Ms. Baumann served as Vice President and Deputy Anti-Money Laundering Officer (2007-2012). |
Christine Reynolds (54) |
| Year of Election or Appointment: 2008 Chief Financial Officer of the Fidelity funds. Ms. Reynolds became President of Fidelity Pricing and Cash Management Services (FPCMS) in August 2008. Ms. Reynolds served as Chief Operating Officer of FPCMS (2007-2008). Previously, Ms. Reynolds served as President, Treasurer, and Anti-Money Laundering officer of the Fidelity funds (2004-2007). |
Joseph A. Hanlon (44) |
| Year of Election or Appointment: 2012 Chief Compliance Officer of Fidelity's Equity and High Income Funds. Mr. Hanlon serves as Compliance Officer of FMR, FMR Co., Inc., Fidelity Investments Money Management, Inc. (FIMM), Fidelity Research and Analysis Company (FRAC), Fidelity Management & Research (Japan) Inc., Fidelity Management & Research (U.K.) Inc., Fidelity Management & Research (Hong Kong), and Strategic Advisers, Inc. (2009-present), as Senior Vice President of the Fidelity Asset Management Division (2009-present), and is an employee of Fidelity Investments. |
Joseph F. Zambello (55) |
| Year of Election or Appointment: 2011 Deputy Treasurer of the Fidelity funds. Mr. Zambello is an employee of Fidelity Investments. Previously, Mr. Zambello served as Vice President of FMR's Program Management Group (2009-2011) and Vice President of the Transfer Agent Oversight Group (2005-2009). |
Adrien E. Deberghes (45) |
| Year of Election or Appointment: 2008 Deputy Treasurer of Fidelity's Equity and High Income Funds. Mr. Deberghes also serves as Vice President (2011-present) and Assistant Treasurer (2010-present) of other Fidelity funds, and is an employee of Fidelity Investments (2008-present). Previously, Mr. Deberghes served as Senior Vice President of Mutual Fund Administration at State Street Corporation (2007-2008), Senior Director of Mutual Fund Administration at Investors Bank & Trust (2005-2007), and Director of Finance for Dunkin' Brands (2000-2005). |
Stephen Sadoski (41) |
| Year of Election or Appointment: 2012 Deputy Treasurer of Fidelity's Equity and High Income Funds. Mr. Sadoski also serves as Assistant Treasurer of other Fidelity funds (2012-present) and is an employee of Fidelity Investments (2012-present). Previously, Mr. Sadoski served as an assistant chief accountant in the Division of Investment Management of the Securities and Exchange Commission (SEC) (2009-2012) and as a senior manager at Deloitte & Touche (1997-2009). |
Stephanie J. Dorsey (43) |
| Year of Election or Appointment: 2010 Assistant Treasurer of Fidelity's Equity and High Income Funds. Ms. Dorsey also serves as Deputy Treasurer of other Fidelity funds (2008-present) and is an employee of Fidelity Investments (2008-present). Previously, Ms. Dorsey served as Treasurer (2004-2008) of the JPMorgan Mutual Funds and Vice President (2004-2008) of JPMorgan Chase Bank. |
John R. Hebble (54) |
| Year of Election or Appointment: 2009 Assistant Treasurer of Fidelity's Equity and High Income Funds. Mr. Hebble also serves as President (2011-present), Treasurer, and Chief Financial Officer of The North Carolina Capital Management Trust: Cash and Term Portfolios (2008-present), President and Treasurer of other Fidelity funds (2008-present) and is an employee of Fidelity Investments. |
Gary W. Ryan (54) |
| Year of Election or Appointment: 2005 Assistant Treasurer of the Fidelity funds. Mr. Ryan is an employee of Fidelity Investments. Previously, Mr. Ryan served as Vice President of Fund Reporting in Fidelity Pricing and Cash Management Services (FPCMS) (1999-2005). |
Jonathan Davis (44) |
| Year of Election or Appointment: 2010 Assistant Treasurer of the Fidelity funds. Mr. Davis is also Assistant Treasurer of Fidelity Rutland Square Trust II and Fidelity Commonwealth Trust II. Mr. Davis is an employee of Fidelity Investments. Previously, Mr. Davis served as Vice President and Associate General Counsel of FMR LLC (2003-2010). |
Annual Report
The Board of Trustees of Fidelity Total International Equity Fund voted to pay to shareholders of record at the opening of business on record date, the following distributions per share derived from capital gains realized from sales of portfolio securities, and dividends derived from net investment income:
| Pay Date | Record Date | Dividends | Capital Gains |
Class A | 12/10/12 | 12/07/12 | $0.126 | $0.245 |
| | | | |
Class T | 12/10/12 | 12/07/12 | $0.128 | $0.245 |
| | | | |
Class B | 12/10/12 | 12/07/12 | $0.054 | $0.245 |
| | | | |
Class C | 12/10/12 | 12/07/12 | $0.075 | $0.245 |
The fund hereby designates as a capital gain dividend with respect to the taxable year ended October 31, 2012 $309,806, or, if subsequently determined to be different, the net capital gain of such year.
Class A designates 4%, Class T designates 5%, Class B designates 13% and Class C designates 11% of the dividends distributed during the fiscal year as qualifying for the dividends-received deduction for corporate shareholders.
Class A, Class T, Class B, and Class C designates 100% of the dividends distributed during the fiscal year as amounts which may be taken into account as a dividend for purposes of the maximum rate under section 1(h)(11) of the Internal Revenue Code.
The amounts per share which represent income derived from sources within, and taxes paid to, foreign countries or possessions of the United States are as follows:
| Pay Date | Income | Taxes |
Class A | 12/05/11 | $0.064 | $0.0107 |
| | | |
Class T | 12/05/11 | $0.052 | $0.0107 |
| | | |
Class B | 12/05/11 | $0.022 | $0.0107 |
| | | |
Class C | 12/05/11 | $0.025 | $0.0107 |
The fund will notify shareholders in January 2013 of amounts for use in preparing 2012 income tax returns.
Annual Report
Board Approval of Investment Advisory Contracts and Management Fees
Fidelity Total International Equity Fund
Each year, the Board of Trustees, including the Independent Trustees (together, the Board), votes on the renewal of the management contract and sub-advisory agreements (together, the Advisory Contracts) for the fund. The Board, assisted by the advice of fund counsel and Independent Trustees' counsel, requests and considers a broad range of information relevant to the renewal of the Advisory Contracts throughout the year.
The Board meets regularly and, at each of its meetings, considers factors that are relevant to its annual consideration of the renewal of the fund's Advisory Contracts, including the services and support provided to the fund and its shareholders. The Board has established various standing committees, each composed of and chaired by Independent Trustees with varying backgrounds, to which the Board has assigned specific subject matter responsibilities in order to enhance effective decision-making by the Board. The Board, acting directly and through its Committees, requests and receives information concerning the annual consideration of the renewal of the fund's Advisory Contracts. The Board also meets as needed to consider matters specifically related to the Board's annual consideration of the renewal of Advisory Contracts. Members of the Board may also meet with trustees of other Fidelity funds through ad hoc joint committees to discuss certain matters relevant to the Fidelity funds.
At its July 2012 meeting, the Board of Trustees, including the Independent Trustees, unanimously determined to renew the fund's Advisory Contracts. In reaching its determination, the Board considered all factors it believed relevant, including (i) the nature, extent, and quality of the services to be provided to the fund and its shareholders (including the investment performance of the fund); (ii) the competitiveness of the fund's management fee and total expense ratio relative to peer funds; (iii) the total costs of the services to be provided by and the profits to be realized by Fidelity from its relationship with the fund; (iv) the extent to which economies of scale exist and would be realized as the fund grows; and (v) whether fee levels reflect these economies of scale, if any, for the benefit of fund shareholders.
In considering whether to renew the Advisory Contracts for the fund, the Board reached a determination, with the assistance of fund counsel and Independent Trustees' counsel and through the exercise of its business judgment, that the renewal of the Advisory Contracts is in the best interests of the fund and its shareholders and that the compensation payable under the Advisory Contracts is fair and reasonable. The Board's decision to renew the Advisory Contracts was not based on any single factor, but rather was based on a comprehensive consideration of all the information provided to the Board at its meetings throughout the year. The Board, in reaching its determination to renew the Advisory Contracts, is aware that shareholders in the fund have a broad range of investment choices available to them, including a wide choice among mutual funds offered by Fidelity's competitors, and that the fund's shareholders, who have the opportunity to review and weigh the disclosure provided by the fund in its prospectus and other public disclosures, have chosen to invest in this fund, managed by Fidelity.
Annual Report
Nature, Extent, and Quality of Services Provided. The Board considered the staffing within the investment adviser, FMR, and the sub-advisers (together, the Investment Advisers), including the backgrounds of the fund's investment personnel, and also considered the fund's investment objective, strategies, and related investment philosophy. The Independent Trustees also had discussions with senior management of Fidelity's investment operations and investment groups. The Board considered the structure of the portfolio manager compensation program and whether this structure provides appropriate incentives to act in the best interests of the fund.
Resources Dedicated to Investment Management and Support Services. The Board and the Fund Oversight and Research Committees reviewed the general qualifications and capabilities of the Investment Advisers' investment staff, including its size, education, experience, and resources, as well as the Investment Advisers' approach to recruiting, training, managing, and compensating investment personnel. The Board also noted that FMR has continued to increase the resources devoted to non-U.S. offices, including expansion of Fidelity's global investment organization. The Board noted that Fidelity's analysts have extensive resources, tools and capabilities that allow them to conduct sophisticated quantitative and fundamental analysis, as well as credit analysis of issuers, counterparties and guarantors. The Board also believes that Fidelity's investment professionals have sufficient access to global information and data so as to provide competitive investment results over time, and that those professionals also have access to sophisticated tools that permit them to assess portfolio construction and risk and performance attribution characteristics continuously, as well as to transmit new information and research conclusions rapidly around the world. Additionally, in its deliberations, the Board considered the Investment Advisers' trading and risk management capabilities and resources, which are an integral part of the investment management process.
Shareholder and Administrative Services. The Board considered (i) the nature, extent, quality, and cost of advisory, administrative, and shareholder services performed by the Investment Advisers and their affiliates under the Advisory Contracts and under separate agreements covering transfer agency, pricing and bookkeeping, and securities lending services for the fund; (ii) the nature and extent of the supervision of third party service providers, principally custodians and subcustodians; and (iii) the resources devoted to, and the record of compliance with, the fund's compliance policies and procedures. The Board also reviewed the allocation of fund brokerage, including allocations to brokers affiliated with the Investment Advisers, the use of brokerage commissions to pay fund expenses, and the use of "soft" commission dollars to pay for research services.
Annual Report
Board Approval of Investment Advisory Contracts and
Management Fees - continued
The Board noted that the growth of fund assets over time across the complex allows Fidelity to reinvest in the development of services designed to enhance the value or convenience of the Fidelity funds as investment vehicles. These services include 24-hour access to account information and market information through telephone representatives and over the Internet, investor education materials and asset allocation tools, and the expanded availability of Fidelity Investor Centers.
Investment in a Large Fund Family. The Board considered the benefits to shareholders of investing in a Fidelity fund, including the benefits of investing in a fund that is part of a large family of funds offering a variety of investment disciplines and providing a large variety of mutual fund investor services. The Board noted that Fidelity had taken, or had made recommendations that resulted in the Fidelity funds taking, a number of actions over the previous year that benefited particular funds, including (i) continuing to dedicate additional resources to investment research and support of the senior management team that oversees asset management; (ii) persisting in efforts to enhance Fidelity's research capabilities, in particular, international research; (iii) launching new funds and making other enhancements to meet client needs for global and income-oriented solutions; (iv) continuing to launch dedicated lower cost underlying funds to meet investment management's portfolio construction needs related to expanding underlying fund options, specifically for the Freedom Fund product lines; (v) adopting a "Stock Selector" sector neutral investment approach and employing a team of portfolio managers who are sector specialists to manage certain funds; (vi) rationalizing product lines and gaining increased efficiencies through the mergers of several funds into other funds; (vii) strengthening the Spartan Index Fund product line by adding new funds and/or new low-cost institutional share classes, restructuring fund expenses to accommodate new classes, and reducing investment minimums for certain classes of shares; (viii) modifying the eligibility criteria for Institutional Class shares to increase their appeal to government entities and charitable investors; and (ix) reducing certain transfer agent fee rates.
Investment Performance. The Board considered whether the fund has operated in accordance with its investment objective, as well as its record of compliance with its investment restrictions. It also reviewed the fund's absolute investment performance for each class, as well as the fund's relative investment performance for each class measured over multiple periods against (i) a broad-based securities market index, and (ii) a peer group of mutual funds deemed appropriate by Fidelity and reviewed by the Board. Because the fund had been in existence less than five calendar years, the following charts considered by the Board show, over the one- and three-year periods ended December 31, 2011, the cumulative total returns of the retail class and Class B of the fund, the cumulative total returns of a broad-based securities market index ("benchmark"), and a range of cumulative total returns of a peer group of mutual funds identified by Morningstar, Inc. as having an investment style similar to that of the fund based on underlying portfolio holdings. The returns of the retail class and Class B show the performance of the highest and lowest performing classes, respectively (based on three-year performance). The box within each chart shows the 25th percentile return (top of box) and the 75th percentile return (bottom of box) of the peer group. Returns shown above the box are in the first quartile and returns shown below the box are in the fourth quartile. The percentage beaten numbers noted below each chart correspond to the percentile box and represent the percentage of funds in the peer group whose performance was equal to or lower than that of the class indicated.
Annual Report
Fidelity Total International Equity Fund

The Board reviewed the fund's relative investment performance against its peer group and noted that the performance of the retail class of the fund was in the third quartile for the one-year period and the second quartile for the three-year period. The Board also noted that the investment performance of the fund was lower than its benchmark for the one-year period, although the three-year cumulative total return of the retail class compared favorably to its benchmark. The Board considered that the variations in performance among the fund's classes reflect the variations in class expenses, which result in lower performance for higher expense classes. The Board noted that there were portfolio management changes for the fund in February 2012 and September 2011. The Board also reviewed the fund's performance since inception as well as performance in the current year.
The Board also considered that the fund's management fee is subject to upward or downward adjustment depending upon whether, and to what extent, the fund's investment performance for the performance period exceeds, or is exceeded by, the record (over the same period) of a Board-approved performance adjustment index. The Board noted that the performance adjustment provides FMR with a strong economic incentive to seek to achieve superior performance for the fund's shareholders and helps to more closely align the interests of FMR and the fund's shareholders.
Annual Report
Board Approval of Investment Advisory Contracts and
Management Fees - continued
Based on its review, the Board concluded that the nature, extent, and quality of services provided to the fund under the Advisory Contracts should benefit the fund's shareholders.
Competitiveness of Management Fee and Total Expense Ratio. The Board considered the fund's management fee and total expense ratio compared to "mapped groups" of competitive funds and classes. Fidelity creates "mapped groups" by combining similar Lipper investment objective categories that have comparable management fee characteristics. Combining Lipper investment objective categories aids the Board's management fee and total expense ratio comparisons by broadening the competitive group used for comparison and by reducing the number of universes to which various Fidelity funds are compared.
Management Fee. The Board considered two proprietary management fee comparisons for the 12-month (or shorter) periods shown in the chart below. The group of Lipper funds used by the Board for management fee comparisons is referred to below as the "Total Mapped Group." The Total Mapped Group comparison focuses on a fund's standing relative to the total universe of comparable funds available to investors in terms of gross management fees before expense reimbursements or caps, and without giving effect to the fund's performance adjustment. "TMG %" represents the percentage of funds in the Total Mapped Group that had management fees that were lower than the fund's. For example, a TMG % of 17% means that 83% of the funds in the Total Mapped Group had higher management fees than the fund. The "Asset-Size Peer Group" (ASPG) comparison focuses on a fund's standing relative to non-Fidelity funds similar in size to the fund within the Total Mapped Group. The ASPG represents at least 15% of the funds in the Total Mapped Group with comparable asset size and management fee characteristics, subject to a minimum of 50 funds (or all funds in the Total Mapped Group if fewer than 50). Additional information, such as the ASPG quartile in which the fund's management fee ranked and the impact of the fund's performance adjustment, is also included in the chart and considered by the Board.
Annual Report
Fidelity Total International Equity Fund

The Board noted that the fund's management fee ranked below the median of its Total Mapped Group and below the median of its ASPG for 2011. The Board also noted the effect of the fund's negative performance adjustment on the fund's management fee ranking. The Board noted that the performance adjustment for each year represents calculations for performance periods that differ from the periods shown in the performance charts above.
Based on its review, the Board concluded that the fund's management fee is fair and reasonable in light of the services that the fund receives and the other factors considered.
Total Expense Ratio. In its review of each class's total expense ratio, the Board considered the fund's management fee as well as other fund or class expenses, as applicable, such as transfer agent fees, pricing and bookkeeping fees, fund-paid 12b-1 fees, and custodial, legal, and audit fees. The Board also noted the effects of any waivers and reimbursements on fees and expenses, as well as the impact of the fund's performance adjustment. As part of its review, the Board also considered the current and historical total expense ratios of each class of the fund compared to competitive fund median expenses. Each class of the fund is compared to those funds and classes in the Total Mapped Group (used by the Board for management fee comparisons) that have a similar sales load structure.
The Board noted that the total expense ratio of each of Class A and the retail class ranked below its competitive median for 2011, the total expense ratio of Class B ranked equal to its competitive median for 2011, and the total expense ratio of each of Class T, Class C, and Institutional Class ranked above its competitive median for 2011. The Board considered that various factors, including 12b-1 fees, positive or negative performance adjustments, and relatively higher other expenses in the case of small fund size, can affect total expense ratios. The Board noted that the total expense ratio of Class T was above the competitive median primarily because of higher 12b-1 fees on Class T. Class T has a higher 12b-1 fee, but a lower front-end sales charge, than traditionally priced front-end sales charge classes. The Board considered that Class T is primarily sold load-waived in the retirement plan market where its 0.50% 12b-1 fee is comparable to competing no-load, higher 12b-1 fee classes designed specifically for retirement plans. The Board noted that the fund offers multiple classes, each of which has a different sales load and 12b-1 fee structure, and that the multiple structures are intended to offer a range of pricing options for the intermediary market. The Board also noted that the total expense ratios of the classes vary primarily by the level of their 12b-1 fees, although differences in transfer agent fees may also cause expenses to vary from class to class.
Annual Report
Board Approval of Investment Advisory Contracts and
Management Fees - continued
The Board further considered that FMR contractually agreed to reimburse Class A, Class T, Class B, Class C, Institutional Class, and the retail class of the fund to the extent that total operating expenses (excluding interest, taxes, certain securities lending costs, brokerage commissions, extraordinary expenses, and acquired fund fees and expenses, if any), as a percentage of their respective average net assets, exceed 1.45%, 1.70%, 2.20%, 2.20%, 1.20% and 1.20% through December 31, 2012.
Fees Charged to Other Fidelity Clients. The Board also considered Fidelity fee structures and other information with respect to clients of FMR and its affiliates, such as other mutual funds advised or subadvised by FMR or its affiliates, pension plan clients, and other institutional clients. The Board noted the findings of the 2010 ad hoc joint committee (created with the board of other Fidelity funds), which reviewed and compared Fidelity's institutional investment advisory business with its business of providing services to the Fidelity funds, including the differences in services provided, fees charged, and costs incurred, as well as competition in their respective marketplaces.
Based on its review of total expense ratios and fees charged to other Fidelity clients, the Board concluded that the total expense ratio of each class of the fund was reasonable, although in some cases above the median of the universe presented for comparison, in light of the services that the fund and its shareholders receive and the other factors considered.
Costs of the Services and Profitability. The Board considered the revenues earned and the expenses incurred by Fidelity in conducting the business of developing, marketing, distributing, managing, administering and servicing the fund and its shareholders. The Board also considered the level of Fidelity's profits in respect of all the Fidelity funds.
Annual Report
On an annual basis, FMR presents to the Board Fidelity's profitability for the fund. Fidelity calculates the profitability for each fund, as well as aggregate profitability for groups of Fidelity funds and all Fidelity funds, using a series of detailed revenue and cost allocation methodologies which originate with the books and records of Fidelity on which Fidelity's audited financial statements are based. The Audit Committee of the Board reviews any significant changes from the prior year's methodologies.
PricewaterhouseCoopers LLP (PwC), independent registered public accounting firm and auditor to Fidelity and certain Fidelity funds, has been engaged annually by the Board as part of the Board's assessment of Fidelity's profitability analysis. PwC's engagement includes the review and assessment of Fidelity's methodologies used in determining the revenues and expenses attributable to Fidelity's mutual fund business, and completion of agreed-upon procedures surrounding the mathematical accuracy of fund profitability and its conformity to allocation methodologies. After considering PwC's reports issued under the engagement and information provided by Fidelity, the Board concluded that while other allocation methods may also be reasonable, Fidelity's profitability methodologies are reasonable in all material respects.
The Board also reviewed Fidelity's non-fund businesses and fall-out benefits related to the mutual fund business as well as cases where Fidelity's affiliates may benefit from or be related to the fund's business.
The Board considered the costs of the services provided by and the profits realized by Fidelity in connection with the operation of the fund and was satisfied that the profitability was not excessive in the circumstances.
Economies of Scale. The Board considered whether there have been economies of scale in respect of the management of the Fidelity funds, whether the Fidelity funds (including the fund) have appropriately benefited from any such economies of scale, and whether there is potential for realization of any further economies of scale. The Board considered the extent to which the fund will benefit from economies of scale through increased services to the fund, through waivers or reimbursements, or through fee or expense reductions. The Board also noted that in 2009, it and the board of other Fidelity funds created an ad hoc committee (the Economies of Scale Committee) to analyze whether FMR attains economies of scale in respect of the management and servicing of the Fidelity funds, whether the Fidelity funds have appropriately benefited from such economies of scale, and whether there is potential for realization of any further economies of scale.
The Board recognized that the fund's management contract incorporates a "group fee" structure, which provides for lower group fee rates as total fund assets under FMR's management increase, and for higher group fee rates as total fund assets under FMR's management decrease. FMR calculates the group fee rates based on a tiered asset "breakpoint" schedule that varies based on asset class. The Board considered that the group fee is designed to deliver the benefits of economies of scale to fund shareholders when total Fidelity fund assets increase, even if assets of any particular fund are unchanged or have declined, because some portion of Fidelity's costs are attributable to services provided to all Fidelity funds, and all funds benefit if those costs can be allocated among more assets. The Board concluded that, given the group fee structure, fund shareholders will benefit from lower management fees as assets under FMR's management increase at the fund complex level, regardless of whether Fidelity achieves any such economies of scale.
Annual Report
Board Approval of Investment Advisory Contracts and
Management Fees - continued
The Board concluded, taking into account the analysis of the Economies of Scale Committee, that economies of scale, if any, are being appropriately shared between fund shareholders and Fidelity.
Additional Information Requested by the Board. In order to develop fully the factual basis for consideration of the Fidelity funds' Advisory Contracts, the Board requested and received additional information on certain topics, including (i) fund performance trends, actions to be taken by FMR to improve certain funds' overall performance, and Fidelity's long-term strategies for certain funds; (ii) the potential to further rationalize the Fidelity fund lineup with the possibility of achieving savings for the funds and Fidelity; (iii) Fidelity's compensation structure for portfolio managers and other key investment personnel; (iv) the amount of the investment that each portfolio manager has made in the Fidelity fund(s) that he or she manages; (v) the realization of fall-out benefits in certain Fidelity business units; (vi) Fidelity's group fee structures, the potential impact of regulatory changes on such structures, and the rationale for the individual fee rates of certain funds; (vii) fund profitability methodology, including Fidelity's cost allocation methodology, and the impact of certain factors on fund profitability results; (viii) trends regarding industry use of performance fee structures and the possibility of implementing performance fee structures for additional funds; and (ix) the impact of net redemptions from the Fidelity funds.
Based on its evaluation of all of the conclusions noted above, and after considering all factors it believed relevant, the Board ultimately concluded that the advisory fee structures are fair and reasonable, and that the fund's Advisory Contracts should be renewed.
Annual Report
Investment Adviser
Fidelity Management & Research Company
Boston, MA
Investment Sub-Advisers
FMR Co., Inc.
Fidelity Management & Research
(U.K.) Inc.
FIL Investment Advisors
FIL Investments (Japan) Limited
FIL Investment Advisors
(U.K.) Limited
Fidelity Management & Research
(Hong Kong) Limited
Fidelity Management & Research
(Japan) Inc.
General Distributor
Fidelity Distributors Corporation
Smithfield, RI
Transfer and Service Agents
Fidelity Investments Institutional Operations Company, Inc.
Boston, MA
Fidelity Service Company, Inc.
Boston, MA
Custodian
State Street Bank & Trust Company
Quincy, MA
(Fidelity Investment logo)(registered trademark)
ATIE-UANN-1212
1.853363.104
(Fidelity Investment logo)(registered trademark)
Fidelity Advisor®
Total International Equity
Fund - Institutional Class
Annual Report
October 31, 2012
(Fidelity Cover Art)
Institutional Class is
a class of Fidelity®
Total International Equity Fund
Contents
Performance | (Click Here) | How the fund has done over time. |
Management's Discussion of Fund Performance | (Click Here) | The Portfolio Manager's review of fund performance and strategy. |
Shareholder Expense Example | (Click Here) | An example of shareholder expenses. |
Investment Changes | (Click Here) | A summary of major shifts in the fund's investments over the past six months. |
Investments | (Click Here) | A complete list of the fund's investments with their market values. |
Financial Statements | (Click Here) | Statements of assets and liabilities, operations, and changes in net assets, as well as financial highlights. |
Notes | (Click Here) | Notes to the financial statements. |
Report of Independent Registered Public Accounting Firm | (Click Here) | |
Trustees and Officers | (Click Here) | |
Distributions | (Click Here) | |
Board Approval of Investment Advisory Contracts and Management Fees | (Click Here) | |
To view a fund's proxy voting guidelines and proxy voting record for the 12-month period ended June 30, visit http://www.fidelity.com/proxyvotingresults or visit the Securities and Exchange Commission's (SEC) web site at http://www.sec.gov. You may also call 1-877-208-0098 to request a free copy of the proxy voting guidelines.
Standard & Poor's, S&P and S&P 500 are registered service marks of The McGraw-Hill Companies, Inc. and have been licensed for use by Fidelity Distributors Corporation.
Other third party marks appearing herein are the property of their respective owners.
All other marks appearing herein are registered or unregistered trademarks or service marks of FMR LLC or an affiliated company. © 2012 FMR LLC. All rights reserved.
Annual Report
This report and the financial statements contained herein are submitted for the general information of the shareholders of the fund. This report is not authorized for distribution to prospective investors in the fund unless preceded or accompanied by an effective prospectus.
A fund files its complete schedule of portfolio holdings with the SEC for the first and third quarters of each fiscal year on Form N-Q. Forms N-Q are available on the SEC's web site at http://www.sec.gov. A fund's Forms N-Q may be reviewed and copied at the SEC's Public Reference Room in Washington, DC. Information regarding the operation of the SEC's Public Reference Room may be obtained by calling 1-800-SEC-0330. For a complete list of a fund's portfolio holdings, view the most recent holdings listing, semiannual report, or annual report on Fidelity's web site at http://www.fidelity.com, http://www.advisor.fidelity.com, or http://www.401k.com, as applicable.
NOT FDIC INSURED • MAY LOSE VALUE • NO BANK GUARANTEE
Neither the fund nor Fidelity Distributors Corporation is a bank.
Annual Report
Average annual total return reflects the change in the value of an investment, assuming reinvestment of the class' distributions from dividend income and capital gains (the profits earned upon the sale of securities that have grown in value, if any) and assuming a constant rate of performance each year. The $10,000 table and the fund's returns do not reflect the deduction of taxes that a shareholder would pay on fund distributions or the redemption of fund shares. During periods of reimbursement by Fidelity, a fund's total return will be greater than it would be had the reimbursement not occurred. How a fund did yesterday is no guarantee of how it will do tomorrow.
Average Annual Total Returns
Periods ended October 31, 2012 | Past 1
year | Life of
fund A |
Institutional Class | 11.06% | -4.67% |
A From November 1, 2007.
$10,000 Over Life of Fund
Let's say hypothetically that $10,000 was invested in Fidelity Advisor® Total International Equity Fund - Institutional Class on November 1, 2007, when the fund started. The chart shows how the value of your investment would have changed, and also shows how the MSCI® ACWI® (All Country World Index) ex USA Index performed over the same period.
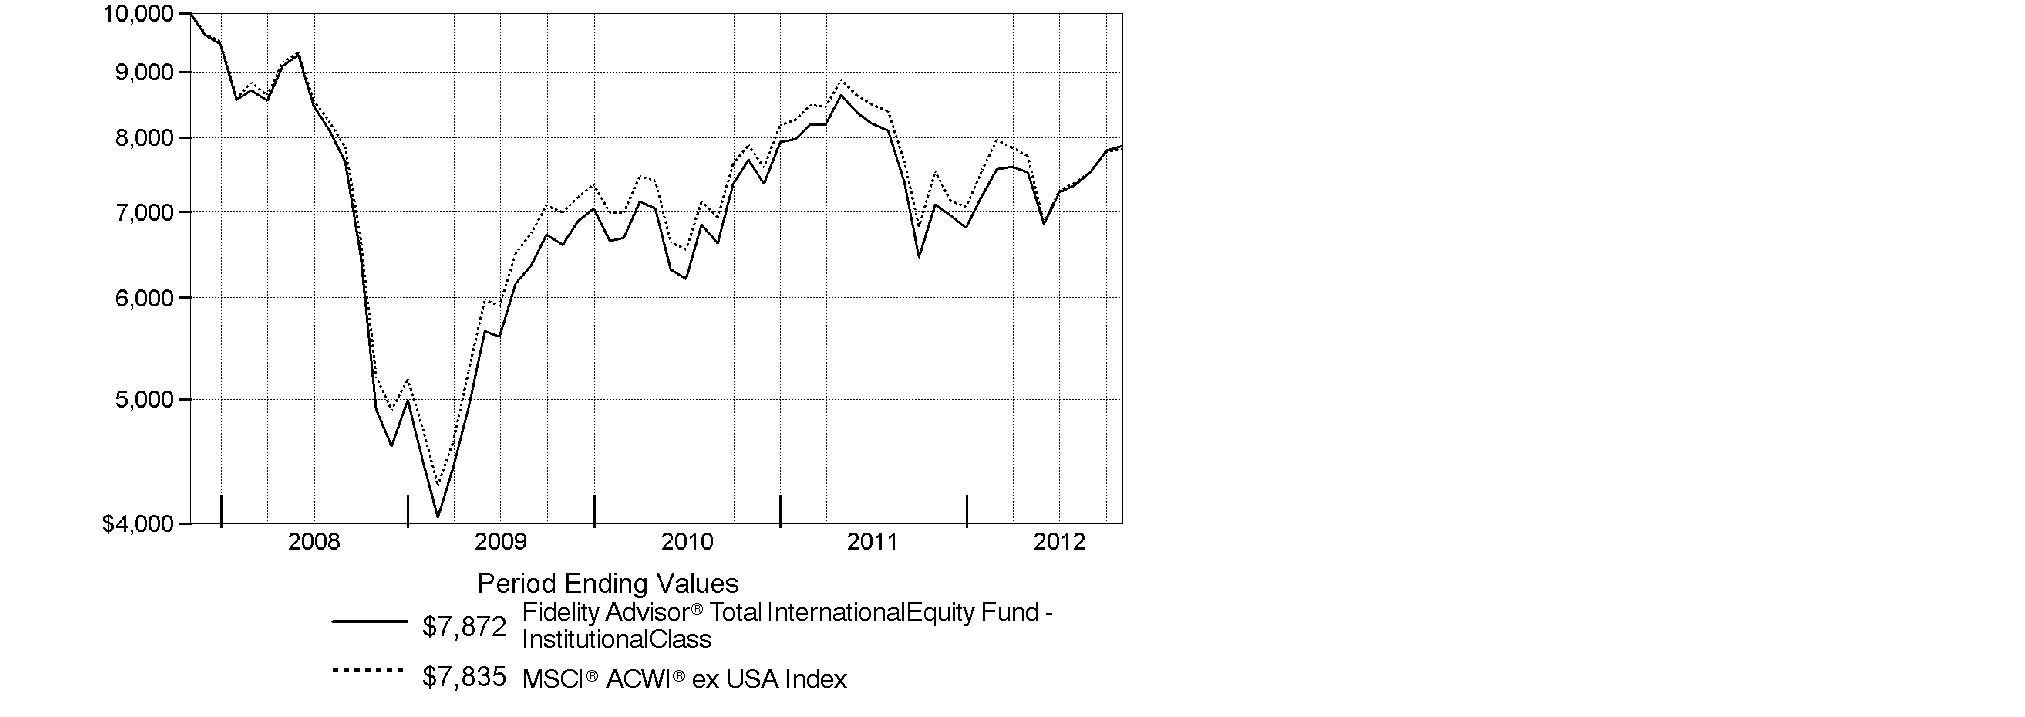
Annual Report
Market Recap: International stocks experienced pendulum-like swings during the 12 months ending October 31, 2012, finishing the period with a modest advance. The market faced periodic bouts of volatility this past year, as a number of macroeconomic concerns - including the eurozone debt crisis, the strength and pace of the U.S. economic recovery, and a slowdown in China's once-blistering growth - dominated headlines and weighed on investors. While a stronger U.S. dollar provided an additional head wind, foreign developed- and emerging-markets stocks still managed a gain for the 12 months, as the MSCI® ACWI® (All Country World Index) ex USA Index rose 4.11%, largely buttressed in the summertime by pledges of accommodative monetary action from eurozone officials, as well as signs that the U.S. housing market was on the mend. Within the index, Asia-Pacific ex Japan showed the most impressive gains, advancing roughly 11%. A number of core European components, most notably Germany (+11%), Switzerland (+10%) and the U.K. (+9%), benefited from optimism about the eurozone's ability to resolve its debt woes, which also helped the region outpace the index overall. Elsewhere, results from Canada (+3%) and the generally more volatile emerging markets (+2%) each fell short of the MSCI index, while Japan was among the few benchmark constituents to finish in the red, returning about -3%.
Comments from Alex Zavratsky, Co-Portfolio Manager of Fidelity Advisor® Total International Equity Fund: For the year, the fund's Institutional Class shares gained 11.06%, significantly outpacing the MSCI index. The fund benefited from good security selection in emerging markets - especially Brazil, South Korea and Chile - and Japan. Good positioning in Europe overcame negative stock selection specifically in Germany. An out-of-benchmark allocation to U.S. stocks also added, notably credit card network Visa. Conversely, stock picking in Canada modestly hurt. In sector terms, security selection helped in industrials, as did positioning in materials and health care. The top individual contributor was Belgian brewer Anheuser-Busch InBev, while, in health care, Denmark's Novo Nordisk and Australian biotechnology company CSL added value. Not owning Telefonica, a poor-performing Spanish telecom provider and benchmark component, also helped. In contrast, untimely ownership of South Korean electronics maker Samsung Electronics hurt, as did not owning Diageo, a strong-performing U.K.-based spirits company and benchmark component. An overweighting in Repsol, a Spain-based integrated oil and gas company, also detracted. Samsung was not held at period end.
The views expressed above reflect those of the portfolio manager(s) only through the end of the period as stated on the cover of this report and do not necessarily represent the views of Fidelity or any other person in the Fidelity organization. Any such views are subject to change at any time based upon market or other conditions and Fidelity disclaims any responsibility to update such views. These views may not be relied on as investment advice and, because investment decisions for a Fidelity fund are based on numerous factors, may not be relied on as an indication of trading intent on behalf of any Fidelity fund.
Annual Report
Shareholder Expense Example
As a shareholder of the Fund, you incur two types of costs: (1) transaction costs, including sales charges (loads) on purchase payments or redemption proceeds, redemption fees and (2) ongoing costs, including management fees, distribution and/or service (12b-1) fees and other Fund expenses. This Example is intended to help you understand your ongoing costs (in dollars) of investing in the Fund and to compare these costs with the ongoing costs of investing in other mutual funds.
The Example is based on an investment of $1,000 invested at the beginning of the period and held for the entire period (May 1, 2012 to October 31, 2012).
Actual Expenses
The first line of the accompanying table for each class of the Fund provides information about actual account values and actual expenses. You may use the information in this line, together with the amount you invested, to estimate the expenses that you paid over the period. Simply divide your account value by $1,000.00 (for example, an $8,600 account value divided by $1,000.00 = 8.6), then multiply the result by the number in the first line for a class of the Fund under the heading entitled "Expenses Paid During Period" to estimate the expenses you paid on your account during this period. A small balance maintenance fee of $12.00 that is charged once a year may apply for certain accounts with a value of less than $2,000. This fee is not included in the table below. If it was, the estimate of expenses you paid during the period would be higher, and your ending account value lower, by this amount. In addition, the Fund, as a shareholder in the underlying Fidelity Central Funds, will indirectly bear its pro-rata share of the fees and expenses incurred by the underlying Fidelity Central Funds. These fees and expenses are not included in the Fund's annualized expense ratio used to calculate the expense estimate in the table below.
Hypothetical Example for Comparison Purposes
The second line of the accompanying table for each class of the Fund provides information about hypothetical account values and hypothetical expenses based on a Class' actual expense ratio and an assumed rate of return of 5% per year before expenses, which is not the Class' actual return. The hypothetical account values and expenses may not be used to estimate the actual ending account balance or expenses you paid for the period. You may use this information to compare the ongoing costs of investing in the Fund and other funds. To do so, compare this 5% hypothetical example with the 5% hypothetical examples that appear in the shareholder reports of the other funds. A small balance maintenance fee of $12.00 that is charged once a year may apply for certain accounts with a value of less than $2,000. This fee is not included in the table below. If it was, the estimate of expenses you paid during the period would be higher, and your ending account value lower, by this amount. In addition, the Fund, as a shareholder in the underlying Fidelity Central Funds, will indirectly bear its pro-rata share of the fees and expenses incurred by the underlying Fidelity Central Funds. These fees and expenses are not included in the Fund's annualized expense ratio used to calculate the expense estimate in the table below.
Please note that the expenses shown in the table are meant to highlight your ongoing costs only and do not reflect any transaction costs. Therefore, the second line of the table is useful in comparing ongoing costs only, and will not help you determine the relative total costs of owning different funds. In addition, if these transactional costs were included, your costs would have been higher.
Annual Report
Shareholder Expense Example - continued
| Annualized
Expense Ratio | Beginning
Account Value
May 1, 2012 | Ending
Account Value
October 31, 2012 | Expenses Paid
During Period*
May 1, 2012 to
October 31, 2012 |
Class A | 1.45% | | | |
Actual | | $ 1,000.00 | $ 1,045.80 | $ 7.46 |
HypotheticalA | | $ 1,000.00 | $ 1,017.85 | $ 7.35 |
Class T | 1.70% | | | |
Actual | | $ 1,000.00 | $ 1,043.90 | $ 8.73 |
HypotheticalA | | $ 1,000.00 | $ 1,016.59 | $ 8.62 |
Class B | 2.20% | | | |
Actual | | $ 1,000.00 | $ 1,042.70 | $ 11.30 |
HypotheticalA | | $ 1,000.00 | $ 1,014.08 | $ 11.14 |
Class C | 2.20% | | | |
Actual | | $ 1,000.00 | $ 1,041.30 | $ 11.29 |
HypotheticalA | | $ 1,000.00 | $ 1,014.08 | $ 11.14 |
Total International Equity | 1.14% | | | |
Actual | | $ 1,000.00 | $ 1,047.20 | $ 5.87 |
HypotheticalA | | $ 1,000.00 | $ 1,019.41 | $ 5.79 |
Institutional Class | 1.20% | | | |
Actual | | $ 1,000.00 | $ 1,047.30 | $ 6.18 |
HypotheticalA | | $ 1,000.00 | $ 1,019.10 | $ 6.09 |
A 5% return per year before expenses
* Expenses are equal to each Class' annualized expense ratio, multiplied by the average account value over the period, multiplied by 184/366 (to reflect the one-half year period).
Annual Report
Investment Changes (Unaudited)
Geographic Diversification (% of fund's net assets) |
As of October 31, 2012 |
 | United Kingdom 16.8% | |
 | Japan 10.8% | |
 | United States of America 7.2% | |
 | Switzerland 6.9% | |
 | Germany 5.1% | |
 | France 5.0% | |
 | Australia 4.8% | |
 | Taiwan 3.7% | |
 | Korea (South) 2.9% | |
| Other 36.8% | |

Percentages are based on country or territory of incorporation and are adjusted for the effect of futures contracts, if applicable. |
As of April 30, 2012 |
| United Kingdom 18.1% | |
| Japan 13.5% | |
| Switzerland 7.0% | |
| United States of America 6.4% | |
| Germany 5.7% | |
| Australia 4.4% | |
| France 4.3% | |
| Taiwan 3.0% | |
 | India 2.6% | |
| Other 35.0% | |

Percentages are based on country or territory of incorporation and are adjusted for the effect of futures contracts, if applicable. |
Asset Allocation |
| % of fund's
net assets | % of fund's net assets
6 months ago |
Stocks | 98.4 | 98.8 |
Short-Term Investments and Net Other Assets (Liabilities) | 1.6 | 1.2 |
Top Ten Stocks as of October 31, 2012 |
| % of fund's
net assets | % of fund's net assets
6 months ago |
Nestle SA (Switzerland, Food Products) | 2.3 | 2.4 |
Roche Holding AG (participation certificate) (Switzerland, Pharmaceuticals) | 1.8 | 2.2 |
Royal Dutch Shell PLC Class A sponsored ADR (United Kingdom, Oil, Gas & Consumable Fuels) | 1.8 | 2.2 |
Sanofi SA (France, Pharmaceuticals) | 1.4 | 1.4 |
BHP Billiton PLC (United Kingdom, Metals & Mining) | 1.3 | 1.0 |
GlaxoSmithKline PLC sponsored ADR (United Kingdom, Pharmaceuticals) | 1.2 | 1.6 |
Vodafone Group PLC sponsored ADR (United Kingdom, Wireless Telecommunication Services) | 1.2 | 1.4 |
Anheuser-Busch InBev SA NV (Belgium, Beverages) | 1.2 | 1.0 |
HSBC Holdings PLC sponsored ADR (United Kingdom, Commercial Banks) | 1.0 | 0.9 |
Commonwealth Bank of Australia (Australia, Commercial Banks) | 1.0 | 1.0 |
| 14.2 | |
Market Sectors as of October 31, 2012 |
| % of fund's
net assets | % of fund's net assets
6 months ago |
Financials | 21.4 | 19.8 |
Consumer Staples | 14.4 | 14.7 |
Industrials | 12.2 | 11.7 |
Consumer Discretionary | 10.2 | 11.6 |
Health Care | 9.8 | 10.6 |
Materials | 8.7 | 7.4 |
Energy | 7.4 | 7.6 |
Information Technology | 6.3 | 6.0 |
Telecommunication Services | 4.1 | 5.4 |
Utilities | 3.9 | 4.0 |
Annual Report
Investments October 31, 2012
Showing Percentage of Net Assets
Common Stocks - 97.9% |
| Shares | | Value |
Australia - 4.8% |
Australia & New Zealand Banking Group Ltd. | 91,182 | | $ 2,408,879 |
Coca-Cola Amatil Ltd. | 58,234 | | 813,050 |
Commonwealth Bank of Australia | 47,936 | | 2,873,638 |
CSL Ltd. | 35,275 | | 1,739,318 |
Newcrest Mining Ltd. | 19,905 | | 546,107 |
Origin Energy Ltd. | 38,131 | | 449,650 |
Ramsay Health Care Ltd. | 2,082 | | 51,351 |
Sydney Airport unit | 284,317 | | 1,000,509 |
Telstra Corp. Ltd. | 234,394 | | 1,007,315 |
Transurban Group unit | 73,700 | | 465,146 |
Westfield Group unit | 112,623 | | 1,246,243 |
Woodside Petroleum Ltd. | 18,232 | | 651,045 |
Woolworths Ltd. | 14,358 | | 438,336 |
WorleyParsons Ltd. | 22,067 | | 565,107 |
TOTAL AUSTRALIA | | 14,255,694 |
Austria - 0.4% |
Andritz AG | 18,358 | | 1,105,741 |
Zumtobel AG | 5,000 | | 53,421 |
TOTAL AUSTRIA | | 1,159,162 |
Bailiwick of Jersey - 0.8% |
Atrium European Real Estate Ltd. | 134,051 | | 757,725 |
Informa PLC | 52,073 | | 336,299 |
Randgold Resources Ltd. sponsored ADR | 6,760 | | 808,428 |
Wolseley PLC | 13,367 | | 584,358 |
TOTAL BAILIWICK OF JERSEY | | 2,486,810 |
Belgium - 1.6% |
Anheuser-Busch InBev SA NV | 40,471 | | 3,384,637 |
Gimv NV | 1,703 | | 82,312 |
KBC Groupe SA | 9,918 | | 232,808 |
Umicore SA | 19,051 | | 977,718 |
TOTAL BELGIUM | | 4,677,475 |
Bermuda - 2.0% |
Cheung Kong Infrastructure Holdings Ltd. | 70,000 | | 410,062 |
First Pacific Co. Ltd. | 764,000 | | 850,745 |
GP Investments Ltd. (depositary receipt) (a) | 12,300 | | 28,403 |
Lazard Ltd. Class A | 8,770 | | 258,364 |
Li & Fung Ltd. | 234,000 | | 392,514 |
Pacific Basin Shipping Ltd. | 1,704,000 | | 912,459 |
Texwinca Holdings Ltd. | 860,000 | | 684,667 |
Common Stocks - continued |
| Shares | | Value |
Bermuda - continued |
Trinity Ltd. | 964,000 | | $ 675,418 |
Vtech Holdings Ltd. | 65,900 | | 782,717 |
Yue Yuen Industrial (Holdings) Ltd. | 222,000 | | 766,253 |
TOTAL BERMUDA | | 5,761,602 |
Brazil - 2.4% |
Arezzo Industria e Comercio SA | 15,600 | | 278,427 |
Banco Bradesco SA | 123,000 | | 1,618,764 |
Banco Pine SA | 7,106 | | 49,681 |
Duratex SA | 98,200 | | 683,177 |
Iguatemi Empresa de Shopping Centers SA | 20,600 | | 261,677 |
LPS Brasil Consultoria de Imoveis SA | 30,100 | | 517,215 |
Multiplan Empreendimentos Imobiliarios SA | 16,100 | | 471,653 |
Oi SA | 123,916 | | 585,704 |
Porto Seguro SA | 73,000 | | 776,347 |
Tractebel Energia SA | 51,300 | | 884,026 |
Weg SA | 63,000 | | 723,660 |
TOTAL BRAZIL | | 6,850,331 |
British Virgin Islands - 0.0% |
Gem Diamonds Ltd. (a) | 10,228 | | 27,853 |
Canada - 0.9% |
Agnico-Eagle Mines Ltd. (Canada) | 6,440 | | 363,606 |
Baytex Energy Corp. | 700 | | 31,855 |
Copper Mountain Mining Corp. (a) | 6,600 | | 26,697 |
Eldorado Gold Corp. | 3,800 | | 56,158 |
Fairfax Financial Holdings Ltd. (sub. vtg.) | 705 | | 261,536 |
First Quantum Minerals Ltd. | 10,585 | | 237,931 |
Goldcorp, Inc. | 12,994 | | 587,413 |
Open Text Corp. (a) | 5,150 | | 276,798 |
Painted Pony Petroleum Ltd. Class A (a) | 3,200 | | 34,603 |
Pason Systems, Inc. | 3,700 | | 60,274 |
Petrominerales Ltd. | 3,125 | | 25,063 |
Suncor Energy, Inc. | 17,300 | | 580,622 |
TAG Oil Ltd. (a) | 4,700 | | 32,941 |
TOTAL CANADA | | 2,575,497 |
Cayman Islands - 1.8% |
ASM Pacific Technology Ltd. | 53,400 | | 595,320 |
Baidu.com, Inc. sponsored ADR (a) | 3,500 | | 373,170 |
ENN Energy Holdings Ltd. | 122,000 | | 507,674 |
Common Stocks - continued |
| Shares | | Value |
Cayman Islands - continued |
Haitian International Holdings Ltd. | 512,000 | | $ 632,233 |
Kingboard Chemical Holdings Ltd. | 213,000 | | 633,499 |
Lee & Man Paper Manufacturing Ltd. | 1,489,000 | | 781,960 |
Sands China Ltd. | 290,600 | | 1,093,024 |
Vantage Drilling Co. (a) | 15,200 | | 27,968 |
Yingde Gases Group Co. Ltd. | 750,500 | | 711,760 |
TOTAL CAYMAN ISLANDS | | 5,356,608 |
Chile - 2.1% |
Cencosud SA | 120,432 | | 657,289 |
Compania Cervecerias Unidas SA sponsored ADR | 11,400 | | 808,602 |
Embotelladora Andina SA sponsored ADR | 18,600 | | 704,568 |
Inversiones Aguas Metropolitanas SA | 437,696 | | 814,170 |
Isapre CruzBlanca SA | 637,596 | | 834,580 |
Parque Arauco SA | 402,367 | | 919,051 |
Quinenco SA | 315,548 | | 898,474 |
Sociedad Matriz SAAM SA | 4,670,971 | | 546,071 |
TOTAL CHILE | | 6,182,805 |
China - 1.1% |
China BlueChemical Ltd. (H Shares) | 1,336,000 | | 846,415 |
China Oilfield Services Ltd. (H Shares) | 430,000 | | 815,608 |
China Shipping Development Co. Ltd. (H Shares) | 1,472,000 | | 773,032 |
Dongfeng Motor Group Co. Ltd. (H Shares) | 544,000 | | 673,854 |
TOTAL CHINA | | 3,108,909 |
Colombia - 0.3% |
BanColombia SA sponsored ADR | 11,500 | | 736,230 |
Curacao - 0.2% |
Schlumberger Ltd. | 8,600 | | 597,958 |
Denmark - 0.9% |
Novo Nordisk A/S Series B sponsored ADR | 15,200 | | 2,436,408 |
William Demant Holding A/S (a) | 4,110 | | 353,488 |
TOTAL DENMARK | | 2,789,896 |
Finland - 0.8% |
Nokian Tyres PLC | 29,202 | | 1,211,206 |
Outotec Oyj | 6,412 | | 312,241 |
Sampo OYJ (A Shares) | 27,199 | | 852,441 |
TOTAL FINLAND | | 2,375,888 |
Common Stocks - continued |
| Shares | | Value |
France - 5.0% |
Alstom SA | 22,162 | | $ 756,911 |
Arkema SA | 7,560 | | 689,254 |
Atos Origin SA | 10,510 | | 705,784 |
BNP Paribas SA | 42,351 | | 2,130,407 |
Compagnie de St. Gobain | 16,600 | | 585,022 |
Danone SA | 20,380 | | 1,252,757 |
GDF Suez | 39,743 | | 912,036 |
Laurent-Perrier Group | 859 | | 73,261 |
Pernod Ricard SA | 5,500 | | 591,906 |
PPR SA | 3,083 | | 542,062 |
Remy Cointreau SA | 5,281 | | 547,734 |
Safran SA | 15,114 | | 601,315 |
Saft Groupe SA | 2,629 | | 58,457 |
Sanofi SA | 46,258 | | 4,062,723 |
Schneider Electric SA | 6,245 | | 390,436 |
Unibail-Rodamco | 2,908 | | 655,276 |
Vetoquinol SA | 1,200 | | 40,129 |
Virbac SA | 520 | | 90,653 |
TOTAL FRANCE | | 14,686,123 |
Germany - 4.6% |
Allianz AG | 15,953 | | 1,978,008 |
alstria office REIT-AG | 5,100 | | 61,595 |
BASF AG | 8,181 | | 677,901 |
Bayer AG | 24,293 | | 2,115,637 |
Bilfinger Berger AG | 1,167 | | 114,187 |
CompuGROUP Holding AG | 3,446 | | 62,531 |
CTS Eventim AG | 4,250 | | 126,148 |
Daimler AG (Germany) | 22,353 | | 1,043,747 |
Deutsche Post AG | 40,282 | | 798,575 |
Fielmann AG | 1,079 | | 105,031 |
Fresenius SE & Co. KGaA | 5,800 | | 661,555 |
HeidelbergCement Finance AG | 10,700 | | 567,095 |
Linde AG | 13,449 | | 2,261,792 |
RWE AG | 23,200 | | 1,060,142 |
Siemens AG | 13,786 | | 1,389,063 |
Siemens AG sponsored ADR | 5,669 | | 572,059 |
Software AG (Bearer) | 1,959 | | 78,485 |
TOTAL GERMANY | | 13,673,551 |
Hong Kong - 2.5% |
Cathay Pacific Airways Ltd. | 393,000 | | 711,959 |
Common Stocks - continued |
| Shares | | Value |
Hong Kong - continued |
Cheung Kong Holdings Ltd. | 78,000 | | $ 1,152,380 |
China Insurance International Holdings Co. Ltd. (a) | 608,800 | | 1,043,201 |
China Merchant Holdings International Co. Ltd. | 234,000 | | 775,969 |
China Resources Enterprise Ltd. | 284,000 | | 923,452 |
China Resources Power Holdings Co. Ltd. | 250,000 | | 535,480 |
Dah Chong Hong Holdings Ltd. | 687,000 | | 647,992 |
Hopewell Holdings Ltd. | 163,500 | | 589,651 |
Hysan Development Co. Ltd. | 28,000 | | 123,741 |
Television Broadcasts Ltd. | 129,000 | | 961,252 |
TOTAL HONG KONG | | 7,465,077 |
Hungary - 0.2% |
Richter Gedeon PLC | 3,700 | | 690,100 |
India - 2.4% |
Bharti Airtel Ltd. | 173,106 | | 867,541 |
Cipla Ltd. | 79,925 | | 539,666 |
Container Corp. of India Ltd. | 33,774 | | 630,253 |
Housing Development Finance Corp. Ltd. (a) | 94,893 | | 1,344,516 |
Jyothy Laboratories Ltd. | 24,138 | | 79,563 |
Max India Ltd. (a) | 171,991 | | 773,888 |
Piramal Enterprises Ltd. | 58,571 | | 540,588 |
Punjab National Bank | 51,513 | | 730,982 |
Satyam Computer Services Ltd. (a) | 418,989 | | 850,360 |
Tata Power Co. Ltd. | 427,422 | | 842,451 |
TOTAL INDIA | | 7,199,808 |
Indonesia - 0.2% |
PT Kalbe Farma Tbk | 6,357,000 | | 641,985 |
Ireland - 0.6% |
CRH PLC sponsored ADR | 31,200 | | 581,880 |
Elan Corp. PLC sponsored ADR (a) | 28,485 | | 307,638 |
FBD Holdings PLC | 2,500 | | 31,270 |
James Hardie Industries NV: | | | |
CDI | 1,000 | | 9,581 |
sponsored ADR | 16,845 | | 810,076 |
TOTAL IRELAND | | 1,740,445 |
Israel - 0.1% |
Azrieli Group | 11,296 | | 252,176 |
Common Stocks - continued |
| Shares | | Value |
Israel - continued |
Ituran Location & Control Ltd. | 4,361 | | $ 53,902 |
Strauss Group Ltd. | 659 | | 7,446 |
TOTAL ISRAEL | | 313,524 |
Italy - 1.6% |
Azimut Holding SpA | 7,614 | | 96,419 |
ENI SpA | 123,700 | | 2,846,452 |
Fiat Industrial SpA | 81,628 | | 883,977 |
Interpump Group SpA | 51,091 | | 388,059 |
Saipem SpA | 13,530 | | 607,829 |
TOTAL ITALY | | 4,822,736 |
Japan - 10.8% |
Aeon Credit Service Co. Ltd. | 33,700 | | 715,117 |
Air Water, Inc. | 49,000 | | 613,804 |
Aozora Bank Ltd. | 158,000 | | 445,321 |
Asahi Co. Ltd. | 3,000 | | 45,171 |
Astellas Pharma, Inc. | 27,400 | | 1,360,904 |
Autobacs Seven Co. Ltd. | 11,900 | | 488,194 |
Azbil Corp. | 2,100 | | 42,958 |
Chubu Electric Power Co., Inc. | 36,200 | | 373,201 |
Cosmos Pharmaceutical Corp. | 400 | | 39,434 |
Credit Saison Co. Ltd. | 24,500 | | 537,999 |
Daikoku Denki Co. Ltd. | 1,000 | | 25,304 |
Daikokutenbussan Co. Ltd. | 3,800 | | 120,812 |
Denso Corp. | 64,500 | | 2,019,109 |
Fanuc Corp. | 7,700 | | 1,225,943 |
Fast Retailing Co. Ltd. | 3,400 | | 757,259 |
FCC Co. Ltd. | 5,500 | | 98,866 |
Fields Corp. | 2,000 | | 28,761 |
GCA Savvian Group Corp. | 44 | | 52,251 |
Glory Ltd. | 2,900 | | 70,402 |
Goldcrest Co. Ltd. | 3,280 | | 49,346 |
Hitachi Ltd. | 161,000 | | 853,100 |
Honda Motor Co. Ltd. | 50,100 | | 1,506,169 |
INPEX Corp. | 67 | | 381,874 |
Itochu Corp. | 60,800 | | 608,533 |
Iwatsuka Confectionary Co. Ltd. | 1,000 | | 37,430 |
Japan Retail Fund Investment Corp. | 257 | | 468,414 |
Japan Tobacco, Inc. | 53,900 | | 1,489,458 |
JS Group Corp. | 13,600 | | 300,689 |
JSR Corp. | 28,500 | | 488,388 |
Common Stocks - continued |
| Shares | | Value |
Japan - continued |
Kamigumi Co. Ltd. | 7,000 | | $ 56,470 |
Keyence Corp. | 4,321 | | 1,146,421 |
Kobayashi Pharmaceutical Co. Ltd. | 10,700 | | 564,957 |
Kyoto Kimono Yuzen Co. Ltd. | 3,800 | | 45,935 |
Meiko Network Japan Co. Ltd. | 3,700 | | 37,542 |
Miraial Co. Ltd. | 300 | | 5,712 |
Mitsubishi Corp. | 43,100 | | 769,354 |
Mitsubishi Estate Co. Ltd. | 47,000 | | 929,638 |
Mitsui Fudosan Co. Ltd. | 27,000 | | 545,547 |
Nabtesco Corp. | 3,600 | | 67,012 |
Nagaileben Co. Ltd. | 3,700 | | 54,320 |
Nihon M&A Center, Inc. | 4,000 | | 120,005 |
Nihon Parkerizing Co. Ltd. | 5,000 | | 75,473 |
Nintendo Co. Ltd. | 3,600 | | 463,585 |
Nippon Seiki Co. Ltd. | 6,000 | | 57,648 |
Nippon Telegraph & Telephone Corp. | 12,000 | | 548,738 |
Nippon Thompson Co. Ltd. | 14,000 | | 48,403 |
NS Tool Co., Ltd. | 1,600 | | 27,258 |
Obic Co. Ltd. | 310 | | 63,802 |
ORIX Corp. | 6,400 | | 657,397 |
Osaka Securities Exchange Co. Ltd. | 14 | | 52,173 |
OSG Corp. | 5,200 | | 68,070 |
Santen Pharmaceutical Co. Ltd. | 13,300 | | 582,281 |
Seven & i Holdings Co., Ltd. | 50,600 | | 1,560,531 |
Seven Bank Ltd. | 232,500 | | 664,036 |
SHO-BOND Holdings Co. Ltd. | 12,400 | | 374,811 |
Shoei Co. Ltd. | 3,900 | | 21,251 |
SMC Corp. | 2,200 | | 346,687 |
Softbank Corp. | 19,900 | | 629,930 |
Sumitomo Mitsui Financial Group, Inc. | 64,700 | | 1,977,038 |
Sumitomo Realty & Development Co. Ltd. | 20,000 | | 552,173 |
The Nippon Synthetic Chemical Industry Co. Ltd. | 10,000 | | 65,640 |
Tocalo Co. Ltd. | 2,000 | | 29,037 |
Toyo Suisan Kaisha Ltd. | 16,000 | | 398,647 |
Tsutsumi Jewelry Co. Ltd. | 1,200 | | 27,523 |
Unicharm Corp. | 10,100 | | 546,561 |
USS Co. Ltd. | 15,840 | | 1,664,758 |
Yamato Kogyo Co. Ltd. | 23,200 | | 651,274 |
TOTAL JAPAN | | 31,741,849 |
Korea (South) - 2.9% |
AMOREPACIFIC Corp. | 595 | | 676,682 |
Common Stocks - continued |
| Shares | | Value |
Korea (South) - continued |
BS Financial Group, Inc. | 91,770 | | $ 1,039,474 |
E-Mart Co. Ltd. | 3,360 | | 728,814 |
Kiwoom Securities Co. Ltd. | 11,170 | | 565,507 |
LG Corp. | 21,485 | | 1,312,368 |
LG Household & Health Care Ltd. | 1,406 | | 826,589 |
NICE Holdings Co. Ltd. | 600 | | 31,862 |
NICE Information Service Co. Ltd. | 7,500 | | 33,018 |
S1 Corp. | 10,741 | | 648,211 |
Samsung Fire & Marine Insurance Co. Ltd. | 4,109 | | 898,816 |
Shinsegae Co. Ltd. | 4,287 | | 766,715 |
Woongjin Coway Co. Ltd. | 1,880 | | 68,453 |
Yuhan Corp. | 4,588 | | 793,197 |
TOTAL KOREA (SOUTH) | | 8,389,706 |
Malaysia - 0.5% |
Axiata Group Bhd | 381,100 | | 817,000 |
Top Glove Corp. Bhd | 393,700 | | 691,495 |
TOTAL MALAYSIA | | 1,508,495 |
Mexico - 0.5% |
Bolsa Mexicana de Valores SA de CV | 406,600 | | 900,209 |
Urbi, Desarrollos Urbanos, SA de CV (a) | 892,000 | | 556,563 |
TOTAL MEXICO | | 1,456,772 |
Netherlands - 1.9% |
Aalberts Industries NV | 6,400 | | 116,135 |
ASM International NV unit | 2,250 | | 71,370 |
ASML Holding NV | 28,800 | | 1,583,136 |
D.E. Master Blenders 1753 NV (a) | 29,200 | | 356,865 |
Heijmans NV unit | 3,381 | | 28,629 |
ING Groep NV (Certificaten Van Aandelen) (a) | 152,478 | | 1,356,770 |
Koninklijke Philips Electronics NV | 36,839 | | 922,672 |
QIAGEN NV (a) | 3,000 | | 52,350 |
Unilever NV (Certificaten Van Aandelen) (Bearer) | 27,200 | | 999,726 |
TOTAL NETHERLANDS | | 5,487,653 |
Norway - 0.5% |
Orkla ASA (A Shares) | 53,082 | | 419,904 |
Telenor ASA | 45,711 | | 898,778 |
TOTAL NORWAY | | 1,318,682 |
Papua New Guinea - 0.3% |
Oil Search Ltd. ADR | 107,827 | | 832,758 |
Common Stocks - continued |
| Shares | | Value |
Philippines - 0.6% |
BDO Unibank, Inc. | 666,132 | | $ 1,037,286 |
Jollibee Food Corp. | 26,900 | | 69,181 |
Manila Water Co., Inc. | 1,106,700 | | 780,883 |
TOTAL PHILIPPINES | | 1,887,350 |
Poland - 0.2% |
Warsaw Stock Exchange | 54,438 | | 639,414 |
Portugal - 0.4% |
Jeronimo Martins SGPS SA | 64,569 | | 1,129,830 |
Singapore - 1.9% |
Ascendas India Trust | 931,000 | | 580,062 |
Ascendas Real Estate Investment Trust | 310,000 | | 599,770 |
Bumitama Agri Ltd. | 859,000 | | 707,735 |
ComfortDelgro Corp. Ltd. | 266,000 | | 368,536 |
Ezra Holdings Ltd. | 687,000 | | 627,976 |
Global Logistic Properties Ltd. | 372,000 | | 783,768 |
Singapore Telecommunications Ltd. | 267,000 | | 704,820 |
United Overseas Bank Ltd. | 77,746 | | 1,164,469 |
TOTAL SINGAPORE | | 5,537,136 |
South Africa - 2.8% |
African Rainbow Minerals Ltd. | 2,600 | | 54,425 |
AngloGold Ashanti Ltd. | 27,700 | | 935,854 |
Bidvest Group Ltd. | 29,400 | | 701,716 |
City Lodge Hotels Ltd. | 2,500 | | 26,526 |
Clicks Group Ltd. | 69,625 | | 480,031 |
Impala Platinum Holdings Ltd. | 46,100 | | 829,419 |
Mr Price Group Ltd. | 3,100 | | 47,891 |
MTN Group Ltd. | 60,100 | | 1,083,660 |
Nampak Ltd. | 176,100 | | 586,956 |
Reunert Ltd. | 63,000 | | 554,969 |
Sasol Ltd. | 25,800 | | 1,099,082 |
Standard Bank Group Ltd. | 82,600 | | 1,020,372 |
Tiger Brands Ltd. | 28,600 | | 909,062 |
TOTAL SOUTH AFRICA | | 8,329,963 |
Spain - 1.4% |
Banco Bilbao Vizcaya Argentaria SA sponsored ADR | 194,128 | | 1,611,262 |
Grifols SA (a) | 1,546 | | 53,623 |
Inditex SA | 8,110 | | 1,034,779 |
Common Stocks - continued |
| Shares | | Value |
Spain - continued |
Prosegur Compania de Seguridad SA (Reg.) | 96,376 | | $ 524,655 |
Repsol YPF SA | 42,765 | | 854,728 |
TOTAL SPAIN | | 4,079,047 |
Sweden - 1.5% |
ASSA ABLOY AB (B Shares) | 19,600 | | 653,343 |
Fagerhult AB | 11,100 | | 274,450 |
H&M Hennes & Mauritz AB (B Shares) | 33,386 | | 1,129,997 |
Intrum Justitia AB | 23,463 | | 339,587 |
Svenska Handelsbanken AB (A Shares) | 32,600 | | 1,116,664 |
Swedish Match Co. AB | 25,950 | | 884,183 |
TOTAL SWEDEN | | 4,398,224 |
Switzerland - 6.9% |
Holcim Ltd. (Reg.) | 13,460 | | 918,483 |
Nestle SA | 105,629 | | 6,703,182 |
Roche Holding AG (participation certificate) | 28,367 | | 5,455,309 |
Schindler Holding AG: | | | |
(participation certificate) | 3,536 | | 465,873 |
(Reg.) | 820 | | 106,099 |
Swatch Group AG (Bearer) | 1,230 | | 509,011 |
Swisscom AG | 1,648 | | 684,646 |
Syngenta AG (Switzerland) | 3,135 | | 1,222,304 |
UBS AG (NY Shares) | 169,037 | | 2,538,936 |
Zehnder Group AG | 993 | | 58,484 |
Zurich Financial Services AG | 6,802 | | 1,676,215 |
TOTAL SWITZERLAND | | 20,338,542 |
Taiwan - 3.7% |
Chinatrust Financial Holding Co. Ltd. | 2,114 | | 1,165 |
Chroma ATE, Inc. | 264,116 | | 502,734 |
CTCI Corp. | 248,000 | | 493,283 |
Delta Electronics, Inc. | 229,000 | | 782,410 |
E Sun Financial Holdings Co. Ltd. | 1,187,350 | | 595,504 |
Motech Industries, Inc. (a) | 458,000 | | 352,790 |
Powertech Technology, Inc. | 358,000 | | 556,426 |
President Chain Store Corp. | 126,000 | | 623,314 |
SIMPLO Technology Co. Ltd. | 88,300 | | 435,303 |
St. Shine Optical Co. Ltd. | 57,000 | | 743,478 |
Synnex Technology International Corp. | 286,000 | | 605,094 |
Taiwan Hon Chuan Enterprise Co. Ltd. | 258,000 | | 549,387 |
Taiwan Mobile Co. Ltd. | 219,000 | | 764,738 |
Taiwan Semiconductor Manufacturing Co. Ltd. | 444,035 | | 1,353,117 |
Common Stocks - continued |
| Shares | | Value |
Taiwan - continued |
Unified-President Enterprises Corp. | 684,800 | | $ 1,209,712 |
Wistron Corp. | 540,000 | | 518,555 |
WPG Holding Co. Ltd. | 558,000 | | 674,338 |
TOTAL TAIWAN | | 10,761,348 |
Turkey - 1.2% |
Albaraka Turk Katilim Bankasi A/S | 89,303 | | 70,745 |
Anadolu Efes Biracilik Ve Malt Sanayii A/S | 73,000 | | 1,095,509 |
Boyner Buyuk Magazacilik A/S (a) | 42,049 | | 96,648 |
Coca-Cola Icecek A/S | 39,789 | | 772,473 |
Enka Insaat ve Sanayi A/S | 224,680 | | 596,640 |
Turkiye Garanti Bankasi A/S | 121,500 | | 580,218 |
Turkiye Petrol Rafinerile A/S | 15,313 | | 374,175 |
TOTAL TURKEY | | 3,586,408 |
United Arab Emirates - 0.2% |
First Gulf Bank PJSC | 214,355 | | 609,858 |
United Kingdom - 16.8% |
AMEC PLC | 3,189 | | 54,550 |
Anglo American PLC (United Kingdom) | 12,500 | | 383,871 |
Babcock International Group PLC | 40,500 | | 639,190 |
Barclays PLC | 409,903 | | 1,515,713 |
Bellway PLC | 6,228 | | 101,610 |
Berendsen PLC | 5,246 | | 47,662 |
BG Group PLC | 113,677 | | 2,105,046 |
BHP Billiton PLC | 67,335 | | 2,158,171 |
BHP Billiton PLC ADR | 26,900 | | 1,721,062 |
BP PLC sponsored ADR | 42,587 | | 1,826,556 |
British American Tobacco PLC (United Kingdom) | 17,153 | | 850,782 |
British Land Co. PLC | 85,777 | | 731,564 |
Britvic PLC | 13,800 | | 79,993 |
Bunzl PLC | 43,757 | | 723,782 |
Centrica PLC | 199,975 | | 1,045,902 |
Compass Group PLC | 94,000 | | 1,031,509 |
Dechra Pharmaceuticals PLC | 8,600 | | 85,629 |
Derwent London PLC | 1,800 | | 59,896 |
Elementis PLC | 12,790 | | 43,199 |
GlaxoSmithKline PLC sponsored ADR | 79,097 | | 3,551,455 |
Great Portland Estates PLC | 15,772 | | 119,014 |
H&T Group PLC | 7,014 | | 32,542 |
HSBC Holdings PLC sponsored ADR | 61,131 | | 3,017,426 |
Imperial Tobacco Group PLC | 12,777 | | 482,482 |
Common Stocks - continued |
| Shares | | Value |
United Kingdom - continued |
InterContinental Hotel Group PLC ADR | 42,777 | | $ 1,053,170 |
Johnson Matthey PLC | 23,377 | | 848,427 |
Kingfisher PLC | 116,601 | | 544,737 |
Legal & General Group PLC | 464,777 | | 1,005,045 |
Meggitt PLC | 25,298 | | 157,583 |
National Grid PLC | 139,691 | | 1,593,114 |
Next PLC | 9,400 | | 540,935 |
Persimmon PLC | 6,137 | | 78,733 |
Prudential PLC | 68,427 | | 939,749 |
PZ Cussons PLC Class L | 157,519 | | 860,454 |
Reckitt Benckiser Group PLC | 22,851 | | 1,382,843 |
Reed Elsevier PLC | 107,134 | | 1,047,698 |
Rexam PLC | 59,209 | | 426,815 |
Rolls-Royce Group PLC | 67,452 | | 930,129 |
Rolls-Royce Group PLC Class C | 5,126,352 | | 8,273 |
Rotork PLC | 18,503 | | 680,193 |
Royal Dutch Shell PLC Class A sponsored ADR | 76,315 | | 5,226,051 |
SABMiller PLC | 31,063 | | 1,330,646 |
Scottish & Southern Energy PLC | 50,824 | | 1,187,609 |
Serco Group PLC | 68,159 | | 623,102 |
Shaftesbury PLC | 40,537 | | 358,483 |
Spectris PLC | 4,170 | | 116,283 |
Spirax-Sarco Engineering PLC | 5,404 | | 168,746 |
Standard Chartered PLC (United Kingdom) | 73,695 | | 1,740,472 |
Ted Baker PLC | 3,775 | | 57,751 |
Ultra Electronics Holdings PLC | 4,101 | | 112,043 |
Unite Group PLC | 91,702 | | 418,943 |
Victrex PLC | 4,718 | | 108,495 |
Vodafone Group PLC sponsored ADR | 127,532 | | 3,471,421 |
TOTAL UNITED KINGDOM | | 49,426,549 |
United States of America - 5.6% |
Allergan, Inc. | 6,500 | | 584,480 |
Amazon.com, Inc. (a) | 2,399 | | 558,535 |
ANSYS, Inc. (a) | 500 | | 35,440 |
Autoliv, Inc. | 16,910 | | 974,016 |
Berkshire Hathaway, Inc. Class B (a) | 9,945 | | 858,751 |
BorgWarner, Inc. (a) | 8,997 | | 592,183 |
BPZ Energy, Inc. (a) | 9,388 | | 27,037 |
Broadridge Financial Solutions, Inc. | 1,990 | | 45,671 |
CME Group, Inc. | 6,400 | | 357,952 |
Cummins, Inc. | 3,300 | | 308,814 |
Common Stocks - continued |
| Shares | | Value |
United States of America - continued |
Cymer, Inc. (a) | 6,083 | | $ 484,754 |
Dril-Quip, Inc. (a) | 1,210 | | 83,805 |
Evercore Partners, Inc. Class A | 1,860 | | 51,894 |
FMC Technologies, Inc. (a) | 10,803 | | 441,843 |
Freeport-McMoRan Copper & Gold, Inc. | 6,100 | | 237,168 |
Greenhill & Co., Inc. | 1,270 | | 60,604 |
Kansas City Southern | 1,420 | | 114,253 |
Martin Marietta Materials, Inc. | 3,690 | | 303,724 |
MasterCard, Inc. Class A | 3,609 | | 1,663,496 |
Mead Johnson Nutrition Co. Class A | 14,000 | | 863,240 |
Mohawk Industries, Inc. (a) | 6,805 | | 568,013 |
National Oilwell Varco, Inc. | 8,900 | | 655,930 |
Oceaneering International, Inc. | 1,680 | | 87,914 |
Philip Morris International, Inc. | 21,100 | | 1,868,616 |
PriceSmart, Inc. | 6,850 | | 568,482 |
ResMed, Inc. | 15,140 | | 604,692 |
Solera Holdings, Inc. | 7,202 | | 337,126 |
SS&C Technologies Holdings, Inc. (a) | 11,854 | | 284,852 |
Union Pacific Corp. | 7,900 | | 971,937 |
Virgin Media, Inc. | 22,733 | | 746,914 |
Visa, Inc. Class A | 9,301 | | 1,290,607 |
TOTAL UNITED STATES OF AMERICA | | 16,632,743 |
TOTAL COMMON STOCKS (Cost $273,143,791) |
288,268,394
|
Nonconvertible Preferred Stocks - 0.5% |
| | | |
Brazil - 0.0% |
Banco ABC Brasil SA | 13,794 | | 78,375 |
Germany - 0.5% |
ProSiebenSat.1 Media AG | 20,800 | | 579,638 |
Volkswagen AG | 4,434 | | 917,242 |
TOTAL NONCONVERTIBLE PREFERRED STOCKS (Cost $1,351,389) |
1,575,255
|
Money Market Funds - 2.1% |
| Shares | | Value |
Fidelity Cash Central Fund, 0.19% (b)
(Cost $6,092,586) | 6,092,586 | | $ 6,092,586 |
TOTAL INVESTMENT PORTFOLIO - 100.5% (Cost $280,587,766) | | 295,936,235 |
NET OTHER ASSETS (LIABILITIES) - (0.5)% | | (1,370,438) |
NET ASSETS - 100% | $ 294,565,797 |
Legend |
(a) Non-income producing |
(b) Affiliated fund that is available only to investment companies and other accounts managed by Fidelity Investments. The rate quoted is the annualized seven-day yield of the fund at period end. A complete unaudited listing of the fund's holdings as of its most recent quarter end is available upon request. In addition, each Fidelity Central Fund's financial statements, which are not covered by the Fund's Report of Independent Registered Public Accounting Firm, are available on the SEC's website or upon request. |
Affiliated Central Funds |
Information regarding fiscal year to date income earned by the Fund from investments in Fidelity Central Funds is as follows: |
Fund | Income earned |
Fidelity Cash Central Fund | $ 6,990 |
Fidelity Securities Lending Cash Central Fund | 151,487 |
Total | $ 158,477 |
Other Information |
Categorizations in the Schedule of Investments are based on country or territory of incorporation. |
The following is a summary of the inputs used, as of October 31, 2012, involving the Fund's assets and liabilities carried at fair value. The inputs or methodology used for valuing securities may not be an indication of the risk associated with investing in those securities. For more information on valuation inputs, and their aggregation into the levels used in the tables below, please refer to the Security Valuation section in the accompanying Notes to Financial Statements. |
Valuation Inputs at Reporting Date: |
Description | Total | Level 1 | Level 2 | Level 3 |
Investments in Securities: | | | | |
Equities: | | | | |
Consumer Discretionary | $ 30,059,832 | $ 28,553,663 | $ 1,506,169 | $ - |
Consumer Staples | 41,431,676 | 36,196,531 | 5,235,145 | - |
Energy | 22,006,300 | 18,060,766 | 3,945,534 | - |
Financials | 63,247,920 | 56,727,668 | 6,520,252 | - |
Health Care | 29,781,563 | 25,718,840 | 4,062,723 | - |
Industrials | 36,211,061 | 33,899,326 | 2,311,735 | - |
Information Technology | 18,619,115 | 17,265,998 | 1,353,117 | - |
Materials | 25,475,141 | 21,158,812 | 4,316,329 | - |
Telecommunication Services | 12,064,291 | 11,515,553 | 548,738 | - |
Utilities | 10,946,750 | 9,353,636 | 1,593,114 | - |
Money Market Funds | 6,092,586 | 6,092,586 | - | - |
Total Investments in Securities: | $ 295,936,235 | $ 264,543,379 | $ 31,392,856 | $ - |
The following is a summary of transfers between Level 1 and Level 2 for the period ended October 31, 2012. Transfers are assumed to have occurred at the beginning of the period, and are primarily attributable to the valuation techniques used for foreign equity securities, as discussed in the accompanying Notes to Financial Statements: |
Transfers | Total |
Level 1 to Level 2 | $ 0 |
Level 2 to Level 1 | $ 19,846,441 |
See accompanying notes which are an integral part of the financial statements.
Annual Report
Statement of Assets and Liabilities
| October 31, 2012 |
| | |
Assets | | |
Investment in securities, at value - See accompanying schedule: Unaffiliated issuers (cost $274,495,180) | $ 289,843,649 | |
Fidelity Central Funds (cost $6,092,586) | 6,092,586 | |
Total Investments (cost $280,587,766) | | $ 295,936,235 |
Foreign currency held at value (cost $23,243) | | 23,223 |
Receivable for investments sold | | 526,923 |
Receivable for fund shares sold | | 122,914 |
Dividends receivable | | 650,136 |
Distributions receivable from Fidelity Central Funds | | 4,446 |
Receivable from investment adviser for expense reductions | | 1,586 |
Other receivables | | 26,309 |
Total assets | | 297,291,772 |
| | |
Liabilities | | |
Payable to custodian bank | $ 472,489 | |
Payable for investments purchased | 806,751 | |
Payable for fund shares redeemed | 1,068,841 | |
Accrued management fee | 194,059 | |
Distribution and service plan fees payable | 4,561 | |
Other affiliated payables | 48,559 | |
Other payables and accrued expenses | 130,715 | |
Total liabilities | | 2,725,975 |
| | |
Net Assets | | $ 294,565,797 |
Net Assets consist of: | | |
Paid in capital | | $ 297,394,209 |
Undistributed net investment income | | 5,300,982 |
Accumulated undistributed net realized gain (loss) on investments and foreign currency transactions | | (23,430,376) |
Net unrealized appreciation (depreciation) on investments and assets and liabilities in foreign currencies | | 15,300,982 |
Net Assets | | $ 294,565,797 |
See accompanying notes which are an integral part of the financial statements.
Annual Report
Statement of Assets and Liabilities - continued
| October 31, 2012 |
| | |
Calculation of Maximum Offering Price Class A:
Net Asset Value and redemption price per share ($5,766,838 ÷ 789,026 shares) | | $ 7.31 |
| | |
Maximum offering price per share (100/94.25 of $7.31) | | $ 7.76 |
Class T:
Net Asset Value and redemption price per share ($2,348,287 ÷ 318,734 shares) | | $ 7.37 |
| | |
Maximum offering price per share (100/96.50 of $7.37) | | $ 7.64 |
Class B:
Net Asset Value and offering price per share ($219,813 ÷ 30,007 shares)A | | $ 7.33 |
| | |
Class C:
Net Asset Value and offering price per share ($2,737,321 ÷ 374,276 shares)A | | $ 7.31 |
| | |
Total International Equity:
Net Asset Value, offering price and redemption price per share ($281,979,071 ÷ 38,522,819 shares) | | $ 7.32 |
| | |
Institutional Class:
Net Asset Value, offering price and redemption price per share ($1,514,467 ÷ 207,475 shares) | | $ 7.30 |
A Redemption price per share is equal to net asset value less any applicable contingent deferred sales charge.
See accompanying notes which are an integral part of the financial statements.
Annual Report
Financial Statements - continued
Statement of Operations
| Year ended October 31, 2012 |
| | |
Investment Income | | |
Dividends | | $ 9,170,980 |
Interest | | 243 |
Income from Fidelity Central Funds | | 158,477 |
Income before foreign taxes withheld | | 9,329,700 |
Less foreign taxes withheld | | (704,106) |
Total income | | 8,625,594 |
| | |
Expenses | | |
Management fee
Basic fee | $ 1,851,948 | |
Performance adjustment | 105,713 | |
Transfer agent fees | 404,702 | |
Distribution and service plan fees | 44,605 | |
Accounting and security lending fees | 136,093 | |
Custodian fees and expenses | 312,577 | |
Independent trustees' compensation | 1,628 | |
Registration fees | 155,663 | |
Audit | 90,778 | |
Legal | 1,181 | |
Interest | 212 | |
Miscellaneous | 1,695 | |
Total expenses before reductions | 3,106,795 | |
Expense reductions | (96,572) | 3,010,223 |
Net investment income (loss) | | 5,615,371 |
Realized and Unrealized Gain (Loss) Net realized gain (loss) on: | | |
Investment securities: | | |
Unaffiliated issuers | 9,404,014 | |
Foreign currency transactions | (263,621) | |
Total net realized gain (loss) | | 9,140,393 |
Change in net unrealized appreciation (depreciation) on: Investment securities (net of increase in deferred foreign taxes of $35,138) | 20,557,485 | |
Assets and liabilities in foreign currencies | (20,296) | |
Total change in net unrealized appreciation (depreciation) | | 20,537,189 |
Net gain (loss) | | 29,677,582 |
Net increase (decrease) in net assets resulting from operations | | $ 35,292,953 |
See accompanying notes which are an integral part of the financial statements.
Annual Report
Statement of Changes in Net Assets
| Year ended
October 31,
2012 | Year ended
October 31,
2011 |
Increase (Decrease) in Net Assets | | |
Operations | | |
Net investment income (loss) | $ 5,615,371 | $ 1,864,848 |
Net realized gain (loss) | 9,140,393 | (8,998,027) |
Change in net unrealized appreciation (depreciation) | 20,537,189 | (8,597,909) |
Net increase (decrease) in net assets resulting
from operations | 35,292,953 | (15,731,088) |
Distributions to shareholders from net investment income | (1,867,192) | (953,041) |
Distributions to shareholders from net realized gain | - | (220,294) |
Total distributions | (1,867,192) | (1,173,335) |
Share transactions - net increase (decrease) | 122,647,348 | 86,742,563 |
Redemption fees | 3,128 | 14,195 |
Total increase (decrease) in net assets | 156,076,237 | 69,852,335 |
| | |
Net Assets | | |
Beginning of period | 138,489,560 | 68,637,225 |
End of period (including undistributed net investment income of $5,300,982 and undistributed net investment income of $1,552,849, respectively) | $ 294,565,797 | $ 138,489,560 |
See accompanying notes which are an integral part of the financial statements.
Annual Report
Financial Highlights - Class A
Years ended October 31, | 2012 | 2011 | 2010 | 2009 | 2008 F |
Selected Per-Share Data | | | | |
Net asset value, beginning of period | $ 6.67 | $ 7.36 | $ 6.40 | $ 4.90 | $ 10.00 |
Income from Investment Operations | | | | | |
Net investment income (loss) C | .13 | .11 | .08 | .06 | .11 |
Net realized and unrealized gain (loss) | .59 | (.69) | .95 | 1.55 | (5.21) |
Total from investment operations | .72 | (.58) | 1.03 | 1.61 | (5.10) |
Distributions from net investment income | (.08) | (.09) | (.04) | (.11) | - |
Distributions from net realized gain | - | (.02) | (.03) | - | - |
Total distributions | (.08) | (.11) | (.07) | (.11) | - |
Redemption fees added to paid in capital C, H | - | - | - | - | - |
Net asset value, end of period | $ 7.31 | $ 6.67 | $ 7.36 | $ 6.40 | $ 4.90 |
Total Return A, B | 10.88% | (8.03)% | 16.17% | 33.87% | (51.00)% |
Ratios to Average Net Assets D, G | | | | |
Expenses before reductions | 1.57% | 1.73% | 2.02% | 2.09% | 2.00% |
Expenses net of fee waivers, if any | 1.45% | 1.45% | 1.50% | 1.50% | 1.50% |
Expenses net of all reductions | 1.42% | 1.42% | 1.47% | 1.47% | 1.48% |
Net investment income (loss) | 1.88% | 1.44% | 1.15% | 1.13% | 1.35% |
Supplemental Data | | | | |
Net assets, end of period (000 omitted) | $ 5,767 | $ 4,307 | $ 5,029 | $ 3,727 | $ 5,944 |
Portfolio turnover rate E | 110% | 75% | 67% | 98% | 91% |
A Total returns would have been lower if certain expenses had not been reduced during the applicable periods shown.
B Total returns do not include the effect of the sales charges.
C Calculated based on average shares outstanding during the period.
D Fees and expenses of any underlying Fidelity Central Funds are not included in the Fund's expense ratio. The Fund indirectly bears its proportionate share of the expenses of any underlying Fidelity Central Funds.
E Amount does not include the portfolio activity of any underlying Fidelity Central Funds.
F For the period November 1, 2007 (commencement of operations) to October 31, 2008.
G Expense ratios reflect operating expenses of the class. Expenses before reductions do not reflect amounts reimbursed by the investment adviser or reductions from brokerage service arrangements or reductions from other expense offset arrangements and do not represent the amount paid by the class during periods when reimbursements or reductions occur. Expense ratios before reductions for start-up periods may not be representative of longer-term operating periods. Expenses net of fee waivers reflect expenses after reimbursement by the investment adviser but prior to reductions from brokerage service arrangements or other expense offset arrangements. Expenses net of all reductions represent the net expenses paid by the class.
H Amount represents less than $.01 per share.
See accompanying notes which are an integral part of the financial statements.
Annual Report
Financial Highlights - Class T
Years ended October 31, | 2012 | 2011 | 2010 | 2009 | 2008 F |
Selected Per-Share Data | | | | |
Net asset value, beginning of period | $ 6.73 | $ 7.41 | $ 6.40 | $ 4.88 | $ 10.00 |
Income from Investment Operations | | | | | |
Net investment income (loss) C | .11 | .09 | .06 | .04 | .09 |
Net realized and unrealized gain (loss) | .59 | (.68) | .95 | 1.57 | (5.21) |
Total from investment operations | .70 | (.59) | 1.01 | 1.61 | (5.12) |
Distributions from net investment income | (.06) | (.07) | - | (.09) | - |
Distributions from net realized gain | - | (.02) | - | - | - |
Total distributions | (.06) | (.09) | - | (.09) | - |
Redemption fees added to paid in capital C, H | - | - | - | - | - |
Net asset value, end of period | $ 7.37 | $ 6.73 | $ 7.41 | $ 6.40 | $ 4.88 |
Total Return A, B | 10.52% | (8.08)% | 15.78% | 33.74% | (51.20)% |
Ratios to Average Net Assets D, G | | | | |
Expenses before reductions | 1.84% | 2.02% | 2.31% | 2.34% | 2.42% |
Expenses net of fee waivers, if any | 1.70% | 1.70% | 1.75% | 1.75% | 1.75% |
Expenses net of all reductions | 1.67% | 1.67% | 1.72% | 1.72% | 1.73% |
Net investment income (loss) | 1.63% | 1.19% | .90% | .88% | 1.10% |
Supplemental Data | | | | |
Net assets, end of period (000 omitted) | $ 2,348 | $ 997 | $ 1,004 | $ 1,526 | $ 2,567 |
Portfolio turnover rate E | 110% | 75% | 67% | 98% | 91% |
A Total returns would have been lower if certain expenses had not been reduced during the applicable periods shown.
B Total returns do not include the effect of the sales charges.
C Calculated based on average shares outstanding during the period.
D Fees and expenses of any underlying Fidelity Central Funds are not included in the Fund's expense ratio. The Fund indirectly bears its proportionate share of the expenses of any underlying Fidelity Central Funds.
E Amount does not include the portfolio activity of any underlying Fidelity Central Funds.
F For the period November 1, 2007 (commencement of operations) to October 31, 2008.
G Expense ratios reflect operating expenses of the class. Expenses before reductions do not reflect amounts reimbursed by the investment adviser or reductions from brokerage service arrangements or reductions from other expense offset arrangements and do not represent the amount paid by the class during periods when reimbursements or reductions occur. Expense ratios before reductions for start-up periods may not be representative of longer-term operating periods. Expenses net of fee waivers reflect expenses after reimbursement by the investment adviser but prior to reductions from brokerage service arrangements or other expense offset arrangements. Expenses net of all reductions represent the net expenses paid by the class.
H Amount represents less than $.01 per share.
See accompanying notes which are an integral part of the financial statements.
Annual Report
Financial Highlights - Class B
Years ended October 31, | 2012 | 2011 | 2010 | 2009 | 2008 F |
Selected Per-Share Data | | | | |
Net asset value, beginning of period | $ 6.68 | $ 7.37 | $ 6.39 | $ 4.86 | $ 10.00 |
Income from Investment Operations | | | | | |
Net investment income (loss) C | .08 | .05 | .03 | .02 | .05 |
Net realized and unrealized gain (loss) | .59 | (.68) | .95 | 1.56 | (5.19) |
Total from investment operations | .67 | (.63) | .98 | 1.58 | (5.14) |
Distributions from net investment income | (.02) | (.04) | - | (.05) | - |
Distributions from net realized gain | - | (.02) | - | - | - |
Total distributions | (.02) | (.06) | - | (.05) | - |
Redemption fees added to paid in capital C, H | - | - | - | - | - |
Net asset value, end of period | $ 7.33 | $ 6.68 | $ 7.37 | $ 6.39 | $ 4.86 |
Total Return A, B | 10.05% | (8.66)% | 15.34% | 32.95% | (51.40)% |
Ratios to Average Net Assets D, G | | | | |
Expenses before reductions | 2.34% | 2.51% | 2.81% | 2.82% | 2.92% |
Expenses net of fee waivers, if any | 2.20% | 2.20% | 2.25% | 2.25% | 2.25% |
Expenses net of all reductions | 2.17% | 2.17% | 2.22% | 2.22% | 2.24% |
Net investment income (loss) | 1.13% | .69% | .40% | .38% | .60% |
Supplemental Data | | | | |
Net assets, end of period (000 omitted) | $ 220 | $ 254 | $ 327 | $ 1,337 | $ 2,505 |
Portfolio turnover rate E | 110% | 75% | 67% | 98% | 91% |
A Total returns would have been lower if certain expenses had not been reduced during the applicable periods shown.
B Total returns do not include the effect of the contingent deferred sales charge.
C Calculated based on average shares outstanding during the period.
D Fees and expenses of any underlying Fidelity Central Funds are not included in the Fund's expense ratio. The Fund indirectly bears its proportionate share of the expenses of any underlying Fidelity Central Funds.
E Amount does not include the portfolio activity of any underlying Fidelity Central Funds.
F For the period November 1, 2007 (commencement of operations) to October 31, 2008.
G Expense ratios reflect operating expenses of the class. Expenses before reductions do not reflect amounts reimbursed by the investment adviser or reductions from brokerage service arrangements or reductions from other expense offset arrangements and do not represent the amount paid by the class during periods when reimbursements or reductions occur. Expense ratios before reductions for start-up periods may not be representative of longer-term operating periods. Expenses net of fee waivers reflect expenses after reimbursement by the investment adviser but prior to reductions from brokerage service arrangements or other expense offset arrangements. Expenses net of all reductions represent the net expenses paid by the class.
H Amount represents less than $.01 per share.
See accompanying notes which are an integral part of the financial statements.
Annual Report
Financial Highlights - Class C
Years ended October 31, | 2012 | 2011 | 2010 | 2009 | 2008 F |
Selected Per-Share Data | | | | |
Net asset value, beginning of period | $ 6.67 | $ 7.36 | $ 6.39 | $ 4.86 | $ 10.00 |
Income from Investment Operations | | | | | |
Net investment income (loss) C | .08 | .05 | .03 | .02 | .05 |
Net realized and unrealized gain (loss) | .58 | (.69) | .94 | 1.56 | (5.19) |
Total from investment operations | .66 | (.64) | .97 | 1.58 | (5.14) |
Distributions from net investment income | (.02) | (.03) | - | (.05) | - |
Distributions from net realized gain | - | (.02) | - | - | - |
Total distributions | (.02) | (.05) | - | (.05) | - |
Redemption fees added to paid in capital C, H | - | - | - | - | - |
Net asset value, end of period | $ 7.31 | $ 6.67 | $ 7.36 | $ 6.39 | $ 4.86 |
Total Return A, B | 9.98% | (8.72)% | 15.18% | 33.10% | (51.40)% |
Ratios to Average Net Assets D, G | | | | |
Expenses before reductions | 2.31% | 2.51% | 2.80% | 2.85% | 2.92% |
Expenses net of fee waivers, if any | 2.20% | 2.20% | 2.25% | 2.25% | 2.25% |
Expenses net of all reductions | 2.17% | 2.17% | 2.22% | 2.22% | 2.23% |
Net investment income (loss) | 1.13% | .69% | .40% | .38% | .60% |
Supplemental Data | | | | |
Net assets, end of period (000 omitted) | $ 2,737 | $ 1,396 | $ 1,423 | $ 1,714 | $ 2,787 |
Portfolio turnover rate E | 110% | 75% | 67% | 98% | 91% |
A Total returns would have been lower if certain expenses had not been reduced during the applicable periods shown.
B Total returns do not include the effect of the contingent deferred sales charge.
C Calculated based on average shares outstanding during the period.
D Fees and expenses of any underlying Fidelity Central Funds are not included in the Fund's expense ratio. The Fund indirectly bears its proportionate share of the expenses of any underlying Fidelity Central Funds.
E Amount does not include the portfolio activity of any underlying Fidelity Central Funds.
F For the period November 1, 2007 (commencement of operations) to October 31, 2008.
G Expense ratios reflect operating expenses of the class. Expenses before reductions do not reflect amounts reimbursed by the investment adviser or reductions from brokerage service arrangements or reductions from other expense offset arrangements and do not represent the amount paid by the class during periods when reimbursements or reductions occur. Expense ratios before reductions for start-up periods may not be representative of longer-term operating periods. Expenses net of fee waivers reflect expenses after reimbursement by the investment adviser but prior to reductions from brokerage service arrangements or other expense offset arrangements. Expenses net of all reductions represent the net expenses paid by the class.
H Amount represents less than $.01 per share.
See accompanying notes which are an integral part of the financial statements.
Annual Report
Financial Highlights - Total International Equity
Years ended October 31, | 2012 | 2011 | 2010 | 2009 | 2008 E |
Selected Per-Share Data | | | | |
Net asset value, beginning of period | $ 6.69 | $ 7.37 | $ 6.41 | $ 4.91 | $ 10.00 |
Income from Investment Operations | | | | | |
Net investment income (loss) B | .15 | .12 | .09 | .07 | .13 |
Net realized and unrealized gain (loss) | .58 | (.68) | .96 | 1.55 | (5.21) |
Total from investment operations | .73 | (.56) | 1.05 | 1.62 | (5.08) |
Distributions from net investment income | (.10) | (.10) | (.06) | (.12) | (.01) |
Distributions from net realized gain | - | (.02) | (.03) | - | - |
Total distributions | (.10) | (.12) | (.09) | (.12) | (.01) |
Redemption fees added to paid in capital B, G | - | - | - | - | - |
Net asset value, end of period | $ 7.32 | $ 6.69 | $ 7.37 | $ 6.41 | $ 4.91 |
Total Return A | 11.03% | (7.70)% | 16.45% | 34.23% | (50.87)% |
Ratios to Average Net Assets C, F | | | | |
Expenses before reductions | 1.16% | 1.42% | 1.79% | 1.87% | 1.89% |
Expenses net of fee waivers, if any | 1.16% | 1.20% | 1.25% | 1.25% | 1.25% |
Expenses net of all reductions | 1.13% | 1.17% | 1.22% | 1.22% | 1.23% |
Net investment income (loss) | 2.16% | 1.69% | 1.40% | 1.38% | 1.60% |
Supplemental Data | | | | |
Net assets, end of period (000 omitted) | $ 281,979 | $ 131,338 | $ 60,826 | $ 33,061 | $ 23,226 |
Portfolio turnover rate D | 110% | 75% | 67% | 98% | 91% |
A Total returns would have been lower if certain expenses had not been reduced during the applicable periods shown.
B Calculated based on average shares outstanding during the period.
C Fees and expenses of any underlying Fidelity Central Funds are not included in the Fund's expense ratio. The Fund indirectly bears its proportionate share of the expenses of any underlying Fidelity Central Funds.
D Amount does not include the portfolio activity of any underlying Fidelity Central Funds.
E For the period November 1, 2007 (commencement of operations) to October 31, 2008.
F Expense ratios reflect operating expenses of the class. Expenses before reductions do not reflect amounts reimbursed by the investment adviser or reductions from brokerage service arrangements or reductions from other expense offset arrangements and do not represent the amount paid by the class during periods when reimbursements or reductions occur. Expense ratios before reductions for start-up periods may not be representative of longer-term operating periods. Expenses net of fee waivers reflect expenses after reimbursement by the investment adviser but prior to reductions from brokerage service arrangements or other expense offset arrangements. Expenses net of all reductions represent the net expenses paid by the class.
G Amount represents less than $.01 per share.
See accompanying notes which are an integral part of the financial statements.
Annual Report
Financial Highlights - Institutional Class
Years ended October 31, | 2012 | 2011 | 2010 | 2009 | 2008 E |
Selected Per-Share Data | | | | |
Net asset value, beginning of period | $ 6.67 | $ 7.35 | $ 6.41 | $ 4.91 | $ 10.00 |
Income from Investment Operations | | | | | |
Net investment income (loss) B | .14 | .12 | .10 | .07 | .13 |
Net realized and unrealized gain (loss) | .59 | (.68) | .95 | 1.55 | (5.21) |
Total from investment operations | .73 | (.56) | 1.05 | 1.62 | (5.08) |
Distributions from net investment income | (.10) | (.10) | (.08) | (.12) | (.01) |
Distributions from net realized gain | - | (.02) | (.03) | - | - |
Total distributions | (.10) | (.12) | (.11) | (.12) | (.01) |
Redemption fees added to paid in capital B, G | - | - | - | - | - |
Net asset value, end of period | $ 7.30 | $ 6.67 | $ 7.35 | $ 6.41 | $ 4.91 |
Total Return A | 11.06% | (7.72)% | 16.48% | 34.23% | (50.87)% |
Ratios to Average Net Assets C, F | | | | |
Expenses before reductions | 1.27% | 1.48% | 1.82% | 1.80% | 1.91% |
Expenses net of fee waivers, if any | 1.20% | 1.20% | 1.25% | 1.25% | 1.25% |
Expenses net of all reductions | 1.17% | 1.17% | 1.23% | 1.22% | 1.23% |
Net investment income (loss) | 2.13% | 1.69% | 1.40% | 1.38% | 1.60% |
Supplemental Data | | | | |
Net assets, end of period (000 omitted) | $ 1,514 | $ 197 | $ 28 | $ 1,308 | $ 2,733 |
Portfolio turnover rate D | 110% | 75% | 67% | 98% | 91% |
A Total returns would have been lower if certain expenses had not been reduced during the applicable periods shown.
B Calculated based on average shares outstanding during the period.
C Fees and expenses of any underlying Fidelity Central Funds are not included in the Fund's expense ratio. The Fund indirectly bears its proportionate share of the expenses of any underlying Fidelity Central Funds.
D Amount does not include the portfolio activity of any underlying Fidelity Central Funds.
E For the period November 1, 2007 (commencement of operations) to October 31, 2008.
F Expense ratios reflect operating expenses of the class. Expenses before reductions do not reflect amounts reimbursed by the investment adviser or reductions from brokerage service arrangements or reductions from other expense offset arrangements and do not represent the amount paid by the class during periods when reimbursements or reductions occur. Expense ratios before reductions for start-up periods may not be representative of longer-term operating periods. Expenses net of fee waivers reflect expenses after reimbursement by the investment adviser but prior to reductions from brokerage service arrangements or other expense offset arrangements. Expenses net of all reductions represent the net expenses paid by the class.
G Amount represents less than $.01 per share.
See accompanying notes which are an integral part of the financial statements.
Annual Report
Notes to Financial Statements
For the period ended October 31, 2012
1. Organization.
Fidelity Total International Equity Fund (the Fund) is a fund of Fidelity Investment Trust (the Trust) and is authorized to issue an unlimited number of shares. The Trust is registered under the Investment Company Act of 1940, as amended (the 1940 Act), as an open-end management investment company organized as a Massachusetts business trust. The Fund offers Class A, Class T, Class C, Total International Equity and Institutional Class shares, each of which, along with Class B shares, has equal rights as to assets and voting privileges. Effective after the close of business on September 1, 2010, Class B shares were closed to new accounts and additional purchases, except for exchanges and reinvestments. Each class has exclusive voting rights with respect to matters that affect that class. Class B shares will automatically convert to Class A shares after a holding period of seven years from the initial date of purchase. Investment income, realized and unrealized capital gains and losses, the common expenses of the Fund, and certain fund-level expense reductions, if any, are allocated on a pro-rata basis to each class based on the relative net assets of each class to the total net assets of the Fund. Each class differs with respect to transfer agent and distribution and service plan fees incurred. Certain expense reductions may also differ by class. The Fund's investments in emerging markets can be subject to social, economic, regulatory, and political uncertainties and can be extremely volatile.
2. Investments in Fidelity Central Funds.
The Fund invests in Fidelity Central Funds, which are open-end investment companies available only to other investment companies and accounts managed by Fidelity Management & Research Company (FMR) and its affiliates. The Fund's Schedule of Investments lists each of the Fidelity Central Funds held as of period end, if any, as an investment of the Fund, but does not include the underlying holdings of each Fidelity Central Fund. As an Investing Fund, the Fund indirectly bears its proportionate share of the expenses of the underlying Fidelity Central Funds.
The Money Market Central Funds seek preservation of capital and current income and are managed by Fidelity Investments Money Management, Inc. (FIMM), an affiliate of FMR.
A complete unaudited list of holdings for each Fidelity Central Fund is available upon request or at the Securities and Exchange Commission (the SEC) web site at www.sec.gov. In addition, the financial statements of the Fidelity Central Funds, which are not covered by the Fund's Report of Independent Registered Public Accounting Firm, are available on the SEC web site or upon request.
Annual Report
Notes to Financial Statements - continued
3. Significant Accounting Policies.
The financial statements have been prepared in conformity with accounting principles generally accepted in the United States of America (GAAP), which require management to make certain estimates and assumptions at the date of the financial statements. Actual results could differ from those estimates. Subsequent events, if any, through the date that the financial statements were issued have been evaluated in the preparation of the financial statements. The following summarizes the significant accounting policies of the Fund:
Security Valuation. Investments are valued as of 4:00 p.m. Eastern time on the last calendar day of the period. In accordance with valuation policies and procedures approved by the Board of Trustees (the Board), the Fund attempts to obtain prices from one or more third party pricing vendors or brokers to value its investments. When current market prices, quotations or rates are not readily available or reliable, securities will be fair valued in good faith by the FMR Fair Value Committee (the Committee), in accordance with procedures adopted by the Fund's Board. Factors used in determining fair value vary by security type and may include market or security specific events. The frequency with which these procedures are used cannot be predicted and they may be utilized to a significant extent. The Committee oversees the Fund's valuation policies and procedures and is responsible for approving and reporting to the Board all fair value determinations.
The Fund categorizes the inputs to valuation techniques used to value its investments into a disclosure hierarchy consisting of three levels as shown below:
Level 1 - quoted prices in active markets for identical investments
Level 2 - other significant observable inputs (including quoted prices for similar investments, interest rates, prepayment speeds, etc.)
Level 3 - unobservable inputs (including the Fund's own assumptions based on the best information available)
Valuation techniques used to value the Fund's investments by major category are as follows:
Equity securities, including restricted securities, for which market quotations are readily available, are valued at the last reported sale price or official closing price as reported by a third party pricing vendor on the primary market or exchange on which they are traded and are categorized as Level 1 in the hierarchy. In the event there were no sales during the day or closing prices are not available, securities are valued at the last quoted bid price or may be valued using the last available price and are generally categorized as Level 2 in the hierarchy. For foreign equity securities, when significant market or security specific events arise, comparisons to the valuation of American Depositary Receipts
Annual Report
3. Significant Accounting Policies - continued
Security Valuation - continued
(ADRs), futures contracts, Exchange-Traded Funds (ETFs) and certain indexes as well as quoted prices for similar securities are used and are categorized as Level 2 in the hierarchy. Utilizing these techniques may result in transfers between Level 1 and Level 2.
Investments in open-end mutual funds, including the Fidelity Central Funds, are valued at their closing net asset value (NAV) each business day and are categorized as Level 1 in the hierarchy.
Changes in valuation techniques may result in transfers in or out of an assigned level within the disclosure hierarchy. The aggregate value of investments by input level, as of October 31, 2012, including information on transfers between Levels 1 and 2, is included at the end of the Fund's Schedule of Investments.
Foreign Currency Translation. The Fund may use foreign currency contracts to facilitate transactions in foreign-denominated securities. Gains and losses from these transactions may arise from changes in the value of the foreign currency or if the counterparties do not perform under the contracts' terms.
Foreign-denominated assets, including investment securities, and liabilities are translated into U.S. dollars at the exchange rates at period end. Purchases and sales of investment securities, income and dividends received and expenses denominated in foreign currencies are translated into U.S. dollars at the exchange rate in effect on the transaction date.
The effects of exchange rate fluctuations on investments are included with the net realized and unrealized gain (loss) on investment securities. Other foreign currency transactions resulting in realized and unrealized gain (loss) are disclosed separately.
Investment Transactions and Income. For financial reporting purposes, the Fund's investment holdings and NAV include trades executed through the end of the last business day of the period. The NAV per share for processing shareholder transactions is calculated as of the close of business of the New York Stock Exchange (NYSE), normally 4:00 p.m. Eastern time and includes trades executed through the end of the prior business day. Gains and losses on securities sold are determined on the basis of identified cost and may include proceeds received from litigation. Dividend income is recorded on the ex-dividend date, except for certain dividends from foreign securities where the ex-dividend date may have passed, which are recorded as soon as the Fund is informed of the ex-dividend date. Non-cash dividends included in dividend income, if any, are recorded at the fair market value of the securities received. Distributions received on securities that represent a return of capital or capital gain are recorded as a reduction of cost of investments and/or as a realized gain. The Fund estimates the components of
Annual Report
Notes to Financial Statements - continued
3. Significant Accounting Policies - continued
Investment Transactions and Income - continued
distributions received that may be considered return of capital distributions or capital gain distributions. Interest income and distributions from the Fidelity Central Funds are accrued as earned. Interest income includes coupon interest and amortization of premium and accretion of discount on debt securities. Investment income is recorded net of foreign taxes withheld where recovery of such taxes is uncertain.
Expenses. Expenses directly attributable to a fund are charged to that fund. Expenses attributable to more than one fund are allocated among the respective funds on the basis of relative net assets or other appropriate methods. Expense estimates are accrued in the period to which they relate and adjustments are made when actual amounts are known.
Income Tax Information and Distributions to Shareholders. Each year, the Fund intends to qualify as a regulated investment company under Subchapter M of the Internal Revenue Code, including distributing substantially all of its taxable income and realized gains. As a result, no provision for income taxes is required. As of October 31, 2012, the Fund did not have any unrecognized tax benefits in the financial statements; nor is the Fund aware of any tax positions for which it is reasonably possible that the total amounts of unrecognized tax benefits will significantly change in the next twelve months. The Fund files a U.S. federal tax return, in addition to state and local tax returns as required. A fund's federal income tax returns are subject to examination by the Internal Revenue Service (IRS) for a period of three fiscal years after they are filed. State and local tax returns may be subject to examination for an additional fiscal year depending on the jurisdiction. Foreign taxes are provided for based on the Fund's understanding of the tax rules and rates that exist in the foreign markets in which it invests. The Fund is subject to a tax imposed on capital gains by certain countries in which it invests. An estimated deferred tax liability for net unrealized appreciation on the applicable securities is included in Other payables and accrued expenses on the Statement of Assets & Liabilities.
Distributions are declared and recorded on the ex-dividend date. Income dividends and capital gain distributions are declared separately for each class. Income and capital gain distributions are determined in accordance with income tax regulations, which may differ from GAAP.
Capital accounts within the financial statements are adjusted for permanent book-tax differences. These adjustments have no impact on net assets or the results of operations. Temporary book-tax differences will reverse in a subsequent period.
Book-tax differences are primarily due to foreign currency transactions, passive foreign investment companies (PFIC), partnerships, capital loss carryforwards and losses deferred due to wash sales.
Annual Report
3. Significant Accounting Policies - continued
Income Tax Information and Distributions to Shareholders - continued
The federal tax cost of investment securities and unrealized appreciation (depreciation) as of period end were as follows:
Gross unrealized appreciation | $ 27,195,779 |
Gross unrealized depreciation | (13,448,638) |
Net unrealized appreciation (depreciation) on securities and other investments | $ 13,747,141 |
| |
Tax Cost | $ 282,189,094 |
The tax-based components of distributable earnings as of period end were as follows:
Undistributed ordinary income | $ 14,696,955 |
Undistributed long-term capital gain | $ 309,806 |
Capital loss carryforward | $ (31,534,827) |
Net unrealized appreciation (depreciation) | $ 13,734,792 |
Capital loss carryforwards are only available to offset future capital gains of the Fund to the extent provided by regulations and may be limited. Under the Regulated Investment Company Modernization Act of 2010 (the Act), the Fund is permitted to carry forward capital losses incurred in taxable years beginning after December 22, 2010 for an unlimited period and such capital losses are required to be used prior to any losses that expire. Capital loss carryforwards were as follows:
Fiscal year of expiration | |
2016 | $ (6,969,886) |
2017 | (15,708,944) |
2019 | (8,855,997) |
Total capital loss carryforward | $ (31,534,827) |
As a result of a large subscription in December 2011, the Fund had an "ownership change" under the Internal Revenue Code, which limits capital losses that will be available to offset future capital gains to approximately $4,535,766 per year plus certain gains in the Fund existing at the time of the ownership change. As a result, at least $1,623,551 of the Fund's capital loss carryforward will expire unused and is not included in the capital loss carryforward amounts disclosed above.
The tax character of distributions paid was as follows:
| October 31, 2012 | October 31, 2011 |
Ordinary Income | $ 1,867,192 | $ 1,173,335 |
Annual Report
Notes to Financial Statements - continued
3. Significant Accounting Policies - continued
Short-Term Trading (Redemption) Fees. Shares held by investors in the Fund less than 30 days are subject to a redemption fee equal to 1.00% of the net asset value of shares redeemed. All redemption fees, which reduce the proceeds of the shareholder redemption, are retained by the Fund and accounted for as an addition to paid in capital.
New Accounting Pronouncement. In December 2011, the Financial Accounting Standards Board issued Accounting Standard Update No. 2011-11, Disclosures about Offsetting Assets and Liabilities. The update creates new disclosure requirements requiring entities to disclose both gross and net information for derivatives and other financial instruments that are either offset in the Statement of Assets and Liabilities or subject to an enforceable master netting arrangement or similar agreement. The disclosure requirements are effective for annual reporting periods beginning on or after January 1, 2013, and interim periods within those annual periods. Management is currently evaluating the impact of the update's adoption on the Fund's financial statement disclosures.
4. Purchases and Sales of Investments.
Purchases and sales of securities, other than short-term securities, aggregated $402,947,967 and $277,094,245, respectively.
5. Fees and Other Transactions with Affiliates.
Management Fee. FMR and its affiliates provide the Fund with investment management related services for which the Fund pays a monthly management fee. The management fee is the sum of an individual fund fee rate that is based on an annual rate of .45% of the Fund's average net assets and an annualized group fee rate that averaged .26% during the period. The group fee rate is based upon the average net assets of all the mutual funds advised by FMR. The group fee rate decreases as assets under management increase and increases as assets under management decrease. In addition, the management fee is subject to a performance adjustment (up to a maximum of ± .20% of the Fund's average net assets over a 36 month performance period). The upward or downward adjustment to the management fee is based on the relative investment performance of Total International Equity as compared to an appropriate benchmark index. For the period, the total annual management fee rate, including the performance adjustment, was .75% of the Fund's average net assets.
Distribution and Service Plan Fees. In accordance with Rule 12b-1 of the 1940 Act, the Fund has adopted separate Distribution and Service Plans for each class of shares. Certain classes pay Fidelity Distributors Corporation (FDC), an affiliate of FMR, separate Distribution and Service Fees, each of which is based on an annual percentage of each class' average net assets. In addition, FDC may pay financial intermediaries for
Annual Report
5. Fees and Other Transactions with Affiliates - continued
Distribution and Service Plan Fees - continued
selling shares of the Fund and providing shareholder support services. For the period, the Distribution and Service Fee rates, total fees and amounts retained by FDC were as follows:
| Distribution
Fee | Service
Fee | Total Fees | Retained
by FDC |
Class A | -% | .25% | $ 12,621 | $ 968 |
Class T | .25% | .25% | 6,560 | 86 |
Class B | .75% | .25% | 2,453 | 1,851 |
Class C | .75% | .25% | 22,971 | 2,990 |
| | | $ 44,605 | $ 5,895 |
Sales Load. FDC may receive a front-end sales charge of up to 5.75% for selling Class A shares and 3.50% for selling Class T shares, some of which is paid to financial intermediaries for selling shares of the Fund. Depending on the holding period, FDC may receive contingent deferred sales charges levied on Class A, Class T, Class B, and Class C redemptions. The deferred sales charges range from 5.00% to 1.00% for Class B shares, 1.00% for Class C shares, 1.00% for certain purchases of Class A shares and .25% for certain purchases of Class T shares.
For the period, sales charge amounts retained by FDC were as follows:
| Retained
by FDC |
Class A | $ 3,215 |
Class T | 893 |
Class B* | 362 |
Class C* | 249 |
| $ 4,719 |
* When Class B and Class C shares are initially sold, FDC pays commissions from its own resources to financial intermediaries through which the sales are made.
Transfer Agent Fees. Fidelity Investments Institutional Operations Company, Inc. (FIIOC), an affiliate of FMR, is the transfer, dividend disbursing and shareholder servicing agent for each class of the Fund. FIIOC receives account fees and asset-based fees that vary according to the account size and type of account of the shareholders of the respective classes of the Fund. FIIOC pays for typesetting, printing and mailing of
Annual Report
Notes to Financial Statements - continued
5. Fees and Other Transactions with Affiliates - continued
Transfer Agent Fees - continued
shareholder reports, except proxy statements. For the period, transfer agent fees for each class were as follows:
| Amount | % of
Average
Net Assets |
Class A | $ 15,172 | .30 |
Class T | 4,212 | .32 |
Class B | 743 | .30 |
Class C | 6,965 | .30 |
Total International Equity | 375,719 | .15 |
Institutional Class | 1,891 | .29 |
| $ 404,702 | |
Accounting and Security Lending Fees. Fidelity Service Company, Inc. (FSC), an affiliate of FMR, maintains the Fund's accounting records. The accounting fee is based on the level of average net assets for each month. Under a separate contract, FSC administers the security lending program. The security lending fee is based on the number and duration of lending transactions.
Brokerage Commissions. The Fund placed a portion of its portfolio transactions with brokerage firms which are affiliates of the investment adviser. The commissions paid to these affiliated firms were $1,696 for the period.
Interfund Lending Program. Pursuant to an Exemptive Order issued by the SEC, the Fund, along with other registered investment companies having management contracts with FMR, may participate in an interfund lending program. This program provides an alternative credit facility allowing the funds to borrow from, or lend money to, other participating affiliated funds. At period end, there were no interfund loans outstanding. The Fund's activity in this program during the period for which loans were outstanding was as follows:
Borrower or Lender | Average Loan
Balance | Weighted Average
Interest Rate | Interest
Expense |
Borrower | $ 6,692,667 | .38% | $ 212 |
6. Committed Line of Credit.
The Fund participates with other funds managed by FMR or an affiliate in a $4.25 billion credit facility (the "line of credit") to be utilized for temporary or emergency purposes to fund shareholder redemptions or for other short-term liquidity purposes. The Fund has agreed to pay commitment fees on its pro-rata portion of the line of credit, which
Annual Report
6. Committed Line of Credit - continued
amounted to $670 and is reflected in Miscellaneous expenses on the Statement of Operations. During the period, there were no borrowings on this line of credit.
7. Security Lending.
The Fund lends portfolio securities through a lending agent from time to time in order to earn additional income. For equity securities, a lending agent is used and may loan securities to certain qualified borrowers, including Fidelity Capital Markets (FCM), a broker-dealer affiliated with the Fund. On the settlement date of the loan, the Fund receives collateral (in the form of U.S. Treasury obligations, letters of credit and/or cash) against the loaned securities and maintains collateral in an amount not less than 100% of the market value of the loaned securities during the period of the loan. The market value of the loaned securities is determined at the close of business of the Fund and any additional required collateral is delivered to the Fund on the next business day. If the borrower defaults on its obligation to return the securities loaned because of insolvency or other reasons, a fund could experience delays and costs in recovering the securities loaned or in gaining access to the collateral. Any cash collateral received is invested in the Fidelity Securities Lending Cash Central Fund. Security lending income represents the income earned on investing cash collateral, less rebates paid to borrowers and any lending agent fees associated with the loan, plus any premium payments received for lending certain types of securities. Security lending income is presented in the Statement of Operations as a component of income from Fidelity Central Funds. Total security lending income during the period amounted to $151,487. During the period, there were no securities loaned to FCM.
8. Expense Reductions.
FMR contractually agreed to reimburse each class to the extent annual operating expenses exceeded certain levels of average net assets as noted in the table below. This reimbursement will remain in place through December 31, 2013. Some expenses, for example interest expense, including commitment fees, are excluded from this reimbursement.
The following classes were in reimbursement during the period:
| Expense
Limitations | Reimbursement
from adviser |
Class A | 1.45% | $ 5,921 |
Class T | 1.70% | 1,880 |
Class B | 2.20% | 335 |
Class C | 2.20% | 2,543 |
Institutional Class | 1.20% | 416 |
| | $ 11,095 |
Annual Report
Notes to Financial Statements - continued
8. Expense Reductions - continued
Many of the brokers with whom FMR places trades on behalf of the Fund provided services to the Fund in addition to trade execution. These services included payments of certain expenses on behalf of the Fund totaling $85,477 for the period.
9. Distributions to Shareholders.
Distributions to shareholders of each class were as follows:
Years ended October 31, | 2012 | 2011 |
From net investment income | | |
Class A | $ 48,329 | $ 61,018 |
Class T | 9,062 | 9,414 |
Class B | 714 | 1,488 |
Class C | 4,731 | 6,263 |
Total International Equity | 1,801,469 | 873,280 |
Institutional Class | 2,887 | 1,578 |
Total | $ 1,867,192 | $ 953,041 |
From net realized gain | | |
Class A | $ - | $ 16,196 |
Class T | - | 3,213 |
Class B | - | 1,016 |
Class C | - | 4,485 |
Total International Equity | - | 195,026 |
Institutional Class | - | 358 |
Total | $ - | $ 220,294 |
10. Share Transactions.
Transactions for each class of shares were as follows:
| Shares | Dollars |
Years ended October 31, | 2012 | 2011 | 2012 | 2011 |
Class A | | | | |
Shares sold | 388,955 | 231,083 | $ 2,677,369 | $ 1,708,687 |
Reinvestment of distributions | 7,157 | 10,039 | 46,237 | 74,076 |
Shares redeemed | (252,362) | (279,366) | (1,699,392) | (2,035,449) |
Net increase (decrease) | 143,750 | (38,244) | $ 1,024,214 | $ (252,686) |
Class T | | | | |
Shares sold | 207,939 | 37,121 | $ 1,463,372 | $ 276,509 |
Reinvestment of distributions | 1,377 | 1,678 | 8,993 | 12,524 |
Shares redeemed | (38,757) | (25,970) | (259,817) | (191,826) |
Net increase (decrease) | 170,559 | 12,829 | $ 1,212,548 | $ 97,207 |
Annual Report
10. Share Transactions - continued
| Shares | Dollars |
Years ended October 31, | 2012 | 2011 | 2012 | 2011 |
Class B | | | | |
Shares sold | 4,797 | 3,282 | $ 32,306 | $ 24,631 |
Reinvestment of distributions | 108 | 331 | 705 | 2,469 |
Shares redeemed | (12,955) | (9,973) | (88,815) | (73,676) |
Net increase (decrease) | (8,050) | (6,360) | $ (55,804) | $ (46,576) |
Class C | | | | |
Shares sold | 258,694 | 66,879 | $ 1,733,640 | $ 498,161 |
Reinvestment of distributions | 710 | 1,425 | 4,622 | 10,610 |
Shares redeemed | (94,222) | (52,554) | (638,538) | (388,669) |
Net increase (decrease) | 165,182 | 15,750 | $ 1,099,724 | $ 120,102 |
Total International Equity | | | | |
Shares sold | 32,478,543 | 16,784,298 | $ 209,916,522 | $ 125,543,898 |
Reinvestment of distributions | 266,160 | 135,624 | 1,719,395 | 1,000,533 |
Shares redeemed | (13,867,286) | (5,532,363) | (93,416,780) | (39,913,646) |
Net increase (decrease) | 18,877,417 | 11,387,559 | $ 118,219,137 | $ 86,630,785 |
Institutional Class | | | | |
Shares sold | 198,611 | 26,909 | $ 1,289,078 | $ 202,383 |
Reinvestment of distributions | 448 | 263 | 2,887 | 1,936 |
Shares redeemed | (21,161) | (1,422) | (144,436) | (10,588) |
Net increase (decrease) | 177,898 | 25,750 | $ 1,147,529 | $ 193,731 |
11. Other.
The Fund's organizational documents provide former and current trustees and officers with a limited indemnification against liabilities arising in connection with the performance of their duties to the Fund. In the normal course of business, the Fund may also enter into contracts that provide general indemnifications. The Fund's maximum exposure under these arrangements is unknown as this would be dependent on future claims that may be made against the Fund. The risk of material loss from such claims is considered remote.
At the end of the period, a shareholder of record owned approximately 65% of the total outstanding shares of the Fund.
Annual Report
To the Trustees of Fidelity Investment Trust and Shareholders of Fidelity Total International Equity Fund:
We have audited the accompanying statement of assets and liabilities of Fidelity Total International Equity Fund (the Fund), a fund of Fidelity Investment Trust, including the schedule of investments, as of October 31, 2012, and the related statement of operations for the year then ended, the statement of changes in net assets for each of the two years in the period then ended, and the financial highlights for each of the five years in the period then ended. These financial statements and financial highlights are the responsibility of the Fund's management. Our responsibility is to express an opinion on these financial statements and financial highlights based on our audits.
We conducted our audits in accordance with the standards of the Public Company Accounting Oversight Board (United States). Those standards require that we plan and perform the audit to obtain reasonable assurance about whether the financial statements and financial highlights are free of material misstatement. The Fund is not required to have, nor were we engaged to perform, an audit of its internal control over financial reporting. Our audits included consideration of internal control over financial reporting as a basis for designing audit procedures that are appropriate in the circumstances, but not for the purpose of expressing an opinion on the effectiveness of the Fund's internal control over financial reporting. Accordingly, we express no such opinion. An audit also includes examining, on a test basis, evidence supporting the amounts and disclosures in the financial statements, assessing the accounting principles used and significant estimates made by management, as well as evaluating the overall financial statement presentation. Our procedures included confirmation of securities owned as of October 31, 2012, by correspondence with the custodians and brokers; where replies were not received from brokers, we performed other auditing procedures. We believe that our audits provide a reasonable basis for our opinion.
In our opinion, the financial statements and financial highlights referred to above present fairly, in all material respects, the financial position of Fidelity Total International Equity Fund as of October 31, 2012, the results of its operations for the year then ended, the changes in its net assets for each of the two years in the period then ended, and the financial highlights for each of the five years in the period then ended, in conformity with accounting principles generally accepted in the United States of America.
DELOITTE & TOUCHE LLP
Boston, Massachusetts
December 14, 2012
Annual Report
The Trustees, Members of the Advisory Board, and executive officers of the trust and fund, as applicable, are listed below. The Board of Trustees governs the fund and is responsible for protecting the interests of shareholders. The Trustees are experienced executives who meet periodically throughout the year to oversee the fund's activities, review contractual arrangements with companies that provide services to the fund, oversee management of the risks associated with such activities and contractual arrangements, and review the fund's performance. Except for James C. Curvey, each of the Trustees oversees 236 funds advised by FMR or an affiliate. Mr. Curvey oversees 443 funds advised by FMR or an affiliate.
The Trustees hold office without limit in time except that (a) any Trustee may resign; (b) any Trustee may be removed by written instrument, signed by at least two-thirds of the number of Trustees prior to such removal; (c) any Trustee who requests to be retired or who has become incapacitated by illness or injury may be retired by written instrument signed by a majority of the other Trustees; and (d) any Trustee may be removed at any special meeting of shareholders by a two-thirds vote of the outstanding voting securities of the trust. Each Trustee who is not an interested person (as defined in the 1940 Act) (Independent Trustee), shall retire not later than the last day of the calendar year in which his or her 75th birthday occurs. The Independent Trustees may waive this mandatory retirement age policy with respect to individual Trustees. The executive officers and Advisory Board Members hold office without limit in time, except that any officer and Advisory Board Member may resign or may be removed by a vote of a majority of the Trustees at any regular meeting or any special meeting of the Trustees. Except as indicated, each individual has held the office shown or other offices in the same company for the past five years.
Experience, Skills, Attributes, and Qualifications of the Fund's Trustees. The Governance and Nominating Committee has adopted a statement of policy that describes the experience, qualifications, attributes, and skills that are necessary and desirable for potential Independent Trustee candidates (Statement of Policy). The Board believes that each Trustee satisfied at the time he or she was initially elected or appointed a Trustee, and continues to satisfy, the standards contemplated by the Statement of Policy. The Governance and Nominating Committee also engages professional search firms to help identify potential Independent Trustee candidates who have the experience, qualifications, attributes, and skills consistent with the Statement of Policy. From time to time, additional criteria based on the composition and skills of the current Independent Trustees, as well as experience or skills that may be appropriate in light of future changes to board composition, business conditions, and regulatory or other developments, have also been considered by the professional search firms and the Governance and Nominating Committee. In addition, the Board takes into account the Trustees' commitment and participation in Board and committee meetings, as well as their leadership of standing and ad hoc committees throughout their tenure.
In determining that a particular Trustee was and continues to be qualified to serve as a Trustee, the Board has considered a variety of criteria, none of which, in isolation, was controlling. The Board believes that, collectively, the Trustees have balanced and diverse experience, qualifications, attributes, and skills, which allow the Board to operate effectively in governing the fund and protecting the interests of shareholders. Information about the specific experience, skills, attributes, and qualifications of each Trustee, which in each case led to the Board's conclusion that the Trustee should serve (or continue to serve) as a trustee of the fund, is provided below.
Annual Report
Trustees and Officers - continued
Board Structure and Oversight Function. James C. Curvey is an interested person (as defined in the 1940 Act) and currently serves as Chairman. The Trustees have determined that an interested Chairman is appropriate and benefits shareholders because an interested Chairman has a personal and professional stake in the quality and continuity of services provided to the fund. Independent Trustees exercise their informed business judgment to appoint an individual of their choosing to serve as Chairman, regardless of whether the Trustee happens to be independent or a member of management. The Independent Trustees have determined that they can act independently and effectively without having an Independent Trustee serve as Chairman and that a key structural component for assuring that they are in a position to do so is for the Independent Trustees to constitute a substantial majority for the Board. The Independent Trustees also regularly meet in executive session. Ned C. Lautenbach serves as Chairman of the Independent Trustees and as such (i) acts as a liaison between the Independent Trustees and management with respect to matters important to the Independent Trustees and (ii) with management prepares agendas for Board meetings.
Fidelity funds are overseen by different Boards of Trustees. The fund's Board oversees Fidelity's equity and high income funds and another Board oversees Fidelity's investment-grade bond, money market, and asset allocation funds. The asset allocation funds may invest in Fidelity funds overseen by the fund's Board. The use of separate Boards, each with its own committee structure, allows the Trustees of each group of Fidelity funds to focus on the unique issues of the funds they oversee, including common research, investment, and operational issues. On occasion, the separate Boards establish joint committees to address issues of overlapping consequences for the Fidelity funds overseen by each Board.
The Trustees operate using a system of committees to facilitate the timely and efficient consideration of all matters of importance to the Trustees, the fund, and fund shareholders and to facilitate compliance with legal and regulatory requirements and oversight of the fund's activities and associated risks. The Board, acting through its committees, has charged FMR and its affiliates with (i) identifying events or circumstances the occurrence of which could have demonstrably adverse effects on the fund's business and/or reputation; (ii) implementing processes and controls to lessen the possibility that such events or circumstances occur or to mitigate the effects of such events or circumstances if they do occur; and (iii) creating and maintaining a system designed to evaluate continuously business and market conditions in order to facilitate the identification and implementation processes described in (i) and (ii) above. Because the day-to-day operations and activities of the fund are carried out by or through FMR, its affiliates and other service providers, the fund's exposure to risks is mitigated but not eliminated by the processes overseen by the Trustees. While each of the Board's committees has responsibility for overseeing different aspects of the fund's activities, oversight is exercised primarily through the Operations, Audit, and Compliance Committees. In addition, the Independent Trustees have worked with FMR to enhance the Board's oversight of investment and financial risks, legal and regulatory risks, technology risks, and operational risks, including the development of additional risk reporting to the Board. For example, a working group comprised of Independent Trustees and FMR has worked and continues to work to review the Fidelity funds' valuation-related activities, reporting and risk management. Appropriate personnel, including but not limited to the fund's Chief Compliance Officer (CCO), FMR's internal auditor, the independent accountants, the fund's Treasurer and portfolio management personnel, make periodic reports to the Board's committees, as appropriate, including an annual review of FMR's risk management program for the Fidelity funds. The responsibilities of each standing committee, including their oversight responsibilities, are described further under "Standing Committees of the Fund's Trustees."
Annual Report
The fund's Statement of Additional Information (SAI) includes more information about the Trustees. To request a free copy, call Fidelity at 1-877-208-0098.
Interested Trustees*:
Correspondence intended for each Trustee who is an interested person may be sent to Fidelity Investments, 82 Devonshire Street, Boston, Massachusetts 02109.
Name, Age; Principal Occupations and Other Relevant Experience+ |
James C. Curvey (77) |
| Year of Election or Appointment: 2007 Mr. Curvey is Trustee and Chairman of the Board of Trustees of certain Trusts. Mr. Curvey also serves as Trustee (2007-present) of other investment companies advised by FMR. Mr. Curvey is a Director of Fidelity Investments Money Management, Inc. (2009-present), Director of Fidelity Research & Analysis Co. (2009-present) and Director of FMR and FMR Co., Inc. (2007-present). Mr. Curvey is also Vice Chairman (2007-present) and Director of FMR LLC. In addition, Mr. Curvey serves as an Overseer for the Boston Symphony Orchestra and a member of the Trustees of Villanova University. Previously, Mr. Curvey was the Vice Chairman (2006-2007) and Director (2000-2007) of FMR Corp. |
Ronald P. O'Hanley (55) |
| Year of Election or Appointment: 2011 Mr. O'Hanley is Director of FMR Co., Inc. (2010-present), Director of Fidelity Investments Money Management, Inc. (2010-present), Director of Fidelity Research & Analysis Company (2010-present), President of Fidelity Asset Management and Corporate Services and a member of Fidelity's Executive Committee (2010-present). Previously, Mr. O'Hanley served as President and Chief Executive Officer of BNY Mellon Asset Management (2007-2010). Mr. O'Hanley also served as Vice Chairman of Bank New York Mellon Corp. and a member of that firm's Executive Committee. Prior to the 2007 merger of The Bank of New York and Mellon Financial Corporation, he was Vice Chairman of Mellon Financial Corporation and President and Chief Executive Officer of Mellon Asset Management. He joined Mellon in February 1997. Mr. O'Hanley currently serves as Chairman of the Boston Public Library Foundation Board of Directors and sits on the Board of Directors of Beth Israel Deaconess Medical Center, the Board of Trustees of the Marine Biological Laboratory and the Advisory Board of the Maxwell School of Citizenship and Public Administration at Syracuse University. Mr. O'Hanley also chairs the Council on Asset Management for the Financial Services Roundtable and is a member of the Board of Directors of Institutional Investor's U.S. Institute. |
* Trustees have been determined to be "Interested Trustees" by virtue of, among other things, their affiliation with the trust or various entities under common control with FMR.
+ The information above includes each Trustee's principal occupation during the last five years and other information relating to the experience, attributes, and skills relevant to each Trustee's qualifications to serve as a Trustee, which led to the conclusion that each Trustee should serve as a Trustee for the fund.
Annual Report
Independent Trustees:
Correspondence intended for each Independent Trustee (that is, the Trustees other than the Interested Trustees) may be sent to Fidelity Investments, P.O. Box 55235, Boston, Massachusetts 02205-5235.
Name, Age; Principal Occupations and Other Relevant Experience+ |
Dennis J. Dirks (64) |
| Year of Election or Appointment: 2005 Prior to his retirement in May 2003, Mr. Dirks was Chief Operating Officer and a member of the Board of The Depository Trust & Clearing Corporation (DTCC). He also served as President, Chief Operating Officer, and Board member of The Depository Trust Company (DTC) and President and Board member of the National Securities Clearing Corporation (NSCC). In addition, Mr. Dirks served as Chief Executive Officer and Board member of the Government Securities Clearing Corporation, Chief Executive Officer and Board member of the Mortgage-Backed Securities Clearing Corporation, as a Trustee and a member of the Finance Committee of Manhattan College (2005-2008), and as a Trustee and a member of the Finance Committee of AHRC of Nassau County (2006-2008). Mr. Dirks is a member of the Independent Directors Council (IDC) Governing Council (2010-present) and Board of Directors for The Brookville Center for Children's Services, Inc. (2009-present). |
Alan J. Lacy (59) |
| Year of Election or Appointment: 2008 Mr. Lacy serves as Senior Adviser (2007-present) of Oak Hill Capital Partners, L.P. (private equity). Mr. Lacy also served as Chief Executive Officer (2000-2005) and Vice Chairman (2005-2006) of Sears Holdings Corporation and Sears, Roebuck and Co. (retail). In addition, Mr. Lacy serves as a member of the Board of Directors of Dave & Buster's Entertainment, Inc. (restaurant and entertainment complexes, 2010-present), Earth Fare, Inc. (retail grocery, 2012-present), The Hillman Companies, Inc. (hardware wholesalers, 2010-present), and Bristol-Myers Squibb Company (global pharmaceuticals, 2008-present). Mr. Lacy is a member of the Board of Trustees of The National Parks Conservation Association (2006-present). Previously, Mr. Lacy served as Chairman of the Board of Trustees of the National Parks Conservation Association (2008-2011) and as a member of the Board of Directors for the Western Union Company (global money transfer, 2006-2011). |
Ned C. Lautenbach (68) |
| Year of Election or Appointment: 2000 Mr. Lautenbach is Chairman of the Independent Trustees of the Equity and High Income Funds (2006-present). Mr. Lautenbach currently serves as the Lead Director of the Eaton Corporation Board of Directors (diversified industrial, 1997-present). Mr. Lautenbach is Chairman of the Board of Directors of the Philharmonic Center for the Arts in Naples, Florida (2012-present) and a member of the Council on Foreign Relations (1994-present). Previously, Mr. Lautenbach was a Partner/Advisory Partner at Clayton, Dubilier & Rice, LLC (private equity investment, 1998-2010), as well as a Director of Sony Corporation (2006-2007). |
Joseph Mauriello (68) |
| Year of Election or Appointment: 2008 Prior to his retirement in January 2006, Mr. Mauriello served in numerous senior management positions including Deputy Chairman and Chief Operating Officer (2004-2005), and Vice Chairman of Financial Services (2002-2004) of KPMG LLP US (professional services, 1965-2005). Mr. Mauriello currently serves as a member of the Board of Directors of XL Group plc. (global insurance and re-insurance, 2006-present). Previously, Mr. Mauriello served as a Director of the Hamilton Funds of the Bank of New York (2006-2007) and of Arcadia Resources Inc. (health care services and products, 2007-2012). |
Robert W. Selander (62) |
| Year of Election or Appointment: 2011 Previously, Mr. Selander served as a Member of the Advisory Board of Fidelity's Equity and High Income Funds (2011), Executive Vice Chairman (2010), Chief Executive Officer (2009-2010), and President and Chief Executive Officer (1997-2009) of Mastercard, Inc. |
Cornelia M. Small (68) |
| Year of Election or Appointment: 2005 Ms. Small is a member of the Board of Directors (2009-present) and Chair of the Investment Committee (2010-present) of the Teagle Foundation. Ms. Small also serves on the Investment Committee of the Berkshire Taconic Community Foundation (2008-present). Previously, Ms. Small served as Chairperson (2002-2008) and a member of the Investment Committee and Chairperson (2008-2012) and a member of the Board of Trustees of Smith College. In addition, Ms. Small served as Chief Investment Officer, Director of Global Equity Investments, and a member of the Board of Directors of Scudder, Stevens & Clark and Scudder Kemper Investments. |
William S. Stavropoulos (73) |
| Year of Election or Appointment: 2001 Mr. Stavropoulos is Vice Chairman of the Independent Trustees of the Equity and High Income Funds (2006-present). Mr. Stavropoulos serves as President and Founder of the Michigan Baseball Foundation, the Great Lakes Loons (2007-present). Mr. Stavropoulos is Chairman Emeritus of the Board of Directors of The Dow Chemical Company, where he previously served in numerous senior management positions, including President, CEO (1995-2000; 2002-2004), Chairman of the Executive Committee (2000-2006), and as a member of the Board of Directors (1990-2006). Currently, Mr. Stavropoulos is a Director of Univar Inc. (global distributor of commodity and specialty chemicals, Chairman from 2010-May 2012 and Lead Director from May 2012-present), Teradata Corporation (data warehousing and technology solutions, 2008-present), Maersk Inc. (industrial conglomerate), and Tyco International, Ltd. (multinational manufacturing and services, 2007-present), and a member of the Advisory Board for Metalmark Capital LLC (private equity investment, 2005-present). Mr. Stavropoulos is an operating advisor to Clayton, Dubilier & Rice, LLC (private equity investment). In addition, Mr. Stavropoulos is a member of the University of Notre Dame Advisory Council for the College of Science, a Trustee of the Rollin L. Gerstacker Foundation, and a Director of the Naples Philharmonic Center for the Arts. Previously, Mr. Stavropoulos served as a Director of Chemical Financial Corporation (bank holding company, 1993-2012). |
David M. Thomas (63) |
| Year of Election or Appointment: 2008 Previously, Mr. Thomas served as Executive Chairman (2005-2006) and Chairman and Chief Executive Officer (2000-2005) of IMS Health, Inc. (pharmaceutical and healthcare information solutions), and a Director of Fortune Brands, Inc. (consumer products, 2000-2011). In addition, Mr. Thomas serves as Non-Executive Chairman of the Board of Directors of Fortune Brands Home and Security (home and security products, 2011-present), and as a member of the Board of Directors of Interpublic Group of Companies, Inc. (marketing communication, 2004-present). |
Michael E. Wiley (62) |
| Year of Election or Appointment: 2008 Mr. Wiley also serves as a Director of Asia Pacific Exploration Consolidated (international oil and gas exploration and production, 2008-present). Mr. Wiley serves as a Director of Tesoro Corporation (independent oil refiner and marketer, 2005-present), and a Director of Bill Barrett Corporation (exploration and production, 2005-present). In addition, Mr. Wiley also serves as a Director of Post Oak Bank (privately-held bank, 2004-present). Previously, Mr. Wiley served as a member of the Board of Trustees of the University of Tulsa (2000-2006; 2007-2010), as a Senior Energy Advisor of Katzenbach Partners, LLC (consulting, 2006-2007), as an Advisory Director of Riverstone Holdings (private investment), Chairman, President, and CEO of Baker Hughes, Inc. (oilfield services, 2000-2004), and as Director of Spinnaker Exploration Company (exploration and production, 2001-2005). |
+ The information above includes each Trustee's principal occupation during the last five years and other information relating to the experience, attributes, and skills relevant to each Trustee's qualifications to serve as a Trustee, which led to the conclusion that each Trustee should serve as a Trustee for the fund.
Advisory Board Members and Executive Officers:
Correspondence intended for David A. Rosow and Garnett A. Smith may be sent to Fidelity Investments, P.O. Box 55235, Boston, Massachusetts 02205-5235. Correspondence intended for each executive officer, Edward C. Johnson 3d, and Peter S. Lynch may be sent to Fidelity Investments, 82 Devonshire Street, Boston, Massachusetts 02109.
Name, Age; Principal Occupation |
Edward C. Johnson 3d (82) |
| Year of Election or Appointment: 2011 Member of the Advisory Board of Fidelity's Equity and High Income Funds. Mr. Johnson serves as Chief Executive Officer, Chairman, and a Director of FMR LLC, and also serves as Chairman and Director of FIL Limited. Previously, Mr. Johnson served as a Trustee and Chairman of the Board of certain Fidelity Trusts, Chairman and a Director of FMR, Chairman and a Director of FMR Co., Inc., and President of FMR LLC (2006-2007). |
Peter S. Lynch (68) |
| Year of Election or Appointment: 2003 Member of the Advisory Board of Fidelity's Equity and High Income Funds. Mr. Lynch is Vice Chairman and a Director of FMR and FMR Co., Inc. In addition, Mr. Lynch serves as a Trustee of Boston College and as the Chairman of the Inner-City Scholarship Fund. Previously, Mr. Lynch served on the Special Olympics International Board of Directors (1997-2006). |
David A. Rosow (70) |
| Year of Election or Appointment: 2012 Member of the Advisory Board of Fidelity's Equity and High Income Funds. Chairman and Chief Executive Officer of International Golf Group, Inc. (golf course development, 1989-present). Previously, Mr. Rosow served as Chairman and Chief Executive Officer of Rosow & Company, Inc. (private investment company, 1989-2011), a Lead Director of Hudson United Bancorp (2001-2006) and as a Director of TD Banknorth (1996-2006). In addition, Mr. Rosow is a member (2008-present) and President (2009-present) of the Town Council of Palm Beach, Florida. |
Garnett A. Smith (65) |
| Year of Election or Appointment: 2012 Member of the Advisory Board of Fidelity's Equity and High Income Funds. Prior to Mr. Smith's retirement, he served as Chairman and Chief Executive Officer of Inbrand Corp. (manufacturer of personal absorbent products, 1990-1997). He also served as President (1986-1990) of Inbrand Corp. Prior to his employment with Inbrand Corp., he was employed by a retail fabric chain and North Carolina National Bank. In addition, Mr. Smith is a board member of the Jackson Hole Land Trust (2009-present). |
Kenneth B. Robins (43) |
| Year of Election or Appointment: 2008 President and Treasurer of Fidelity's Equity and High Income Funds. Mr. Robins also serves as President and Treasurer (2010-present) and Assistant Treasurer (2009-present) of other Fidelity funds and is an employee of Fidelity Investments (2004-present). Previously, Mr. Robins served as Deputy Treasurer of the Fidelity funds (2005-2008) and Treasurer and Chief Financial Officer of The North Carolina Capital Management Trust: Cash and Term Portfolios (2006-2008). |
Bruce T. Herring (47) |
| Year of Election or Appointment: 2006 Vice President of certain Equity Funds. Mr. Herring also serves as President of Fidelity Research & Analysis Company (2010-present), Chief Investment Officer and Director of Fidelity Management & Research (U.K.) Inc. (2010-present) and Group Chief Investment Officer of FMR. Previously, Mr. Herring served as Vice President (2005-2006) and Senior Vice President (2006-2007) of Fidelity Management & Research Company, Vice President of FMR Co., Inc. (2001-2007) and as a portfolio manager for Fidelity U.S. Equity Funds. |
Brian B. Hogan (48) |
| Year of Election or Appointment: 2009 Vice President of Equity and High Income Funds. Mr. Hogan also serves as President of FMR's Equity Division (2009-present). Previously, Mr. Hogan served as Senior Vice President, Equity Research of FMR (2006-2009) and as a portfolio manager. |
Scott C. Goebel (44) |
| Year of Election or Appointment: 2008 Secretary and Chief Legal Officer (CLO) of the Fidelity funds. Mr. Goebel also serves as Secretary of Fidelity Investments Money Management, Inc. (FIMM) (2010-present) and Fidelity Research and Analysis Company (FRAC) (2010-present); Secretary and CLO of The North Carolina Capital Management Trust: Cash and Term Portfolios (2008-present); General Counsel, Secretary, and Senior Vice President of FMR (2008-present) and FMR Co., Inc. (2008-present); employed by FMR LLC or an affiliate (2001-present); Chief Legal Officer of Fidelity Management & Research (Hong Kong) Limited (2008-present) and Assistant Secretary of Fidelity Management & Research (Japan) Inc. (2008-present), and Fidelity Management & Research (U.K.) Inc. (2008-present). Previously, Mr. Goebel served as Assistant Secretary of FIMM (2008-2010), FRAC (2008-2010), and the Funds (2007-2008) and as Vice President and Secretary of Fidelity Distributors Corporation (FDC) (2005-2007). |
William C. Coffey (43) |
| Year of Election or Appointment: 2009 Assistant Secretary of Fidelity's Equity and High Income Funds. Mr. Coffey also serves as Senior Vice President and Deputy General Counsel of FMR LLC (2010-present), and is an employee of Fidelity Investments. Previously, Mr. Coffey served as Vice President and Associate General Counsel of FMR LLC (2005-2009). |
Elizabeth Paige Baumann (44) |
| Year of Election or Appointment: 2012 Anti-Money Laundering (AML) Officer of the Fidelity funds. Ms. Baumann also serves as AML Officer of The North Carolina Capital Management Trust: Cash and Term Portfolios (2012-present), Chief AML Officer of FMR LLC (2012-present), and is an employee of Fidelity Investments. Previously, Ms. Baumann served as Vice President and Deputy Anti-Money Laundering Officer (2007-2012). |
Christine Reynolds (54) |
| Year of Election or Appointment: 2008 Chief Financial Officer of the Fidelity funds. Ms. Reynolds became President of Fidelity Pricing and Cash Management Services (FPCMS) in August 2008. Ms. Reynolds served as Chief Operating Officer of FPCMS (2007-2008). Previously, Ms. Reynolds served as President, Treasurer, and Anti-Money Laundering officer of the Fidelity funds (2004-2007). |
Joseph A. Hanlon (44) |
| Year of Election or Appointment: 2012 Chief Compliance Officer of Fidelity's Equity and High Income Funds. Mr. Hanlon serves as Compliance Officer of FMR, FMR Co., Inc., Fidelity Investments Money Management, Inc. (FIMM), Fidelity Research and Analysis Company (FRAC), Fidelity Management & Research (Japan) Inc., Fidelity Management & Research (U.K.) Inc., Fidelity Management & Research (Hong Kong), and Strategic Advisers, Inc. (2009-present), as Senior Vice President of the Fidelity Asset Management Division (2009-present), and is an employee of Fidelity Investments. |
Joseph F. Zambello (55) |
| Year of Election or Appointment: 2011 Deputy Treasurer of the Fidelity funds. Mr. Zambello is an employee of Fidelity Investments. Previously, Mr. Zambello served as Vice President of FMR's Program Management Group (2009-2011) and Vice President of the Transfer Agent Oversight Group (2005-2009). |
Adrien E. Deberghes (45) |
| Year of Election or Appointment: 2008 Deputy Treasurer of Fidelity's Equity and High Income Funds. Mr. Deberghes also serves as Vice President (2011-present) and Assistant Treasurer (2010-present) of other Fidelity funds, and is an employee of Fidelity Investments (2008-present). Previously, Mr. Deberghes served as Senior Vice President of Mutual Fund Administration at State Street Corporation (2007-2008), Senior Director of Mutual Fund Administration at Investors Bank & Trust (2005-2007), and Director of Finance for Dunkin' Brands (2000-2005). |
Stephen Sadoski (41) |
| Year of Election or Appointment: 2012 Deputy Treasurer of Fidelity's Equity and High Income Funds. Mr. Sadoski also serves as Assistant Treasurer of other Fidelity funds (2012-present) and is an employee of Fidelity Investments (2012-present). Previously, Mr. Sadoski served as an assistant chief accountant in the Division of Investment Management of the Securities and Exchange Commission (SEC) (2009-2012) and as a senior manager at Deloitte & Touche (1997-2009). |
Stephanie J. Dorsey (43) |
| Year of Election or Appointment: 2010 Assistant Treasurer of Fidelity's Equity and High Income Funds. Ms. Dorsey also serves as Deputy Treasurer of other Fidelity funds (2008-present) and is an employee of Fidelity Investments (2008-present). Previously, Ms. Dorsey served as Treasurer (2004-2008) of the JPMorgan Mutual Funds and Vice President (2004-2008) of JPMorgan Chase Bank. |
John R. Hebble (54) |
| Year of Election or Appointment: 2009 Assistant Treasurer of Fidelity's Equity and High Income Funds. Mr. Hebble also serves as President (2011-present), Treasurer, and Chief Financial Officer of The North Carolina Capital Management Trust: Cash and Term Portfolios (2008-present), President and Treasurer of other Fidelity funds (2008-present) and is an employee of Fidelity Investments. |
Gary W. Ryan (54) |
| Year of Election or Appointment: 2005 Assistant Treasurer of the Fidelity funds. Mr. Ryan is an employee of Fidelity Investments. Previously, Mr. Ryan served as Vice President of Fund Reporting in Fidelity Pricing and Cash Management Services (FPCMS) (1999-2005). |
Jonathan Davis (44) |
| Year of Election or Appointment: 2010 Assistant Treasurer of the Fidelity funds. Mr. Davis is also Assistant Treasurer of Fidelity Rutland Square Trust II and Fidelity Commonwealth Trust II. Mr. Davis is an employee of Fidelity Investments. Previously, Mr. Davis served as Vice President and Associate General Counsel of FMR LLC (2003-2010). |
Annual Report
The Board of Trustees of Fidelity Total International Equity Fund voted to pay to shareholders of record at the opening of business on record date, the following distributions per share derived from capital gains realized from sales of portfolio securities, and dividends derived from net investment income:
| Pay Date | Record Date | Dividends | Capital Gains |
Institutional Class | 12/10/12 | 12/07/12 | $0.148 | $0.245 |
The fund hereby designates as a capital gain dividend with respect to the taxable year ended October 31, 2012 $309,806, or, if subsequently determined to be different, the net capital gain of such year.
Institutional Class designates 4% of the dividends distributed in December 2011 as indicated in the Corporate Qualifying memo distributed by the Tax department, during the fiscal year as qualifying for the dividends-received deduction for corporate shareholders.
Institutional Class designates 100% of the dividends distributed in December during the fiscal year as amounts which may be taken into account as a dividend for purposes of the maximum rate under section 1(h)(11) of the Internal Revenue Code.
The amounts per share which represent income derived from sources within, and taxes paid to, foreign countries or possessions of the United States are as follows:
| Pay Date | Income | Taxes |
Institutional Class | 12/05/11 | $0.078 | $0.0107 |
The fund will notify shareholders in January 2013 of amounts for use in preparing 2012 income tax returns.
Annual Report
Board Approval of Investment Advisory Contracts and Management Fees
Fidelity Total International Equity Fund
Each year, the Board of Trustees, including the Independent Trustees (together, the Board), votes on the renewal of the management contract and sub-advisory agreements (together, the Advisory Contracts) for the fund. The Board, assisted by the advice of fund counsel and Independent Trustees' counsel, requests and considers a broad range of information relevant to the renewal of the Advisory Contracts throughout the year.
The Board meets regularly and, at each of its meetings, considers factors that are relevant to its annual consideration of the renewal of the fund's Advisory Contracts, including the services and support provided to the fund and its shareholders. The Board has established various standing committees, each composed of and chaired by Independent Trustees with varying backgrounds, to which the Board has assigned specific subject matter responsibilities in order to enhance effective decision-making by the Board. The Board, acting directly and through its Committees, requests and receives information concerning the annual consideration of the renewal of the fund's Advisory Contracts. The Board also meets as needed to consider matters specifically related to the Board's annual consideration of the renewal of Advisory Contracts. Members of the Board may also meet with trustees of other Fidelity funds through ad hoc joint committees to discuss certain matters relevant to the Fidelity funds.
At its July 2012 meeting, the Board of Trustees, including the Independent Trustees, unanimously determined to renew the fund's Advisory Contracts. In reaching its determination, the Board considered all factors it believed relevant, including (i) the nature, extent, and quality of the services to be provided to the fund and its shareholders (including the investment performance of the fund); (ii) the competitiveness of the fund's management fee and total expense ratio relative to peer funds; (iii) the total costs of the services to be provided by and the profits to be realized by Fidelity from its relationship with the fund; (iv) the extent to which economies of scale exist and would be realized as the fund grows; and (v) whether fee levels reflect these economies of scale, if any, for the benefit of fund shareholders.
In considering whether to renew the Advisory Contracts for the fund, the Board reached a determination, with the assistance of fund counsel and Independent Trustees' counsel and through the exercise of its business judgment, that the renewal of the Advisory Contracts is in the best interests of the fund and its shareholders and that the compensation payable under the Advisory Contracts is fair and reasonable. The Board's decision to renew the Advisory Contracts was not based on any single factor, but rather was based on a comprehensive consideration of all the information provided to the Board at its meetings throughout the year. The Board, in reaching its determination to renew the Advisory Contracts, is aware that shareholders in the fund have a broad range of investment choices available to them, including a wide choice among mutual funds offered by Fidelity's competitors, and that the fund's shareholders, who have the opportunity to review and weigh the disclosure provided by the fund in its prospectus and other public disclosures, have chosen to invest in this fund, managed by Fidelity.
Annual Report
Nature, Extent, and Quality of Services Provided. The Board considered the staffing within the investment adviser, FMR, and the sub-advisers (together, the Investment Advisers), including the backgrounds of the fund's investment personnel, and also considered the fund's investment objective, strategies, and related investment philosophy. The Independent Trustees also had discussions with senior management of Fidelity's investment operations and investment groups. The Board considered the structure of the portfolio manager compensation program and whether this structure provides appropriate incentives to act in the best interests of the fund.
Resources Dedicated to Investment Management and Support Services. The Board and the Fund Oversight and Research Committees reviewed the general qualifications and capabilities of the Investment Advisers' investment staff, including its size, education, experience, and resources, as well as the Investment Advisers' approach to recruiting, training, managing, and compensating investment personnel. The Board also noted that FMR has continued to increase the resources devoted to non-U.S. offices, including expansion of Fidelity's global investment organization. The Board noted that Fidelity's analysts have extensive resources, tools and capabilities that allow them to conduct sophisticated quantitative and fundamental analysis, as well as credit analysis of issuers, counterparties and guarantors. The Board also believes that Fidelity's investment professionals have sufficient access to global information and data so as to provide competitive investment results over time, and that those professionals also have access to sophisticated tools that permit them to assess portfolio construction and risk and performance attribution characteristics continuously, as well as to transmit new information and research conclusions rapidly around the world. Additionally, in its deliberations, the Board considered the Investment Advisers' trading and risk management capabilities and resources, which are an integral part of the investment management process.
Shareholder and Administrative Services. The Board considered (i) the nature, extent, quality, and cost of advisory, administrative, and shareholder services performed by the Investment Advisers and their affiliates under the Advisory Contracts and under separate agreements covering transfer agency, pricing and bookkeeping, and securities lending services for the fund; (ii) the nature and extent of the supervision of third party service providers, principally custodians and subcustodians; and (iii) the resources devoted to, and the record of compliance with, the fund's compliance policies and procedures. The Board also reviewed the allocation of fund brokerage, including allocations to brokers affiliated with the Investment Advisers, the use of brokerage commissions to pay fund expenses, and the use of "soft" commission dollars to pay for research services.
Annual Report
Board Approval of Investment Advisory Contracts and
Management Fees - continued
The Board noted that the growth of fund assets over time across the complex allows Fidelity to reinvest in the development of services designed to enhance the value or convenience of the Fidelity funds as investment vehicles. These services include 24-hour access to account information and market information through telephone representatives and over the Internet, investor education materials and asset allocation tools, and the expanded availability of Fidelity Investor Centers.
Investment in a Large Fund Family. The Board considered the benefits to shareholders of investing in a Fidelity fund, including the benefits of investing in a fund that is part of a large family of funds offering a variety of investment disciplines and providing a large variety of mutual fund investor services. The Board noted that Fidelity had taken, or had made recommendations that resulted in the Fidelity funds taking, a number of actions over the previous year that benefited particular funds, including (i) continuing to dedicate additional resources to investment research and support of the senior management team that oversees asset management; (ii) persisting in efforts to enhance Fidelity's research capabilities, in particular, international research; (iii) launching new funds and making other enhancements to meet client needs for global and income-oriented solutions; (iv) continuing to launch dedicated lower cost underlying funds to meet investment management's portfolio construction needs related to expanding underlying fund options, specifically for the Freedom Fund product lines; (v) adopting a "Stock Selector" sector neutral investment approach and employing a team of portfolio managers who are sector specialists to manage certain funds; (vi) rationalizing product lines and gaining increased efficiencies through the mergers of several funds into other funds; (vii) strengthening the Spartan Index Fund product line by adding new funds and/or new low-cost institutional share classes, restructuring fund expenses to accommodate new classes, and reducing investment minimums for certain classes of shares; (viii) modifying the eligibility criteria for Institutional Class shares to increase their appeal to government entities and charitable investors; and (ix) reducing certain transfer agent fee rates.
Investment Performance. The Board considered whether the fund has operated in accordance with its investment objective, as well as its record of compliance with its investment restrictions. It also reviewed the fund's absolute investment performance for each class, as well as the fund's relative investment performance for each class measured over multiple periods against (i) a broad-based securities market index, and (ii) a peer group of mutual funds deemed appropriate by Fidelity and reviewed by the Board. Because the fund had been in existence less than five calendar years, the following charts considered by the Board show, over the one- and three-year periods ended December 31, 2011, the cumulative total returns of the retail class and Class B of the fund, the cumulative total returns of a broad-based securities market index ("benchmark"), and a range of cumulative total returns of a peer group of mutual funds identified by Morningstar, Inc. as having an investment style similar to that of the fund based on underlying portfolio holdings. The returns of the retail class and Class B show the performance of the highest and lowest performing classes, respectively (based on three-year performance). The box within each chart shows the 25th percentile return (top of box) and the 75th percentile return (bottom of box) of the peer group. Returns shown above the box are in the first quartile and returns shown below the box are in the fourth quartile. The percentage beaten numbers noted below each chart correspond to the percentile box and represent the percentage of funds in the peer group whose performance was equal to or lower than that of the class indicated.
Annual Report
Fidelity Total International Equity Fund
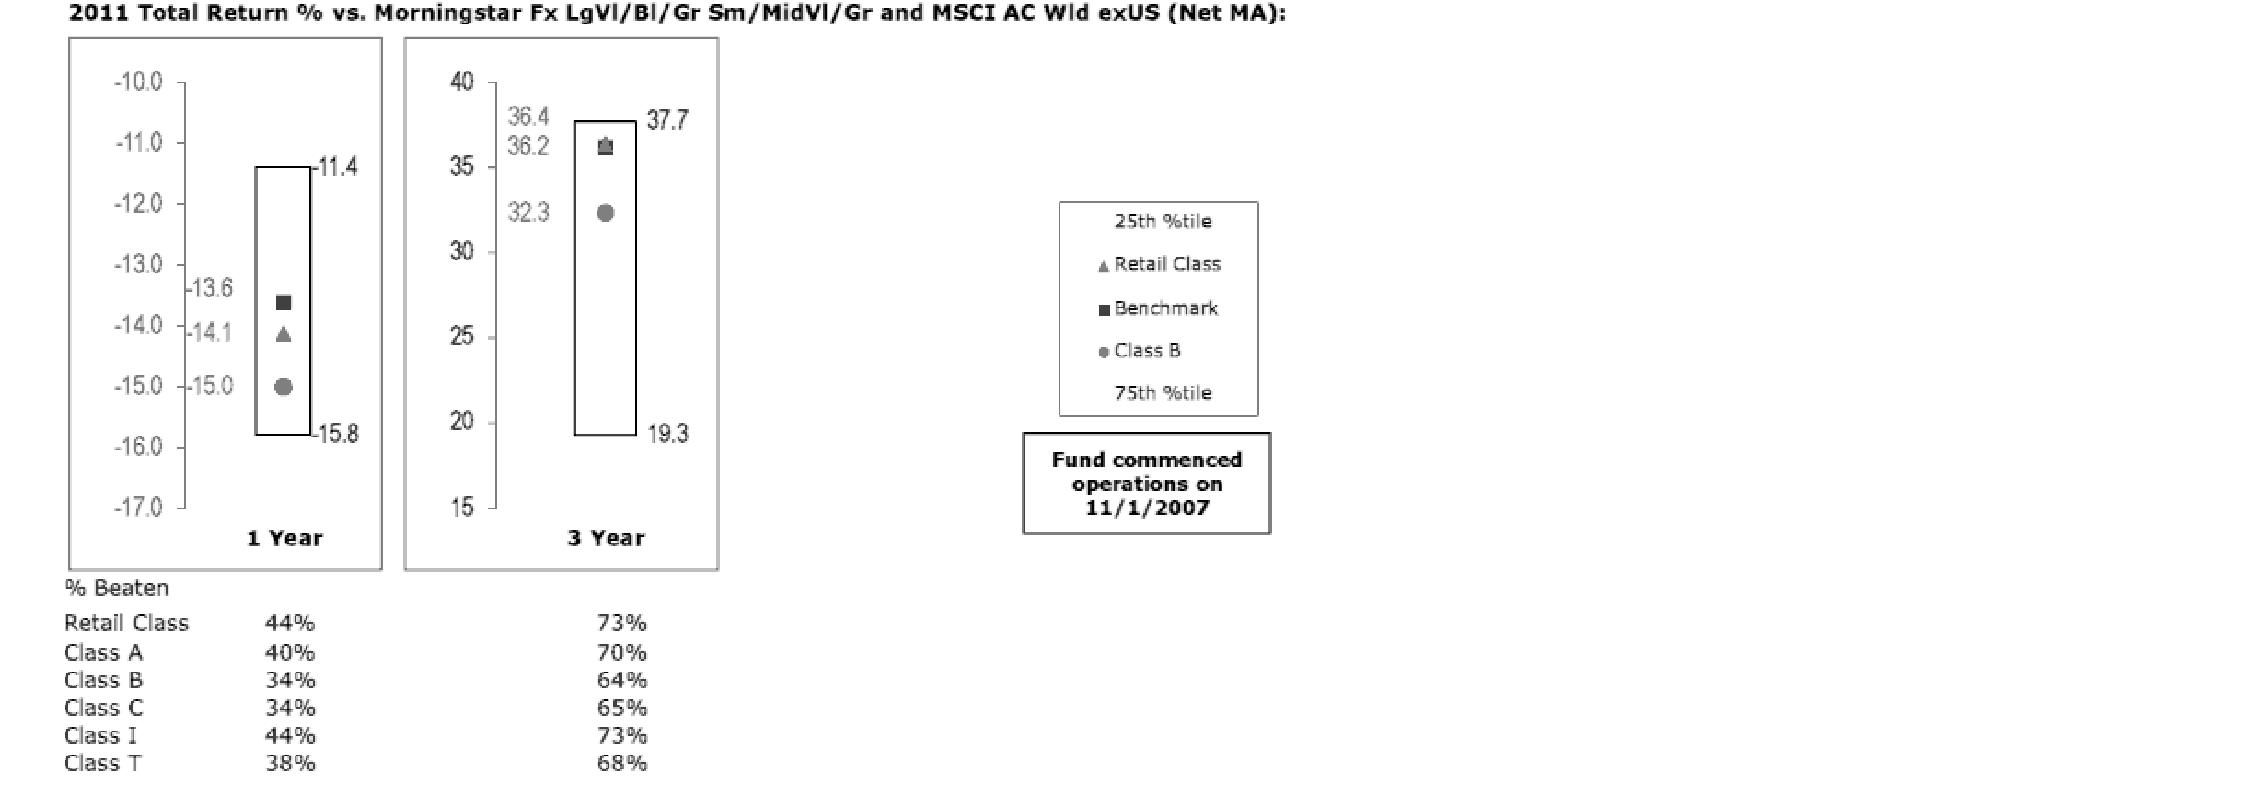
The Board reviewed the fund's relative investment performance against its peer group and noted that the performance of the retail class of the fund was in the third quartile for the one-year period and the second quartile for the three-year period. The Board also noted that the investment performance of the fund was lower than its benchmark for the one-year period, although the three-year cumulative total return of the retail class compared favorably to its benchmark. The Board considered that the variations in performance among the fund's classes reflect the variations in class expenses, which result in lower performance for higher expense classes. The Board noted that there were portfolio management changes for the fund in February 2012 and September 2011. The Board also reviewed the fund's performance since inception as well as performance in the current year.
The Board also considered that the fund's management fee is subject to upward or downward adjustment depending upon whether, and to what extent, the fund's investment performance for the performance period exceeds, or is exceeded by, the record (over the same period) of a Board-approved performance adjustment index. The Board noted that the performance adjustment provides FMR with a strong economic incentive to seek to achieve superior performance for the fund's shareholders and helps to more closely align the interests of FMR and the fund's shareholders.
Annual Report
Board Approval of Investment Advisory Contracts and
Management Fees - continued
Based on its review, the Board concluded that the nature, extent, and quality of services provided to the fund under the Advisory Contracts should benefit the fund's shareholders.
Competitiveness of Management Fee and Total Expense Ratio. The Board considered the fund's management fee and total expense ratio compared to "mapped groups" of competitive funds and classes. Fidelity creates "mapped groups" by combining similar Lipper investment objective categories that have comparable management fee characteristics. Combining Lipper investment objective categories aids the Board's management fee and total expense ratio comparisons by broadening the competitive group used for comparison and by reducing the number of universes to which various Fidelity funds are compared.
Management Fee. The Board considered two proprietary management fee comparisons for the 12-month (or shorter) periods shown in the chart below. The group of Lipper funds used by the Board for management fee comparisons is referred to below as the "Total Mapped Group." The Total Mapped Group comparison focuses on a fund's standing relative to the total universe of comparable funds available to investors in terms of gross management fees before expense reimbursements or caps, and without giving effect to the fund's performance adjustment. "TMG %" represents the percentage of funds in the Total Mapped Group that had management fees that were lower than the fund's. For example, a TMG % of 17% means that 83% of the funds in the Total Mapped Group had higher management fees than the fund. The "Asset-Size Peer Group" (ASPG) comparison focuses on a fund's standing relative to non-Fidelity funds similar in size to the fund within the Total Mapped Group. The ASPG represents at least 15% of the funds in the Total Mapped Group with comparable asset size and management fee characteristics, subject to a minimum of 50 funds (or all funds in the Total Mapped Group if fewer than 50). Additional information, such as the ASPG quartile in which the fund's management fee ranked and the impact of the fund's performance adjustment, is also included in the chart and considered by the Board.
Annual Report
Fidelity Total International Equity Fund
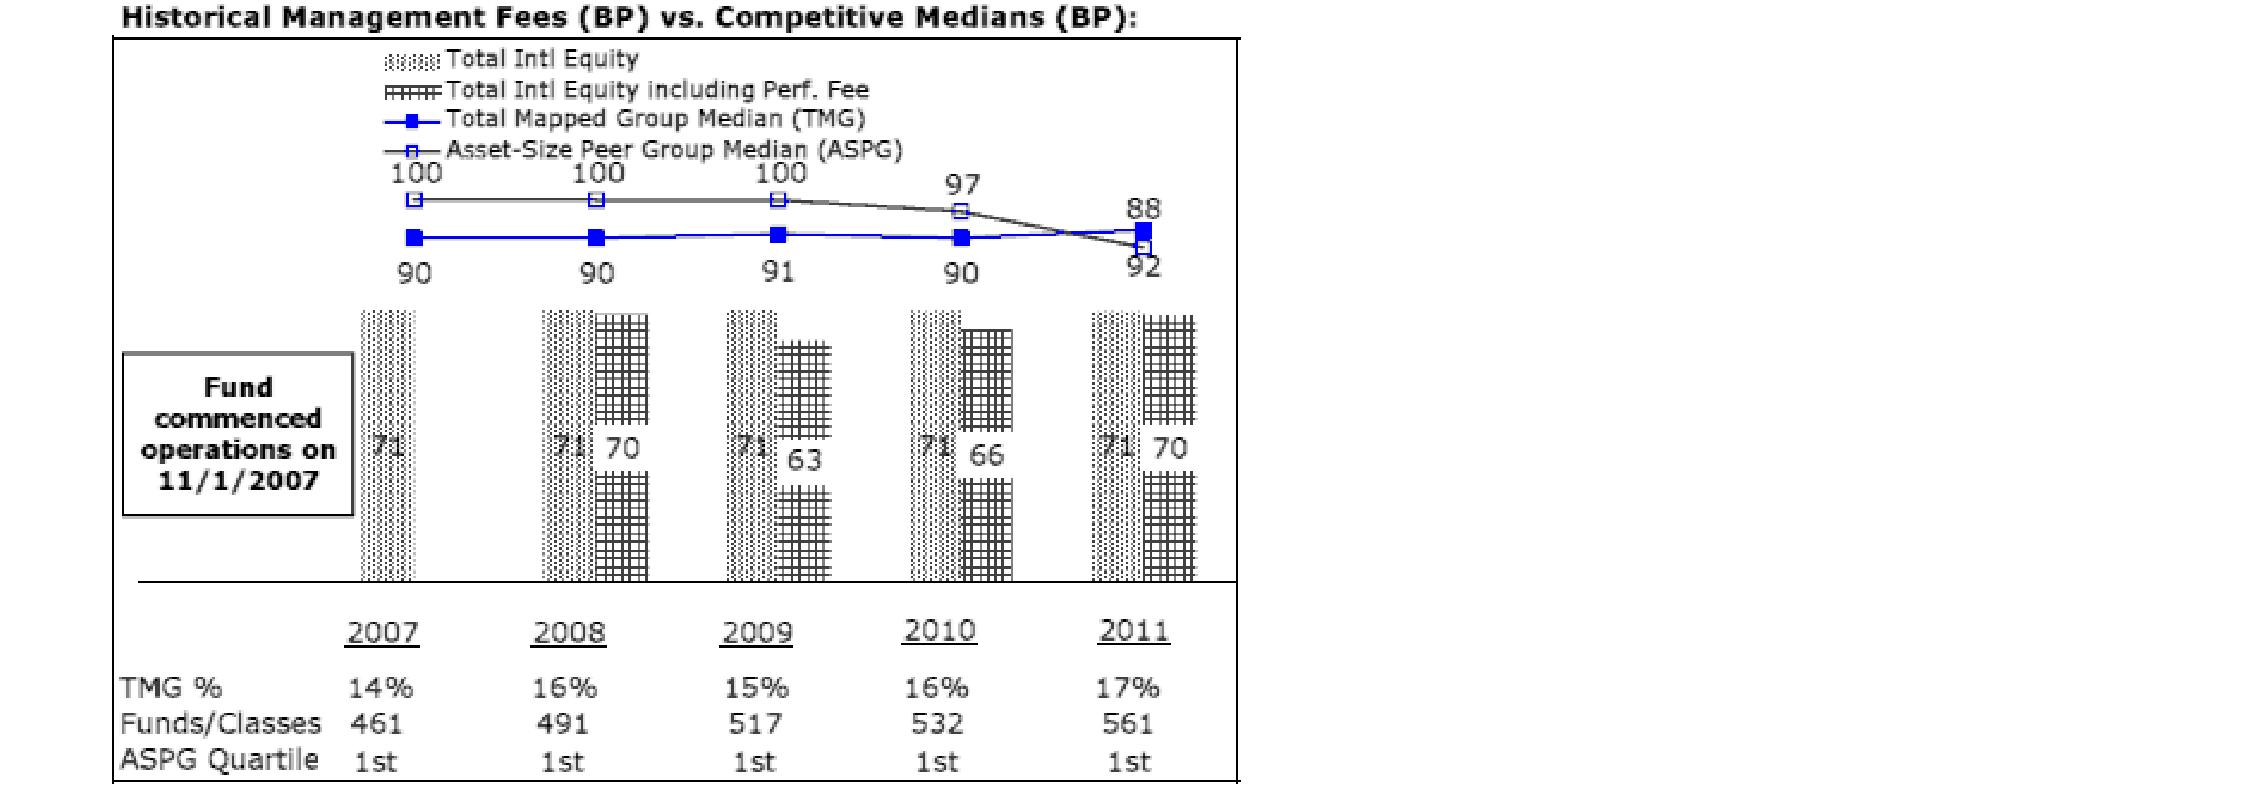
The Board noted that the fund's management fee ranked below the median of its Total Mapped Group and below the median of its ASPG for 2011. The Board also noted the effect of the fund's negative performance adjustment on the fund's management fee ranking. The Board noted that the performance adjustment for each year represents calculations for performance periods that differ from the periods shown in the performance charts above.
Based on its review, the Board concluded that the fund's management fee is fair and reasonable in light of the services that the fund receives and the other factors considered.
Total Expense Ratio. In its review of each class's total expense ratio, the Board considered the fund's management fee as well as other fund or class expenses, as applicable, such as transfer agent fees, pricing and bookkeeping fees, fund-paid 12b-1 fees, and custodial, legal, and audit fees. The Board also noted the effects of any waivers and reimbursements on fees and expenses, as well as the impact of the fund's performance adjustment. As part of its review, the Board also considered the current and historical total expense ratios of each class of the fund compared to competitive fund median expenses. Each class of the fund is compared to those funds and classes in the Total Mapped Group (used by the Board for management fee comparisons) that have a similar sales load structure.
The Board noted that the total expense ratio of each of Class A and the retail class ranked below its competitive median for 2011, the total expense ratio of Class B ranked equal to its competitive median for 2011, and the total expense ratio of each of Class T, Class C, and Institutional Class ranked above its competitive median for 2011. The Board considered that various factors, including 12b-1 fees, positive or negative performance adjustments, and relatively higher other expenses in the case of small fund size, can affect total expense ratios. The Board noted that the total expense ratio of Class T was above the competitive median primarily because of higher 12b-1 fees on Class T. Class T has a higher 12b-1 fee, but a lower front-end sales charge, than traditionally priced front-end sales charge classes. The Board considered that Class T is primarily sold load-waived in the retirement plan market where its 0.50% 12b-1 fee is comparable to competing no-load, higher 12b-1 fee classes designed specifically for retirement plans. The Board noted that the fund offers multiple classes, each of which has a different sales load and 12b-1 fee structure, and that the multiple structures are intended to offer a range of pricing options for the intermediary market. The Board also noted that the total expense ratios of the classes vary primarily by the level of their 12b-1 fees, although differences in transfer agent fees may also cause expenses to vary from class to class.
Annual Report
Board Approval of Investment Advisory Contracts and
Management Fees - continued
The Board further considered that FMR contractually agreed to reimburse Class A, Class T, Class B, Class C, Institutional Class, and the retail class of the fund to the extent that total operating expenses (excluding interest, taxes, certain securities lending costs, brokerage commissions, extraordinary expenses, and acquired fund fees and expenses, if any), as a percentage of their respective average net assets, exceed 1.45%, 1.70%, 2.20%, 2.20%, 1.20% and 1.20% through December 31, 2012.
Fees Charged to Other Fidelity Clients. The Board also considered Fidelity fee structures and other information with respect to clients of FMR and its affiliates, such as other mutual funds advised or subadvised by FMR or its affiliates, pension plan clients, and other institutional clients. The Board noted the findings of the 2010 ad hoc joint committee (created with the board of other Fidelity funds), which reviewed and compared Fidelity's institutional investment advisory business with its business of providing services to the Fidelity funds, including the differences in services provided, fees charged, and costs incurred, as well as competition in their respective marketplaces.
Based on its review of total expense ratios and fees charged to other Fidelity clients, the Board concluded that the total expense ratio of each class of the fund was reasonable, although in some cases above the median of the universe presented for comparison, in light of the services that the fund and its shareholders receive and the other factors considered.
Costs of the Services and Profitability. The Board considered the revenues earned and the expenses incurred by Fidelity in conducting the business of developing, marketing, distributing, managing, administering and servicing the fund and its shareholders. The Board also considered the level of Fidelity's profits in respect of all the Fidelity funds.
Annual Report
On an annual basis, FMR presents to the Board Fidelity's profitability for the fund. Fidelity calculates the profitability for each fund, as well as aggregate profitability for groups of Fidelity funds and all Fidelity funds, using a series of detailed revenue and cost allocation methodologies which originate with the books and records of Fidelity on which Fidelity's audited financial statements are based. The Audit Committee of the Board reviews any significant changes from the prior year's methodologies.
PricewaterhouseCoopers LLP (PwC), independent registered public accounting firm and auditor to Fidelity and certain Fidelity funds, has been engaged annually by the Board as part of the Board's assessment of Fidelity's profitability analysis. PwC's engagement includes the review and assessment of Fidelity's methodologies used in determining the revenues and expenses attributable to Fidelity's mutual fund business, and completion of agreed-upon procedures surrounding the mathematical accuracy of fund profitability and its conformity to allocation methodologies. After considering PwC's reports issued under the engagement and information provided by Fidelity, the Board concluded that while other allocation methods may also be reasonable, Fidelity's profitability methodologies are reasonable in all material respects.
The Board also reviewed Fidelity's non-fund businesses and fall-out benefits related to the mutual fund business as well as cases where Fidelity's affiliates may benefit from or be related to the fund's business.
The Board considered the costs of the services provided by and the profits realized by Fidelity in connection with the operation of the fund and was satisfied that the profitability was not excessive in the circumstances.
Economies of Scale. The Board considered whether there have been economies of scale in respect of the management of the Fidelity funds, whether the Fidelity funds (including the fund) have appropriately benefited from any such economies of scale, and whether there is potential for realization of any further economies of scale. The Board considered the extent to which the fund will benefit from economies of scale through increased services to the fund, through waivers or reimbursements, or through fee or expense reductions. The Board also noted that in 2009, it and the board of other Fidelity funds created an ad hoc committee (the Economies of Scale Committee) to analyze whether FMR attains economies of scale in respect of the management and servicing of the Fidelity funds, whether the Fidelity funds have appropriately benefited from such economies of scale, and whether there is potential for realization of any further economies of scale.
The Board recognized that the fund's management contract incorporates a "group fee" structure, which provides for lower group fee rates as total fund assets under FMR's management increase, and for higher group fee rates as total fund assets under FMR's management decrease. FMR calculates the group fee rates based on a tiered asset "breakpoint" schedule that varies based on asset class. The Board considered that the group fee is designed to deliver the benefits of economies of scale to fund shareholders when total Fidelity fund assets increase, even if assets of any particular fund are unchanged or have declined, because some portion of Fidelity's costs are attributable to services provided to all Fidelity funds, and all funds benefit if those costs can be allocated among more assets. The Board concluded that, given the group fee structure, fund shareholders will benefit from lower management fees as assets under FMR's management increase at the fund complex level, regardless of whether Fidelity achieves any such economies of scale.
Annual Report
Board Approval of Investment Advisory Contracts and
Management Fees - continued
The Board concluded, taking into account the analysis of the Economies of Scale Committee, that economies of scale, if any, are being appropriately shared between fund shareholders and Fidelity.
Additional Information Requested by the Board. In order to develop fully the factual basis for consideration of the Fidelity funds' Advisory Contracts, the Board requested and received additional information on certain topics, including (i) fund performance trends, actions to be taken by FMR to improve certain funds' overall performance, and Fidelity's long-term strategies for certain funds; (ii) the potential to further rationalize the Fidelity fund lineup with the possibility of achieving savings for the funds and Fidelity; (iii) Fidelity's compensation structure for portfolio managers and other key investment personnel; (iv) the amount of the investment that each portfolio manager has made in the Fidelity fund(s) that he or she manages; (v) the realization of fall-out benefits in certain Fidelity business units; (vi) Fidelity's group fee structures, the potential impact of regulatory changes on such structures, and the rationale for the individual fee rates of certain funds; (vii) fund profitability methodology, including Fidelity's cost allocation methodology, and the impact of certain factors on fund profitability results; (viii) trends regarding industry use of performance fee structures and the possibility of implementing performance fee structures for additional funds; and (ix) the impact of net redemptions from the Fidelity funds.
Based on its evaluation of all of the conclusions noted above, and after considering all factors it believed relevant, the Board ultimately concluded that the advisory fee structures are fair and reasonable, and that the fund's Advisory Contracts should be renewed.
Annual Report
Investment Adviser
Fidelity Management & Research Company
Boston, MA
Investment Sub-Advisers
FMR Co., Inc.
Fidelity Management & Research
(U.K.) Inc.
FIL Investment Advisors
FIL Investments (Japan) Limited
FIL Investment Advisors
(U.K.) Limited
Fidelity Management & Research
(Hong Kong) Limited
Fidelity Management & Research
(Japan) Inc.
General Distributor
Fidelity Distributors Corporation
Smithfield, RI
Transfer and Service Agents
Fidelity Investments Institutional Operations Company, Inc.
Boston, MA
Fidelity Service Company, Inc.
Boston, MA
Custodian
State Street Bank & Trust Company
Quincy, MA
(Fidelity Investment logo)(registered trademark)
ATIEI-UANN-1212
1.853356.104
Fidelity®
Total International Equity
Fund
Annual Report
October 31, 2012
(Fidelity Cover Art)
Contents
Performance | (Click Here) | How the fund has done over time. |
Management's Discussion of Fund Performance | (Click Here) | The Portfolio Manager's review of fund performance and strategy. |
Shareholder Expense Example | (Click Here) | An example of shareholder expenses. |
Investment Changes | (Click Here) | A summary of major shifts in the fund's investments over the past six months. |
Investments | (Click Here) | A complete list of the fund's investments with their market values. |
Financial Statements | (Click Here) | Statements of assets and liabilities, operations, and changes in net assets, as well as financial highlights. |
Notes | (Click Here) | Notes to the financial statements. |
Report of Independent Registered Public Accounting Firm | (Click Here) | |
Trustees and Officers | (Click Here) | |
Distributions | (Click Here) | |
Board Approval of Investment Advisory Contracts and Management Fees | (Click Here) | |
To view a fund's proxy voting guidelines and proxy voting record for the 12-month period ended June 30, visit http://www.fidelity.com/proxyvotingresults or visit the Securities and Exchange Commission's (SEC) web site at http://www.sec.gov. You may also call 1-800-544-8544 to request a free copy of the proxy voting guidelines.
Standard & Poor's, S&P and S&P 500 are registered service marks of The McGraw-Hill Companies, Inc. and have been licensed for use by Fidelity Distributors Corporation.
Other third party marks appearing herein are the property of their respective owners.
All other marks appearing herein are registered or unregistered trademarks or service marks of FMR LLC or an affiliated company. © 2012 FMR LLC. All rights reserved.
Annual Report
This report and the financial statements contained herein are submitted for the general information of the shareholders of the fund. This report is not authorized for distribution to prospective investors in the fund unless preceded or accompanied by an effective prospectus.
A fund files its complete schedule of portfolio holdings with the SEC for the first and third quarters of each fiscal year on Form N-Q. Forms N-Q are available on the SEC's web site at http://www.sec.gov. A fund's Forms N-Q may be reviewed and copied at the SEC's Public Reference Room in Washington, DC. Information regarding the operation of the SEC's Public Reference Room may be obtained by calling 1-800-SEC-0330. For a complete list of a fund's portfolio holdings, view the most recent holdings listing, semiannual report, or annual report on Fidelity's web site at http://www.fidelity.com, http://www.advisor.fidelity.com, or http://www.401k.com, as applicable.
NOT FDIC INSURED • MAY LOSE VALUE • NO BANK GUARANTEE
Neither the fund nor Fidelity Distributors Corporation is a bank.
Annual Report
Average annual total return reflects the change in the value of an investment, assuming reinvestment of the class' distributions from dividend income and capital gains (the profits earned upon the sale of securities that have grown in value, if any) and assuming a constant rate of performance each year. The $10,000 table and the fund's returns do not reflect the deduction of taxes that a shareholder would pay on fund distributions or the redemption of fund shares. During periods of reimbursement by Fidelity, a fund's total return will be greater than it would be had the reimbursement not occurred. How a fund did yesterday is no guarantee of how it will do tomorrow.
Average Annual Total Returns
Periods ended October 31, 2012 | Past 1
year | Life of
fund A |
Fidelity® Total International Equity Fund | 11.03% | -4.68% |
A From November 1, 2007.
$10,000 Over Life of Fund
Let's say hypothetically that $10,000 was invested in Fidelity® Total International Equity Fund, a class of the fund, on November 1, 2007, when the fund started. The chart shows how the value of your investment would have changed, and also shows how the MSCI® ACWI® (All Country World Index) ex USA Index performed over the same period.
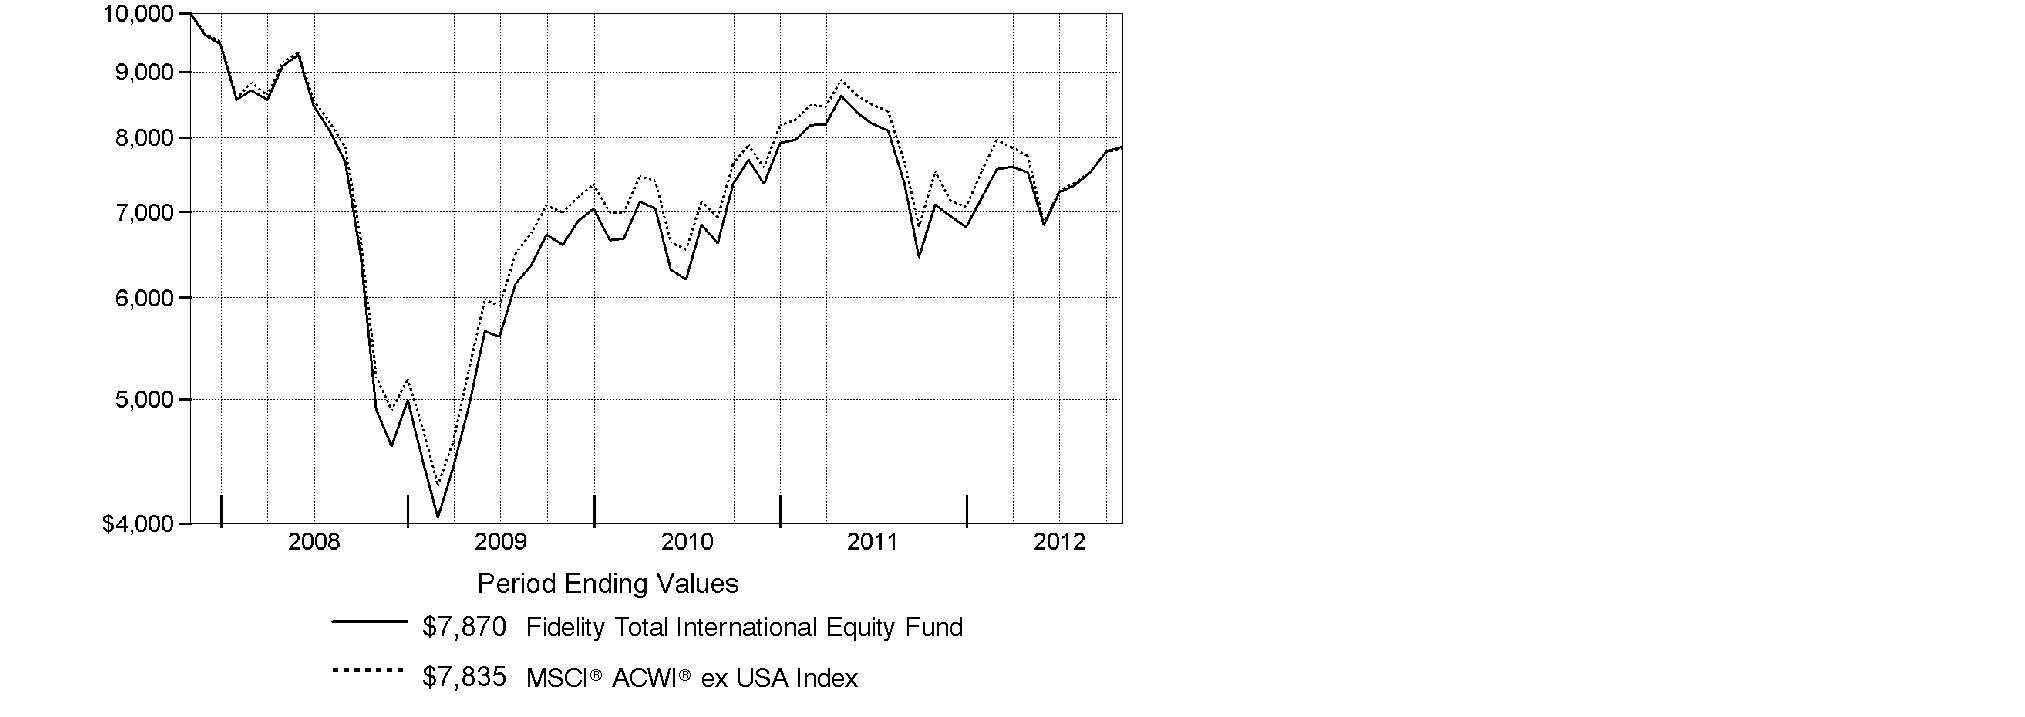
Annual Report
Market Recap: International stocks experienced pendulum-like swings during the 12 months ending October 31, 2012, finishing the period with a modest advance. The market faced periodic bouts of volatility this past year, as a number of macroeconomic concerns - including the eurozone debt crisis, the strength and pace of the U.S. economic recovery, and a slowdown in China's once-blistering growth - dominated headlines and weighed on investors. While a stronger U.S. dollar provided an additional head wind, foreign developed- and emerging-markets stocks still managed a gain for the 12 months, as the MSCI® ACWI® (All Country World Index) ex USA Index rose 4.11%, largely buttressed in the summertime by pledges of accommodative monetary action from eurozone officials, as well as signs that the U.S. housing market was on the mend. Within the index, Asia-Pacific ex Japan showed the most impressive gains, advancing roughly 11%. A number of core European components, most notably Germany (+11%), Switzerland (+10%) and the U.K. (+9%), benefited from optimism about the eurozone's ability to resolve its debt woes, which also helped the region outpace the index overall. Elsewhere, results from Canada (+3%) and the generally more volatile emerging markets (+2%) each fell short of the MSCI index, while Japan was among the few benchmark constituents to finish in the red, returning about -3%.
Comments from Alex Zavratsky, Co-Portfolio Manager of Fidelity® Total International Equity Fund: For the year, the fund's Retail Class shares gained 11.03%, significantly outpacing the MSCI index. The fund benefited from security selection in emerging markets - especially Brazil, South Korea, and Chile - and Japan. Good positioning in Europe overcame negative stock selection, specifically in Germany. An out-of-benchmark allocation to U.S. stocks also added, notably credit card network Visa. Conversely, stock picking in Canada modestly hurt. In sector terms, security selection helped in industrials, as did positioning in materials and health care. The top individual contributor was Belgian brewer Anheuser-Busch InBev, while, in health care, Denmark's Novo Nordisk and Australian biotechnology company CSL added value. Not owning Telefonica, a poor-performing Spanish telecom provider and benchmark component, also helped. In contrast, untimely ownership of South Korean electronics maker Samsung Electronics hurt, as did not owning Diageo, a strong-performing U.K.-based spirits company and benchmark component. An overweighting in Repsol, a Spain-based integrated oil and gas company, also detracted. Samsung was not held at period end.
The views expressed above reflect those of the portfolio manager(s) only through the end of the period as stated on the cover of this report and do not necessarily represent the views of Fidelity or any other person in the Fidelity organization. Any such views are subject to change at any time based upon market or other conditions and Fidelity disclaims any responsibility to update such views. These views may not be relied on as investment advice and, because investment decisions for a Fidelity fund are based on numerous factors, may not be relied on as an indication of trading intent on behalf of any Fidelity fund.
Annual Report
Shareholder Expense Example
As a shareholder of the Fund, you incur two types of costs: (1) transaction costs, including sales charges (loads) on purchase payments or redemption proceeds, redemption fees and (2) ongoing costs, including management fees, distribution and/or service (12b-1) fees and other Fund expenses. This Example is intended to help you understand your ongoing costs (in dollars) of investing in the Fund and to compare these costs with the ongoing costs of investing in other mutual funds.
The Example is based on an investment of $1,000 invested at the beginning of the period and held for the entire period (May 1, 2012 to October 31, 2012).
Actual Expenses
The first line of the accompanying table for each class of the Fund provides information about actual account values and actual expenses. You may use the information in this line, together with the amount you invested, to estimate the expenses that you paid over the period. Simply divide your account value by $1,000.00 (for example, an $8,600 account value divided by $1,000.00 = 8.6), then multiply the result by the number in the first line for a class of the Fund under the heading entitled "Expenses Paid During Period" to estimate the expenses you paid on your account during this period. A small balance maintenance fee of $12.00 that is charged once a year may apply for certain accounts with a value of less than $2,000. This fee is not included in the table below. If it was, the estimate of expenses you paid during the period would be higher, and your ending account value lower, by this amount. In addition, the Fund, as a shareholder in the underlying Fidelity Central Funds, will indirectly bear its pro-rata share of the fees and expenses incurred by the underlying Fidelity Central Funds. These fees and expenses are not included in the Fund's annualized expense ratio used to calculate the expense estimate in the table below.
Hypothetical Example for Comparison Purposes
The second line of the accompanying table for each class of the Fund provides information about hypothetical account values and hypothetical expenses based on a Class' actual expense ratio and an assumed rate of return of 5% per year before expenses, which is not the Class' actual return. The hypothetical account values and expenses may not be used to estimate the actual ending account balance or expenses you paid for the period. You may use this information to compare the ongoing costs of investing in the Fund and other funds. To do so, compare this 5% hypothetical example with the 5% hypothetical examples that appear in the shareholder reports of the other funds. A small balance maintenance fee of $12.00 that is charged once a year may apply for certain accounts with a value of less than $2,000. This fee is not included in the table below. If it was, the estimate of expenses you paid during the period would be higher, and your ending account value lower, by this amount. In addition, the Fund, as a shareholder in the underlying Fidelity Central Funds, will indirectly bear its pro-rata share of the fees and expenses incurred by the underlying Fidelity Central Funds. These fees and expenses are not included in the Fund's annualized expense ratio used to calculate the expense estimate in the table below.
Please note that the expenses shown in the table are meant to highlight your ongoing costs only and do not reflect any transaction costs. Therefore, the second line of the table is useful in comparing ongoing costs only, and will not help you determine the relative total costs of owning different funds. In addition, if these transactional costs were included, your costs would have been higher.
Annual Report
Shareholder Expense Example - continued
| Annualized
Expense Ratio | Beginning
Account Value
May 1, 2012 | Ending
Account Value
October 31, 2012 | Expenses Paid
During Period*
May 1, 2012 to
October 31, 2012 |
Class A | 1.45% | | | |
Actual | | $ 1,000.00 | $ 1,045.80 | $ 7.46 |
HypotheticalA | | $ 1,000.00 | $ 1,017.85 | $ 7.35 |
Class T | 1.70% | | | |
Actual | | $ 1,000.00 | $ 1,043.90 | $ 8.73 |
HypotheticalA | | $ 1,000.00 | $ 1,016.59 | $ 8.62 |
Class B | 2.20% | | | |
Actual | | $ 1,000.00 | $ 1,042.70 | $ 11.30 |
HypotheticalA | | $ 1,000.00 | $ 1,014.08 | $ 11.14 |
Class C | 2.20% | | | |
Actual | | $ 1,000.00 | $ 1,041.30 | $ 11.29 |
HypotheticalA | | $ 1,000.00 | $ 1,014.08 | $ 11.14 |
Total International Equity | 1.14% | | | |
Actual | | $ 1,000.00 | $ 1,047.20 | $ 5.87 |
HypotheticalA | | $ 1,000.00 | $ 1,019.41 | $ 5.79 |
Institutional Class | 1.20% | | | |
Actual | | $ 1,000.00 | $ 1,047.30 | $ 6.18 |
HypotheticalA | | $ 1,000.00 | $ 1,019.10 | $ 6.09 |
A 5% return per year before expenses
* Expenses are equal to each Class' annualized expense ratio, multiplied by the average account value over the period, multiplied by 184/366 (to reflect the one-half year period).
Annual Report
Investment Changes (Unaudited)
Geographic Diversification (% of fund's net assets) |
As of October 31, 2012 |
 | United Kingdom 16.8% | |
 | Japan 10.8% | |
 | United States of America 7.2% | |
 | Switzerland 6.9% | |
 | Germany 5.1% | |
 | France 5.0% | |
 | Australia 4.8% | |
 | Taiwan 3.7% | |
 | Korea (South) 2.9% | |
| Other 36.8% | |

Percentages are based on country or territory of incorporation and are adjusted for the effect of futures contracts, if applicable. |
As of April 30, 2012 |
| United Kingdom 18.1% | |
| Japan 13.5% | |
| Switzerland 7.0% | |
| United States of America 6.4% | |
| Germany 5.7% | |
| Australia 4.4% | |
| France 4.3% | |
| Taiwan 3.0% | |
| India 2.6% | |
| Other 35.0% | |

Percentages are based on country or territory of incorporation and are adjusted for the effect of futures contracts, if applicable. |
Asset Allocation |
| % of fund's
net assets | % of fund's net assets
6 months ago |
Stocks | 98.4 | 98.8 |
Short-Term Investments and Net Other Assets (Liabilities) | 1.6 | 1.2 |
Top Ten Stocks as of October 31, 2012 |
| % of fund's
net assets | % of fund's net assets
6 months ago |
Nestle SA (Switzerland, Food Products) | 2.3 | 2.4 |
Roche Holding AG (participation certificate) (Switzerland, Pharmaceuticals) | 1.8 | 2.2 |
Royal Dutch Shell PLC Class A sponsored ADR (United Kingdom, Oil, Gas & Consumable Fuels) | 1.8 | 2.2 |
Sanofi SA (France, Pharmaceuticals) | 1.4 | 1.4 |
BHP Billiton PLC (United Kingdom, Metals & Mining) | 1.3 | 1.0 |
GlaxoSmithKline PLC sponsored ADR (United Kingdom, Pharmaceuticals) | 1.2 | 1.6 |
Vodafone Group PLC sponsored ADR (United Kingdom, Wireless Telecommunication Services) | 1.2 | 1.4 |
Anheuser-Busch InBev SA NV (Belgium, Beverages) | 1.2 | 1.0 |
HSBC Holdings PLC sponsored ADR (United Kingdom, Commercial Banks) | 1.0 | 0.9 |
Commonwealth Bank of Australia (Australia, Commercial Banks) | 1.0 | 1.0 |
| 14.2 | |
Market Sectors as of October 31, 2012 |
| % of fund's
net assets | % of fund's net assets
6 months ago |
Financials | 21.4 | 19.8 |
Consumer Staples | 14.4 | 14.7 |
Industrials | 12.2 | 11.7 |
Consumer Discretionary | 10.2 | 11.6 |
Health Care | 9.8 | 10.6 |
Materials | 8.7 | 7.4 |
Energy | 7.4 | 7.6 |
Information Technology | 6.3 | 6.0 |
Telecommunication Services | 4.1 | 5.4 |
Utilities | 3.9 | 4.0 |
Annual Report
Investments October 31, 2012
Showing Percentage of Net Assets
Common Stocks - 97.9% |
| Shares | | Value |
Australia - 4.8% |
Australia & New Zealand Banking Group Ltd. | 91,182 | | $ 2,408,879 |
Coca-Cola Amatil Ltd. | 58,234 | | 813,050 |
Commonwealth Bank of Australia | 47,936 | | 2,873,638 |
CSL Ltd. | 35,275 | | 1,739,318 |
Newcrest Mining Ltd. | 19,905 | | 546,107 |
Origin Energy Ltd. | 38,131 | | 449,650 |
Ramsay Health Care Ltd. | 2,082 | | 51,351 |
Sydney Airport unit | 284,317 | | 1,000,509 |
Telstra Corp. Ltd. | 234,394 | | 1,007,315 |
Transurban Group unit | 73,700 | | 465,146 |
Westfield Group unit | 112,623 | | 1,246,243 |
Woodside Petroleum Ltd. | 18,232 | | 651,045 |
Woolworths Ltd. | 14,358 | | 438,336 |
WorleyParsons Ltd. | 22,067 | | 565,107 |
TOTAL AUSTRALIA | | 14,255,694 |
Austria - 0.4% |
Andritz AG | 18,358 | | 1,105,741 |
Zumtobel AG | 5,000 | | 53,421 |
TOTAL AUSTRIA | | 1,159,162 |
Bailiwick of Jersey - 0.8% |
Atrium European Real Estate Ltd. | 134,051 | | 757,725 |
Informa PLC | 52,073 | | 336,299 |
Randgold Resources Ltd. sponsored ADR | 6,760 | | 808,428 |
Wolseley PLC | 13,367 | | 584,358 |
TOTAL BAILIWICK OF JERSEY | | 2,486,810 |
Belgium - 1.6% |
Anheuser-Busch InBev SA NV | 40,471 | | 3,384,637 |
Gimv NV | 1,703 | | 82,312 |
KBC Groupe SA | 9,918 | | 232,808 |
Umicore SA | 19,051 | | 977,718 |
TOTAL BELGIUM | | 4,677,475 |
Bermuda - 2.0% |
Cheung Kong Infrastructure Holdings Ltd. | 70,000 | | 410,062 |
First Pacific Co. Ltd. | 764,000 | | 850,745 |
GP Investments Ltd. (depositary receipt) (a) | 12,300 | | 28,403 |
Lazard Ltd. Class A | 8,770 | | 258,364 |
Li & Fung Ltd. | 234,000 | | 392,514 |
Pacific Basin Shipping Ltd. | 1,704,000 | | 912,459 |
Texwinca Holdings Ltd. | 860,000 | | 684,667 |
Common Stocks - continued |
| Shares | | Value |
Bermuda - continued |
Trinity Ltd. | 964,000 | | $ 675,418 |
Vtech Holdings Ltd. | 65,900 | | 782,717 |
Yue Yuen Industrial (Holdings) Ltd. | 222,000 | | 766,253 |
TOTAL BERMUDA | | 5,761,602 |
Brazil - 2.4% |
Arezzo Industria e Comercio SA | 15,600 | | 278,427 |
Banco Bradesco SA | 123,000 | | 1,618,764 |
Banco Pine SA | 7,106 | | 49,681 |
Duratex SA | 98,200 | | 683,177 |
Iguatemi Empresa de Shopping Centers SA | 20,600 | | 261,677 |
LPS Brasil Consultoria de Imoveis SA | 30,100 | | 517,215 |
Multiplan Empreendimentos Imobiliarios SA | 16,100 | | 471,653 |
Oi SA | 123,916 | | 585,704 |
Porto Seguro SA | 73,000 | | 776,347 |
Tractebel Energia SA | 51,300 | | 884,026 |
Weg SA | 63,000 | | 723,660 |
TOTAL BRAZIL | | 6,850,331 |
British Virgin Islands - 0.0% |
Gem Diamonds Ltd. (a) | 10,228 | | 27,853 |
Canada - 0.9% |
Agnico-Eagle Mines Ltd. (Canada) | 6,440 | | 363,606 |
Baytex Energy Corp. | 700 | | 31,855 |
Copper Mountain Mining Corp. (a) | 6,600 | | 26,697 |
Eldorado Gold Corp. | 3,800 | | 56,158 |
Fairfax Financial Holdings Ltd. (sub. vtg.) | 705 | | 261,536 |
First Quantum Minerals Ltd. | 10,585 | | 237,931 |
Goldcorp, Inc. | 12,994 | | 587,413 |
Open Text Corp. (a) | 5,150 | | 276,798 |
Painted Pony Petroleum Ltd. Class A (a) | 3,200 | | 34,603 |
Pason Systems, Inc. | 3,700 | | 60,274 |
Petrominerales Ltd. | 3,125 | | 25,063 |
Suncor Energy, Inc. | 17,300 | | 580,622 |
TAG Oil Ltd. (a) | 4,700 | | 32,941 |
TOTAL CANADA | | 2,575,497 |
Cayman Islands - 1.8% |
ASM Pacific Technology Ltd. | 53,400 | | 595,320 |
Baidu.com, Inc. sponsored ADR (a) | 3,500 | | 373,170 |
ENN Energy Holdings Ltd. | 122,000 | | 507,674 |
Common Stocks - continued |
| Shares | | Value |
Cayman Islands - continued |
Haitian International Holdings Ltd. | 512,000 | | $ 632,233 |
Kingboard Chemical Holdings Ltd. | 213,000 | | 633,499 |
Lee & Man Paper Manufacturing Ltd. | 1,489,000 | | 781,960 |
Sands China Ltd. | 290,600 | | 1,093,024 |
Vantage Drilling Co. (a) | 15,200 | | 27,968 |
Yingde Gases Group Co. Ltd. | 750,500 | | 711,760 |
TOTAL CAYMAN ISLANDS | | 5,356,608 |
Chile - 2.1% |
Cencosud SA | 120,432 | | 657,289 |
Compania Cervecerias Unidas SA sponsored ADR | 11,400 | | 808,602 |
Embotelladora Andina SA sponsored ADR | 18,600 | | 704,568 |
Inversiones Aguas Metropolitanas SA | 437,696 | | 814,170 |
Isapre CruzBlanca SA | 637,596 | | 834,580 |
Parque Arauco SA | 402,367 | | 919,051 |
Quinenco SA | 315,548 | | 898,474 |
Sociedad Matriz SAAM SA | 4,670,971 | | 546,071 |
TOTAL CHILE | | 6,182,805 |
China - 1.1% |
China BlueChemical Ltd. (H Shares) | 1,336,000 | | 846,415 |
China Oilfield Services Ltd. (H Shares) | 430,000 | | 815,608 |
China Shipping Development Co. Ltd. (H Shares) | 1,472,000 | | 773,032 |
Dongfeng Motor Group Co. Ltd. (H Shares) | 544,000 | | 673,854 |
TOTAL CHINA | | 3,108,909 |
Colombia - 0.3% |
BanColombia SA sponsored ADR | 11,500 | | 736,230 |
Curacao - 0.2% |
Schlumberger Ltd. | 8,600 | | 597,958 |
Denmark - 0.9% |
Novo Nordisk A/S Series B sponsored ADR | 15,200 | | 2,436,408 |
William Demant Holding A/S (a) | 4,110 | | 353,488 |
TOTAL DENMARK | | 2,789,896 |
Finland - 0.8% |
Nokian Tyres PLC | 29,202 | | 1,211,206 |
Outotec Oyj | 6,412 | | 312,241 |
Sampo OYJ (A Shares) | 27,199 | | 852,441 |
TOTAL FINLAND | | 2,375,888 |
Common Stocks - continued |
| Shares | | Value |
France - 5.0% |
Alstom SA | 22,162 | | $ 756,911 |
Arkema SA | 7,560 | | 689,254 |
Atos Origin SA | 10,510 | | 705,784 |
BNP Paribas SA | 42,351 | | 2,130,407 |
Compagnie de St. Gobain | 16,600 | | 585,022 |
Danone SA | 20,380 | | 1,252,757 |
GDF Suez | 39,743 | | 912,036 |
Laurent-Perrier Group | 859 | | 73,261 |
Pernod Ricard SA | 5,500 | | 591,906 |
PPR SA | 3,083 | | 542,062 |
Remy Cointreau SA | 5,281 | | 547,734 |
Safran SA | 15,114 | | 601,315 |
Saft Groupe SA | 2,629 | | 58,457 |
Sanofi SA | 46,258 | | 4,062,723 |
Schneider Electric SA | 6,245 | | 390,436 |
Unibail-Rodamco | 2,908 | | 655,276 |
Vetoquinol SA | 1,200 | | 40,129 |
Virbac SA | 520 | | 90,653 |
TOTAL FRANCE | | 14,686,123 |
Germany - 4.6% |
Allianz AG | 15,953 | | 1,978,008 |
alstria office REIT-AG | 5,100 | | 61,595 |
BASF AG | 8,181 | | 677,901 |
Bayer AG | 24,293 | | 2,115,637 |
Bilfinger Berger AG | 1,167 | | 114,187 |
CompuGROUP Holding AG | 3,446 | | 62,531 |
CTS Eventim AG | 4,250 | | 126,148 |
Daimler AG (Germany) | 22,353 | | 1,043,747 |
Deutsche Post AG | 40,282 | | 798,575 |
Fielmann AG | 1,079 | | 105,031 |
Fresenius SE & Co. KGaA | 5,800 | | 661,555 |
HeidelbergCement Finance AG | 10,700 | | 567,095 |
Linde AG | 13,449 | | 2,261,792 |
RWE AG | 23,200 | | 1,060,142 |
Siemens AG | 13,786 | | 1,389,063 |
Siemens AG sponsored ADR | 5,669 | | 572,059 |
Software AG (Bearer) | 1,959 | | 78,485 |
TOTAL GERMANY | | 13,673,551 |
Hong Kong - 2.5% |
Cathay Pacific Airways Ltd. | 393,000 | | 711,959 |
Common Stocks - continued |
| Shares | | Value |
Hong Kong - continued |
Cheung Kong Holdings Ltd. | 78,000 | | $ 1,152,380 |
China Insurance International Holdings Co. Ltd. (a) | 608,800 | | 1,043,201 |
China Merchant Holdings International Co. Ltd. | 234,000 | | 775,969 |
China Resources Enterprise Ltd. | 284,000 | | 923,452 |
China Resources Power Holdings Co. Ltd. | 250,000 | | 535,480 |
Dah Chong Hong Holdings Ltd. | 687,000 | | 647,992 |
Hopewell Holdings Ltd. | 163,500 | | 589,651 |
Hysan Development Co. Ltd. | 28,000 | | 123,741 |
Television Broadcasts Ltd. | 129,000 | | 961,252 |
TOTAL HONG KONG | | 7,465,077 |
Hungary - 0.2% |
Richter Gedeon PLC | 3,700 | | 690,100 |
India - 2.4% |
Bharti Airtel Ltd. | 173,106 | | 867,541 |
Cipla Ltd. | 79,925 | | 539,666 |
Container Corp. of India Ltd. | 33,774 | | 630,253 |
Housing Development Finance Corp. Ltd. (a) | 94,893 | | 1,344,516 |
Jyothy Laboratories Ltd. | 24,138 | | 79,563 |
Max India Ltd. (a) | 171,991 | | 773,888 |
Piramal Enterprises Ltd. | 58,571 | | 540,588 |
Punjab National Bank | 51,513 | | 730,982 |
Satyam Computer Services Ltd. (a) | 418,989 | | 850,360 |
Tata Power Co. Ltd. | 427,422 | | 842,451 |
TOTAL INDIA | | 7,199,808 |
Indonesia - 0.2% |
PT Kalbe Farma Tbk | 6,357,000 | | 641,985 |
Ireland - 0.6% |
CRH PLC sponsored ADR | 31,200 | | 581,880 |
Elan Corp. PLC sponsored ADR (a) | 28,485 | | 307,638 |
FBD Holdings PLC | 2,500 | | 31,270 |
James Hardie Industries NV: | | | |
CDI | 1,000 | | 9,581 |
sponsored ADR | 16,845 | | 810,076 |
TOTAL IRELAND | | 1,740,445 |
Israel - 0.1% |
Azrieli Group | 11,296 | | 252,176 |
Common Stocks - continued |
| Shares | | Value |
Israel - continued |
Ituran Location & Control Ltd. | 4,361 | | $ 53,902 |
Strauss Group Ltd. | 659 | | 7,446 |
TOTAL ISRAEL | | 313,524 |
Italy - 1.6% |
Azimut Holding SpA | 7,614 | | 96,419 |
ENI SpA | 123,700 | | 2,846,452 |
Fiat Industrial SpA | 81,628 | | 883,977 |
Interpump Group SpA | 51,091 | | 388,059 |
Saipem SpA | 13,530 | | 607,829 |
TOTAL ITALY | | 4,822,736 |
Japan - 10.8% |
Aeon Credit Service Co. Ltd. | 33,700 | | 715,117 |
Air Water, Inc. | 49,000 | | 613,804 |
Aozora Bank Ltd. | 158,000 | | 445,321 |
Asahi Co. Ltd. | 3,000 | | 45,171 |
Astellas Pharma, Inc. | 27,400 | | 1,360,904 |
Autobacs Seven Co. Ltd. | 11,900 | | 488,194 |
Azbil Corp. | 2,100 | | 42,958 |
Chubu Electric Power Co., Inc. | 36,200 | | 373,201 |
Cosmos Pharmaceutical Corp. | 400 | | 39,434 |
Credit Saison Co. Ltd. | 24,500 | | 537,999 |
Daikoku Denki Co. Ltd. | 1,000 | | 25,304 |
Daikokutenbussan Co. Ltd. | 3,800 | | 120,812 |
Denso Corp. | 64,500 | | 2,019,109 |
Fanuc Corp. | 7,700 | | 1,225,943 |
Fast Retailing Co. Ltd. | 3,400 | | 757,259 |
FCC Co. Ltd. | 5,500 | | 98,866 |
Fields Corp. | 2,000 | | 28,761 |
GCA Savvian Group Corp. | 44 | | 52,251 |
Glory Ltd. | 2,900 | | 70,402 |
Goldcrest Co. Ltd. | 3,280 | | 49,346 |
Hitachi Ltd. | 161,000 | | 853,100 |
Honda Motor Co. Ltd. | 50,100 | | 1,506,169 |
INPEX Corp. | 67 | | 381,874 |
Itochu Corp. | 60,800 | | 608,533 |
Iwatsuka Confectionary Co. Ltd. | 1,000 | | 37,430 |
Japan Retail Fund Investment Corp. | 257 | | 468,414 |
Japan Tobacco, Inc. | 53,900 | | 1,489,458 |
JS Group Corp. | 13,600 | | 300,689 |
JSR Corp. | 28,500 | | 488,388 |
Common Stocks - continued |
| Shares | | Value |
Japan - continued |
Kamigumi Co. Ltd. | 7,000 | | $ 56,470 |
Keyence Corp. | 4,321 | | 1,146,421 |
Kobayashi Pharmaceutical Co. Ltd. | 10,700 | | 564,957 |
Kyoto Kimono Yuzen Co. Ltd. | 3,800 | | 45,935 |
Meiko Network Japan Co. Ltd. | 3,700 | | 37,542 |
Miraial Co. Ltd. | 300 | | 5,712 |
Mitsubishi Corp. | 43,100 | | 769,354 |
Mitsubishi Estate Co. Ltd. | 47,000 | | 929,638 |
Mitsui Fudosan Co. Ltd. | 27,000 | | 545,547 |
Nabtesco Corp. | 3,600 | | 67,012 |
Nagaileben Co. Ltd. | 3,700 | | 54,320 |
Nihon M&A Center, Inc. | 4,000 | | 120,005 |
Nihon Parkerizing Co. Ltd. | 5,000 | | 75,473 |
Nintendo Co. Ltd. | 3,600 | | 463,585 |
Nippon Seiki Co. Ltd. | 6,000 | | 57,648 |
Nippon Telegraph & Telephone Corp. | 12,000 | | 548,738 |
Nippon Thompson Co. Ltd. | 14,000 | | 48,403 |
NS Tool Co., Ltd. | 1,600 | | 27,258 |
Obic Co. Ltd. | 310 | | 63,802 |
ORIX Corp. | 6,400 | | 657,397 |
Osaka Securities Exchange Co. Ltd. | 14 | | 52,173 |
OSG Corp. | 5,200 | | 68,070 |
Santen Pharmaceutical Co. Ltd. | 13,300 | | 582,281 |
Seven & i Holdings Co., Ltd. | 50,600 | | 1,560,531 |
Seven Bank Ltd. | 232,500 | | 664,036 |
SHO-BOND Holdings Co. Ltd. | 12,400 | | 374,811 |
Shoei Co. Ltd. | 3,900 | | 21,251 |
SMC Corp. | 2,200 | | 346,687 |
Softbank Corp. | 19,900 | | 629,930 |
Sumitomo Mitsui Financial Group, Inc. | 64,700 | | 1,977,038 |
Sumitomo Realty & Development Co. Ltd. | 20,000 | | 552,173 |
The Nippon Synthetic Chemical Industry Co. Ltd. | 10,000 | | 65,640 |
Tocalo Co. Ltd. | 2,000 | | 29,037 |
Toyo Suisan Kaisha Ltd. | 16,000 | | 398,647 |
Tsutsumi Jewelry Co. Ltd. | 1,200 | | 27,523 |
Unicharm Corp. | 10,100 | | 546,561 |
USS Co. Ltd. | 15,840 | | 1,664,758 |
Yamato Kogyo Co. Ltd. | 23,200 | | 651,274 |
TOTAL JAPAN | | 31,741,849 |
Korea (South) - 2.9% |
AMOREPACIFIC Corp. | 595 | | 676,682 |
Common Stocks - continued |
| Shares | | Value |
Korea (South) - continued |
BS Financial Group, Inc. | 91,770 | | $ 1,039,474 |
E-Mart Co. Ltd. | 3,360 | | 728,814 |
Kiwoom Securities Co. Ltd. | 11,170 | | 565,507 |
LG Corp. | 21,485 | | 1,312,368 |
LG Household & Health Care Ltd. | 1,406 | | 826,589 |
NICE Holdings Co. Ltd. | 600 | | 31,862 |
NICE Information Service Co. Ltd. | 7,500 | | 33,018 |
S1 Corp. | 10,741 | | 648,211 |
Samsung Fire & Marine Insurance Co. Ltd. | 4,109 | | 898,816 |
Shinsegae Co. Ltd. | 4,287 | | 766,715 |
Woongjin Coway Co. Ltd. | 1,880 | | 68,453 |
Yuhan Corp. | 4,588 | | 793,197 |
TOTAL KOREA (SOUTH) | | 8,389,706 |
Malaysia - 0.5% |
Axiata Group Bhd | 381,100 | | 817,000 |
Top Glove Corp. Bhd | 393,700 | | 691,495 |
TOTAL MALAYSIA | | 1,508,495 |
Mexico - 0.5% |
Bolsa Mexicana de Valores SA de CV | 406,600 | | 900,209 |
Urbi, Desarrollos Urbanos, SA de CV (a) | 892,000 | | 556,563 |
TOTAL MEXICO | | 1,456,772 |
Netherlands - 1.9% |
Aalberts Industries NV | 6,400 | | 116,135 |
ASM International NV unit | 2,250 | | 71,370 |
ASML Holding NV | 28,800 | | 1,583,136 |
D.E. Master Blenders 1753 NV (a) | 29,200 | | 356,865 |
Heijmans NV unit | 3,381 | | 28,629 |
ING Groep NV (Certificaten Van Aandelen) (a) | 152,478 | | 1,356,770 |
Koninklijke Philips Electronics NV | 36,839 | | 922,672 |
QIAGEN NV (a) | 3,000 | | 52,350 |
Unilever NV (Certificaten Van Aandelen) (Bearer) | 27,200 | | 999,726 |
TOTAL NETHERLANDS | | 5,487,653 |
Norway - 0.5% |
Orkla ASA (A Shares) | 53,082 | | 419,904 |
Telenor ASA | 45,711 | | 898,778 |
TOTAL NORWAY | | 1,318,682 |
Papua New Guinea - 0.3% |
Oil Search Ltd. ADR | 107,827 | | 832,758 |
Common Stocks - continued |
| Shares | | Value |
Philippines - 0.6% |
BDO Unibank, Inc. | 666,132 | | $ 1,037,286 |
Jollibee Food Corp. | 26,900 | | 69,181 |
Manila Water Co., Inc. | 1,106,700 | | 780,883 |
TOTAL PHILIPPINES | | 1,887,350 |
Poland - 0.2% |
Warsaw Stock Exchange | 54,438 | | 639,414 |
Portugal - 0.4% |
Jeronimo Martins SGPS SA | 64,569 | | 1,129,830 |
Singapore - 1.9% |
Ascendas India Trust | 931,000 | | 580,062 |
Ascendas Real Estate Investment Trust | 310,000 | | 599,770 |
Bumitama Agri Ltd. | 859,000 | | 707,735 |
ComfortDelgro Corp. Ltd. | 266,000 | | 368,536 |
Ezra Holdings Ltd. | 687,000 | | 627,976 |
Global Logistic Properties Ltd. | 372,000 | | 783,768 |
Singapore Telecommunications Ltd. | 267,000 | | 704,820 |
United Overseas Bank Ltd. | 77,746 | | 1,164,469 |
TOTAL SINGAPORE | | 5,537,136 |
South Africa - 2.8% |
African Rainbow Minerals Ltd. | 2,600 | | 54,425 |
AngloGold Ashanti Ltd. | 27,700 | | 935,854 |
Bidvest Group Ltd. | 29,400 | | 701,716 |
City Lodge Hotels Ltd. | 2,500 | | 26,526 |
Clicks Group Ltd. | 69,625 | | 480,031 |
Impala Platinum Holdings Ltd. | 46,100 | | 829,419 |
Mr Price Group Ltd. | 3,100 | | 47,891 |
MTN Group Ltd. | 60,100 | | 1,083,660 |
Nampak Ltd. | 176,100 | | 586,956 |
Reunert Ltd. | 63,000 | | 554,969 |
Sasol Ltd. | 25,800 | | 1,099,082 |
Standard Bank Group Ltd. | 82,600 | | 1,020,372 |
Tiger Brands Ltd. | 28,600 | | 909,062 |
TOTAL SOUTH AFRICA | | 8,329,963 |
Spain - 1.4% |
Banco Bilbao Vizcaya Argentaria SA sponsored ADR | 194,128 | | 1,611,262 |
Grifols SA (a) | 1,546 | | 53,623 |
Inditex SA | 8,110 | | 1,034,779 |
Common Stocks - continued |
| Shares | | Value |
Spain - continued |
Prosegur Compania de Seguridad SA (Reg.) | 96,376 | | $ 524,655 |
Repsol YPF SA | 42,765 | | 854,728 |
TOTAL SPAIN | | 4,079,047 |
Sweden - 1.5% |
ASSA ABLOY AB (B Shares) | 19,600 | | 653,343 |
Fagerhult AB | 11,100 | | 274,450 |
H&M Hennes & Mauritz AB (B Shares) | 33,386 | | 1,129,997 |
Intrum Justitia AB | 23,463 | | 339,587 |
Svenska Handelsbanken AB (A Shares) | 32,600 | | 1,116,664 |
Swedish Match Co. AB | 25,950 | | 884,183 |
TOTAL SWEDEN | | 4,398,224 |
Switzerland - 6.9% |
Holcim Ltd. (Reg.) | 13,460 | | 918,483 |
Nestle SA | 105,629 | | 6,703,182 |
Roche Holding AG (participation certificate) | 28,367 | | 5,455,309 |
Schindler Holding AG: | | | |
(participation certificate) | 3,536 | | 465,873 |
(Reg.) | 820 | | 106,099 |
Swatch Group AG (Bearer) | 1,230 | | 509,011 |
Swisscom AG | 1,648 | | 684,646 |
Syngenta AG (Switzerland) | 3,135 | | 1,222,304 |
UBS AG (NY Shares) | 169,037 | | 2,538,936 |
Zehnder Group AG | 993 | | 58,484 |
Zurich Financial Services AG | 6,802 | | 1,676,215 |
TOTAL SWITZERLAND | | 20,338,542 |
Taiwan - 3.7% |
Chinatrust Financial Holding Co. Ltd. | 2,114 | | 1,165 |
Chroma ATE, Inc. | 264,116 | | 502,734 |
CTCI Corp. | 248,000 | | 493,283 |
Delta Electronics, Inc. | 229,000 | | 782,410 |
E Sun Financial Holdings Co. Ltd. | 1,187,350 | | 595,504 |
Motech Industries, Inc. (a) | 458,000 | | 352,790 |
Powertech Technology, Inc. | 358,000 | | 556,426 |
President Chain Store Corp. | 126,000 | | 623,314 |
SIMPLO Technology Co. Ltd. | 88,300 | | 435,303 |
St. Shine Optical Co. Ltd. | 57,000 | | 743,478 |
Synnex Technology International Corp. | 286,000 | | 605,094 |
Taiwan Hon Chuan Enterprise Co. Ltd. | 258,000 | | 549,387 |
Taiwan Mobile Co. Ltd. | 219,000 | | 764,738 |
Taiwan Semiconductor Manufacturing Co. Ltd. | 444,035 | | 1,353,117 |
Common Stocks - continued |
| Shares | | Value |
Taiwan - continued |
Unified-President Enterprises Corp. | 684,800 | | $ 1,209,712 |
Wistron Corp. | 540,000 | | 518,555 |
WPG Holding Co. Ltd. | 558,000 | | 674,338 |
TOTAL TAIWAN | | 10,761,348 |
Turkey - 1.2% |
Albaraka Turk Katilim Bankasi A/S | 89,303 | | 70,745 |
Anadolu Efes Biracilik Ve Malt Sanayii A/S | 73,000 | | 1,095,509 |
Boyner Buyuk Magazacilik A/S (a) | 42,049 | | 96,648 |
Coca-Cola Icecek A/S | 39,789 | | 772,473 |
Enka Insaat ve Sanayi A/S | 224,680 | | 596,640 |
Turkiye Garanti Bankasi A/S | 121,500 | | 580,218 |
Turkiye Petrol Rafinerile A/S | 15,313 | | 374,175 |
TOTAL TURKEY | | 3,586,408 |
United Arab Emirates - 0.2% |
First Gulf Bank PJSC | 214,355 | | 609,858 |
United Kingdom - 16.8% |
AMEC PLC | 3,189 | | 54,550 |
Anglo American PLC (United Kingdom) | 12,500 | | 383,871 |
Babcock International Group PLC | 40,500 | | 639,190 |
Barclays PLC | 409,903 | | 1,515,713 |
Bellway PLC | 6,228 | | 101,610 |
Berendsen PLC | 5,246 | | 47,662 |
BG Group PLC | 113,677 | | 2,105,046 |
BHP Billiton PLC | 67,335 | | 2,158,171 |
BHP Billiton PLC ADR | 26,900 | | 1,721,062 |
BP PLC sponsored ADR | 42,587 | | 1,826,556 |
British American Tobacco PLC (United Kingdom) | 17,153 | | 850,782 |
British Land Co. PLC | 85,777 | | 731,564 |
Britvic PLC | 13,800 | | 79,993 |
Bunzl PLC | 43,757 | | 723,782 |
Centrica PLC | 199,975 | | 1,045,902 |
Compass Group PLC | 94,000 | | 1,031,509 |
Dechra Pharmaceuticals PLC | 8,600 | | 85,629 |
Derwent London PLC | 1,800 | | 59,896 |
Elementis PLC | 12,790 | | 43,199 |
GlaxoSmithKline PLC sponsored ADR | 79,097 | | 3,551,455 |
Great Portland Estates PLC | 15,772 | | 119,014 |
H&T Group PLC | 7,014 | | 32,542 |
HSBC Holdings PLC sponsored ADR | 61,131 | | 3,017,426 |
Imperial Tobacco Group PLC | 12,777 | | 482,482 |
Common Stocks - continued |
| Shares | | Value |
United Kingdom - continued |
InterContinental Hotel Group PLC ADR | 42,777 | | $ 1,053,170 |
Johnson Matthey PLC | 23,377 | | 848,427 |
Kingfisher PLC | 116,601 | | 544,737 |
Legal & General Group PLC | 464,777 | | 1,005,045 |
Meggitt PLC | 25,298 | | 157,583 |
National Grid PLC | 139,691 | | 1,593,114 |
Next PLC | 9,400 | | 540,935 |
Persimmon PLC | 6,137 | | 78,733 |
Prudential PLC | 68,427 | | 939,749 |
PZ Cussons PLC Class L | 157,519 | | 860,454 |
Reckitt Benckiser Group PLC | 22,851 | | 1,382,843 |
Reed Elsevier PLC | 107,134 | | 1,047,698 |
Rexam PLC | 59,209 | | 426,815 |
Rolls-Royce Group PLC | 67,452 | | 930,129 |
Rolls-Royce Group PLC Class C | 5,126,352 | | 8,273 |
Rotork PLC | 18,503 | | 680,193 |
Royal Dutch Shell PLC Class A sponsored ADR | 76,315 | | 5,226,051 |
SABMiller PLC | 31,063 | | 1,330,646 |
Scottish & Southern Energy PLC | 50,824 | | 1,187,609 |
Serco Group PLC | 68,159 | | 623,102 |
Shaftesbury PLC | 40,537 | | 358,483 |
Spectris PLC | 4,170 | | 116,283 |
Spirax-Sarco Engineering PLC | 5,404 | | 168,746 |
Standard Chartered PLC (United Kingdom) | 73,695 | | 1,740,472 |
Ted Baker PLC | 3,775 | | 57,751 |
Ultra Electronics Holdings PLC | 4,101 | | 112,043 |
Unite Group PLC | 91,702 | | 418,943 |
Victrex PLC | 4,718 | | 108,495 |
Vodafone Group PLC sponsored ADR | 127,532 | | 3,471,421 |
TOTAL UNITED KINGDOM | | 49,426,549 |
United States of America - 5.6% |
Allergan, Inc. | 6,500 | | 584,480 |
Amazon.com, Inc. (a) | 2,399 | | 558,535 |
ANSYS, Inc. (a) | 500 | | 35,440 |
Autoliv, Inc. | 16,910 | | 974,016 |
Berkshire Hathaway, Inc. Class B (a) | 9,945 | | 858,751 |
BorgWarner, Inc. (a) | 8,997 | | 592,183 |
BPZ Energy, Inc. (a) | 9,388 | | 27,037 |
Broadridge Financial Solutions, Inc. | 1,990 | | 45,671 |
CME Group, Inc. | 6,400 | | 357,952 |
Cummins, Inc. | 3,300 | | 308,814 |
Common Stocks - continued |
| Shares | | Value |
United States of America - continued |
Cymer, Inc. (a) | 6,083 | | $ 484,754 |
Dril-Quip, Inc. (a) | 1,210 | | 83,805 |
Evercore Partners, Inc. Class A | 1,860 | | 51,894 |
FMC Technologies, Inc. (a) | 10,803 | | 441,843 |
Freeport-McMoRan Copper & Gold, Inc. | 6,100 | | 237,168 |
Greenhill & Co., Inc. | 1,270 | | 60,604 |
Kansas City Southern | 1,420 | | 114,253 |
Martin Marietta Materials, Inc. | 3,690 | | 303,724 |
MasterCard, Inc. Class A | 3,609 | | 1,663,496 |
Mead Johnson Nutrition Co. Class A | 14,000 | | 863,240 |
Mohawk Industries, Inc. (a) | 6,805 | | 568,013 |
National Oilwell Varco, Inc. | 8,900 | | 655,930 |
Oceaneering International, Inc. | 1,680 | | 87,914 |
Philip Morris International, Inc. | 21,100 | | 1,868,616 |
PriceSmart, Inc. | 6,850 | | 568,482 |
ResMed, Inc. | 15,140 | | 604,692 |
Solera Holdings, Inc. | 7,202 | | 337,126 |
SS&C Technologies Holdings, Inc. (a) | 11,854 | | 284,852 |
Union Pacific Corp. | 7,900 | | 971,937 |
Virgin Media, Inc. | 22,733 | | 746,914 |
Visa, Inc. Class A | 9,301 | | 1,290,607 |
TOTAL UNITED STATES OF AMERICA | | 16,632,743 |
TOTAL COMMON STOCKS (Cost $273,143,791) |
288,268,394
|
Nonconvertible Preferred Stocks - 0.5% |
| | | |
Brazil - 0.0% |
Banco ABC Brasil SA | 13,794 | | 78,375 |
Germany - 0.5% |
ProSiebenSat.1 Media AG | 20,800 | | 579,638 |
Volkswagen AG | 4,434 | | 917,242 |
TOTAL NONCONVERTIBLE PREFERRED STOCKS (Cost $1,351,389) |
1,575,255
|
Money Market Funds - 2.1% |
| Shares | | Value |
Fidelity Cash Central Fund, 0.19% (b)
(Cost $6,092,586) | 6,092,586 | | $ 6,092,586 |
TOTAL INVESTMENT PORTFOLIO - 100.5% (Cost $280,587,766) | | 295,936,235 |
NET OTHER ASSETS (LIABILITIES) - (0.5)% | | (1,370,438) |
NET ASSETS - 100% | $ 294,565,797 |
Legend |
(a) Non-income producing |
(b) Affiliated fund that is available only to investment companies and other accounts managed by Fidelity Investments. The rate quoted is the annualized seven-day yield of the fund at period end. A complete unaudited listing of the fund's holdings as of its most recent quarter end is available upon request. In addition, each Fidelity Central Fund's financial statements, which are not covered by the Fund's Report of Independent Registered Public Accounting Firm, are available on the SEC's website or upon request. |
Affiliated Central Funds |
Information regarding fiscal year to date income earned by the Fund from investments in Fidelity Central Funds is as follows: |
Fund | Income earned |
Fidelity Cash Central Fund | $ 6,990 |
Fidelity Securities Lending Cash Central Fund | 151,487 |
Total | $ 158,477 |
Other Information |
Categorizations in the Schedule of Investments are based on country or territory of incorporation. |
The following is a summary of the inputs used, as of October 31, 2012, involving the Fund's assets and liabilities carried at fair value. The inputs or methodology used for valuing securities may not be an indication of the risk associated with investing in those securities. For more information on valuation inputs, and their aggregation into the levels used in the tables below, please refer to the Security Valuation section in the accompanying Notes to Financial Statements. |
Valuation Inputs at Reporting Date: |
Description | Total | Level 1 | Level 2 | Level 3 |
Investments in Securities: | | | | |
Equities: | | | | |
Consumer Discretionary | $ 30,059,832 | $ 28,553,663 | $ 1,506,169 | $ - |
Consumer Staples | 41,431,676 | 36,196,531 | 5,235,145 | - |
Energy | 22,006,300 | 18,060,766 | 3,945,534 | - |
Financials | 63,247,920 | 56,727,668 | 6,520,252 | - |
Health Care | 29,781,563 | 25,718,840 | 4,062,723 | - |
Industrials | 36,211,061 | 33,899,326 | 2,311,735 | - |
Information Technology | 18,619,115 | 17,265,998 | 1,353,117 | - |
Materials | 25,475,141 | 21,158,812 | 4,316,329 | - |
Telecommunication Services | 12,064,291 | 11,515,553 | 548,738 | - |
Utilities | 10,946,750 | 9,353,636 | 1,593,114 | - |
Money Market Funds | 6,092,586 | 6,092,586 | - | - |
Total Investments in Securities: | $ 295,936,235 | $ 264,543,379 | $ 31,392,856 | $ - |
The following is a summary of transfers between Level 1 and Level 2 for the period ended October 31, 2012. Transfers are assumed to have occurred at the beginning of the period, and are primarily attributable to the valuation techniques used for foreign equity securities, as discussed in the accompanying Notes to Financial Statements: |
Transfers | Total |
Level 1 to Level 2 | $ 0 |
Level 2 to Level 1 | $ 19,846,441 |
See accompanying notes which are an integral part of the financial statements.
Annual Report
Statement of Assets and Liabilities
| October 31, 2012 |
| | |
Assets | | |
Investment in securities, at value - See accompanying schedule: Unaffiliated issuers (cost $274,495,180) | $ 289,843,649 | |
Fidelity Central Funds (cost $6,092,586) | 6,092,586 | |
Total Investments (cost $280,587,766) | | $ 295,936,235 |
Foreign currency held at value (cost $23,243) | | 23,223 |
Receivable for investments sold | | 526,923 |
Receivable for fund shares sold | | 122,914 |
Dividends receivable | | 650,136 |
Distributions receivable from Fidelity Central Funds | | 4,446 |
Receivable from investment adviser for expense reductions | | 1,586 |
Other receivables | | 26,309 |
Total assets | | 297,291,772 |
| | |
Liabilities | | |
Payable to custodian bank | $ 472,489 | |
Payable for investments purchased | 806,751 | |
Payable for fund shares redeemed | 1,068,841 | |
Accrued management fee | 194,059 | |
Distribution and service plan fees payable | 4,561 | |
Other affiliated payables | 48,559 | |
Other payables and accrued expenses | 130,715 | |
Total liabilities | | 2,725,975 |
| | |
Net Assets | | $ 294,565,797 |
Net Assets consist of: | | |
Paid in capital | | $ 297,394,209 |
Undistributed net investment income | | 5,300,982 |
Accumulated undistributed net realized gain (loss) on investments and foreign currency transactions | | (23,430,376) |
Net unrealized appreciation (depreciation) on investments and assets and liabilities in foreign currencies | | 15,300,982 |
Net Assets | | $ 294,565,797 |
See accompanying notes which are an integral part of the financial statements.
Annual Report
Statement of Assets and Liabilities - continued
| October 31, 2012 |
| | |
Calculation of Maximum Offering Price Class A:
Net Asset Value and redemption price per share ($5,766,838 ÷ 789,026 shares) | | $ 7.31 |
| | |
Maximum offering price per share (100/94.25 of $7.31) | | $ 7.76 |
Class T:
Net Asset Value and redemption price per share ($2,348,287 ÷ 318,734 shares) | | $ 7.37 |
| | |
Maximum offering price per share (100/96.50 of $7.37) | | $ 7.64 |
Class B:
Net Asset Value and offering price per share ($219,813 ÷ 30,007 shares)A | | $ 7.33 |
| | |
Class C:
Net Asset Value and offering price per share ($2,737,321 ÷ 374,276 shares)A | | $ 7.31 |
| | |
Total International Equity:
Net Asset Value, offering price and redemption price per share ($281,979,071 ÷ 38,522,819 shares) | | $ 7.32 |
| | |
Institutional Class:
Net Asset Value, offering price and redemption price per share ($1,514,467 ÷ 207,475 shares) | | $ 7.30 |
A Redemption price per share is equal to net asset value less any applicable contingent deferred sales charge.
See accompanying notes which are an integral part of the financial statements.
Annual Report
Financial Statements - continued
Statement of Operations
| Year ended October 31, 2012 |
| | |
Investment Income | | |
Dividends | | $ 9,170,980 |
Interest | | 243 |
Income from Fidelity Central Funds | | 158,477 |
Income before foreign taxes withheld | | 9,329,700 |
Less foreign taxes withheld | | (704,106) |
Total income | | 8,625,594 |
| | |
Expenses | | |
Management fee
Basic fee | $ 1,851,948 | |
Performance adjustment | 105,713 | |
Transfer agent fees | 404,702 | |
Distribution and service plan fees | 44,605 | |
Accounting and security lending fees | 136,093 | |
Custodian fees and expenses | 312,577 | |
Independent trustees' compensation | 1,628 | |
Registration fees | 155,663 | |
Audit | 90,778 | |
Legal | 1,181 | |
Interest | 212 | |
Miscellaneous | 1,695 | |
Total expenses before reductions | 3,106,795 | |
Expense reductions | (96,572) | 3,010,223 |
Net investment income (loss) | | 5,615,371 |
Realized and Unrealized Gain (Loss) Net realized gain (loss) on: | | |
Investment securities: | | |
Unaffiliated issuers | 9,404,014 | |
Foreign currency transactions | (263,621) | |
Total net realized gain (loss) | | 9,140,393 |
Change in net unrealized appreciation (depreciation) on: Investment securities (net of increase in deferred foreign taxes of $35,138) | 20,557,485 | |
Assets and liabilities in foreign currencies | (20,296) | |
Total change in net unrealized appreciation (depreciation) | | 20,537,189 |
Net gain (loss) | | 29,677,582 |
Net increase (decrease) in net assets resulting from operations | | $ 35,292,953 |
See accompanying notes which are an integral part of the financial statements.
Annual Report
Statement of Changes in Net Assets
| Year ended
October 31,
2012 | Year ended
October 31,
2011 |
Increase (Decrease) in Net Assets | | |
Operations | | |
Net investment income (loss) | $ 5,615,371 | $ 1,864,848 |
Net realized gain (loss) | 9,140,393 | (8,998,027) |
Change in net unrealized appreciation (depreciation) | 20,537,189 | (8,597,909) |
Net increase (decrease) in net assets resulting
from operations | 35,292,953 | (15,731,088) |
Distributions to shareholders from net investment income | (1,867,192) | (953,041) |
Distributions to shareholders from net realized gain | - | (220,294) |
Total distributions | (1,867,192) | (1,173,335) |
Share transactions - net increase (decrease) | 122,647,348 | 86,742,563 |
Redemption fees | 3,128 | 14,195 |
Total increase (decrease) in net assets | 156,076,237 | 69,852,335 |
| | |
Net Assets | | |
Beginning of period | 138,489,560 | 68,637,225 |
End of period (including undistributed net investment income of $5,300,982 and undistributed net investment income of $1,552,849, respectively) | $ 294,565,797 | $ 138,489,560 |
See accompanying notes which are an integral part of the financial statements.
Annual Report
Financial Highlights - Class A
Years ended October 31, | 2012 | 2011 | 2010 | 2009 | 2008 F |
Selected Per-Share Data | | | | |
Net asset value, beginning of period | $ 6.67 | $ 7.36 | $ 6.40 | $ 4.90 | $ 10.00 |
Income from Investment Operations | | | | | |
Net investment income (loss) C | .13 | .11 | .08 | .06 | .11 |
Net realized and unrealized gain (loss) | .59 | (.69) | .95 | 1.55 | (5.21) |
Total from investment operations | .72 | (.58) | 1.03 | 1.61 | (5.10) |
Distributions from net investment income | (.08) | (.09) | (.04) | (.11) | - |
Distributions from net realized gain | - | (.02) | (.03) | - | - |
Total distributions | (.08) | (.11) | (.07) | (.11) | - |
Redemption fees added to paid in capital C, H | - | - | - | - | - |
Net asset value, end of period | $ 7.31 | $ 6.67 | $ 7.36 | $ 6.40 | $ 4.90 |
Total Return A, B | 10.88% | (8.03)% | 16.17% | 33.87% | (51.00)% |
Ratios to Average Net Assets D, G | | | | |
Expenses before reductions | 1.57% | 1.73% | 2.02% | 2.09% | 2.00% |
Expenses net of fee waivers, if any | 1.45% | 1.45% | 1.50% | 1.50% | 1.50% |
Expenses net of all reductions | 1.42% | 1.42% | 1.47% | 1.47% | 1.48% |
Net investment income (loss) | 1.88% | 1.44% | 1.15% | 1.13% | 1.35% |
Supplemental Data | | | | |
Net assets, end of period (000 omitted) | $ 5,767 | $ 4,307 | $ 5,029 | $ 3,727 | $ 5,944 |
Portfolio turnover rate E | 110% | 75% | 67% | 98% | 91% |
A Total returns would have been lower if certain expenses had not been reduced during the applicable periods shown.
B Total returns do not include the effect of the sales charges.
C Calculated based on average shares outstanding during the period.
D Fees and expenses of any underlying Fidelity Central Funds are not included in the Fund's expense ratio. The Fund indirectly bears its proportionate share of the expenses of any underlying Fidelity Central Funds.
E Amount does not include the portfolio activity of any underlying Fidelity Central Funds.
F For the period November 1, 2007 (commencement of operations) to October 31, 2008.
G Expense ratios reflect operating expenses of the class. Expenses before reductions do not reflect amounts reimbursed by the investment adviser or reductions from brokerage service arrangements or reductions from other expense offset arrangements and do not represent the amount paid by the class during periods when reimbursements or reductions occur. Expense ratios before reductions for start-up periods may not be representative of longer-term operating periods. Expenses net of fee waivers reflect expenses after reimbursement by the investment adviser but prior to reductions from brokerage service arrangements or other expense offset arrangements. Expenses net of all reductions represent the net expenses paid by the class.
H Amount represents less than $.01 per share.
See accompanying notes which are an integral part of the financial statements.
Annual Report
Financial Highlights - Class T
Years ended October 31, | 2012 | 2011 | 2010 | 2009 | 2008 F |
Selected Per-Share Data | | | | |
Net asset value, beginning of period | $ 6.73 | $ 7.41 | $ 6.40 | $ 4.88 | $ 10.00 |
Income from Investment Operations | | | | | |
Net investment income (loss) C | .11 | .09 | .06 | .04 | .09 |
Net realized and unrealized gain (loss) | .59 | (.68) | .95 | 1.57 | (5.21) |
Total from investment operations | .70 | (.59) | 1.01 | 1.61 | (5.12) |
Distributions from net investment income | (.06) | (.07) | - | (.09) | - |
Distributions from net realized gain | - | (.02) | - | - | - |
Total distributions | (.06) | (.09) | - | (.09) | - |
Redemption fees added to paid in capital C, H | - | - | - | - | - |
Net asset value, end of period | $ 7.37 | $ 6.73 | $ 7.41 | $ 6.40 | $ 4.88 |
Total Return A, B | 10.52% | (8.08)% | 15.78% | 33.74% | (51.20)% |
Ratios to Average Net Assets D, G | | | | |
Expenses before reductions | 1.84% | 2.02% | 2.31% | 2.34% | 2.42% |
Expenses net of fee waivers, if any | 1.70% | 1.70% | 1.75% | 1.75% | 1.75% |
Expenses net of all reductions | 1.67% | 1.67% | 1.72% | 1.72% | 1.73% |
Net investment income (loss) | 1.63% | 1.19% | .90% | .88% | 1.10% |
Supplemental Data | | | | |
Net assets, end of period (000 omitted) | $ 2,348 | $ 997 | $ 1,004 | $ 1,526 | $ 2,567 |
Portfolio turnover rate E | 110% | 75% | 67% | 98% | 91% |
A Total returns would have been lower if certain expenses had not been reduced during the applicable periods shown.
B Total returns do not include the effect of the sales charges.
C Calculated based on average shares outstanding during the period.
D Fees and expenses of any underlying Fidelity Central Funds are not included in the Fund's expense ratio. The Fund indirectly bears its proportionate share of the expenses of any underlying Fidelity Central Funds.
E Amount does not include the portfolio activity of any underlying Fidelity Central Funds.
F For the period November 1, 2007 (commencement of operations) to October 31, 2008.
G Expense ratios reflect operating expenses of the class. Expenses before reductions do not reflect amounts reimbursed by the investment adviser or reductions from brokerage service arrangements or reductions from other expense offset arrangements and do not represent the amount paid by the class during periods when reimbursements or reductions occur. Expense ratios before reductions for start-up periods may not be representative of longer-term operating periods. Expenses net of fee waivers reflect expenses after reimbursement by the investment adviser but prior to reductions from brokerage service arrangements or other expense offset arrangements. Expenses net of all reductions represent the net expenses paid by the class.
H Amount represents less than $.01 per share.
See accompanying notes which are an integral part of the financial statements.
Annual Report
Financial Highlights - Class B
Years ended October 31, | 2012 | 2011 | 2010 | 2009 | 2008 F |
Selected Per-Share Data | | | | |
Net asset value, beginning of period | $ 6.68 | $ 7.37 | $ 6.39 | $ 4.86 | $ 10.00 |
Income from Investment Operations | | | | | |
Net investment income (loss) C | .08 | .05 | .03 | .02 | .05 |
Net realized and unrealized gain (loss) | .59 | (.68) | .95 | 1.56 | (5.19) |
Total from investment operations | .67 | (.63) | .98 | 1.58 | (5.14) |
Distributions from net investment income | (.02) | (.04) | - | (.05) | - |
Distributions from net realized gain | - | (.02) | - | - | - |
Total distributions | (.02) | (.06) | - | (.05) | - |
Redemption fees added to paid in capital C, H | - | - | - | - | - |
Net asset value, end of period | $ 7.33 | $ 6.68 | $ 7.37 | $ 6.39 | $ 4.86 |
Total Return A, B | 10.05% | (8.66)% | 15.34% | 32.95% | (51.40)% |
Ratios to Average Net Assets D, G | | | | |
Expenses before reductions | 2.34% | 2.51% | 2.81% | 2.82% | 2.92% |
Expenses net of fee waivers, if any | 2.20% | 2.20% | 2.25% | 2.25% | 2.25% |
Expenses net of all reductions | 2.17% | 2.17% | 2.22% | 2.22% | 2.24% |
Net investment income (loss) | 1.13% | .69% | .40% | .38% | .60% |
Supplemental Data | | | | |
Net assets, end of period (000 omitted) | $ 220 | $ 254 | $ 327 | $ 1,337 | $ 2,505 |
Portfolio turnover rate E | 110% | 75% | 67% | 98% | 91% |
A Total returns would have been lower if certain expenses had not been reduced during the applicable periods shown.
B Total returns do not include the effect of the contingent deferred sales charge.
C Calculated based on average shares outstanding during the period.
D Fees and expenses of any underlying Fidelity Central Funds are not included in the Fund's expense ratio. The Fund indirectly bears its proportionate share of the expenses of any underlying Fidelity Central Funds.
E Amount does not include the portfolio activity of any underlying Fidelity Central Funds.
F For the period November 1, 2007 (commencement of operations) to October 31, 2008.
G Expense ratios reflect operating expenses of the class. Expenses before reductions do not reflect amounts reimbursed by the investment adviser or reductions from brokerage service arrangements or reductions from other expense offset arrangements and do not represent the amount paid by the class during periods when reimbursements or reductions occur. Expense ratios before reductions for start-up periods may not be representative of longer-term operating periods. Expenses net of fee waivers reflect expenses after reimbursement by the investment adviser but prior to reductions from brokerage service arrangements or other expense offset arrangements. Expenses net of all reductions represent the net expenses paid by the class.
H Amount represents less than $.01 per share.
See accompanying notes which are an integral part of the financial statements.
Annual Report
Financial Highlights - Class C
Years ended October 31, | 2012 | 2011 | 2010 | 2009 | 2008 F |
Selected Per-Share Data | | | | |
Net asset value, beginning of period | $ 6.67 | $ 7.36 | $ 6.39 | $ 4.86 | $ 10.00 |
Income from Investment Operations | | | | | |
Net investment income (loss) C | .08 | .05 | .03 | .02 | .05 |
Net realized and unrealized gain (loss) | .58 | (.69) | .94 | 1.56 | (5.19) |
Total from investment operations | .66 | (.64) | .97 | 1.58 | (5.14) |
Distributions from net investment income | (.02) | (.03) | - | (.05) | - |
Distributions from net realized gain | - | (.02) | - | - | - |
Total distributions | (.02) | (.05) | - | (.05) | - |
Redemption fees added to paid in capital C, H | - | - | - | - | - |
Net asset value, end of period | $ 7.31 | $ 6.67 | $ 7.36 | $ 6.39 | $ 4.86 |
Total Return A, B | 9.98% | (8.72)% | 15.18% | 33.10% | (51.40)% |
Ratios to Average Net Assets D, G | | | | |
Expenses before reductions | 2.31% | 2.51% | 2.80% | 2.85% | 2.92% |
Expenses net of fee waivers, if any | 2.20% | 2.20% | 2.25% | 2.25% | 2.25% |
Expenses net of all reductions | 2.17% | 2.17% | 2.22% | 2.22% | 2.23% |
Net investment income (loss) | 1.13% | .69% | .40% | .38% | .60% |
Supplemental Data | | | | |
Net assets, end of period (000 omitted) | $ 2,737 | $ 1,396 | $ 1,423 | $ 1,714 | $ 2,787 |
Portfolio turnover rate E | 110% | 75% | 67% | 98% | 91% |
A Total returns would have been lower if certain expenses had not been reduced during the applicable periods shown.
B Total returns do not include the effect of the contingent deferred sales charge.
C Calculated based on average shares outstanding during the period.
D Fees and expenses of any underlying Fidelity Central Funds are not included in the Fund's expense ratio. The Fund indirectly bears its proportionate share of the expenses of any underlying Fidelity Central Funds.
E Amount does not include the portfolio activity of any underlying Fidelity Central Funds.
F For the period November 1, 2007 (commencement of operations) to October 31, 2008.
G Expense ratios reflect operating expenses of the class. Expenses before reductions do not reflect amounts reimbursed by the investment adviser or reductions from brokerage service arrangements or reductions from other expense offset arrangements and do not represent the amount paid by the class during periods when reimbursements or reductions occur. Expense ratios before reductions for start-up periods may not be representative of longer-term operating periods. Expenses net of fee waivers reflect expenses after reimbursement by the investment adviser but prior to reductions from brokerage service arrangements or other expense offset arrangements. Expenses net of all reductions represent the net expenses paid by the class.
H Amount represents less than $.01 per share.
See accompanying notes which are an integral part of the financial statements.
Annual Report
Financial Highlights - Total International Equity
Years ended October 31, | 2012 | 2011 | 2010 | 2009 | 2008 E |
Selected Per-Share Data | | | | |
Net asset value, beginning of period | $ 6.69 | $ 7.37 | $ 6.41 | $ 4.91 | $ 10.00 |
Income from Investment Operations | | | | | |
Net investment income (loss) B | .15 | .12 | .09 | .07 | .13 |
Net realized and unrealized gain (loss) | .58 | (.68) | .96 | 1.55 | (5.21) |
Total from investment operations | .73 | (.56) | 1.05 | 1.62 | (5.08) |
Distributions from net investment income | (.10) | (.10) | (.06) | (.12) | (.01) |
Distributions from net realized gain | - | (.02) | (.03) | - | - |
Total distributions | (.10) | (.12) | (.09) | (.12) | (.01) |
Redemption fees added to paid in capital B, G | - | - | - | - | - |
Net asset value, end of period | $ 7.32 | $ 6.69 | $ 7.37 | $ 6.41 | $ 4.91 |
Total Return A | 11.03% | (7.70)% | 16.45% | 34.23% | (50.87)% |
Ratios to Average Net Assets C, F | | | | |
Expenses before reductions | 1.16% | 1.42% | 1.79% | 1.87% | 1.89% |
Expenses net of fee waivers, if any | 1.16% | 1.20% | 1.25% | 1.25% | 1.25% |
Expenses net of all reductions | 1.13% | 1.17% | 1.22% | 1.22% | 1.23% |
Net investment income (loss) | 2.16% | 1.69% | 1.40% | 1.38% | 1.60% |
Supplemental Data | | | | |
Net assets, end of period (000 omitted) | $ 281,979 | $ 131,338 | $ 60,826 | $ 33,061 | $ 23,226 |
Portfolio turnover rate D | 110% | 75% | 67% | 98% | 91% |
A Total returns would have been lower if certain expenses had not been reduced during the applicable periods shown.
B Calculated based on average shares outstanding during the period.
C Fees and expenses of any underlying Fidelity Central Funds are not included in the Fund's expense ratio. The Fund indirectly bears its proportionate share of the expenses of any underlying Fidelity Central Funds.
D Amount does not include the portfolio activity of any underlying Fidelity Central Funds.
E For the period November 1, 2007 (commencement of operations) to October 31, 2008.
F Expense ratios reflect operating expenses of the class. Expenses before reductions do not reflect amounts reimbursed by the investment adviser or reductions from brokerage service arrangements or reductions from other expense offset arrangements and do not represent the amount paid by the class during periods when reimbursements or reductions occur. Expense ratios before reductions for start-up periods may not be representative of longer-term operating periods. Expenses net of fee waivers reflect expenses after reimbursement by the investment adviser but prior to reductions from brokerage service arrangements or other expense offset arrangements. Expenses net of all reductions represent the net expenses paid by the class.
G Amount represents less than $.01 per share.
See accompanying notes which are an integral part of the financial statements.
Annual Report
Financial Highlights - Institutional Class
Years ended October 31, | 2012 | 2011 | 2010 | 2009 | 2008 E |
Selected Per-Share Data | | | | |
Net asset value, beginning of period | $ 6.67 | $ 7.35 | $ 6.41 | $ 4.91 | $ 10.00 |
Income from Investment Operations | | | | | |
Net investment income (loss) B | .14 | .12 | .10 | .07 | .13 |
Net realized and unrealized gain (loss) | .59 | (.68) | .95 | 1.55 | (5.21) |
Total from investment operations | .73 | (.56) | 1.05 | 1.62 | (5.08) |
Distributions from net investment income | (.10) | (.10) | (.08) | (.12) | (.01) |
Distributions from net realized gain | - | (.02) | (.03) | - | - |
Total distributions | (.10) | (.12) | (.11) | (.12) | (.01) |
Redemption fees added to paid in capital B, G | - | - | - | - | - |
Net asset value, end of period | $ 7.30 | $ 6.67 | $ 7.35 | $ 6.41 | $ 4.91 |
Total Return A | 11.06% | (7.72)% | 16.48% | 34.23% | (50.87)% |
Ratios to Average Net Assets C, F | | | | |
Expenses before reductions | 1.27% | 1.48% | 1.82% | 1.80% | 1.91% |
Expenses net of fee waivers, if any | 1.20% | 1.20% | 1.25% | 1.25% | 1.25% |
Expenses net of all reductions | 1.17% | 1.17% | 1.23% | 1.22% | 1.23% |
Net investment income (loss) | 2.13% | 1.69% | 1.40% | 1.38% | 1.60% |
Supplemental Data | | | | |
Net assets, end of period (000 omitted) | $ 1,514 | $ 197 | $ 28 | $ 1,308 | $ 2,733 |
Portfolio turnover rate D | 110% | 75% | 67% | 98% | 91% |
A Total returns would have been lower if certain expenses had not been reduced during the applicable periods shown.
B Calculated based on average shares outstanding during the period.
C Fees and expenses of any underlying Fidelity Central Funds are not included in the Fund's expense ratio. The Fund indirectly bears its proportionate share of the expenses of any underlying Fidelity Central Funds.
D Amount does not include the portfolio activity of any underlying Fidelity Central Funds.
E For the period November 1, 2007 (commencement of operations) to October 31, 2008.
F Expense ratios reflect operating expenses of the class. Expenses before reductions do not reflect amounts reimbursed by the investment adviser or reductions from brokerage service arrangements or reductions from other expense offset arrangements and do not represent the amount paid by the class during periods when reimbursements or reductions occur. Expense ratios before reductions for start-up periods may not be representative of longer-term operating periods. Expenses net of fee waivers reflect expenses after reimbursement by the investment adviser but prior to reductions from brokerage service arrangements or other expense offset arrangements. Expenses net of all reductions represent the net expenses paid by the class.
G Amount represents less than $.01 per share.
See accompanying notes which are an integral part of the financial statements.
Annual Report
Notes to Financial Statements
For the period ended October 31, 2012
1. Organization.
Fidelity Total International Equity Fund (the Fund) is a fund of Fidelity Investment Trust (the Trust) and is authorized to issue an unlimited number of shares. The Trust is registered under the Investment Company Act of 1940, as amended (the 1940 Act), as an open-end management investment company organized as a Massachusetts business trust. The Fund offers Class A, Class T, Class C, Total International Equity and Institutional Class shares, each of which, along with Class B shares, has equal rights as to assets and voting privileges. Effective after the close of business on September 1, 2010, Class B shares were closed to new accounts and additional purchases, except for exchanges and reinvestments. Each class has exclusive voting rights with respect to matters that affect that class. Class B shares will automatically convert to Class A shares after a holding period of seven years from the initial date of purchase. Investment income, realized and unrealized capital gains and losses, the common expenses of the Fund, and certain fund-level expense reductions, if any, are allocated on a pro-rata basis to each class based on the relative net assets of each class to the total net assets of the Fund. Each class differs with respect to transfer agent and distribution and service plan fees incurred. Certain expense reductions may also differ by class. The Fund's investments in emerging markets can be subject to social, economic, regulatory, and political uncertainties and can be extremely volatile.
2. Investments in Fidelity Central Funds.
The Fund invests in Fidelity Central Funds, which are open-end investment companies available only to other investment companies and accounts managed by Fidelity Management & Research Company (FMR) and its affiliates. The Fund's Schedule of Investments lists each of the Fidelity Central Funds held as of period end, if any, as an investment of the Fund, but does not include the underlying holdings of each Fidelity Central Fund. As an Investing Fund, the Fund indirectly bears its proportionate share of the expenses of the underlying Fidelity Central Funds.
The Money Market Central Funds seek preservation of capital and current income and are managed by Fidelity Investments Money Management, Inc. (FIMM), an affiliate of FMR.
A complete unaudited list of holdings for each Fidelity Central Fund is available upon request or at the Securities and Exchange Commission (the SEC) web site at www.sec.gov. In addition, the financial statements of the Fidelity Central Funds, which are not covered by the Fund's Report of Independent Registered Public Accounting Firm, are available on the SEC web site or upon request.
Annual Report
Notes to Financial Statements - continued
3. Significant Accounting Policies.
The financial statements have been prepared in conformity with accounting principles generally accepted in the United States of America (GAAP), which require management to make certain estimates and assumptions at the date of the financial statements. Actual results could differ from those estimates. Subsequent events, if any, through the date that the financial statements were issued have been evaluated in the preparation of the financial statements. The following summarizes the significant accounting policies of the Fund:
Security Valuation. Investments are valued as of 4:00 p.m. Eastern time on the last calendar day of the period. In accordance with valuation policies and procedures approved by the Board of Trustees (the Board), the Fund attempts to obtain prices from one or more third party pricing vendors or brokers to value its investments. When current market prices, quotations or rates are not readily available or reliable, securities will be fair valued in good faith by the FMR Fair Value Committee (the Committee), in accordance with procedures adopted by the Fund's Board. Factors used in determining fair value vary by security type and may include market or security specific events. The frequency with which these procedures are used cannot be predicted and they may be utilized to a significant extent. The Committee oversees the Fund's valuation policies and procedures and is responsible for approving and reporting to the Board all fair value determinations.
The Fund categorizes the inputs to valuation techniques used to value its investments into a disclosure hierarchy consisting of three levels as shown below:
Level 1 - quoted prices in active markets for identical investments
Level 2 - other significant observable inputs (including quoted prices for similar investments, interest rates, prepayment speeds, etc.)
Level 3 - unobservable inputs (including the Fund's own assumptions based on the best information available)
Valuation techniques used to value the Fund's investments by major category are as follows:
Equity securities, including restricted securities, for which market quotations are readily available, are valued at the last reported sale price or official closing price as reported by a third party pricing vendor on the primary market or exchange on which they are traded and are categorized as Level 1 in the hierarchy. In the event there were no sales during the day or closing prices are not available, securities are valued at the last quoted bid price or may be valued using the last available price and are generally categorized as Level 2 in the hierarchy. For foreign equity securities, when significant market or security specific events arise, comparisons to the valuation of American Depositary Receipts
Annual Report
3. Significant Accounting Policies - continued
Security Valuation - continued
(ADRs), futures contracts, Exchange-Traded Funds (ETFs) and certain indexes as well as quoted prices for similar securities are used and are categorized as Level 2 in the hierarchy. Utilizing these techniques may result in transfers between Level 1 and Level 2.
Investments in open-end mutual funds, including the Fidelity Central Funds, are valued at their closing net asset value (NAV) each business day and are categorized as Level 1 in the hierarchy.
Changes in valuation techniques may result in transfers in or out of an assigned level within the disclosure hierarchy. The aggregate value of investments by input level, as of October 31, 2012, including information on transfers between Levels 1 and 2, is included at the end of the Fund's Schedule of Investments.
Foreign Currency Translation. The Fund may use foreign currency contracts to facilitate transactions in foreign-denominated securities. Gains and losses from these transactions may arise from changes in the value of the foreign currency or if the counterparties do not perform under the contracts' terms.
Foreign-denominated assets, including investment securities, and liabilities are translated into U.S. dollars at the exchange rates at period end. Purchases and sales of investment securities, income and dividends received and expenses denominated in foreign currencies are translated into U.S. dollars at the exchange rate in effect on the transaction date.
The effects of exchange rate fluctuations on investments are included with the net realized and unrealized gain (loss) on investment securities. Other foreign currency transactions resulting in realized and unrealized gain (loss) are disclosed separately.
Investment Transactions and Income. For financial reporting purposes, the Fund's investment holdings and NAV include trades executed through the end of the last business day of the period. The NAV per share for processing shareholder transactions is calculated as of the close of business of the New York Stock Exchange (NYSE), normally 4:00 p.m. Eastern time and includes trades executed through the end of the prior business day. Gains and losses on securities sold are determined on the basis of identified cost and may include proceeds received from litigation. Dividend income is recorded on the ex-dividend date, except for certain dividends from foreign securities where the ex-dividend date may have passed, which are recorded as soon as the Fund is informed of the ex-dividend date. Non-cash dividends included in dividend income, if any, are recorded at the fair market value of the securities received. Distributions received on securities that represent a return of capital or capital gain are recorded as a reduction of cost of investments and/or as a realized gain. The Fund estimates the components of
Annual Report
Notes to Financial Statements - continued
3. Significant Accounting Policies - continued
Investment Transactions and Income - continued
distributions received that may be considered return of capital distributions or capital gain distributions. Interest income and distributions from the Fidelity Central Funds are accrued as earned. Interest income includes coupon interest and amortization of premium and accretion of discount on debt securities. Investment income is recorded net of foreign taxes withheld where recovery of such taxes is uncertain.
Expenses. Expenses directly attributable to a fund are charged to that fund. Expenses attributable to more than one fund are allocated among the respective funds on the basis of relative net assets or other appropriate methods. Expense estimates are accrued in the period to which they relate and adjustments are made when actual amounts are known.
Income Tax Information and Distributions to Shareholders. Each year, the Fund intends to qualify as a regulated investment company under Subchapter M of the Internal Revenue Code, including distributing substantially all of its taxable income and realized gains. As a result, no provision for income taxes is required. As of October 31, 2012, the Fund did not have any unrecognized tax benefits in the financial statements; nor is the Fund aware of any tax positions for which it is reasonably possible that the total amounts of unrecognized tax benefits will significantly change in the next twelve months. The Fund files a U.S. federal tax return, in addition to state and local tax returns as required. A fund's federal income tax returns are subject to examination by the Internal Revenue Service (IRS) for a period of three fiscal years after they are filed. State and local tax returns may be subject to examination for an additional fiscal year depending on the jurisdiction. Foreign taxes are provided for based on the Fund's understanding of the tax rules and rates that exist in the foreign markets in which it invests. The Fund is subject to a tax imposed on capital gains by certain countries in which it invests. An estimated deferred tax liability for net unrealized appreciation on the applicable securities is included in Other payables and accrued expenses on the Statement of Assets & Liabilities.
Distributions are declared and recorded on the ex-dividend date. Income dividends and capital gain distributions are declared separately for each class. Income and capital gain distributions are determined in accordance with income tax regulations, which may differ from GAAP.
Capital accounts within the financial statements are adjusted for permanent book-tax differences. These adjustments have no impact on net assets or the results of operations. Temporary book-tax differences will reverse in a subsequent period.
Book-tax differences are primarily due to foreign currency transactions, passive foreign investment companies (PFIC), partnerships, capital loss carryforwards and losses deferred due to wash sales.
Annual Report
3. Significant Accounting Policies - continued
Income Tax Information and Distributions to Shareholders - continued
The federal tax cost of investment securities and unrealized appreciation (depreciation) as of period end were as follows:
Gross unrealized appreciation | $ 27,195,779 |
Gross unrealized depreciation | (13,448,638) |
Net unrealized appreciation (depreciation) on securities and other investments | $ 13,747,141 |
| |
Tax Cost | $ 282,189,094 |
The tax-based components of distributable earnings as of period end were as follows:
Undistributed ordinary income | $ 14,696,955 |
Undistributed long-term capital gain | $ 309,806 |
Capital loss carryforward | $ (31,534,827) |
Net unrealized appreciation (depreciation) | $ 13,734,792 |
Capital loss carryforwards are only available to offset future capital gains of the Fund to the extent provided by regulations and may be limited. Under the Regulated Investment Company Modernization Act of 2010 (the Act), the Fund is permitted to carry forward capital losses incurred in taxable years beginning after December 22, 2010 for an unlimited period and such capital losses are required to be used prior to any losses that expire. Capital loss carryforwards were as follows:
Fiscal year of expiration | |
2016 | $ (6,969,886) |
2017 | (15,708,944) |
2019 | (8,855,997) |
Total capital loss carryforward | $ (31,534,827) |
As a result of a large subscription in December 2011, the Fund had an "ownership change" under the Internal Revenue Code, which limits capital losses that will be available to offset future capital gains to approximately $4,535,766 per year plus certain gains in the Fund existing at the time of the ownership change. As a result, at least $1,623,551 of the Fund's capital loss carryforward will expire unused and is not included in the capital loss carryforward amounts disclosed above.
The tax character of distributions paid was as follows:
| October 31, 2012 | October 31, 2011 |
Ordinary Income | $ 1,867,192 | $ 1,173,335 |
Annual Report
Notes to Financial Statements - continued
3. Significant Accounting Policies - continued
Short-Term Trading (Redemption) Fees. Shares held by investors in the Fund less than 30 days are subject to a redemption fee equal to 1.00% of the net asset value of shares redeemed. All redemption fees, which reduce the proceeds of the shareholder redemption, are retained by the Fund and accounted for as an addition to paid in capital.
New Accounting Pronouncement. In December 2011, the Financial Accounting Standards Board issued Accounting Standard Update No. 2011-11, Disclosures about Offsetting Assets and Liabilities. The update creates new disclosure requirements requiring entities to disclose both gross and net information for derivatives and other financial instruments that are either offset in the Statement of Assets and Liabilities or subject to an enforceable master netting arrangement or similar agreement. The disclosure requirements are effective for annual reporting periods beginning on or after January 1, 2013, and interim periods within those annual periods. Management is currently evaluating the impact of the update's adoption on the Fund's financial statement disclosures.
4. Purchases and Sales of Investments.
Purchases and sales of securities, other than short-term securities, aggregated $402,947,967 and $277,094,245, respectively.
5. Fees and Other Transactions with Affiliates.
Management Fee. FMR and its affiliates provide the Fund with investment management related services for which the Fund pays a monthly management fee. The management fee is the sum of an individual fund fee rate that is based on an annual rate of .45% of the Fund's average net assets and an annualized group fee rate that averaged .26% during the period. The group fee rate is based upon the average net assets of all the mutual funds advised by FMR. The group fee rate decreases as assets under management increase and increases as assets under management decrease. In addition, the management fee is subject to a performance adjustment (up to a maximum of ± .20% of the Fund's average net assets over a 36 month performance period). The upward or downward adjustment to the management fee is based on the relative investment performance of Total International Equity as compared to an appropriate benchmark index. For the period, the total annual management fee rate, including the performance adjustment, was .75% of the Fund's average net assets.
Distribution and Service Plan Fees. In accordance with Rule 12b-1 of the 1940 Act, the Fund has adopted separate Distribution and Service Plans for each class of shares. Certain classes pay Fidelity Distributors Corporation (FDC), an affiliate of FMR, separate Distribution and Service Fees, each of which is based on an annual percentage of each class' average net assets. In addition, FDC may pay financial intermediaries for
Annual Report
5. Fees and Other Transactions with Affiliates - continued
Distribution and Service Plan Fees - continued
selling shares of the Fund and providing shareholder support services. For the period, the Distribution and Service Fee rates, total fees and amounts retained by FDC were as follows:
| Distribution
Fee | Service
Fee | Total Fees | Retained
by FDC |
Class A | -% | .25% | $ 12,621 | $ 968 |
Class T | .25% | .25% | 6,560 | 86 |
Class B | .75% | .25% | 2,453 | 1,851 |
Class C | .75% | .25% | 22,971 | 2,990 |
| | | $ 44,605 | $ 5,895 |
Sales Load. FDC may receive a front-end sales charge of up to 5.75% for selling Class A shares and 3.50% for selling Class T shares, some of which is paid to financial intermediaries for selling shares of the Fund. Depending on the holding period, FDC may receive contingent deferred sales charges levied on Class A, Class T, Class B, and Class C redemptions. The deferred sales charges range from 5.00% to 1.00% for Class B shares, 1.00% for Class C shares, 1.00% for certain purchases of Class A shares and .25% for certain purchases of Class T shares.
For the period, sales charge amounts retained by FDC were as follows:
| Retained
by FDC |
Class A | $ 3,215 |
Class T | 893 |
Class B* | 362 |
Class C* | 249 |
| $ 4,719 |
* When Class B and Class C shares are initially sold, FDC pays commissions from its own resources to financial intermediaries through which the sales are made.
Transfer Agent Fees. Fidelity Investments Institutional Operations Company, Inc. (FIIOC), an affiliate of FMR, is the transfer, dividend disbursing and shareholder servicing agent for each class of the Fund. FIIOC receives account fees and asset-based fees that vary according to the account size and type of account of the shareholders of the respective classes of the Fund. FIIOC pays for typesetting, printing and mailing of
Annual Report
Notes to Financial Statements - continued
5. Fees and Other Transactions with Affiliates - continued
Transfer Agent Fees - continued
shareholder reports, except proxy statements. For the period, transfer agent fees for each class were as follows:
| Amount | % of
Average
Net Assets |
Class A | $ 15,172 | .30 |
Class T | 4,212 | .32 |
Class B | 743 | .30 |
Class C | 6,965 | .30 |
Total International Equity | 375,719 | .15 |
Institutional Class | 1,891 | .29 |
| $ 404,702 | |
Accounting and Security Lending Fees. Fidelity Service Company, Inc. (FSC), an affiliate of FMR, maintains the Fund's accounting records. The accounting fee is based on the level of average net assets for each month. Under a separate contract, FSC administers the security lending program. The security lending fee is based on the number and duration of lending transactions.
Brokerage Commissions. The Fund placed a portion of its portfolio transactions with brokerage firms which are affiliates of the investment adviser. The commissions paid to these affiliated firms were $1,696 for the period.
Interfund Lending Program. Pursuant to an Exemptive Order issued by the SEC, the Fund, along with other registered investment companies having management contracts with FMR, may participate in an interfund lending program. This program provides an alternative credit facility allowing the funds to borrow from, or lend money to, other participating affiliated funds. At period end, there were no interfund loans outstanding. The Fund's activity in this program during the period for which loans were outstanding was as follows:
Borrower or Lender | Average Loan
Balance | Weighted Average
Interest Rate | Interest
Expense |
Borrower | $ 6,692,667 | .38% | $ 212 |
6. Committed Line of Credit.
The Fund participates with other funds managed by FMR or an affiliate in a $4.25 billion credit facility (the "line of credit") to be utilized for temporary or emergency purposes to fund shareholder redemptions or for other short-term liquidity purposes. The Fund has agreed to pay commitment fees on its pro-rata portion of the line of credit, which
Annual Report
6. Committed Line of Credit - continued
amounted to $670 and is reflected in Miscellaneous expenses on the Statement of Operations. During the period, there were no borrowings on this line of credit.
7. Security Lending.
The Fund lends portfolio securities through a lending agent from time to time in order to earn additional income. For equity securities, a lending agent is used and may loan securities to certain qualified borrowers, including Fidelity Capital Markets (FCM), a broker-dealer affiliated with the Fund. On the settlement date of the loan, the Fund receives collateral (in the form of U.S. Treasury obligations, letters of credit and/or cash) against the loaned securities and maintains collateral in an amount not less than 100% of the market value of the loaned securities during the period of the loan. The market value of the loaned securities is determined at the close of business of the Fund and any additional required collateral is delivered to the Fund on the next business day. If the borrower defaults on its obligation to return the securities loaned because of insolvency or other reasons, a fund could experience delays and costs in recovering the securities loaned or in gaining access to the collateral. Any cash collateral received is invested in the Fidelity Securities Lending Cash Central Fund. Security lending income represents the income earned on investing cash collateral, less rebates paid to borrowers and any lending agent fees associated with the loan, plus any premium payments received for lending certain types of securities. Security lending income is presented in the Statement of Operations as a component of income from Fidelity Central Funds. Total security lending income during the period amounted to $151,487. During the period, there were no securities loaned to FCM.
8. Expense Reductions.
FMR contractually agreed to reimburse each class to the extent annual operating expenses exceeded certain levels of average net assets as noted in the table below. This reimbursement will remain in place through December 31, 2013. Some expenses, for example interest expense, including commitment fees, are excluded from this reimbursement.
The following classes were in reimbursement during the period:
| Expense
Limitations | Reimbursement
from adviser |
Class A | 1.45% | $ 5,921 |
Class T | 1.70% | 1,880 |
Class B | 2.20% | 335 |
Class C | 2.20% | 2,543 |
Institutional Class | 1.20% | 416 |
| | $ 11,095 |
Annual Report
Notes to Financial Statements - continued
8. Expense Reductions - continued
Many of the brokers with whom FMR places trades on behalf of the Fund provided services to the Fund in addition to trade execution. These services included payments of certain expenses on behalf of the Fund totaling $85,477 for the period.
9. Distributions to Shareholders.
Distributions to shareholders of each class were as follows:
Years ended October 31, | 2012 | 2011 |
From net investment income | | |
Class A | $ 48,329 | $ 61,018 |
Class T | 9,062 | 9,414 |
Class B | 714 | 1,488 |
Class C | 4,731 | 6,263 |
Total International Equity | 1,801,469 | 873,280 |
Institutional Class | 2,887 | 1,578 |
Total | $ 1,867,192 | $ 953,041 |
From net realized gain | | |
Class A | $ - | $ 16,196 |
Class T | - | 3,213 |
Class B | - | 1,016 |
Class C | - | 4,485 |
Total International Equity | - | 195,026 |
Institutional Class | - | 358 |
Total | $ - | $ 220,294 |
10. Share Transactions.
Transactions for each class of shares were as follows:
| Shares | Dollars |
Years ended October 31, | 2012 | 2011 | 2012 | 2011 |
Class A | | | | |
Shares sold | 388,955 | 231,083 | $ 2,677,369 | $ 1,708,687 |
Reinvestment of distributions | 7,157 | 10,039 | 46,237 | 74,076 |
Shares redeemed | (252,362) | (279,366) | (1,699,392) | (2,035,449) |
Net increase (decrease) | 143,750 | (38,244) | $ 1,024,214 | $ (252,686) |
Class T | | | | |
Shares sold | 207,939 | 37,121 | $ 1,463,372 | $ 276,509 |
Reinvestment of distributions | 1,377 | 1,678 | 8,993 | 12,524 |
Shares redeemed | (38,757) | (25,970) | (259,817) | (191,826) |
Net increase (decrease) | 170,559 | 12,829 | $ 1,212,548 | $ 97,207 |
Annual Report
10. Share Transactions - continued
| Shares | Dollars |
Years ended October 31, | 2012 | 2011 | 2012 | 2011 |
Class B | | | | |
Shares sold | 4,797 | 3,282 | $ 32,306 | $ 24,631 |
Reinvestment of distributions | 108 | 331 | 705 | 2,469 |
Shares redeemed | (12,955) | (9,973) | (88,815) | (73,676) |
Net increase (decrease) | (8,050) | (6,360) | $ (55,804) | $ (46,576) |
Class C | | | | |
Shares sold | 258,694 | 66,879 | $ 1,733,640 | $ 498,161 |
Reinvestment of distributions | 710 | 1,425 | 4,622 | 10,610 |
Shares redeemed | (94,222) | (52,554) | (638,538) | (388,669) |
Net increase (decrease) | 165,182 | 15,750 | $ 1,099,724 | $ 120,102 |
Total International Equity | | | | |
Shares sold | 32,478,543 | 16,784,298 | $ 209,916,522 | $ 125,543,898 |
Reinvestment of distributions | 266,160 | 135,624 | 1,719,395 | 1,000,533 |
Shares redeemed | (13,867,286) | (5,532,363) | (93,416,780) | (39,913,646) |
Net increase (decrease) | 18,877,417 | 11,387,559 | $ 118,219,137 | $ 86,630,785 |
Institutional Class | | | | |
Shares sold | 198,611 | 26,909 | $ 1,289,078 | $ 202,383 |
Reinvestment of distributions | 448 | 263 | 2,887 | 1,936 |
Shares redeemed | (21,161) | (1,422) | (144,436) | (10,588) |
Net increase (decrease) | 177,898 | 25,750 | $ 1,147,529 | $ 193,731 |
11. Other.
The Fund's organizational documents provide former and current trustees and officers with a limited indemnification against liabilities arising in connection with the performance of their duties to the Fund. In the normal course of business, the Fund may also enter into contracts that provide general indemnifications. The Fund's maximum exposure under these arrangements is unknown as this would be dependent on future claims that may be made against the Fund. The risk of material loss from such claims is considered remote.
At the end of the period, a shareholder of record owned approximately 65% of the total outstanding shares of the Fund.
Annual Report
To the Trustees of Fidelity Investment Trust and Shareholders of Fidelity Total International Equity Fund:
We have audited the accompanying statement of assets and liabilities of Fidelity Total International Equity Fund (the Fund), a fund of Fidelity Investment Trust, including the schedule of investments, as of October 31, 2012, and the related statement of operations for the year then ended, the statement of changes in net assets for each of the two years in the period then ended, and the financial highlights for each of the five years in the period then ended. These financial statements and financial highlights are the responsibility of the Fund's management. Our responsibility is to express an opinion on these financial statements and financial highlights based on our audits.
We conducted our audits in accordance with the standards of the Public Company Accounting Oversight Board (United States). Those standards require that we plan and perform the audit to obtain reasonable assurance about whether the financial statements and financial highlights are free of material misstatement. The Fund is not required to have, nor were we engaged to perform, an audit of its internal control over financial reporting. Our audits included consideration of internal control over financial reporting as a basis for designing audit procedures that are appropriate in the circumstances, but not for the purpose of expressing an opinion on the effectiveness of the Fund's internal control over financial reporting. Accordingly, we express no such opinion. An audit also includes examining, on a test basis, evidence supporting the amounts and disclosures in the financial statements, assessing the accounting principles used and significant estimates made by management, as well as evaluating the overall financial statement presentation. Our procedures included confirmation of securities owned as of October 31, 2012, by correspondence with the custodians and brokers; where replies were not received from brokers, we performed other auditing procedures. We believe that our audits provide a reasonable basis for our opinion.
In our opinion, the financial statements and financial highlights referred to above present fairly, in all material respects, the financial position of Fidelity Total International Equity Fund as of October 31, 2012, the results of its operations for the year then ended, the changes in its net assets for each of the two years in the period then ended, and the financial highlights for each of the five years in the period then ended, in conformity with accounting principles generally accepted in the United States of America.
DELOITTE & TOUCHE LLP
Boston, Massachusetts
December 14, 2012
Annual Report
The Trustees, Members of the Advisory Board, and executive officers of the trust and fund, as applicable, are listed below. The Board of Trustees governs the fund and is responsible for protecting the interests of shareholders. The Trustees are experienced executives who meet periodically throughout the year to oversee the fund's activities, review contractual arrangements with companies that provide services to the fund, oversee management of the risks associated with such activities and contractual arrangements, and review the fund's performance. Except for James C. Curvey, each of the Trustees oversees 236 funds advised by FMR or an affiliate. Mr. Curvey oversees 443 funds advised by FMR or an affiliate.
The Trustees hold office without limit in time except that (a) any Trustee may resign; (b) any Trustee may be removed by written instrument, signed by at least two-thirds of the number of Trustees prior to such removal; (c) any Trustee who requests to be retired or who has become incapacitated by illness or injury may be retired by written instrument signed by a majority of the other Trustees; and (d) any Trustee may be removed at any special meeting of shareholders by a two-thirds vote of the outstanding voting securities of the trust. Each Trustee who is not an interested person (as defined in the 1940 Act) (Independent Trustee), shall retire not later than the last day of the calendar year in which his or her 75th birthday occurs. The Independent Trustees may waive this mandatory retirement age policy with respect to individual Trustees. The executive officers and Advisory Board Members hold office without limit in time, except that any officer and Advisory Board Member may resign or may be removed by a vote of a majority of the Trustees at any regular meeting or any special meeting of the Trustees. Except as indicated, each individual has held the office shown or other offices in the same company for the past five years.
Experience, Skills, Attributes, and Qualifications of the Fund's Trustees. The Governance and Nominating Committee has adopted a statement of policy that describes the experience, qualifications, attributes, and skills that are necessary and desirable for potential Independent Trustee candidates (Statement of Policy). The Board believes that each Trustee satisfied at the time he or she was initially elected or appointed a Trustee, and continues to satisfy, the standards contemplated by the Statement of Policy. The Governance and Nominating Committee also engages professional search firms to help identify potential Independent Trustee candidates who have the experience, qualifications, attributes, and skills consistent with the Statement of Policy. From time to time, additional criteria based on the composition and skills of the current Independent Trustees, as well as experience or skills that may be appropriate in light of future changes to board composition, business conditions, and regulatory or other developments, have also been considered by the professional search firms and the Governance and Nominating Committee. In addition, the Board takes into account the Trustees' commitment and participation in Board and committee meetings, as well as their leadership of standing and ad hoc committees throughout their tenure.
In determining that a particular Trustee was and continues to be qualified to serve as a Trustee, the Board has considered a variety of criteria, none of which, in isolation, was controlling. The Board believes that, collectively, the Trustees have balanced and diverse experience, qualifications, attributes, and skills, which allow the Board to operate effectively in governing the fund and protecting the interests of shareholders. Information about the specific experience, skills, attributes, and qualifications of each Trustee, which in each case led to the Board's conclusion that the Trustee should serve (or continue to serve) as a trustee of the fund, is provided below.
Annual Report
Trustees and Officers - continued
Board Structure and Oversight Function. James C. Curvey is an interested person (as defined in the 1940 Act) and currently serves as Chairman. The Trustees have determined that an interested Chairman is appropriate and benefits shareholders because an interested Chairman has a personal and professional stake in the quality and continuity of services provided to the fund. Independent Trustees exercise their informed business judgment to appoint an individual of their choosing to serve as Chairman, regardless of whether the Trustee happens to be independent or a member of management. The Independent Trustees have determined that they can act independently and effectively without having an Independent Trustee serve as Chairman and that a key structural component for assuring that they are in a position to do so is for the Independent Trustees to constitute a substantial majority for the Board. The Independent Trustees also regularly meet in executive session. Ned C. Lautenbach serves as Chairman of the Independent Trustees and as such (i) acts as a liaison between the Independent Trustees and management with respect to matters important to the Independent Trustees and (ii) with management prepares agendas for Board meetings.
Fidelity funds are overseen by different Boards of Trustees. The fund's Board oversees Fidelity's equity and high income funds and another Board oversees Fidelity's investment-grade bond, money market, and asset allocation funds. The asset allocation funds may invest in Fidelity funds overseen by the fund's Board. The use of separate Boards, each with its own committee structure, allows the Trustees of each group of Fidelity funds to focus on the unique issues of the funds they oversee, including common research, investment, and operational issues. On occasion, the separate Boards establish joint committees to address issues of overlapping consequences for the Fidelity funds overseen by each Board.
The Trustees operate using a system of committees to facilitate the timely and efficient consideration of all matters of importance to the Trustees, the fund, and fund shareholders and to facilitate compliance with legal and regulatory requirements and oversight of the fund's activities and associated risks. The Board, acting through its committees, has charged FMR and its affiliates with (i) identifying events or circumstances the occurrence of which could have demonstrably adverse effects on the fund's business and/or reputation; (ii) implementing processes and controls to lessen the possibility that such events or circumstances occur or to mitigate the effects of such events or circumstances if they do occur; and (iii) creating and maintaining a system designed to evaluate continuously business and market conditions in order to facilitate the identification and implementation processes described in (i) and (ii) above. Because the day-to-day operations and activities of the fund are carried out by or through FMR, its affiliates and other service providers, the fund's exposure to risks is mitigated but not eliminated by the processes overseen by the Trustees. While each of the Board's committees has responsibility for overseeing different aspects of the fund's activities, oversight is exercised primarily through the Operations, Audit, and Compliance Committees. In addition, the Independent Trustees have worked with FMR to enhance the Board's oversight of investment and financial risks, legal and regulatory risks, technology risks, and operational risks, including the development of additional risk reporting to the Board. For example, a working group comprised of Independent Trustees and FMR has worked and continues to work to review the Fidelity funds' valuation-related activities, reporting and risk management. Appropriate personnel, including but not limited to the fund's Chief Compliance Officer (CCO), FMR's internal auditor, the independent accountants, the fund's Treasurer and portfolio management personnel, make periodic reports to the Board's committees, as appropriate, including an annual review of FMR's risk management program for the Fidelity funds. The responsibilities of each standing committee, including their oversight responsibilities, are described further under "Standing Committees of the Fund's Trustees."
Annual Report
The fund's Statement of Additional Information (SAI) includes more information about the Trustees. To request a free copy, call Fidelity at 1-800-544-8544.
Interested Trustees*:
Correspondence intended for each Trustee who is an interested person may be sent to Fidelity Investments, 82 Devonshire Street, Boston, Massachusetts 02109.
Name, Age; Principal Occupations and Other Relevant Experience+ |
James C. Curvey (77) |
| Year of Election or Appointment: 2007 Mr. Curvey is Trustee and Chairman of the Board of Trustees of certain Trusts. Mr. Curvey also serves as Trustee (2007-present) of other investment companies advised by FMR. Mr. Curvey is a Director of Fidelity Investments Money Management, Inc. (2009-present), Director of Fidelity Research & Analysis Co. (2009-present) and Director of FMR and FMR Co., Inc. (2007-present). Mr. Curvey is also Vice Chairman (2007-present) and Director of FMR LLC. In addition, Mr. Curvey serves as an Overseer for the Boston Symphony Orchestra and a member of the Trustees of Villanova University. Previously, Mr. Curvey was the Vice Chairman (2006-2007) and Director (2000-2007) of FMR Corp. |
Ronald P. O'Hanley (55) |
| Year of Election or Appointment: 2011 Mr. O'Hanley is Director of FMR Co., Inc. (2010-present), Director of Fidelity Investments Money Management, Inc. (2010-present), Director of Fidelity Research & Analysis Company (2010-present), President of Fidelity Asset Management and Corporate Services and a member of Fidelity's Executive Committee (2010-present). Previously, Mr. O'Hanley served as President and Chief Executive Officer of BNY Mellon Asset Management (2007-2010). Mr. O'Hanley also served as Vice Chairman of Bank New York Mellon Corp. and a member of that firm's Executive Committee. Prior to the 2007 merger of The Bank of New York and Mellon Financial Corporation, he was Vice Chairman of Mellon Financial Corporation and President and Chief Executive Officer of Mellon Asset Management. He joined Mellon in February 1997. Mr. O'Hanley currently serves as Chairman of the Boston Public Library Foundation Board of Directors and sits on the Board of Directors of Beth Israel Deaconess Medical Center, the Board of Trustees of the Marine Biological Laboratory and the Advisory Board of the Maxwell School of Citizenship and Public Administration at Syracuse University. Mr. O'Hanley also chairs the Council on Asset Management for the Financial Services Roundtable and is a member of the Board of Directors of Institutional Investor's U.S. Institute. |
* Trustees have been determined to be "Interested Trustees" by virtue of, among other things, their affiliation with the trust or various entities under common control with FMR.
+ The information above includes each Trustee's principal occupation during the last five years and other information relating to the experience, attributes, and skills relevant to each Trustee's qualifications to serve as a Trustee, which led to the conclusion that each Trustee should serve as a Trustee for the fund.
Annual Report
Independent Trustees:
Correspondence intended for each Independent Trustee (that is, the Trustees other than the Interested Trustees) may be sent to Fidelity Investments, P.O. Box 55235, Boston, Massachusetts 02205-5235.
Name, Age; Principal Occupations and Other Relevant Experience+ |
Dennis J. Dirks (64) |
| Year of Election or Appointment: 2005 Prior to his retirement in May 2003, Mr. Dirks was Chief Operating Officer and a member of the Board of The Depository Trust & Clearing Corporation (DTCC). He also served as President, Chief Operating Officer, and Board member of The Depository Trust Company (DTC) and President and Board member of the National Securities Clearing Corporation (NSCC). In addition, Mr. Dirks served as Chief Executive Officer and Board member of the Government Securities Clearing Corporation, Chief Executive Officer and Board member of the Mortgage-Backed Securities Clearing Corporation, as a Trustee and a member of the Finance Committee of Manhattan College (2005-2008), and as a Trustee and a member of the Finance Committee of AHRC of Nassau County (2006-2008). Mr. Dirks is a member of the Independent Directors Council (IDC) Governing Council (2010-present) and Board of Directors for The Brookville Center for Children's Services, Inc. (2009-present). |
Alan J. Lacy (59) |
| Year of Election or Appointment: 2008 Mr. Lacy serves as Senior Adviser (2007-present) of Oak Hill Capital Partners, L.P. (private equity). Mr. Lacy also served as Chief Executive Officer (2000-2005) and Vice Chairman (2005-2006) of Sears Holdings Corporation and Sears, Roebuck and Co. (retail). In addition, Mr. Lacy serves as a member of the Board of Directors of Dave & Buster's Entertainment, Inc. (restaurant and entertainment complexes, 2010-present), Earth Fare, Inc. (retail grocery, 2012-present), The Hillman Companies, Inc. (hardware wholesalers, 2010-present), and Bristol-Myers Squibb Company (global pharmaceuticals, 2008-present). Mr. Lacy is a member of the Board of Trustees of The National Parks Conservation Association (2006-present). Previously, Mr. Lacy served as Chairman of the Board of Trustees of the National Parks Conservation Association (2008-2011) and as a member of the Board of Directors for the Western Union Company (global money transfer, 2006-2011). |
Ned C. Lautenbach (68) |
| Year of Election or Appointment: 2000 Mr. Lautenbach is Chairman of the Independent Trustees of the Equity and High Income Funds (2006-present). Mr. Lautenbach currently serves as the Lead Director of the Eaton Corporation Board of Directors (diversified industrial, 1997-present). Mr. Lautenbach is Chairman of the Board of Directors of the Philharmonic Center for the Arts in Naples, Florida (2012-present) and a member of the Council on Foreign Relations (1994-present). Previously, Mr. Lautenbach was a Partner/Advisory Partner at Clayton, Dubilier & Rice, LLC (private equity investment, 1998-2010), as well as a Director of Sony Corporation (2006-2007). |
Joseph Mauriello (68) |
| Year of Election or Appointment: 2008 Prior to his retirement in January 2006, Mr. Mauriello served in numerous senior management positions including Deputy Chairman and Chief Operating Officer (2004-2005), and Vice Chairman of Financial Services (2002-2004) of KPMG LLP US (professional services, 1965-2005). Mr. Mauriello currently serves as a member of the Board of Directors of XL Group plc. (global insurance and re-insurance, 2006-present). Previously, Mr. Mauriello served as a Director of the Hamilton Funds of the Bank of New York (2006-2007) and of Arcadia Resources Inc. (health care services and products, 2007-2012). |
Robert W. Selander (62) |
| Year of Election or Appointment: 2011 Previously, Mr. Selander served as a Member of the Advisory Board of Fidelity's Equity and High Income Funds (2011), Executive Vice Chairman (2010), Chief Executive Officer (2009-2010), and President and Chief Executive Officer (1997-2009) of Mastercard, Inc. |
Cornelia M. Small (68) |
| Year of Election or Appointment: 2005 Ms. Small is a member of the Board of Directors (2009-present) and Chair of the Investment Committee (2010-present) of the Teagle Foundation. Ms. Small also serves on the Investment Committee of the Berkshire Taconic Community Foundation (2008-present). Previously, Ms. Small served as Chairperson (2002-2008) and a member of the Investment Committee and Chairperson (2008-2012) and a member of the Board of Trustees of Smith College. In addition, Ms. Small served as Chief Investment Officer, Director of Global Equity Investments, and a member of the Board of Directors of Scudder, Stevens & Clark and Scudder Kemper Investments. |
William S. Stavropoulos (73) |
| Year of Election or Appointment: 2001 Mr. Stavropoulos is Vice Chairman of the Independent Trustees of the Equity and High Income Funds (2006-present). Mr. Stavropoulos serves as President and Founder of the Michigan Baseball Foundation, the Great Lakes Loons (2007-present). Mr. Stavropoulos is Chairman Emeritus of the Board of Directors of The Dow Chemical Company, where he previously served in numerous senior management positions, including President, CEO (1995-2000; 2002-2004), Chairman of the Executive Committee (2000-2006), and as a member of the Board of Directors (1990-2006). Currently, Mr. Stavropoulos is a Director of Univar Inc. (global distributor of commodity and specialty chemicals, Chairman from 2010-May 2012 and Lead Director from May 2012-present), Teradata Corporation (data warehousing and technology solutions, 2008-present), Maersk Inc. (industrial conglomerate), and Tyco International, Ltd. (multinational manufacturing and services, 2007-present), and a member of the Advisory Board for Metalmark Capital LLC (private equity investment, 2005-present). Mr. Stavropoulos is an operating advisor to Clayton, Dubilier & Rice, LLC (private equity investment). In addition, Mr. Stavropoulos is a member of the University of Notre Dame Advisory Council for the College of Science, a Trustee of the Rollin L. Gerstacker Foundation, and a Director of the Naples Philharmonic Center for the Arts. Previously, Mr. Stavropoulos served as a Director of Chemical Financial Corporation (bank holding company, 1993-2012). |
David M. Thomas (63) |
| Year of Election or Appointment: 2008 Previously, Mr. Thomas served as Executive Chairman (2005-2006) and Chairman and Chief Executive Officer (2000-2005) of IMS Health, Inc. (pharmaceutical and healthcare information solutions), and a Director of Fortune Brands, Inc. (consumer products, 2000-2011). In addition, Mr. Thomas serves as Non-Executive Chairman of the Board of Directors of Fortune Brands Home and Security (home and security products, 2011-present), and as a member of the Board of Directors of Interpublic Group of Companies, Inc. (marketing communication, 2004-present). |
Michael E. Wiley (62) |
| Year of Election or Appointment: 2008 Mr. Wiley also serves as a Director of Asia Pacific Exploration Consolidated (international oil and gas exploration and production, 2008-present). Mr. Wiley serves as a Director of Tesoro Corporation (independent oil refiner and marketer, 2005-present), and a Director of Bill Barrett Corporation (exploration and production, 2005-present). In addition, Mr. Wiley also serves as a Director of Post Oak Bank (privately-held bank, 2004-present). Previously, Mr. Wiley served as a member of the Board of Trustees of the University of Tulsa (2000-2006; 2007-2010), as a Senior Energy Advisor of Katzenbach Partners, LLC (consulting, 2006-2007), as an Advisory Director of Riverstone Holdings (private investment), Chairman, President, and CEO of Baker Hughes, Inc. (oilfield services, 2000-2004), and as Director of Spinnaker Exploration Company (exploration and production, 2001-2005). |
+ The information above includes each Trustee's principal occupation during the last five years and other information relating to the experience, attributes, and skills relevant to each Trustee's qualifications to serve as a Trustee, which led to the conclusion that each Trustee should serve as a Trustee for the fund.
Advisory Board Members and Executive Officers:
Correspondence intended for David A. Rosow and Garnett A. Smith may be sent to Fidelity Investments, P.O. Box 55235, Boston, Massachusetts 02205-5235. Correspondence intended for each executive officer, Edward C. Johnson 3d, and Peter S. Lynch may be sent to Fidelity Investments, 82 Devonshire Street, Boston, Massachusetts 02109.
Name, Age; Principal Occupation |
Edward C. Johnson 3d (82) |
| Year of Election or Appointment: 2011 Member of the Advisory Board of Fidelity's Equity and High Income Funds. Mr. Johnson serves as Chief Executive Officer, Chairman, and a Director of FMR LLC, and also serves as Chairman and Director of FIL Limited. Previously, Mr. Johnson served as a Trustee and Chairman of the Board of certain Fidelity Trusts, Chairman and a Director of FMR, Chairman and a Director of FMR Co., Inc., and President of FMR LLC (2006-2007). |
Peter S. Lynch (68) |
| Year of Election or Appointment: 2003 Member of the Advisory Board of Fidelity's Equity and High Income Funds. Mr. Lynch is Vice Chairman and a Director of FMR and FMR Co., Inc. In addition, Mr. Lynch serves as a Trustee of Boston College and as the Chairman of the Inner-City Scholarship Fund. Previously, Mr. Lynch served on the Special Olympics International Board of Directors (1997-2006). |
David A. Rosow (70) |
| Year of Election or Appointment: 2012 Member of the Advisory Board of Fidelity's Equity and High Income Funds. Chairman and Chief Executive Officer of International Golf Group, Inc. (golf course development, 1989-present). Previously, Mr. Rosow served as Chairman and Chief Executive Officer of Rosow & Company, Inc. (private investment company, 1989-2011), a Lead Director of Hudson United Bancorp (2001-2006) and as a Director of TD Banknorth (1996-2006). In addition, Mr. Rosow is a member (2008-present) and President (2009-present) of the Town Council of Palm Beach, Florida. |
Garnett A. Smith (65) |
| Year of Election or Appointment: 2012 Member of the Advisory Board of Fidelity's Equity and High Income Funds. Prior to Mr. Smith's retirement, he served as Chairman and Chief Executive Officer of Inbrand Corp. (manufacturer of personal absorbent products, 1990-1997). He also served as President (1986-1990) of Inbrand Corp. Prior to his employment with Inbrand Corp., he was employed by a retail fabric chain and North Carolina National Bank. In addition, Mr. Smith is a board member of the Jackson Hole Land Trust (2009-present). |
Kenneth B. Robins (43) |
| Year of Election or Appointment: 2008 President and Treasurer of Fidelity's Equity and High Income Funds. Mr. Robins also serves as President and Treasurer (2010-present) and Assistant Treasurer (2009-present) of other Fidelity funds and is an employee of Fidelity Investments (2004-present). Previously, Mr. Robins served as Deputy Treasurer of the Fidelity funds (2005-2008) and Treasurer and Chief Financial Officer of The North Carolina Capital Management Trust: Cash and Term Portfolios (2006-2008). |
Bruce T. Herring (47) |
| Year of Election or Appointment: 2006 Vice President of certain Equity Funds. Mr. Herring also serves as President of Fidelity Research & Analysis Company (2010-present), Chief Investment Officer and Director of Fidelity Management & Research (U.K.) Inc. (2010-present) and Group Chief Investment Officer of FMR. Previously, Mr. Herring served as Vice President (2005-2006) and Senior Vice President (2006-2007) of Fidelity Management & Research Company, Vice President of FMR Co., Inc. (2001-2007) and as a portfolio manager for Fidelity U.S. Equity Funds. |
Brian B. Hogan (48) |
| Year of Election or Appointment: 2009 Vice President of Equity and High Income Funds. Mr. Hogan also serves as President of FMR's Equity Division (2009-present). Previously, Mr. Hogan served as Senior Vice President, Equity Research of FMR (2006-2009) and as a portfolio manager. |
Scott C. Goebel (44) |
| Year of Election or Appointment: 2008 Secretary and Chief Legal Officer (CLO) of the Fidelity funds. Mr. Goebel also serves as Secretary of Fidelity Investments Money Management, Inc. (FIMM) (2010-present) and Fidelity Research and Analysis Company (FRAC) (2010-present); Secretary and CLO of The North Carolina Capital Management Trust: Cash and Term Portfolios (2008-present); General Counsel, Secretary, and Senior Vice President of FMR (2008-present) and FMR Co., Inc. (2008-present); employed by FMR LLC or an affiliate (2001-present); Chief Legal Officer of Fidelity Management & Research (Hong Kong) Limited (2008-present) and Assistant Secretary of Fidelity Management & Research (Japan) Inc. (2008-present), and Fidelity Management & Research (U.K.) Inc. (2008-present). Previously, Mr. Goebel served as Assistant Secretary of FIMM (2008-2010), FRAC (2008-2010), and the Funds (2007-2008) and as Vice President and Secretary of Fidelity Distributors Corporation (FDC) (2005-2007). |
William C. Coffey (43) |
| Year of Election or Appointment: 2009 Assistant Secretary of Fidelity's Equity and High Income Funds. Mr. Coffey also serves as Senior Vice President and Deputy General Counsel of FMR LLC (2010-present), and is an employee of Fidelity Investments. Previously, Mr. Coffey served as Vice President and Associate General Counsel of FMR LLC (2005-2009). |
Elizabeth Paige Baumann (44) |
| Year of Election or Appointment: 2012 Anti-Money Laundering (AML) Officer of the Fidelity funds. Ms. Baumann also serves as AML Officer of The North Carolina Capital Management Trust: Cash and Term Portfolios (2012-present), Chief AML Officer of FMR LLC (2012-present), and is an employee of Fidelity Investments. Previously, Ms. Baumann served as Vice President and Deputy Anti-Money Laundering Officer (2007-2012). |
Christine Reynolds (54) |
| Year of Election or Appointment: 2008 Chief Financial Officer of the Fidelity funds. Ms. Reynolds became President of Fidelity Pricing and Cash Management Services (FPCMS) in August 2008. Ms. Reynolds served as Chief Operating Officer of FPCMS (2007-2008). Previously, Ms. Reynolds served as President, Treasurer, and Anti-Money Laundering officer of the Fidelity funds (2004-2007). |
Joseph A. Hanlon (44) |
| Year of Election or Appointment: 2012 Chief Compliance Officer of Fidelity's Equity and High Income Funds. Mr. Hanlon serves as Compliance Officer of FMR, FMR Co., Inc., Fidelity Investments Money Management, Inc. (FIMM), Fidelity Research and Analysis Company (FRAC), Fidelity Management & Research (Japan) Inc., Fidelity Management & Research (U.K.) Inc., Fidelity Management & Research (Hong Kong), and Strategic Advisers, Inc. (2009-present), as Senior Vice President of the Fidelity Asset Management Division (2009-present), and is an employee of Fidelity Investments. |
Joseph F. Zambello (55) |
| Year of Election or Appointment: 2011 Deputy Treasurer of the Fidelity funds. Mr. Zambello is an employee of Fidelity Investments. Previously, Mr. Zambello served as Vice President of FMR's Program Management Group (2009-2011) and Vice President of the Transfer Agent Oversight Group (2005-2009). |
Adrien E. Deberghes (45) |
| Year of Election or Appointment: 2008 Deputy Treasurer of Fidelity's Equity and High Income Funds. Mr. Deberghes also serves as Vice President (2011-present) and Assistant Treasurer (2010-present) of other Fidelity funds, and is an employee of Fidelity Investments (2008-present). Previously, Mr. Deberghes served as Senior Vice President of Mutual Fund Administration at State Street Corporation (2007-2008), Senior Director of Mutual Fund Administration at Investors Bank & Trust (2005-2007), and Director of Finance for Dunkin' Brands (2000-2005). |
Stephen Sadoski (41) |
| Year of Election or Appointment: 2012 Deputy Treasurer of Fidelity's Equity and High Income Funds. Mr. Sadoski also serves as Assistant Treasurer of other Fidelity funds (2012-present) and is an employee of Fidelity Investments (2012-present). Previously, Mr. Sadoski served as an assistant chief accountant in the Division of Investment Management of the Securities and Exchange Commission (SEC) (2009-2012) and as a senior manager at Deloitte & Touche (1997-2009). |
Stephanie J. Dorsey (43) |
| Year of Election or Appointment: 2010 Assistant Treasurer of Fidelity's Equity and High Income Funds. Ms. Dorsey also serves as Deputy Treasurer of other Fidelity funds (2008-present) and is an employee of Fidelity Investments (2008-present). Previously, Ms. Dorsey served as Treasurer (2004-2008) of the JPMorgan Mutual Funds and Vice President (2004-2008) of JPMorgan Chase Bank. |
John R. Hebble (54) |
| Year of Election or Appointment: 2009 Assistant Treasurer of Fidelity's Equity and High Income Funds. Mr. Hebble also serves as President (2011-present), Treasurer, and Chief Financial Officer of The North Carolina Capital Management Trust: Cash and Term Portfolios (2008-present), President and Treasurer of other Fidelity funds (2008-present) and is an employee of Fidelity Investments. |
Gary W. Ryan (54) |
| Year of Election or Appointment: 2005 Assistant Treasurer of the Fidelity funds. Mr. Ryan is an employee of Fidelity Investments. Previously, Mr. Ryan served as Vice President of Fund Reporting in Fidelity Pricing and Cash Management Services (FPCMS) (1999-2005). |
Jonathan Davis (44) |
| Year of Election or Appointment: 2010 Assistant Treasurer of the Fidelity funds. Mr. Davis is also Assistant Treasurer of Fidelity Rutland Square Trust II and Fidelity Commonwealth Trust II. Mr. Davis is an employee of Fidelity Investments. Previously, Mr. Davis served as Vice President and Associate General Counsel of FMR LLC (2003-2010). |
Annual Report
The Board of Trustees of Fidelity Total International Equity Fund voted to pay on December 10, 2012, to shareholders of record at the opening of business on December 7, 2012, a distribution of $0.245 per share derived from capital gains realized from sales of portfolio securities and a dividend of $0.148 per share from net investment income.
The fund hereby designates as a capital gain dividend with respect to the taxable year ended October 31, 2012 $309,806, or, if subsequently determined to be different, the net capital gain of such year.
The fund designates 4% of the dividends distributed during the fiscal year as qualifying for the dividends-received deduction for corporate shareholders.
The fund designates 100% of the dividends distributed in December 2011 during the fiscal year as amounts which may be taken into account as a dividend for the purposes of the maximum rate under section 1(h)(11) of the Internal Revenue Code.
The amounts per share which represent income derived from sources within, and taxes paid to, foreign countries or possessions of the United States are as follows:
| Pay Date | Income | Taxes |
Total International Equity Fund | 12/05/11 | $0.078 | $0.0107 |
The fund will notify shareholders in January 2013 of amounts for use in preparing 2012 income tax returns.
Annual Report
Board Approval of Investment Advisory Contracts and Management Fees
Fidelity Total International Equity Fund
Each year, the Board of Trustees, including the Independent Trustees (together, the Board), votes on the renewal of the management contract and sub-advisory agreements (together, the Advisory Contracts) for the fund. The Board, assisted by the advice of fund counsel and Independent Trustees' counsel, requests and considers a broad range of information relevant to the renewal of the Advisory Contracts throughout the year.
The Board meets regularly and, at each of its meetings, considers factors that are relevant to its annual consideration of the renewal of the fund's Advisory Contracts, including the services and support provided to the fund and its shareholders. The Board has established various standing committees, each composed of and chaired by Independent Trustees with varying backgrounds, to which the Board has assigned specific subject matter responsibilities in order to enhance effective decision-making by the Board. The Board, acting directly and through its Committees, requests and receives information concerning the annual consideration of the renewal of the fund's Advisory Contracts. The Board also meets as needed to consider matters specifically related to the Board's annual consideration of the renewal of Advisory Contracts. Members of the Board may also meet with trustees of other Fidelity funds through ad hoc joint committees to discuss certain matters relevant to the Fidelity funds.
At its July 2012 meeting, the Board of Trustees, including the Independent Trustees, unanimously determined to renew the fund's Advisory Contracts. In reaching its determination, the Board considered all factors it believed relevant, including (i) the nature, extent, and quality of the services to be provided to the fund and its shareholders (including the investment performance of the fund); (ii) the competitiveness of the fund's management fee and total expense ratio relative to peer funds; (iii) the total costs of the services to be provided by and the profits to be realized by Fidelity from its relationship with the fund; (iv) the extent to which economies of scale exist and would be realized as the fund grows; and (v) whether fee levels reflect these economies of scale, if any, for the benefit of fund shareholders.
In considering whether to renew the Advisory Contracts for the fund, the Board reached a determination, with the assistance of fund counsel and Independent Trustees' counsel and through the exercise of its business judgment, that the renewal of the Advisory Contracts is in the best interests of the fund and its shareholders and that the compensation payable under the Advisory Contracts is fair and reasonable. The Board's decision to renew the Advisory Contracts was not based on any single factor, but rather was based on a comprehensive consideration of all the information provided to the Board at its meetings throughout the year. The Board, in reaching its determination to renew the Advisory Contracts, is aware that shareholders in the fund have a broad range of investment choices available to them, including a wide choice among mutual funds offered by Fidelity's competitors, and that the fund's shareholders, who have the opportunity to review and weigh the disclosure provided by the fund in its prospectus and other public disclosures, have chosen to invest in this fund, managed by Fidelity.
Annual Report
Nature, Extent, and Quality of Services Provided. The Board considered the staffing within the investment adviser, FMR, and the sub-advisers (together, the Investment Advisers), including the backgrounds of the fund's investment personnel, and also considered the fund's investment objective, strategies, and related investment philosophy. The Independent Trustees also had discussions with senior management of Fidelity's investment operations and investment groups. The Board considered the structure of the portfolio manager compensation program and whether this structure provides appropriate incentives to act in the best interests of the fund.
Resources Dedicated to Investment Management and Support Services. The Board and the Fund Oversight and Research Committees reviewed the general qualifications and capabilities of the Investment Advisers' investment staff, including its size, education, experience, and resources, as well as the Investment Advisers' approach to recruiting, training, managing, and compensating investment personnel. The Board also noted that FMR has continued to increase the resources devoted to non-U.S. offices, including expansion of Fidelity's global investment organization. The Board noted that Fidelity's analysts have extensive resources, tools and capabilities that allow them to conduct sophisticated quantitative and fundamental analysis, as well as credit analysis of issuers, counterparties and guarantors. The Board also believes that Fidelity's investment professionals have sufficient access to global information and data so as to provide competitive investment results over time, and that those professionals also have access to sophisticated tools that permit them to assess portfolio construction and risk and performance attribution characteristics continuously, as well as to transmit new information and research conclusions rapidly around the world. Additionally, in its deliberations, the Board considered the Investment Advisers' trading and risk management capabilities and resources, which are an integral part of the investment management process.
Shareholder and Administrative Services. The Board considered (i) the nature, extent, quality, and cost of advisory, administrative, and shareholder services performed by the Investment Advisers and their affiliates under the Advisory Contracts and under separate agreements covering transfer agency, pricing and bookkeeping, and securities lending services for the fund; (ii) the nature and extent of the supervision of third party service providers, principally custodians and subcustodians; and (iii) the resources devoted to, and the record of compliance with, the fund's compliance policies and procedures. The Board also reviewed the allocation of fund brokerage, including allocations to brokers affiliated with the Investment Advisers, the use of brokerage commissions to pay fund expenses, and the use of "soft" commission dollars to pay for research services.
Annual Report
Board Approval of Investment Advisory Contracts and
Management Fees - continued
The Board noted that the growth of fund assets over time across the complex allows Fidelity to reinvest in the development of services designed to enhance the value or convenience of the Fidelity funds as investment vehicles. These services include 24-hour access to account information and market information through telephone representatives and over the Internet, investor education materials and asset allocation tools, and the expanded availability of Fidelity Investor Centers.
Investment in a Large Fund Family. The Board considered the benefits to shareholders of investing in a Fidelity fund, including the benefits of investing in a fund that is part of a large family of funds offering a variety of investment disciplines and providing a large variety of mutual fund investor services. The Board noted that Fidelity had taken, or had made recommendations that resulted in the Fidelity funds taking, a number of actions over the previous year that benefited particular funds, including (i) continuing to dedicate additional resources to investment research and support of the senior management team that oversees asset management; (ii) persisting in efforts to enhance Fidelity's research capabilities, in particular, international research; (iii) launching new funds and making other enhancements to meet client needs for global and income-oriented solutions; (iv) continuing to launch dedicated lower cost underlying funds to meet investment management's portfolio construction needs related to expanding underlying fund options, specifically for the Freedom Fund product lines; (v) adopting a "Stock Selector" sector neutral investment approach and employing a team of portfolio managers who are sector specialists to manage certain funds; (vi) rationalizing product lines and gaining increased efficiencies through the mergers of several funds into other funds; (vii) strengthening the Spartan Index Fund product line by adding new funds and/or new low-cost institutional share classes, restructuring fund expenses to accommodate new classes, and reducing investment minimums for certain classes of shares; (viii) modifying the eligibility criteria for Institutional Class shares to increase their appeal to government entities and charitable investors; and (ix) reducing certain transfer agent fee rates.
Investment Performance. The Board considered whether the fund has operated in accordance with its investment objective, as well as its record of compliance with its investment restrictions. It also reviewed the fund's absolute investment performance for each class, as well as the fund's relative investment performance for each class measured over multiple periods against (i) a broad-based securities market index, and (ii) a peer group of mutual funds deemed appropriate by Fidelity and reviewed by the Board. Because the fund had been in existence less than five calendar years, the following charts considered by the Board show, over the one- and three-year periods ended December 31, 2011, the cumulative total returns of the retail class and Class B of the fund, the cumulative total returns of a broad-based securities market index ("benchmark"), and a range of cumulative total returns of a peer group of mutual funds identified by Morningstar, Inc. as having an investment style similar to that of the fund based on underlying portfolio holdings. The returns of the retail class and Class B show the performance of the highest and lowest performing classes, respectively (based on three-year performance). The box within each chart shows the 25th percentile return (top of box) and the 75th percentile return (bottom of box) of the peer group. Returns shown above the box are in the first quartile and returns shown below the box are in the fourth quartile. The percentage beaten numbers noted below each chart correspond to the percentile box and represent the percentage of funds in the peer group whose performance was equal to or lower than that of the class indicated.
Annual Report
Fidelity Total International Equity Fund

The Board reviewed the fund's relative investment performance against its peer group and noted that the performance of the retail class of the fund was in the third quartile for the one-year period and the second quartile for the three-year period. The Board also noted that the investment performance of the fund was lower than its benchmark for the one-year period, although the three-year cumulative total return of the retail class compared favorably to its benchmark. The Board considered that the variations in performance among the fund's classes reflect the variations in class expenses, which result in lower performance for higher expense classes. The Board noted that there were portfolio management changes for the fund in February 2012 and September 2011. The Board also reviewed the fund's performance since inception as well as performance in the current year.
The Board also considered that the fund's management fee is subject to upward or downward adjustment depending upon whether, and to what extent, the fund's investment performance for the performance period exceeds, or is exceeded by, the record (over the same period) of a Board-approved performance adjustment index. The Board noted that the performance adjustment provides FMR with a strong economic incentive to seek to achieve superior performance for the fund's shareholders and helps to more closely align the interests of FMR and the fund's shareholders.
Annual Report
Board Approval of Investment Advisory Contracts and
Management Fees - continued
Based on its review, the Board concluded that the nature, extent, and quality of services provided to the fund under the Advisory Contracts should benefit the fund's shareholders.
Competitiveness of Management Fee and Total Expense Ratio. The Board considered the fund's management fee and total expense ratio compared to "mapped groups" of competitive funds and classes. Fidelity creates "mapped groups" by combining similar Lipper investment objective categories that have comparable management fee characteristics. Combining Lipper investment objective categories aids the Board's management fee and total expense ratio comparisons by broadening the competitive group used for comparison and by reducing the number of universes to which various Fidelity funds are compared.
Management Fee. The Board considered two proprietary management fee comparisons for the 12-month (or shorter) periods shown in the chart below. The group of Lipper funds used by the Board for management fee comparisons is referred to below as the "Total Mapped Group." The Total Mapped Group comparison focuses on a fund's standing relative to the total universe of comparable funds available to investors in terms of gross management fees before expense reimbursements or caps, and without giving effect to the fund's performance adjustment. "TMG %" represents the percentage of funds in the Total Mapped Group that had management fees that were lower than the fund's. For example, a TMG % of 17% means that 83% of the funds in the Total Mapped Group had higher management fees than the fund. The "Asset-Size Peer Group" (ASPG) comparison focuses on a fund's standing relative to non-Fidelity funds similar in size to the fund within the Total Mapped Group. The ASPG represents at least 15% of the funds in the Total Mapped Group with comparable asset size and management fee characteristics, subject to a minimum of 50 funds (or all funds in the Total Mapped Group if fewer than 50). Additional information, such as the ASPG quartile in which the fund's management fee ranked and the impact of the fund's performance adjustment, is also included in the chart and considered by the Board.
Annual Report
Fidelity Total International Equity Fund

The Board noted that the fund's management fee ranked below the median of its Total Mapped Group and below the median of its ASPG for 2011. The Board also noted the effect of the fund's negative performance adjustment on the fund's management fee ranking. The Board noted that the performance adjustment for each year represents calculations for performance periods that differ from the periods shown in the performance charts above.
Based on its review, the Board concluded that the fund's management fee is fair and reasonable in light of the services that the fund receives and the other factors considered.
Total Expense Ratio. In its review of each class's total expense ratio, the Board considered the fund's management fee as well as other fund or class expenses, as applicable, such as transfer agent fees, pricing and bookkeeping fees, fund-paid 12b-1 fees, and custodial, legal, and audit fees. The Board also noted the effects of any waivers and reimbursements on fees and expenses, as well as the impact of the fund's performance adjustment. As part of its review, the Board also considered the current and historical total expense ratios of each class of the fund compared to competitive fund median expenses. Each class of the fund is compared to those funds and classes in the Total Mapped Group (used by the Board for management fee comparisons) that have a similar sales load structure.
The Board noted that the total expense ratio of each of Class A and the retail class ranked below its competitive median for 2011, the total expense ratio of Class B ranked equal to its competitive median for 2011, and the total expense ratio of each of Class T, Class C, and Institutional Class ranked above its competitive median for 2011. The Board considered that various factors, including 12b-1 fees, positive or negative performance adjustments, and relatively higher other expenses in the case of small fund size, can affect total expense ratios. The Board noted that the total expense ratio of Class T was above the competitive median primarily because of higher 12b-1 fees on Class T. Class T has a higher 12b-1 fee, but a lower front-end sales charge, than traditionally priced front-end sales charge classes. The Board considered that Class T is primarily sold load-waived in the retirement plan market where its 0.50% 12b-1 fee is comparable to competing no-load, higher 12b-1 fee classes designed specifically for retirement plans. The Board noted that the fund offers multiple classes, each of which has a different sales load and 12b-1 fee structure, and that the multiple structures are intended to offer a range of pricing options for the intermediary market. The Board also noted that the total expense ratios of the classes vary primarily by the level of their 12b-1 fees, although differences in transfer agent fees may also cause expenses to vary from class to class.
Annual Report
Board Approval of Investment Advisory Contracts and
Management Fees - continued
The Board further considered that FMR contractually agreed to reimburse Class A, Class T, Class B, Class C, Institutional Class, and the retail class of the fund to the extent that total operating expenses (excluding interest, taxes, certain securities lending costs, brokerage commissions, extraordinary expenses, and acquired fund fees and expenses, if any), as a percentage of their respective average net assets, exceed 1.45%, 1.70%, 2.20%, 2.20%, 1.20% and 1.20% through December 31, 2012.
Fees Charged to Other Fidelity Clients. The Board also considered Fidelity fee structures and other information with respect to clients of FMR and its affiliates, such as other mutual funds advised or subadvised by FMR or its affiliates, pension plan clients, and other institutional clients. The Board noted the findings of the 2010 ad hoc joint committee (created with the board of other Fidelity funds), which reviewed and compared Fidelity's institutional investment advisory business with its business of providing services to the Fidelity funds, including the differences in services provided, fees charged, and costs incurred, as well as competition in their respective marketplaces.
Based on its review of total expense ratios and fees charged to other Fidelity clients, the Board concluded that the total expense ratio of each class of the fund was reasonable, although in some cases above the median of the universe presented for comparison, in light of the services that the fund and its shareholders receive and the other factors considered.
Costs of the Services and Profitability. The Board considered the revenues earned and the expenses incurred by Fidelity in conducting the business of developing, marketing, distributing, managing, administering and servicing the fund and its shareholders. The Board also considered the level of Fidelity's profits in respect of all the Fidelity funds.
Annual Report
On an annual basis, FMR presents to the Board Fidelity's profitability for the fund. Fidelity calculates the profitability for each fund, as well as aggregate profitability for groups of Fidelity funds and all Fidelity funds, using a series of detailed revenue and cost allocation methodologies which originate with the books and records of Fidelity on which Fidelity's audited financial statements are based. The Audit Committee of the Board reviews any significant changes from the prior year's methodologies.
PricewaterhouseCoopers LLP (PwC), independent registered public accounting firm and auditor to Fidelity and certain Fidelity funds, has been engaged annually by the Board as part of the Board's assessment of Fidelity's profitability analysis. PwC's engagement includes the review and assessment of Fidelity's methodologies used in determining the revenues and expenses attributable to Fidelity's mutual fund business, and completion of agreed-upon procedures surrounding the mathematical accuracy of fund profitability and its conformity to allocation methodologies. After considering PwC's reports issued under the engagement and information provided by Fidelity, the Board concluded that while other allocation methods may also be reasonable, Fidelity's profitability methodologies are reasonable in all material respects.
The Board also reviewed Fidelity's non-fund businesses and fall-out benefits related to the mutual fund business as well as cases where Fidelity's affiliates may benefit from or be related to the fund's business.
The Board considered the costs of the services provided by and the profits realized by Fidelity in connection with the operation of the fund and was satisfied that the profitability was not excessive in the circumstances.
Economies of Scale. The Board considered whether there have been economies of scale in respect of the management of the Fidelity funds, whether the Fidelity funds (including the fund) have appropriately benefited from any such economies of scale, and whether there is potential for realization of any further economies of scale. The Board considered the extent to which the fund will benefit from economies of scale through increased services to the fund, through waivers or reimbursements, or through fee or expense reductions. The Board also noted that in 2009, it and the board of other Fidelity funds created an ad hoc committee (the Economies of Scale Committee) to analyze whether FMR attains economies of scale in respect of the management and servicing of the Fidelity funds, whether the Fidelity funds have appropriately benefited from such economies of scale, and whether there is potential for realization of any further economies of scale.
The Board recognized that the fund's management contract incorporates a "group fee" structure, which provides for lower group fee rates as total fund assets under FMR's management increase, and for higher group fee rates as total fund assets under FMR's management decrease. FMR calculates the group fee rates based on a tiered asset "breakpoint" schedule that varies based on asset class. The Board considered that the group fee is designed to deliver the benefits of economies of scale to fund shareholders when total Fidelity fund assets increase, even if assets of any particular fund are unchanged or have declined, because some portion of Fidelity's costs are attributable to services provided to all Fidelity funds, and all funds benefit if those costs can be allocated among more assets. The Board concluded that, given the group fee structure, fund shareholders will benefit from lower management fees as assets under FMR's management increase at the fund complex level, regardless of whether Fidelity achieves any such economies of scale.
Annual Report
Board Approval of Investment Advisory Contracts and
Management Fees - continued
The Board concluded, taking into account the analysis of the Economies of Scale Committee, that economies of scale, if any, are being appropriately shared between fund shareholders and Fidelity.
Additional Information Requested by the Board. In order to develop fully the factual basis for consideration of the Fidelity funds' Advisory Contracts, the Board requested and received additional information on certain topics, including (i) fund performance trends, actions to be taken by FMR to improve certain funds' overall performance, and Fidelity's long-term strategies for certain funds; (ii) the potential to further rationalize the Fidelity fund lineup with the possibility of achieving savings for the funds and Fidelity; (iii) Fidelity's compensation structure for portfolio managers and other key investment personnel; (iv) the amount of the investment that each portfolio manager has made in the Fidelity fund(s) that he or she manages; (v) the realization of fall-out benefits in certain Fidelity business units; (vi) Fidelity's group fee structures, the potential impact of regulatory changes on such structures, and the rationale for the individual fee rates of certain funds; (vii) fund profitability methodology, including Fidelity's cost allocation methodology, and the impact of certain factors on fund profitability results; (viii) trends regarding industry use of performance fee structures and the possibility of implementing performance fee structures for additional funds; and (ix) the impact of net redemptions from the Fidelity funds.
Based on its evaluation of all of the conclusions noted above, and after considering all factors it believed relevant, the Board ultimately concluded that the advisory fee structures are fair and reasonable, and that the fund's Advisory Contracts should be renewed.
Annual Report
Investment Adviser
Fidelity Management & Research Company
Boston, MA
Investment Sub-Advisers
FMR Co., Inc.
Fidelity Management & Research
(U.K.) Inc.
Fidelity Management & Research
(Hong Kong) Limited
Fidelity Management & Research
(Japan) Inc.
FIL Investment Advisors
FIL Investments (Japan) Limited
FIL Investment Advisors (U.K.) Ltd.
General Distributor
Fidelity Distributors Corporation
Smithfield, RI
Transfer and Service Agent
Fidelity Investments Institutional
Operations Company, Inc.
Boston, MA
Fidelity Service Company, Inc.
Boston, MA
Custodian
State Street Bank and Trust Company
Quincy, MA
The Fidelity Telephone Connection
Mutual Fund 24-Hour Service
Exchanges/Redemptions
and Account Assistance 1-800-544-6666
Product Information 1-800-544-8888
Retirement Accounts 1-800-544-4774
(8 a.m. - 9 p.m.)
TDD Service 1-800-544-0118
for the deaf and hearing impaired
(9 a.m. - 9 p.m. Eastern time)
Fidelity Automated Service
Telephone (FAST®) (automated graphic)
1-800-544-5555
(automated graphic)
Automated line for quickest service
(Fidelity Investment logo)(registered trademark)
Corporate Headquarters
82 Devonshire St., Boston, MA 02109
www.fidelity.com
TIE-UANN-1212
1.912357.102
Fidelity®
Diversified International
Fund -
Class K
Annual Report
October 31, 2012
(Fidelity Cover Art)
Contents
Performance | (Click Here) | How the fund has done over time. |
Management's Discussion of Fund Performance | (Click Here) | The Portfolio Manager's review of fund performance and strategy. |
Shareholder Expense Example | (Click Here) | An example of shareholder expenses. |
Investment Changes | (Click Here) | A summary of major shifts in the fund's investments over the past six months. |
Investments | (Click Here) | A complete list of the fund's investments with their market values. |
Financial Statements | (Click Here) | Statements of assets and liabilities, operations, and changes in net assets, as well as financial highlights. |
Notes | (Click Here) | Notes to the financial statements. |
Report of Independent Registered Public Accounting Firm | (Click Here) | |
Trustees and Officers | (Click Here) | |
Distributions | (Click Here) | |
Board Approval of Investment Advisory Contracts and Management Fees | (Click Here) | |
To view a fund's proxy voting guidelines and proxy voting record for the 12-month period ended June 30, visit http://www.fidelity.com/proxyvotingresults or visit the Securities and Exchange Commission's (SEC) web site at http://www.sec.gov. You may also call 1-800-835-5092 to request a free copy of the proxy voting guidelines.
Standard & Poor's, S&P and S&P 500 are registered service marks of The McGraw-Hill Companies, Inc. and have been licensed for use by Fidelity Distributors Corporation.
Other third party marks appearing herein are the property of their respective owners.
All other marks appearing herein are registered or unregistered trademarks or service marks of FMR LLC or an affiliated company. © 2012 FMR LLC. All rights reserved.
This report and the financial statements contained herein are submitted for the general information of the shareholders of the fund. This report is not authorized for distribution to prospective investors in the fund unless preceded or accompanied by an effective prospectus.
A fund files its complete schedule of portfolio holdings with the SEC for the first and third quarters of each fiscal year on Form N-Q. Forms N-Q are available on the SEC's web site at http://www.sec.gov. A fund's Forms N-Q may be reviewed and copied at the SEC's Public Reference Room in Washington, DC. Information regarding the operation of the SEC's Public Reference Room may be obtained by calling 1-800-SEC-0330. For a complete list of a fund's portfolio holdings, view the most recent holdings listing, semiannual report, or annual report on Fidelity's web site at http://www.fidelity.com, http://www.advisor.fidelity.com, or http://www.401k.com, as applicable.
NOT FDIC INSURED • MAY LOSE VALUE • NO BANK GUARANTEE
Neither the fund nor Fidelity Distributors Corporation is a bank.
Annual Report
Average annual total return reflects the change in the value of an investment, assuming reinvestment of the class' distributions from dividend income and capital gains (the profits earned upon the sale of securities that have grown in value, if any) and assuming a constant rate of performance each year. The $10,000 table and the fund's returns do not reflect the deduction of taxes that a shareholder would pay on fund distributions or the redemption of fund shares. During periods of reimbursement by Fidelity, a fund's total return will be greater than it would be had the reimbursement not occurred. How a fund did yesterday is no guarantee of how it will do tomorrow.
Average Annual Total Returns
Periods ended October 31, 2012 | Past 1
year | Past 5
years | Past 10
years |
Class K A | 7.86% | -5.83% | 8.58% |
A The initial offering of Class K shares took place on May 9, 2008. Returns prior to May 9, 2008, are those of Fidelity® Diversified International Fund, the original class of the fund.
$10,000 Over 10 Years
Let's say hypothetically that $10,000 was invested in Fidelity® Diversified International Fund - Class K on October 31, 2002. The chart shows how the value of your investment would have changed, and also shows how the MSCI® EAFE® Index performed over the same period. The initial offering of Class K took place on May 9, 2008. See above for additional information regarding the performance of Class K.
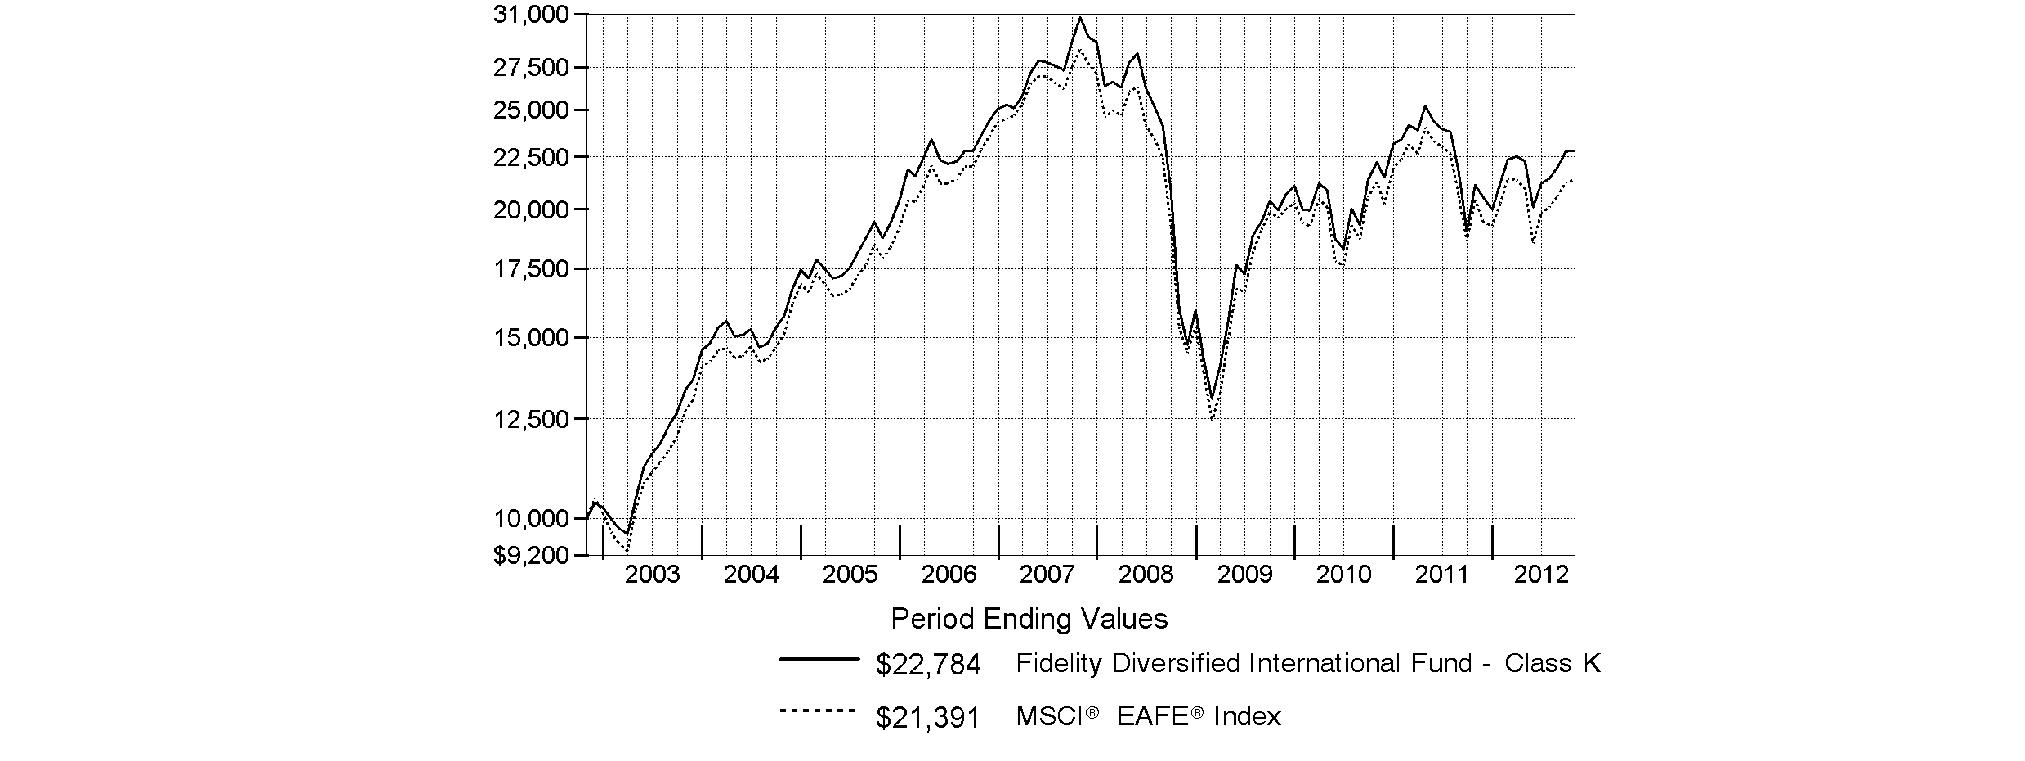
Annual Report
Market Recap: Returns for most domestic and international equities fluctuated during the 12 months ending October 31, 2012, as investor sentiment towards risk vacillated amid a changing global economic landscape. U.S. stocks overcame bouts of volatility to post strong gains for the past year, extending an uptrend that began in March 2009. The broad-based S&P 500® Index advanced 15.21%, while the blue-chip-laden Dow Jones Industrial AverageSM and technology-heavy Nasdaq Composite® Index rose 12.56% and 12.21%, respectively. Performance outside of the U.S. was relatively weak, as the MSCI® ACWI® (All Country World Index) ex USA Index rose 4.11%, hampered in part by a stronger U.S. dollar. International developed-markets generally struggled during the period as macroeconomic concerns ebbed and flowed, finishing with only a modest gain. The MSCI® EAFE® Index rose 4.76% for the year, largely buttressed in the summertime by pledges of accommodative monetary action from eurozone officials, as well as signs that the U.S. housing market was on the mend. Within the index, Asia-Pacific ex Japan showed the most impressive gain, advancing roughly 10%. A number of core European components, including Germany (+11%) and Switzerland (+10%), and the U.K. (+9%), benefited from optimism about the eurozone's ability to resolve its debt woes, which helped the region outpace the index overall. Elsewhere, Japan was among the few benchmark constituents to finish in the red, returning about -3%. Emerging-markets stocks gained 2.98% for the year, as measured by the MSCI Emerging Markets Index. A general uptrend in the final five months of the period lifted the index into positive territory for the full 12 months.
Comments from William Bower, Portfolio Manager of Fidelity® Diversified International Fund: For the year, the fund's Class K shares returned 7.86%, solidly outperforming the 4.76% gain of the MSCI® EAFE® Index. Stock selection in information technology, consumer staples, health care and consumer discretionary helped relative performance. Geographically, the fund benefited from security selection in Europe - particularly Spain and France - and Japan. Top individual contributors included Danish pharmaceuticals firm Novo Nordisk, U.S. consumer electronics giant Apple, Belgian brewer Anheuser-Busch InBev, South Korean snack maker Orion, Spanish online retailer Inditex, South Korea's Samsung Electronics and not owning Spanish telecommunications company and index component Telefonica. Conversely, stock selection in energy and an underweighting in financials hurt. Among the main detractors were Canadian energy exploration and production companies Niko Resources and Petrominerales, Japanese Internet retailer Rakuten, Australian gold firm Newcrest Mining and Chinese search engine company Baidu, which is listed in the Cayman Islands. Some of the stocks mentioned in this review were not in the index, and Niko was not held at period end.
The views expressed above reflect those of the portfolio manager(s) only through the end of the period as stated on the cover of this report and do not necessarily represent the views of Fidelity or any other person in the Fidelity organization. Any such views are subject to change at any time based upon market or other conditions and Fidelity disclaims any responsibility to update such views. These views may not be relied on as investment advice and, because investment decisions for a Fidelity fund are based on numerous factors, may not be relied on as an indication of trading intent on behalf of any Fidelity fund.
Annual Report
Fidelity Diversified International Fund
As a shareholder of the Fund, you incur two types of costs: (1) transaction costs, including redemption fees and (2) ongoing costs, including management fees and other Fund expenses. This Example is intended to help you understand your ongoing costs (in dollars) of investing in the Fund and to compare these costs with the ongoing costs of investing in other mutual funds.
The Example is based on an investment of $1,000 invested at the beginning of the period and held for the entire period (May 1, 2012 to October 31, 2012).
Actual Expenses
The first line of the accompanying table for each class of the Fund provides information about actual account values and actual expenses. You may use the information in this line, together with the amount you invested, to estimate the expenses that you paid over the period. Simply divide your account value by $1,000.00 (for example, an $8,600 account value divided by $1,000.00 = 8.6), then multiply the result by the number in the first line for a class of the Fund under the heading entitled "Expenses Paid During Period" to estimate the expenses you paid on your account during this period. A small balance maintenance fee of $12.00 that is charged once a year may apply for certain accounts with a value of less than $2,000. This fee is not included in the table below. If it was, the estimate of expenses you paid during the period would be higher, and your ending account value lower, by this amount. In addition, the Fund, as a shareholder in the underlying Fidelity Central Funds, will indirectly bear its pro-rata share of the fees and expenses incurred by the underlying Fidelity Central Funds. These fees and expenses are not included in the Fund's annualized expense ratio used to calculate the expense estimate in the table below.
Hypothetical Example for Comparison Purposes
The second line of the accompanying table for each class of the Fund provides information about hypothetical account values and hypothetical expenses based on a Class' actual expense ratio and an assumed rate of return of 5% per year before expenses, which is not the Class' actual return. The hypothetical account values and expenses may not be used to estimate the actual ending account balance or expenses you paid for the period. You may use this information to compare the ongoing costs of investing in the Fund and other funds. To do so, compare this 5% hypothetical example with the 5% hypothetical examples that appear in the shareholder reports of the other funds. A small balance maintenance fee of $12.00 that is charged once a year may apply for certain accounts with a value of less than $2,000. This fee is not included in the table below. If it was, the estimate of expenses you paid during the period would be higher, and your ending account value lower, by this amount. In addition, the Fund, as a shareholder in the underlying Fidelity Central Funds, will indirectly bear its pro-rata share of the fees and expenses incurred by the underlying Fidelity Central Funds. These fees and expenses are not included in the Fund's annualized expense ratio used to calculate the expense estimate in the table below.
Please note that the expenses shown in the table are meant to highlight your ongoing costs only and do not reflect any transaction costs. Therefore, the second line of the table is useful in comparing ongoing costs only, and will not help you determine the relative total costs of owning different funds. In addition, if these transactional costs were included, your costs would have been higher.
| Annualized Expense Ratio | Beginning
Account Value
May 1, 2012 | Ending
Account Value
October 31, 2012 | Expenses Paid
During Period*
May 1, 2012 to October 31, 2012 |
Diversified International | 1.05% | | | |
Actual | | $ 1,000.00 | $ 1,022.90 | $ 5.34 |
HypotheticalA | | $ 1,000.00 | $ 1,019.86 | $ 5.33 |
Class K | .88% | | | |
Actual | | $ 1,000.00 | $ 1,024.00 | $ 4.48 |
HypotheticalA | | $ 1,000.00 | $ 1,020.71 | $ 4.47 |
A 5% return per year before expenses
* Expenses are equal to each Class' annualized expense ratio, multiplied by the average account value over the period, multiplied by 184/366 (to reflect the one-half year period).
Annual Report
Fidelity Diversified International Fund
Investment Changes (Unaudited)
Geographic Diversification (% of fund's net assets) |
As of October 31, 2012 |
 | United Kingdom | 16.5% | |
 | Japan | 14.0% | |
 | United States of America | 10.0% | |
 | Germany | 8.9% | |
 | France | 8.4% | |
 | Switzerland | 5.3% | |
 | Australia | 4.3% | |
 | Spain | 3.3% | |
 | Canada | 3.3% | |
| Other | 26.0% | |

Percentages are based on country or territory of incorporation and are adjusted for the effect of futures contracts, if applicable. |
As of April 30, 2012 |
| United Kingdom | 17.7% | |
| Japan | 15.3% | |
| United States of America | 8.8% | |
| Germany | 8.6% | |
| France | 7.5% | |
| Switzerland | 4.7% | |
| Australia | 3.9% | |
 | Canada | 3.6% | |
| Denmark | 3.2% | |
| Other | 26.7% | |

Percentages are based on country or territory of incorporation and are adjusted for the effect of futures contracts, if applicable. |
Asset Allocation |
| % of fund's
net assets | % of fund's net assets
6 months ago |
Stocks | 94.7 | 95.6 |
Short-Term Investments and Net Other Assets (Liabilities) | 5.3 | 4.4 |
Top Ten Stocks as of October 31, 2012 |
| % of fund's
net assets | % of fund's net assets
6 months ago |
Novo Nordisk A/S Series B (Denmark, Pharmaceuticals) | 2.6 | 2.7 |
Sanofi SA (France, Pharmaceuticals) | 2.6 | 2.0 |
Royal Dutch Shell PLC Class B sponsored ADR (United Kingdom, Oil, Gas & Consumable Fuels) | 2.3 | 2.6 |
Anheuser-Busch InBev SA NV (Belgium, Beverages) | 2.2 | 1.7 |
BHP Billiton Ltd. sponsored ADR (Australia, Metals & Mining) | 2.1 | 2.1 |
Vodafone Group PLC sponsored ADR (United Kingdom, Wireless Telecommunication Services) | 2.0 | 1.8 |
HSBC Holdings PLC sponsored ADR (United Kingdom, Commercial Banks) | 1.9 | 1.4 |
Nestle SA (Switzerland, Food Products) | 1.8 | 1.6 |
Inditex SA (Spain, Specialty Retail) | 1.7 | 1.2 |
ORIX Corp. (Japan, Diversified Financial Services) | 1.5 | 1.4 |
| 20.7 | |
Market Sectors as of October 31, 2012 |
| % of fund's
net assets | % of fund's net assets
6 months ago |
Consumer Discretionary | 15.2 | 16.0 |
Financials | 14.9 | 15.0 |
Consumer Staples | 13.8 | 12.1 |
Health Care | 12.5 | 10.8 |
Information Technology | 10.6 | 11.0 |
Materials | 8.2 | 8.7 |
Industrials | 7.5 | 7.8 |
Energy | 6.8 | 9.2 |
Telecommunication Services | 4.7 | 4.7 |
Utilities | 0.5 | 0.3 |
Annual Report
Fidelity Diversified International Fund
Investments October 31, 2012
Showing Percentage of Net Assets
Common Stocks - 93.3% |
| Shares | | Value |
Australia - 4.3% |
Australia & New Zealand Banking Group Ltd. | 6,023,852 | | $ 159,140,367 |
BHP Billiton Ltd. sponsored ADR (d) | 6,546,864 | | 463,125,159 |
CSL Ltd. | 1,727,496 | | 85,178,293 |
Iluka Resources Ltd. | 2,498,732 | | 25,730,583 |
Newcrest Mining Ltd. | 3,231,215 | | 88,650,521 |
Origin Energy Ltd. | 3,253,432 | | 38,365,277 |
Spark Infrastructure Group unit | 15,030,146 | | 26,367,453 |
Telstra Corp. Ltd. | 13,908,276 | | 59,771,192 |
TOTAL AUSTRALIA | | 946,328,845 |
Bailiwick of Guernsey - 0.6% |
Resolution Ltd. | 40,590,837 | | 142,994,060 |
Bailiwick of Jersey - 1.4% |
Experian PLC | 9,017,072 | | 155,698,910 |
Randgold Resources Ltd. sponsored ADR | 484,800 | | 57,977,232 |
Shire PLC | 1,558,700 | | 43,829,970 |
WPP PLC | 3,752,709 | | 48,504,824 |
TOTAL BAILIWICK OF JERSEY | | 306,010,936 |
Belgium - 2.3% |
Anheuser-Busch InBev SA NV | 5,709,430 | | 477,486,248 |
Anheuser-Busch InBev SA NV (strip VVPR) | 5,250,900 | | 6,806 |
UCB SA | 410,500 | | 23,943,131 |
TOTAL BELGIUM | | 501,436,185 |
Bermuda - 0.2% |
Assured Guaranty Ltd. | 2,994,300 | | 41,590,827 |
Brazil - 1.1% |
Anhanguera Educacional Participacoes SA | 2,501,300 | | 43,842,485 |
BR Malls Participacoes SA | 724,200 | | 9,520,268 |
Estacio Participacoes SA | 2,338,265 | | 44,553,731 |
Kroton Educacional SA unit (a) | 1,279,200 | | 25,570,774 |
Qualicorp SA (a) | 4,596,000 | | 47,158,189 |
Souza Cruz SA | 3,313,300 | | 43,230,078 |
Tractebel Energia SA | 1,894,800 | | 32,652,076 |
TOTAL BRAZIL | | 246,527,601 |
British Virgin Islands - 0.2% |
Camelot Information Systems, Inc. ADR (a) | 1,810,103 | | 2,371,235 |
Mail.ru Group Ltd. GDR (Reg. S) | 1,047,500 | | 34,934,125 |
TOTAL BRITISH VIRGIN ISLANDS | | 37,305,360 |
Canada - 3.3% |
Alimentation Couche-Tard, Inc. Class B (sub. vtg.) | 769,500 | | 37,798,919 |
ARC Resources Ltd. (d) | 867,500 | | 21,063,204 |
Canadian Natural Resources Ltd. | 2,709,500 | | 81,658,022 |
Catamaran Corp. (a) | 500,600 | | 23,507,524 |
CGI Group, Inc. Class A (sub. vtg.) (a) | 1,238,000 | | 32,389,427 |
Fairfax Financial Holdings Ltd. (sub. vtg.) | 161,600 | | 59,949,353 |
|
| Shares | | Value |
Franco-Nevada Corp. | 853,100 | | $ 49,123,185 |
Goldcorp, Inc. | 1,829,000 | | 82,682,703 |
Painted Pony Petroleum Ltd. (a)(e)(f) | 2,485,600 | | 26,878,078 |
Painted Pony Petroleum Ltd.
Class A (a)(e) | 3,983,070 | | 43,070,995 |
Penn West Petroleum Ltd. | 1,779,000 | | 23,102,508 |
Petrobank Energy & Resources Ltd. (a) | 2,895,100 | | 39,770,485 |
Petrominerales Ltd. | 1,377,875 | | 11,050,592 |
Suncor Energy, Inc. | 3,662,400 | | 122,917,295 |
Tourmaline Oil Corp. (a) | 1,416,200 | | 46,793,091 |
TransForce, Inc. | 265,900 | | 4,853,424 |
Turquoise Hill Resources Ltd. (a) | 2,681,541 | | 20,969,047 |
TOTAL CANADA | | 727,577,852 |
Cayman Islands - 1.5% |
Baidu.com, Inc. sponsored ADR (a) | 1,158,900 | | 123,561,918 |
Haitian International Holdings Ltd. | 6,743,000 | | 8,326,464 |
Hengan International Group Co. Ltd. | 9,291,500 | | 84,642,022 |
HiSoft Technology International Ltd. ADR (a)(e) | 1,697,800 | | 17,640,142 |
Sands China Ltd. | 23,448,800 | | 88,197,176 |
TOTAL CAYMAN ISLANDS | | 322,367,722 |
Curacao - 0.4% |
Schlumberger Ltd. | 1,136,200 | | 78,999,986 |
Denmark - 3.0% |
Novo Nordisk A/S Series B | 3,675,339 | | 589,213,858 |
William Demant Holding A/S (a) | 957,003 | | 82,308,893 |
TOTAL DENMARK | | 671,522,751 |
France - 8.4% |
Alstom SA | 575,549 | | 19,657,043 |
Arkema SA | 862,900 | | 78,671,621 |
AXA SA | 4,419,200 | | 70,253,259 |
BNP Paribas SA | 5,146,376 | | 258,881,145 |
Bureau Veritas SA | 853,700 | | 90,657,451 |
Dassault Aviation SA (d) | 35,665 | | 32,151,011 |
Edenred SA | 1,660,790 | | 48,057,531 |
Essilor International SA | 1,576,620 | | 142,127,930 |
JCDecaux SA | 1,418,600 | | 30,026,271 |
LVMH Moet Hennessy - Louis Vuitton SA | 669,860 | | 108,877,176 |
PPR SA | 1,015,600 | | 178,565,583 |
Publicis Groupe SA | 1,516,800 | | 81,716,804 |
Sanofi SA | 6,424,876 | | 564,280,639 |
Schneider Electric SA | 784,600 | | 49,053,032 |
Vivendi SA | 5,276,023 | | 107,945,995 |
TOTAL FRANCE | | 1,860,922,491 |
Germany - 7.5% |
adidas AG | 1,561,780 | | 133,057,315 |
Allianz AG | 1,025,209 | | 127,115,366 |
BASF AG | 3,028,956 | | 250,987,987 |
Bayer AG | 3,101,862 | | 270,135,947 |
Brenntag AG | 181,900 | | 22,926,244 |
Common Stocks - continued |
| Shares | | Value |
Germany - continued |
CompuGROUP Holding AG | 1,457,200 | | $ 26,442,497 |
Deutsche Post AG | 2,678,237 | | 53,095,016 |
ElringKlinger AG | 1,020,828 | | 28,341,792 |
Fresenius Medical Care AG & Co. KGaA | 893,700 | | 62,795,180 |
Fresenius SE & Co. KGaA | 1,254,800 | | 143,123,994 |
GFK AG | 1,496,500 | | 68,141,256 |
Linde AG | 1,151,929 | | 193,726,193 |
SAP AG | 3,980,256 | | 290,252,414 |
TOTAL GERMANY | | 1,670,141,201 |
Hong Kong - 1.3% |
AIA Group Ltd. | 35,967,000 | | 142,474,810 |
Galaxy Entertainment Group Ltd. (a) | 24,081,000 | | 82,807,034 |
Henderson Land Development Co. Ltd. | 8,337,400 | | 57,769,741 |
TOTAL HONG KONG | | 283,051,585 |
India - 1.9% |
Apollo Hospitals Enterprise Ltd. | 150,707 | | 2,184,628 |
Bajaj Auto Ltd. | 1,103,493 | | 37,253,784 |
HDFC Bank Ltd. | 12,995,695 | | 152,595,202 |
Housing Development Finance Corp. Ltd. | 7,489,994 | | 106,123,907 |
ITC Ltd. | 11,354,613 | | 59,627,281 |
Mahindra & Mahindra Financial Services Ltd. | 2,167,276 | | 34,908,832 |
Shriram Transport Finance Co. Ltd. | 1,982,796 | | 23,037,727 |
TOTAL INDIA | | 415,731,361 |
Ireland - 0.6% |
Accenture PLC Class A | 1,065,300 | | 71,811,873 |
CRH PLC | 29,251 | | 544,470 |
Elan Corp. PLC sponsored ADR (a) | 2,930,000 | | 31,644,000 |
Ryanair Holdings PLC sponsored ADR | 687,400 | | 22,168,650 |
TOTAL IRELAND | | 126,168,993 |
Isle of Man - 0.0% |
3Legs Resources PLC (a)(e) | 6,268,300 | | 4,046,188 |
Italy - 1.6% |
ENI SpA | 4,415,600 | | 101,607,051 |
Fiat Industrial SpA | 6,028,692 | | 65,286,715 |
Prada SpA | 7,151,000 | | 58,314,876 |
Prysmian SpA | 343,100 | | 6,599,483 |
Saipem SpA | 2,745,899 | | 123,358,302 |
TOTAL ITALY | | 355,166,427 |
Japan - 14.0% |
ABC-Mart, Inc. | 1,076,900 | | 47,214,706 |
Aozora Bank Ltd. | 10,536,000 | | 29,695,603 |
Calbee, Inc. (d) | 1,087,800 | | 99,881,924 |
Credit Saison Co. Ltd. | 3,753,200 | | 82,417,131 |
Denso Corp. | 1,061,700 | | 33,235,479 |
Don Quijote Co. Ltd. | 3,234,900 | | 127,442,822 |
Fanuc Corp. | 701,400 | | 111,672,228 |
|
| Shares | | Value |
Fast Retailing Co. Ltd. | 294,300 | | $ 65,547,463 |
Hitachi Ltd. | 41,642,000 | | 220,650,957 |
Honda Motor Co. Ltd. | 6,828,800 | | 205,295,907 |
Hoya Corp. | 2,862,600 | | 57,947,658 |
Itochu Corp. | 6,655,500 | | 66,613,359 |
Japan Tobacco, Inc. | 10,242,400 | | 283,035,629 |
JS Group Corp. | 2,436,300 | | 53,865,332 |
JSR Corp. | 5,086,800 | | 87,169,515 |
Keyence Corp. | 714,210 | | 189,489,762 |
Mitsubishi UFJ Financial Group, Inc. | 16,874,900 | | 76,341,508 |
Nintendo Co. Ltd. | 200,200 | | 25,780,483 |
Nitto Denko Corp. | 950,300 | | 43,092,647 |
ORIX Corp. | 3,347,600 | | 343,859,700 |
Rakuten, Inc. | 26,046,300 | | 234,263,351 |
Seven & i Holdings Co., Ltd. | 5,480,100 | | 169,009,221 |
Seven Bank Ltd. | 12,099,900 | | 34,558,151 |
SHIMANO, Inc. | 1,070,100 | | 67,425,817 |
SMC Corp. | 714,100 | | 112,531,354 |
Softbank Corp. | 5,406,000 | | 171,125,666 |
Unicharm Corp. | 798,300 | | 43,200,000 |
Yahoo! Japan Corp. | 65,755 | | 22,626,705 |
TOTAL JAPAN | | 3,104,990,078 |
Korea (South) - 2.9% |
AMOREPACIFIC Corp. | 47,406 | | 53,913,937 |
Hyundai Motor Co. | 380,453 | | 78,336,364 |
LG Household & Health Care Ltd. | 59,599 | | 35,038,302 |
NHN Corp. | 472,201 | | 109,353,915 |
Orion Corp. | 136,504 | | 128,200,992 |
Samsung Electronics Co. Ltd. | 200,615 | | 241,035,356 |
TOTAL KOREA (SOUTH) | | 645,878,866 |
Mexico - 0.6% |
America Movil SAB de CV Series L sponsored ADR | 2,983,200 | | 75,445,128 |
Fomento Economico Mexicano SAB de CV sponsored ADR | 168,085 | | 15,230,182 |
Mexichem SAB de CV | 9,739,300 | | 48,265,097 |
TOTAL MEXICO | | 138,940,407 |
Netherlands - 2.7% |
AEGON NV | 25,624,900 | | 143,311,255 |
ASML Holding NV (Netherlands) | 1,802,100 | | 99,065,525 |
D.E. Master Blenders 1753 NV (a) | 7,368,227 | | 90,050,038 |
Gemalto NV | 600,000 | | 54,142,778 |
Heineken NV (Bearer) | 901,800 | | 55,597,210 |
NXP Semiconductors NV (a) | 2,449,083 | | 59,414,754 |
Randstad Holding NV | 364,500 | | 11,898,570 |
Unilever NV (Certificaten Van Aandelen) (Bearer) | 2,550,400 | | 93,739,027 |
TOTAL NETHERLANDS | | 607,219,157 |
Common Stocks - continued |
| Shares | | Value |
Norway - 1.0% |
DnB NOR ASA | 3,663,309 | | $ 45,748,794 |
Telenor ASA | 9,296,600 | | 182,791,444 |
TOTAL NORWAY | | 228,540,238 |
Russia - 0.1% |
Sberbank (Savings Bank of the Russian Federation) | 9,564,100 | | 27,998,140 |
Singapore - 0.2% |
Avago Technologies Ltd. | 613,700 | | 20,270,511 |
United Overseas Bank Ltd. | 2,086,000 | | 31,243,827 |
TOTAL SINGAPORE | | 51,514,338 |
South Africa - 0.7% |
Foschini Ltd. | 78,971 | | 1,146,588 |
Life Healthcare Group Holdings Ltd. | 6,906,900 | | 26,119,985 |
Nampak Ltd. | 6,576,500 | | 21,920,023 |
Naspers Ltd. Class N | 982,699 | | 63,798,111 |
Shoprite Holdings Ltd. | 605,000 | | 12,440,993 |
Tiger Brands Ltd. | 899,000 | | 28,575,066 |
TOTAL SOUTH AFRICA | | 154,000,766 |
Spain - 3.3% |
Amadeus IT Holding SA Class A | 2,634,200 | | 65,213,480 |
Banco Bilbao Vizcaya Argentaria SA | 7,668,545 | | 64,078,018 |
Grifols SA ADR | 2,728,831 | | 68,657,388 |
Inditex SA | 2,996,351 | | 382,313,432 |
Prosegur Compania de Seguridad SA (Reg.) | 17,924,093 | | 97,575,715 |
Repsol YPF SA | 2,810,006 | | 56,162,559 |
TOTAL SPAIN | | 734,000,592 |
Sweden - 1.2% |
ASSA ABLOY AB (B Shares) | 687,400 | | 22,913,679 |
Atlas Copco AB (A Shares) | 945,100 | | 23,239,580 |
H&M Hennes & Mauritz AB (B Shares) | 669,105 | | 22,646,817 |
Svenska Handelsbanken AB (A Shares) | 2,160,300 | | 73,997,823 |
Swedbank AB (A Shares) | 4,213,700 | | 78,138,537 |
Swedish Match Co. AB | 1,552,600 | | 52,901,084 |
TOTAL SWEDEN | | 273,837,520 |
Switzerland - 5.3% |
Kuehne & Nagel International AG | 378,820 | | 44,215,327 |
Nestle SA | 6,315,075 | | 400,752,639 |
Roche Holding AG (participation certificate) | 421,264 | | 81,014,047 |
Schindler Holding AG (Reg.) | 766,553 | | 99,183,546 |
SGS SA (Reg.) | 21,720 | | 45,991,453 |
Syngenta AG (Switzerland) | 570,230 | | 222,326,709 |
UBS AG | 12,221,701 | | 183,369,444 |
Zurich Financial Services AG | 403,865 | | 99,524,340 |
TOTAL SWITZERLAND | | 1,176,377,505 |
|
| Shares | | Value |
Taiwan - 0.5% |
HIWIN Technologies Corp. | 120,400 | | $ 774,913 |
Taiwan Semiconductor Manufacturing Co. Ltd. sponsored ADR | 6,221,700 | | 98,925,030 |
TOTAL TAIWAN | | 99,699,943 |
United Kingdom - 16.5% |
Aggreko PLC | 652,600 | | 22,642,365 |
Babcock International Group PLC | 1,375,600 | | 21,710,373 |
Barclays PLC | 41,612,242 | | 153,871,043 |
Barratt Developments PLC (a) | 4,833,700 | | 14,789,527 |
BG Group PLC | 4,475,579 | | 82,877,793 |
British American Tobacco PLC sponsored ADR | 1,809,400 | | 179,781,984 |
Capita Group PLC | 4,091,300 | | 47,734,885 |
Compass Group PLC | 2,313,400 | | 25,386,095 |
Diageo PLC | 1,817,649 | | 51,963,917 |
Domino's Pizza UK & IRL PLC | 3,501,400 | | 28,562,692 |
Filtrona PLC | 3,799,388 | | 35,132,134 |
GlaxoSmithKline PLC | 12,955,500 | | 290,299,915 |
Hikma Pharmaceuticals PLC | 2,465,284 | | 29,419,914 |
HSBC Holdings PLC sponsored ADR | 8,373,200 | | 413,301,152 |
IMI PLC | 770,400 | | 11,866,659 |
Imperial Tobacco Group PLC | 3,167,193 | | 119,598,750 |
Inchcape PLC | 8,759,127 | | 56,822,866 |
InterContinental Hotel Group PLC | 2,038,600 | | 50,438,619 |
Kingfisher PLC | 4,968,500 | | 23,211,869 |
London Stock Exchange Group PLC | 1,389,500 | | 21,873,691 |
Meggitt PLC | 8,046,700 | | 50,123,498 |
National Grid PLC | 3,094,757 | | 35,294,341 |
Next PLC | 3,481,200 | | 200,330,267 |
Persimmon PLC | 1,032,600 | | 13,247,548 |
PZ Cussons PLC Class L (d) | 2,710,800 | | 14,807,864 |
Reckitt Benckiser Group PLC | 4,305,687 | | 260,561,340 |
Rolls-Royce Group PLC | 14,222,900 | | 196,126,591 |
Rolls-Royce Group PLC Class C | 1,080,940,400 | | 1,744,368 |
Royal Dutch Shell PLC Class B sponsored ADR (d) | 7,285,137 | | 514,549,226 |
Serco Group PLC | 4,949,706 | | 45,249,686 |
Standard Chartered PLC (United Kingdom) | 2,001,219 | | 47,263,252 |
Taylor Wimpey PLC | 51,652,000 | | 50,928,937 |
Tesco PLC | 5,203,800 | | 26,859,827 |
Travis Perkins PLC | 1,369,800 | | 23,873,559 |
Vodafone Group PLC sponsored ADR | 16,222,400 | | 441,573,728 |
Whitbread PLC | 1,318,845 | | 50,014,724 |
TOTAL UNITED KINGDOM | | 3,653,834,999 |
United States of America - 4.7% |
Allergan, Inc. | 486,500 | | 43,746,080 |
Apple, Inc. | 207,800 | | 123,661,780 |
Beam, Inc. | 601,200 | | 33,402,672 |
Common Stocks - continued |
| Shares | | Value |
United States of America - continued |
Cognizant Technology Solutions Corp. Class A (a) | 560,400 | | $ 37,350,660 |
Cummins, Inc. | 369,900 | | 34,615,242 |
D.R. Horton, Inc. | 535,300 | | 11,219,888 |
Facebook, Inc. Class B (a)(g) | 1,288,142 | | 24,479,207 |
Freeport-McMoRan Copper & Gold, Inc. | 551,500 | | 21,442,320 |
Gilead Sciences, Inc. (a) | 933,600 | | 62,700,576 |
Las Vegas Sands Corp. | 966,900 | | 44,902,836 |
MasterCard, Inc. Class A | 225,360 | | 103,875,185 |
McGraw-Hill Companies, Inc. | 1,285,000 | | 71,034,800 |
Noble Energy, Inc. | 769,828 | | 73,141,358 |
Polycom, Inc. (a) | 2,852,000 | | 28,577,040 |
PriceSmart, Inc. | 298,900 | | 24,805,711 |
Virgin Media, Inc. (d) | 1,142,600 | | 37,408,724 |
ViroPharma, Inc. (a) | 1,170,500 | | 29,555,125 |
Visa, Inc. Class A | 886,800 | | 123,052,368 |
VMware, Inc. Class A (a) | 275,000 | | 23,311,750 |
Workday, Inc. | 239,850 | | 11,632,725 |
Yum! Brands, Inc. | 1,174,800 | | 82,365,228 |
TOTAL UNITED STATES OF AMERICA | | 1,046,281,275 |
TOTAL COMMON STOCKS (Cost $17,413,567,380) |
20,681,004,195
|
Nonconvertible Preferred Stocks - 1.4% |
| | | |
Germany - 1.4% |
Henkel AG & Co. KGaA | 757,300 | | 60,474,799 |
ProSiebenSat.1 Media AG | 2,050,900 | | 57,152,892 |
Volkswagen AG | 919,826 | | 190,280,303 |
TOTAL NONCONVERTIBLE PREFERRED STOCKS (Cost $185,494,906) |
307,907,994
|
Master Notes - 0.0% |
| Principal Amount | | |
Canada - 0.0% |
OZ Optics Ltd. 5% 11/5/14 (g)
(Cost $183,060) | | $ 180,662 | |
180,662
|
Money Market Funds - 6.7% |
| Shares | | Value |
Fidelity Cash Central Fund, 0.19% (b) | 1,164,258,182 | | $ 1,164,258,182 |
Fidelity Securities Lending Cash Central Fund, 0.19% (b)(c) | 315,781,287 | | 315,781,287 |
TOTAL MONEY MARKET FUNDS (Cost $1,480,039,469) |
1,480,039,469
|
TOTAL INVESTMENT
PORTFOLIO - 101.4% (Cost $19,079,284,815) | 22,469,132,320 |
NET OTHER ASSETS (LIABILITIES) - (1.4)% | (314,058,785) |
NET ASSETS - 100% | $ 22,155,073,535 |
Legend |
(a) Non-income producing |
(b) Affiliated fund that is available only to investment companies and other accounts managed by Fidelity Investments. The rate quoted is the annualized seven-day yield of the fund at period end. A complete unaudited listing of the fund's holdings as of its most recent quarter end is available upon request. In addition, each Fidelity Central Fund's financial statements, which are not covered by the Fund's Report of Independent Registered Public Accounting Firm, are available on the SEC's website or upon request. |
(c) Investment made with cash collateral received from securities on loan. |
(d) Security or a portion of the security is on loan at period end. |
(e) Affiliated company |
(f) Security exempt from registration under Rule 144A of the Securities Act of 1933. These securities may be resold in transactions exempt from registration, normally to qualified institutional buyers. At the end of the period, the value of these securities amounted to $26,878,078 or 0.1% of net assets. |
(g) Restricted securities - Investment in securities not registered under the Securities Act of 1933 (excluding 144A issues). At the end of the period, the value of restricted securities (excluding 144A issues) amounted to $24,659,869 or 0.1% of net assets. |
Additional information on each restricted holding is as follows: |
Security | Acquisition Date | Acquisition Cost |
Facebook, Inc. Class B | 3/31/11 | $ 32,203,550 |
OZ Optics Ltd. 5% 11/5/14 | 11/5/10 | $ 185,227 |
Affiliated Central Funds |
Information regarding fiscal year to date income earned by the Fund from investments in Fidelity Central Funds is as follows: |
Fund | Income earned |
Fidelity Cash Central Fund | $ 1,367,879 |
Fidelity Securities Lending Cash Central Fund | 15,556,493 |
Total | $ 16,924,372 |
Other Affiliated Issuers |
An affiliated company is a company in which the Fund has ownership of at least 5% of the voting securities. Fiscal year to date transactions with companies which are or were affiliates are as follows: |
Affiliate | Value,
beginning of
period | Purchases | Sales
Proceeds | Dividend
Income | Value,
end of
period |
3Legs Resources PLC | $ 13,837,749 | $ - | $ 109,582 | $ - | $ 4,046,188 |
HiSoft Technology International Ltd. ADR | 21,372,832 | - | 439,582 | - | 17,640,142 |
Painted Pony Petroleum Ltd. | 30,395,209 | - | - | - | 26,878,078 |
Painted Pony Petroleum Ltd. Class A | 44,553,022 | 3,256,743 | 498,801 | - | 43,070,995 |
Schweitzer-Mauduit International, Inc. | 113,092,492 | - | 110,115,959 | 598,416 | - |
Total | $ 223,251,304 | $ 3,256,743 | $ 111,163,924 | $ 598,416 | $ 91,635,403 |
Other Information |
Categorizations in the Schedule of Investments are based on country or territory of incorporation. |
The following is a summary of the inputs used, as of October 31, 2012, involving the Fund's assets and liabilities carried at fair value. The inputs or methodology used for valuing securities may not be an indication of the risk associated with investing in those securities. For more information on valuation inputs, and their aggregation into the levels used in the tables below, please refer to the Security Valuation section in the accompanying Notes to Financial Statements. |
Valuation Inputs at Reporting Date: |
Description | Total | Level 1 | Level 2 | Level 3 |
Investments in Securities: | | | | |
Equities: | | | | |
Consumer Discretionary | $ 3,394,535,553 | $ 3,090,296,203 | $ 304,239,350 | $ - |
Consumer Staples | 3,036,614,462 | 2,413,425,270 | 623,189,192 | - |
Energy | 1,489,412,010 | 1,387,804,959 | 101,607,051 | - |
Financials | 3,336,946,273 | 2,563,379,803 | 773,566,470 | - |
Health Care | 2,769,387,703 | 1,218,968,141 | 1,550,419,562 | - |
Industrials | 1,724,693,256 | 1,724,693,256 | - | - |
Information Technology | 2,312,818,763 | 1,899,021,617 | 413,797,146 | - |
Materials | 1,791,537,146 | 1,568,665,967 | 222,871,179 | - |
Telecommunication Services | 1,038,653,153 | 1,038,653,153 | - | - |
Utilities | 94,313,870 | 59,019,529 | 35,294,341 | - |
Master Notes | 180,662 | - | - | 180,662 |
Money Market Funds | 1,480,039,469 | 1,480,039,469 | - | - |
Total Investments in Securities: | $ 22,469,132,320 | $ 18,443,967,367 | $ 4,024,984,291 | $ 180,662 |
The following is a summary of transfers between Level 1 and Level 2 for the period ended October 31, 2012. Transfers are assumed to have occurred at the beginning of the period, and are primarily attributable to the valuation techniques used for foreign equity securities, as discussed in the accompanying Notes to Financial Statements. |
Transfers | Total |
Level 1 to Level 2 | $ 0 |
Level 2 to Level 1 | $ 3,771,433,057 |
See accompanying notes which are an integral part of the financial statements.
Annual Report
Fidelity Diversified International Fund
Statement of Assets and Liabilities
| October 31, 2012 |
| | |
Assets | | |
Investment in securities, at value (including securities loaned of $309,743,462) - See accompanying schedule: Unaffiliated issuers (cost $17,486,695,145) | $ 20,897,457,448 | |
Fidelity Central Funds (cost $1,480,039,469) | 1,480,039,469 | |
Other affiliated issuers (cost $112,550,201) | 91,635,403 | |
Total Investments (cost $19,079,284,815) | | $ 22,469,132,320 |
Foreign currency held at value (cost $2,562) | | 2,562 |
Receivable for investments sold
Regular delivery | | 18,145,561 |
Delayed delivery | | 3,659,139 |
Receivable for fund shares sold | | 20,336,178 |
Dividends receivable | | 57,001,656 |
Interest receivable | | 26,988 |
Distributions receivable from Fidelity Central Funds | | 349,490 |
Other receivables | | 2,236,967 |
Total assets | | 22,570,890,861 |
| | |
Liabilities | | |
Payable for investments purchased | $ 40,876,867 | |
Payable for fund shares redeemed | 38,788,247 | |
Accrued management fee | 15,853,686 | |
Other affiliated payables | 2,878,721 | |
Other payables and accrued expenses | 1,638,518 | |
Collateral on securities loaned, at value | 315,781,287 | |
Total liabilities | | 415,817,326 |
| | |
Net Assets | | $ 22,155,073,535 |
Net Assets consist of: | | |
Paid in capital | | $ 21,443,322,870 |
Undistributed net investment income | | 320,513,134 |
Accumulated undistributed net realized gain (loss) on investments and foreign currency transactions | | (2,999,563,657) |
Net unrealized appreciation (depreciation) on investments and assets and liabilities in foreign currencies | | 3,390,801,188 |
Net Assets | | $ 22,155,073,535 |
| | |
Diversified International:
Net Asset Value, offering price and redemption price per share ($13,269,769,305 ÷ 456,467,556 shares) | | $ 29.07 |
| | |
Class K:
Net Asset Value, offering price and redemption price per share ($8,885,304,230 ÷ 305,725,561 shares) | | $ 29.06 |
Statement of Operations
| Year ended October 31, 2012 |
| | |
Investment Income | | |
Dividends (including $598,416 earned from other affiliated issuers) | | $ 598,692,833 |
Interest | | 10,226 |
Income from Fidelity Central Funds | | 16,924,372 |
Income before foreign taxes withheld | | 615,627,431 |
Less foreign taxes withheld | | (41,147,575) |
Total income | | 574,479,856 |
| | |
Expenses | | |
Management fee
Basic fee | $ 161,089,886 | |
Performance adjustment | 12,019,269 | |
Transfer agent fees | 35,456,624 | |
Accounting and security lending fees | 2,401,416 | |
Custodian fees and expenses | 2,567,810 | |
Independent trustees' compensation | 152,451 | |
Appreciation in deferred trustee compensation account | 38 | |
Registration fees | 224,871 | |
Audit | 197,504 | |
Legal | 142,881 | |
Miscellaneous | 274,157 | |
Total expenses before reductions | 214,526,907 | |
Expense reductions | (2,425,924) | 212,100,983 |
Net investment income (loss) | | 362,378,873 |
Realized and Unrealized Gain (Loss) Net realized gain (loss) on: | | |
Investment securities: | | |
Unaffiliated issuers | 499,550,522 | |
Other affiliated issuers | 25,672,181 | |
Foreign currency transactions | (2,542,356) | |
Total net realized gain (loss) | | 522,680,347 |
Change in net unrealized appreciation (depreciation) on: Investment securities (net of increase in deferred foreign taxes of $8,309) | 779,239,745 | |
Assets and liabilities in foreign currencies | (1,792,174) | |
Total change in net unrealized appreciation (depreciation) | | 777,447,571 |
Net gain (loss) | | 1,300,127,918 |
Net increase (decrease) in net assets resulting from operations | | $ 1,662,506,791 |
See accompanying notes which are an integral part of the financial statements.
Annual Report
Fidelity Diversified International Fund
Financial Statements - continued
Statement of Changes in Net Assets
| Year ended
October 31,
2012 | Year ended
October 31,
2011 |
Increase (Decrease) in Net Assets | | |
Operations | | |
Net investment income (loss) | $ 362,378,873 | $ 581,959,099 |
Net realized gain (loss) | 522,680,347 | 1,881,502,446 |
Change in net unrealized appreciation (depreciation) | 777,447,571 | (3,646,283,921) |
Net increase (decrease) in net assets resulting from operations | 1,662,506,791 | (1,182,822,376) |
Distributions to shareholders from net investment income | (460,432,289) | (554,171,382) |
Distributions to shareholders from net realized gain | - | (93,780,346) |
Total distributions | (460,432,289) | (647,951,728) |
Share transactions - net increase (decrease) | (4,619,314,396) | (7,417,526,738) |
Redemption fees | 414,440 | 964,713 |
Total increase (decrease) in net assets | (3,416,825,454) | (9,247,336,129) |
| | |
Net Assets | | |
Beginning of period | 25,571,898,989 | 34,819,235,118 |
End of period (including undistributed net investment income of $320,513,134 and undistributed net investment income of $418,909,977, respectively) | $ 22,155,073,535 | $ 25,571,898,989 |
Financial Highlights - Diversified International
Years ended October 31, | 2012 | 2011 | 2010 | 2009 | 2008 |
Selected Per-Share Data | | | | | |
Net asset value, beginning of period | $ 27.49 | $ 29.49 | $ 26.86 | $ 21.96 | $ 45.41 |
Income from Investment Operations | | | | | |
Net investment income (loss) B | .42 | .53 E | .37 | .35 | .55 |
Net realized and unrealized gain (loss) | 1.65 | (1.99) | 2.61 | 4.86 | (20.96) |
Total from investment operations | 2.07 | (1.46) | 2.98 | 5.21 | (20.41) |
Distributions from net investment income | (.49) | (.46) | (.35) | (.31) | (.47) |
Distributions from net realized gain | - | (.08) | - | - | (2.57) |
Total distributions | (.49) | (.54) | (.35) | (.31) | (3.04) |
Redemption fees added to paid in capital B,G | - | - | - | - | - |
Net asset value, end of period | $ 29.07 | $ 27.49 | $ 29.49 | $ 26.86 | $ 21.96 |
Total Return A | 7.72% | (5.07)% | 11.15% | 24.32% | (48.04)% |
Ratios to Average Net Assets C,F | | | | | |
Expenses before reductions | 1.01% | .90% | .98% | 1.01% | 1.04% |
Expenses net of fee waivers, if any | 1.01% | .89% | .98% | 1.01% | 1.04% |
Expenses net of all reductions | .99% | .87% | .96% | .99% | 1.02% |
Net investment income (loss) | 1.53% | 1.78% E | 1.34% | 1.58% | 1.53% |
Supplemental Data | | | | | |
Net assets, end of period (000 omitted) | $ 13,269,769 | $ 17,285,369 | $ 26,527,229 | $ 30,998,270 | $ 28,274,961 |
Portfolio turnover rate D | 35% | 45% | 57% | 54% | 49% |
A Total returns would have been lower if certain expenses had not been reduced during the applicable periods shown.
B Calculated based on average shares outstanding during the period.
C Fees and expenses of any underlying Fidelity Central Funds are not included in the Fund's expense ratio. The Fund indirectly bears its proportionate share of the expenses of any underlying Fidelity Central Funds.
D Amount does not include the portfolio activity of any underlying Fidelity Central Funds.
E Investment income per share reflects a large, non-recurring dividend which amounted to $.10 per share. Excluding this non-recurring dividend, the ratio of net investment income (loss) to average net assets would have been 1.44%.
F Expense ratios reflect operating expenses of the class. Expenses before reductions do not reflect amounts reimbursed by the investment adviser or reductions from brokerage service arrangements or reductions from other expense offset arrangements and do not represent the amount paid by the class during periods when reimbursements or reductions occur. Expenses net of fee waivers reflect expenses after reimbursement by the investment adviser but prior to reductions from brokerage service arrangements or other expense offset arrangements. Expenses net of all reductions represent the net expenses paid by the class.
G Amount represents less than $.01 per share.
See accompanying notes which are an integral part of the financial statements.
Annual Report
Financial Highlights - Class K
Years ended October 31, | 2012 | 2011 | 2010 | 2009 | 2008 H |
Selected Per-Share Data | | | | | |
Net asset value, beginning of period | $ 27.51 | $ 29.51 | $ 26.89 | $ 21.98 | $ 38.39 |
Income from Investment Operations | | | | | |
Net investment income (loss) D | .47 | .58 G | .42 | .42 | .16 |
Net realized and unrealized gain (loss) | 1.63 | (1.97) | 2.61 | 4.85 | (16.57) |
Total from investment operations | 2.10 | (1.39) | 3.03 | 5.27 | (16.41) |
Distributions from net investment income | (.55) | (.53) | (.41) | (.36) | - |
Distributions from net realized gain | - | (.08) | - | - | - |
Total distributions | (.55) | (.61) | (.41) | (.36) | - |
Redemption fees added to paid in capital D,J | - | - | - | - | - |
Net asset value, end of period | $ 29.06 | $ 27.51 | $ 29.51 | $ 26.89 | $ 21.98 |
Total Return B,C | 7.86% | (4.87)% | 11.33% | 24.64% | (42.75)% |
Ratios to Average Net Assets E,I | | | | | |
Expenses before reductions | .84% | .73% | .79% | .77% | .88% A |
Expenses net of fee waivers, if any | .84% | .72% | .79% | .77% | .88% A |
Expenses net of all reductions | .83% | .70% | .77% | .76% | .87% A |
Net investment income (loss) | 1.70% | 1.95% G | 1.54% | 1.81% | 1.45% A |
Supplemental Data | | | | | |
Net assets, end of period (000 omitted) | $ 8,885,304 | $ 8,115,192 | $ 7,697,405 | $ 4,713,909 | $ 932,275 |
Portfolio turnover rate F | 35% | 45% | 57% | 54% | 49% |
A Annualized
B Total returns for periods of less than one year are not annualized.
C Total returns would have been lower if certain expenses had not been reduced during the applicable periods shown.
D Calculated based on average shares outstanding during the period.
E Fees and expenses of any underlying Fidelity Central Funds are not included in the Fund's expense ratio. The Fund indirectly bears its proportionate share of the expenses of any underlying Fidelity Central Funds.
F Amount does not include the portfolio activity of any underlying Fidelity Central Funds.
G Investment income per share reflects a large, non-recurring dividend which amounted to $.10 per share. Excluding this non-recurring dividend, the ratio of net investment income (loss) to average net assets would have been 1.61%.
H For the period May 9, 2008 (commencement of sale of shares) to October 31, 2008.
I Expense ratios reflect operating expenses of the class. Expenses before reductions do not reflect amounts reimbursed by the investment adviser or reductions from brokerage service arrangements or reductions from other expense offset arrangements and do not represent the amount paid by the class during periods when reimbursements or reductions occur. Expense ratios before reductions for start-up periods may not be representative of longer-term operating periods. Expenses net of fee waivers reflect expenses after reimbursement by the investment adviser but prior to reductions from brokerage service arrangements or other expense offset arrangements. Expenses net of all reductions represent the net expenses paid by the class.
J Amount represents less than $.01 per share.
See accompanying notes which are an integral part of the financial statements.
Annual Report
Fidelity Diversified International Fund
Notes to Financial Statements
For the period ended October 31, 2012
1. Organization.
Fidelity Diversified International Fund (the Fund) is a fund of Fidelity Investment Trust (the Trust) and is authorized to issue an unlimited number of shares. The Trust is registered under the Investment Company Act of 1940, as amended (the 1940 Act), as an open-end management investment company organized as a Massachusetts business trust. The Fund offers Diversified International and Class K shares, each of which has equal rights as to assets and voting privileges. The Fund offered Class F shares during the period June 26, 2009 through December 16, 2011 and all outstanding shares were redeemed by December 16, 2011. Each class has exclusive voting rights with respect to matters that affect that class. Investment income, realized and unrealized capital gains and losses, the common expenses of the Fund, and certain fund-level expense reductions, if any, are allocated on a pro-rata basis to each class based on the relative net assets of each class to the total net assets of the Fund. Each class differs with respect to transfer agent fees incurred. Certain expense reductions may also differ by class. The Fund's investments in emerging markets can be subject to social, economic, regulatory, and political uncertainties and can be extremely volatile.
2. Investments in Fidelity Central Funds.
The Fund invests in Fidelity Central Funds, which are open-end investment companies available only to other investment companies and accounts managed by Fidelity Management & Research Company (FMR) and its affiliates. The Fund's Schedule of Investments lists each of the Fidelity Central Funds held as of period end, as an investment of the Fund, but does not include the underlying holdings of each Fidelity Central Fund. As an Investing Fund, the Fund indirectly bears its proportionate share of the expenses of the underlying Fidelity Central Funds.
The Money Market Central Funds seek preservation of capital and current income and are managed by Fidelity Investments Money Management, Inc. (FIMM), an affiliate of FMR.
A complete unaudited list of holdings for each Fidelity Central Fund is available upon request or at the Securities and Exchange Commission (the SEC) web site at www.sec.gov. In addition, the financial statements of the Fidelity Central Funds, which are not covered by the Fund's Report of Independent Registered Public Accounting Firm, are available on the SEC web site or upon request.
3. Significant Accounting Policies.
The financial statements have been prepared in conformity with accounting principles generally accepted in the United States of America (GAAP), which require management to make certain estimates and assumptions at the date of the financial statements. Actual results could differ from those estimates. Subsequent events, if any, through the date that the financial statements were issued have been evaluated in the preparation of the financial statements. The following summarizes the significant accounting policies of the Fund:
Security Valuation. Investments are valued as of 4:00 p.m. Eastern time on the last calendar day of the period. In accordance with valuation policies and procedures approved by the Board of Trustees (the Board), the Fund attempts to obtain prices from one or more third party pricing vendors or brokers to value its investments. When current market prices, quotations or rates are not readily available or reliable, securities will be fair valued in good faith by the FMR Fair Value Committee (the Committee), in accordance with procedures adopted by the Fund's Board. Factors used in determining fair value vary by security type and may include market or security specific events, changes in interest rates and credit quality. The frequency with which these procedures are used cannot be predicted and they may be utilized to a significant extent. The Committee oversees the Fund's valuation policies and procedures and is responsible for approving and reporting to the Board all fair value determinations.
The Fund categorizes the inputs to valuation techniques used to value its investments into a disclosure hierarchy consisting of three levels as shown below:
Level 1 - quoted prices in active markets for identical investments
Level 2 - other significant observable inputs (including quoted prices for similar investments, interest rates, prepayment speeds, etc.)
Level 3 - unobservable inputs (including the Fund's own assumptions based on the best information available)
Valuation techniques used to value the Fund's investments by major category are as follows:
Equity securities, including restricted securities, for which market quotations are readily available, are valued at the last reported sale price or official closing price as reported by a third party pricing vendor on the primary market or exchange on which they are traded and are categorized as Level 1 in the hierarchy. In the event there were no sales during the day or closing prices are not available, securities are valued at the last quoted bid price or may be valued using the last available price and are generally categorized as Level 2 in the hierarchy. For foreign equity securities, when significant market or security specific events arise, comparisons to the valuation of American Depositary Receipts (ADRs), futures contracts, Exchange-Traded Funds (ETFs) and certain indexes as well as quoted prices for similar securities are used and are categorized as Level 2 in the hierarchy. Utilizing these techniques may result in transfers between Level 1 and Level 2. For restricted equity securities and private placements where observable inputs are limited, assumptions about market activity and risk are used and these securities are generally categorized as Level 3 in the hierarchy.
Annual Report
Fidelity Diversified International Fund
Notes to Financial Statements - continued
3. Significant Accounting Policies - continued
Security Valuation - continued
Debt securities, including restricted securities, are valued based on evaluated prices received from third party pricing vendors or from brokers who make markets in such securities. For master notes, pricing vendors utilize matrix pricing which considers yield or price of bonds of comparable quality, coupon, maturity and type as well as broker-supplied prices and are generally categorized as Level 2 in the hierarchy. When independent prices are unavailable or unreliable, debt securities may be valued utilizing pricing methodologies which consider similar factors that would be used by third party pricing vendors. These are generally categorized as Level 2 in the hierarchy but may be Level 3 depending on the circumstances.
Investments in open-end mutual funds, including the Fidelity Central Funds, are valued at their closing net asset value (NAV) each business day and are categorized as Level 1 in the hierarchy.
Changes in valuation techniques may result in transfers in or out of an assigned level within the disclosure hierarchy. The aggregate value of investments by input level, as of October 31, 2012, including information on transfers between Levels 1 and 2, is included at the end of the Fund's Schedule of Investments.
Foreign Currency Translation. The Fund may use foreign currency contracts to facilitate transactions in foreign-denominated securities. Gains and losses from these transactions may arise from changes in the value of the foreign currency or if the counterparties do not perform under the contracts' terms.
Foreign-denominated assets, including investment securities, and liabilities are translated into U.S. dollars at the exchange rates at period end. Purchases and sales of investment securities, income and dividends received and expenses denominated in foreign currencies are translated into U.S. dollars at the exchange rate in effect on the transaction date.
The effects of exchange rate fluctuations on investments are included with the net realized and unrealized gain (loss) on investment securities. Other foreign currency transactions resulting in realized and unrealized gain (loss) are disclosed separately.
Investment Transactions and Income. For financial reporting purposes, the Fund's investment holdings and NAV include trades executed through the end of the last business day of the period. The NAV per share for processing shareholder transactions is calculated as of the close of business of the New York Stock Exchange (NYSE), normally 4:00 p.m. Eastern time and includes trades executed through the end of the prior business day. Gains and losses on securities sold are determined on the basis of identified cost and may include proceeds received from litigation. Dividend income is recorded on the ex-dividend date, except for certain dividends from foreign securities where the ex-dividend date may have passed, which are recorded as soon as the Fund is informed of the ex-dividend date. Non-cash dividends included in dividend income, if any, are recorded at the fair market value of the securities received. Interest income and distributions from the Fidelity Central Funds are accrued as earned. Distributions received on securities that represent a return of capital or capital gain are recorded as a reduction of cost of investments and/or as a realized gain. The Fund estimates the components of distributions received that may be considered return of capital distributions or capital gain distributions. Interest income includes coupon interest and amortization of premium and accretion of discount on debt securities. Investment income is recorded net of foreign taxes withheld where recovery of such taxes is uncertain.
Expenses. Expenses directly attributable to a fund are charged to that fund. Expenses attributable to more than one fund are allocated among the respective funds on the basis of relative net assets or other appropriate methods. Expense estimates are accrued in the period to which they relate and adjustments are made when actual amounts are known.
Deferred Trustee Compensation. Under a Deferred Compensation Plan (the Plan), independent Trustees may elect to defer receipt of a portion of their annual compensation. Deferred amounts are invested in a cross-section of Fidelity funds, are marked-to-market and remain in the Fund until distributed in accordance with the Plan. The investment of deferred amounts and the offsetting payable to the Trustees are included in the accompanying Statement of Assets and Liabilities.
Income Tax Information and Distributions to Shareholders. Each year, the Fund intends to qualify as a regulated investment company under Subchapter M of the Internal Revenue Code, including distributing substantially all of its taxable income and realized gains. As a result, no provision for income taxes is required. As of October 31, 2012, the Fund did not have any unrecognized tax benefits in the financial statements; nor is the Fund aware of any tax positions for which it is reasonably possible that the total amounts of unrecognized tax benefits will significantly change in the next twelve months. The Fund files a U.S. federal tax return, in addition to state and local tax returns as required. A fund's federal income tax returns are subject to examination by the Internal Revenue Service (IRS) for a period of three fiscal years after they are filed. State and local tax returns may be subject to examination for an additional fiscal year depending on the jurisdiction. Foreign taxes are provided for based on the Fund's understanding of the tax rules and rates that exist in the foreign markets in which it invests.
Annual Report
3. Significant Accounting Policies - continued
Income Tax Information and Distributions to Shareholders - continued
Distributions are declared and recorded on the ex-dividend date. Income dividends and capital gain distributions are declared separately for each class. Income and capital gain distributions are determined in accordance with income tax regulations, which may differ from GAAP.
Capital accounts within the financial statements are adjusted for permanent book-tax differences. These adjustments have no impact on net assets or the results of operations. Temporary book-tax differences will reverse in a subsequent period.
Book-tax differences are primarily due to foreign currency transactions, certain foreign taxes, passive foreign investment companies (PFIC), redemptions in kind, deferred trustees compensation, capital loss carryforwards and losses deferred due to wash sales.
The federal tax cost of investment securities and unrealized appreciation (depreciation) as of period end were as follows:
Gross unrealized appreciation | $ 4,187,321,081 |
Gross unrealized depreciation | (944,082,744) |
Net unrealized appreciation (depreciation) on securities and other investments | $ 3,243,238,337 |
| |
Tax Cost | $ 19,225,893,983 |
The tax-based components of distributable earnings as of period end were as follows:
Undistributed ordinary income | $ 371,274,366 |
Capital loss carryforward | $ (2,902,796,078) |
Net unrealized appreciation (depreciation) | $ 3,244,192,020 |
Capital loss carryforwards are only available to offset future capital gains of the Fund to the extent provided by regulations and may be limited. Under the Regulated Investment Company Modernization Act of 2010 (the Act), the Fund is permitted to carry forward capital losses incurred in taxable years beginning after December 22, 2010 for an unlimited period and such capital losses are required to be used prior to any losses that expire. Capital loss carryforwards were as follows:
Fiscal year of expiration | |
2017 | $ (2,283,224,226) |
2018 | (619,571,852) |
Total capital loss carryforward | $ (2,902,796,078) |
The tax character of distributions paid was as follows:
| October 31, 2012 | October 31, 2011 |
Ordinary Income | $ 460,432,289 | $ 647,951,728 |
Short-Term Trading (Redemption) Fees. Shares held by investors in the Fund less than 30 days are subject to a redemption fee equal to 1.00% of the net asset value of shares redeemed. All redemption fees, which reduce the proceeds of the shareholder redemption, are retained by the Fund and accounted for as an addition to paid in capital.
Delayed Delivery Transactions and When-Issued Securities. During the period, the Fund transacted in securities on a delayed delivery or when-issued basis. Payment and delivery may take place after the customary settlement period for that security. The price of the underlying securities and the date when the securities will be delivered and paid for are fixed at the time the transaction is negotiated. The Fund may receive compensation for interest forgone in the purchase of a delayed delivery or when-issued security. With respect to purchase commitments, the Fund identifies securities as segregated in its records with a value at least equal to the amount of the commitment. Losses may arise due to changes in the value of the underlying securities or if the counterparty does not perform under the contract's terms, or if the issuer does not issue the securities due to political, economic, or other factors.
Restricted Securities. The Fund may invest in securities that are subject to legal or contractual restrictions on resale. These securities generally may be resold in transactions exempt from registration or to the public if the securities are registered. Disposal of these securities may involve time-consuming negotiations and expense, and prompt sale at an acceptable price may be difficult. Information regarding restricted securities is included at the end of the Fund's Schedule of Investments.
Annual Report
Fidelity Diversified International Fund
Notes to Financial Statements - continued
3. Significant Accounting Policies - continued
New Accounting Pronouncement. In December 2011, the Financial Accounting Standards Board issued Accounting Standard Update No. 2011-11, Disclosures about Offsetting Assets and Liabilities. The update creates new disclosure requirements requiring entities to disclose both gross and net information for derivatives and other financial instruments that are either offset in the Statement of Assets and Liabilities or subject to an enforceable master netting arrangement or similar agreement. The disclosure requirements are effective for annual reporting periods beginning on or after January 1, 2013, and interim periods within those annual periods. Management is currently evaluating the impact of the update's adoption on the Fund's financial statement disclosures.
4. Purchases and Sales of Investments.
Purchases and sales of securities, other than short-term securities, aggregated $7,594,576,057 and $12,604,465,054, respectively.
Securities delivered through in-kind redemptions totaled $323,156,811. Realized gain of $94,833,623 on securities delivered through in-kind redemptions is included in the accompanying Statement of Operations as realized gain or loss on investment securities and is not taxable to the fund.
5. Fees and Other Transactions with Affiliates.
Management Fee. FMR and its affiliates provide the Fund with investment management related services for which the Fund pays a monthly management fee. The management fee is the sum of an individual fund fee rate that is based on an annual rate of .45% of the Fund's average net assets and an annualized group fee rate that averaged .26% during the period. The group fee rate is based upon the average net assets of all the mutual funds advised by FMR. The group fee rate decreases as assets under management increase and increases as assets under management decrease. In addition, the management fee is subject to a performance adjustment (up to a maximum of ± .20% of the Fund's average net assets over a 36 month performance period). The upward or downward adjustment to the management fee is based on the relative investment performance of Diversified International as compared to an appropriate benchmark index. For the period, the total annual management fee rate, including the performance adjustment, was .76% of the Fund's average net assets.
Transfer Agent Fees. Fidelity Investments Institutional Operations Company, Inc. (FIIOC), an affiliate of FMR, is the transfer, dividend disbursing and shareholder servicing agent for each class of the Fund. FIIOC receives account fees and asset-based fees that vary according to the account size and type of account of the shareholders of Diversified International. FIIOC receives an asset-based fee of Class K's average net assets. FIIOC pays for typesetting, printing and mailing of shareholder reports, except proxy statements. For the period, transfer agent fees for each class were as follows:
| Amount | % of
Average
Net Assets |
Diversified International | $ 31,220,100 | .22 |
Class K | 4,236,524 | .05 |
| $ 35,456,624 | |
Accounting and Security Lending Fees. Fidelity Service Company, Inc. (FSC), an affiliate of FMR, maintains the Fund's accounting records. The accounting fee is based on the level of average net assets for each month. Under a separate contract, FSC administers the security lending program. The security lending fee is based on the number and duration of lending transactions.
Brokerage Commissions. The Fund placed a portion of its portfolio transactions with brokerage firms which are affiliates of the investment adviser. The commissions paid to these affiliated firms were $25,599 for the period.
6. Committed Line of Credit.
The Fund participates with other funds managed by FMR or an affiliate in a $4.25 billion credit facility (the "line of credit") to be utilized for temporary or emergency purposes to fund shareholder redemptions or for other short-term liquidity purposes. The Fund has agreed to pay commitment fees on its pro-rata portion of the line of credit, which amounted to $63,578 and is reflected in Miscellaneous expenses on the Statement of Operations. During the period, there were no borrowings on this line of credit.
7. Security Lending.
The Fund lends portfolio securities through a lending agent from time to time in order to earn additional income. For equity securities, a lending agent is used and may loan securities to certain qualified borrowers, including Fidelity Capital Markets (FCM), a broker-dealer affiliated with the Fund. On the settlement date of the loan, the Fund receives collateral (in the form of U.S. Treasury obligations, letters of credit and/or cash) against the loaned securities and maintains collateral in an amount not less than 100% of the market value of the loaned securities during the period of the loan. The
Annual Report
7. Security Lending - continued
market value of the loaned securities is determined at the close of business of the Fund and any additional required collateral is delivered to the Fund on the next business day. If the borrower defaults on its obligation to return the securities loaned because of insolvency or other reasons, a fund could experience delays and costs in recovering the securities loaned or in gaining access to the collateral. Any cash collateral received is invested in the Fidelity Securities Lending Cash Central Fund. The value of loaned securities and cash collateral at period end are disclosed on the Fund's Statement of Assets and Liabilities. At period end, there were no security loans outstanding with FCM. Security lending income represents the income earned on investing cash collateral, less rebates paid to borrowers and any lending agent fees associated with the loan, plus any premium payments received for lending certain types of securities. Security lending income is presented in the Statement of Operations as a component of income from Fidelity Central Funds. Total security lending income during the period amounted to $15,556,493, including $12,266 from securities loaned to FCM.
8. Expense Reductions.
Many of the brokers with whom FMR places trades on behalf of the Fund provided services to the Fund in addition to trade execution. These services included payments of certain expenses on behalf of the Fund totaling $2,425,551 for the period. In addition, through arrangements with the Fund's custodian, credits realized as a result of uninvested cash balances were used to reduce the Fund's expenses. During the period, these credits reduced the Fund's custody expenses by $373.
9. Distributions to Shareholders.
Distributions to shareholders of each class were as follows:
Years ended October 31, | 2012A | 2011 |
From net investment income | | |
Diversified International | $ 294,773,906 | $ 404,459,076 |
Class K | 163,061,175 | 139,574,930 |
Class F | 2,597,208 | 10,137,376 |
Total | $ 460,432,289 | $ 554,171,382 |
From net realized gain | | |
Diversified International | $ - | $ 71,011,904 |
Class K | - | 21,272,351 |
Class F | - | 1,496,091 |
Total | $ - | $ 93,780,346 |
A All Class F shares were redeemed on December 16, 2011.
10. Share Transactions.
Transactions for each class of shares were as follows:
| Shares | Dollars |
Years ended October 31, | 2012A | 2011 | 2012A | 2011 |
Diversified International | | | | |
Shares sold | 68,919,981 | 95,789,996 | $ 1,874,276,249 | $ 2,861,192,033 |
Reinvestment of distributions | 10,773,340 | 15,446,133 | 281,938,317 | 459,413,511 |
Shares redeemed | (251,932,423) | (382,099,741) | (6,875,660,945) | (11,334,070,882) |
Net increase (decrease) | (172,239,102) | (270,863,612) | $ (4,719,446,379) | $ (8,013,465,338) |
Class K | | | | |
Shares sold | 107,189,633 | 125,231,374 | $ 2,919,697,004 | $ 3,707,928,503 |
Reinvestment of distributions | 6,242,771 | 5,413,899 | 163,061,175 | 160,847,281 |
Shares redeemed | (102,745,898) | (96,416,162) | (2,820,922,083) | (2,871,502,023) |
Net increase (decrease) | 10,686,506 | 34,229,111 | $ 261,836,096 | $ 997,273,761 |
Class F | | | | |
Shares sold | 439,287 | 13,012,404 | $ 11,548,416 | $ 389,423,461 |
Reinvestment of distributions | 99,472 | 391,673 | 2,597,208 | 11,633,466 |
Shares redeemed | (6,767,017) | (27,320,491) | (175,849,737) | (802,392,088) |
Net increase (decrease) | (6,228,258) | (13,916,414) | $ (161,704,113) | $ (401,335,161) |
A All Class F shares were redeemed on December 16, 2011.
Annual Report
Fidelity Diversified International Fund
Notes to Financial Statements - continued
11. Other.
The Fund's organizational documents provide former and current trustees and officers with a limited indemnification against liabilities arising in connection with the performance of their duties to the Fund. In the normal course of business, the Fund may also enter into contracts that provide general indemnifications. The Fund's maximum exposure under these arrangements is unknown as this would be dependent on future claims that may be made against the Fund. The risk of material loss from such claims is considered remote.
Annual Report
Report of Independent Registered Public Accounting Firm
To the Trustees of Fidelity Investment Trust and Shareholders of Fidelity Diversified International Fund:
We have audited the accompanying statement of assets and liabilities of Fidelity Diversified International Fund (the Fund), a fund of Fidelity Investment Trust, including the schedule of investments, as of October 31, 2012, and the related statement of operations for the year then ended, the statement of changes in net assets for each of the two years in the period then ended, and the financial highlights for each of the five years in the period then ended. These financial statements and financial highlights are the responsibility of the Fund's management. Our responsibility is to express an opinion on these financial statements and financial highlights based on our audits.
We conducted our audits in accordance with the standards of the Public Company Accounting Oversight Board (United States). Those standards require that we plan and perform the audit to obtain reasonable assurance about whether the financial statements and financial highlights are free of material misstatement. The Fund is not required to have, nor were we engaged to perform, an audit of its internal control over financial reporting. Our audits included consideration of internal control over financial reporting as a basis for designing audit procedures that are appropriate in the circumstances, but not for the purpose of expressing an opinion on the effectiveness of the Fund's internal control over financial reporting. Accordingly, we express no such opinion. An audit also includes examining, on a test basis, evidence supporting the amounts and disclosures in the financial statements, assessing the accounting principles used and significant estimates made by management, as well as evaluating the overall financial statement presentation. Our procedures included confirmation of securities owned as of October 31, 2012, by correspondence with the custodians and brokers; where replies were not received from brokers, we performed other auditing procedures. We believe that our audits provide a reasonable basis for our opinion.
In our opinion, the financial statements and financial highlights referred to above present fairly, in all material respects, the financial position of Fidelity Diversified International Fund as of October 31, 2012, the results of its operations for the year then ended, the changes in its net assets for each of the two years in the period then ended, and the financial highlights for each of the five years in the period then ended, in conformity with accounting principles generally accepted in the United States of America.
DELOITTE & TOUCHE LLP
Boston, Massachusetts
December 14, 2012
Annual Report
The Trustees, Members of the Advisory Board, and executive officers of the trust and fund, as applicable, are listed below. The Board of Trustees governs the fund and is responsible for protecting the interests of shareholders. The Trustees are experienced executives who meet periodically throughout the year to oversee the fund's activities, review contractual arrangements with companies that provide services to the fund, oversee management of the risks associated with such activities and contractual arrangements, and review the fund's performance. Except for James C. Curvey, each of the Trustees oversees 236 funds advised by FMR or an affiliate. Mr. Curvey oversees 443 funds advised by FMR or an affiliate.
The Trustees hold office without limit in time except that (a) any Trustee may resign; (b) any Trustee may be removed by written instrument, signed by at least two-thirds of the number of Trustees prior to such removal; (c) any Trustee who requests to be retired or who has become incapacitated by illness or injury may be retired by written instrument signed by a majority of the other Trustees; and (d) any Trustee may be removed at any special meeting of shareholders by a two-thirds vote of the outstanding voting securities of the trust. Each Trustee who is not an interested person (as defined in the 1940 Act) (Independent Trustee), shall retire not later than the last day of the calendar year in which his or her 75th birthday occurs. The Independent Trustees may waive this mandatory retirement age policy with respect to individual Trustees. The executive officers and Advisory Board Members hold office without limit in time, except that any officer and Advisory Board Member may resign or may be removed by a vote of a majority of the Trustees at any regular meeting or any special meeting of the Trustees. Except as indicated, each individual has held the office shown or other offices in the same company for the past five years.
Experience, Skills, Attributes, and Qualifications of the Fund's Trustees. The Governance and Nominating Committee has adopted a statement of policy that describes the experience, qualifications, attributes, and skills that are necessary and desirable for potential Independent Trustee candidates (Statement of Policy). The Board believes that each Trustee satisfied at the time he or she was initially elected or appointed a Trustee, and continues to satisfy, the standards contemplated by the Statement of Policy. The Governance and Nominating Committee also engages professional search firms to help identify potential Independent Trustee candidates who have the experience, qualifications, attributes, and skills consistent with the Statement of Policy. From time to time, additional criteria based on the composition and skills of the current Independent Trustees, as well as experience or skills that may be appropriate in light of future changes to board composition, business conditions, and regulatory or other developments, have also been considered by the professional search firms and the Governance and Nominating Committee. In addition, the Board takes into account the Trustees' commitment and participation in Board and committee meetings, as well as their leadership of standing and ad hoc committees throughout their tenure.
In determining that a particular Trustee was and continues to be qualified to serve as a Trustee, the Board has considered a variety of criteria, none of which, in isolation, was controlling. The Board believes that, collectively, the Trustees have balanced and diverse experience, qualifications, attributes, and skills, which allow the Board to operate effectively in governing the fund and protecting the interests of shareholders. Information about the specific experience, skills, attributes, and qualifications of each Trustee, which in each case led to the Board's conclusion that the Trustee should serve (or continue to serve) as a trustee of the fund, is provided below.
Board Structure and Oversight Function. James C. Curvey is an interested person (as defined in the 1940 Act) and currently serves as Chairman. The Trustees have determined that an interested Chairman is appropriate and benefits shareholders because an interested Chairman has a personal and professional stake in the quality and continuity of services provided to the fund. Independent Trustees exercise their informed business judgment to appoint an individual of their choosing to serve as Chairman, regardless of whether the Trustee happens to be independent or a member of management. The Independent Trustees have determined that they can act independently and effectively without having an Independent Trustee serve as Chairman and that a key structural component for assuring that they are in a position to do so is for the Independent Trustees to constitute a substantial majority for the Board. The Independent Trustees also regularly meet in executive session. Ned C. Lautenbach serves as Chairman of the Independent Trustees and as such (i) acts as a liaison between the Independent Trustees and management with respect to matters important to the Independent Trustees and (ii) with management prepares agendas for Board meetings.
Fidelity funds are overseen by different Boards of Trustees. The fund's Board oversees Fidelity's equity and high income funds and another Board oversees Fidelity's investment-grade bond, money market, and asset allocation funds. The asset allocation funds may invest in Fidelity funds overseen by the fund's Board. The use of separate Boards, each with its own committee structure, allows the Trustees of each group of Fidelity funds to focus on the unique issues of the funds they oversee, including common research, investment, and operational issues. On occasion, the separate Boards establish joint committees to address issues of overlapping consequences for the Fidelity funds overseen by each Board.
The Trustees operate using a system of committees to facilitate the timely and efficient consideration of all matters of importance to the Trustees, the fund, and fund shareholders and to facilitate compliance with legal and regulatory requirements and oversight of the fund's activities and associated risks. The Board, acting through its committees, has charged FMR and its affiliates with (i) identifying events or circumstances the occurrence of which could have demonstrably adverse effects on the fund's business and/or reputation; (ii) implementing processes and controls to lessen the possibility that such events or circumstances occur or to mitigate the effects of such events or circumstances if they do occur; and (iii) creating and maintaining a system designed to evaluate continuously business and market conditions in order to facilitate the identification and implementation processes described in (i) and (ii) above. Because the day-to-day operations and activities of the fund are carried out by or through FMR, its affiliates and other service providers, the fund's exposure to risks is mitigated but not eliminated by the processes overseen by the Trustees. While each of the Board's committees has responsibility for overseeing different aspects of the fund's activities, oversight is exercised primarily through the Operations, Audit, and Compliance Committees. In addition, the Independent Trustees have worked with FMR to enhance the Board's oversight of investment and financial risks, legal and regulatory risks, technology risks, and operational risks, including the development of additional risk reporting to the Board. For example, a working group comprised of Independent Trustees and FMR has worked and continues to work to review the Fidelity funds' valuation-related activities, reporting and risk management. Appropriate personnel, including but not limited to the fund's Chief Compliance Officer (CCO), FMR's internal auditor, the independent accountants, the fund's Treasurer and portfolio management personnel, make periodic reports to the Board's committees, as appropriate, including an annual review of FMR's risk management program for the Fidelity funds. The responsibilities of each standing committee, including their oversight responsibilities, are described further under "Standing Committees of the Fund's Trustees."
Annual Report
The fund's Statement of Additional Information (SAI) includes more information about the Trustees. To request a free copy, call Fidelity at 1-800-835-5092.
Interested Trustees*:
Correspondence intended for each Trustee who is an interested person may be sent to Fidelity Investments, 82 Devonshire Street, Boston, Massachusetts 02109.
Name, Age; Principal Occupations and Other Relevant Experience+ |
James C. Curvey (77) |
| Year of Election or Appointment: 2007 Mr. Curvey is Trustee and Chairman of the Board of Trustees of certain Trusts. Mr. Curvey also serves as Trustee (2007-present) of other investment companies advised by FMR. Mr. Curvey is a Director of Fidelity Investments Money Management, Inc. (2009-present), Director of Fidelity Research & Analysis Co. (2009-present) and Director of FMR and FMR Co., Inc. (2007-present). Mr. Curvey is also Vice Chairman (2007-present) and Director of FMR LLC. In addition, Mr. Curvey serves as an Overseer for the Boston Symphony Orchestra and a member of the Trustees of Villanova University. Previously, Mr. Curvey was the Vice Chairman (2006-2007) and Director (2000-2007) of FMR Corp. |
Ronald P. O'Hanley (55) |
| Year of Election or Appointment: 2011 Mr. O'Hanley is Director of FMR Co., Inc. (2010-present), Director of Fidelity Investments Money Management, Inc. (2010-present), Director of Fidelity Research & Analysis Company (2010-present), President of Fidelity Asset Management and Corporate Services and a member of Fidelity's Executive Committee (2010-present). Previously, Mr. O'Hanley served as President and Chief Executive Officer of BNY Mellon Asset Management (2007-2010). Mr. O'Hanley also served as Vice Chairman of Bank New York Mellon Corp. and a member of that firm's Executive Committee. Prior to the 2007 merger of The Bank of New York and Mellon Financial Corporation, he was Vice Chairman of Mellon Financial Corporation and President and Chief Executive Officer of Mellon Asset Management. He joined Mellon in February 1997. Mr. O'Hanley currently serves as Chairman of the Boston Public Library Foundation Board of Directors and sits on the Board of Directors of Beth Israel Deaconess Medical Center, the Board of Trustees of the Marine Biological Laboratory and the Advisory Board of the Maxwell School of Citizenship and Public Administration at Syracuse University. Mr. O'Hanley also chairs the Council on Asset Management for the Financial Services Roundtable and is a member of the Board of Directors of Institutional Investor's U.S. Institute. |
* Trustees have been determined to be "Interested Trustees" by virtue of, among other things, their affiliation with the trust or various entities under common control with FMR.
+ The information above includes each Trustee's principal occupation during the last five years and other information relating to the experience, attributes, and skills relevant to each Trustee's qualifications to serve as a Trustee, which led to the conclusion that each Trustee should serve as a Trustee for the fund.
Independent Trustees:
Correspondence intended for each Independent Trustee (that is, the Trustees other than the Interested Trustees) may be sent to Fidelity Investments, P.O. Box 55235, Boston, Massachusetts 02205-5235.
Name, Age; Principal Occupations and Other Relevant Experience+ |
Dennis J. Dirks (64) |
| Year of Election or Appointment: 2005 Prior to his retirement in May 2003, Mr. Dirks was Chief Operating Officer and a member of the Board of The Depository Trust & Clearing Corporation (DTCC). He also served as President, Chief Operating Officer, and Board member of The Depository Trust Company (DTC) and President and Board member of the National Securities Clearing Corporation (NSCC). In addition, Mr. Dirks served as Chief Executive Officer and Board member of the Government Securities Clearing Corporation, Chief Executive Officer and Board member of the Mortgage-Backed Securities Clearing Corporation, as a Trustee and a member of the Finance Committee of Manhattan College (2005-2008), and as a Trustee and a member of the Finance Committee of AHRC of Nassau County (2006-2008). Mr. Dirks is a member of the Independent Directors Council (IDC) Governing Council (2010-present) and Board of Directors for The Brookville Center for Children's Services, Inc. (2009-present). |
Alan J. Lacy (59) |
| Year of Election or Appointment: 2008 Mr. Lacy serves as Senior Adviser (2007-present) of Oak Hill Capital Partners, L.P. (private equity). Mr. Lacy also served as Chief Executive Officer (2000-2005) and Vice Chairman (2005-2006) of Sears Holdings Corporation and Sears, Roebuck and Co. (retail). In addition, Mr. Lacy serves as a member of the Board of Directors of Dave & Buster's Entertainment, Inc. (restaurant and entertainment complexes, 2010-present), Earth Fare, Inc. (retail grocery, 2012-present), The Hillman Companies, Inc. (hardware wholesalers, 2010-present), and Bristol-Myers Squibb Company (global pharmaceuticals, 2008-present). Mr. Lacy is a member of the Board of Trustees of The National Parks Conservation Association (2006-present). Previously, Mr. Lacy served as Chairman of the Board of Trustees of the National Parks Conservation Association (2008-2011) and as a member of the Board of Directors for the Western Union Company (global money transfer, 2006-2011). |
Ned C. Lautenbach (68) |
| Year of Election or Appointment: 2000 Mr. Lautenbach is Chairman of the Independent Trustees of the Equity and High Income Funds (2006-present). Mr. Lautenbach currently serves as the Lead Director of the Eaton Corporation Board of Directors (diversified industrial, 1997-present). Mr. Lautenbach is Chairman of the Board of Directors of the Philharmonic Center for the Arts in Naples, Florida (2012-present) and a member of the Council on Foreign Relations (1994-present). Previously, Mr. Lautenbach was a Partner/Advisory Partner at Clayton, Dubilier & Rice, LLC (private equity investment, 1998-2010), as well as a Director of Sony Corporation (2006-2007). |
Joseph Mauriello (68) |
| Year of Election or Appointment: 2008 Prior to his retirement in January 2006, Mr. Mauriello served in numerous senior management positions including Deputy Chairman and Chief Operating Officer (2004-2005), and Vice Chairman of Financial Services (2002-2004) of KPMG LLP US (professional services, 1965-2005). Mr. Mauriello currently serves as a member of the Board of Directors of XL Group plc. (global insurance and re-insurance, 2006-present). Previously, Mr. Mauriello served as a Director of the Hamilton Funds of the Bank of New York (2006-2007) and of Arcadia Resources Inc. (health care services and products, 2007-2012). |
Robert W. Selander (62) |
| Year of Election or Appointment: 2011 Previously, Mr. Selander served as a Member of the Advisory Board of Fidelity's Equity and High Income Funds (2011), Executive Vice Chairman (2010), Chief Executive Officer (2009-2010), and President and Chief Executive Officer (1997-2009) of Mastercard, Inc. |
Cornelia M. Small (68) |
| Year of Election or Appointment: 2005 Ms. Small is a member of the Board of Directors (2009-present) and Chair of the Investment Committee (2010-present) of the Teagle Foundation. Ms. Small also serves on the Investment Committee of the Berkshire Taconic Community Foundation (2008-present). Previously, Ms. Small served as Chairperson (2002-2008) and a member of the Investment Committee and Chairperson (2008-2012) and a member of the Board of Trustees of Smith College. In addition, Ms. Small served as Chief Investment Officer, Director of Global Equity Investments, and a member of the Board of Directors of Scudder, Stevens & Clark and Scudder Kemper Investments. |
William S. Stavropoulos (73) |
| Year of Election or Appointment: 2001 Mr. Stavropoulos is Vice Chairman of the Independent Trustees of the Equity and High Income Funds (2006-present). Mr. Stavropoulos serves as President and Founder of the Michigan Baseball Foundation, the Great Lakes Loons (2007-present). Mr. Stavropoulos is Chairman Emeritus of the Board of Directors of The Dow Chemical Company, where he previously served in numerous senior management positions, including President, CEO (1995-2000; 2002-2004), Chairman of the Executive Committee (2000-2006), and as a member of the Board of Directors (1990-2006). Currently, Mr. Stavropoulos is a Director of Univar Inc. (global distributor of commodity and specialty chemicals, Chairman from 2010-May 2012 and Lead Director from May 2012-present), Teradata Corporation (data warehousing and technology solutions, 2008-present), Maersk Inc. (industrial conglomerate), and Tyco International, Ltd. (multinational manufacturing and services, 2007-present), and a member of the Advisory Board for Metalmark Capital LLC (private equity investment, 2005-present). Mr. Stavropoulos is an operating advisor to Clayton, Dubilier & Rice, LLC (private equity investment). In addition, Mr. Stavropoulos is a member of the University of Notre Dame Advisory Council for the College of Science, a Trustee of the Rollin L. Gerstacker Foundation, and a Director of the Naples Philharmonic Center for the Arts. Previously, Mr. Stavropoulos served as a Director of Chemical Financial Corporation (bank holding company, 1993-2012). |
David M. Thomas (63) |
| Year of Election or Appointment: 2008 Previously, Mr. Thomas served as Executive Chairman (2005-2006) and Chairman and Chief Executive Officer (2000-2005) of IMS Health, Inc. (pharmaceutical and healthcare information solutions), and a Director of Fortune Brands, Inc. (consumer products, 2000-2011). In addition, Mr. Thomas serves as Non-Executive Chairman of the Board of Directors of Fortune Brands Home and Security (home and security products, 2011-present), and as a member of the Board of Directors of Interpublic Group of Companies, Inc. (marketing communication, 2004-present). |
Michael E. Wiley (62) |
| Year of Election or Appointment: 2008 Mr. Wiley also serves as a Director of Asia Pacific Exploration Consolidated (international oil and gas exploration and production, 2008-present). Mr. Wiley serves as a Director of Tesoro Corporation (independent oil refiner and marketer, 2005-present), and a Director of Bill Barrett Corporation (exploration and production, 2005-present). In addition, Mr. Wiley also serves as a Director of Post Oak Bank (privately-held bank, 2004-present). Previously, Mr. Wiley served as a member of the Board of Trustees of the University of Tulsa (2000-2006; 2007-2010), as a Senior Energy Advisor of Katzenbach Partners, LLC (consulting, 2006-2007), as an Advisory Director of Riverstone Holdings (private investment), Chairman, President, and CEO of Baker Hughes, Inc. (oilfield services, 2000-2004), and as Director of Spinnaker Exploration Company (exploration and production, 2001-2005). |
+ The information above includes each Trustee's principal occupation during the last five years and other information relating to the experience, attributes, and skills relevant to each Trustee's qualifications to serve as a Trustee, which led to the conclusion that each Trustee should serve as a Trustee for the fund.
Advisory Board Members and Executive Officers:
Correspondence intended for David A. Rosow and Garnett A. Smith may be sent to Fidelity Investments, P.O. Box 55235, Boston, Massachusetts 02205-5235. Correspondence intended for each executive officer, Edward C. Johnson 3d, and Peter S. Lynch may be sent to Fidelity Investments, 82 Devonshire Street, Boston, Massachusetts 02109.
Name, Age; Principal Occupation |
Edward C. Johnson 3d (82) |
| Year of Election or Appointment: 2011 Member of the Advisory Board of Fidelity's Equity and High Income Funds. Mr. Johnson serves as Chief Executive Officer, Chairman, and a Director of FMR LLC, and also serves as Chairman and Director of FIL Limited. Previously, Mr. Johnson served as a Trustee and Chairman of the Board of certain Fidelity Trusts, Chairman and a Director of FMR, Chairman and a Director of FMR Co., Inc., and President of FMR LLC (2006-2007). |
Peter S. Lynch (68) |
| Year of Election or Appointment: 2003 Member of the Advisory Board of Fidelity's Equity and High Income Funds. Mr. Lynch is Vice Chairman and a Director of FMR and FMR Co., Inc. In addition, Mr. Lynch serves as a Trustee of Boston College and as the Chairman of the Inner-City Scholarship Fund. Previously, Mr. Lynch served on the Special Olympics International Board of Directors (1997-2006). |
David A. Rosow (70) |
| Year of Election or Appointment: 2012 Member of the Advisory Board of Fidelity's Equity and High Income Funds. Chairman and Chief Executive Officer of International Golf Group, Inc. (golf course development, 1989-present). Previously, Mr. Rosow served as Chairman and Chief Executive Officer of Rosow & Company, Inc. (private investment company, 1989-2011), a Lead Director of Hudson United Bancorp (2001-2006) and as a Director of TD Banknorth (1996-2006). In addition, Mr. Rosow is a member (2008-present) and President (2009-present) of the Town Council of Palm Beach, Florida. |
Garnett A. Smith (65) |
| Year of Election or Appointment: 2012 Member of the Advisory Board of Fidelity's Equity and High Income Funds. Prior to Mr. Smith's retirement, he served as Chairman and Chief Executive Officer of Inbrand Corp. (manufacturer of personal absorbent products, 1990-1997). He also served as President (1986-1990) of Inbrand Corp. Prior to his employment with Inbrand Corp., he was employed by a retail fabric chain and North Carolina National Bank. In addition, Mr. Smith is a board member of the Jackson Hole Land Trust (2009-present). |
Kenneth B. Robins (43) |
| Year of Election or Appointment: 2008 President and Treasurer of Fidelity's Equity and High Income Funds. Mr. Robins also serves as President and Treasurer (2010-present) and Assistant Treasurer (2009-present) of other Fidelity funds and is an employee of Fidelity Investments (2004-present). Previously, Mr. Robins served as Deputy Treasurer of the Fidelity funds (2005-2008) and Treasurer and Chief Financial Officer of The North Carolina Capital Management Trust: Cash and Term Portfolios (2006-2008). |
Bruce T. Herring (47) |
| Year of Election or Appointment: 2006 Vice President of certain Equity Funds. Mr. Herring also serves as President of Fidelity Research & Analysis Company (2010-present), Chief Investment Officer and Director of Fidelity Management & Research (U.K.) Inc. (2010-present) and Group Chief Investment Officer of FMR. Previously, Mr. Herring served as Vice President (2005-2006) and Senior Vice President (2006-2007) of Fidelity Management & Research Company, Vice President of FMR Co., Inc. (2001-2007) and as a portfolio manager for Fidelity U.S. Equity Funds. |
Brian B. Hogan (48) |
| Year of Election or Appointment: 2009 Vice President of Equity and High Income Funds. Mr. Hogan also serves as President of FMR's Equity Division (2009-present). Previously, Mr. Hogan served as Senior Vice President, Equity Research of FMR (2006-2009) and as a portfolio manager. |
Scott C. Goebel (44) |
| Year of Election or Appointment: 2008 Secretary and Chief Legal Officer (CLO) of the Fidelity funds. Mr. Goebel also serves as Secretary of Fidelity Investments Money Management, Inc. (FIMM) (2010-present) and Fidelity Research and Analysis Company (FRAC) (2010-present); Secretary and CLO of The North Carolina Capital Management Trust: Cash and Term Portfolios (2008-present); General Counsel, Secretary, and Senior Vice President of FMR (2008-present) and FMR Co., Inc. (2008-present); employed by FMR LLC or an affiliate (2001-present); Chief Legal Officer of Fidelity Management & Research (Hong Kong) Limited (2008-present) and Assistant Secretary of Fidelity Management & Research (Japan) Inc. (2008-present), and Fidelity Management & Research (U.K.) Inc. (2008-present). Previously, Mr. Goebel served as Assistant Secretary of FIMM (2008-2010), FRAC (2008-2010), and the Funds (2007-2008) and as Vice President and Secretary of Fidelity Distributors Corporation (FDC) (2005-2007). |
William C. Coffey (43) |
| Year of Election or Appointment: 2009 Assistant Secretary of Fidelity's Equity and High Income Funds. Mr. Coffey also serves as Senior Vice President and Deputy General Counsel of FMR LLC (2010-present), and is an employee of Fidelity Investments. Previously, Mr. Coffey served as Vice President and Associate General Counsel of FMR LLC (2005-2009). |
Elizabeth Paige Baumann (44) |
| Year of Election or Appointment: 2012 Anti-Money Laundering (AML) Officer of the Fidelity funds. Ms. Baumann also serves as AML Officer of The North Carolina Capital Management Trust: Cash and Term Portfolios (2012-present), Chief AML Officer of FMR LLC (2012-present), and is an employee of Fidelity Investments. Previously, Ms. Baumann served as Vice President and Deputy Anti-Money Laundering Officer (2007-2012). |
Christine Reynolds (54) |
| Year of Election or Appointment: 2008 Chief Financial Officer of the Fidelity funds. Ms. Reynolds became President of Fidelity Pricing and Cash Management Services (FPCMS) in August 2008. Ms. Reynolds served as Chief Operating Officer of FPCMS (2007-2008). Previously, Ms. Reynolds served as President, Treasurer, and Anti-Money Laundering officer of the Fidelity funds (2004-2007). |
Joseph A. Hanlon (44) |
| Year of Election or Appointment: 2012 Chief Compliance Officer of Fidelity's Equity and High Income Funds. Mr. Hanlon serves as Compliance Officer of FMR, FMR Co., Inc., Fidelity Investments Money Management, Inc. (FIMM), Fidelity Research and Analysis Company (FRAC), Fidelity Management & Research (Japan) Inc., Fidelity Management & Research (U.K.) Inc., Fidelity Management & Research (Hong Kong), and Strategic Advisers, Inc. (2009-present), as Senior Vice President of the Fidelity Asset Management Division (2009-present), and is an employee of Fidelity Investments. |
Joseph F. Zambello (55) |
| Year of Election or Appointment: 2011 Deputy Treasurer of the Fidelity funds. Mr. Zambello is an employee of Fidelity Investments. Previously, Mr. Zambello served as Vice President of FMR's Program Management Group (2009-2011) and Vice President of the Transfer Agent Oversight Group (2005-2009). |
Adrien E. Deberghes (45) |
| Year of Election or Appointment: 2008 Deputy Treasurer of Fidelity's Equity and High Income Funds. Mr. Deberghes also serves as Vice President (2011-present) and Assistant Treasurer (2010-present) of other Fidelity funds, and is an employee of Fidelity Investments (2008-present). Previously, Mr. Deberghes served as Senior Vice President of Mutual Fund Administration at State Street Corporation (2007-2008), Senior Director of Mutual Fund Administration at Investors Bank & Trust (2005-2007), and Director of Finance for Dunkin' Brands (2000-2005). |
Stephen Sadoski (41) |
| Year of Election or Appointment: 2012 Deputy Treasurer of Fidelity's Equity and High Income Funds. Mr. Sadoski also serves as Assistant Treasurer of other Fidelity funds (2012-present) and is an employee of Fidelity Investments (2012-present). Previously, Mr. Sadoski served as an assistant chief accountant in the Division of Investment Management of the Securities and Exchange Commission (SEC) (2009-2012) and as a senior manager at Deloitte & Touche (1997-2009). |
Stephanie J. Dorsey (43) |
| Year of Election or Appointment: 2010 Assistant Treasurer of Fidelity's Equity and High Income Funds. Ms. Dorsey also serves as Deputy Treasurer of other Fidelity funds (2008-present) and is an employee of Fidelity Investments (2008-present). Previously, Ms. Dorsey served as Treasurer (2004-2008) of the JPMorgan Mutual Funds and Vice President (2004-2008) of JPMorgan Chase Bank. |
John R. Hebble (54) |
| Year of Election or Appointment: 2009 Assistant Treasurer of Fidelity's Equity and High Income Funds. Mr. Hebble also serves as President (2011-present), Treasurer, and Chief Financial Officer of The North Carolina Capital Management Trust: Cash and Term Portfolios (2008-present), President and Treasurer of other Fidelity funds (2008-present) and is an employee of Fidelity Investments. |
Gary W. Ryan (54) |
| Year of Election or Appointment: 2005 Assistant Treasurer of the Fidelity funds. Mr. Ryan is an employee of Fidelity Investments. Previously, Mr. Ryan served as Vice President of Fund Reporting in Fidelity Pricing and Cash Management Services (FPCMS) (1999-2005). |
Jonathan Davis (44) |
| Year of Election or Appointment: 2010 Assistant Treasurer of the Fidelity funds. Mr. Davis is also Assistant Treasurer of Fidelity Rutland Square Trust II and Fidelity Commonwealth Trust II. Mr. Davis is an employee of Fidelity Investments. Previously, Mr. Davis served as Vice President and Associate General Counsel of FMR LLC (2003-2010). |
Annual Report
The Board of Trustees of Fidelity Diversified International Fund voted to pay to shareholders of record at the opening of business on record date, the following distributions per share derived from capital gains realized from sales of portfolio securities, and dividends derived from net investment income:
| Pay Date | Record Date | Dividends | Capital Gains |
Class K | 12/10/12 | 12/07/12 | $0.508 | $0.068 |
Class K designates 1% of the dividends distributed during the fiscal year as qualifying for the dividends-received deduction for corporate shareholders.
Class K designates 100% of the dividends distributed during the fiscal year as amounts which may be taken into account as a dividend for the purposes of the maximum rate under section 1(h)(11) of the Internal Revenue Code.
The amounts per share which represent income derived from sources within, and taxes paid to, foreign countries or possessions of the United States are as follows:
| | Pay Date | Income | Taxes |
Class K | | 12/05/2011 | $0.573 | $0.0344 |
The fund will notify shareholders in January 2013 of amounts for use in preparing 2012 income tax returns.
Annual Report
Board Approval of Investment Advisory Contracts and Management Fees
Fidelity Diversified International Fund
Each year, the Board of Trustees, including the Independent Trustees (together, the Board), votes on the renewal of the management contract and sub-advisory agreements (together, the Advisory Contracts) for the fund. The Board, assisted by the advice of fund counsel and Independent Trustees' counsel, requests and considers a broad range of information relevant to the renewal of the Advisory Contracts throughout the year.
The Board meets regularly and, at each of its meetings, considers factors that are relevant to its annual consideration of the renewal of the fund's Advisory Contracts, including the services and support provided to the fund and its shareholders. The Board has established various standing committees, each composed of and chaired by Independent Trustees with varying backgrounds, to which the Board has assigned specific subject matter responsibilities in order to enhance effective decision-making by the Board. The Board, acting directly and through its Committees, requests and receives information concerning the annual consideration of the renewal of the fund's Advisory Contracts. The Board also meets as needed to consider matters specifically related to the Board's annual consideration of the renewal of Advisory Contracts. Members of the Board may also meet with trustees of other Fidelity funds through ad hoc joint committees to discuss certain matters relevant to the Fidelity funds.
At its July 2012 meeting, the Board of Trustees, including the Independent Trustees, unanimously determined to renew the fund's Advisory Contracts. In reaching its determination, the Board considered all factors it believed relevant, including (i) the nature, extent, and quality of the services to be provided to the fund and its shareholders (including the investment performance of the fund); (ii) the competitiveness of the fund's management fee and total expense ratio relative to peer funds; (iii) the total costs of the services to be provided by and the profits to be realized by Fidelity from its relationship with the fund; (iv) the extent to which economies of scale exist and would be realized as the fund grows; and (v) whether fee levels reflect these economies of scale, if any, for the benefit of fund shareholders.
In considering whether to renew the Advisory Contracts for the fund, the Board reached a determination, with the assistance of fund counsel and Independent Trustees' counsel and through the exercise of its business judgment, that the renewal of the Advisory Contracts is in the best interests of the fund and its shareholders and that the compensation payable under the Advisory Contracts is fair and reasonable. The Board's decision to renew the Advisory Contracts was not based on any single factor, but rather was based on a comprehensive consideration of all the information provided to the Board at its meetings throughout the year. The Board, in reaching its determination to renew the Advisory Contracts, is aware that shareholders in the fund have a broad range of investment choices available to them, including a wide choice among mutual funds offered by Fidelity's competitors, and that the fund's shareholders, who have the opportunity to review and weigh the disclosure provided by the fund in its prospectus and other public disclosures, have chosen to invest in this fund, managed by Fidelity.
Nature, Extent, and Quality of Services Provided. The Board considered the staffing within the investment adviser, FMR, and the sub-advisers (together, the Investment Advisers), including the backgrounds of the fund's investment personnel, and also considered the fund's investment objective, strategies, and related investment philosophy. The Independent Trustees also had discussions with senior management of Fidelity's investment operations and investment groups. The Board considered the structure of the portfolio manager compensation program and whether this structure provides appropriate incentives to act in the best interests of the fund.
Resources Dedicated to Investment Management and Support Services. The Board and the Fund Oversight and Research Committees reviewed the general qualifications and capabilities of the Investment Advisers' investment staff, including its size, education, experience, and resources, as well as the Investment Advisers' approach to recruiting, training, managing, and compensating investment personnel. The Board also noted that FMR has continued to increase the resources devoted to non-U.S. offices, including expansion of Fidelity's global investment organization. The Board noted that Fidelity's analysts have extensive resources, tools and capabilities that allow them to conduct sophisticated quantitative and fundamental analysis, as well as credit analysis of issuers, counterparties and guarantors. The Board also believes that Fidelity's investment professionals have sufficient access to global information and data so as to provide competitive investment results over time, and that those professionals also have access to sophisticated tools that permit them to assess portfolio construction and risk and performance attribution characteristics continuously, as well as to transmit new information and research conclusions rapidly around the world. Additionally, in its deliberations, the Board considered the Investment Advisers' trading and risk management capabilities and resources, which are an integral part of the investment management process.
Shareholder and Administrative Services. The Board considered (i) the nature, extent, quality, and cost of advisory, administrative, and shareholder services performed by the Investment Advisers and their affiliates under the Advisory Contracts and under separate agreements covering transfer agency, pricing and bookkeeping, and securities lending services for the fund; (ii) the nature and extent of the supervision of third party service providers, principally custodians and subcustodians; and (iii) the resources devoted to, and the record of compliance with, the fund's compliance policies and procedures. The Board also reviewed the allocation of fund brokerage, including allocations to brokers affiliated with the Investment Advisers, the use of brokerage commissions to pay fund expenses, and the use of "soft" commission dollars to pay for research services.
The Board noted that the growth of fund assets over time across the complex allows Fidelity to reinvest in the development of services designed to enhance the value or convenience of the Fidelity funds as investment vehicles. These services include 24-hour access to account information and market information through telephone representatives and over the Internet, investor education materials and asset allocation tools, and the expanded availability of Fidelity Investor Centers.
Annual Report
Board Approval of Investment Advisory Contracts and Management Fees - continued
Investment in a Large Fund Family. The Board considered the benefits to shareholders of investing in a Fidelity fund, including the benefits of investing in a fund that is part of a large family of funds offering a variety of investment disciplines and providing a large variety of mutual fund investor services. The Board noted that Fidelity had taken, or had made recommendations that resulted in the Fidelity funds taking, a number of actions over the previous year that benefited particular funds, including (i) continuing to dedicate additional resources to investment research and support of the senior management team that oversees asset management; (ii) persisting in efforts to enhance Fidelity's research capabilities, in particular, international research; (iii) launching new funds and making other enhancements to meet client needs for global and income-oriented solutions; (iv) continuing to launch dedicated lower cost underlying funds to meet investment management's portfolio construction needs related to expanding underlying fund options, specifically for the Freedom Fund product lines; (v) adopting a "Stock Selector" sector neutral investment approach and employing a team of portfolio managers who are sector specialists to manage certain funds; (vi) rationalizing product lines and gaining increased efficiencies through the mergers of several funds into other funds; (vii) strengthening the Spartan Index Fund product line by adding new funds and/or new low-cost institutional share classes, restructuring fund expenses to accommodate new classes, and reducing investment minimums for certain classes of shares; (viii) modifying the eligibility criteria for Institutional Class shares to increase their appeal to government entities and charitable investors; and (ix) reducing certain transfer agent fee rates.
Investment Performance. The Board considered whether the fund has operated in accordance with its investment objective, as well as its record of compliance with its investment restrictions. It also reviewed the fund's absolute investment performance for each class, as well as the fund's relative investment performance for each class measured over multiple periods against (i) a broad-based securities market index, and (ii) a peer group of mutual funds deemed appropriate by Fidelity and reviewed by the Board. The following charts considered by the Board show, over the one-, three-, and five-year periods ended December 31, 2011, as available, the cumulative total returns of Class K and the retail class of the fund, the cumulative total returns of a broad-based securities market index ("benchmark"), and a range of cumulative total returns of a peer group of mutual funds identified by Morningstar, Inc. as having an investment style similar to that of the fund based on underlying portfolio holdings. The box within each chart shows the 25th percentile return (top of box) and the 75th percentile return (bottom of box) of the peer group. Returns shown above the box are in the first quartile and returns shown below the box are in the fourth quartile. The percentage beaten numbers noted below each chart correspond to the percentile box and represent the percentage of funds in the peer group whose performance was equal to or lower than that of the class indicated.
Fidelity Diversified International Fund
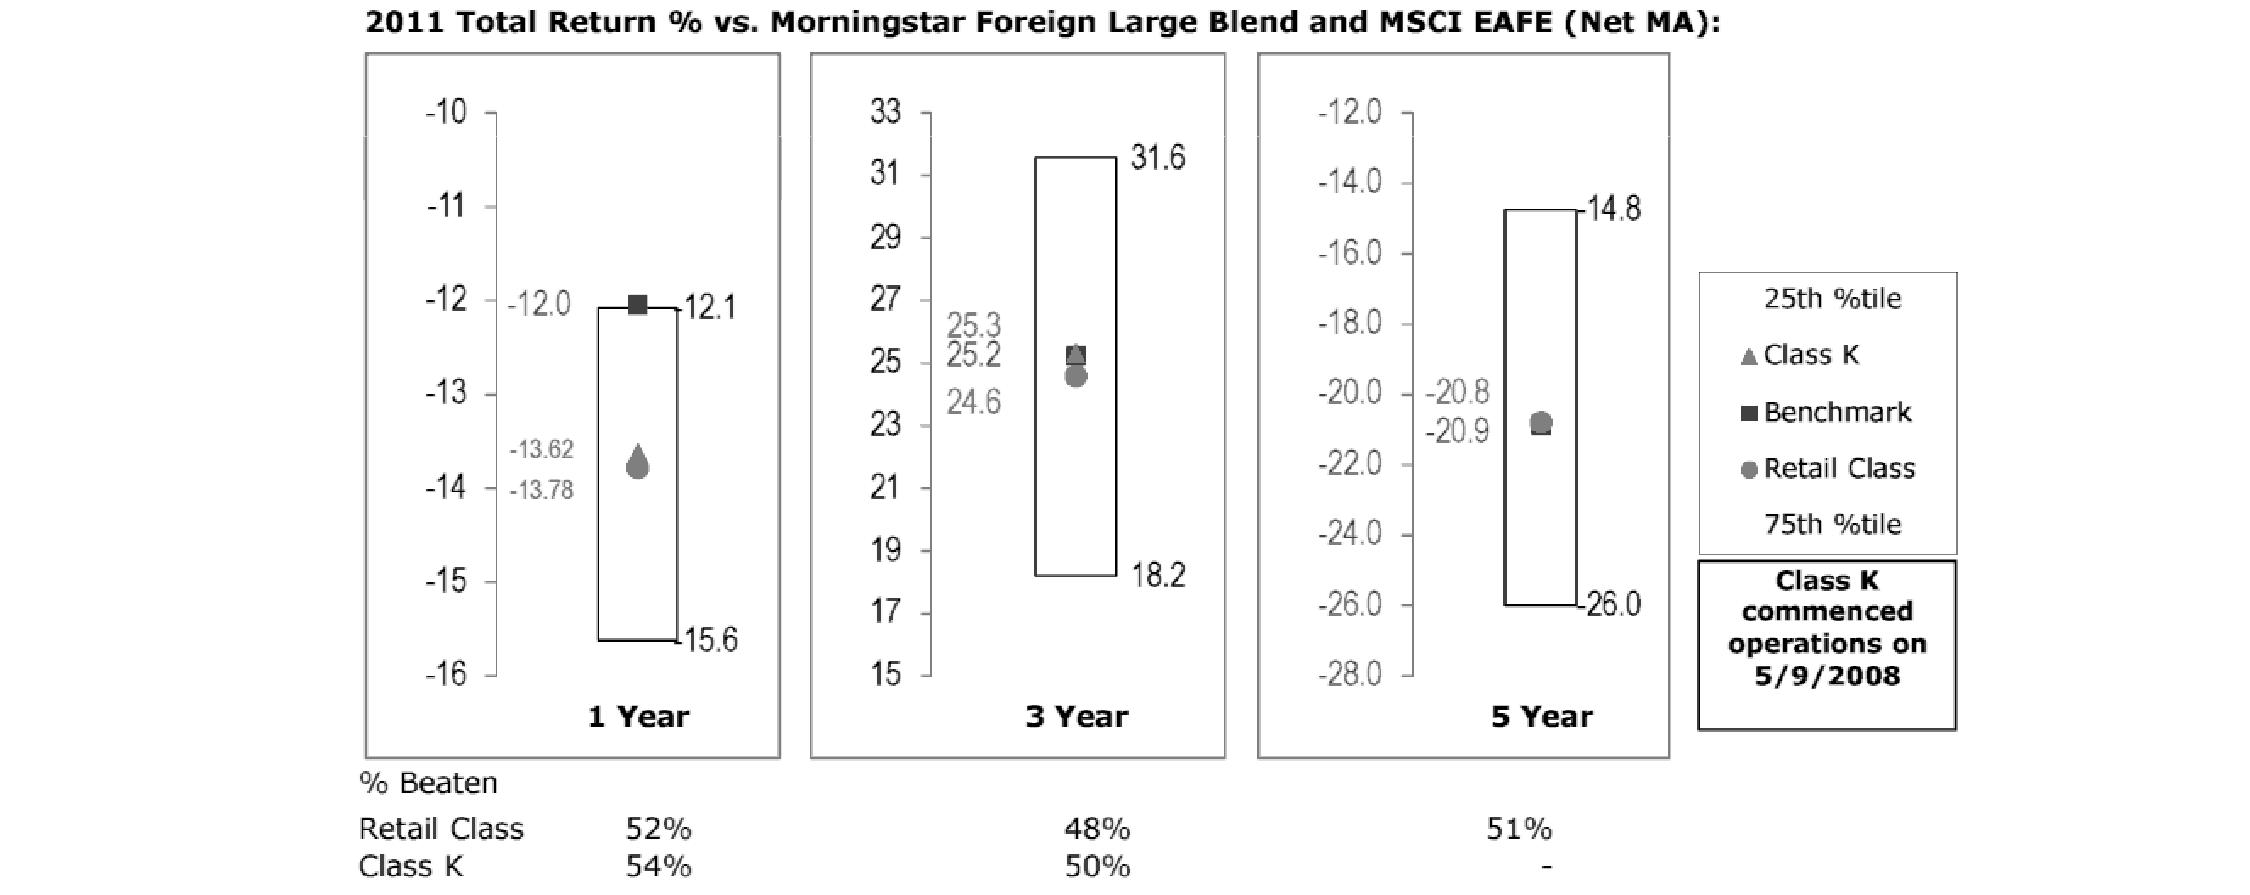
The Board reviewed the fund's relative investment performance against its peer group and noted that the performance of the retail class of the fund (the class with the longer performance record) was in the second quartile for the one- and five-year periods and the third quartile for the three-year period. The Board also noted that the investment performance of the retail class of the fund was lower than its benchmark for the one- and three-year periods, although the five-year cumulative total return of the retail class compared favorably to its benchmark. The Board considered that the variations in performance between the fund's classes reflect the variations in class expenses, which result in lower performance for the higher expense class. The Board also reviewed the fund's performance since inception as well as performance in the current year.
The Board also considered that the fund's management fee is subject to upward or downward adjustment depending upon whether, and to what extent, the fund's investment performance for the performance period exceeds, or is exceeded by, the record (over the same period) of a Board-approved performance adjustment index. The Board noted that the performance adjustment provides FMR with a strong economic incentive to seek to achieve superior performance for the fund's shareholders and helps to more closely align the interests of FMR and the fund's shareholders.
Annual Report
Based on its review, the Board concluded that the nature, extent, and quality of services provided to the fund under the Advisory Contracts should benefit the fund's shareholders.
Competitiveness of Management Fee and Total Expense Ratio. The Board considered the fund's management fee and total expense ratio compared to "mapped groups" of competitive funds and classes. Fidelity creates "mapped groups" by combining similar Lipper investment objective categories that have comparable management fee characteristics. Combining Lipper investment objective categories aids the Board's management fee and total expense ratio comparisons by broadening the competitive group used for comparison and by reducing the number of universes to which various Fidelity funds are compared.
Management Fee. The Board considered two proprietary management fee comparisons for the 12-month periods shown in the chart below. The group of Lipper funds used by the Board for management fee comparisons is referred to below as the "Total Mapped Group." The Total Mapped Group comparison focuses on a fund's standing relative to the total universe of comparable funds available to investors in terms of gross management fees before expense reimbursements or caps, and without giving effect to the fund's performance adjustment. "TMG %" represents the percentage of funds in the Total Mapped Group that had management fees that were lower than the fund's. For example, a TMG % of 17% means that 83% of the funds in the Total Mapped Group had higher management fees than the fund. The "Asset-Size Peer Group" (ASPG) comparison focuses on a fund's standing relative to non-Fidelity funds similar in size to the fund within the Total Mapped Group. The ASPG represents at least 15% of the funds in the Total Mapped Group with comparable asset size and management fee characteristics, subject to a minimum of 50 funds (or all funds in the Total Mapped Group if fewer than 50). Additional information, such as the ASPG quartile in which the fund's management fee ranked and the impact of the fund's performance adjustment, is also included in the chart and considered by the Board.
Fidelity Diversified International Fund

The Board noted that the fund's management fee ranked below the median of its Total Mapped Group and below the median of its ASPG for 2011. The Board also noted the effect of the fund's negative performance adjustment on the fund's management fee ranking. The Board noted that the performance adjustment for each year represents calculations for performance periods that differ from the periods shown in the performance charts above.
Based on its review, the Board concluded that the fund's management fee is fair and reasonable in light of the services that the fund receives and the other factors considered.
Total Expense Ratio. In its review of each class's total expense ratio, the Board considered the fund's management fee as well as other fund or class expenses, as applicable, such as transfer agent fees, pricing and bookkeeping fees, and custodial, legal, and audit fees. The Board also noted the effects of any waivers and reimbursements on fees and expenses, as well as the impact of the fund's performance adjustment. As part of its review, the Board also considered the current and historical total expense ratios of each class of the fund compared to competitive fund median expenses. Each class of the fund is compared to those funds and classes in the Total Mapped Group (used by the Board for management fee comparisons) that have a similar sales load structure.
The Board noted that the total expense ratio of each class ranked below its competitive median for 2011.
Fees Charged to Other Fidelity Clients. The Board also considered Fidelity fee structures and other information with respect to clients of FMR and its affiliates, such as other mutual funds advised or subadvised by FMR or its affiliates, pension plan clients, and other institutional clients. The Board noted the findings of the 2010 ad hoc joint committee (created with the board of other Fidelity funds), which reviewed and compared Fidelity's institutional investment advisory business with its business of providing services to the Fidelity funds, including the differences in services provided, fees charged, and costs incurred, as well as competition in their respective marketplaces.
Annual Report
Board Approval of Investment Advisory Contracts and Management Fees - continued
Based on its review of total expense ratios and fees charged to other Fidelity clients, the Board concluded that the total expense ratio of each class of the fund was reasonable in light of the services that the fund and its shareholders receive and the other factors considered.
Costs of the Services and Profitability. The Board considered the revenues earned and the expenses incurred by Fidelity in conducting the business of developing, marketing, distributing, managing, administering and servicing the fund and its shareholders. The Board also considered the level of Fidelity's profits in respect of all the Fidelity funds.
On an annual basis, FMR presents to the Board Fidelity's profitability for the fund. Fidelity calculates the profitability for each fund, as well as aggregate profitability for groups of Fidelity funds and all Fidelity funds, using a series of detailed revenue and cost allocation methodologies which originate with the books and records of Fidelity on which Fidelity's audited financial statements are based. The Audit Committee of the Board reviews any significant changes from the prior year's methodologies.
PricewaterhouseCoopers LLP (PwC), independent registered public accounting firm and auditor to Fidelity and certain Fidelity funds, has been engaged annually by the Board as part of the Board's assessment of Fidelity's profitability analysis. PwC's engagement includes the review and assessment of Fidelity's methodologies used in determining the revenues and expenses attributable to Fidelity's mutual fund business, and completion of agreed-upon procedures surrounding the mathematical accuracy of fund profitability and its conformity to allocation methodologies. After considering PwC's reports issued under the engagement and information provided by Fidelity, the Board concluded that while other allocation methods may also be reasonable, Fidelity's profitability methodologies are reasonable in all material respects.
The Board also reviewed Fidelity's non-fund businesses and fall-out benefits related to the mutual fund business as well as cases where Fidelity's affiliates may benefit from or be related to the fund's business.
The Board considered the costs of the services provided by and the profits realized by Fidelity in connection with the operation of the fund and was satisfied that the profitability was not excessive in the circumstances.
Economies of Scale. The Board considered whether there have been economies of scale in respect of the management of the Fidelity funds, whether the Fidelity funds (including the fund) have appropriately benefited from any such economies of scale, and whether there is potential for realization of any further economies of scale. The Board considered the extent to which the fund will benefit from economies of scale through increased services to the fund, through waivers or reimbursements, or through fee or expense reductions. The Board also noted that in 2009, it and the board of other Fidelity funds created an ad hoc committee (the Economies of Scale Committee) to analyze whether FMR attains economies of scale in respect of the management and servicing of the Fidelity funds, whether the Fidelity funds have appropriately benefited from such economies of scale, and whether there is potential for realization of any further economies of scale.
The Board recognized that the fund's management contract incorporates a "group fee" structure, which provides for lower group fee rates as total fund assets under FMR's management increase, and for higher group fee rates as total fund assets under FMR's management decrease. FMR calculates the group fee rates based on a tiered asset "breakpoint" schedule that varies based on asset class. The Board considered that the group fee is designed to deliver the benefits of economies of scale to fund shareholders when total Fidelity fund assets increase, even if assets of any particular fund are unchanged or have declined, because some portion of Fidelity's costs are attributable to services provided to all Fidelity funds, and all funds benefit if those costs can be allocated among more assets. The Board concluded that, given the group fee structure, fund shareholders will benefit from lower management fees as assets under FMR's management increase at the fund complex level, regardless of whether Fidelity achieves any such economies of scale.
The Board concluded, taking into account the analysis of the Economies of Scale Committee, that economies of scale, if any, are being appropriately shared between fund shareholders and Fidelity.
Additional Information Requested by the Board. In order to develop fully the factual basis for consideration of the Fidelity funds' Advisory Contracts, the Board requested and received additional information on certain topics, including (i) fund performance trends, actions to be taken by FMR to improve certain funds' overall performance, and Fidelity's long-term strategies for certain funds; (ii) the potential to further rationalize the Fidelity fund lineup with the possibility of achieving savings for the funds and Fidelity; (iii) Fidelity's compensation structure for portfolio managers and other key investment personnel; (iv) the amount of the investment that each portfolio manager has made in the Fidelity fund(s) that he or she manages; (v) the realization of fall-out benefits in certain Fidelity business units; (vi) Fidelity's group fee structures, the potential impact of regulatory changes on such structures, and the rationale for the individual fee rates of certain funds; (vii) fund profitability methodology, including Fidelity's cost allocation methodology, and the impact of certain factors on fund profitability results; (viii) trends regarding industry use of performance fee structures and the possibility of implementing performance fee structures for additional funds; and (ix) the impact of net redemptions from the Fidelity funds.
Based on its evaluation of all of the conclusions noted above, and after considering all factors it believed relevant, the Board ultimately concluded that the advisory fee structures are fair and reasonable, and that the fund's Advisory Contracts should be renewed.
Annual Report
Investment Adviser
Fidelity Management & Research Company
Boston, MA
Investment Sub-Advisers
FMR Co., Inc.
Fidelity Management & Research (U.K.) Inc.
Fidelity Management & Research
(Hong Kong) Limited
Fidelity Management & Research
(Japan) Inc.
FIL Investment Advisors
FIL Investment Advisors (UK) Limited
FIL Investments (Japan) Limited
General Distributor
Fidelity Distributors Corporation
Smithfield, RI
Transfer and Service Agents
Fidelity Investments Institutional
Operations Company, Inc.
Boston, MA
Fidelity Service Company, Inc.
Boston, MA
Custodian
JPMorgan Chase Bank
New York, NY
(Fidelity Investment logo)(registered trademark)
Corporate Headquarters
82 Devonshire St., Boston, MA 02109
www.fidelity.com
DIF-K-UANN-1212
1.863004.104
Fidelity®
Overseas
Fund -
Class K
Annual Report
October 31, 2012
(Fidelity Cover Art)
Contents
Performance | (Click Here) | How the fund has done over time. |
Management's Discussion of Fund Performance | (Click Here) | The Portfolio Manager's review of fund performance and strategy. |
Shareholder Expense Example | (Click Here) | An example of shareholder expenses. |
Investment Changes | (Click Here) | A summary of major shifts in the fund's investments over the past six months. |
Investments | (Click Here) | A complete list of the fund's investments with their market values. |
Financial Statements | (Click Here) | Statements of assets and liabilities, operations, and changes in net assets, as well as financial highlights. |
Notes | (Click Here) | Notes to the financial statements. |
Report of Independent Registered Public Accounting Firm | (Click Here) | |
Trustees and Officers | (Click Here) | |
Distributions | (Click Here) | |
Board Approval of Investment Advisory Contracts and Management Fees | (Click Here) | |
To view a fund's proxy voting guidelines and proxy voting record for the 12-month period ended June 30, visit http://www.fidelity.com/proxyvotingresults or visit the Securities and Exchange Commission's (SEC) web site at http://www.sec.gov. You may also call 1-800-835-5092 to request a free copy of the proxy voting guidelines.
Standard & Poor's, S&P and S&P 500 are registered service marks of The McGraw-Hill Companies, Inc. and have been licensed for use by Fidelity Distributors Corporation.
Other third party marks appearing herein are the property of their respective owners.
All other marks appearing herein are registered or unregistered trademarks or service marks of FMR LLC or an affiliated company. © 2012 FMR LLC. All rights reserved.
This report and the financial statements contained herein are submitted for the general information of the shareholders of the fund. This report is not authorized for distribution to prospective investors in the fund unless preceded or accompanied by an effective prospectus.
A fund files its complete schedule of portfolio holdings with the SEC for the first and third quarters of each fiscal year on Form N-Q. Forms N-Q are available on the SEC's web site at http://www.sec.gov. A fund's Forms N-Q may be reviewed and copied at the SEC's Public Reference Room in Washington, DC. Information regarding the operation of the SEC's Public Reference Room may be obtained by calling 1-800-SEC-0330. For a complete list of a fund's portfolio holdings, view the most recent holdings listing, semiannual report, or annual report on Fidelity's web site at http://www.fidelity.com, http://www.advisor.fidelity.com, or http://www.401k.com, as applicable.
NOT FDIC INSURED • MAY LOSE VALUE • NO BANK GUARANTEE
Neither the fund nor Fidelity Distributors Corporation is a bank.
Annual Report
Average annual total return reflects the change in the value of an investment, assuming reinvestment of the class' distributions from dividend income and capital gains (the profits earned upon the sale of securities that have grown in value, if any) and assuming a constant rate of performance each year. The $10,000 table and the fund's returns do not reflect the deduction of taxes that a shareholder would pay on fund distributions or the redemption of fund shares. During periods of reimbursement by Fidelity, a fund's total return will be greater than it would be had the reimbursement not occurred. How a fund did yesterday is no guarantee of how it will do tomorrow.
Average Annual Total Returns
Periods ended October 31, 2012 | Past 1
year | Past 5
years | Past 10
years |
Class K A | 10.59% | -7.98% | 7.19% |
A The initial offering of Class K shares took place on May 9, 2008. Returns prior to May 9, 2008, are those of Fidelity® Overseas Fund, the original class of the fund.
$10,000 Over 10 Years
Let's say hypothetically that $10,000 was invested in Fidelity® Overseas Fund - Class K on October 31, 2002. The chart shows how the value of your investment would have changed, and also shows how the MSCI® EAFE® Index performed over the same period. The initial offering of Class K took place on May 9, 2008. See above for additional information regarding the performance of Class K.
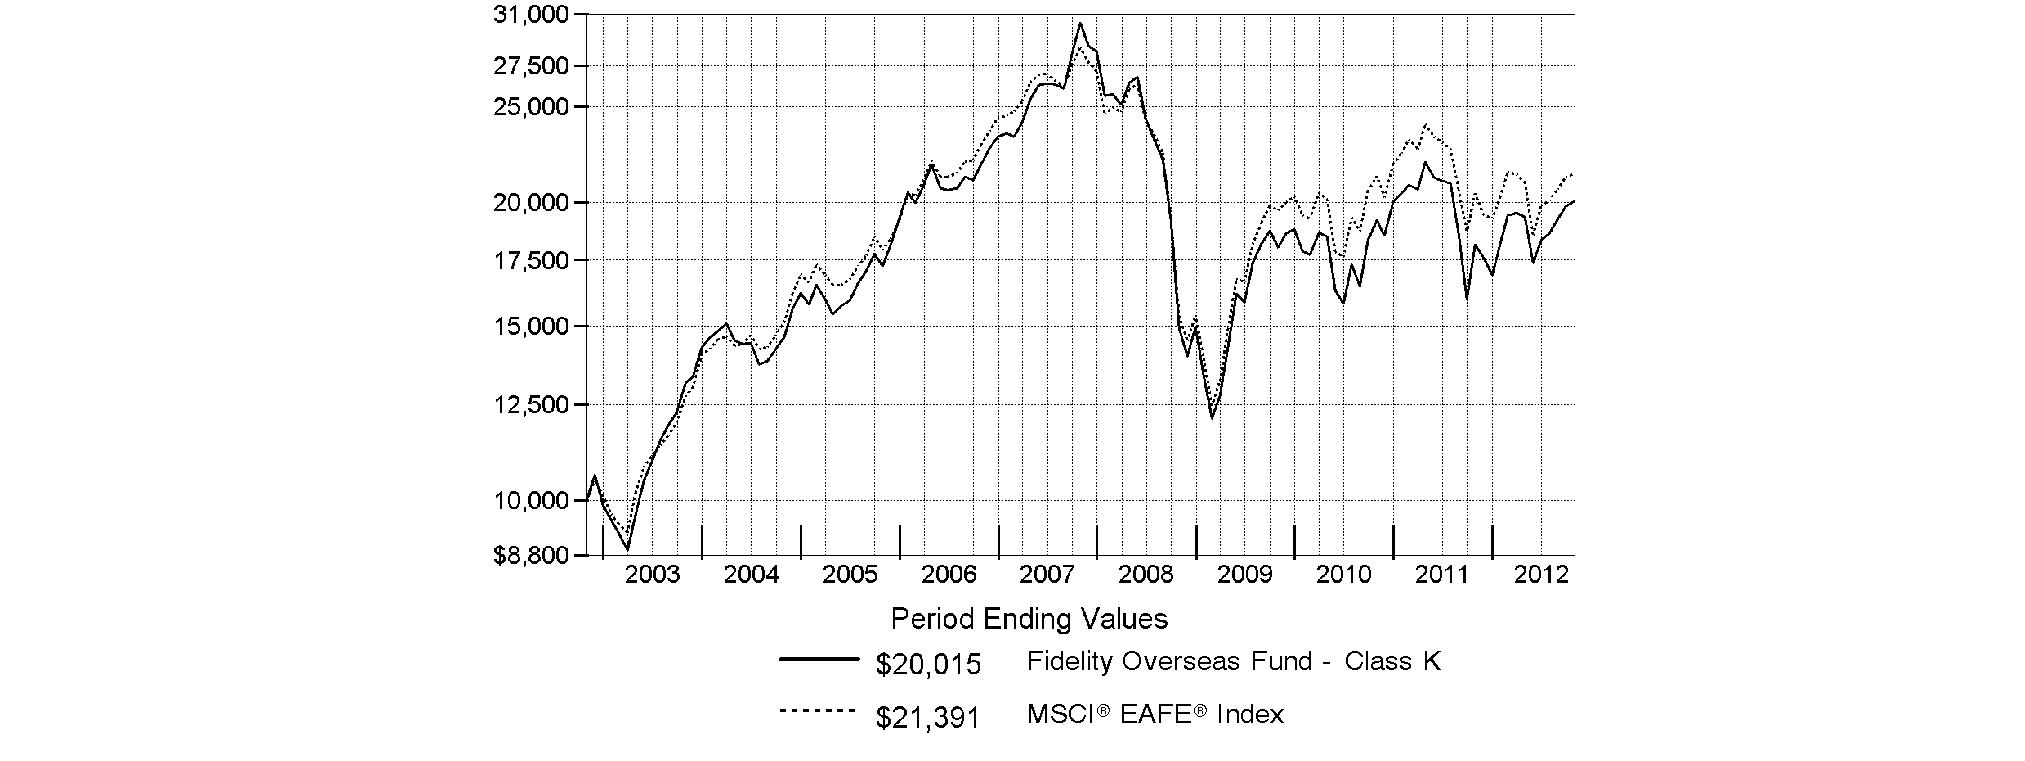
Annual Report
Market Recap: Returns for most domestic and international equities fluctuated during the 12 months ending October 31, 2012, as investor sentiment towards risk vacillated amid a changing global economic landscape. U.S. stocks overcame bouts of volatility to post strong gains for the past year, extending an uptrend that began in March 2009. The broad-based S&P 500® Index advanced 15.21%, while the blue-chip-laden Dow Jones Industrial AverageSM and technology-heavy Nasdaq Composite® Index rose 12.56% and 12.21%, respectively. Performance outside of the U.S. was relatively weak, as the MSCI® ACWI® (All Country World Index) ex USA Index rose 4.11%, hampered in part by a stronger U.S. dollar. International developed-markets generally struggled during the period as macroeconomic concerns ebbed and flowed, finishing with only a modest gain. The MSCI® EAFE® Index rose 4.76% for the year, largely buttressed in the summertime by pledges of accommodative monetary action from eurozone officials, as well as signs that the U.S. housing market was on the mend. Within the index, Asia-Pacific ex Japan showed the most impressive gain, advancing roughly 10%. A number of core European components, including Germany (+11%) and Switzerland (+10%), and the U.K. (+9%), benefited from optimism about the eurozone's ability to resolve its debt woes, which helped the region outpace the index overall. Elsewhere, Japan was among the few benchmark constituents to finish in the red, returning about -3%. Emerging-markets stocks gained 2.98% for the year, as measured by the MSCI Emerging Markets Index. A general uptrend in the final five months of the period lifted the index into positive territory for the full 12 months.
Comments from Vincent Montemaggiore, who became Portfolio Manager of Fidelity® Overseas Fund on January 12, 2012: For the year, the fund's Class K shares returned 10.59%, well ahead of the 4.76% gain of the MSCI® EAFE® Index. Versus the index, the fund was particularly helped by stock selection in consumer staples, materials and industrials, and by a sizable overweighting in the strong-performing food/beverage/tobacco segment of consumer staples. Geographically, the fund was aided by solid picks in France, the United Kingdom and Mexico, as well as positioning in Japan and an overweighting in Germany. An out-of-benchmark stake in Mexican cement/building materials producer CEMEX was the fund's top contributor. CEMEX started to outperform soon after I began managing the fund, and I took this opportunity to exit the position. A large overweighting in French spirits maker Pernod Ricard also lifted performance, as did a non-index position in Calbee, a Japanese manufacturer of potato chips. Conversely, the largest relative detractor was Japanese automaker Mazda Motor, which I sold shortly after taking over the fund. An overweighted stake in French consumer goods producer Christian Dior also detracted.
The views expressed above reflect those of the portfolio manager(s) only through the end of the period as stated on the cover of this report and do not necessarily represent the views of Fidelity or any other person in the Fidelity organization. Any such views are subject to change at any time based upon market or other conditions and Fidelity disclaims any responsibility to update such views. These views may not be relied on as investment advice and, because investment decisions for a Fidelity fund are based on numerous factors, may not be relied on as an indication of trading intent on behalf of any Fidelity fund.
Annual Report
Fidelity Overseas Fund
As a shareholder of the Fund, you incur two types of costs: (1) transaction costs, including redemption fees and (2) ongoing costs, including management fees and other Fund expenses. This Example is intended to help you understand your ongoing costs (in dollars) of investing in the Fund and to compare these costs with the ongoing costs of investing in other mutual funds.
The Example is based on an investment of $1,000 invested at the beginning of the period and held for the entire period (May 1, 2012 to October 31, 2012).
Actual Expenses
The first line of the accompanying table for each class of the Fund provides information about actual account values and actual expenses. You may use the information in this line, together with the amount you invested, to estimate the expenses that you paid over the period. Simply divide your account value by $1,000.00 (for example, an $8,600 account value divided by $1,000.00 = 8.6), then multiply the result by the number in the first line for a class of the Fund under the heading entitled "Expenses Paid During Period" to estimate the expenses you paid on your account during this period. A small balance maintenance fee of $12.00 that is charged once a year may apply for certain accounts with a value of less than $2,000. This fee is not included in the table below. If it was, the estimate of expenses you paid during the period would be higher, and your ending account value lower, by this amount. In addition, the Fund, as a shareholder in the underlying Fidelity Central Funds, will indirectly bear its pro-rata share of the fees and expenses incurred by the underlying Fidelity Central Funds. These fees and expenses are not included in the Fund's annualized expense ratio used to calculate the expense estimate in the table below.
Hypothetical Example for Comparison Purposes
The second line of the accompanying table for each class of the Fund provides information about hypothetical account values and hypothetical expenses based on a Class' actual expense ratio and an assumed rate of return of 5% per year before expenses, which is not the Class' actual return. The hypothetical account values and expenses may not be used to estimate the actual ending account balance or expenses you paid for the period. You may use this information to compare the ongoing costs of investing in the Fund and other funds. To do so, compare this 5% hypothetical example with the 5% hypothetical examples that appear in the shareholder reports of the other funds. A small balance maintenance fee of $12.00 that is charged once a year may apply for certain accounts with a value of less than $2,000. This fee is not included in the table below. If it was, the estimate of expenses you paid during the period would be higher, and your ending account value lower, by this amount. In addition, the Fund, as a shareholder in the underlying Fidelity Central Funds, will indirectly bear its pro-rata share of the fees and expenses incurred by the underlying Fidelity Central Funds. These fees and expenses are not included in the Fund's annualized expense ratio used to calculate the expense estimate in the table below.
Please note that the expenses shown in the table are meant to highlight your ongoing costs only and do not reflect any transaction costs. Therefore, the second line of the table is useful in comparing ongoing costs only, and will not help you determine the relative total costs of owning different funds. In addition, if these transactional costs were included, your costs would have been higher.
| Annualized Expense Ratio | Beginning
Account Value
May 1, 2012 | Ending
Account Value
October 31, 2012 | Expenses Paid
During Period*
May 1, 2012 to October 31, 2012 |
Overseas | .87% | | | |
Actual | | $ 1,000.00 | $ 1,034.30 | $ 4.45 |
HypotheticalA | | $ 1,000.00 | $ 1,020.76 | $ 4.42 |
Class K | .71% | | | |
Actual | | $ 1,000.00 | $ 1,035.40 | $ 3.63 |
HypotheticalA | | $ 1,000.00 | $ 1,021.57 | $ 3.61 |
A 5% return per year before expenses
* Expenses are equal to each Class' annualized expense ratio, multiplied by the average account value over the period, multiplied by 184/366 (to reflect the one-half year period).
Annual Report
Fidelity Overseas Fund
Investment Changes (Unaudited)
Geographic Diversification (% of fund's net assets) |
As of October 31, 2012 |
 | United Kingdom | 26.7% | |
 | Japan | 14.6% | |
 | Germany | 14.1% | |
 | France | 8.9% | |
 | Switzerland | 8.9% | |
 | United States of America | 5.6% | |
 | Sweden | 3.2% | |
 | Australia | 3.0% | |
 | Italy | 2.7% | |
| Other | 12.3% | |

Percentages are based on country or territory of incorporation and are adjusted for the effect of futures contracts, if applicable. |
As of April 30, 2012 |
| United Kingdom | 28.6% | |
| Japan | 14.6% | |
| Germany | 13.3% | |
| France | 11.1% | |
| Switzerland | 8.6% | |
| Italy | 3.5% | |
| Australia | 3.0% | |
| United States of America | 2.5% | |
| Sweden | 2.3% | |
| Other | 12.5% | |

Percentages are based on country or territory of incorporation and are adjusted for the effect of futures contracts, if applicable. |
Asset Allocation |
| % of fund's
net assets | % of fund's net assets
6 months ago |
Stocks | 97.7 | 98.5 |
Short-Term Investments and Net Other Assets (Liabilities) | 2.3 | 1.5 |
Top Ten Stocks as of October 31, 2012 |
| % of fund's
net assets | % of fund's net assets
6 months ago |
Nestle SA (Switzerland, Food Products) | 2.8 | 2.6 |
Royal Dutch Shell PLC Class A (United Kingdom) (United Kingdom, Oil, Gas & Consumable Fuels) | 2.5 | 2.8 |
Roche Holding AG (participation certificate) (Switzerland, Pharmaceuticals) | 2.0 | 1.8 |
Sanofi SA (France, Pharmaceuticals) | 1.9 | 1.6 |
Vodafone Group PLC (United Kingdom, Wireless Telecommunication Services) | 1.8 | 2.1 |
GlaxoSmithKline PLC (United Kingdom, Pharmaceuticals) | 1.8 | 1.9 |
Diageo PLC (United Kingdom, Beverages) | 1.6 | 1.3 |
British American Tobacco PLC (United Kingdom) (United Kingdom, Tobacco) | 1.5 | 1.7 |
Bayer AG (Germany, Pharmaceuticals) | 1.5 | 1.2 |
Anheuser-Busch InBev SA NV (Belgium, Beverages) | 1.5 | 1.2 |
| 18.9 | |
Market Sectors as of October 31, 2012 |
| % of fund's
net assets | % of fund's net assets
6 months ago |
Consumer Staples | 15.5 | 16.7 |
Financials | 14.9 | 14.2 |
Consumer Discretionary | 14.8 | 14.3 |
Industrials | 14.6 | 16.3 |
Health Care | 11.5 | 9.7 |
Materials | 10.0 | 10.5 |
Information Technology | 7.3 | 7.4 |
Energy | 6.1 | 6.5 |
Telecommunication Services | 3.0 | 2.9 |
Annual Report
Fidelity Overseas Fund
Investments October 31, 2012
Showing Percentage of Net Assets
Common Stocks - 95.2% |
| Shares | | Value |
Australia - 3.0% |
Australia & New Zealand Banking Group Ltd. | 1,001,167 | | $ 26,449,203 |
BHP Billiton Ltd. | 625,052 | | 22,130,245 |
Orica Ltd. | 327,401 | | 8,537,248 |
TOTAL AUSTRALIA | | 57,116,696 |
Bailiwick of Jersey - 1.7% |
Experian PLC | 957,900 | | 16,540,179 |
WPP PLC | 1,266,133 | | 16,365,127 |
TOTAL BAILIWICK OF JERSEY | | 32,905,306 |
Belgium - 1.5% |
Anheuser-Busch InBev SA NV | 338,012 | | 28,268,335 |
Brazil - 0.3% |
Qualicorp SA (a) | 513,000 | | 5,263,740 |
Canada - 0.3% |
Constellation Software, Inc. | 49,300 | | 5,654,877 |
Cayman Islands - 0.7% |
China Medical System Holdings Ltd. | 6,358,875 | | 3,667,611 |
Lifestyle International Holdings Ltd. | 1,306,500 | | 2,791,677 |
Shenzhou International Group Holdings Ltd. | 3,194,000 | | 6,223,108 |
TOTAL CAYMAN ISLANDS | | 12,682,396 |
Denmark - 1.1% |
Novo Nordisk A/S Series B | 137,200 | | 21,995,289 |
Finland - 0.5% |
Nokian Tyres PLC | 210,600 | | 8,735,014 |
France - 8.9% |
ALTEN | 155,300 | | 4,884,353 |
BNP Paribas SA | 294,071 | | 14,792,825 |
Bureau Veritas SA | 141,100 | | 14,983,913 |
Christian Dior SA | 106,197 | | 15,244,432 |
Eurofins Scientific SA | 73,500 | | 11,365,356 |
Ipsos SA | 272,657 | | 9,580,793 |
JCDecaux SA | 311,500 | | 6,593,249 |
Pernod Ricard SA | 149,524 | | 16,091,673 |
PPR SA | 95,400 | | 16,773,490 |
Sanofi SA | 417,284 | | 36,649,000 |
VINCI SA | 232,900 | | 10,307,465 |
Vivendi SA | 586,264 | | 11,994,802 |
TOTAL FRANCE | | 169,261,351 |
Germany - 11.6% |
adidas AG | 187,200 | | 15,948,680 |
Allianz AG | 135,843 | | 16,843,134 |
BASF AG | 278,346 | | 23,064,548 |
Bayer AG | 332,097 | | 28,921,769 |
Bayerische Motoren Werke AG (BMW) | 148,773 | | 11,849,534 |
Brenntag AG | 125,900 | | 15,868,137 |
Deutsche Boerse AG | 187,492 | | 10,148,422 |
Deutsche Post AG | 757,816 | | 15,023,410 |
|
| Shares | | Value |
Fresenius SE & Co. KGaA | 161,500 | | $ 18,420,884 |
GEA Group AG | 323,522 | | 10,101,733 |
Linde AG | 88,707 | | 14,918,341 |
Pfeiffer Vacuum Technology AG | 58,589 | | 5,976,488 |
SAP AG | 339,871 | | 24,784,430 |
Software AG (Bearer) | 226,100 | | 9,058,470 |
TOTAL GERMANY | | 220,927,980 |
Greece - 0.1% |
Metka SA | 219,083 | | 1,990,591 |
Hong Kong - 0.1% |
City Telecom (HK) Ltd. (CTI) | 7,267,000 | | 1,666,537 |
Ireland - 1.8% |
Accenture PLC Class A | 136,200 | | 9,181,242 |
DCC PLC (Ireland) | 389,100 | | 11,117,998 |
Kerry Group PLC Class A | 260,664 | | 13,639,394 |
TOTAL IRELAND | | 33,938,634 |
Italy - 2.7% |
ENI SpA | 999,600 | | 23,001,723 |
Pirelli & C SpA (d) | 714,300 | | 8,272,380 |
Prysmian SpA | 510,200 | | 9,813,629 |
Saipem SpA | 249,473 | | 11,207,465 |
TOTAL ITALY | | 52,295,197 |
Japan - 14.6% |
ABC-Mart, Inc. | 303,200 | | 13,293,248 |
Air Water, Inc. | 629,000 | | 7,879,243 |
Aozora Bank Ltd. | 2,574,000 | | 7,254,791 |
Asahi Group Holdings | 311,200 | | 7,090,978 |
Credit Saison Co. Ltd. | 324,000 | | 7,114,769 |
Daito Trust Construction Co. Ltd. | 92,300 | | 9,319,028 |
Don Quijote Co. Ltd. | 203,800 | | 8,028,949 |
Fanuc Corp. | 100,100 | | 15,937,254 |
Fast Retailing Co. Ltd. | 30,800 | | 6,859,877 |
GMO Internet, Inc. | 574,800 | | 4,017,768 |
Hitachi Ltd. | 2,750,000 | | 14,571,590 |
Honda Motor Co. Ltd. sponsored ADR | 571,700 | | 17,242,472 |
Hoya Corp. | 487,700 | | 9,872,519 |
Japan Tobacco, Inc. | 571,500 | | 15,792,672 |
JSR Corp. | 344,300 | | 5,900,068 |
Kansai Paint Co. Ltd. | 638,000 | | 6,865,113 |
Keyence Corp. | 51,890 | | 13,767,133 |
Misumi Group, Inc. | 233,500 | | 5,730,007 |
Mitsubishi Corp. | 137,200 | | 2,449,079 |
Nakanishi, Inc. | 34,300 | | 3,738,068 |
Nitori Holdings Co. Ltd. | 64,000 | | 5,227,108 |
NuFlare Technology, Inc. | 458 | | 3,482,475 |
Obic Co. Ltd. | 25,590 | | 5,266,738 |
ORIX Corp. | 142,310 | | 14,617,838 |
Rakuten, Inc. | 1,019,000 | | 9,165,001 |
Seven Bank Ltd. | 4,241,900 | | 12,115,160 |
Shinsei Bank Ltd. | 5,435,000 | | 7,965,614 |
Ship Healthcare Holdings, Inc. | 179,600 | | 5,991,166 |
Common Stocks - continued |
| Shares | | Value |
Japan - continued |
SMC Corp. | 62,400 | | $ 9,833,296 |
Unicharm Corp. | 171,400 | | 9,275,310 |
USS Co. Ltd. | 114,590 | | 12,043,218 |
TOTAL JAPAN | | 277,707,550 |
Netherlands - 1.0% |
AEGON NV | 1,186,993 | | 6,638,444 |
Akzo Nobel NV | 229,175 | | 12,466,986 |
TOTAL NETHERLANDS | | 19,105,430 |
Norway - 1.2% |
DnB NOR ASA | 1,114,600 | | 13,919,548 |
Telenor ASA | 448,400 | | 8,816,523 |
TOTAL NORWAY | | 22,736,071 |
South Africa - 0.3% |
Coronation Fund Managers Ltd. | 1,665,500 | | 6,425,236 |
Spain - 1.7% |
Amadeus IT Holding SA Class A | 614,400 | | 15,210,372 |
Banco Bilbao Vizcaya Argentaria SA | 653,621 | | 5,461,628 |
Inditex SA | 99,960 | | 12,754,197 |
TOTAL SPAIN | | 33,426,197 |
Sweden - 3.2% |
ASSA ABLOY AB (B Shares) | 374,200 | | 12,473,521 |
Atlas Copco AB (A Shares) | 538,600 | | 13,243,930 |
Nordea Bank AB | 1,256,000 | | 11,408,886 |
Svenska Handelsbanken AB (A Shares) | 418,500 | | 14,335,087 |
Swedbank AB (A Shares) | 536,100 | | 9,941,398 |
TOTAL SWEDEN | | 61,402,822 |
Switzerland - 8.9% |
Aryzta AG | 307,320 | | 15,344,551 |
Nestle SA | 823,845 | | 52,280,939 |
Roche Holding AG (participation certificate) | 197,550 | | 37,991,200 |
Schindler Holding AG (participation certificate) | 91,154 | | 12,009,659 |
Syngenta AG (Switzerland) | 44,730 | | 17,439,759 |
UBS AG | 1,268,663 | | 19,034,505 |
Zurich Financial Services AG | 60,037 | | 14,794,901 |
TOTAL SWITZERLAND | | 168,895,514 |
United Kingdom - 26.7% |
AMEC PLC | 655,450 | | 11,211,964 |
Anglo American PLC (United Kingdom) | 400,100 | | 12,286,936 |
Ashmore Group PLC | 1,712,800 | | 10,052,781 |
Babcock International Group PLC | 776,000 | | 12,247,201 |
Barclays PLC | 3,259,690 | | 12,053,470 |
BHP Billiton PLC | 736,867 | | 23,617,513 |
BP PLC | 944,300 | | 6,743,818 |
|
| Shares | | Value |
British American Tobacco PLC (United Kingdom) | 587,500 | | $ 29,139,771 |
Bunzl PLC | 615,207 | | 10,176,101 |
Diageo PLC | 1,045,980 | | 29,903,033 |
Domino Printing Sciences PLC | 852,314 | | 7,454,786 |
Elementis PLC | 2,208,000 | | 7,457,694 |
GlaxoSmithKline PLC | 1,547,000 | | 34,664,349 |
IMI PLC | 658,500 | | 10,143,036 |
Johnson Matthey PLC | 257,900 | | 9,360,026 |
Kingfisher PLC | 2,438,561 | | 11,392,485 |
London Stock Exchange Group PLC | 409,300 | | 6,443,254 |
Meggitt PLC | 2,255,900 | | 14,052,170 |
Next PLC | 296,500 | | 17,062,485 |
Reckitt Benckiser Group PLC | 396,600 | | 24,000,497 |
Reed Elsevier PLC | 1,207,000 | | 11,803,645 |
Rolls-Royce Group PLC | 1,011,606 | | 13,949,535 |
Rolls-Royce Group PLC Class C | 76,882,056 | | 124,068 |
Rotork PLC | 264,300 | | 9,715,992 |
Royal Dutch Shell PLC: | | | |
Class A (United Kingdom) | 1,372,203 | | 47,084,057 |
Class B (United Kingdom) | 235,419 | | 8,327,344 |
SABMiller PLC | 369,500 | | 15,828,269 |
Sage Group PLC | 1,739,400 | | 8,721,215 |
Serco Group PLC | 1,055,467 | | 9,648,967 |
Spirax-Sarco Engineering PLC | 244,900 | | 7,647,263 |
Standard Chartered PLC (United Kingdom) | 948,765 | | 22,407,202 |
SuperGroup PLC (a) | 257,000 | | 2,772,495 |
Tate & Lyle PLC | 954,369 | | 11,181,220 |
The Restaurant Group PLC | 787,200 | | 4,761,249 |
Vodafone Group PLC | 12,888,959 | | 35,001,716 |
TOTAL UNITED KINGDOM | | 508,437,607 |
United States of America - 3.3% |
Albemarle Corp. | 151,700 | | 8,360,187 |
Corrections Corp. of America | 310,112 | | 10,435,269 |
FMC Corp. | 163,900 | | 8,771,928 |
JPMorgan Chase & Co. | 85,300 | | 3,555,304 |
Lorillard, Inc. | 73,000 | | 8,468,730 |
McGraw-Hill Companies, Inc. | 151,400 | | 8,369,392 |
National Oilwell Varco, Inc. | 89,300 | | 6,581,410 |
Varian Medical Systems, Inc. (a)(d) | 125,000 | | 8,345,000 |
TOTAL UNITED STATES OF AMERICA | | 62,887,220 |
TOTAL COMMON STOCKS (Cost $1,707,811,265) |
1,813,725,590
|
Nonconvertible Preferred Stocks - 2.5% |
| | | |
Germany - 2.5% |
Henkel AG & Co. KGaA | 234,500 | | 18,726,186 |
ProSiebenSat.1 Media AG | 295,800 | | 8,243,125 |
Nonconvertible Preferred Stocks - continued |
| Shares | | Value |
Germany - continued |
Sartorius AG (non-vtg.) | 51,800 | | $ 4,330,567 |
Volkswagen AG | 74,368 | | 15,384,177 |
TOTAL NONCONVERTIBLE PREFERRED STOCKS (Cost $37,926,143) |
46,684,055
|
Money Market Funds - 2.3% |
| | | |
Fidelity Cash Central Fund, 0.19% (b) | 35,550,361 | | 35,550,361 |
Fidelity Securities Lending Cash Central Fund, 0.19% (b)(c) | 9,174,805 | | 9,174,805 |
TOTAL MONEY MARKET FUNDS (Cost $44,725,166) |
44,725,166
|
TOTAL INVESTMENT PORTFOLIO - 100.0% (Cost $1,790,462,574) | 1,905,134,811 |
NET OTHER ASSETS (LIABILITIES) - 0.0% | | 74,448 |
NET ASSETS - 100% | $ 1,905,209,259 |
Legend |
(a) Non-income producing |
(b) Affiliated fund that is available only to investment companies and other accounts managed by Fidelity Investments. The rate quoted is the annualized seven-day yield of the fund at period end. A complete unaudited listing of the fund's holdings as of its most recent quarter end is available upon request. In addition, each Fidelity Central Fund's financial statements, which are not covered by the Fund's Report of Independent Registered Public Accounting Firm, are available on the SEC's website or upon request. |
(c) Investment made with cash collateral received from securities on loan. |
(d) Security or a portion of the security is on loan at period end. |
Affiliated Central Funds |
Information regarding fiscal year to date income earned by the Fund from investments in Fidelity Central Funds is as follows: |
Fund | Income earned |
Fidelity Cash Central Fund | $ 84,150 |
Fidelity Securities Lending Cash Central Fund | 1,140,979 |
Total | $ 1,225,129 |
Other Information |
Categorizations in the Schedule of Investments are based on country or territory of incorporation. |
The following is a summary of the inputs used, as of October 31, 2012, involving the Fund's assets and liabilities carried at fair value. The inputs or methodology used for valuing securities may not be an indication of the risk associated with investing in those securities. For more information on valuation inputs, and their aggregation into the levels used in the tables below, please refer to the Security Valuation section in the accompanying Notes to Financial Statements. |
Valuation Inputs at Reporting Date: |
Description | Total | Level 1 | Level 2 | Level 3 |
Investments in Securities: | | | | |
Equities: | | | | |
Consumer Discretionary | $ 282,780,607 | $ 266,415,480 | $ 16,365,127 | $ - |
Consumer Staples | 295,031,558 | 207,720,419 | 87,311,139 | - |
Energy | 114,157,781 | 29,000,839 | 85,156,942 | - |
Financials | 283,092,428 | 239,904,381 | 43,188,047 | - |
Health Care | 221,343,999 | 128,035,361 | 93,308,638 | - |
Industrials | 281,539,891 | 281,539,891 | - | - |
Information Technology | 135,927,968 | 111,143,538 | 24,784,430 | - |
Materials | 189,055,835 | 125,868,318 | 63,187,517 | - |
Telecommunication Services | 57,479,578 | 20,811,325 | 36,668,253 | - |
Money Market Funds | 44,725,166 | 44,725,166 | - | - |
Total Investments in Securities: | $ 1,905,134,811 | $ 1,455,164,718 | $ 449,970,093 | $ - |
The following is a summary of transfers between Level 1 and Level 2 for the period ended October 31, 2012. Transfers are assumed to have occurred at the beginning of the period, and are primarily attributable to the valuation techniques used for foreign equity securities, as discussed in the accompanying Notes to Financial Statements. |
Transfers | Total |
Level 1 to Level 2 | $ 0 |
Level 2 to Level 1 | $ 147,897,797 |
See accompanying notes which are an integral part of the financial statements.
Annual Report
Fidelity Overseas Fund
Statement of Assets and Liabilities
| October 31, 2012 |
| | |
Assets | | |
Investment in securities, at value (including securities loaned of $8,755,176) - See accompanying schedule: Unaffiliated issuers (cost $1,745,737,408) | $ 1,860,409,645 | |
Fidelity Central Funds (cost $44,725,166) | 44,725,166 | |
Total Investments (cost $1,790,462,574) | | $ 1,905,134,811 |
Foreign currency held at value (cost $12,821) | | 12,825 |
Receivable for investments sold | | 23,918,482 |
Receivable for fund shares sold | | 1,259,145 |
Dividends receivable | | 3,757,549 |
Distributions receivable from Fidelity Central Funds | | 11,422 |
Other receivables | | 580,381 |
Total assets | | 1,934,674,615 |
| | |
Liabilities | | |
Payable for investments purchased | $ 12,796,237 | |
Payable for fund shares redeemed | 5,483,952 | |
Accrued management fee | 1,310,526 | |
Other affiliated payables | 392,932 | |
Other payables and accrued expenses | 306,904 | |
Collateral on securities loaned, at value | 9,174,805 | |
Total liabilities | | 29,465,356 |
| | |
Net Assets | | $ 1,905,209,259 |
Net Assets consist of: | | |
Paid in capital | | $ 3,335,743,843 |
Undistributed net investment income | | 43,880,081 |
Accumulated undistributed net realized gain (loss) on investments and foreign currency transactions | | (1,589,020,510) |
Net unrealized appreciation (depreciation) on investments and assets and liabilities in foreign currencies | | 114,605,845 |
Net Assets | | $ 1,905,209,259 |
| | |
Overseas:
Net Asset Value, offering price and redemption price per share ($1,639,724,856 ÷ 52,300,348 shares) | | $ 31.35 |
| | |
Class K:
Net Asset Value, offering price and redemption price per share ($265,484,403 ÷ 8,476,978 shares) | | $ 31.32 |
Statement of Operations
| Year ended October 31, 2012 |
| | |
Investment Income | | |
Dividends | | $ 66,575,637 |
Interest | | 49 |
Income from Fidelity Central Funds | | 1,225,129 |
Income before foreign taxes withheld | | 67,800,815 |
Less foreign taxes withheld | | (5,228,771) |
Total income | | 62,572,044 |
| | |
Expenses | | |
Management fee
Basic fee | $ 13,921,215 | |
Performance adjustment | (6,285,452) | |
Transfer agent fees | 4,050,766 | |
Accounting and security lending fees | 877,870 | |
Custodian fees and expenses | 200,601 | |
Independent trustees' compensation | 13,738 | |
Appreciation in deferred trustee compensation account | 321 | |
Registration fees | 61,330 | |
Audit | 87,788 | |
Legal | 102,645 | |
Interest | 559 | |
Miscellaneous | 30,452 | |
Total expenses before reductions | 13,061,833 | |
Expense reductions | (533,186) | 12,528,647 |
Net investment income (loss) | | 50,043,397 |
Realized and Unrealized Gain (Loss) Net realized gain (loss) on: | | |
Investment securities: | | |
Unaffiliated issuers | (145,800,189) | |
Foreign currency transactions | (567,202) | |
Futures contracts | 4,377,933 | |
Total net realized gain (loss) | | (141,989,458) |
Change in net unrealized appreciation (depreciation) on: Investment securities | 260,262,752 | |
Assets and liabilities in foreign currencies | (89,261) | |
Total change in net unrealized appreciation (depreciation) | | 260,173,491 |
Net gain (loss) | | 118,184,033 |
Net increase (decrease) in net assets resulting from operations | | $ 168,227,430 |
See accompanying notes which are an integral part of the financial statements.
Annual Report
Fidelity Overseas Fund
Financial Statements - continued
Statement of Changes in Net Assets
| Year ended
October 31,
2012 | Year ended
October 31,
2011 |
Increase (Decrease) in Net Assets | | |
Operations | | |
Net investment income (loss) | $ 50,043,397 | $ 70,820,055 |
Net realized gain (loss) | (141,989,458) | 282,595,294 |
Change in net unrealized appreciation (depreciation) | 260,173,491 | (436,401,912) |
Net increase (decrease) in net assets resulting from operations | 168,227,430 | (82,986,563) |
Distributions to shareholders from net investment income | (70,077,891) | (92,196,839) |
Distributions to shareholders from net realized gain | (1,661,965) | - |
Total distributions | (71,739,856) | (92,196,839) |
Share transactions - net increase (decrease) | (857,000,541) | (3,671,962,139) |
Redemption fees | 66,899 | 112,180 |
Total increase (decrease) in net assets | (760,446,068) | (3,847,033,361) |
| | |
Net Assets | | |
Beginning of period | 2,665,655,327 | 6,512,688,688 |
End of period (including undistributed net investment income of $43,880,081 and undistributed net investment income of $64,516,366, respectively) | $ 1,905,209,259 | $ 2,665,655,327 |
Financial Highlights - Overseas
Years ended October 31, | 2012 | 2011 | 2010 | 2009 | 2008 |
Selected Per-Share Data | | | | | |
Net asset value, beginning of period | $ 29.28 | $ 31.56 | $ 30.13 | $ 25.43 | $ 58.39 |
Income from Investment Operations | | | | | |
Net investment income (loss) B | .73 | .47 | .42 | .52 | .55 |
Net realized and unrealized gain (loss) | 2.19 | (2.27) | 1.49 | 4.55 | (27.19) |
Total from investment operations | 2.92 | (1.80) | 1.91 | 5.07 | (26.64) |
Distributions from net investment income | (.83) | (.48) | (.47) | (.37) | (.57) |
Distributions from net realized gain | (.02) | - | (.01) | - | (5.75) |
Total distributions | (.85) | (.48) | (.48) | (.37) | (6.32) |
Redemption fees added to paid in capital B,F | - | - | - | - | - |
Net asset value, end of period | $ 31.35 | $ 29.28 | $ 31.56 | $ 30.13 | $ 25.43 |
Total Return A | 10.37% | (5.83)% | 6.33% | 20.44% | (50.88)% |
Ratios to Average Net Assets C,E | | | | | |
Expenses before reductions | .69% | .73% | .89% | 1.02% | 1.13% |
Expenses net of fee waivers, if any | .69% | .73% | .89% | 1.02% | 1.13% |
Expenses net of all reductions | .67% | .67% | .85% | .98% | 1.10% |
Net investment income (loss) | 2.52% | 1.44% | 1.41% | 2.01% | 1.33% |
Supplemental Data | | | | | |
Net assets, end of period (000 omitted) | $ 1,639,725 | $ 2,215,717 | $ 5,548,689 | $ 6,602,017 | $ 5,464,901 |
Portfolio turnover rate D | 90% | 77% | 111% | 115% | 113% |
A Total returns would have been lower if certain expenses had not been reduced during the applicable periods shown.
B Calculated based on average shares outstanding during the period.
C Fees and expenses of any underlying Fidelity Central Funds are not included in the Fund's expense ratio. The Fund indirectly bears its proportionate share of the expenses of any underlying Fidelity Central Funds.
D Amount does not include the portfolio activity of any underlying Fidelity Central Funds.
E Expense ratios reflect operating expenses of the class. Expenses before reductions do not reflect amounts reimbursed by the investment adviser or reductions from brokerage service arrangements or reductions from other expense offset arrangements and do not represent the amount paid by the class during periods when reimbursements or reductions occur. Expenses net of fee waivers reflect expenses after reimbursement by the investment adviser but prior to reductions from brokerage service arrangements or other expense offset arrangements. Expenses net of all reductions represent the net expenses paid by the class.
F Amount represents less than $.01 per share.
See accompanying notes which are an integral part of the financial statements.
Annual Report
Financial Highlights - Class K
Years ended October 31, | 2012 | 2011 | 2010 | 2009 | 2008 G |
Selected Per-Share Data | | | | | |
Net asset value, beginning of period | $ 29.29 | $ 31.59 | $ 30.16 | $ 25.45 | $ 45.00 |
Income from Investment Operations | | | | | |
Net investment income (loss) D | .79 | .52 | .47 | .59 | .13 |
Net realized and unrealized gain (loss) | 2.18 | (2.27) | 1.50 | 4.54 | (19.68) |
Total from investment operations | 2.97 | (1.75) | 1.97 | 5.13 | (19.55) |
Distributions from net investment income | (.92) | (.55) | (.53) | (.42) | - |
Distributions from net realized gain | (.02) | - | (.01) | - | - |
Total distributions | (.94) | (.55) | (.54) | (.42) | - |
Redemption fees added to paid in capital D,I | - | - | - | - | - |
Net asset value, end of period | $ 31.32 | $ 29.29 | $ 31.59 | $ 30.16 | $ 25.45 |
Total Return B,C | 10.59% | (5.67)% | 6.55% | 20.73% | (43.44)% |
Ratios to Average Net Assets E,H | | | | | |
Expenses before reductions | .51% | .56% | .69% | .78% | .96% A |
Expenses net of fee waivers, if any | .51% | .55% | .69% | .78% | .96% A |
Expenses net of all reductions | .48% | .50% | .66% | .74% | .93% A |
Net investment income (loss) | 2.70% | 1.61% | 1.60% | 2.25% | 1.08% A |
Supplemental Data | | | | | |
Net assets, end of period (000 omitted) | $ 265,484 | $ 291,323 | $ 368,004 | $ 383,048 | $ 44,277 |
Portfolio turnover rate F | 90% | 77% | 111% | 115% | 113% |
A Annualized
B Total returns for periods of less than one year are not annualized.
C Total returns would have been lower if certain expenses had not been reduced during the applicable periods shown.
D Calculated based on average shares outstanding during the period.
E Fees and expenses of any underlying Fidelity Central Funds are not included in the Fund's expense ratio. The Fund indirectly bears its proportionate share of the expenses of any underlying Fidelity Central Funds.
F Amount does not include the portfolio activity of any underlying Fidelity Central Funds.
G For the period May 9, 2008 (commencement of sale of shares) to October 31, 2008.
H Expense ratios reflect operating expenses of the class. Expenses before reductions do not reflect amounts reimbursed by the investment adviser or reductions from brokerage service arrangements or reductions from other expense offset arrangements and do not represent the amount paid by the class during periods when reimbursements or reductions occur. Expense ratios before reductions for start-up periods may not be representative of longer-term operating periods. Expenses net of fee waivers reflect expenses after reimbursement by the investment adviser but prior to reductions from brokerage service arrangements or other expense offset arrangements. Expenses net of all reductions represent the net expenses paid by the class.
I Amount represents less than $.01 per share.
See accompanying notes which are an integral part of the financial statements.
Annual Report
Fidelity Overseas Fund
Notes to Financial Statements
For the period ended October 31, 2012
1. Organization.
Fidelity Overseas Fund (the Fund) is a fund of Fidelity Investment Trust (the Trust) and is authorized to issue an unlimited number of shares. The Trust is registered under the Investment Company Act of 1940, as amended (the 1940 Act), as an open-end management investment company organized as a Massachusetts business trust. The Fund offers Overseas and Class K shares each of which has equal rights as to assets and voting privileges. The Fund offered Class F shares during the period June 26, 2009 through December 16, 2011, and all outstanding shares were redeemed by December 16, 2011. Each class has exclusive voting rights with respect to matters that affect that class. Investment income, realized and unrealized capital gains and losses, the common expenses of the Fund, and certain fund-level expense reductions, if any, are allocated on a pro-rata basis to each class based on the relative net assets of each class to the total net assets of the Fund. Each class differs with respect to transfer agent fees incurred. Certain expense reductions may also differ by class.
2. Investments in Fidelity Central Funds.
The Fund invests in Fidelity Central Funds, which are open-end investment companies available only to other investment companies and accounts managed by Fidelity Management & Research Company (FMR) and its affiliates. The Fund's Schedule of Investments lists each of the Fidelity Central Funds held as of period end, as an investment of the Fund, but does not include the underlying holdings of each Fidelity Central Fund. As an Investing Fund, the Fund indirectly bears its proportionate share of the expenses of the underlying Fidelity Central Funds.
The Money Market Central Funds seek preservation of capital and current income and are managed by Fidelity Investments Money Management, Inc. (FIMM), an affiliate of FMR.
A complete unaudited list of holdings for each Fidelity Central Fund is available upon request or at the Securities and Exchange Commission (the SEC) web site at www.sec.gov. In addition, the financial statements of the Fidelity Central Funds, which are not covered by the Fund's Report of Independent Registered Public Accounting Firm, are available on the SEC web site or upon request.
3. Significant Accounting Policies.
The financial statements have been prepared in conformity with accounting principles generally accepted in the United States of America (GAAP), which require management to make certain estimates and assumptions at the date of the financial statements. Actual results could differ from those estimates. Subsequent events, if any, through the date that the financial statements were issued have been evaluated in the preparation of the financial statements. The following summarizes the significant accounting policies of the Fund:
Security Valuation. Investments are valued as of 4:00 p.m. Eastern time on the last calendar day of the period. In accordance with valuation policies and procedures approved by the Board of Trustees (the Board), the Fund attempts to obtain prices from one or more third party pricing vendors or brokers to value its investments. When current market prices, quotations or rates are not readily available or reliable, securities will be fair valued in good faith by the FMR Fair Value Committee (the Committee), in accordance with procedures adopted by the Fund's Board. Factors used in determining fair value vary by security type and may include market or security specific events. The frequency with which these procedures are used cannot be predicted and they may be utilized to a significant extent. The Committee oversees the Fund's valuation policies and procedures and is responsible for approving and reporting to the Board all fair value determinations.
The Fund categorizes the inputs to valuation techniques used to value its investments into a disclosure hierarchy consisting of three levels as shown below:
Level 1 - quoted prices in active markets for identical investments
Level 2 - other significant observable inputs (including quoted prices for similar investments, interest rates, prepayment speeds, etc.)
Level 3 - unobservable inputs (including the Fund's own assumptions based on the best information available)
Valuation techniques used to value the Fund's investments by major category are as follows:
Equity securities, including restricted securities, for which market quotations are readily available, are valued at the last reported sale price or official closing price as reported by a third party pricing vendor on the primary market or exchange on which they are traded and are categorized as Level 1 in the hierarchy. In the event there were no sales during the day or closing prices are not available, securities are valued at the last quoted bid price or may be valued using the last available price and are generally categorized as Level 2 in the hierarchy. For foreign equity securities, when significant market or security specific events arise, comparisons to the valuation of American Depositary Receipts (ADRs), futures contracts, Exchange-Traded Funds (ETFs) and certain indexes as well as quoted prices for similar securities are used and are categorized as Level 2 in the hierarchy. Utilizing these techniques may result in transfers between Level 1 and Level 2.
Annual Report
Fidelity Overseas Fund
Notes to Financial Statements - continued
3. Significant Accounting Policies - continued
Security Valuation - continued
Investments in open-end mutual funds, including the Fidelity Central Funds, are valued at their closing net asset value (NAV) each business day and are categorized as Level 1 in the hierarchy.
Changes in valuation techniques may result in transfers in or out of an assigned level within the disclosure hierarchy. The aggregate value of investments by input level, as of October 31, 2012, including information on transfers between Levels 1 and 2, is included at the end of the Fund's Schedule of Investments.
Foreign Currency Translation. The Fund may use foreign currency contracts to facilitate transactions in foreign-denominated securities. Gains and losses from these transactions may arise from changes in the value of the foreign currency or if the counterparties do not perform under the contracts' terms.
Foreign-denominated assets, including investment securities, and liabilities are translated into U.S. dollars at the exchange rates at period end. Purchases and sales of investment securities, income and dividends received and expenses denominated in foreign currencies are translated into U.S. dollars at the exchange rate in effect on the transaction date.
The effects of exchange rate fluctuations on investments are included with the net realized and unrealized gain (loss) on investment securities. Other foreign currency transactions resulting in realized and unrealized gain (loss) are disclosed separately.
Investment Transactions and Income. For financial reporting purposes, the Fund's investment holdings and NAV include trades executed through the end of the last business day of the period. The NAV per share for processing shareholder transactions is calculated as of the close of business of the New York Stock Exchange (NYSE), normally 4:00 p.m. Eastern time and includes trades executed through the end of the prior business day. Gains and losses on securities sold are determined on the basis of identified cost and may include proceeds received from litigation. Dividend income is recorded on the ex-dividend date, except for certain dividends from foreign securities where the ex-dividend date may have passed, which are recorded as soon as the Fund is informed of the ex-dividend date. Non-cash dividends included in dividend income, if any, are recorded at the fair market value of the securities received. Distributions received on securities that represent a return of capital or capital gain are recorded as a reduction of cost of investments and/or as a realized gain. The Fund estimates the components of distributions received that may be considered return of capital distributions or capital gain distributions. Interest income and distributions from the Fidelity Central Funds are accrued as earned. Interest income includes coupon interest and amortization of premium and accretion of discount on debt securities. Investment income is recorded net of foreign taxes withheld where recovery of such taxes is uncertain.
Expenses. Expenses directly attributable to a fund are charged to that fund. Expenses attributable to more than one fund are allocated among the respective funds on the basis of relative net assets or other appropriate methods. Expense estimates are accrued in the period to which they relate and adjustments are made when actual amounts are known.
Deferred Trustee Compensation. Under a Deferred Compensation Plan (the Plan), independent Trustees may elect to defer receipt of a portion of their annual compensation. Deferred amounts are invested in a cross-section of Fidelity funds, are marked-to-market and remain in the Fund until distributed in accordance with the Plan. The investment of deferred amounts and the offsetting payable to the Trustees are included in the accompanying Statement of Assets and Liabilities.
Income Tax Information and Distributions to Shareholders. Each year, the Fund intends to qualify as a regulated investment company under Subchapter M of the Internal Revenue Code, including distributing substantially all of its taxable income and realized gains. As a result, no provision for income taxes is required. As of October 31, 2012, the Fund did not have any unrecognized tax benefits in the financial statements; nor is the Fund aware of any tax positions for which it is reasonably possible that the total amounts of unrecognized tax benefits will significantly change in the next twelve months. The Fund files a U.S. federal tax return, in addition to state and local tax returns as required. A fund's federal income tax returns are subject to examination by the Internal Revenue Service (IRS) for a period of three fiscal years after they are filed. State and local tax returns may be subject to examination for an additional fiscal year depending on the jurisdiction. Foreign taxes are provided for based on the Fund's understanding of the tax rules and rates that exist in the foreign markets in which it invests.
Distributions are declared and recorded on the ex-dividend date. Income dividends and capital gain distributions are declared separately for each class. Income and capital gain distributions are determined in accordance with income tax regulations, which may differ from GAAP.
Capital accounts within the financial statements are adjusted for permanent book-tax differences. These adjustments have no impact on net assets or the results of operations. Temporary book-tax differences will reverse in a subsequent period.
Book-tax differences are primarily due to futures transactions, foreign currency transactions, passive foreign investment companies (PFIC), deferred trustees compensation, capital loss carryforwards and losses deferred due to wash sales.
Annual Report
3. Significant Accounting Policies - continued
Income Tax Information and Distributions to Shareholders - continued
The federal tax cost of investment securities and unrealized appreciation (depreciation) as of period end were as follows:
Gross unrealized appreciation | $ 181,334,156 |
Gross unrealized depreciation | (78,692,488) |
Net unrealized appreciation (depreciation) on securities and other investments | $ 102,641,668 |
| |
Tax Cost | $ 1,802,493,143 |
The tax-based components of distributable earnings as of period end were as follows:
Undistributed ordinary income | $ 44,077,257 |
Capital loss carryforward | $ (1,576,989,942) |
Net unrealized appreciation (depreciation) | $ 102,575,276 |
Capital loss carryforwards are only available to offset future capital gains of the Fund to the extent provided by regulations and may be limited. Under the Regulated Investment Company Modernization Act of 2010 (the Act), the Fund is permitted to carry forward capital losses incurred in taxable years beginning after December 22, 2010 for an unlimited period and such capital losses are required to be used prior to any losses that expire. Capital loss carryforwards were as follows:
Fiscal year of expiration | |
| |
2016 | $ (464,379,964) |
2017 | (939,719,765) |
Total with expiration | (1,404,099,729) |
No expiration | |
Short-term | (45,748,177) |
Long-term | (127,142,036) |
Total no expiration | (172,890,213) |
Total capital loss carryforward | $ (1,576,989,942) |
The tax character of distributions paid was as follows:
| October 31, 2012 | October 31, 2011 |
Ordinary Income | $ 71,739,856 | $ 92,196,839 |
Short-Term Trading (Redemption) Fees. Shares held by investors in the Fund less than 30 days are subject to a redemption fee equal to 1.00% of the net asset value of shares redeemed. All redemption fees, which reduce the proceeds of the shareholder redemption, are retained by the Fund and accounted for as an addition to paid in capital.
New Accounting Pronouncement. In December 2011, the Financial Accounting Standards Board issued Accounting Standard Update No. 2011-11, Disclosures about Offsetting Assets and Liabilities. The update creates new disclosure requirements requiring entities to disclose both gross and net information for derivatives and other financial instruments that are either offset in the Statement of Assets and Liabilities or subject to an enforceable master netting arrangement or similar agreement. The disclosure requirements are effective for annual reporting periods beginning on or after January 1, 2013, and interim periods within those annual periods. Management is currently evaluating the impact of the update's adoption on the Fund's financial statement disclosures.
4. Derivative Instruments.
Risk Exposures and the Use of Derivative Instruments. The Fund's investment objective allows the Fund to enter into various types of derivative contracts, including futures contracts. Derivatives are investments whose value is primarily derived from underlying assets, indices or reference rates and may be transacted on an exchange or over-the-counter (OTC). Derivatives may involve a future commitment to buy or sell a specified instrument based on specified terms, to exchange future cash flows at periodic intervals based on a notional principal amount, or for one party to make one or more payments upon the occurrence of specified events in exchange for periodic payments from the other party.
Annual Report
Fidelity Overseas Fund
Notes to Financial Statements - continued
4. Derivative Instruments - continued
Risk Exposures and the Use of Derivative Instruments - continued
The Fund used derivatives to increase returns and to manage exposure to certain risks as defined below. The success of any strategy involving derivatives depends on analysis of numerous economic factors, and if the strategies for investment do not work as intended, the Fund may not achieve its objectives.
The Fund's use of derivatives increased or decreased its exposure to the following risk:
Equity Risk | Equity risk relates to the fluctuations in the value of financial instruments as a result of changes in market prices (other than those arising from interest rate risk or foreign exchange risk), whether caused by factors specific to an individual investment, its issuer, or all factors affecting all instruments traded in a market or market segment. |
The Fund is also exposed to additional risks from investing in derivatives, such as liquidity risk and counterparty credit risk. Liquidity risk is the risk that the Fund will be unable to close out the derivative in the open market in a timely manner. Counterparty credit risk is the risk that the counterparty will not be able to fulfill its obligation to the Fund. Counterparty credit risk related to exchange-traded futures contracts is minimal because of the protection provided by the exchange on which they trade.
Investing in derivatives may involve greater risks than investing in the underlying assets directly and, to varying degrees, may involve risk of loss in excess of any initial investment and collateral received and amounts recognized in the Statement of Assets and Liabilities. In addition, there may be the risk that the change in value of the derivative contract does not correspond to the change in value of the underlying instrument.
Futures Contracts. A futures contract is an agreement between two parties to buy or sell a specified underlying instrument for a fixed price at a specified future date. The Fund used futures contracts to manage its exposure to the stock market.
Upon entering into a futures contract, a fund is required to deposit either cash or securities (initial margin) with a clearing broker in an amount equal to a certain percentage of the face value of the contract. Futures contracts are marked-to-market daily and subsequent payments (variation margin) are made or received by a fund depending on the daily fluctuations in the value of the futures contracts and are recorded as unrealized appreciation or (depreciation). This receivable and/or payable is included in daily variation margin on futures contracts in the Statement of Assets and Liabilities. Realized gain or (loss) is recorded upon the expiration or closing of a futures contract.
Any open futures contracts at period end are shown in the Schedule of Investments under the caption "Futures Contracts." The underlying face amount at value reflects each contract's exposure to the underlying instrument at period end.
During the period the Fund recognized net realized gain (loss) of $4,377,933 related to its investment in futures contracts. This amount is included in the Statement of Operations.
5. Purchases and Sales of Investments.
Purchases and sales of securities, other than short-term securities, aggregated $1,730,739,879 and $2,430,078,978, respectively.
6. Fees and Other Transactions with Affiliates.
Management Fee. FMR and its affiliates provide the Fund with investment management related services for which the Fund pays a monthly management fee. The management fee is the sum of an individual fund fee rate that is based on an annual rate of .45% of the Fund's average net assets and an annualized group fee rate that averaged .26% during the period. The group fee rate is based upon the average net assets of all the mutual funds advised by FMR. The group fee rate decreases as assets under management increase and increases as assets under management decrease. In addition, the management fee is subject to a performance adjustment (up to a maximum of ± .20% of the Fund's average net assets over a 36 month performance period). The upward or downward adjustment to the management fee is based on the relative investment performance of Overseas as compared to an appropriate benchmark index. For the period, the total annual management fee rate, including the performance adjustment, was .39% of the Fund's average net assets.
Annual Report
6. Fees and Other Transactions with Affiliates - continued
Transfer Agent Fees. Fidelity Investments Institutional Operations Company, Inc. (FIIOC), an affiliate of FMR, is the transfer, dividend disbursing and shareholder servicing agent for each class of the Fund. FIIOC receives account fees and asset-based fees that vary according to the account size and type of account of the shareholders of Overseas. FIIOC receives an asset-based fee of Class K's average net assets. FIIOC pays for typesetting, printing and mailing of shareholder reports, except proxy statements. For the period, transfer agent fees for each class were as follows:
| Amount | % of
Average
Net Assets |
Overseas | $ 3,904,215 | .23 |
Class K | 146,551 | .05 |
| $ 4,050,766 | |
Accounting and Security Lending Fees. Fidelity Service Company, Inc. (FSC), an affiliate of FMR, maintains the Fund's accounting records. The accounting fee is based on the level of average net assets for each month. Under a separate contract, FSC administers the security lending program. The security lending fee is based on the number and duration of lending transactions.
Brokerage Commissions. The Fund placed a portion of its portfolio transactions with brokerage firms which are affiliates of the investment adviser. The commissions paid to these affiliated firms were $737 for the period.
Interfund Lending Program. Pursuant to an Exemptive Order issued by the SEC, the Fund, along with other registered investment companies having management contracts with FMR, may participate in an interfund lending program. This program provides an alternative credit facility allowing the funds to borrow from, or lend money to, other participating affiliated funds. At period end, there were no interfund loans outstanding. The Fund's activity in this program during the period for which loans were outstanding was as follows:
Borrower or Lender | Average Loan
Balance | Weighted Average Interest Rate | Interest
Expense |
Borrower | $ 29,057,000 | .35% | $ 559 |
7. Committed Line of Credit.
The Fund participates with other funds managed by FMR or an affiliate in a $4.25 billion credit facility (the "line of credit") to be utilized for temporary or emergency purposes to fund shareholder redemptions or for other short-term liquidity purposes. The Fund has agreed to pay commitment fees on its pro-rata portion of the line of credit, which amounted to $5,640 and is reflected in Miscellaneous expenses on the Statement of Operations. During the period, there were no borrowings on this line of credit.
8. Security Lending.
The Fund lends portfolio securities through a lending agent from time to time in order to earn additional income. For equity securities, a lending agent is used and may loan securities to certain qualified borrowers, including Fidelity Capital Markets (FCM), a broker-dealer affiliated with the Fund. On the settlement date of the loan, the Fund receives collateral (in the form of U.S. Treasury obligations, letters of credit and/or cash) against the loaned securities and maintains collateral in an amount not less than 100% of the market value of the loaned securities during the period of the loan. The market value of the loaned securities is determined at the close of business of the Fund and any additional required collateral is delivered to the Fund on the next business day. If the borrower defaults on its obligation to return the securities loaned because of insolvency or other reasons, a fund could experience delays and costs in recovering the securities loaned or in gaining access to the collateral. Any cash collateral received is invested in the Fidelity Securities Lending Cash Central Fund. The value of loaned securities and cash collateral at period end are disclosed on the Fund's Statement of Assets and Liabilities. Security lending income represents the income earned on investing cash collateral, less rebates paid to borrowers and any lending agent fees associated with the loan, plus any premium payments received for lending certain types of securities. Security lending income is presented in the Statement of Operations as a component of income from Fidelity Central Funds. Total security lending income during the period amounted to $1,140,979. During the period, there were no securities loaned to FCM.
9. Expense Reductions.
Many of the brokers with whom FMR places trades on behalf of the Fund provided services to the Fund in addition to trade execution. These services included payments of certain expenses on behalf of the Fund totaling $533,174 for the period. In addition, through arrangements with the Fund's custodian, credits realized as a result of uninvested cash balances were used to reduce the Fund's expenses. During the period, these credits reduced the Fund's custody expenses by $12.
Annual Report
Fidelity Overseas Fund
Notes to Financial Statements - continued
10. Distributions to Shareholders.
Distributions to shareholders of each class were as follows:
Years ended October 31, | 2012 A | 2011 A |
From net investment income | | |
Overseas | $ 56,962,859 | $ 75,897,727 |
Class K | 9,516,308 | 6,408,873 |
Class F | 3,598,724 | 9,890,239 |
Total | $ 70,077,891 | $ 92,196,839 |
From net realized gain | | |
Overseas | $ 1,377,579 | $ - |
Class K | 207,326 | - |
Class F | 77,060 | - |
Total | $ 1,661,965 | $ - |
A All Class F shares were redeemed on December 16, 2011.
11. Share Transactions.
Transactions for each class of shares were as follows:
| Shares | Dollars |
Years ended October 31, | 2012 A | 2011 | 2012 A | 2011 |
Overseas | | | | |
Shares sold | 5,513,981 | 10,588,919 | $ 159,997,895 | $ 338,680,110 |
Reinvestment of distributions | 2,082,243 | 2,356,512 | 57,282,489 | 75,196,294 |
Shares redeemed | (30,970,724) | (113,084,725) | (876,498,461) | (3,611,089,764) |
Net increase (decrease) | (23,374,500) | (100,139,294) | $ (659,218,077) | $ (3,197,213,360) |
Class K | | | | |
Shares sold | 5,090,211 | 4,129,689 | $ 145,041,228 | $ 128,992,232 |
Reinvestment of distributions | 354,489 | 201,094 | 9,723,634 | 6,408,873 |
Shares redeemed | (6,913,669) | (6,034,878) | (205,273,028) | (198,074,826) |
Net increase (decrease) | (1,468,969) | (1,704,095) | $ (50,508,166) | $ (62,673,721) |
Class F | | | | |
Shares sold | 373,582 | 12,066,248 | $ 10,277,470 | $ 388,123,231 |
Reinvestment of distributions | 134,104 | 310,526 | 3,675,784 | 9,890,239 |
Shares redeemed | (5,923,991) | (25,830,866) | (161,227,552) | (810,088,528) |
Net increase (decrease) | (5,416,305) | (13,454,092) | $ (147,274,298) | $ (412,075,058) |
A All Class F shares were redeemed on December 16, 2011.
12. Other.
The Fund's organizational documents provide former and current trustees and officers with a limited indemnification against liabilities arising in connection with the performance of their duties to the Fund. In the normal course of business, the Fund may also enter into contracts that provide general indemnifications. The Fund's maximum exposure under these arrangements is unknown as this would be dependent on future claims that may be made against the Fund. The risk of material loss from such claims is considered remote.
Annual Report
Report of Independent Registered Public Accounting Firm
To the Trustees of Fidelity Investment Trust and the Shareholders of Fidelity Overseas Fund:
In our opinion, the accompanying statement of assets and liabilities, including the schedule of investments, and the related statements of operations and of changes in net assets and the financial highlights present fairly, in all material respects, the financial position of Fidelity Overseas Fund (a fund of Fidelity Investment Trust) at October 31, 2012, the results of its operations for the year then ended, the changes in its net assets for each of the two years in the period then ended and the financial highlights for each of the periods indicated, in conformity with accounting principles generally accepted in the United States of America. These financial statements and financial highlights (hereafter referred to as "financial statements") are the responsibility of the Fidelity Overseas Fund's management. Our responsibility is to express an opinion on these financial statements based on our audits. We conducted our audits of these financial statements in accordance with the standards of the Public Company Accounting Oversight Board (United States). Those standards require that we plan and perform the audit to obtain reasonable assurance about whether the financial statements are free of material misstatement. An audit includes examining, on a test basis, evidence supporting the amounts and disclosures in the financial statements, assessing the accounting principles used and significant estimates made by management, and evaluating the overall financial statement presentation. We believe that our audits, which included confirmation of securities at October 31, 2012 by correspondence with the custodian and brokers, provide a reasonable basis for our opinion.
PricewaterhouseCoopers LLP
Boston, Massachusetts
December 14, 2012
Annual Report
The Trustees, Members of the Advisory Board, and executive officers of the trust and fund, as applicable, are listed below. The Board of Trustees governs the fund and is responsible for protecting the interests of shareholders. The Trustees are experienced executives who meet periodically throughout the year to oversee the fund's activities, review contractual arrangements with companies that provide services to the fund, oversee management of the risks associated with such activities and contractual arrangements, and review the fund's performance. Except for James C. Curvey, each of the Trustees oversees 227 funds advised by FMR or an affiliate. Mr. Curvey oversees 434 funds advised by FMR or an affiliate.
The Trustees hold office without limit in time except that (a) any Trustee may resign; (b) any Trustee may be removed by written instrument, signed by at least two-thirds of the number of Trustees prior to such removal; (c) any Trustee who requests to be retired or who has become incapacitated by illness or injury may be retired by written instrument signed by a majority of the other Trustees; and (d) any Trustee may be removed at any special meeting of shareholders by a two-thirds vote of the outstanding voting securities of the trust. Each Trustee who is not an interested person (as defined in the 1940 Act) (Independent Trustee), shall retire not later than the last day of the calendar year in which his or her 75th birthday occurs. The Independent Trustees may waive this mandatory retirement age policy with respect to individual Trustees. The executive officers and Advisory Board Members hold office without limit in time, except that any officer and Advisory Board Member may resign or may be removed by a vote of a majority of the Trustees at any regular meeting or any special meeting of the Trustees. Except as indicated, each individual has held the office shown or other offices in the same company for the past five years.
Experience, Skills, Attributes, and Qualifications of the Fund's Trustees. The Governance and Nominating Committee has adopted a statement of policy that describes the experience, qualifications, attributes, and skills that are necessary and desirable for potential Independent Trustee candidates (Statement of Policy). The Board believes that each Trustee satisfied at the time he or she was initially elected or appointed a Trustee, and continues to satisfy, the standards contemplated by the Statement of Policy. The Governance and Nominating Committee also engages professional search firms to help identify potential Independent Trustee candidates who have the experience, qualifications, attributes, and skills consistent with the Statement of Policy. From time to time, additional criteria based on the composition and skills of the current Independent Trustees, as well as experience or skills that may be appropriate in light of future changes to board composition, business conditions, and regulatory or other developments, have also been considered by the professional search firms and the Governance and Nominating Committee. In addition, the Board takes into account the Trustees' commitment and participation in Board and committee meetings, as well as their leadership of standing and ad hoc committees throughout their tenure.
In determining that a particular Trustee was and continues to be qualified to serve as a Trustee, the Board has considered a variety of criteria, none of which, in isolation, was controlling. The Board believes that, collectively, the Trustees have balanced and diverse experience, qualifications, attributes, and skills, which allow the Board to operate effectively in governing the fund and protecting the interests of shareholders. Information about the specific experience, skills, attributes, and qualifications of each Trustee, which in each case led to the Board's conclusion that the Trustee should serve (or continue to serve) as a trustee of the fund, is provided below.
Board Structure and Oversight Function. James C. Curvey is an interested person (as defined in the 1940 Act) and currently serves as Chairman. The Trustees have determined that an interested Chairman is appropriate and benefits shareholders because an interested Chairman has a personal and professional stake in the quality and continuity of services provided to the fund. Independent Trustees exercise their informed business judgment to appoint an individual of their choosing to serve as Chairman, regardless of whether the Trustee happens to be independent or a member of management. The Independent Trustees have determined that they can act independently and effectively without having an Independent Trustee serve as Chairman and that a key structural component for assuring that they are in a position to do so is for the Independent Trustees to constitute a substantial majority for the Board. The Independent Trustees also regularly meet in executive session. Ned C. Lautenbach serves as Chairman of the Independent Trustees and as such (i) acts as a liaison between the Independent Trustees and management with respect to matters important to the Independent Trustees and (ii) with management prepares agendas for Board meetings.
Fidelity funds are overseen by different Boards of Trustees. The fund's Board oversees Fidelity's equity and high income funds and another Board oversees Fidelity's investment-grade bond, money market, and asset allocation funds. The asset allocation funds may invest in Fidelity funds overseen by the fund's Board. The use of separate Boards, each with its own committee structure, allows the Trustees of each group of Fidelity funds to focus on the unique issues of the funds they oversee, including common research, investment, and operational issues. On occasion, the separate Boards establish joint committees to address issues of overlapping consequences for the Fidelity funds overseen by each Board.
The Trustees operate using a system of committees to facilitate the timely and efficient consideration of all matters of importance to the Trustees, the fund, and fund shareholders and to facilitate compliance with legal and regulatory requirements and oversight of the fund's activities and associated risks. The Board, acting through its committees, has charged FMR and its affiliates with (i) identifying events or circumstances the occurrence of which could have demonstrably adverse effects on the fund's business and/or reputation; (ii) implementing processes and controls to lessen the possibility that such events or circumstances occur or to mitigate the effects of such events or circumstances if they do occur; and (iii) creating and maintaining a system designed to evaluate continuously business and market conditions in order to facilitate the identification and implementation processes described in (i) and (ii) above. Because the day-to-day operations and activities of the fund's are carried out by or through FMR, its affiliates and other service providers, the fund's exposure to risks is mitigated but not eliminated by the processes overseen by the Trustees. While each of the Board's committees has responsibility for overseeing different aspects of the fund's activities, oversight is exercised primarily through the Operations, Audit, and Compliance Committees. In addition, the Independent Trustees have worked with FMR to enhance the Board's oversight of investment and financial risks, legal and regulatory risks, technology risks, and operational risks, including the development of additional risk reporting to the Board. For example, a working group comprised of Independent Trustees and FMR has worked and continues to work to review the Fidelity funds' valuation-related activities, reporting and risk management. Appropriate personnel, including but not limited to the fund's Chief Compliance Officer (CCO), FMR's internal auditor, the independent accountants, the fund's Treasurer and portfolio management personnel, make periodic reports to the Board's committees, as appropriate, including an annual review of FMR's risk management program for the Fidelity funds. The responsibilities of each standing committee, including their oversight responsibilities, are described further under "Standing Committees of the Fund's Trustees."
Annual Report
The fund's Statement of Additional Information (SAI) includes more information about the Trustees. To request a free copy, call Fidelity at 1-800-835-5092.
Interested Trustees*:
Correspondence intended for each Trustee who is an interested person may be sent to Fidelity Investments, 82 Devonshire Street, Boston, Massachusetts 02109.
Name, Age; Principal Occupations and Other Relevant Experience+ |
James C. Curvey (77) |
| Year of Election or Appointment: 2007 Mr. Curvey is Trustee and Chairman of the Board of Trustees of certain Trusts. Mr. Curvey also serves as Trustee (2007-present) of other investment companies advised by FMR. Mr. Curvey is a Director of Fidelity Investments Money Management, Inc. (2009-present), Director of Fidelity Research & Analysis Co. (2009-present) and Director of FMR and FMR Co., Inc. (2007-present). Mr. Curvey is also Vice Chairman (2007-present) and Director of FMR LLC. In addition, Mr. Curvey serves as an Overseer for the Boston Symphony Orchestra and a member of the Trustees of Villanova University. Previously, Mr. Curvey was the Vice Chairman (2006-2007) and Director (2000-2007) of FMR Corp. |
Ronald P. O'Hanley (55) |
| Year of Election or Appointment: 2011 Mr. O'Hanley is Director of FMR Co., Inc. (2010-present), Director of Fidelity Investments Money Management, Inc. (2010-present), Director of Fidelity Research & Analysis Company (2010-present), President of Fidelity Asset Management and Corporate Services and a member of Fidelity's Executive Committee (2010-present). Previously, Mr. O'Hanley served as President and Chief Executive Officer of BNY Mellon Asset Management (2007-2010). Mr. O'Hanley also served as Vice Chairman of Bank New York Mellon Corp. and a member of that firm's Executive Committee. Prior to the 2007 merger of The Bank of New York and Mellon Financial Corporation, he was Vice Chairman of Mellon Financial Corporation and President and Chief Executive Officer of Mellon Asset Management. He joined Mellon in February 1997. Mr. O'Hanley currently serves as Chairman of the Boston Public Library Foundation Board of Directors and sits on the Board of Directors of Beth Israel Deaconess Medical Center, the Board of Trustees of the Marine Biological Laboratory and the Advisory Board of the Maxwell School of Citizenship and Public Administration at Syracuse University. Mr. O'Hanley also chairs the Council on Asset Management for the Financial Services Roundtable and is a member of the Board of Directors of Institutional Investor's U.S. Institute. |
* Trustees have been determined to be "Interested Trustees" by virtue of, among other things, their affiliation with the trust or various entities under common control with FMR.
+ The information above includes the Trustee's principal occupation during the last five years and other information relating to the experience, attributes, and skills relevant to each Trustee's qualifications to serve as a Trustee, which led to the conclusion that each Trustee should serve as a Trustee for the fund.
Independent Trustees:
Correspondence intended for each Independent Trustee (that is, the Trustees other than the Interested Trustees) may be sent to Fidelity Investments, P.O. Box 55235, Boston, Massachusetts 02205-5235.
Name, Age; Principal Occupations and Other Relevant Experience+ |
Dennis J. Dirks (64) |
| Year of Election or Appointment: 2005 Prior to his retirement in May 2003, Mr. Dirks was Chief Operating Officer and a member of the Board of The Depository Trust & Clearing Corporation (DTCC). He also served as President, Chief Operating Officer, and Board member of The Depository Trust Company (DTC) and President and Board member of the National Securities Clearing Corporation (NSCC). In addition, Mr. Dirks served as Chief Executive Officer and Board member of the Government Securities Clearing Corporation, Chief Executive Officer and Board member of the Mortgage-Backed Securities Clearing Corporation, as a Trustee and a member of the Finance Committee of Manhattan College (2005-2008), and as a Trustee and a member of the Finance Committee of AHRC of Nassau County (2006-2008). Mr. Dirks is a member of the Independent Directors Council (IDC) Governing Council (2010-present) and Board of Directors for The Brookville Center for Children's Services, Inc. (2009-present). |
Alan J. Lacy (59) |
| Year of Election or Appointment: 2008 Mr. Lacy serves as Senior Adviser (2007-present) of Oak Hill Capital Partners, L.P. (private equity). Mr. Lacy also served as Chief Executive Officer (2000-2005) and Vice Chairman (2005-2006) of Sears Holdings Corporation and Sears, Roebuck and Co. (retail). In addition, Mr. Lacy serves as a member of the Board of Directors of Dave & Buster's Entertainment, Inc. (restaurant and entertainment complexes, 2010-present), Earth Fare, Inc. (retail grocery, 2012-present), The Hillman Companies, Inc. (hardware wholesalers, 2010-present), and Bristol-Myers Squibb Company (global pharmaceuticals, 2008-present). Mr. Lacy is a member of the Board of Trustees of The National Parks Conservation Association (2006-present). Previously, Mr. Lacy served as Chairman of the Board of Trustees of the National Parks Conservation Association (2008-2011) and as a member of the Board of Directors for the Western Union Company (global money transfer, 2006-2011). |
Ned C. Lautenbach (68) |
| Year of Election or Appointment: 2000 Mr. Lautenbach is Chairman of the Independent Trustees of the Equity and High Income Funds (2006-present). Mr. Lautenbach currently serves as the Lead Director of the Eaton Corporation Board of Directors (diversified industrial, 1997-present). Mr. Lautenbach is Chairman of the Board of Directors of the Philharmonic Center for the Arts in Naples, Florida (2012-present) and a member of the Council on Foreign Relations (1994-present). Previously, Mr. Lautenbach was a Partner/Advisory Partner at Clayton, Dubilier & Rice, LLC (private equity investment, 1998-2010), as well as a Director of Sony Corporation (2006-2007). |
Joseph Mauriello (68) |
| Year of Election or Appointment: 2008 Prior to his retirement in January 2006, Mr. Mauriello served in numerous senior management positions including Deputy Chairman and Chief Operating Officer (2004-2005), and Vice Chairman of Financial Services (2002-2004) of KPMG LLP US (professional services, 1965-2005). Mr. Mauriello currently serves as a member of the Board of Directors of XL Group plc. (global insurance and re-insurance, 2006-present). Previously, Mr. Mauriello served as a Director of the Hamilton Funds of the Bank of New York (2006-2007) and of Arcadia Resources Inc. (health care services and products, 2007-2012). |
Robert W. Selander (62) |
| Year of Election or Appointment: 2011 Previously, Mr. Selander served as a Member of the Advisory Board of Fidelity's Equity and High Income Funds (2011), Executive Vice Chairman (2010), Chief Executive Officer (2009-2010), and President and Chief Executive Officer (1997-2009) of Mastercard, Inc. |
Cornelia M. Small (68) |
| Year of Election or Appointment: 2005 Ms. Small is a member of the Board of Directors (2009-present) and Chair of the Investment Committee (2010-present) of the Teagle Foundation. Ms. Small also serves on the Investment Committee of the Berkshire Taconic Community Foundation (2008-present). Previously, Ms. Small served as Chairperson (2002-2008) and a member of the Investment Committee and Chairperson (2008-2012) and a member of the Board of Trustees of Smith College. In addition, Ms. Small served as Chief Investment Officer, Director of Global Equity Investments, and a member of the Board of Directors of Scudder, Stevens & Clark and Scudder Kemper Investments. |
William S. Stavropoulos (73) |
| Year of Election or Appointment: 2001 Mr. Stavropoulos is Vice Chairman of the Independent Trustees of the Equity and High Income Funds (2006-present). Mr. Stavropoulos serves as President and Founder of the Michigan Baseball Foundation, the Great Lakes Loons (2007-present). Mr. Stavropoulos is Chairman Emeritus of the Board of Directors of The Dow Chemical Company, where he previously served in numerous senior management positions, including President, CEO (1995-2000; 2002-2004), Chairman of the Executive Committee (2000-2006), and as a member of the Board of Directors (1990-2006). Currently, Mr. Stavropoulos is a Director of Univar Inc. (global distributor of commodity and specialty chemicals, Chairman from 2010-May 2012 and Lead Director from May 2012-present), Teradata Corporation (data warehousing and technology solutions, 2008-present), Maersk Inc. (industrial conglomerate), and Tyco International, Ltd. (multinational manufacturing and services, 2007-present), and a member of the Advisory Board for Metalmark Capital LLC (private equity investment, 2005-present). Mr. Stavropoulos is an operating advisor to Clayton, Dubilier & Rice, LLC (private equity investment). In addition, Mr. Stavropoulos is a member of the University of Notre Dame Advisory Council for the College of Science, a Trustee of the Rollin L. Gerstacker Foundation, and a Director of the Naples Philharmonic Center for the Arts. Previously, Mr. Stavropoulos served as a Director of Chemical Financial Corporation (bank holding company, 1993-2012). |
David M. Thomas (63) |
| Year of Election or Appointment: 2008 Previously, Mr. Thomas served as Executive Chairman (2005-2006) and Chairman and Chief Executive Officer (2000-2005) of IMS Health, Inc. (pharmaceutical and healthcare information solutions), and a Director of Fortune Brands, Inc. (consumer products, 2000-2011). In addition, Mr. Thomas serves as Non-Executive Chairman of the Board of Directors of Fortune Brands Home and Security (home and security products, 2011-present), and as a member of the Board of Directors of Interpublic Group of Companies, Inc. (marketing communication, 2004-present). |
Michael E. Wiley (62) |
| Year of Election or Appointment: 2008 Mr. Wiley also serves as a Director of Asia Pacific Exploration Consolidated (international oil and gas exploration and production, 2008-present). Mr. Wiley serves as a Director of Tesoro Corporation (independent oil refiner and marketer, 2005-present), and a Director of Bill Barrett Corporation (exploration and production, 2005-present). In addition, Mr. Wiley also serves as a Director of Post Oak Bank (privately-held bank, 2004-present). Previously, Mr. Wiley served as a member of the Board of Trustees of the University of Tulsa (2000-2006; 2007-2010), as a Senior Energy Advisor of Katzenbach Partners, LLC (consulting, 2006-2007), as an Advisory Director of Riverstone Holdings (private investment), Chairman, President, and CEO of Baker Hughes, Inc. (oilfield services, 2000-2004), and as Director of Spinnaker Exploration Company (exploration and production, 2001-2005). |
+ The information above includes each Trustee's principal occupation during the last five years and other information relating to the experience, attributes, and skills relevant to each Trustee's qualifications to serve as a Trustee, which led to the conclusion that each Trustee should serve as a Trustee for the fund.
Advisory Board Members and Executive Officers:
Correspondence intended for David A. Rosow and Garnett A. Smith may be sent to Fidelity Investments, P.O. Box 55235, Boston, Massachusetts 02205-5235. Correspondence intended for each executive officer, Edward C. Johnson 3d, and Peter S. Lynch may be sent to Fidelity Investments, 82 Devonshire Street, Boston, Massachusetts 02109.
Name, Age; Principal Occupation |
Edward C. Johnson 3d (82) |
| Year of Election or Appointment: 2011 Member of the Advisory Board of Fidelity's Equity and High Income Funds. Mr. Johnson serves as Chief Executive Officer, Chairman, and a Director of FMR LLC, and also serves as Chairman and Director of FIL Limited. Previously, Mr. Johnson served as a Trustee and Chairman of the Board of certain Fidelity Trusts, Chairman and a Director of FMR, Chairman and a Director of FMR Co., Inc., and President of FMR LLC (2006-2007). |
Peter S. Lynch (68) |
| Year of Election or Appointment: 2003 Member of the Advisory Board of Fidelity's Equity and High Income Funds. Mr. Lynch is Vice Chairman and a Director of FMR and FMR Co., Inc. In addition, Mr. Lynch serves as a Trustee of Boston College and as the Chairman of the Inner-City Scholarship Fund. Previously, Mr. Lynch served on the Special Olympics International Board of Directors (1997-2006). |
David A. Rosow (70) |
| Year of Election or Appointment: 2012 Member of the Advisory Board of Fidelity's Equity and High Income Funds. Chairman and Chief Executive Officer of International Golf Group, Inc. (golf course development, 1989-present). Previously, Mr. Rosow served as Chairman and Chief Executive Officer of Rosow & Company, Inc. (private investment company, 1989-2011), a Lead Director of Hudson United Bancorp (2001-2006) and as a Director of TD Banknorth (1996-2006). In addition, Mr. Rosow is a member (2008-present) and President (2009-present) of the Town Council of Palm Beach, Florida. |
Garnett A. Smith (65) |
| Year of Election or Appointment: 2012 Member of the Advisory Board of Fidelity's Equity and High Income Funds. Prior to Mr. Smith's retirement, he served as Chairman and Chief Executive Officer of Inbrand Corp. (manufacturer of personal absorbent products, 1990-1997). He also served as President (1986-1990) of Inbrand Corp. Prior to his employment with Inbrand Corp., he was employed by a retail fabric chain and North Carolina National Bank. In addition, Mr. Smith is a board member of the Jackson Hole Land Trust (2009-present). |
Kenneth B. Robins (43) |
| Year of Election or Appointment: 2008 President and Treasurer of Fidelity's Equity and High Income Funds. Mr. Robins also serves as President and Treasurer (2010-present) and Assistant Treasurer (2009-present) of other Fidelity funds and is an employee of Fidelity Investments (2004-present). Previously, Mr. Robins served as Deputy Treasurer of the Fidelity funds (2005-2008) and Treasurer and Chief Financial Officer of The North Carolina Capital Management Trust: Cash and Term Portfolios (2006-2008). |
Bruce T. Herring (47) |
| Year of Election or Appointment: 2006 Vice President of certain Equity Funds. Mr. Herring also serves as President of Fidelity Research & Analysis Company (2010-present), Chief Investment Officer and Director of Fidelity Management & Research (U.K.) Inc. (2010-present) and Group Chief Investment Officer of FMR. Previously, Mr. Herring served as Vice President (2005-2006) and Senior Vice President (2006-2007) of Fidelity Management & Research Company, Vice President of FMR Co., Inc. (2001-2007) and as a portfolio manager for Fidelity U.S. Equity Funds. |
Brian B. Hogan (48) |
| Year of Election or Appointment: 2009 Vice President of Equity and High Income Funds. Mr. Hogan also serves as President of FMR's Equity Division (2009-present). Previously, Mr. Hogan served as Senior Vice President, Equity Research of FMR (2006-2009) and as a portfolio manager. |
Scott C. Goebel (44) |
| Year of Election or Appointment: 2008 Secretary and Chief Legal Officer (CLO) of the Fidelity funds. Mr. Goebel also serves as Secretary of Fidelity Investments Money Management, Inc. (FIMM) (2010-present) and Fidelity Research and Analysis Company (FRAC) (2010-present); Secretary and CLO of The North Carolina Capital Management Trust: Cash and Term Portfolios (2008-present); General Counsel, Secretary, and Senior Vice President of FMR (2008-present) and FMR Co., Inc. (2008-present); employed by FMR LLC or an affiliate (2001-present); Chief Legal Officer of Fidelity Management & Research (Hong Kong) Limited (2008-present) and Assistant Secretary of Fidelity Management & Research (Japan) Inc. (2008-present), and Fidelity Management & Research (U.K.) Inc. (2008-present). Previously, Mr. Goebel served as Assistant Secretary of FIMM (2008-2010), FRAC (2008-2010), and the Funds (2007-2008) and as Vice President and Secretary of Fidelity Distributors Corporation (FDC) (2005-2007). |
William C. Coffey (43) |
| Year of Election or Appointment: 2009 Assistant Secretary of Fidelity's Equity and High Income Funds. Mr. Coffey also serves as Senior Vice President and Deputy General Counsel of FMR LLC (2010-present), and is an employee of Fidelity Investments. Previously, Mr. Coffey served as Vice President and Associate General Counsel of FMR LLC (2005-2009). |
Elizabeth Paige Baumann (44) |
| Year of Election or Appointment: 2012 Anti-Money Laundering (AML) Officer of the Fidelity funds. Ms. Baumann also serves as AML Officer of The North Carolina Capital Management Trust: Cash and Term Portfolios (2012-present), Chief AML Officer of FMR LLC (2012-present), and is an employee of Fidelity Investments. Previously, Ms. Baumann served as Vice President and Deputy Anti-Money Laundering Officer (2007-2012). |
Christine Reynolds (54) |
| Year of Election or Appointment: 2008 Chief Financial Officer of the Fidelity funds. Ms. Reynolds became President of Fidelity Pricing and Cash Management Services (FPCMS) in August 2008. Ms. Reynolds served as Chief Operating Officer of FPCMS (2007-2008). Previously, Ms. Reynolds served as President, Treasurer, and Anti-Money Laundering officer of the Fidelity funds (2004-2007). |
Joseph A. Hanlon (44) |
| Year of Election or Appointment: 2012 Chief Compliance Officer of Fidelity's Equity and High Income Funds. Mr. Hanlon serves as Compliance Officer of FMR, FMR Co., Inc., Fidelity Investments Money Management, Inc. (FIMM), Fidelity Research and Analysis Company (FRAC), Fidelity Management & Research (Japan) Inc., Fidelity Management & Research (U.K.) Inc., Fidelity Management & Research (Hong Kong), and Strategic Advisers, Inc. (2009-present), as Senior Vice President of the Fidelity Asset Management Division (2009-present), and is an employee of Fidelity Investments. |
Joseph F. Zambello (55) |
| Year of Election or Appointment: 2011 Deputy Treasurer of the Fidelity funds. Mr. Zambello is an employee of Fidelity Investments. Previously, Mr. Zambello served as Vice President of FMR's Program Management Group (2009-2011) and Vice President of the Transfer Agent Oversight Group (2005-2009). |
Adrien E. Deberghes (45) |
| Year of Election or Appointment: 2008 Deputy Treasurer of Fidelity's Equity and High Income Funds. Mr. Deberghes also serves as Vice President (2011-present) and Assistant Treasurer (2010-present) of other Fidelity funds, and is an employee of Fidelity Investments (2008-present). Previously, Mr. Deberghes served as Senior Vice President of Mutual Fund Administration at State Street Corporation (2007-2008), Senior Director of Mutual Fund Administration at Investors Bank & Trust (2005-2007), and Director of Finance for Dunkin' Brands (2000-2005). |
Stephen Sadoski (41) |
| Year of Election or Appointment: 2012 Deputy Treasurer of Fidelity's Equity and High Income Funds. Mr. Sadoski also serves as Assistant Treasurer of other Fidelity funds (2012-present) and is an employee of Fidelity Investments (2012-present). Previously, Mr. Sadoski served as an assistant chief accountant in the Division of Investment Management of the Securities and Exchange Commission (SEC) (2009-2012) and as a senior manager at Deloitte & Touche (1997-2009). |
Stephanie J. Dorsey (43) |
| Year of Election or Appointment: 2010 Assistant Treasurer of Fidelity's Equity and High Income Funds. Ms. Dorsey also serves as Deputy Treasurer of other Fidelity funds (2008-present) and is an employee of Fidelity Investments (2008-present). Previously, Ms. Dorsey served as Treasurer (2004-2008) of the JPMorgan Mutual Funds and Vice President (2004-2008) of JPMorgan Chase Bank. |
John R. Hebble (54) |
| Year of Election or Appointment: 2009 Assistant Treasurer of Fidelity's Equity and High Income Funds. Mr. Hebble also serves as President (2011-present), Treasurer, and Chief Financial Officer of The North Carolina Capital Management Trust: Cash and Term Portfolios (2008-present), President and Treasurer of other Fidelity funds (2008-present) and is an employee of Fidelity Investments. |
Gary W. Ryan (54) |
| Year of Election or Appointment: 2005 Assistant Treasurer of the Fidelity funds. Mr. Ryan is an employee of Fidelity Investments. Previously, Mr. Ryan served as Vice President of Fund Reporting in Fidelity Pricing and Cash Management Services (FPCMS) (1999-2005). |
Jonathan Davis (44) |
| Year of Election or Appointment: 2010 Assistant Treasurer of the Fidelity funds. Mr. Davis is also Assistant Treasurer of Fidelity Rutland Square Trust II and Fidelity Commonwealth Trust II. Mr. Davis is an employee of Fidelity Investments. Previously, Mr. Davis served as Vice President and Associate General Counsel of FMR LLC (2003-2010). |
Annual Report
Class K designates 71% of dividends distributed during the fiscal year as amounts which may be taken into account as a dividend for purposes of the maximum rate under section 1(h)(11) of the Internal Revenue Code.
The amounts per share which represent income derived from sources within, and taxes paid to, foreign countries or possessions of the United States are $0.897 and $0.0493 for the dividend paid December 5, 2011.
The fund will notify shareholders in January 2013 of amounts for use in preparing 2012 income tax returns.
Annual Report
Board Approval of Investment Advisory Contracts and Management Fees
Fidelity Overseas Fund
Each year, the Board of Trustees, including the Independent Trustees (together, the Board), votes on the renewal of the management contract and sub-advisory agreements (together, the Advisory Contracts) for the fund. The Board, assisted by the advice of fund counsel and Independent Trustees' counsel, requests and considers a broad range of information relevant to the renewal of the Advisory Contracts throughout the year.
The Board meets regularly and, at each of its meetings, considers factors that are relevant to its annual consideration of the renewal of the fund's Advisory Contracts, including the services and support provided to the fund and its shareholders. The Board has established various standing committees, each composed of and chaired by Independent Trustees with varying backgrounds, to which the Board has assigned specific subject matter responsibilities in order to enhance effective decision-making by the Board. The Board, acting directly and through its Committees, requests and receives information concerning the annual consideration of the renewal of the fund's Advisory Contracts. The Board also meets as needed to consider matters specifically related to the Board's annual consideration of the renewal of Advisory Contracts. Members of the Board may also meet with trustees of other Fidelity funds through ad hoc joint committees to discuss certain matters relevant to the Fidelity funds.
At its July 2012 meeting, the Board of Trustees, including the Independent Trustees, unanimously determined to renew the fund's Advisory Contracts. In reaching its determination, the Board considered all factors it believed relevant, including (i) the nature, extent, and quality of the services to be provided to the fund and its shareholders (including the investment performance of the fund); (ii) the competitiveness of the fund's management fee and total expense ratio relative to peer funds; (iii) the total costs of the services to be provided by and the profits to be realized by Fidelity from its relationship with the fund; (iv) the extent to which economies of scale exist and would be realized as the fund grows; and (v) whether fee levels reflect these economies of scale, if any, for the benefit of fund shareholders.
In considering whether to renew the Advisory Contracts for the fund, the Board reached a determination, with the assistance of fund counsel and Independent Trustees' counsel and through the exercise of its business judgment, that the renewal of the Advisory Contracts is in the best interests of the fund and its shareholders and that the compensation payable under the Advisory Contracts is fair and reasonable. The Board's decision to renew the Advisory Contracts was not based on any single factor, but rather was based on a comprehensive consideration of all the information provided to the Board at its meetings throughout the year. The Board, in reaching its determination to renew the Advisory Contracts, is aware that shareholders in the fund have a broad range of investment choices available to them, including a wide choice among mutual funds offered by Fidelity's competitors, and that the fund's shareholders, who have the opportunity to review and weigh the disclosure provided by the fund in its prospectus and other public disclosures, have chosen to invest in this fund, managed by Fidelity.
Nature, Extent, and Quality of Services Provided. The Board considered the staffing within the investment adviser, FMR, and the sub-advisers (together, the Investment Advisers), including the backgrounds of the fund's investment personnel, and also considered the fund's investment objective, strategies, and related investment philosophy. The Independent Trustees also had discussions with senior management of Fidelity's investment operations and investment groups. The Board considered the structure of the portfolio manager compensation program and whether this structure provides appropriate incentives to act in the best interests of the fund.
Resources Dedicated to Investment Management and Support Services. The Board and the Fund Oversight and Research Committees reviewed the general qualifications and capabilities of the Investment Advisers' investment staff, including its size, education, experience, and resources, as well as the Investment Advisers' approach to recruiting, training, managing, and compensating investment personnel. The Board also noted that FMR has continued to increase the resources devoted to non-U.S. offices, including expansion of Fidelity's global investment organization. The Board noted that Fidelity's analysts have extensive resources, tools and capabilities that allow them to conduct sophisticated quantitative and fundamental analysis, as well as credit analysis of issuers, counterparties and guarantors. The Board also believes that Fidelity's investment professionals have sufficient access to global information and data so as to provide competitive investment results over time, and that those professionals also have access to sophisticated tools that permit them to assess portfolio construction and risk and performance attribution characteristics continuously, as well as to transmit new information and research conclusions rapidly around the world. Additionally, in its deliberations, the Board considered the Investment Advisers' trading and risk management capabilities and resources, which are an integral part of the investment management process.
Shareholder and Administrative Services. The Board considered (i) the nature, extent, quality, and cost of advisory, administrative, and shareholder services performed by the Investment Advisers and their affiliates under the Advisory Contracts and under separate agreements covering transfer agency, pricing and bookkeeping, and securities lending services for the fund; (ii) the nature and extent of the supervision of third party service providers, principally custodians and subcustodians; and (iii) the resources devoted to, and the record of compliance with, the fund's compliance policies and procedures. The Board also reviewed the allocation of fund brokerage, including allocations to brokers affiliated with the Investment Advisers, the use of brokerage commissions to pay fund expenses, and the use of "soft" commission dollars to pay for research services.
The Board noted that the growth of fund assets over time across the complex allows Fidelity to reinvest in the development of services designed to enhance the value or convenience of the Fidelity funds as investment vehicles. These services include 24-hour access to account information and market information through telephone representatives and over the Internet, investor education materials and asset allocation tools, and the expanded availability of Fidelity Investor Centers.
Annual Report
Board Approval of Investment Advisory Contracts and Management Fees - continued
Investment in a Large Fund Family. The Board considered the benefits to shareholders of investing in a Fidelity fund, including the benefits of investing in a fund that is part of a large family of funds offering a variety of investment disciplines and providing a large variety of mutual fund investor services. The Board noted that Fidelity had taken, or had made recommendations that resulted in the Fidelity funds taking, a number of actions over the previous year that benefited particular funds, including (i) continuing to dedicate additional resources to investment research and support of the senior management team that oversees asset management; (ii) persisting in efforts to enhance Fidelity's research capabilities, in particular, international research; (iii) launching new funds and making other enhancements to meet client needs for global and income-oriented solutions; (iv) continuing to launch dedicated lower cost underlying funds to meet investment management's portfolio construction needs related to expanding underlying fund options, specifically for the Freedom Fund product lines; (v) adopting a "Stock Selector" sector neutral investment approach and employing a team of portfolio managers who are sector specialists to manage certain funds; (vi) rationalizing product lines and gaining increased efficiencies through the mergers of several funds into other funds; (vii) strengthening the Spartan Index Fund product line by adding new funds and/or new low-cost institutional share classes, restructuring fund expenses to accommodate new classes, and reducing investment minimums for certain classes of shares; (viii) modifying the eligibility criteria for Institutional Class shares to increase their appeal to government entities and charitable investors; and (ix) reducing certain transfer agent fee rates.
Investment Performance. The Board considered whether the fund has operated in accordance with its investment objective, as well as its record of compliance with its investment restrictions. It also reviewed the fund's absolute investment performance for each class, as well as the fund's relative investment performance for each class measured over multiple periods against (i) a broad-based securities market index, and (ii) a peer group of mutual funds deemed appropriate by Fidelity and reviewed by the Board. The following charts considered by the Board show, over the one-, three-, and five-year periods ended December 31, 2011, as available, the cumulative total returns of Class K and the retail class of the fund, the cumulative total returns of a broad-based securities market index ("benchmark"), and a range of cumulative total returns of a peer group of mutual funds identified by Morningstar, Inc. as having an investment style similar to that of the fund based on underlying portfolio holdings. The box within each chart shows the 25th percentile return (top of box) and the 75th percentile return (bottom of box) of the peer group. Returns shown above the box are in the first quartile and returns shown below the box are in the fourth quartile. The percentage beaten numbers noted below each chart correspond to the percentile box and represent the percentage of funds in the peer group whose performance was equal to or lower than that of the class indicated.
Fidelity Overseas Fund

The Board reviewed the fund's relative investment performance against its peer group and noted that the performance of the retail class of the fund (the class with the longer performance record) was in the fourth quartile for all the periods shown. The Board also noted that the investment performance of the fund was lower than its benchmark for all the periods shown. The Board considered that the variations in performance between the fund's classes reflect the variations in class expenses, which result in lower performance for the higher expense class. The Board discussed with FMR actions to improve the fund's disappointing performance relative to its peer group and benchmark. The Board noted that this fund had underperformed in the past and discussed with FMR its disappointment with the continued underperformance of the fund. The Board noted that there was a portfolio management change for the fund in January 2012. The Board also reviewed the fund's performance since inception as well as performance in the current year. The Board will continue to closely monitor the performance of the fund in the coming year and discuss with FMR other appropriate actions to address the performance of the fund.
Annual Report
The Board also considered that the fund's management fee is subject to upward or downward adjustment depending upon whether, and to what extent, the fund's investment performance for the performance period exceeds, or is exceeded by, the record (over the same period) of a Board-approved performance adjustment index. The Board noted that the performance adjustment provides FMR with a strong economic incentive to seek to achieve superior performance for the fund's shareholders and helps to more closely align the interests of FMR and the fund's shareholders.
Based on its review, the Board concluded that the nature, extent, and quality of services provided to the fund under the Advisory Contracts should benefit the fund's shareholders.
Competitiveness of Management Fee and Total Expense Ratio. The Board considered the fund's management fee and total expense ratio compared to "mapped groups" of competitive funds and classes. Fidelity creates "mapped groups" by combining similar Lipper investment objective categories that have comparable management fee characteristics. Combining Lipper investment objective categories aids the Board's management fee and total expense ratio comparisons by broadening the competitive group used for comparison and by reducing the number of universes to which various Fidelity funds are compared.
Management Fee. The Board considered two proprietary management fee comparisons for the 12-month periods shown in the chart below. The group of Lipper funds used by the Board for management fee comparisons is referred to below as the "Total Mapped Group." The Total Mapped Group comparison focuses on a fund's standing relative to the total universe of comparable funds available to investors in terms of gross management fees before expense reimbursements or caps, and without giving effect to the fund's performance adjustment. "TMG %" represents the percentage of funds in the Total Mapped Group that had management fees that were lower than the fund's. For example, a TMG % of 17% means that 83% of the funds in the Total Mapped Group had higher management fees than the fund. The "Asset-Size Peer Group" (ASPG) comparison focuses on a fund's standing relative to non-Fidelity funds similar in size to the fund within the Total Mapped Group. The ASPG represents at least 15% of the funds in the Total Mapped Group with comparable asset size and management fee characteristics, subject to a minimum of 50 funds (or all funds in the Total Mapped Group if fewer than 50). Additional information, such as the ASPG quartile in which the fund's management fee ranked and the impact of the fund's performance adjustment, is also included in the chart and considered by the Board.
Fidelity Overseas Fund

The Board noted that the fund's management fee ranked below the median of its Total Mapped Group and below the median of its ASPG for 2011. The Board also noted the effect of the fund's negative performance adjustment on the fund's management fee ranking. The Board noted that the performance adjustment for each year represents calculations for performance periods that differ from the periods shown in the performance charts above.
Based on its review, the Board concluded that the fund's management fee is fair and reasonable in light of the services that the fund receives and the other factors considered.
Total Expense Ratio. In its review of each class's total expense ratio, the Board considered the fund's management fee as well as other fund or class expenses, as applicable, such as transfer agent fees, pricing and bookkeeping fees, and custodial, legal, and audit fees. The Board also noted the effects of any waivers and reimbursements on fees and expenses, as well as the impact of the fund's performance adjustment. As part of its review, the Board also considered the current and historical total expense ratios of each class of the fund compared to competitive fund median expenses. Each class of the fund is compared to those funds and classes in the Total Mapped Group (used by the Board for management fee comparisons) that have a similar sales load structure.
Annual Report
Board Approval of Investment Advisory Contracts and Management Fees - continued
The Board noted that the total expense ratio of each class ranked below its competitive median for 2011.
Fees Charged to Other Fidelity Clients. The Board also considered Fidelity fee structures and other information with respect to clients of FMR and its affiliates, such as other mutual funds advised or subadvised by FMR or its affiliates, pension plan clients, and other institutional clients. The Board noted the findings of the 2010 ad hoc joint committee (created with the board of other Fidelity funds), which reviewed and compared Fidelity's institutional investment advisory business with its business of providing services to the Fidelity funds, including the differences in services provided, fees charged, and costs incurred, as well as competition in their respective marketplaces.
Based on its review of total expense ratios and fees charged to other Fidelity clients, the Board concluded that the total expense ratio of each class of the fund was reasonable in light of the services that the fund and its shareholders receive and the other factors considered.
Costs of the Services and Profitability. The Board considered the revenues earned and the expenses incurred by Fidelity in conducting the business of developing, marketing, distributing, managing, administering and servicing the fund and its shareholders. The Board also considered the level of Fidelity's profits in respect of all the Fidelity funds.
On an annual basis, FMR presents to the Board Fidelity's profitability for the fund. Fidelity calculates the profitability for each fund, as well as aggregate profitability for groups of Fidelity funds and all Fidelity funds, using a series of detailed revenue and cost allocation methodologies which originate with the books and records of Fidelity on which Fidelity's audited financial statements are based. The Audit Committee of the Board reviews any significant changes from the prior year's methodologies.
PricewaterhouseCoopers LLP (PwC), independent registered public accounting firm and auditor to Fidelity and certain Fidelity funds, has been engaged annually by the Board as part of the Board's assessment of Fidelity's profitability analysis. PwC's engagement includes the review and assessment of Fidelity's methodologies used in determining the revenues and expenses attributable to Fidelity's mutual fund business, and completion of agreed-upon procedures surrounding the mathematical accuracy of fund profitability and its conformity to allocation methodologies. After considering PwC's reports issued under the engagement and information provided by Fidelity, the Board concluded that while other allocation methods may also be reasonable, Fidelity's profitability methodologies are reasonable in all material respects.
The Board also reviewed Fidelity's non-fund businesses and fall-out benefits related to the mutual fund business as well as cases where Fidelity's affiliates may benefit from or be related to the fund's business.
The Board considered the costs of the services provided by and the profits realized by Fidelity in connection with the operation of the fund and was satisfied that the profitability was not excessive in the circumstances.
Economies of Scale. The Board considered whether there have been economies of scale in respect of the management of the Fidelity funds, whether the Fidelity funds (including the fund) have appropriately benefited from any such economies of scale, and whether there is potential for realization of any further economies of scale. The Board considered the extent to which the fund will benefit from economies of scale through increased services to the fund, through waivers or reimbursements, or through fee or expense reductions. The Board also noted that in 2009, it and the board of other Fidelity funds created an ad hoc committee (the Economies of Scale Committee) to analyze whether FMR attains economies of scale in respect of the management and servicing of the Fidelity funds, whether the Fidelity funds have appropriately benefited from such economies of scale, and whether there is potential for realization of any further economies of scale.
The Board recognized that the fund's management contract incorporates a "group fee" structure, which provides for lower group fee rates as total fund assets under FMR's management increase, and for higher group fee rates as total fund assets under FMR's management decrease. FMR calculates the group fee rates based on a tiered asset "breakpoint" schedule that varies based on asset class. The Board considered that the group fee is designed to deliver the benefits of economies of scale to fund shareholders when total Fidelity fund assets increase, even if assets of any particular fund are unchanged or have declined, because some portion of Fidelity's costs are attributable to services provided to all Fidelity funds, and all funds benefit if those costs can be allocated among more assets. The Board concluded that, given the group fee structure, fund shareholders will benefit from lower management fees as assets under FMR's management increase at the fund complex level, regardless of whether Fidelity achieves any such economies of scale.
The Board concluded, taking into account the analysis of the Economies of Scale Committee, that economies of scale, if any, are being appropriately shared between fund shareholders and Fidelity.
Additional Information Requested by the Board. In order to develop fully the factual basis for consideration of the Fidelity funds' Advisory Contracts, the Board requested and received additional information on certain topics, including (i) fund performance trends, actions to be taken by FMR to improve certain funds' overall performance, and Fidelity's long-term strategies for certain funds; (ii) the potential to further rationalize the Fidelity fund lineup with the possibility of achieving savings for the funds and Fidelity; (iii) Fidelity's compensation structure for portfolio managers and other key investment personnel; (iv) the amount of the investment that each portfolio manager has made in the Fidelity fund(s) that he or she manages; (v) the realization of fall-out benefits in certain Fidelity business units; (vi) Fidelity's group fee structures, the potential impact of regulatory changes on such structures, and the rationale for the individual fee rates of certain funds; (vii) fund profitability methodology, including Fidelity's cost allocation methodology, and the impact of certain factors on fund profitability results; (viii) trends regarding industry use of performance fee structures and the possibility of implementing performance fee structures for additional funds; and (ix) the impact of net redemptions from the Fidelity funds.
Annual Report
Based on its evaluation of all of the conclusions noted above, and after considering all factors it believed relevant, the Board ultimately concluded that the advisory fee structures are fair and reasonable, and that the fund's Advisory Contracts should be renewed.
Annual Report
Investment Adviser
Fidelity Management & Research Company
Boston, MA
Investment Sub-Advisers
FMR Co., Inc.
Fidelity Management & Research (U.K.) Inc.
Fidelity Management & Research
(Hong Kong) Limited
Fidelity Management & Research
(Japan) Inc.
FIL Investment Advisors
FIL Investment Advisors (UK) Limited
FIL Investments (Japan) Limited
General Distributor
Fidelity Distributors Corporation
Smithfield, RI
Transfer and Service Agents
Fidelity Investments Institutional
Operations Company, Inc.
Boston, MA
Fidelity Service Company, Inc.
Boston, MA
Custodian
JPMorgan Chase Bank
New York, NY
(Fidelity Investment logo)(registered trademark)
Corporate Headquarters
82 Devonshire St., Boston, MA 02109
www.fidelity.com
OVE-K-UANN-1212
1.863317.104
(Fidelity Investment logo)(registered trademark)
Fidelity Advisor®
Global Commodity Stock
Fund - Class A, Class T, Class B
and Class C
Annual Report
October 31, 2012
(Fidelity Cover Art)
Class A, Class T, Class B,
and Class C are classes
of Fidelity® Global Commodity
Stock Fund
Contents
Performance | (Click Here) | How the fund has done over time. |
Management's Discussion of Fund Performance | (Click Here) | The Portfolio Manager's review of fund performance and strategy. |
Shareholder Expense Example | (Click Here) | An example of shareholder expenses. |
Investment Changes | (Click Here) | A summary of major shifts in the fund's investments over the past six months. |
Investments | (Click Here) | A complete list of the fund's investments with their market values. |
Financial Statements | (Click Here) | Statements of assets and liabilities, operations, and changes in net assets, as well as financial highlights. |
Notes | (Click Here) | Notes to the financial statements. |
Report of Independent Registered Public Accounting Firm | (Click Here) | |
Trustees and Officers | (Click Here) | |
Distributions | (Click Here) | |
Board Approval of Investment Advisory Contracts and Management Fees | (Click Here) | |
To view a fund's proxy voting guidelines and proxy voting record for the 12-month period ended June 30, visit http://www.fidelity.com/proxyvotingresults or visit the Securities and Exchange Commission's (SEC) web site at http://www.sec.gov. You may also call 1-877-208-0098 to request a free copy of the proxy voting guidelines.
Standard & Poor's, S&P and S&P 500 are registered service marks of The McGraw-Hill Companies, Inc. and have been licensed for use by Fidelity Distributors Corporation.
Other third party marks appearing herein are the property of their respective owners.
All other marks appearing herein are registered or unregistered trademarks or service marks of FMR LLC or an affiliated company. © 2012 FMR LLC. All rights reserved.
Annual Report
This report and the financial statements contained herein are submitted for the general information of the shareholders of the fund. This report is not authorized for distribution to prospective investors in the fund unless preceded or accompanied by an effective prospectus.
A fund files its complete schedule of portfolio holdings with the SEC for the first and third quarters of each fiscal year on Form N-Q. Forms N-Q are available on the SEC's web site at http://www.sec.gov. A fund's Forms N-Q may be reviewed and copied at the SEC's Public Reference Room in Washington, DC. Information regarding the operation of the SEC's Public Reference Room may be obtained by calling 1-800-SEC-0330. For a complete list of a fund's portfolio holdings, view the most recent holdings listing, semiannual report, or annual report on Fidelity's web site at http://www.fidelity.com, http://www.advisor.fidelity.com, or http://www.401k.com, as applicable.
NOT FDIC INSURED • MAY LOSE VALUE • NO BANK GUARANTEE
Neither the fund nor Fidelity Distributors Corporation is a bank.
Annual Report
Average annual total return reflects the change in the value of an investment, assuming reinvestment of the class' distributions from dividend income and capital gains (the profits earned upon the sale of securities that have grown in value, if any) and assuming a constant rate of performance each year. The $10,000 table and the fund's returns do not reflect the deduction of taxes that a shareholder would pay on fund distributions or the redemption of fund shares. During periods of reimbursement by Fidelity, a fund's total return will be greater than it would be had the reimbursement not occurred. How a fund did yesterday is no guarantee of how it will do tomorrow.
Average Annual Total Returns
Periods ended October 31, 2012 | Past 1
year | Life of
fund A |
Class A (incl. 5.75% sales charge) | -8.76% | 9.91% |
Class T (incl. 3.50% sales charge) | -6.81% | 10.33% |
Class B (incl. contingent deferred sales charge) B | -8.74% | 10.21% |
Class C (incl. contingent deferred sales charge) C | -4.84% | 10.88% |
A From March 25, 2009.
B Class B shares' contingent deferred sales charges included in the past one year and life of fund total return figures are 5% and 3%, respectively.
C Class C shares' contingent deferred sales charges included in the past one year and life of fund total return figures are 1% and 0%, respectively.
Annual Report
$10,000 Over Life of Fund
Let's say hypothetically that $10,000 was invested in Fidelity Advisor® Global Commodity Stock Fund - Class A on March 25, 2009, when the fund started, and the current 5.75% sales charge was paid. The chart shows how the value of your investment would have changed, and also shows how the MSCI® ACWI® (All Country World Index) Index performed over the same period.
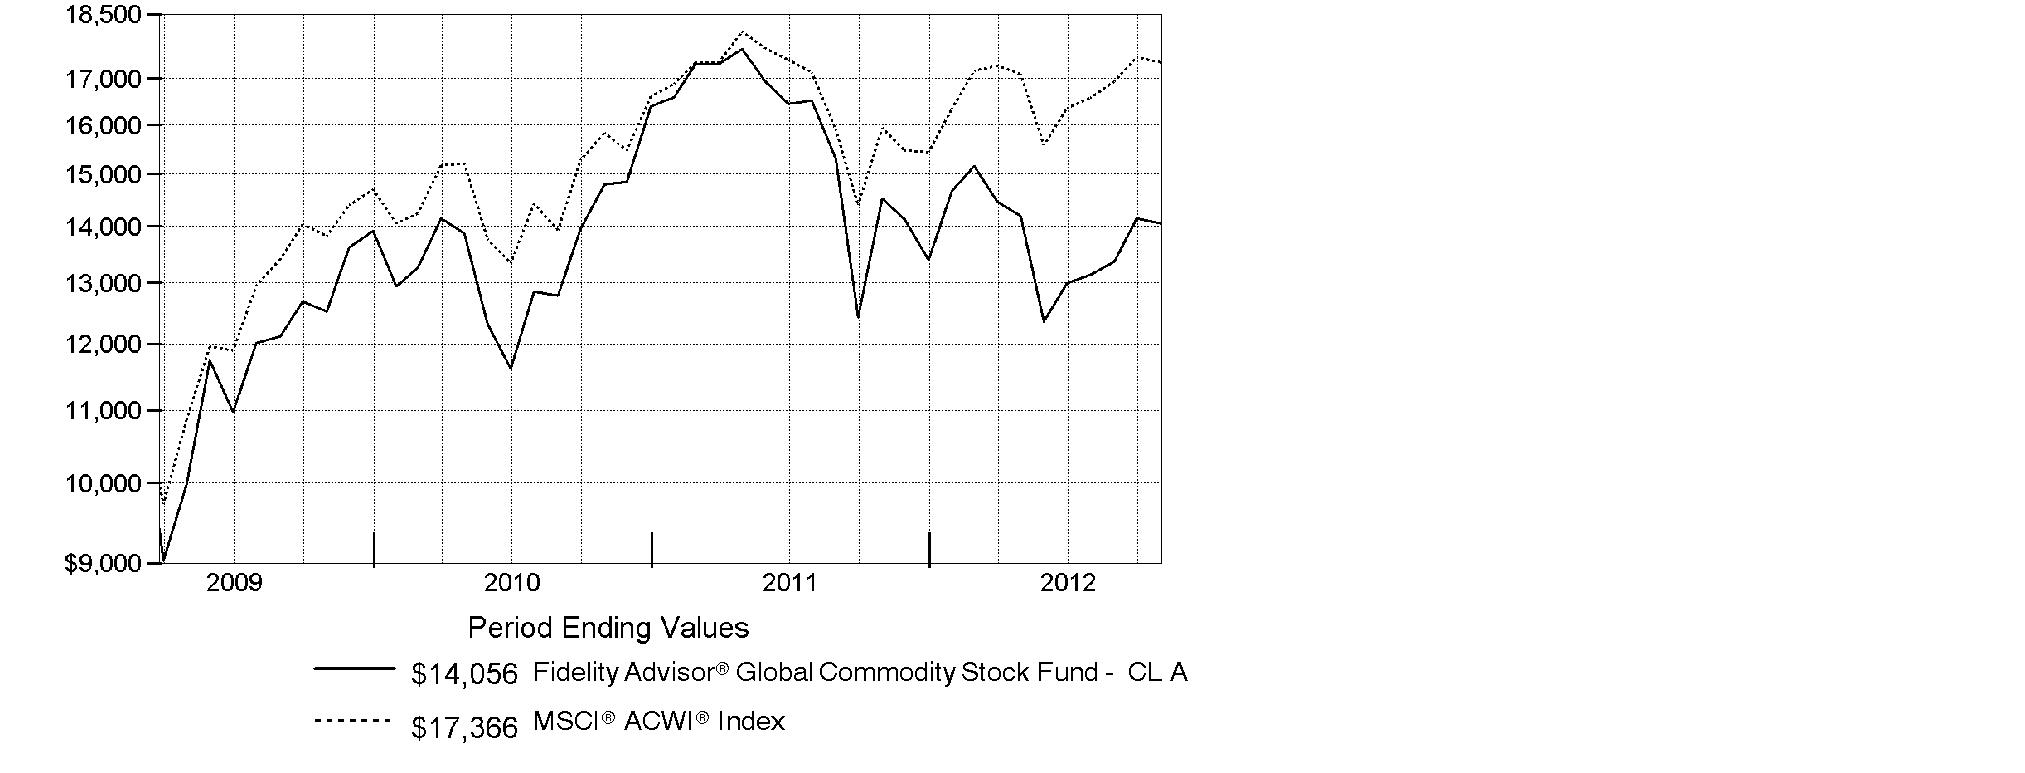
Annual Report
Market Recap: Global stocks experienced pendulum-like swings during the 12 months ending October 31, 2012, finishing the period with a solid advance. The market faced periodic bouts of volatility this past year, as a number of macroeconomic concerns - including the eurozone debt crisis, the strength and pace of the U.S. economic recovery, and a slowdown in China's once-blistering growth - dominated headlines and weighed on investors. While a stronger U.S. dollar provided an additional head wind for foreign investments, stocks worldwide rose 8.96% for the 12 months, as measured by the MSCI® ACWI® (All Country World Index) Index, largely buttressed in the summer by pledges of accommodative monetary action from eurozone officials, as well as signs that the U.S. housing market was on the mend. Within the index, the U.S. showed the most impressive gain among major markets, advancing 15%, closely followed by Asia-Pacific ex Japan (+10%). A number of core European components, most notably Germany (+11%), Switzerland (+10%) and the U.K. (+9%), benefited from optimism about the eurozone's ability to resolve its debt woes. However, continued weakness in peripheral European markets caused the region to lag the index overall. Elsewhere, results from Canada (+3%) and the generally more volatile emerging markets (+2%) each fell short of the MSCI index, while Japan was among the few benchmark constituents to finish in the red, returning about -3%.
Comments from S. Joseph Wickwire II, Portfolio Manager of Fidelity Advisor® Global Commodity Stock Fund: For the year, the fund's Class A, Class T, Class B and Class C shares returned -3.19%, -3.43%, -3.93% and -3.88%, respectively (excluding sales charges), versus -2.63% for the MSCI® ACWI® (All Country World Index) Commodity Producers Sector Capped Index. The fund was hurt the most by its investments in coal stocks, while choices in oil/gas refining and marketing meaningfully contributed. Overweightings in coal producers Alpha Natural Resources and Peabody Energy detracted, as did oil/gas equipment and services providers such as Ion Geophysical. Underweighting several solid-performing paper-related names also hurt, including Swedish paper product maker Svenska Cellulosa. Conversely, investments in refiners such as Marathon Petroleum and Tesoro were standouts, while oil/gas exploration and production firm Nexen was the fund's top individual contributor after its stock surged in late July on a takeover bid from Hong Kong-based CNOOC. Cabot Oil & Gas was another contributor. In agriculture, the fund benefited in part from an overweighting in fertilizer maker CF Industries Holdings. Some of the stocks I've mentioned were not in the benchmark and/or were sold by period end.
The views expressed above reflect those of the portfolio manager(s) only through the end of the period as stated on the cover of this report and do not necessarily represent the views of Fidelity or any other person in the Fidelity organization. Any such views are subject to change at any time based upon market or other conditions and Fidelity disclaims any responsibility to update such views. These views may not be relied on as investment advice and, because investment decisions for a Fidelity fund are based on numerous factors, may not be relied on as an indication of trading intent on behalf of any Fidelity fund.
Annual Report
Shareholder Expense Example
As a shareholder of the Fund, you incur two types of costs: (1) transaction costs, including sales charges (loads) on purchase payments or redemption proceeds, redemption fees and (2) ongoing costs, including management fees, distribution and/or service (12b-1) fees and other Fund expenses. This Example is intended to help you understand your ongoing costs (in dollars) of investing in the Fund and to compare these costs with the ongoing costs of investing in other mutual funds.
The Example is based on an investment of $1,000 invested at the beginning of the period and held for the entire period (May 1, 2012 to October 31, 2012).
Actual Expenses
The first line of the accompanying table for each class of the Fund provides information about actual account values and actual expenses. You may use the information in this line, together with the amount you invested, to estimate the expenses that you paid over the period. Simply divide your account value by $1,000.00 (for example, an $8,600 account value divided by $1,000.00 = 8.6), then multiply the result by the number in the first line for a class of the Fund under the heading entitled "Expenses Paid During Period" to estimate the expenses you paid on your account during this period. A small balance maintenance fee of $12.00 that is charged once a year may apply for certain accounts with a value of less than $2,000. This fee is not included in the table below. If it was, the estimate of expenses you paid during the period would be higher, and your ending account value lower, by this amount. In addition, the Fund, as a shareholder in the underlying Fidelity Central Funds, will indirectly bear its pro-rata share of the fees and expenses incurred by the underlying Fidelity Central Funds. These fees and expenses are not included in the Fund's annualized expense ratio used to calculate the expense estimate in the table below.
Hypothetical Example for Comparison Purposes
The second line of the accompanying table for each class of the Fund provides information about hypothetical account values and hypothetical expenses based on a Class' actual expense ratio and an assumed rate of return of 5% per year before expenses, which is not the Class' actual return. The hypothetical account values and expenses may not be used to estimate the actual ending account balance or expenses you paid for the period. You may use this information to compare the ongoing costs of investing in the Fund and other funds. To do so, compare this 5% hypothetical example with the 5% hypothetical examples that appear in the shareholder reports of the other funds. A small balance maintenance fee of $12.00 that is charged once a year may apply for certain accounts with a value of less than $2,000. This fee is not included in the table below. If it was, the estimate of expenses you paid during the period would be higher, and your ending account value lower, by this amount. In addition, the Fund, as a shareholder in the underlying Fidelity Central Funds, will indirectly bear its pro-rata share of the fees and expenses incurred by the underlying Fidelity Central Funds. These fees and expenses are not included in the Fund's annualized expense ratio used to calculate the expense estimate in the table below.
Please note that the expenses shown in the table are meant to highlight your ongoing costs only and do not reflect any transaction costs. Therefore, the second line of the table is useful in comparing ongoing costs only, and will not help you determine the relative total costs of owning different funds. In addition, if these transactional costs were included, your costs would have been higher.
Annual Report
| Annualized Expense Ratio | Beginning
Account Value
May 1, 2012 | Ending
Account Value
October 31, 2012 | Expenses Paid
During Period*
May 1, 2012 to October 31, 2012 |
Class A | 1.33% | | | |
Actual | | $ 1,000.00 | $ 990.50 | $ 6.65 |
HypotheticalA | | $ 1,000.00 | $ 1,018.45 | $ 6.75 |
Class T | 1.59% | | | |
Actual | | $ 1,000.00 | $ 989.10 | $ 7.95 |
HypotheticalA | | $ 1,000.00 | $ 1,017.14 | $ 8.06 |
Class B | 2.09% | | | |
Actual | | $ 1,000.00 | $ 987.00 | $ 10.44 |
HypotheticalA | | $ 1,000.00 | $ 1,014.63 | $ 10.58 |
Class C | 2.09% | | | |
Actual | | $ 1,000.00 | $ 987.00 | $ 10.44 |
HypotheticalA | | $ 1,000.00 | $ 1,014.63 | $ 10.58 |
Global Commodity Stock | 1.08% | | | |
Actual | | $ 1,000.00 | $ 991.90 | $ 5.41 |
HypotheticalA | | $ 1,000.00 | $ 1,019.71 | $ 5.48 |
Institutional Class | 1.03% | | | |
Actual | | $ 1,000.00 | $ 992.60 | $ 5.16 |
HypotheticalA | | $ 1,000.00 | $ 1,019.96 | $ 5.23 |
A 5% return per year before expenses
* Expenses are equal to each Class' annualized expense ratio, multiplied by the average account value over the period, multiplied by 184/366 (to reflect the one-half year period).
Annual Report
Investment Changes (Unaudited)
Top Ten Stocks as of October 31, 2012 |
| % of fund's
net assets | % of fund's net assets
6 months ago |
BHP Billiton PLC | 5.7 | 5.6 |
Monsanto Co. | 5.0 | 4.6 |
Syngenta AG (Switzerland) | 3.9 | 1.8 |
Potash Corp. of Saskatchewan, Inc. | 3.4 | 4.1 |
Royal Dutch Shell PLC Class A (United Kingdom) | 3.2 | 3.0 |
Rio Tinto PLC | 2.9 | 2.7 |
Chevron Corp. | 2.0 | 3.1 |
BP PLC | 1.9 | 1.8 |
Agrium, Inc. | 1.7 | 1.4 |
International Paper Co. | 1.7 | 1.2 |
| 31.4 | |
Top Sectors (% of fund's net assets) |
As of October 31, 2012 |
 | Metals 35.2% | |
 | Energy 34.0% | |
 | Agriculture 28.7% | |
 | Other 1.6% | |
| Short-Term Investments
and Net Other Assets 0.5% | |

As of April 30, 2012 |
| Energy 37.0% | |
| Metals 36.8% | |
| Agriculture 23.5% | |
| Other 2.5% | |
| Short-Term Investments
and Net Other Assets 0.2% | |

Annual Report
Investments October 31, 2012
Showing Percentage of Net Assets
Common Stocks - 99.5% |
| Shares | | Value |
CHEMICALS - 21.2% |
Commodity Chemicals - 0.0% |
Braskem SA (PN-A) | 13,250 | | $ 87,547 |
Fertilizers & Agricultural Chemicals - 21.2% |
Agrium, Inc. | 94,300 | | 9,930,888 |
CF Industries Holdings, Inc. | 42,072 | | 8,632,754 |
China BlueChemical Ltd. (H Shares) | 2,450,000 | | 1,552,184 |
Incitec Pivot Ltd. | 838,984 | | 2,752,067 |
Israel Chemicals Ltd. | 337,000 | | 4,217,218 |
Israel Corp. Ltd. (Class A) | 1,000 | | 679,773 |
K&S AG | 74,207 | | 3,510,694 |
Monsanto Co. | 339,900 | | 29,255,193 |
Potash Corp. of Saskatchewan, Inc. | 501,600 | | 20,164,446 |
Sociedad Quimica y Minera de Chile SA (PN-B) sponsored ADR | 3,100 | | 179,335 |
Syngenta AG (Switzerland) | 58,362 | | 22,754,733 |
Taiwan Fertilizer Co. Ltd. | 93,000 | | 221,595 |
The Mosaic Co. | 181,700 | | 9,510,178 |
United Phosphorous Ltd. (a) | 252,256 | | 534,939 |
Uralkali OJSC GDR (Reg. S) | 137,900 | | 5,402,922 |
Yara International ASA | 115,400 | | 5,436,732 |
| | 124,735,651 |
Specialty Chemicals - 0.0% |
LyondellBasell Industries NV Class A | 3,900 | | 208,221 |
TOTAL CHEMICALS | | 125,031,419 |
CONSTRUCTION & ENGINEERING - 0.0% |
Construction & Engineering - 0.0% |
FLSmidth & Co. A/S | 3,100 | | 183,134 |
CONSTRUCTION MATERIALS - 0.1% |
Construction Materials - 0.1% |
Martin Marietta Materials, Inc. | 7,100 | | 584,401 |
CONTAINERS & PACKAGING - 0.1% |
Paper Packaging - 0.1% |
Klabin SA (PN) (non-vtg.) | 31,700 | | 186,200 |
Rock-Tenn Co. Class A | 9,000 | | 658,710 |
| | 844,910 |
Common Stocks - continued |
| Shares | | Value |
ENERGY EQUIPMENT & SERVICES - 1.5% |
Oil & Gas Drilling - 1.2% |
Eurasia Drilling Co. Ltd. GDR (Reg. S) | 8,000 | | $ 276,800 |
Noble Corp. | 56,600 | | 2,136,084 |
Ocean Rig UDW, Inc. (United States) (a) | 90,700 | | 1,439,409 |
Rowan Companies PLC (a) | 32,900 | | 1,043,259 |
Unit Corp. (a) | 14,400 | | 581,040 |
Vantage Drilling Co. (a) | 1,074,382 | | 1,976,863 |
| | 7,453,455 |
Oil & Gas Equipment & Services - 0.3% |
Cameron International Corp. (a) | 12,700 | | 643,128 |
National Oilwell Varco, Inc. | 4,200 | | 309,540 |
Superior Energy Services, Inc. (a) | 36,600 | | 744,078 |
| | 1,696,746 |
TOTAL ENERGY EQUIPMENT & SERVICES | | 9,150,201 |
FOOD PRODUCTS - 4.1% |
Agricultural Products - 4.0% |
Archer Daniels Midland Co. | 311,500 | | 8,360,660 |
Bunge Ltd. | 104,400 | | 7,415,532 |
China Agri-Industries Holdings Ltd. | 1,561,000 | | 976,878 |
Golden Agri-Resources Ltd. | 4,481,000 | | 2,295,971 |
Ingredion, Inc. | 10,400 | | 639,184 |
Viterra, Inc. | 200,600 | | 3,161,396 |
Wilmar International Ltd. | 214,000 | | 542,105 |
| | 23,391,726 |
Packaged Foods & Meats - 0.1% |
Tyson Foods, Inc. Class A | 46,300 | | 778,303 |
TOTAL FOOD PRODUCTS | | 24,170,029 |
MACHINERY - 0.7% |
Construction & Farm Machinery & Heavy Trucks - 0.7% |
Caterpillar, Inc. | 3,200 | | 271,392 |
Cummins, Inc. | 2,900 | | 271,382 |
Deere & Co. | 450 | | 38,448 |
Fiat Industrial SpA | 186,900 | | 2,024,002 |
Jain Irrigation Systems Ltd. | 442,016 | | 537,271 |
Joy Global, Inc. | 12,850 | | 802,483 |
| | 3,944,978 |
Common Stocks - continued |
| Shares | | Value |
METALS & MINING - 35.2% |
Aluminum - 0.2% |
Alcoa, Inc. | 135,300 | | $ 1,159,521 |
Diversified Metals & Mining - 18.2% |
Anglo American PLC (United Kingdom) | 286,151 | | 8,787,601 |
BHP Billiton PLC | 1,044,896 | | 33,490,228 |
Copper Mountain Mining Corp. (a) | 1,376,156 | | 5,566,629 |
Eurasian Natural Resources Corp. PLC | 86,200 | | 455,848 |
First Quantum Minerals Ltd. | 164,100 | | 3,688,656 |
Freeport-McMoRan Copper & Gold, Inc. | 239,200 | | 9,300,096 |
Glencore International PLC (d) | 698,800 | | 3,868,535 |
Grupo Mexico SA de CV Series B | 89,411 | | 286,519 |
Horsehead Holding Corp. (a) | 221,000 | | 2,000,050 |
Iluka Resources Ltd. | 344,446 | | 3,546,918 |
Inmet Mining Corp. | 16,800 | | 866,283 |
Ivanhoe Australia Ltd. (a) | 536,258 | | 487,080 |
Jiangxi Copper Co. Ltd. (H Shares) | 75,000 | | 194,031 |
Kazakhmys PLC | 28,100 | | 321,506 |
Korea Zinc Co. Ltd. | 1,100 | | 451,977 |
Norilsk Nickel OJSC sponsored ADR | 1,700 | | 25,789 |
OZ Minerals Ltd. | 531 | | 4,514 |
Rio Tinto PLC | 341,587 | | 17,064,470 |
Sterlite Industries (India) Ltd. | 148,488 | | 273,500 |
Sumitomo Metal Mining Co. Ltd. | 103,000 | | 1,356,044 |
Teck Resources Ltd. Class B (sub. vtg.) | 111,100 | | 3,526,278 |
Turquoise Hill Resources Ltd. (a)(d) | 510,014 | | 3,988,195 |
Walter Energy, Inc. | 26,800 | | 936,928 |
Xstrata PLC | 416,691 | | 6,583,812 |
| | 107,071,487 |
Gold - 9.3% |
Agnico-Eagle Mines Ltd. (Canada) | 32,400 | | 1,829,323 |
AngloGold Ashanti Ltd. sponsored ADR | 103,800 | | 3,527,124 |
Barrick Gold Corp. | 227,800 | | 9,212,358 |
Centerra Gold, Inc. | 40,500 | | 459,439 |
Eldorado Gold Corp. | 218,350 | | 3,226,880 |
Gold Fields Ltd. sponsored ADR | 156,900 | | 1,962,819 |
Goldcorp, Inc. | 185,810 | | 8,399,821 |
Harmony Gold Mining Co. Ltd. sponsored ADR | 158,500 | | 1,315,550 |
IAMGOLD Corp. | 97,900 | | 1,519,349 |
Kinross Gold Corp. | 264,705 | | 2,629,160 |
New Gold, Inc. (a) | 255,100 | | 2,985,851 |
Newcrest Mining Ltd. | 170,840 | | 4,687,108 |
Common Stocks - continued |
| Shares | | Value |
METALS & MINING - CONTINUED |
Gold - continued |
Newmont Mining Corp. | 99,000 | | $ 5,400,450 |
Osisko Mining Corp. (a) | 99,400 | | 976,334 |
Premier Gold Mines Ltd. (a) | 301,500 | | 1,693,532 |
Randgold Resources Ltd. sponsored ADR | 17,800 | | 2,128,702 |
Yamana Gold, Inc. | 150,200 | | 3,033,326 |
| | 54,987,126 |
Precious Metals & Minerals - 1.1% |
Aquarius Platinum Ltd. (United Kingdom) | 492,800 | | 298,221 |
Gem Diamonds Ltd. (a) | 223,600 | | 608,908 |
Impala Platinum Holdings Ltd. | 10,000 | | 179,917 |
Lonmin PLC (d) | 5,922 | | 49,026 |
Northam Platinum Ltd. | 30,500 | | 114,674 |
Pan American Silver Corp. | 92,300 | | 2,024,824 |
Silver Wheaton Corp. | 74,400 | | 2,998,348 |
| | 6,273,918 |
Steel - 6.4% |
African Minerals Ltd. (a) | 612,800 | | 2,702,186 |
Allegheny Technologies, Inc. | 28,000 | | 737,800 |
ArcelorMittal SA Class A unit (d) | 202,400 | | 2,989,448 |
Bradespar SA (PN) | 12,600 | | 186,111 |
Carpenter Technology Corp. | 3,400 | | 165,274 |
Cliffs Natural Resources, Inc. | 26,100 | | 946,647 |
Commercial Metals Co. | 19,550 | | 269,008 |
Eregli Demir ve Celik Fabrikalari T.A.S. | 149,000 | | 177,054 |
Fortescue Metals Group Ltd. (d) | 624,689 | | 2,645,710 |
Gerdau SA sponsored ADR | 179,500 | | 1,577,805 |
Hyundai Steel Co. | 30,714 | | 2,211,323 |
JFE Holdings, Inc. | 119,000 | | 1,677,001 |
Jindal Steel & Power Ltd. | 61,255 | | 442,122 |
London Mining PLC (a) | 1,327,900 | | 3,267,920 |
Maanshan Iron & Steel Ltd. (H Shares) (a) | 977,000 | | 252,127 |
Magnitogorsk Iron & Steel Works OJSC unit (a) | 143,600 | | 619,203 |
Nucor Corp. | 24,600 | | 987,198 |
POSCO | 15,694 | | 4,934,748 |
Reliance Steel & Aluminum Co. | 7,100 | | 385,814 |
Salzgitter AG | 4,700 | | 203,378 |
Sims Metal Management Ltd. | 21,500 | | 210,091 |
Tata Steel Ltd. | 63,017 | | 459,349 |
Thyssenkrupp AG (d) | 56,600 | | 1,287,871 |
Common Stocks - continued |
| Shares | | Value |
METALS & MINING - CONTINUED |
Steel - continued |
Usinas Siderurgicas de Minas Gerais SA - Usiminas (PN-A) (non-vtg.) | 58,700 | | $ 283,522 |
Vale SA (PN-A) sponsored ADR | 403,000 | | 7,169,370 |
Voestalpine AG | 23,100 | | 727,568 |
Yamato Kogyo Co. Ltd. | 9,100 | | 255,457 |
| | 37,771,105 |
TOTAL METALS & MINING | | 207,263,157 |
OIL, GAS & CONSUMABLE FUELS - 32.5% |
Coal & Consumable Fuels - 1.7% |
Alpha Natural Resources, Inc. (a)(d) | 484,337 | | 4,150,768 |
Banpu PCL (For. Reg.) | 8,950 | | 114,392 |
Cameco Corp. | 24,600 | | 477,098 |
China Shenhua Energy Co. Ltd. (H Shares) | 54,000 | | 229,934 |
Paladin Energy Ltd.: | | | |
(Australia) (a) | 46,842 | | 55,189 |
(Canada) (a) | 271,500 | | 320,771 |
Peabody Energy Corp. | 141,600 | | 3,950,640 |
Whitehaven Coal Ltd. | 138,200 | | 437,548 |
Yanzhou Coal Mining Co. Ltd. (H Shares) | 102,000 | | 152,044 |
| | 9,888,384 |
Integrated Oil & Gas - 17.3% |
BG Group PLC | 271,550 | | 5,028,504 |
BP PLC | 1,556,100 | | 11,113,052 |
Cenovus Energy, Inc. | 38,100 | | 1,343,943 |
Chevron Corp. | 105,900 | | 11,671,239 |
China Petroleum & Chemical Corp. (H Shares) | 508,000 | | 535,370 |
ENI SpA | 254,827 | | 5,863,806 |
Exxon Mobil Corp. | 69,961 | | 6,378,344 |
Gazprom OAO sponsored ADR | 474,100 | | 4,333,274 |
Hess Corp. | 51,900 | | 2,712,294 |
InterOil Corp. (a) | 41,300 | | 2,663,024 |
Lukoil Oil Co. sponsored ADR | 39,900 | | 2,401,980 |
Murphy Oil Corp. | 38,700 | | 2,322,000 |
Occidental Petroleum Corp. | 95,100 | | 7,509,096 |
OMV AG | 13,300 | | 486,134 |
Origin Energy Ltd. | 254,563 | | 3,001,870 |
Petroleo Brasileiro SA - Petrobras (PN) sponsored ADR (non-vtg.) | 259,600 | | 5,329,588 |
Common Stocks - continued |
| Shares | | Value |
OIL, GAS & CONSUMABLE FUELS - CONTINUED |
Integrated Oil & Gas - continued |
Repsol YPF SA | 72,671 | | $ 1,452,449 |
Royal Dutch Shell PLC Class A (United Kingdom) | 548,750 | | 18,829,121 |
StatoilHydro ASA | 64,600 | | 1,591,031 |
Suncor Energy, Inc. | 199,432 | | 6,693,327 |
Total SA | 14,900 | | 750,516 |
| | 102,009,962 |
Oil & Gas Exploration & Production - 12.4% |
Anadarko Petroleum Corp. | 127,800 | | 8,793,918 |
Apache Corp. | 90,000 | | 7,447,500 |
Baytex Energy Corp. | 4,300 | | 195,680 |
Bonavista Energy Corp. (d) | 45,000 | | 806,959 |
C&C Energia Ltd. (a) | 284,900 | | 1,660,193 |
Cabot Oil & Gas Corp. | 32,200 | | 1,512,756 |
Canadian Natural Resources Ltd. | 199,200 | | 6,003,424 |
Canadian Oil Sands Ltd. | 8,600 | | 182,548 |
Chesapeake Energy Corp. | 65,700 | | 1,331,082 |
Cimarex Energy Co. | 7,400 | | 423,132 |
CNOOC Ltd. | 120,000 | | 246,957 |
CNOOC Ltd. sponsored ADR (d) | 14,800 | | 3,042,140 |
Cobalt International Energy, Inc. (a) | 99,800 | | 2,076,838 |
Concho Resources, Inc. (a) | 7,000 | | 602,840 |
ConocoPhillips | 3,200 | | 185,120 |
Crew Energy, Inc. (a) | 378,000 | | 2,910,458 |
Denbury Resources, Inc. (a) | 251,900 | | 3,861,627 |
Devon Energy Corp. | 32,600 | | 1,897,646 |
Double Eagle Petroleum Co. (a)(d) | 284,610 | | 1,425,896 |
EOG Resources, Inc. | 14,700 | | 1,712,403 |
EQT Corp. | 4,600 | | 278,898 |
INPEX Corp. | 437 | | 2,490,730 |
Marathon Oil Corp. | 62,600 | | 1,881,756 |
Newfield Exploration Co. (a) | 9,100 | | 246,792 |
Nexen, Inc. | 10,400 | | 248,350 |
Noble Energy, Inc. | 15,800 | | 1,501,158 |
NOVATEK OAO GDR (Reg. S) | 8,700 | | 991,800 |
Oasis Petroleum, Inc. (a) | 3,150 | | 92,516 |
OGX Petroleo e Gas Participacoes SA (a) | 56,600 | | 131,255 |
Oil Search Ltd. ADR | 46,796 | | 361,410 |
Pacific Rubiales Energy Corp. | 1,700 | | 39,983 |
Painted Pony Petroleum Ltd. (a)(e) | 15,000 | | 162,203 |
Painted Pony Petroleum Ltd. Class A (a) | 213,100 | | 2,304,360 |
Common Stocks - continued |
| Shares | | Value |
OIL, GAS & CONSUMABLE FUELS - CONTINUED |
Oil & Gas Exploration & Production - continued |
Pengrowth Energy Corp. (d) | 54,200 | | $ 325,064 |
Penn West Petroleum Ltd. | 160,000 | | 2,077,797 |
PetroBakken Energy Ltd. Class A (d) | 132,900 | | 1,677,966 |
Petrominerales Ltd. | 241,126 | | 1,933,837 |
Pioneer Natural Resources Co. | 11,700 | | 1,236,105 |
QEP Resources, Inc. | 18,100 | | 524,900 |
Rosetta Resources, Inc. (a) | 13,200 | | 607,728 |
Santos Ltd. | 92,100 | | 1,100,407 |
SM Energy Co. | 5,700 | | 307,344 |
Southwestern Energy Co. (a) | 30,900 | | 1,072,230 |
Talisman Energy, Inc. | 86,500 | | 980,406 |
Tullow Oil PLC | 89,300 | | 2,023,275 |
Whiting Petroleum Corp. (a) | 30,100 | | 1,264,802 |
Woodside Petroleum Ltd. | 24,408 | | 871,583 |
| | 73,053,772 |
Oil & Gas Refining & Marketing - 0.8% |
Marathon Petroleum Corp. | 26,850 | | 1,474,871 |
Phillips 66 | 4,100 | | 193,356 |
Tesoro Corp. | 29,900 | | 1,127,529 |
Valero Energy Corp. | 60,700 | | 1,766,370 |
| | 4,562,126 |
Oil & Gas Storage & Transport - 0.3% |
Cheniere Energy, Inc. (a) | 73,900 | | 1,189,051 |
The Williams Companies, Inc. | 18,000 | | 629,820 |
| | 1,818,871 |
TOTAL OIL, GAS & CONSUMABLE FUELS | | 191,333,115 |
PAPER & FOREST PRODUCTS - 3.6% |
Paper Products - 3.6% |
Empresas CMPC SA | 333,075 | | 1,277,197 |
International Paper Co. | 275,700 | | 9,878,331 |
MeadWestvaco Corp. | 800 | | 23,752 |
Nine Dragons Paper (Holdings) Ltd. | 869,000 | | 612,221 |
Nippon Paper Group, Inc. (d) | 86,800 | | 992,715 |
Oji Holdings Corp. | 268,000 | | 785,569 |
Stora Enso Oyj (R Shares) | 487,600 | | 3,076,589 |
UPM-Kymmene Corp. | 405,300 | | 4,339,222 |
| | 20,985,596 |
Common Stocks - continued |
| Shares | | Value |
SPECIALTY RETAIL - 0.4% |
Specialty Stores - 0.4% |
Tsutsumi Jewelry Co. Ltd. | 95,500 | | $ 2,190,411 |
TRADING COMPANIES & DISTRIBUTORS - 0.1% |
Trading Companies & Distributors - 0.1% |
Mitsubishi Corp. | 28,900 | | 515,877 |
TOTAL COMMON STOCKS (Cost $614,116,238) |
586,197,228
|
Money Market Funds - 3.1% |
| | | |
Fidelity Cash Central Fund, 0.19% (b) | 1,525,856 | | 1,525,856 |
Fidelity Securities Lending Cash Central Fund, 0.19% (b)(c) | 16,641,647 | | 16,641,647 |
TOTAL MONEY MARKET FUNDS (Cost $18,167,503) |
18,167,503
|
TOTAL INVESTMENT PORTFOLIO - 102.6% (Cost $632,283,741) | 604,364,731 |
NET OTHER ASSETS (LIABILITIES) - (2.6)% | (15,234,186) |
NET ASSETS - 100% | $ 589,130,545 |
Legend |
(a) Non-income producing |
(b) Affiliated fund that is available only to investment companies and other accounts managed by Fidelity Investments. The rate quoted is the annualized seven-day yield of the fund at period end. A complete unaudited listing of the fund's holdings as of its most recent quarter end is available upon request. In addition, each Fidelity Central Fund's financial statements, which are not covered by the Fund's Report of Independent Registered Public Accounting Firm, are available on the SEC's website or upon request. |
(c) Investment made with cash collateral received from securities on loan. |
(d) Security or a portion of the security is on loan at period end. |
(e) Security exempt from registration under Rule 144A of the Securities Act of 1933. These securities may be resold in transactions exempt from registration, normally to qualified institutional buyers. At the end of the period, the value of these securities amounted to $162,203 or 0.0% of net assets. |
Affiliated Central Funds |
Information regarding fiscal year to date income earned by the Fund from investments in Fidelity Central Funds is as follows: |
Fund | Income earned |
Fidelity Cash Central Fund | $ 6,102 |
Fidelity Securities Lending Cash Central Fund | 447,820 |
Total | $ 453,922 |
Other Information |
The following is a summary of the inputs used, as of October 31, 2012, involving the Fund's assets and liabilities carried at fair value. The inputs or methodology used for valuing securities may not be an indication of the risk associated with investing in those securities. For more information on valuation inputs, and their aggregation into the levels used in the tables below, please refer to the Security Valuation section in the accompanying Notes to Financial Statements. |
Valuation Inputs at Reporting Date: |
Description | Total | Level 1 | Level 2 | Level 3 |
Investments in Securities: | | | | |
Common Stocks | $ 586,197,228 | $ 468,387,561 | $ 117,809,667 | $ - |
Money Market Funds | 18,167,503 | 18,167,503 | - | - |
Total Investments in Securities: | $ 604,364,731 | $ 486,555,064 | $ 117,809,667 | $ - |
The following is a summary of transfers between Level 1 and Level 2 for the period ended October 31, 2012. Transfers are assumed to have occurred at the beginning of the period, and are primarily attributable to the valuation techniques used for foreign equity securities, as discussed in the accompanying Notes to Financial Statements: |
Transfers | Total |
Level 1 to Level 2 | $ 0 |
Level 2 to Level 1 | $ 40,233,339 |
Distribution of investments by country or territory of incorporation, as a percentage of total net assets, is as follows. (Unaudited) |
United States of America | 31.3% |
Canada | 20.9% |
United Kingdom | 18.5% |
Switzerland | 4.3% |
Australia | 3.6% |
Brazil | 2.5% |
Russia | 2.3% |
Bermuda | 2.0% |
Japan | 1.7% |
Italy | 1.3% |
Korea (South) | 1.3% |
Finland | 1.3% |
Norway | 1.2% |
South Africa | 1.1% |
Bailiwick of Jersey | 1.1% |
Others (Individually Less Than 1%) | 5.6% |
| 100.0% |
See accompanying notes which are an integral part of the financial statements.
Annual Report
Statement of Assets and Liabilities
| October 31, 2012 |
| | |
Assets | | |
Investment in securities, at value (including securities loaned of $15,891,643) - See accompanying schedule: Unaffiliated issuers (cost $614,116,238) | $ 586,197,228 | |
Fidelity Central Funds (cost $18,167,503) | 18,167,503 | |
Total Investments (cost $632,283,741) | | $ 604,364,731 |
Receivable for investments sold | | 3,085,957 |
Receivable for fund shares sold | | 635,744 |
Dividends receivable | | 697,233 |
Distributions receivable from Fidelity Central Funds | | 25,559 |
Other receivables | | 25,267 |
Total assets | | 608,834,491 |
| | |
Liabilities | | |
Payable for investments purchased | $ 862,645 | |
Payable for fund shares redeemed | 1,560,012 | |
Accrued management fee | 352,531 | |
Distribution and service plan fees payable | 57,926 | |
Other affiliated payables | 173,018 | |
Other payables and accrued expenses | 56,167 | |
Collateral on securities loaned, at value | 16,641,647 | |
Total liabilities | | 19,703,946 |
| | |
Net Assets | | $ 589,130,545 |
Net Assets consist of: | | |
Paid in capital | | $ 653,044,854 |
Undistributed net investment income | | 4,752,569 |
Accumulated undistributed net realized gain (loss) on investments and foreign currency transactions | | (40,740,018) |
Net unrealized appreciation (depreciation) on investments and assets and liabilities in foreign currencies | | (27,926,860) |
Net Assets | | $ 589,130,545 |
See accompanying notes which are an integral part of the financial statements.
Annual Report
Statement of Assets and Liabilities - continued
| October 31, 2012 |
| | |
Calculation of Maximum Offering Price
Class A:
Net Asset Value and redemption price per share
($99,694,434 ÷ 6,832,148 shares) | | $ 14.59 |
| | |
Maximum offering price per share (100/94.25 of $14.59) | | $ 15.48 |
Class T:
Net Asset Value and redemption price per share ($16,692,439 ÷ 1,147,836 shares) | | $ 14.54 |
| | |
Maximum offering price per share (100/96.50 of $14.54) | | $ 15.07 |
Class B:
Net Asset Value and offering price per share ($3,096,607 ÷ 214,827 shares)A | | $ 14.41 |
| | |
Class C:
Net Asset Value and offering price per share ($31,865,429 ÷ 2,217,584 shares)A | | $ 14.37 |
| | |
Global Commodity Stock:
Net Asset Value, offering price and redemption price per share ($387,241,629 ÷ 26,407,116 shares) | | $ 14.66 |
| | |
Institutional Class:
Net Asset Value, offering price and redemption price per share ($50,540,007 ÷ 3,445,636 shares) | | $ 14.67 |
A Redemption price per share is equal to net asset value less any applicable contingent deferred sales charge.
See accompanying notes which are an integral part of the financial statements.
Annual Report
Financial Statements - continued
Statement of Operations
| Year ended October 31, 2012 |
| | |
Investment Income | | |
Dividends | | $ 14,713,564 |
Interest | | 7,665 |
Income from Fidelity Central Funds | | 453,922 |
Income before foreign taxes withheld | | 15,175,151 |
Less foreign taxes withheld | | (949,994) |
Total income | | 14,225,157 |
| | |
Expenses | | |
Management fee | $ 4,742,379 | |
Transfer agent fees | 1,946,370 | |
Distribution and service plan fees | 749,354 | |
Accounting and security lending fees | 334,777 | |
Custodian fees and expenses | 90,233 | |
Independent trustees' compensation | 4,478 | |
Registration fees | 112,635 | |
Audit | 54,137 | |
Legal | 3,454 | |
Interest | 1,155 | |
Miscellaneous | 9,469 | |
Total expenses before reductions | 8,048,441 | |
Expense reductions | (50,515) | 7,997,926 |
Net investment income (loss) | | 6,227,231 |
Realized and Unrealized Gain (Loss) Net realized gain (loss) on: | | |
Investment securities: | | |
Unaffiliated issuers | (27,052,701) | |
Foreign currency transactions | (554,431) | |
Total net realized gain (loss) | | (27,607,132) |
Change in net unrealized appreciation (depreciation) on: Investment securities (net of increase in deferred foreign taxes of $5,167) | (9,235,369) | |
Assets and liabilities in foreign currencies | 240,281 | |
Total change in net unrealized appreciation (depreciation) | | (8,995,088) |
Net gain (loss) | | (36,602,220) |
Net increase (decrease) in net assets resulting from operations | | $ (30,374,989) |
See accompanying notes which are an integral part of the financial statements.
Annual Report
Statement of Changes in Net Assets
| Year ended
October 31,
2012 | Year ended
October 31,
2011 |
Increase (Decrease) in Net Assets | | |
Operations | | |
Net investment income (loss) | $ 6,227,231 | $ 6,869,450 |
Net realized gain (loss) | (27,607,132) | (6,898,032) |
Change in net unrealized appreciation (depreciation) | (8,995,088) | (67,719,909) |
Net increase (decrease) in net assets resulting
from operations | (30,374,989) | (67,748,491) |
Distributions to shareholders from net investment income | (3,692,921) | (5,045,313) |
Distributions to shareholders from net realized gain | (671,463) | (2,104,800) |
Total distributions | (4,364,384) | (7,150,113) |
Share transactions - net increase (decrease) | (156,629,581) | 418,528,912 |
Redemption fees | 31,600 | 94,436 |
Total increase (decrease) in net assets | (191,337,354) | 343,724,744 |
| | |
Net Assets | | |
Beginning of period | 780,467,899 | 436,743,155 |
End of period (including undistributed net investment income of $4,752,569 and undistributed net investment income of $2,852,890, respectively) | $ 589,130,545 | $ 780,467,899 |
See accompanying notes which are an integral part of the financial statements.
Annual Report
Financial Highlights - Class A
Years ended October 31, | 2012 | 2011 | 2010 | 2009 I |
Selected Per-Share Data | | | | |
Net asset value, beginning of period | $ 15.14 | $ 15.60 | $ 13.29 | $ 10.00 |
Income from Investment Operations | | | | |
Net investment income (loss) E | .11 | .12 | .19 H | (.01) |
Net realized and unrealized gain (loss) | (.59) | (.38) | 2.20 | 3.29 |
Total from investment operations | (.48) | (.26) | 2.39 | 3.28 |
Distributions from net investment income | (.05) | (.13) | - K | - |
Distributions from net realized gain | (.01) | (.06) | (.08) | - |
Total distributions | (.07) M | (.20) L | (.08) | - |
Redemption fees added to paid in capital E | - K | - K | - K | .01 |
Net asset value, end of period | $ 14.59 | $ 15.14 | $ 15.60 | $ 13.29 |
Total Return B,C,D | (3.19)% | (1.80)% | 18.04% | 32.90% |
Ratios to Average Net Assets F,J | | | | |
Expenses before reductions | 1.34% | 1.32% | 1.37% | 1.65% A |
Expenses net of fee waivers, if any | 1.34% | 1.32% | 1.37% | 1.50% A |
Expenses net of all reductions | 1.33% | 1.31% | 1.36% | 1.48% A |
Net investment income (loss) | .80% | .71% | 1.35% H | (.15)% A |
Supplemental Data | | | | |
Net assets, end of period (000 omitted) | $ 99,694 | $ 127,979 | $ 60,370 | $ 15,705 |
Portfolio turnover rate G | 91% | 71% | 54% | 25% A |
A Annualized
B Total returns for periods of less than one year are not annualized.
C Total returns would have been lower if certain expenses had not been reduced during the applicable periods shown.
D Total returns do not include the effect of the sales charges.
E Calculated based on average shares outstanding during the period.
F Fees and expenses of any underlying Fidelity Central Funds are not included in the Fund's expense ratio. The Fund indirectly bears its proportionate share of the expenses of any underlying Fidelity Central Funds.
G Amount does not include the portfolio activity of any underlying Fidelity Central Funds.
H Investment income per share reflects a large, non-recurring dividend which amounted to $.13 per share. Excluding this non-recurring dividend, the ratio of net investment income (loss) to average net assets would have been .42%.
I For the period March 25, 2009 (commencement of operations) to October 31, 2009.
J Expense ratios reflect operating expenses of the class. Expenses before reductions do not reflect amounts reimbursed by the investment adviser or reductions from brokerage service arrangements or reductions from other expense offset arrangements and do not represent the amount paid by the class during periods when reimbursements or reductions occur. Expense ratios before reductions for start-up periods may not be representative of longer-term operating periods. Expenses net of fee waivers reflect expenses after reimbursement by the investment adviser but prior to reductions from brokerage service arrangements or other expense offset arrangements. Expenses net of all reductions represent the net expenses paid by the class.
K Amount represents less than $.01 per share.
L Total distributions of $.20 per share is comprised of distributions from net investment income of $.133 and distributions from net realized gain of $.062 per share.
M Total distributions of $.07 per share is comprised of distributions from net investment income of $.052 and distributions from net realized gain of $.014 per share.
See accompanying notes which are an integral part of the financial statements.
Annual Report
Financial Highlights - Class T
Years ended October 31, | 2012 | 2011 | 2010 | 2009 I |
Selected Per-Share Data | | | | |
Net asset value, beginning of period | $ 15.08 | $ 15.55 | $ 13.27 | $ 10.00 |
Income from Investment Operations | | | | |
Net investment income (loss) E | .08 | .07 | .16 H | (.03) |
Net realized and unrealized gain (loss) | (.60) | (.38) | 2.19 | 3.29 |
Total from investment operations | (.52) | (.31) | 2.35 | 3.26 |
Distributions from net investment income | (.01) | (.10) | - | - |
Distributions from net realized gain | (.01) | (.06) | (.07) | - |
Total distributions | (.02) | (.16) | (.07) | - |
Redemption fees added to paid in capital E | - K | - K | - K | .01 |
Net asset value, end of period | $ 14.54 | $ 15.08 | $ 15.55 | $ 13.27 |
Total Return B,C,D | (3.43)% | (2.09)% | 17.73% | 32.70% |
Ratios to Average Net Assets F,J | | | | |
Expenses before reductions | 1.61% | 1.60% | 1.63% | 2.04% A |
Expenses net of fee waivers, if any | 1.61% | 1.60% | 1.63% | 1.75% A |
Expenses net of all reductions | 1.60% | 1.59% | 1.61% | 1.73% A |
Net investment income (loss) | .53% | .43% | 1.10% H | (.40)% A |
Supplemental Data | | | | |
Net assets, end of period (000 omitted) | $ 16,692 | $ 20,831 | $ 11,762 | $ 4,665 |
Portfolio turnover rate G | 91% | 71% | 54% | 25% A |
A Annualized
B Total returns for periods of less than one year are not annualized.
C Total returns would have been lower if certain expenses had not been reduced during the applicable periods shown.
D Total returns do not include the effect of the sales charges.
E Calculated based on average shares outstanding during the period.
F Fees and expenses of any underlying Fidelity Central Funds are not included in the Fund's expense ratio. The Fund indirectly bears its proportionate share of the expenses of any underlying Fidelity Central Funds.
G Amount does not include the portfolio activity of any underlying Fidelity Central Funds.
H Investment income per share reflects a large, non-recurring dividend which amounted to $.13 per share. Excluding this non-recurring dividend, the ratio of net investment income (loss) to average net assets would have been .17%.
I For the period March 25, 2009 (commencement of operations) to October 31, 2009.
J Expense ratios reflect operating expenses of the class. Expenses before reductions do not reflect amounts reimbursed by the investment adviser or reductions from brokerage service arrangements or reductions from other expense offset arrangements and do not represent the amount paid by the class during periods when reimbursements or reductions occur. Expense ratios before reductions for start-up periods may not be representative of longer-term operating periods. Expenses net of fee waivers reflect expenses after reimbursement by the investment adviser but prior to reductions from brokerage service arrangements or other expense offset arrangements. Expenses net of all reductions represent the net expenses paid by the class.
K Amount represents less than $.01 per share.
See accompanying notes which are an integral part of the financial statements.
Annual Report
Financial Highlights - Class B
Years ended October 31, | 2012 | 2011 | 2010 | 2009 I |
Selected Per-Share Data | | | | |
Net asset value, beginning of period | $ 15.00 | $ 15.46 | $ 13.22 | $ 10.00 |
Income from Investment Operations | | | | |
Net investment income (loss) E | - K | (.01) | .08 H | (.07) |
Net realized and unrealized gain (loss) | (.59) | (.39) | 2.20 | 3.28 |
Total from investment operations | (.59) | (.40) | 2.28 | 3.21 |
Distributions from net realized gain | - | (.06) | (.04) | - |
Redemption fees added to paid in capital E | - K | - K | - K | .01 |
Net asset value, end of period | $ 14.41 | $ 15.00 | $ 15.46 | $ 13.22 |
Total Return B,C,D | (3.93)% | (2.62)% | 17.23% | 32.20% |
Ratios to Average Net Assets F,J | | | | |
Expenses before reductions | 2.10% | 2.11% | 2.16% | 2.66% A |
Expenses net of fee waivers, if any | 2.10% | 2.11% | 2.16% | 2.25% A |
Expenses net of all reductions | 2.10% | 2.10% | 2.15% | 2.23% A |
Net investment income (loss) | .03% | (.09)% | .56% H | (.90)% A |
Supplemental Data | | | | |
Net assets, end of period (000 omitted) | $ 3,097 | $ 4,324 | $ 4,348 | $ 2,726 |
Portfolio turnover rate G | 91% | 71% | 54% | 25% A |
A Annualized
B Total returns for periods of less than one year are not annualized.
C Total returns would have been lower if certain expenses had not been reduced during the applicable periods shown.
D Total returns do not include the effect of the contingent deferred sales charge.
E Calculated based on average shares outstanding during the period.
F Fees and expenses of any underlying Fidelity Central Funds are not included in the Fund's expense ratio. The Fund indirectly bears its proportionate share of the expenses of any underlying Fidelity Central Funds.
G Amount does not include the portfolio activity of any underlying Fidelity Central Funds.
H Investment income per share reflects a large, non-recurring dividend which amounted to $.13 per share. Excluding this non-recurring dividend, the ratio of net investment income (loss) to average net assets would have been (.37)%.
I For the period March 25, 2009 (commencement of operations) to October 31, 2009.
J Expense ratios reflect operating expenses of the class. Expenses before reductions do not reflect amounts reimbursed by the investment adviser or reductions from brokerage service arrangements or reductions from other expense offset arrangements and do not represent the amount paid by the class during periods when reimbursements or reductions occur. Expense ratios before reductions for start-up periods may not be representative of longer-term operating periods. Expenses net of fee waivers reflect expenses after reimbursement by the investment adviser but prior to reductions from brokerage service arrangements or other expense offset arrangements. Expenses net of all reductions represent the net expenses paid by the class.
K Amount represents less than $.01 per share.
See accompanying notes which are an integral part of the financial statements.
Annual Report
Financial Highlights - Class C
Years ended October 31, | 2012 | 2011 | 2010 | 2009 I |
Selected Per-Share Data | | | | |
Net asset value, beginning of period | $ 14.95 | $ 15.45 | $ 13.22 | $ 10.00 |
Income from Investment Operations | | | | |
Net investment income (loss) E | .01 | (.01) | .08 H | (.07) |
Net realized and unrealized gain (loss) | (.59) | (.38) | 2.19 | 3.28 |
Total from investment operations | (.58) | (.39) | 2.27 | 3.21 |
Distributions from net investment income | - | (.05) | - | - |
Distributions from net realized gain | - | (.06) | (.04) | - |
Total distributions | - | (.11) | (.04) | - |
Redemption fees added to paid in capital E | - K | - K | - K | .01 |
Net asset value, end of period | $ 14.37 | $ 14.95 | $ 15.45 | $ 13.22 |
Total Return B,C,D | (3.88)% | (2.58)% | 17.21% | 32.20% |
Ratios to Average Net Assets F,J | | | | |
Expenses before reductions | 2.10% | 2.09% | 2.14% | 2.53% A |
Expenses net of fee waivers, if any | 2.10% | 2.09% | 2.14% | 2.25% A |
Expenses net of all reductions | 2.09% | 2.08% | 2.13% | 2.23% A |
Net investment income (loss) | .03% | (.07)% | .58% H | (.90)% A |
Supplemental Data | | | | |
Net assets, end of period (000 omitted) | $ 31,865 | $ 37,185 | $ 14,338 | $ 4,798 |
Portfolio turnover rate G | 91% | 71% | 54% | 25% A |
A Annualized
B Total returns for periods of less than one year are not annualized.
C Total returns would have been lower if certain expenses had not been reduced during the applicable periods shown.
D Total returns do not include the effect of the contingent deferred sales charge.
E Calculated based on average shares outstanding during the period.
F Fees and expenses of any underlying Fidelity Central Funds are not included in the Fund's expense ratio. The Fund indirectly bears its proportionate share of the expenses of any underlying Fidelity Central Funds.
G Amount does not include the portfolio activity of any underlying Fidelity Central Funds.
H Investment income per share reflects a large, non-recurring dividend which amounted to $.13 per share. Excluding this non-recurring dividend, the ratio of net investment income (loss) to average net assets would have been (.34)%.
I For the period March 25, 2009 (commencement of operations) to October 31, 2009.
J Expense ratios reflect operating expenses of the class. Expenses before reductions do not reflect amounts reimbursed by the investment adviser or reductions from brokerage service arrangements or reductions from other expense offset arrangements and do not represent the amount paid by the class during periods when reimbursements or reductions occur. Expense ratios before reductions for start-up periods may not be representative of longer-term operating periods. Expenses net of fee waivers reflect expenses after reimbursement by the investment adviser but prior to reductions from brokerage service arrangements or other expense offset arrangements. Expenses net of all reductions represent the net expenses paid by the class.
K Amount represents less than $.01 per share.
See accompanying notes which are an integral part of the financial statements.
Annual Report
Financial Highlights - Global Commodity Stock
Years ended October 31, | 2012 | 2011 | 2010 | 2009 H |
Selected Per-Share Data | | | | |
Net asset value, beginning of period | $ 15.21 | $ 15.66 | $ 13.31 | $ 10.00 |
Income from Investment Operations | | | | |
Net investment income (loss) D | .15 | .16 | .23 G | .01 |
Net realized and unrealized gain (loss) | (.60) | (.39) | 2.21 | 3.29 |
Total from investment operations | (.45) | (.23) | 2.44 | 3.30 |
Distributions from net investment income | (.08) | (.16) | (.01) | - |
Distributions from net realized gain | (.01) | (.06) | (.08) | - |
Total distributions | (.10) K | (.22) | (.09) | - |
Redemption fees added to paid in capital D | - J | - J | - J | .01 |
Net asset value, end of period | $ 14.66 | $ 15.21 | $ 15.66 | $ 13.31 |
Total Return B,C | (2.96)% | (1.59)% | 18.38% | 33.10% |
Ratios to Average Net Assets E,I | | | | |
Expenses before reductions | 1.10% | 1.08% | 1.10% | 1.42% A |
Expenses net of fee waivers, if any | 1.10% | 1.08% | 1.10% | 1.25% A |
Expenses net of all reductions | 1.09% | 1.07% | 1.09% | 1.23% A |
Net investment income (loss) | 1.04% | .95% | 1.62% G | .10% A |
Supplemental Data | | | | |
Net assets, end of period (000 omitted) | $ 387,242 | $ 531,224 | $ 310,186 | $ 159,439 |
Portfolio turnover rate F | 91% | 71% | 54% | 25% A |
A Annualized
B Total returns for periods of less than one year are not annualized.
C Total returns would have been lower if certain expenses had not been reduced during the applicable periods shown.
D Calculated based on average shares outstanding during the period.
E Fees and expenses of any underlying Fidelity Central Funds are not included in the Fund's expense ratio. The Fund indirectly bears its proportionate share of the expenses of any underlying Fidelity Central Funds.
F Amount does not include the portfolio activity of any underlying Fidelity Central Funds.
G Investment income per share reflects a large, non-recurring dividend which amounted to $.13 per share. Excluding this non-recurring dividend, the ratio of net investment income (loss) to average net assets would have been .69%.
H For the period March 25, 2009 (commencement of operations) to October 31, 2009.
I Expense ratios reflect operating expenses of the class. Expenses before reductions do not reflect amounts reimbursed by the investment adviser or reductions from brokerage service arrangements or reductions from other expense offset arrangements and do not represent the amount paid by the class during periods when reimbursements or reductions occur. Expense ratios before reductions for start-up periods may not be representative of longer-term operating periods. Expenses net of fee waivers reflect expenses after reimbursement by the investment adviser but prior to reductions from brokerage service arrangements or other expense offset arrangements. Expenses net of all reductions represent the net expenses paid by the class.
J Amount represents less than $.01 per share.
K Total distributions of $.10 per share is comprised of distributions from net investment income of $.084 and distributions from net realized gain of $.014 per share.
See accompanying notes which are an integral part of the financial statements.
Annual Report
Financial Highlights - Institutional Class
Years ended October 31, | 2012 | 2011 | 2010 | 2009 H |
Selected Per-Share Data | | | | |
Net asset value, beginning of period | $ 15.22 | $ 15.66 | $ 13.31 | $ 10.00 |
Income from Investment Operations | | | | |
Net investment income (loss) D | .16 | .16 | .23 G | .01 |
Net realized and unrealized gain (loss) | (.60) | (.38) | 2.21 | 3.29 |
Total from investment operations | (.44) | (.22) | 2.44 | 3.30 |
Distributions from net investment income | (.09) | (.16) | (.01) | - |
Distributions from net realized gain | (.01) | (.06) | (.08) | - |
Total distributions | (.11) K | (.22) | (.09) | - |
Redemption fees added to paid in capital D | - J | - J | - J | .01 |
Net asset value, end of period | $ 14.67 | $ 15.22 | $ 15.66 | $ 13.31 |
Total Return B,C | (2.90)% | (1.50)% | 18.39% | 33.10% |
Ratios to Average Net Assets E,I | | | | |
Expenses before reductions | 1.04% | 1.03% | 1.09% | 1.36% A |
Expenses net of fee waivers, if any | 1.04% | 1.03% | 1.09% | 1.25% A |
Expenses net of all reductions | 1.03% | 1.03% | 1.07% | 1.23% A |
Net investment income (loss) | 1.10% | .99% | 1.64% G | .10% A |
Supplemental Data | | | | |
Net assets, end of period (000 omitted) | $ 50,540 | $ 58,925 | $ 35,739 | $ 9,811 |
Portfolio turnover rate F | 91% | 71% | 54% | 25% A |
A Annualized
B Total returns for periods of less than one year are not annualized.
C Total returns would have been lower if certain expenses had not been reduced during the applicable periods shown.
D Calculated based on average shares outstanding during the period.
E Fees and expenses of any underlying Fidelity Central Funds are not included in the Fund's expense ratio. The Fund indirectly bears its proportionate share of the expenses of any underlying Fidelity Central Funds.
F Amount does not include the portfolio activity of any underlying Fidelity Central Funds.
G Investment income per share reflects a large, non-recurring dividend which amounted to $.13 per share. Excluding this non-recurring dividend, the ratio of net investment income (loss) to average net assets would have been .71%.
H For the period March 25, 2009 (commencement of operations) to October 31, 2009.
I Expense ratios reflect operating expenses of the class. Expenses before reductions do not reflect amounts reimbursed by the investment adviser or reductions from brokerage service arrangements or reductions from other expense offset arrangements and do not represent the amount paid by the class during periods when reimbursements or reductions occur. Expense ratios before reductions for start-up periods may not be representative of longer-term operating periods. Expenses net of fee waivers reflect expenses after reimbursement by the investment adviser but prior to reductions from brokerage service arrangements or other expense offset arrangements. Expenses net of all reductions represent the net expenses paid by the class.
J Amount represents less than $.01 per share.
K Total distributions of $.11 per share is comprised of distributions from net investment income of $.093 and distributions from net realized gain of $.014 per share.
See accompanying notes which are an integral part of the financial statements.
Annual Report
Notes to Financial Statements
For the period ended October 31, 2012
1. Organization.
Fidelity® Global Commodity Stock Fund (the Fund) is a non-diversified fund of Fidelity Investment Trust (the Trust) and is authorized to issue an unlimited number of shares. The Trust is registered under the Investment Company Act of 1940, as amended (the 1940 Act), as an open-end management investment company organized as a Massachusetts business trust. The Fund offers Class A, Class T, Class C, Global Commodity Stock and Institutional Class shares, each of which, along with Class B shares, has equal rights as to assets and voting privileges. Effective after the close of business on September 1, 2010, Class B shares were closed to new accounts and additional purchases, except for exchanges and reinvestments. Each class has exclusive voting rights with respect to matters that affect that class. Class B shares will automatically convert to Class A shares after a holding period of seven years from the initial date of purchase. Investment income, realized and unrealized capital gains and losses, the common expenses of the Fund, and certain fund-level expense reductions, if any, are allocated on a pro-rata basis to each class based on the relative net assets of each class to the total net assets of the Fund. Each class differs with respect to transfer agent and distribution and service plan fees incurred. Certain expense reductions may also differ by class. The Fund's investments in emerging markets can be subject to social, economic, regulatory, and political uncertainties and can be extremely volatile.
2. Investments in Fidelity Central Funds.
The Fund invests in Fidelity Central Funds, which are open-end investment companies available only to other investment companies and accounts managed by Fidelity Management & Research Company (FMR) and its affiliates. The Fund's Schedule of Investments lists each of the Fidelity Central Funds held as of period end, if any, as an investment of the Fund, but does not include the underlying holdings of each Fidelity Central Fund. As an Investing Fund, the Fund indirectly bears its proportionate share of the expenses of the underlying Fidelity Central Funds.
The Money Market Central Funds seek preservation of capital and current income and are managed by Fidelity Investments Money Management, Inc. (FIMM), an affiliate of FMR.
A complete unaudited list of holdings for each Fidelity Central Fund is available upon request or at the Securities and Exchange Commission (the SEC) web site at www.sec.gov. In addition, the financial statements of the Fidelity Central Funds, which are not covered by the Fund's Report of Independent Registered Public Accounting Firm, are available on the SEC web site or upon request.
Annual Report
3. Significant Accounting Policies.
The financial statements have been prepared in conformity with accounting principles generally accepted in the United States of America (GAAP), which require management to make certain estimates and assumptions at the date of the financial statements. Actual results could differ from those estimates. Subsequent events, if any, through the date that the financial statements were issued have been evaluated in the preparation of the financial statements. The following summarizes the significant accounting policies of the Fund:
Security Valuation. Investments are valued as of 4:00 p.m. Eastern time on the last calendar day of the period. In accordance with valuation policies and procedures approved by the Board of Trustees (the Board), the Fund attempts to obtain prices from one or more third party pricing vendors or brokers to value its investments. When current market prices, quotations or rates are not readily available or reliable, securities will be fair valued in good faith by the FMR Fair Value Committee (the Committee), in accordance with procedures adopted by the Fund's Board. Factors used in determining fair value vary by security type and may include market or security specific events. The frequency with which these procedures are used cannot be predicted and they may be utilized to a significant extent. The Committee oversees the Fund's valuation policies and procedures and is responsible for approving and reporting to the Board all fair value determinations.
The Fund categorizes the inputs to valuation techniques used to value its investments into a disclosure hierarchy consisting of three levels as shown below:
Level 1 - quoted prices in active markets for identical investments
Level 2 - other significant observable inputs (including quoted prices for similar investments, interest rates, prepayment speeds, etc.)
Level 3 - unobservable inputs (including the Fund's own assumptions based on the best information available)
Valuation techniques used to value the Fund's investments by major category are as follows:
Equity securities, including restricted securities, for which market quotations are readily available, are valued at the last reported sale price or official closing price as reported by a third party pricing vendor on the primary market or exchange on which they are traded and are categorized as Level 1 in the hierarchy. In the event there were no sales during the day or closing prices are not available, securities are valued at the last quoted bid price or may be valued using the last available price and are generally categorized as Level 2 in the hierarchy. For foreign equity securities, when significant market or security specific events arise, comparisons to the valuation of American Depositary Receipts
Annual Report
Notes to Financial Statements - continued
3. Significant Accounting Policies - continued
Security Valuation - continued
(ADRs), futures contracts, Exchange-Traded Funds (ETFs) and certain indexes as well as quoted prices for similar securities are used and are categorized as Level 2 in the hierarchy. Utilizing these techniques may result in transfers between Level 1 and Level 2.
Investments in open-end mutual funds, including the Fidelity Central Funds, are valued at their closing net asset value (NAV) each business day and are categorized as Level 1 in the hierarchy.
Changes in valuation techniques may result in transfers in or out of an assigned level within the disclosure hierarchy. The aggregate value of investments by input level, as of October 31, 2012, including information on transfers between Levels 1 and 2, is included at the end of the Fund's Schedule of Investments.
Foreign Currency Translation. The Fund may use foreign currency contracts to facilitate transactions in foreign-denominated securities. Gains and losses from these transactions may arise from changes in the value of the foreign currency or if the counterparties do not perform under the contracts' terms.
Foreign-denominated assets, including investment securities, and liabilities are translated into U.S. dollars at the exchange rates at period end. Purchases and sales of investment securities, income and dividends received and expenses denominated in foreign currencies are translated into U.S. dollars at the exchange rate in effect on the transaction date.
The effects of exchange rate fluctuations on investments are included with the net realized and unrealized gain (loss) on investment securities. Other foreign currency transactions resulting in realized and unrealized gain (loss) are disclosed separately.
Investment Transactions and Income. For financial reporting purposes, the Fund's investment holdings and NAV include trades executed through the end of the last business day of the period. The NAV per share for processing shareholder transactions is calculated as of the close of business of the New York Stock Exchange (NYSE), normally 4:00 p.m. Eastern time and includes trades executed through the end of the prior business day. Gains and losses on securities sold are determined on the basis of identified cost. Dividend income is recorded on the ex-dividend date, except for certain dividends from foreign securities where the ex-dividend date may have passed, which are recorded as soon as the Fund is informed of the ex-dividend date. Non-cash dividends included in dividend income, if any, are recorded at the fair market value of the securities received. Distributions received on securities that represent a return of capital or capital gain are recorded as a reduction of cost of investments and/or as a realized gain. The Fund
Annual Report
3. Significant Accounting Policies - continued
Investment Transactions and Income - continued
estimates the components of distributions received that may be considered return of capital distributions or capital gain distributions. Interest income and distributions from the Fidelity Central Funds are accrued as earned. Interest income includes coupon interest and amortization of premium and accretion of discount on debt securities. Investment income is recorded net of foreign taxes withheld where recovery of such taxes is uncertain.
Expenses. Expenses directly attributable to a fund are charged to that fund. Expenses attributable to more than one fund are allocated among the respective funds on the basis of relative net assets or other appropriate methods. Expense estimates are accrued in the period to which they relate and adjustments are made when actual amounts are known.
Income Tax Information and Distributions to Shareholders. Each year, the Fund intends to qualify as a regulated investment company under Subchapter M of the Internal Revenue Code, including distributing substantially all of its taxable income and realized gains. As a result, no provision for income taxes is required. As of October 31, 2012, the Fund did not have any unrecognized tax benefits in the financial statements; nor is the Fund aware of any tax positions for which it is reasonably possible that the total amounts of unrecognized tax benefits will significantly change in the next twelve months. The Fund files a U.S. federal tax return, in addition to state and local tax returns as required. A fund's federal income tax returns are subject to examination by the Internal Revenue Service (IRS) for a period of three fiscal years after they are filed. State and local tax returns may be subject to examination for an additional fiscal year depending on the jurisdiction. Foreign taxes are provided for based on the Fund's understanding of the tax rules and rates that exist in the foreign markets in which it invests.
Distributions are declared and recorded on the ex-dividend date. Income dividends and capital gain distributions are declared separately for each class. Income and capital gain distributions are determined in accordance with income tax regulations, which may differ from GAAP. In addition, the Fund claimed a portion of the payment made to redeeming shareholders as a distribution for income tax purposes.
Capital accounts within the financial statements are adjusted for permanent book-tax differences. These adjustments have no impact on net assets or the results of operations. Temporary book-tax differences will reverse in a subsequent period.
Book-tax differences are primarily due to foreign currency transactions, certain foreign taxes, passive foreign investment companies (PFIC), partnerships, capital loss carryforwards and losses deferred due to wash sales.
Annual Report
Notes to Financial Statements - continued
3. Significant Accounting Policies - continued
Income Tax Information and Distributions to Shareholders - continued
The federal tax cost of investment securities and unrealized appreciation (depreciation) as of period end were as follows:
Gross unrealized appreciation | $ 39,956,815 |
Gross unrealized depreciation | (75,456,352) |
Net unrealized appreciation (depreciation) on securities and other investments | $ (35,499,537) |
| |
Tax Cost | $ 639,864,268 |
The tax-based components of distributable earnings as of period end were as follows:
Undistributed ordinary income | $ 4,752,569 |
Capital loss carryforward | $ (33,159,492) |
Net unrealized appreciation (depreciation) | $ (35,507,387) |
Capital loss carryforwards are only available to offset future capital gains of the Fund to the extent provided by regulations and may be limited. Under the Regulated Investment Company Modernization Act of 2010 (the Act), the Fund is permitted to carry forward capital losses incurred in taxable years beginning after December 22, 2010 for an unlimited period and such capital losses are required to be used prior to any losses that expire. Capital loss carryforwards were as follows:
Fiscal year of expiration | |
2019 | $ (6,952,413) |
No expiration | |
Short-term | (26,207,079) |
Total capital loss carryforward | $ (33,159,492) |
The tax character of distributions paid was as follows:
| October 31, 2012 | October 31, 2011 |
Ordinary Income | $ 4,364,384 | $ 5,112,665 |
Long-term Capital Gains | - | 2,037,448 |
Total | $ 4,364,384 | $ 7,150,113 |
Annual Report
3. Significant Accounting Policies - continued
Short-Term Trading (Redemption) Fees. Shares held by investors in the Fund less than 30 days are subject to a redemption fee equal to 1.00% of the net asset value of shares redeemed. All redemption fees, which reduce the proceeds of the shareholder redemption, are retained by the Fund and accounted for as an addition to paid in capital.
Restricted Securities. The Fund may invest in securities that are subject to legal or contractual restrictions on resale. These securities generally may be resold in transactions exempt from registration or to the public if the securities are registered. Disposal of these securities may involve time-consuming negotiations and expense, and prompt sale at an acceptable price may be difficult. Information regarding restricted securities is included at the end of the Fund's Schedule of Investments.
New Accounting Pronouncement. In December 2011, the Financial Accounting Standards Board issued Accounting Standard Update No. 2011-11, Disclosures about Offsetting Assets and Liabilities. The update creates new disclosure requirements requiring entities to disclose both gross and net information for derivatives and other financial instruments that are either offset in the Statement of Assets and Liabilities or subject to an enforceable master netting arrangement or similar agreement. The disclosure requirements are effective for annual reporting periods beginning on or after January 1, 2013, and interim periods within those annual periods. Management is currently evaluating the impact of the update's adoption on the Fund's financial statement disclosures.
4. Purchases and Sales of Investments.
Purchases and sales of securities, other than short-term securities, aggregated $608,021,633 and $755,930,501, respectively.
5. Fees and Other Transactions with Affiliates.
Management Fee. FMR and its affiliates provide the Fund with investment management related services for which the Fund pays a monthly management fee. The management fee is the sum of an individual fund fee rate that is based on an annual rate of .45% of the Fund's average net assets and an annualized group fee rate that averaged .26% during the period. The group fee rate is based upon the average net assets of all the mutual funds advised by FMR. The group fee rate decreases as assets under management increase and increases as assets under management decrease. For the period, the total annual management fee rate was .71% of the Fund's average net assets.
Annual Report
Notes to Financial Statements - continued
5. Fees and Other Transactions with Affiliates - continued
Distribution and Service Plan Fees. In accordance with Rule 12b-1 of the 1940 Act, the Fund has adopted separate Distribution and Service Plans for each class of shares. Certain classes pay Fidelity Distributors Corporation (FDC), an affiliate of FMR, separate Distribution and Service Fees, each of which is based on an annual percentage of each class' average net assets. In addition, FDC may pay financial intermediaries for selling shares of the Fund and providing shareholder support services. For the period, the Distribution and Service Fee rates, total fees and amounts retained by FDC were as follows:
| Distribution
Fee | Service
Fee | Total Fees | Retained
by FDC |
Class A | -% | .25% | $ 280,172 | $ 5,920 |
Class T | .25% | .25% | 93,536 | 148 |
Class B | .75% | .25% | 36,080 | 27,074 |
Class C | .75% | .25% | 339,566 | 113,885 |
| | | $ 749,354 | $ 147,027 |
Sales Load. FDC may receive a front-end sales charge of up to 5.75% for selling Class A shares and 3.50% for selling Class T shares, some of which is paid to financial intermediaries for selling shares of the Fund. Depending on the holding period, FDC may receive contingent deferred sales charges levied on Class A, Class T, Class B, and Class C redemptions. The deferred sales charges range from 5.00% to 1.00% for Class B shares, 1.00% for Class C shares, 1.00% for certain purchases of Class A shares and .25% for certain purchases of Class T shares.
For the period, sales charge amounts retained by FDC were as follows:
| Retained
by FDC |
Class A | $ 36,090 |
Class T | 5,451 |
Class B* | 24,757 |
Class C* | 11,858 |
| $ 78,156 |
* When Class B and Class C shares are initially sold, FDC pays commissions from its own resources to financial intermediaries through which the sales are made.
Annual Report
5. Fees and Other Transactions with Affiliates - continued
Transfer Agent Fees. Fidelity Investments Institutional Operations Company, Inc. (FIIOC), an affiliate of FMR, is the transfer, dividend disbursing and shareholder servicing agent for each class of the Fund. FIIOC receives account fees and asset-based fees that vary according to the account size and type of account of the shareholders of the respective classes of the Fund. FIIOC pays for typesetting, printing and mailing of shareholder reports, except proxy statements. For the period, transfer agent fees for each class were as follows:
| Amount | % of
Average
Net Assets |
Class A | $ 321,673 | .29 |
Class T | 56,848 | .30 |
Class B | 10,811 | .30 |
Class C | 101,040 | .30 |
Global Commodity Stock | 1,331,070 | .30 |
Institutional Class | 124,928 | .24 |
| $ 1,946,370 | |
Accounting and Security Lending Fees. Fidelity Service Company, Inc. (FSC), an affiliate of FMR, maintains the Fund's accounting records. The accounting fee is based on the level of average net assets for each month. Under a separate contract, FSC administers the security lending program. The security lending fee is based on the number and duration of lending transactions.
Brokerage Commissions. The Fund placed a portion of its portfolio transactions with brokerage firms which are affiliates of the investment adviser. The commissions paid to these affiliated firms were $6,902 for the period.
Interfund Lending Program. Pursuant to an Exemptive Order issued by the SEC, the Fund, along with other registered investment companies having management contracts with FMR, may participate in an interfund lending program. This program provides an alternative credit facility allowing the funds to borrow from, or lend money to, other participating affiliated funds. At period end, there were no interfund loans outstanding. The Fund's activity in this program during the period for which loans were outstanding was as follows:
Borrower or Lender | Average Loan
Balance | Weighted Average Interest Rate | Interest Expense |
Borrower | $ 2,814,765 | .41% | $ 1,098 |
Annual Report
Notes to Financial Statements - continued
6. Committed Line of Credit.
The Fund participates with other funds managed by FMR or an affiliate in a $4.25 billion credit facility (the "line of credit") to be utilized for temporary or emergency purposes to fund shareholder redemptions or for other short-term liquidity purposes. The Fund has agreed to pay commitment fees on its pro-rata portion of the line of credit, which amounted to $1,897 and is reflected in Miscellaneous expenses on the Statement of Operations. During the period, there were no borrowings on this line of credit.
7. Security Lending.
The Fund lends portfolio securities through a lending agent from time to time in order to earn additional income. For equity securities, a lending agent is used and may loan securities to certain qualified borrowers, including Fidelity Capital Markets (FCM), a broker-dealer affiliated with the Fund. On the settlement date of the loan, the Fund receives collateral (in the form of U.S. Treasury obligations, letters of credit and/or cash) against the loaned securities and maintains collateral in an amount not less than 100% of the market value of the loaned securities during the period of the loan. The market value of the loaned securities is determined at the close of business of the Fund and any additional required collateral is delivered to the Fund on the next business day. If the borrower defaults on its obligation to return the securities loaned because of insolvency or other reasons, a fund could experience delays and costs in recovering the securities loaned or in gaining access to the collateral. Any cash collateral received is invested in the Fidelity Securities Lending Cash Central Fund. The value of loaned securities and cash collateral at period end are disclosed on the Fund's Statement of Assets and Liabilities. Security lending income represents the income earned on investing cash collateral, less rebates paid to borrowers and any lending agent fees associated with the loan, plus any premium payments received for lending certain types of securities. Security lending income is presented in the Statement of Operations as a component of income from Fidelity Central Funds. Total security lending income during the period amounted to $447,820. During the period, there were no securities loaned to FCM.
8. Bank Borrowings.
The Fund is permitted to have bank borrowings for temporary or emergency purposes to fund shareholder redemptions or for other short-term liquidity requirements. The Fund has established borrowing arrangements with certain banks. The interest rate on the borrowings is the bank's base rate, as revised from time to time. The average loan balance during the period for which loans were outstanding amounted to $1,543,000. The weighted average interest rate was .66%. The interest expense amounted to $57 under the bank borrowing program. At period end, there were no bank borrowings outstanding.
Annual Report
9. Expense Reductions.
Many of the brokers with whom FMR places trades on behalf of the Fund provided services to the Fund in addition to trade execution. These services included payments of certain expenses on behalf of the Fund totaling $50,515 for the period.
10. Distributions to Shareholders.
Distributions to shareholders of each class were as follows:
Years ended October 31, | 2012 | 2011 |
From net investment income | | |
Class A | $ 437,422 | $ 597,144 |
Class T | 12,232 | 82,038 |
Class C | - | 56,214 |
Global Commodity Stock | 2,878,965 | 3,895,270 |
Institutional Class | 364,302 | 414,647 |
Total | $ 3,692,921 | $ 5,045,313 |
From net realized gain | | |
Class A | $ 117,768 | $ 275,211 |
Class T | 19,027 | 52,381 |
Class B | - | 16,866 |
Class C | - | 68,717 |
Global Commodity Stock | 479,827 | 1,532,256 |
Institutional Class | 54,841 | 159,369 |
Total | $ 671,463 | $ 2,104,800 |
11. Share Transactions.
Transactions for each class of shares were as follows:
| Shares | Dollars |
Years ended October 31, | 2012 | 2011 | 2012 | 2011 |
Class A | | | | |
Shares sold | 1,675,922 | 7,297,574 | $ 24,194,276 | $ 124,882,197 |
Reinvestment of distributions | 32,805 | 39,060 | 472,060 | 643,900 |
Shares redeemed | (3,329,384) | (2,752,883) | (47,357,051) | (44,565,640) |
Net increase (decrease) | (1,620,657) | 4,583,751 | $ (22,690,715) | $ 80,960,457 |
Class T | | | | |
Shares sold | 189,622 | 866,549 | $ 2,764,209 | $ 14,740,169 |
Reinvestment of distributions | 1,948 | 7,294 | 28,015 | 120,226 |
Shares redeemed | (424,718) | (249,100) | (6,023,857) | (4,030,489) |
Net increase (decrease) | (233,148) | 624,743 | $ (3,231,633) | $ 10,829,906 |
Annual Report
Notes to Financial Statements - continued
11. Share Transactions - continued
| Shares | Dollars |
Years ended October 31, | 2012 | 2011 | 2012 | 2011 |
Class B | | | | |
Shares sold | 7,831 | 82,231 | $ 113,787 | $ 1,397,980 |
Reinvestment of distributions | - | 917 | - | 14,988 |
Shares redeemed | (81,206) | (76,244) | (1,157,702) | (1,237,701) |
Net increase (decrease) | (73,375) | 6,904 | $ (1,043,915) | $ 175,267 |
Class C | | | | |
Shares sold | 492,632 | 2,215,036 | $ 7,143,884 | $ 37,885,797 |
Reinvestment of distributions | - | 6,435 | - | 105,874 |
Shares redeemed | (761,541) | (662,765) | (10,673,957) | (10,246,197) |
Net increase (decrease) | (268,909) | 1,558,706 | $ (3,530,073) | $ 27,745,474 |
Global Commodity Stock | | | | |
Shares sold | 7,606,851 | 32,339,719 | $ 109,989,271 | $ 553,926,075 |
Reinvestment of distributions | 210,059 | 293,921 | 3,031,159 | 4,855,462 |
Shares redeemed | (16,330,927) | (17,519,084) | (233,733,610) | (288,860,403) |
Net increase (decrease) | (8,514,017) | 15,114,556 | $ (120,713,180) | $ 269,921,134 |
Institutional Class | | | | |
Shares sold | 1,589,148 | 4,225,113 | $ 22,944,496 | $ 72,109,877 |
Reinvestment of distributions | 18,526 | 16,850 | 267,335 | 278,352 |
Shares redeemed | (2,034,602) | (2,651,317) | (28,631,896) | (43,491,555) |
Net increase (decrease) | (426,928) | 1,590,646 | $ (5,420,065) | $ 28,896,674 |
12. Other.
The Fund's organizational documents provide former and current trustees and officers with a limited indemnification against liabilities arising in connection with the performance of their duties to the Fund. In the normal course of business, the Fund may also enter into contracts that provide general indemnifications. The Fund's maximum exposure under these arrangements is unknown as this would be dependent on future claims that may be made against the Fund. The risk of material loss from such claims is considered remote.
At the end of the period, FMR or its affiliates were the owners of record of 13% of the total outstanding shares of the Fund.
Annual Report
To the Trustees of Fidelity Investment Trust and the Shareholders of Fidelity Global Commodity Stock Fund:
In our opinion, the accompanying statement of assets and liabilities, including the schedule of investments, and the related statements of operations and of changes in net assets and the financial highlights present fairly, in all material respects, the financial position of Fidelity Global Commodity Stock Fund (a fund of Fidelity Investment Trust) at October 31, 2012, the results of its operations for the year then ended, the changes in its net assets for each of the two years in the period then ended and the financial highlights for each of the periods indicated, in conformity with accounting principles generally accepted in the United States of America. These financial statements and financial highlights (hereafter referred to as "financial statements") are the responsibility of the Fidelity Global Commodity Stock Fund's management. Our responsibility is to express an opinion on these financial statements based on our audits. We conducted our audits of these financial statements in accordance with the standards of the Public Company Accounting Oversight Board (United States). Those standards require that we plan and perform the audit to obtain reasonable assurance about whether the financial statements are free of material misstatement. An audit includes examining, on a test basis, evidence supporting the amounts and disclosures in the financial statements, assessing the accounting principles used and significant estimates made by management, and evaluating the overall financial statement presentation. We believe that our audits, which included confirmation of securities at October 31, 2012 by correspondence with the custodian and brokers, provide a reasonable basis for our opinion.
PricewaterhouseCoopers LLP
Boston, Massachusetts
December 14, 2012
Annual Report
The Trustees, Members of the Advisory Board, and executive officers of the trust and fund, as applicable, are listed below. The Board of Trustees governs the fund and is responsible for protecting the interests of shareholders. The Trustees are experienced executives who meet periodically throughout the year to oversee the fund's activities, review contractual arrangements with companies that provide services to the fund, oversee management of the risks associated with such activities and contractual arrangements, and review the fund's performance. Except for James C. Curvey, each of the Trustees oversees 236 funds advised by FMR or an affiliate. Mr. Curvey oversees 443 funds advised by FMR or an affiliate.
The Trustees hold office without limit in time except that (a) any Trustee may resign; (b) any Trustee may be removed by written instrument, signed by at least two-thirds of the number of Trustees prior to such removal; (c) any Trustee who requests to be retired or who has become incapacitated by illness or injury may be retired by written instrument signed by a majority of the other Trustees; and (d) any Trustee may be removed at any special meeting of shareholders by a two-thirds vote of the outstanding voting securities of the trust. Each Trustee who is not an interested person (as defined in the 1940 Act) (Independent Trustee), shall retire not later than the last day of the calendar year in which his or her 75th birthday occurs. The Independent Trustees may waive this mandatory retirement age policy with respect to individual Trustees. The executive officers and Advisory Board Members hold office without limit in time, except that any officer and Advisory Board Member may resign or may be removed by a vote of a majority of the Trustees at any regular meeting or any special meeting of the Trustees. Except as indicated, each individual has held the office shown or other offices in the same company for the past five years.
Experience, Skills, Attributes, and Qualifications of the Fund's Trustees. The Governance and Nominating Committee has adopted a statement of policy that describes the experience, qualifications, attributes, and skills that are necessary and desirable for potential Independent Trustee candidates (Statement of Policy). The Board believes that each Trustee satisfied at the time he or she was initially elected or appointed a Trustee, and continues to satisfy, the standards contemplated by the Statement of Policy. The Governance and Nominating Committee also engages professional search firms to help identify potential Independent Trustee candidates who have the experience, qualifications, attributes, and skills consistent with the Statement of Policy. From time to time, additional criteria based on the composition and skills of the current Independent Trustees, as well as experience or skills that may be appropriate in light of future changes to board composition, business conditions, and regulatory or other developments, have also been considered by the professional search firms and the Governance and Nominating Committee. In addition, the Board takes into account the Trustees' commitment and participation in Board and committee meetings, as well as their leadership of standing and ad hoc committees throughout their tenure.
In determining that a particular Trustee was and continues to be qualified to serve as a Trustee, the Board has considered a variety of criteria, none of which, in isolation, was controlling. The Board believes that, collectively, the Trustees have balanced and diverse experience, qualifications, attributes, and skills, which allow the Board to operate effectively in governing the fund and protecting the interests of shareholders. Information about the specific experience, skills, attributes, and qualifications of each Trustee, which in each case led to the Board's conclusion that the Trustee should serve (or continue to serve) as a trustee of the fund, is provided below.
Annual Report
Trustees and Officers - continued
Board Structure and Oversight Function. James C. Curvey is an interested person (as defined in the 1940 Act) and currently serves as Chairman. The Trustees have determined that an interested Chairman is appropriate and benefits shareholders because an interested Chairman has a personal and professional stake in the quality and continuity of services provided to the fund. Independent Trustees exercise their informed business judgment to appoint an individual of their choosing to serve as Chairman, regardless of whether the Trustee happens to be independent or a member of management. The Independent Trustees have determined that they can act independently and effectively without having an Independent Trustee serve as Chairman and that a key structural component for assuring that they are in a position to do so is for the Independent Trustees to constitute a substantial majority for the Board. The Independent Trustees also regularly meet in executive session. Ned C. Lautenbach serves as Chairman of the Independent Trustees and as such (i) acts as a liaison between the Independent Trustees and management with respect to matters important to the Independent Trustees and (ii) with management prepares agendas for Board meetings.
Fidelity funds are overseen by different Boards of Trustees. The fund's Board oversees Fidelity's equity and high income funds and another Board oversees Fidelity's investment-grade bond, money market, and asset allocation funds. The asset allocation funds may invest in Fidelity funds overseen by the fund's Board. The use of separate Boards, each with its own committee structure, allows the Trustees of each group of Fidelity funds to focus on the unique issues of the funds they oversee, including common research, investment, and operational issues. On occasion, the separate Boards establish joint committees to address issues of overlapping consequences for the Fidelity funds overseen by each Board.
The Trustees operate using a system of committees to facilitate the timely and efficient consideration of all matters of importance to the Trustees, the fund, and fund shareholders and to facilitate compliance with legal and regulatory requirements and oversight of the fund's activities and associated risks. The Board, acting through its committees, has charged FMR and its affiliates with (i) identifying events or circumstances the occurrence of which could have demonstrably adverse effects on the fund's business and/or reputation; (ii) implementing processes and controls to lessen the possibility that such events or circumstances occur or to mitigate the effects of such events or circumstances if they do occur; and (iii) creating and maintaining a system designed to evaluate continuously business and market conditions in order to facilitate the identification and implementation processes described in (i) and (ii) above. Because the day-to-day operations and activities of the fund are carried out by or through FMR, its affiliates and other service providers, the fund's exposure to risks is mitigated but not eliminated by the processes overseen by the Trustees. While each of the Board's committees has responsibility for overseeing different aspects of the fund's activities, oversight is exercised primarily through the Operations, Audit, and Compliance Committees. In addition, the Independent Trustees have worked with FMR to enhance the Board's oversight of investment and financial risks, legal and regulatory risks, technology risks, and operational risks, including the development of additional risk reporting to the Board. For example, a working group comprised of Independent Trustees and FMR has worked and continues to work to review the Fidelity funds' valuation-related activities, reporting and risk management. Appropriate personnel, including but not limited to the fund's Chief Compliance Officer (CCO), FMR's internal auditor, the independent accountants, the fund's Treasurer and portfolio management personnel, make periodic reports to the Board's committees, as appropriate, including an annual review of FMR's risk management program for the Fidelity funds. The responsibilities of each standing committee, including their oversight responsibilities, are described further under "Standing Committees of the Fund's Trustees."
Annual Report
The fund's Statement of Additional Information (SAI) includes more information about the Trustees. To request a free copy, call Fidelity at 1-877-208-0098.
Interested Trustees*:
Correspondence intended for each Trustee who is an interested person may be sent to Fidelity Investments, 82 Devonshire Street, Boston, Massachusetts 02109.
Name, Age; Principal Occupations and Other Relevant Experience+ |
James C. Curvey (77) |
| Year of Election or Appointment: 2007 Mr. Curvey is Trustee and Chairman of the Board of Trustees of certain Trusts. Mr. Curvey also serves as Trustee (2007-present) of other investment companies advised by FMR. Mr. Curvey is a Director of Fidelity Investments Money Management, Inc. (2009-present), Director of Fidelity Research & Analysis Co. (2009-present) and Director of FMR and FMR Co., Inc. (2007-present). Mr. Curvey is also Vice Chairman (2007-present) and Director of FMR LLC. In addition, Mr. Curvey serves as an Overseer for the Boston Symphony Orchestra and a member of the Trustees of Villanova University. Previously, Mr. Curvey was the Vice Chairman (2006-2007) and Director (2000-2007) of FMR Corp. |
Ronald P. O'Hanley (55) |
| Year of Election or Appointment: 2011 Mr. O'Hanley is Director of FMR Co., Inc. (2010-present), Director of Fidelity Investments Money Management, Inc. (2010-present), Director of Fidelity Research & Analysis Company (2010-present), President of Fidelity Asset Management and Corporate Services and a member of Fidelity's Executive Committee (2010-present). Previously, Mr. O'Hanley served as President and Chief Executive Officer of BNY Mellon Asset Management (2007-2010). Mr. O'Hanley also served as Vice Chairman of Bank New York Mellon Corp. and a member of that firm's Executive Committee. Prior to the 2007 merger of The Bank of New York and Mellon Financial Corporation, he was Vice Chairman of Mellon Financial Corporation and President and Chief Executive Officer of Mellon Asset Management. He joined Mellon in February 1997. Mr. O'Hanley currently serves as Chairman of the Boston Public Library Foundation Board of Directors and sits on the Board of Directors of Beth Israel Deaconess Medical Center, the Board of Trustees of the Marine Biological Laboratory and the Advisory Board of the Maxwell School of Citizenship and Public Administration at Syracuse University. Mr. O'Hanley also chairs the Council on Asset Management for the Financial Services Roundtable and is a member of the Board of Directors of Institutional Investor's U.S. Institute. |
* Trustees have been determined to be "Interested Trustees" by virtue of, among other things, their affiliation with the trust or various entities under common control with FMR.
+ The information above includes each Trustee's principal occupation during the last five years and other information relating to the experience, attributes, and skills relevant to each Trustee's qualifications to serve as a Trustee, which led to the conclusion that each Trustee should serve as a Trustee for the fund.
Annual Report
Independent Trustees:
Correspondence intended for each Independent Trustee (that is, the Trustees other than the Interested Trustees) may be sent to Fidelity Investments, P.O. Box 55235, Boston, Massachusetts 02205-5235.
Name, Age; Principal Occupations and Other Relevant Experience+ |
Dennis J. Dirks (64) |
| Year of Election or Appointment: 2005 Prior to his retirement in May 2003, Mr. Dirks was Chief Operating Officer and a member of the Board of The Depository Trust & Clearing Corporation (DTCC). He also served as President, Chief Operating Officer, and Board member of The Depository Trust Company (DTC) and President and Board member of the National Securities Clearing Corporation (NSCC). In addition, Mr. Dirks served as Chief Executive Officer and Board member of the Government Securities Clearing Corporation, Chief Executive Officer and Board member of the Mortgage-Backed Securities Clearing Corporation, as a Trustee and a member of the Finance Committee of Manhattan College (2005-2008), and as a Trustee and a member of the Finance Committee of AHRC of Nassau County (2006-2008). Mr. Dirks is a member of the Independent Directors Council (IDC) Governing Council (2010-present) and Board of Directors for The Brookville Center for Children's Services, Inc. (2009-present). |
Alan J. Lacy (59) |
| Year of Election or Appointment: 2008 Mr. Lacy serves as Senior Adviser (2007-present) of Oak Hill Capital Partners, L.P. (private equity). Mr. Lacy also served as Chief Executive Officer (2000-2005) and Vice Chairman (2005-2006) of Sears Holdings Corporation and Sears, Roebuck and Co. (retail). In addition, Mr. Lacy serves as a member of the Board of Directors of Dave & Buster's Entertainment, Inc. (restaurant and entertainment complexes, 2010-present), Earth Fare, Inc. (retail grocery, 2012-present), The Hillman Companies, Inc. (hardware wholesalers, 2010-present), and Bristol-Myers Squibb Company (global pharmaceuticals, 2008-present). Mr. Lacy is a member of the Board of Trustees of The National Parks Conservation Association (2006-present). Previously, Mr. Lacy served as Chairman of the Board of Trustees of the National Parks Conservation Association (2008-2011) and as a member of the Board of Directors for the Western Union Company (global money transfer, 2006-2011). |
Ned C. Lautenbach (68) |
| Year of Election or Appointment: 2000 Mr. Lautenbach is Chairman of the Independent Trustees of the Equity and High Income Funds (2006-present). Mr. Lautenbach currently serves as the Lead Director of the Eaton Corporation Board of Directors (diversified industrial, 1997-present). Mr. Lautenbach is Chairman of the Board of Directors of the Philharmonic Center for the Arts in Naples, Florida (2012-present) and a member of the Council on Foreign Relations (1994-present). Previously, Mr. Lautenbach was a Partner/Advisory Partner at Clayton, Dubilier & Rice, LLC (private equity investment, 1998-2010), as well as a Director of Sony Corporation (2006-2007). |
Joseph Mauriello (68) |
| Year of Election or Appointment: 2008 Prior to his retirement in January 2006, Mr. Mauriello served in numerous senior management positions including Deputy Chairman and Chief Operating Officer (2004-2005), and Vice Chairman of Financial Services (2002-2004) of KPMG LLP US (professional services, 1965-2005). Mr. Mauriello currently serves as a member of the Board of Directors of XL Group plc. (global insurance and re-insurance, 2006-present). Previously, Mr. Mauriello served as a Director of the Hamilton Funds of the Bank of New York (2006-2007) and of Arcadia Resources Inc. (health care services and products, 2007-2012). |
Robert W. Selander (62) |
| Year of Election or Appointment: 2011 Previously, Mr. Selander served as a Member of the Advisory Board of Fidelity's Equity and High Income Funds (2011), Executive Vice Chairman (2010), Chief Executive Officer (2009-2010), and President and Chief Executive Officer (1997-2009) of Mastercard, Inc. |
Cornelia M. Small (68) |
| Year of Election or Appointment: 2005 Ms. Small is a member of the Board of Directors (2009-present) and Chair of the Investment Committee (2010-present) of the Teagle Foundation. Ms. Small also serves on the Investment Committee of the Berkshire Taconic Community Foundation (2008-present). Previously, Ms. Small served as Chairperson (2002-2008) and a member of the Investment Committee and Chairperson (2008-2012) and a member of the Board of Trustees of Smith College. In addition, Ms. Small served as Chief Investment Officer, Director of Global Equity Investments, and a member of the Board of Directors of Scudder, Stevens & Clark and Scudder Kemper Investments. |
William S. Stavropoulos (73) |
| Year of Election or Appointment: 2001 Mr. Stavropoulos is Vice Chairman of the Independent Trustees of the Equity and High Income Funds (2006-present). Mr. Stavropoulos serves as President and Founder of the Michigan Baseball Foundation, the Great Lakes Loons (2007-present). Mr. Stavropoulos is Chairman Emeritus of the Board of Directors of The Dow Chemical Company, where he previously served in numerous senior management positions, including President, CEO (1995-2000; 2002-2004), Chairman of the Executive Committee (2000-2006), and as a member of the Board of Directors (1990-2006). Currently, Mr. Stavropoulos is a Director of Univar Inc. (global distributor of commodity and specialty chemicals, Chairman from 2010-May 2012 and Lead Director from May 2012-present), Teradata Corporation (data warehousing and technology solutions, 2008-present), Maersk Inc. (industrial conglomerate), and Tyco International, Ltd. (multinational manufacturing and services, 2007-present), and a member of the Advisory Board for Metalmark Capital LLC (private equity investment, 2005-present). Mr. Stavropoulos is an operating advisor to Clayton, Dubilier & Rice, LLC (private equity investment). In addition, Mr. Stavropoulos is a member of the University of Notre Dame Advisory Council for the College of Science, a Trustee of the Rollin L. Gerstacker Foundation, and a Director of the Naples Philharmonic Center for the Arts. Previously, Mr. Stavropoulos served as a Director of Chemical Financial Corporation (bank holding company, 1993-2012). |
David M. Thomas (63) |
| Year of Election or Appointment: 2008 Previously, Mr. Thomas served as Executive Chairman (2005-2006) and Chairman and Chief Executive Officer (2000-2005) of IMS Health, Inc. (pharmaceutical and healthcare information solutions), and a Director of Fortune Brands, Inc. (consumer products, 2000-2011). In addition, Mr. Thomas serves as Non-Executive Chairman of the Board of Directors of Fortune Brands Home and Security (home and security products, 2011-present), and as a member of the Board of Directors of Interpublic Group of Companies, Inc. (marketing communication, 2004-present). |
Michael E. Wiley (62) |
| Year of Election or Appointment: 2008 Mr. Wiley also serves as a Director of Asia Pacific Exploration Consolidated (international oil and gas exploration and production, 2008-present). Mr. Wiley serves as a Director of Tesoro Corporation (independent oil refiner and marketer, 2005-present), and a Director of Bill Barrett Corporation (exploration and production, 2005-present). In addition, Mr. Wiley also serves as a Director of Post Oak Bank (privately-held bank, 2004-present). Previously, Mr. Wiley served as a member of the Board of Trustees of the University of Tulsa (2000-2006; 2007-2010), as a Senior Energy Advisor of Katzenbach Partners, LLC (consulting, 2006-2007), as an Advisory Director of Riverstone Holdings (private investment), Chairman, President, and CEO of Baker Hughes, Inc. (oilfield services, 2000-2004), and as Director of Spinnaker Exploration Company (exploration and production, 2001-2005). |
+ The information above includes each Trustee's principal occupation during the last five years and other information relating to the experience, attributes, and skills relevant to each Trustee's qualifications to serve as a Trustee, which led to the conclusion that each Trustee should serve as a Trustee for the fund.
Advisory Board Members and Executive Officers:
Correspondence intended for David A. Rosow and Garnett A. Smith may be sent to Fidelity Investments, P.O. Box 55235, Boston, Massachusetts 02205-5235. Correspondence intended for each executive officer, Edward C. Johnson 3d, and Peter S. Lynch may be sent to Fidelity Investments, 82 Devonshire Street, Boston, Massachusetts 02109.
Name, Age; Principal Occupation |
Edward C. Johnson 3d (82) |
| Year of Election or Appointment: 2011 Member of the Advisory Board of Fidelity's Equity and High Income Funds. Mr. Johnson serves as Chief Executive Officer, Chairman, and a Director of FMR LLC, and also serves as Chairman and Director of FIL Limited. Previously, Mr. Johnson served as a Trustee and Chairman of the Board of certain Fidelity Trusts, Chairman and a Director of FMR, Chairman and a Director of FMR Co., Inc., and President of FMR LLC (2006-2007). |
Peter S. Lynch (68) |
| Year of Election or Appointment: 2003 Member of the Advisory Board of Fidelity's Equity and High Income Funds. Mr. Lynch is Vice Chairman and a Director of FMR and FMR Co., Inc. In addition, Mr. Lynch serves as a Trustee of Boston College and as the Chairman of the Inner-City Scholarship Fund. Previously, Mr. Lynch served on the Special Olympics International Board of Directors (1997-2006). |
David A. Rosow (70) |
| Year of Election or Appointment: 2012 Member of the Advisory Board of Fidelity's Equity and High Income Funds. Chairman and Chief Executive Officer of International Golf Group, Inc. (golf course development, 1989-present). Previously, Mr. Rosow served as Chairman and Chief Executive Officer of Rosow & Company, Inc. (private investment company, 1989-2011), a Lead Director of Hudson United Bancorp (2001-2006) and as a Director of TD Banknorth (1996-2006). In addition, Mr. Rosow is a member (2008-present) and President (2009-present) of the Town Council of Palm Beach, Florida. |
Garnett A. Smith (65) |
| Year of Election or Appointment: 2012 Member of the Advisory Board of Fidelity's Equity and High Income Funds. Prior to Mr. Smith's retirement, he served as Chairman and Chief Executive Officer of Inbrand Corp. (manufacturer of personal absorbent products, 1990-1997). He also served as President (1986-1990) of Inbrand Corp. Prior to his employment with Inbrand Corp., he was employed by a retail fabric chain and North Carolina National Bank. In addition, Mr. Smith is a board member of the Jackson Hole Land Trust (2009-present). |
Kenneth B. Robins (43) |
| Year of Election or Appointment: 2008 President and Treasurer of Fidelity's Equity and High Income Funds. Mr. Robins also serves as President and Treasurer (2010-present) and Assistant Treasurer (2009-present) of other Fidelity funds and is an employee of Fidelity Investments (2004-present). Previously, Mr. Robins served as Deputy Treasurer of the Fidelity funds (2005-2008) and Treasurer and Chief Financial Officer of The North Carolina Capital Management Trust: Cash and Term Portfolios (2006-2008). |
Bruce T. Herring (47) |
| Year of Election or Appointment: 2006 Vice President of certain Equity Funds. Mr. Herring also serves as President of Fidelity Research & Analysis Company (2010-present), Chief Investment Officer and Director of Fidelity Management & Research (U.K.) Inc. (2010-present) and Group Chief Investment Officer of FMR. Previously, Mr. Herring served as Vice President (2005-2006) and Senior Vice President (2006-2007) of Fidelity Management & Research Company, Vice President of FMR Co., Inc. (2001-2007) and as a portfolio manager for Fidelity U.S. Equity Funds. |
Brian B. Hogan (48) |
| Year of Election or Appointment: 2009 Vice President of Equity and High Income Funds. Mr. Hogan also serves as President of FMR's Equity Division (2009-present). Previously, Mr. Hogan served as Senior Vice President, Equity Research of FMR (2006-2009) and as a portfolio manager. |
Scott C. Goebel (44) |
| Year of Election or Appointment: 2008 Secretary and Chief Legal Officer (CLO) of the Fidelity funds. Mr. Goebel also serves as Secretary of Fidelity Investments Money Management, Inc. (FIMM) (2010-present) and Fidelity Research and Analysis Company (FRAC) (2010-present); Secretary and CLO of The North Carolina Capital Management Trust: Cash and Term Portfolios (2008-present); General Counsel, Secretary, and Senior Vice President of FMR (2008-present) and FMR Co., Inc. (2008-present); employed by FMR LLC or an affiliate (2001-present); Chief Legal Officer of Fidelity Management & Research (Hong Kong) Limited (2008-present) and Assistant Secretary of Fidelity Management & Research (Japan) Inc. (2008-present), and Fidelity Management & Research (U.K.) Inc. (2008-present). Previously, Mr. Goebel served as Assistant Secretary of FIMM (2008-2010), FRAC (2008-2010), and the Funds (2007-2008) and as Vice President and Secretary of Fidelity Distributors Corporation (FDC) (2005-2007). |
William C. Coffey (43) |
| Year of Election or Appointment: 2009 Assistant Secretary of Fidelity's Equity and High Income Funds. Mr. Coffey also serves as Senior Vice President and Deputy General Counsel of FMR LLC (2010-present), and is an employee of Fidelity Investments. Previously, Mr. Coffey served as Vice President and Associate General Counsel of FMR LLC (2005-2009). |
Elizabeth Paige Baumann (44) |
| Year of Election or Appointment: 2012 Anti-Money Laundering (AML) Officer of the Fidelity funds. Ms. Baumann also serves as AML Officer of The North Carolina Capital Management Trust: Cash and Term Portfolios (2012-present), Chief AML Officer of FMR LLC (2012-present), and is an employee of Fidelity Investments. Previously, Ms. Baumann served as Vice President and Deputy Anti-Money Laundering Officer (2007-2012). |
Christine Reynolds (54) |
| Year of Election or Appointment: 2008 Chief Financial Officer of the Fidelity funds. Ms. Reynolds became President of Fidelity Pricing and Cash Management Services (FPCMS) in August 2008. Ms. Reynolds served as Chief Operating Officer of FPCMS (2007-2008). Previously, Ms. Reynolds served as President, Treasurer, and Anti-Money Laundering officer of the Fidelity funds (2004-2007). |
Joseph A. Hanlon (44) |
| Year of Election or Appointment: 2012 Chief Compliance Officer of Fidelity's Equity and High Income Funds. Mr. Hanlon serves as Compliance Officer of FMR, FMR Co., Inc., Fidelity Investments Money Management, Inc. (FIMM), Fidelity Research and Analysis Company (FRAC), Fidelity Management & Research (Japan) Inc., Fidelity Management & Research (U.K.) Inc., Fidelity Management & Research (Hong Kong), and Strategic Advisers, Inc. (2009-present), as Senior Vice President of the Fidelity Asset Management Division (2009-present), and is an employee of Fidelity Investments. |
Joseph F. Zambello (55) |
| Year of Election or Appointment: 2011 Deputy Treasurer of the Fidelity funds. Mr. Zambello is an employee of Fidelity Investments. Previously, Mr. Zambello served as Vice President of FMR's Program Management Group (2009-2011) and Vice President of the Transfer Agent Oversight Group (2005-2009). |
Adrien E. Deberghes (45) |
| Year of Election or Appointment: 2008 Deputy Treasurer of Fidelity's Equity and High Income Funds. Mr. Deberghes also serves as Vice President (2011-present) and Assistant Treasurer (2010-present) of other Fidelity funds, and is an employee of Fidelity Investments (2008-present). Previously, Mr. Deberghes served as Senior Vice President of Mutual Fund Administration at State Street Corporation (2007-2008), Senior Director of Mutual Fund Administration at Investors Bank & Trust (2005-2007), and Director of Finance for Dunkin' Brands (2000-2005). |
Stephen Sadoski (41) |
| Year of Election or Appointment: 2012 Deputy Treasurer of Fidelity's Equity and High Income Funds. Mr. Sadoski also serves as Assistant Treasurer of other Fidelity funds (2012-present) and is an employee of Fidelity Investments (2012-present). Previously, Mr. Sadoski served as an assistant chief accountant in the Division of Investment Management of the Securities and Exchange Commission (SEC) (2009-2012) and as a senior manager at Deloitte & Touche (1997-2009). |
Stephanie J. Dorsey (43) |
| Year of Election or Appointment: 2010 Assistant Treasurer of Fidelity's Equity and High Income Funds. Ms. Dorsey also serves as Deputy Treasurer of other Fidelity funds (2008-present) and is an employee of Fidelity Investments (2008-present). Previously, Ms. Dorsey served as Treasurer (2004-2008) of the JPMorgan Mutual Funds and Vice President (2004-2008) of JPMorgan Chase Bank. |
John R. Hebble (54) |
| Year of Election or Appointment: 2009 Assistant Treasurer of Fidelity's Equity and High Income Funds. Mr. Hebble also serves as President (2011-present), Treasurer, and Chief Financial Officer of The North Carolina Capital Management Trust: Cash and Term Portfolios (2008-present), President and Treasurer of other Fidelity funds (2008-present) and is an employee of Fidelity Investments. |
Gary W. Ryan (54) |
| Year of Election or Appointment: 2005 Assistant Treasurer of the Fidelity funds. Mr. Ryan is an employee of Fidelity Investments. Previously, Mr. Ryan served as Vice President of Fund Reporting in Fidelity Pricing and Cash Management Services (FPCMS) (1999-2005). |
Jonathan Davis (44) |
| Year of Election or Appointment: 2010 Assistant Treasurer of the Fidelity funds. Mr. Davis is also Assistant Treasurer of Fidelity Rutland Square Trust II and Fidelity Commonwealth Trust II. Mr. Davis is an employee of Fidelity Investments. Previously, Mr. Davis served as Vice President and Associate General Counsel of FMR LLC (2003-2010). |
Annual Report
Class A designates 100%, Class T designates 100%, Class B designates 0%, and Class C designates 0% of the dividend distributed during the fiscal year as qualifying for the dividends-received deduction for corporate shareholders.
Class A designates 100%, Class T designates 100%, Class B designates 0%, and Class C designates 0% of the dividend distributed during the fiscal year as amounts which may be taken into account as a dividend for purposes of the maximum rate under section 1(h)(11) of the Internal Revenue Code.
The amounts per share which represent income derived from sources within, and taxes paid to, foreign countries or possessions of the United States are as follows:
| Pay Date | Income | Taxes |
Class A | 12/12/2011 | $0.077 | $0.0107 |
Class T | 12/12/2011 | $0.034 | $0.0107 |
Class B | 12/12/2011 | $0.000 | $0.000 |
Class C | 12/12/2011 | $0.000 | $0.000 |
The fund will notify shareholders in January 2013 of amounts for use in preparing 2012 income tax returns.
Annual Report
Board Approval of Investment Advisory Contracts and Management Fees
Fidelity Global Commodity Stock Fund
Each year, the Board of Trustees, including the Independent Trustees (together, the Board), votes on the renewal of the management contract and sub-advisory agreements (together, the Advisory Contracts) for the fund. The Board, assisted by the advice of fund counsel and Independent Trustees' counsel, requests and considers a broad range of information relevant to the renewal of the Advisory Contracts throughout the year.
The Board meets regularly and, at each of its meetings, considers factors that are relevant to its annual consideration of the renewal of the fund's Advisory Contracts, including the services and support provided to the fund and its shareholders. The Board has established various standing committees, each composed of and chaired by Independent Trustees with varying backgrounds, to which the Board has assigned specific subject matter responsibilities in order to enhance effective decision-making by the Board. The Board, acting directly and through its Committees, requests and receives information concerning the annual consideration of the renewal of the fund's Advisory Contracts. The Board also meets as needed to consider matters specifically related to the Board's annual consideration of the renewal of Advisory Contracts. Members of the Board may also meet with trustees of other Fidelity funds through ad hoc joint committees to discuss certain matters relevant to the Fidelity funds.
At its July 2012 meeting, the Board of Trustees, including the Independent Trustees, unanimously determined to renew the fund's Advisory Contracts. In reaching its determination, the Board considered all factors it believed relevant, including (i) the nature, extent, and quality of the services to be provided to the fund and its shareholders (including the investment performance of the fund); (ii) the competitiveness of the fund's management fee and total expense ratio relative to peer funds; (iii) the total costs of the services to be provided by and the profits to be realized by Fidelity from its relationship with the fund; (iv) the extent to which economies of scale exist and would be realized as the fund grows; and (v) whether fee levels reflect these economies of scale, if any, for the benefit of fund shareholders.
In considering whether to renew the Advisory Contracts for the fund, the Board reached a determination, with the assistance of fund counsel and Independent Trustees' counsel and through the exercise of its business judgment, that the renewal of the Advisory Contracts is in the best interests of the fund and its shareholders and that the compensation payable under the Advisory Contracts is fair and reasonable. The Board's decision to renew the Advisory Contracts was not based on any single factor, but rather was based on a comprehensive consideration of all the information provided to the Board at its meetings throughout the year. The Board, in reaching its determination to renew the Advisory Contracts, is aware that shareholders in the fund have a broad range of investment choices available to them, including a wide choice among mutual funds offered by Fidelity's competitors, and that the fund's shareholders, who have the opportunity to review and weigh the disclosure provided by the fund in its prospectus and other public disclosures, have chosen to invest in this fund, managed by Fidelity.
Annual Report
Nature, Extent, and Quality of Services Provided. The Board considered the staffing within the investment adviser, FMR, and the sub-advisers (together, the Investment Advisers), including the backgrounds of the fund's investment personnel, and also considered the fund's investment objective, strategies, and related investment philosophy. The Independent Trustees also had discussions with senior management of Fidelity's investment operations and investment groups. The Board considered the structure of the portfolio manager compensation program and whether this structure provides appropriate incentives to act in the best interests of the fund.
Resources Dedicated to Investment Management and Support Services. The Board and the Fund Oversight and Research Committees reviewed the general qualifications and capabilities of the Investment Advisers' investment staff, including its size, education, experience, and resources, as well as the Investment Advisers' approach to recruiting, training, managing, and compensating investment personnel. The Board also noted that FMR has continued to increase the resources devoted to non-U.S. offices, including expansion of Fidelity's global investment organization. The Board noted that Fidelity's analysts have extensive resources, tools and capabilities that allow them to conduct sophisticated quantitative and fundamental analysis, as well as credit analysis of issuers, counterparties and guarantors. The Board also believes that Fidelity's investment professionals have sufficient access to global information and data so as to provide competitive investment results over time, and that those professionals also have access to sophisticated tools that permit them to assess portfolio construction and risk and performance attribution characteristics continuously, as well as to transmit new information and research conclusions rapidly around the world. Additionally, in its deliberations, the Board considered the Investment Advisers' trading and risk management capabilities and resources, which are an integral part of the investment management process.
Shareholder and Administrative Services. The Board considered (i) the nature, extent, quality, and cost of advisory, administrative, and shareholder services performed by the Investment Advisers and their affiliates under the Advisory Contracts and under separate agreements covering transfer agency, pricing and bookkeeping, and securities lending services for the fund; (ii) the nature and extent of the supervision of third party service providers, principally custodians and subcustodians; and (iii) the resources devoted to, and the record of compliance with, the fund's compliance policies and procedures. The Board also reviewed the allocation of fund brokerage, including allocations to brokers affiliated with the Investment Advisers, the use of brokerage commissions to pay fund expenses, and the use of "soft" commission dollars to pay for research services.
Annual Report
Board Approval of Investment Advisory Contracts and
Management Fees - continued
The Board noted that the growth of fund assets over time across the complex allows Fidelity to reinvest in the development of services designed to enhance the value or convenience of the Fidelity funds as investment vehicles. These services include 24-hour access to account information and market information through telephone representatives and over the Internet, investor education materials and asset allocation tools, and the expanded availability of Fidelity Investor Centers.
Investment in a Large Fund Family. The Board considered the benefits to shareholders of investing in a Fidelity fund, including the benefits of investing in a fund that is part of a large family of funds offering a variety of investment disciplines and providing a large variety of mutual fund investor services. The Board noted that Fidelity had taken, or had made recommendations that resulted in the Fidelity funds taking, a number of actions over the previous year that benefited particular funds, including (i) continuing to dedicate additional resources to investment research and support of the senior management team that oversees asset management; (ii) persisting in efforts to enhance Fidelity's research capabilities, in particular, international research; (iii) launching new funds and making other enhancements to meet client needs for global and income-oriented solutions; (iv) continuing to launch dedicated lower cost underlying funds to meet investment management's portfolio construction needs related to expanding underlying fund options, specifically for the Freedom Fund product lines; (v) adopting a "Stock Selector" sector neutral investment approach and employing a team of portfolio managers who are sector specialists to manage certain funds; (vi) rationalizing product lines and gaining increased efficiencies through the mergers of several funds into other funds; (vii) strengthening the Spartan Index Fund product line by adding new funds and/or new low-cost institutional share classes, restructuring fund expenses to accommodate new classes, and reducing investment minimums for certain classes of shares; (viii) modifying the eligibility criteria for Institutional Class shares to increase their appeal to government entities and charitable investors; and (ix) reducing certain transfer agent fee rates.
Investment Performance. The Board considered whether the fund has operated in accordance with its investment objective, as well as its record of compliance with its investment restrictions. It also reviewed the fund's absolute investment performance for each class, as well as the fund's relative investment performance for each class measured against a third-party-sponsored index that reflects the market sector in which the fund invests. The Board noted that FMR believes that no meaningful peer group exists for the fund principally because most other funds in the fund's third-party peer group focus on different industries or sectors than the fund. Because the fund had been in existence less than three calendar years, the following chart considered by the Board shows, for the one-year period ended December 31, 2011, the total returns of Institutional Class (Class I) and Class B of the fund and the total return of a third-party-sponsored index ("benchmark").
Annual Report
Fidelity Global Commodity Stock Fund

The Board noted that the investment performance of the fund was lower than its benchmark for the period shown. The Board considered that the variations in performance among the fund's classes reflect the variations in class expenses, which result in lower performance for higher expense classes. The Board also reviewed the fund's performance since inception as well as performance in the current year. The Board noted that it is difficult to evaluate in any comprehensive fashion the performance of the fund, in light of its relatively recent commencement of operations.
Based on its review, the Board concluded that the nature, extent, and quality of services provided to the fund under the Advisory Contracts should benefit the fund's shareholders.
Competitiveness of Management Fee and Total Expense Ratio. The Board considered the fund's management fee and total expense ratio compared to "mapped groups" of competitive funds and classes. Fidelity creates "mapped groups" by combining similar Lipper investment objective categories that have comparable management fee characteristics. Combining Lipper investment objective categories aids the Board's management fee and total expense ratio comparisons by broadening the competitive group used for comparison and by reducing the number of universes to which various Fidelity funds are compared.
Management Fee. The Board considered two proprietary management fee comparisons for the 12-month (or shorter) periods shown in the chart below. The group of Lipper funds used by the Board for management fee comparisons is referred to below as the "Total Mapped Group." The Total Mapped Group comparison focuses on a fund's standing relative to the total universe of comparable funds available to investors in terms of gross management fees before expense reimbursements or caps. "TMG %" represents the percentage of funds in the Total Mapped Group that had management fees that were lower than the fund's. For example, a TMG % of 31% means that 69% of the funds in the Total Mapped Group had higher management fees than the fund. The "Asset-Size Peer Group" (ASPG) comparison focuses on a fund's standing relative to non-Fidelity funds similar in size to the fund within the Total Mapped Group. The ASPG represents at least 15% of the funds in the Total Mapped Group with comparable asset size and management fee characteristics, subject to a minimum of 50 funds (or all funds in the Total Mapped Group if fewer than 50). Additional information, such as the ASPG quartile in which the fund's management fee ranked, is also included in the chart and considered by the Board.
Annual Report
Board Approval of Investment Advisory Contracts and
Management Fees - continued
Fidelity Global Commodity Stock Fund

The Board noted that the fund's management fee ranked below the median of its Total Mapped Group and below the median of its ASPG for 2011.
Based on its review, the Board concluded that the fund's management fee is fair and reasonable in light of the services that the fund receives and the other factors considered.
Total Expense Ratio. In its review of each class's total expense ratio, the Board considered the fund's management fee as well as other fund or class expenses, as applicable, such as transfer agent fees, pricing and bookkeeping fees, fund-paid 12b-1 fees, and custodial, legal, and audit fees. The Board also noted the effects of any waivers and reimbursements on fees and expenses. As part of its review, the Board also considered the current and historical total expense ratios of each class of the fund compared to competitive fund median expenses. Each class of the fund is compared to those funds and classes in the Total Mapped Group (used by the Board for management fee comparisons) that have a similar sales load structure.
Annual Report
The Board noted that the total expense ratio of each of Class A, Class B, Class C, Institutional Class, and the retail class ranked below its competitive median for 2011 and the total expense ratio of Class T ranked above its competitive median for 2011. The Board considered that various factors, including 12b-1 fees, positive or negative performance adjustments, and relatively higher other expenses in the case of small fund size, can affect total expense ratios. The Board noted that the total expense ratio of Class T was above the competitive median primarily because of higher 12b-1 fees on Class T. Class T has a higher 12b-1 fee, but a lower front-end sales charge, than traditionally priced front-end sales charge classes. The Board considered that Class T is primarily sold load-waived in the retirement plan market where its 0.50% 12b-1 fee is comparable to competing no-load, higher 12b-1 fee classes designed specifically for retirement plans. The Board noted that the fund offers multiple classes, each of which has a different sales load and 12b-1 fee structure, and that the multiple structures are intended to offer a range of pricing options for the intermediary market. The Board also noted that the total expense ratios of the classes vary primarily by the level of their 12b-1 fees, although differences in transfer agent fees may also cause expenses to vary from class to class.
Fees Charged to Other Fidelity Clients. The Board also considered Fidelity fee structures and other information with respect to clients of FMR and its affiliates, such as other mutual funds advised or subadvised by FMR or its affiliates, pension plan clients, and other institutional clients. The Board noted the findings of the 2010 ad hoc joint committee (created with the board of other Fidelity funds), which reviewed and compared Fidelity's institutional investment advisory business with its business of providing services to the Fidelity funds, including the differences in services provided, fees charged, and costs incurred, as well as competition in their respective marketplaces.
Based on its review of total expense ratios and fees charged to other Fidelity clients, the Board concluded that the total expense ratio of each class of the fund was reasonable, although Class T was above the median of the universe presented for comparison, in light of the services that the fund and its shareholders receive and the other factors considered.
Costs of the Services and Profitability. The Board considered the revenues earned and the expenses incurred by Fidelity in conducting the business of developing, marketing, distributing, managing, administering and servicing the fund and its shareholders. The Board also considered the level of Fidelity's profits in respect of all the Fidelity funds.
On an annual basis, FMR presents to the Board Fidelity's profitability for the fund. Fidelity calculates the profitability for each fund, as well as aggregate profitability for groups of Fidelity funds and all Fidelity funds, using a series of detailed revenue and cost allocation methodologies which originate with the books and records of Fidelity on which Fidelity's audited financial statements are based. The Audit Committee of the Board reviews any significant changes from the prior year's methodologies.
Annual Report
Board Approval of Investment Advisory Contracts and
Management Fees - continued
PricewaterhouseCoopers LLP (PwC), independent registered public accounting firm and auditor to Fidelity and certain Fidelity funds, has been engaged annually by the Board as part of the Board's assessment of Fidelity's profitability analysis. PwC's engagement includes the review and assessment of Fidelity's methodologies used in determining the revenues and expenses attributable to Fidelity's mutual fund business, and completion of agreed-upon procedures surrounding the mathematical accuracy of fund profitability and its conformity to allocation methodologies. After considering PwC's reports issued under the engagement and information provided by Fidelity, the Board concluded that while other allocation methods may also be reasonable, Fidelity's profitability methodologies are reasonable in all material respects.
The Board also reviewed Fidelity's non-fund businesses and fall-out benefits related to the mutual fund business as well as cases where Fidelity's affiliates may benefit from or be related to the fund's business.
The Board considered the costs of the services provided by and the profits realized by Fidelity in connection with the operation of the fund and was satisfied that the profitability was not excessive in the circumstances.
Economies of Scale. The Board considered whether there have been economies of scale in respect of the management of the Fidelity funds, whether the Fidelity funds (including the fund) have appropriately benefited from any such economies of scale, and whether there is potential for realization of any further economies of scale. The Board considered the extent to which the fund will benefit from economies of scale through increased services to the fund, through waivers or reimbursements, or through fee or expense reductions. The Board also noted that in 2009, it and the board of other Fidelity funds created an ad hoc committee (the Economies of Scale Committee) to analyze whether FMR attains economies of scale in respect of the management and servicing of the Fidelity funds, whether the Fidelity funds have appropriately benefited from such economies of scale, and whether there is potential for realization of any further economies of scale.
The Board recognized that the fund's management contract incorporates a "group fee" structure, which provides for lower group fee rates as total fund assets under FMR's management increase, and for higher group fee rates as total fund assets under FMR's management decrease. FMR calculates the group fee rates based on a tiered asset "breakpoint" schedule that varies based on asset class. The Board considered that the group fee is designed to deliver the benefits of economies of scale to fund shareholders when total Fidelity fund assets increase, even if assets of any particular fund are unchanged or have declined, because some portion of Fidelity's costs are attributable to services provided to all Fidelity funds, and all funds benefit if those costs can be allocated among more assets. The Board concluded that, given the group fee structure, fund shareholders will benefit from lower management fees as assets under FMR's management increase at the fund complex level, regardless of whether Fidelity achieves any such economies of scale.
Annual Report
The Board concluded, taking into account the analysis of the Economies of Scale Committee, that economies of scale, if any, are being appropriately shared between fund shareholders and Fidelity.
Additional Information Requested by the Board. In order to develop fully the factual basis for consideration of the Fidelity funds' Advisory Contracts, the Board requested and received additional information on certain topics, including (i) fund performance trends, actions to be taken by FMR to improve certain funds' overall performance, and Fidelity's long-term strategies for certain funds; (ii) the potential to further rationalize the Fidelity fund lineup with the possibility of achieving savings for the funds and Fidelity; (iii) Fidelity's compensation structure for portfolio managers and other key investment personnel; (iv) the amount of the investment that each portfolio manager has made in the Fidelity fund(s) that he or she manages; (v) the realization of fall-out benefits in certain Fidelity business units; (vi) Fidelity's group fee structures, the potential impact of regulatory changes on such structures, and the rationale for the individual fee rates of certain funds; (vii) fund profitability methodology, including Fidelity's cost allocation methodology, and the impact of certain factors on fund profitability results; (viii) trends regarding industry use of performance fee structures and the possibility of implementing performance fee structures for additional funds; and (ix) the impact of net redemptions from the Fidelity funds.
Based on its evaluation of all of the conclusions noted above, and after considering all factors it believed relevant, the Board ultimately concluded that the advisory fee structures are fair and reasonable, and that the fund's Advisory Contracts should be renewed.
Annual Report
Investment Adviser
Fidelity Management & Research Company
Boston, MA
Investment Sub-Advisers
FMR Co., Inc.
Fidelity Management & Research
(U.K.) Inc.
FIL Investment Advisors
FIL Investments (Japan) Limited
FIL Investment Advisors (U.K.) Limited
Fidelity Management & Research
(Hong Kong) Limited
Fidelity Management & Research
(Japan) Inc.
General Distributor
Fidelity Distributors Corporation
Smithfield, RI
Transfer and Service Agents
Fidelity Investments Institutional
Operations Company, Inc.
Boston, MA
Fidelity Service Company, Inc.
Boston, MA
Custodian
State Street Bank and Trust Company
Quincy, MA
(Fidelity Investment logo)(registered trademark)
AGCS-UANN-1212
1.879395.103
(Fidelity Investment logo)(registered trademark)
Fidelity Advisor®
Global Commodity Stock
Fund - Institutional Class
Annual Report
October 31, 2012
(Fidelity Cover Art)
Institutional Class is a
class of Fidelity® Global
Commodity Stock Fund
Contents
Performance | (Click Here) | How the fund has done over time. |
Management's Discussion of Fund Performance | (Click Here) | The Portfolio Manager's review of fund performance and strategy. |
Shareholder Expense Example | (Click Here) | An example of shareholder expenses. |
Investment Changes | (Click Here) | A summary of major shifts in the fund's investments over the past six months. |
Investments | (Click Here) | A complete list of the fund's investments with their market values. |
Financial Statements | (Click Here) | Statements of assets and liabilities, operations, and changes in net assets, as well as financial highlights. |
Notes | (Click Here) | Notes to the financial statements. |
Report of Independent Registered Public Accounting Firm | (Click Here) | |
Trustees and Officers | (Click Here) | |
Distributions | (Click Here) | |
Board Approval of Investment Advisory Contracts and Management Fees | (Click Here) | |
To view a fund's proxy voting guidelines and proxy voting record for the 12-month period ended June 30, visit http://www.fidelity.com/proxyvotingresults or visit the Securities and Exchange Commission's (SEC) web site at http://www.sec.gov. You may also call 1-877-208-0098 to request a free copy of the proxy voting guidelines.
Standard & Poor's, S&P and S&P 500 are registered service marks of The McGraw-Hill Companies, Inc. and have been licensed for use by Fidelity Distributors Corporation.
Other third party marks appearing herein are the property of their respective owners.
All other marks appearing herein are registered or unregistered trademarks or service marks of FMR LLC or an affiliated company. © 2012 FMR LLC. All rights reserved.
Annual Report
This report and the financial statements contained herein are submitted for the general information of the shareholders of the fund. This report is not authorized for distribution to prospective investors in the fund unless preceded or accompanied by an effective prospectus.
A fund files its complete schedule of portfolio holdings with the SEC for the first and third quarters of each fiscal year on Form N-Q. Forms N-Q are available on the SEC's web site at http://www.sec.gov. A fund's Forms N-Q may be reviewed and copied at the SEC's Public Reference Room in Washington, DC. Information regarding the operation of the SEC's Public Reference Room may be obtained by calling 1-800-SEC-0330. For a complete list of a fund's portfolio holdings, view the most recent holdings listing, semiannual report, or annual report on Fidelity's web site at http://www.fidelity.com, http://www.advisor.fidelity.com, or http://www.401k.com, as applicable.
NOT FDIC INSURED • MAY LOSE VALUE • NO BANK GUARANTEE
Neither the fund nor Fidelity Distributors Corporation is a bank.
Annual Report
Average annual total return reflects the change in the value of an investment, assuming reinvestment of the class' distributions from dividend income and capital gains (the profits earned upon the sale of securities that have grown in value, if any) and assuming a constant rate of performance each year. The $10,000 table and the fund's returns do not reflect the deduction of taxes that a shareholder would pay on fund distributions or the redemption of fund shares. During periods of reimbursement by Fidelity, a fund's total return will be greater than it would be had the reimbursement not occurred. How a fund did yesterday is no guarantee of how it will do tomorrow.
Average Annual Total Returns
Periods ended October 31, 2012 | Past 1
year | Life of
fund A |
Institutional Class | -2.90% | 12.05% |
A From March 25, 2009.
$10,000 Over Life of Fund
Let's say hypothetically that $10,000 was invested in Fidelity Advisor® Global Commodity Stock Fund - Institutional Class on March 25, 2009, when the fund started. The chart shows how the value of your investment would have changed, and also shows how the MSCI® ACWI® (All Country World Index) Index performed over the same period.
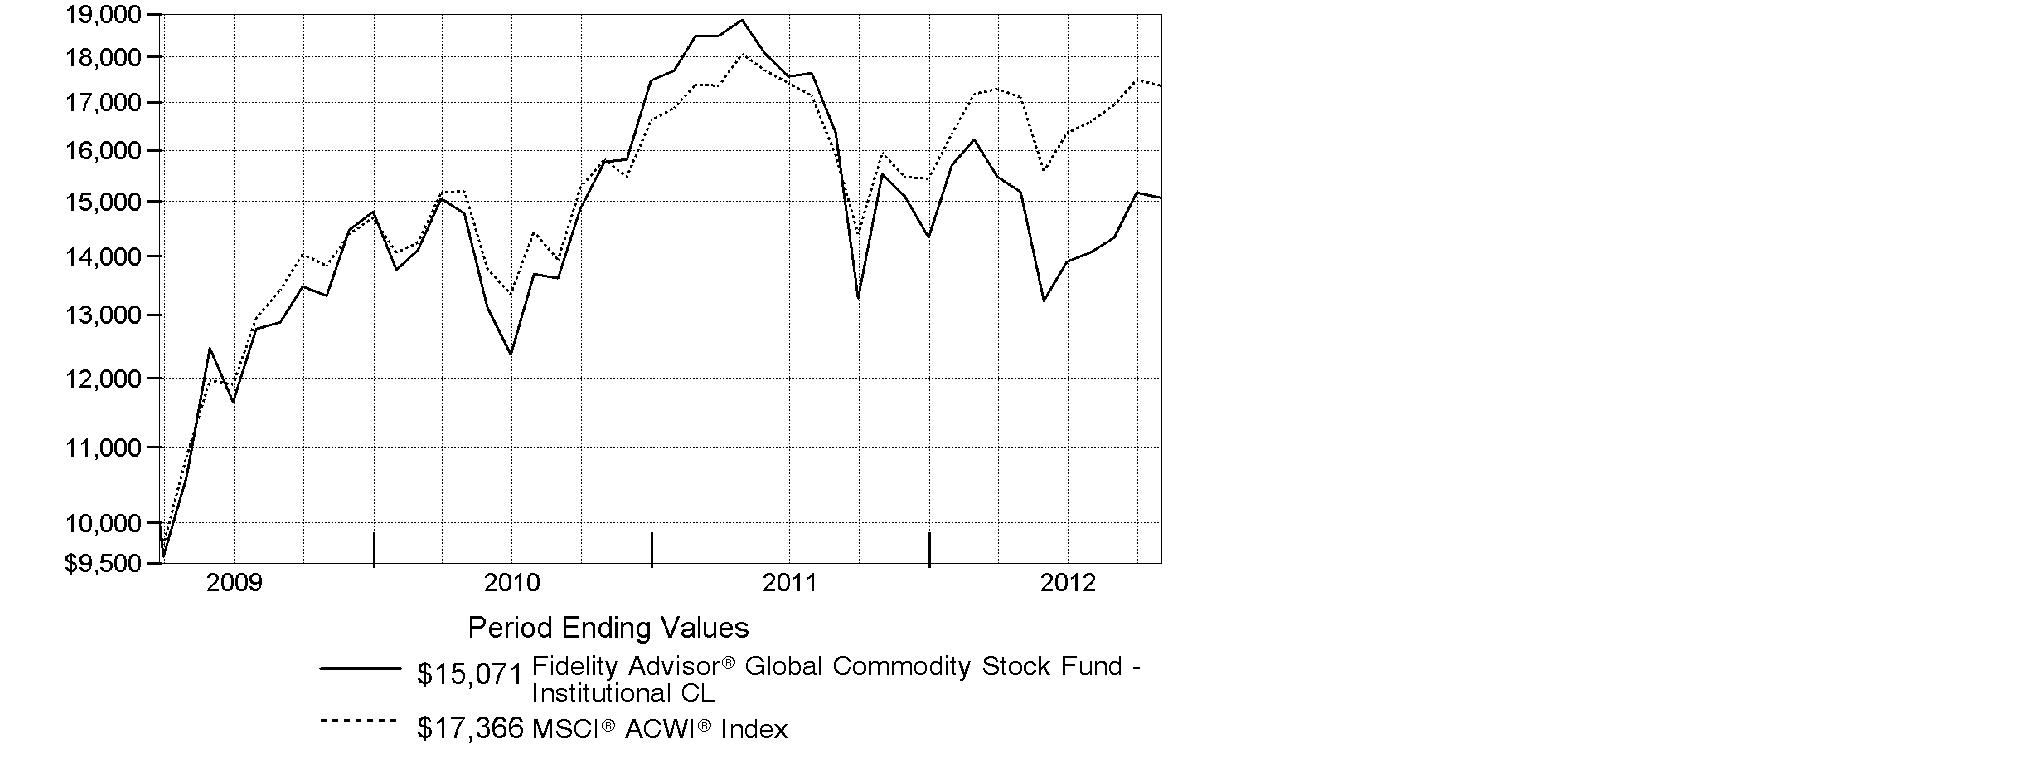
Annual Report
Market Recap: Global stocks experienced pendulum-like swings during the 12 months ending October 31, 2012, finishing the period with a solid advance. The market faced periodic bouts of volatility this past year, as a number of macroeconomic concerns - including the eurozone debt crisis, the strength and pace of the U.S. economic recovery, and a slowdown in China's once-blistering growth - dominated headlines and weighed on investors. While a stronger U.S. dollar provided an additional head wind for foreign investments, stocks worldwide rose 8.96% for the 12 months, as measured by the MSCI® ACWI® (All Country World Index) Index, largely buttressed in the summer by pledges of accommodative monetary action from eurozone officials, as well as signs that the U.S. housing market was on the mend. Within the index, the U.S. showed the most impressive gain among major markets, advancing 15%, closely followed by Asia-Pacific ex Japan (+10%). A number of core European components, most notably Germany (+11%), Switzerland (+10%) and the U.K. (+9%), benefited from optimism about the eurozone's ability to resolve its debt woes. However, continued weakness in peripheral European markets caused the region to lag the index overall. Elsewhere, results from Canada (+3%) and the generally more volatile emerging markets (+2%) each fell short of the MSCI index, while Japan was among the few benchmark constituents to finish in the red, returning about -3%.
Comments from S. Joseph Wickwire II, Portfolio Manager of Fidelity Advisor® Global Commodity Stock Fund: For the year, the fund's Institutional Class shares returned -2.90%, in line with the -2.63% return of the MSCI® ACWI® (All Country World Index) Commodity Producers Sector Capped Index. The fund was hurt the most by its investments in coal stocks, while choices in oil/gas refining and marketing meaningfully contributed. Overweightings in coal producers Alpha Natural Resources and Peabody Energy detracted, as did oil/gas equipment and services providers such as Ion Geophysical. Underweighting several solid-performing paper-related names also hurt, including Swedish paper product maker Svenska Cellulosa. Conversely, investments in refiners such as Marathon Petroleum and Tesoro were standouts, while oil/gas exploration and production firm Nexen was the fund's top individual contributor after its stock surged in late July on a takeover bid from Hong Kong-based CNOOC. Cabot Oil & Gas was another contributor. In agriculture, the fund benefited in part from an overweighting in fertilizer maker CF Industries Holdings. Some of the stocks I've mentioned were not in the benchmark and/or were sold by period end.
The views expressed above reflect those of the portfolio manager(s) only through the end of the period as stated on the cover of this report and do not necessarily represent the views of Fidelity or any other person in the Fidelity organization. Any such views are subject to change at any time based upon market or other conditions and Fidelity disclaims any responsibility to update such views. These views may not be relied on as investment advice and, because investment decisions for a Fidelity fund are based on numerous factors, may not be relied on as an indication of trading intent on behalf of any Fidelity fund.
Annual Report
Shareholder Expense Example
As a shareholder of the Fund, you incur two types of costs: (1) transaction costs, including sales charges (loads) on purchase payments or redemption proceeds, redemption fees and (2) ongoing costs, including management fees, distribution and/or service (12b-1) fees and other Fund expenses. This Example is intended to help you understand your ongoing costs (in dollars) of investing in the Fund and to compare these costs with the ongoing costs of investing in other mutual funds.
The Example is based on an investment of $1,000 invested at the beginning of the period and held for the entire period (May 1, 2012 to October 31, 2012).
Actual Expenses
The first line of the accompanying table for each class of the Fund provides information about actual account values and actual expenses. You may use the information in this line, together with the amount you invested, to estimate the expenses that you paid over the period. Simply divide your account value by $1,000.00 (for example, an $8,600 account value divided by $1,000.00 = 8.6), then multiply the result by the number in the first line for a class of the Fund under the heading entitled "Expenses Paid During Period" to estimate the expenses you paid on your account during this period. A small balance maintenance fee of $12.00 that is charged once a year may apply for certain accounts with a value of less than $2,000. This fee is not included in the table below. If it was, the estimate of expenses you paid during the period would be higher, and your ending account value lower, by this amount. In addition, the Fund, as a shareholder in the underlying Fidelity Central Funds, will indirectly bear its pro-rata share of the fees and expenses incurred by the underlying Fidelity Central Funds. These fees and expenses are not included in the Fund's annualized expense ratio used to calculate the expense estimate in the table below.
Hypothetical Example for Comparison Purposes
The second line of the accompanying table for each class of the Fund provides information about hypothetical account values and hypothetical expenses based on a Class' actual expense ratio and an assumed rate of return of 5% per year before expenses, which is not the Class' actual return. The hypothetical account values and expenses may not be used to estimate the actual ending account balance or expenses you paid for the period. You may use this information to compare the ongoing costs of investing in the Fund and other funds. To do so, compare this 5% hypothetical example with the 5% hypothetical examples that appear in the shareholder reports of the other funds. A small balance maintenance fee of $12.00 that is charged once a year may apply for certain accounts with a value of less than $2,000. This fee is not included in the table below. If it was, the estimate of expenses you paid during the period would be higher, and your ending account value lower, by this amount. In addition, the Fund, as a shareholder in the underlying Fidelity Central Funds, will indirectly bear its pro-rata share of the fees and expenses incurred by the underlying Fidelity Central Funds. These fees and expenses are not included in the Fund's annualized expense ratio used to calculate the expense estimate in the table below.
Please note that the expenses shown in the table are meant to highlight your ongoing costs only and do not reflect any transaction costs. Therefore, the second line of the table is useful in comparing ongoing costs only, and will not help you determine the relative total costs of owning different funds. In addition, if these transactional costs were included, your costs would have been higher.
Annual Report
Shareholder Expense Example - continued
| Annualized Expense Ratio | Beginning
Account Value
May 1, 2012 | Ending
Account Value
October 31, 2012 | Expenses Paid
During Period*
May 1, 2012 to October 31, 2012 |
Class A | 1.33% | | | |
Actual | | $ 1,000.00 | $ 990.50 | $ 6.65 |
HypotheticalA | | $ 1,000.00 | $ 1,018.45 | $ 6.75 |
Class T | 1.59% | | | |
Actual | | $ 1,000.00 | $ 989.10 | $ 7.95 |
HypotheticalA | | $ 1,000.00 | $ 1,017.14 | $ 8.06 |
Class B | 2.09% | | | |
Actual | | $ 1,000.00 | $ 987.00 | $ 10.44 |
HypotheticalA | | $ 1,000.00 | $ 1,014.63 | $ 10.58 |
Class C | 2.09% | | | |
Actual | | $ 1,000.00 | $ 987.00 | $ 10.44 |
HypotheticalA | | $ 1,000.00 | $ 1,014.63 | $ 10.58 |
Global Commodity Stock | 1.08% | | | |
Actual | | $ 1,000.00 | $ 991.90 | $ 5.41 |
HypotheticalA | | $ 1,000.00 | $ 1,019.71 | $ 5.48 |
Institutional Class | 1.03% | | | |
Actual | | $ 1,000.00 | $ 992.60 | $ 5.16 |
HypotheticalA | | $ 1,000.00 | $ 1,019.96 | $ 5.23 |
A 5% return per year before expenses
* Expenses are equal to each Class' annualized expense ratio, multiplied by the average account value over the period, multiplied by 184/366 (to reflect the one-half year period).
Annual Report
Investment Changes (Unaudited)
Top Ten Stocks as of October 31, 2012 |
| % of fund's
net assets | % of fund's net assets
6 months ago |
BHP Billiton PLC | 5.7 | 5.6 |
Monsanto Co. | 5.0 | 4.6 |
Syngenta AG (Switzerland) | 3.9 | 1.8 |
Potash Corp. of Saskatchewan, Inc. | 3.4 | 4.1 |
Royal Dutch Shell PLC Class A (United Kingdom) | 3.2 | 3.0 |
Rio Tinto PLC | 2.9 | 2.7 |
Chevron Corp. | 2.0 | 3.1 |
BP PLC | 1.9 | 1.8 |
Agrium, Inc. | 1.7 | 1.4 |
International Paper Co. | 1.7 | 1.2 |
| 31.4 | |
Top Sectors (% of fund's net assets) |
As of October 31, 2012 |
 | Metals 35.2% | |
 | Energy 34.0% | |
 | Agriculture 28.7% | |
 | Other 1.6% | |
| Short-Term Investments
and Net Other Assets 0.5% | |

As of April 30, 2012 |
| Energy 37.0% | |
| Metals 36.8% | |
| Agriculture 23.5% | |
| Other 2.5% | |
| Short-Term Investments
and Net Other Assets 0.2% | |

Annual Report
Investments October 31, 2012
Showing Percentage of Net Assets
Common Stocks - 99.5% |
| Shares | | Value |
CHEMICALS - 21.2% |
Commodity Chemicals - 0.0% |
Braskem SA (PN-A) | 13,250 | | $ 87,547 |
Fertilizers & Agricultural Chemicals - 21.2% |
Agrium, Inc. | 94,300 | | 9,930,888 |
CF Industries Holdings, Inc. | 42,072 | | 8,632,754 |
China BlueChemical Ltd. (H Shares) | 2,450,000 | | 1,552,184 |
Incitec Pivot Ltd. | 838,984 | | 2,752,067 |
Israel Chemicals Ltd. | 337,000 | | 4,217,218 |
Israel Corp. Ltd. (Class A) | 1,000 | | 679,773 |
K&S AG | 74,207 | | 3,510,694 |
Monsanto Co. | 339,900 | | 29,255,193 |
Potash Corp. of Saskatchewan, Inc. | 501,600 | | 20,164,446 |
Sociedad Quimica y Minera de Chile SA (PN-B) sponsored ADR | 3,100 | | 179,335 |
Syngenta AG (Switzerland) | 58,362 | | 22,754,733 |
Taiwan Fertilizer Co. Ltd. | 93,000 | | 221,595 |
The Mosaic Co. | 181,700 | | 9,510,178 |
United Phosphorous Ltd. (a) | 252,256 | | 534,939 |
Uralkali OJSC GDR (Reg. S) | 137,900 | | 5,402,922 |
Yara International ASA | 115,400 | | 5,436,732 |
| | 124,735,651 |
Specialty Chemicals - 0.0% |
LyondellBasell Industries NV Class A | 3,900 | | 208,221 |
TOTAL CHEMICALS | | 125,031,419 |
CONSTRUCTION & ENGINEERING - 0.0% |
Construction & Engineering - 0.0% |
FLSmidth & Co. A/S | 3,100 | | 183,134 |
CONSTRUCTION MATERIALS - 0.1% |
Construction Materials - 0.1% |
Martin Marietta Materials, Inc. | 7,100 | | 584,401 |
CONTAINERS & PACKAGING - 0.1% |
Paper Packaging - 0.1% |
Klabin SA (PN) (non-vtg.) | 31,700 | | 186,200 |
Rock-Tenn Co. Class A | 9,000 | | 658,710 |
| | 844,910 |
Common Stocks - continued |
| Shares | | Value |
ENERGY EQUIPMENT & SERVICES - 1.5% |
Oil & Gas Drilling - 1.2% |
Eurasia Drilling Co. Ltd. GDR (Reg. S) | 8,000 | | $ 276,800 |
Noble Corp. | 56,600 | | 2,136,084 |
Ocean Rig UDW, Inc. (United States) (a) | 90,700 | | 1,439,409 |
Rowan Companies PLC (a) | 32,900 | | 1,043,259 |
Unit Corp. (a) | 14,400 | | 581,040 |
Vantage Drilling Co. (a) | 1,074,382 | | 1,976,863 |
| | 7,453,455 |
Oil & Gas Equipment & Services - 0.3% |
Cameron International Corp. (a) | 12,700 | | 643,128 |
National Oilwell Varco, Inc. | 4,200 | | 309,540 |
Superior Energy Services, Inc. (a) | 36,600 | | 744,078 |
| | 1,696,746 |
TOTAL ENERGY EQUIPMENT & SERVICES | | 9,150,201 |
FOOD PRODUCTS - 4.1% |
Agricultural Products - 4.0% |
Archer Daniels Midland Co. | 311,500 | | 8,360,660 |
Bunge Ltd. | 104,400 | | 7,415,532 |
China Agri-Industries Holdings Ltd. | 1,561,000 | | 976,878 |
Golden Agri-Resources Ltd. | 4,481,000 | | 2,295,971 |
Ingredion, Inc. | 10,400 | | 639,184 |
Viterra, Inc. | 200,600 | | 3,161,396 |
Wilmar International Ltd. | 214,000 | | 542,105 |
| | 23,391,726 |
Packaged Foods & Meats - 0.1% |
Tyson Foods, Inc. Class A | 46,300 | | 778,303 |
TOTAL FOOD PRODUCTS | | 24,170,029 |
MACHINERY - 0.7% |
Construction & Farm Machinery & Heavy Trucks - 0.7% |
Caterpillar, Inc. | 3,200 | | 271,392 |
Cummins, Inc. | 2,900 | | 271,382 |
Deere & Co. | 450 | | 38,448 |
Fiat Industrial SpA | 186,900 | | 2,024,002 |
Jain Irrigation Systems Ltd. | 442,016 | | 537,271 |
Joy Global, Inc. | 12,850 | | 802,483 |
| | 3,944,978 |
Common Stocks - continued |
| Shares | | Value |
METALS & MINING - 35.2% |
Aluminum - 0.2% |
Alcoa, Inc. | 135,300 | | $ 1,159,521 |
Diversified Metals & Mining - 18.2% |
Anglo American PLC (United Kingdom) | 286,151 | | 8,787,601 |
BHP Billiton PLC | 1,044,896 | | 33,490,228 |
Copper Mountain Mining Corp. (a) | 1,376,156 | | 5,566,629 |
Eurasian Natural Resources Corp. PLC | 86,200 | | 455,848 |
First Quantum Minerals Ltd. | 164,100 | | 3,688,656 |
Freeport-McMoRan Copper & Gold, Inc. | 239,200 | | 9,300,096 |
Glencore International PLC (d) | 698,800 | | 3,868,535 |
Grupo Mexico SA de CV Series B | 89,411 | | 286,519 |
Horsehead Holding Corp. (a) | 221,000 | | 2,000,050 |
Iluka Resources Ltd. | 344,446 | | 3,546,918 |
Inmet Mining Corp. | 16,800 | | 866,283 |
Ivanhoe Australia Ltd. (a) | 536,258 | | 487,080 |
Jiangxi Copper Co. Ltd. (H Shares) | 75,000 | | 194,031 |
Kazakhmys PLC | 28,100 | | 321,506 |
Korea Zinc Co. Ltd. | 1,100 | | 451,977 |
Norilsk Nickel OJSC sponsored ADR | 1,700 | | 25,789 |
OZ Minerals Ltd. | 531 | | 4,514 |
Rio Tinto PLC | 341,587 | | 17,064,470 |
Sterlite Industries (India) Ltd. | 148,488 | | 273,500 |
Sumitomo Metal Mining Co. Ltd. | 103,000 | | 1,356,044 |
Teck Resources Ltd. Class B (sub. vtg.) | 111,100 | | 3,526,278 |
Turquoise Hill Resources Ltd. (a)(d) | 510,014 | | 3,988,195 |
Walter Energy, Inc. | 26,800 | | 936,928 |
Xstrata PLC | 416,691 | | 6,583,812 |
| | 107,071,487 |
Gold - 9.3% |
Agnico-Eagle Mines Ltd. (Canada) | 32,400 | | 1,829,323 |
AngloGold Ashanti Ltd. sponsored ADR | 103,800 | | 3,527,124 |
Barrick Gold Corp. | 227,800 | | 9,212,358 |
Centerra Gold, Inc. | 40,500 | | 459,439 |
Eldorado Gold Corp. | 218,350 | | 3,226,880 |
Gold Fields Ltd. sponsored ADR | 156,900 | | 1,962,819 |
Goldcorp, Inc. | 185,810 | | 8,399,821 |
Harmony Gold Mining Co. Ltd. sponsored ADR | 158,500 | | 1,315,550 |
IAMGOLD Corp. | 97,900 | | 1,519,349 |
Kinross Gold Corp. | 264,705 | | 2,629,160 |
New Gold, Inc. (a) | 255,100 | | 2,985,851 |
Newcrest Mining Ltd. | 170,840 | | 4,687,108 |
Common Stocks - continued |
| Shares | | Value |
METALS & MINING - CONTINUED |
Gold - continued |
Newmont Mining Corp. | 99,000 | | $ 5,400,450 |
Osisko Mining Corp. (a) | 99,400 | | 976,334 |
Premier Gold Mines Ltd. (a) | 301,500 | | 1,693,532 |
Randgold Resources Ltd. sponsored ADR | 17,800 | | 2,128,702 |
Yamana Gold, Inc. | 150,200 | | 3,033,326 |
| | 54,987,126 |
Precious Metals & Minerals - 1.1% |
Aquarius Platinum Ltd. (United Kingdom) | 492,800 | | 298,221 |
Gem Diamonds Ltd. (a) | 223,600 | | 608,908 |
Impala Platinum Holdings Ltd. | 10,000 | | 179,917 |
Lonmin PLC (d) | 5,922 | | 49,026 |
Northam Platinum Ltd. | 30,500 | | 114,674 |
Pan American Silver Corp. | 92,300 | | 2,024,824 |
Silver Wheaton Corp. | 74,400 | | 2,998,348 |
| | 6,273,918 |
Steel - 6.4% |
African Minerals Ltd. (a) | 612,800 | | 2,702,186 |
Allegheny Technologies, Inc. | 28,000 | | 737,800 |
ArcelorMittal SA Class A unit (d) | 202,400 | | 2,989,448 |
Bradespar SA (PN) | 12,600 | | 186,111 |
Carpenter Technology Corp. | 3,400 | | 165,274 |
Cliffs Natural Resources, Inc. | 26,100 | | 946,647 |
Commercial Metals Co. | 19,550 | | 269,008 |
Eregli Demir ve Celik Fabrikalari T.A.S. | 149,000 | | 177,054 |
Fortescue Metals Group Ltd. (d) | 624,689 | | 2,645,710 |
Gerdau SA sponsored ADR | 179,500 | | 1,577,805 |
Hyundai Steel Co. | 30,714 | | 2,211,323 |
JFE Holdings, Inc. | 119,000 | | 1,677,001 |
Jindal Steel & Power Ltd. | 61,255 | | 442,122 |
London Mining PLC (a) | 1,327,900 | | 3,267,920 |
Maanshan Iron & Steel Ltd. (H Shares) (a) | 977,000 | | 252,127 |
Magnitogorsk Iron & Steel Works OJSC unit (a) | 143,600 | | 619,203 |
Nucor Corp. | 24,600 | | 987,198 |
POSCO | 15,694 | | 4,934,748 |
Reliance Steel & Aluminum Co. | 7,100 | | 385,814 |
Salzgitter AG | 4,700 | | 203,378 |
Sims Metal Management Ltd. | 21,500 | | 210,091 |
Tata Steel Ltd. | 63,017 | | 459,349 |
Thyssenkrupp AG (d) | 56,600 | | 1,287,871 |
Common Stocks - continued |
| Shares | | Value |
METALS & MINING - CONTINUED |
Steel - continued |
Usinas Siderurgicas de Minas Gerais SA - Usiminas (PN-A) (non-vtg.) | 58,700 | | $ 283,522 |
Vale SA (PN-A) sponsored ADR | 403,000 | | 7,169,370 |
Voestalpine AG | 23,100 | | 727,568 |
Yamato Kogyo Co. Ltd. | 9,100 | | 255,457 |
| | 37,771,105 |
TOTAL METALS & MINING | | 207,263,157 |
OIL, GAS & CONSUMABLE FUELS - 32.5% |
Coal & Consumable Fuels - 1.7% |
Alpha Natural Resources, Inc. (a)(d) | 484,337 | | 4,150,768 |
Banpu PCL (For. Reg.) | 8,950 | | 114,392 |
Cameco Corp. | 24,600 | | 477,098 |
China Shenhua Energy Co. Ltd. (H Shares) | 54,000 | | 229,934 |
Paladin Energy Ltd.: | | | |
(Australia) (a) | 46,842 | | 55,189 |
(Canada) (a) | 271,500 | | 320,771 |
Peabody Energy Corp. | 141,600 | | 3,950,640 |
Whitehaven Coal Ltd. | 138,200 | | 437,548 |
Yanzhou Coal Mining Co. Ltd. (H Shares) | 102,000 | | 152,044 |
| | 9,888,384 |
Integrated Oil & Gas - 17.3% |
BG Group PLC | 271,550 | | 5,028,504 |
BP PLC | 1,556,100 | | 11,113,052 |
Cenovus Energy, Inc. | 38,100 | | 1,343,943 |
Chevron Corp. | 105,900 | | 11,671,239 |
China Petroleum & Chemical Corp. (H Shares) | 508,000 | | 535,370 |
ENI SpA | 254,827 | | 5,863,806 |
Exxon Mobil Corp. | 69,961 | | 6,378,344 |
Gazprom OAO sponsored ADR | 474,100 | | 4,333,274 |
Hess Corp. | 51,900 | | 2,712,294 |
InterOil Corp. (a) | 41,300 | | 2,663,024 |
Lukoil Oil Co. sponsored ADR | 39,900 | | 2,401,980 |
Murphy Oil Corp. | 38,700 | | 2,322,000 |
Occidental Petroleum Corp. | 95,100 | | 7,509,096 |
OMV AG | 13,300 | | 486,134 |
Origin Energy Ltd. | 254,563 | | 3,001,870 |
Petroleo Brasileiro SA - Petrobras (PN) sponsored ADR (non-vtg.) | 259,600 | | 5,329,588 |
Common Stocks - continued |
| Shares | | Value |
OIL, GAS & CONSUMABLE FUELS - CONTINUED |
Integrated Oil & Gas - continued |
Repsol YPF SA | 72,671 | | $ 1,452,449 |
Royal Dutch Shell PLC Class A (United Kingdom) | 548,750 | | 18,829,121 |
StatoilHydro ASA | 64,600 | | 1,591,031 |
Suncor Energy, Inc. | 199,432 | | 6,693,327 |
Total SA | 14,900 | | 750,516 |
| | 102,009,962 |
Oil & Gas Exploration & Production - 12.4% |
Anadarko Petroleum Corp. | 127,800 | | 8,793,918 |
Apache Corp. | 90,000 | | 7,447,500 |
Baytex Energy Corp. | 4,300 | | 195,680 |
Bonavista Energy Corp. (d) | 45,000 | | 806,959 |
C&C Energia Ltd. (a) | 284,900 | | 1,660,193 |
Cabot Oil & Gas Corp. | 32,200 | | 1,512,756 |
Canadian Natural Resources Ltd. | 199,200 | | 6,003,424 |
Canadian Oil Sands Ltd. | 8,600 | | 182,548 |
Chesapeake Energy Corp. | 65,700 | | 1,331,082 |
Cimarex Energy Co. | 7,400 | | 423,132 |
CNOOC Ltd. | 120,000 | | 246,957 |
CNOOC Ltd. sponsored ADR (d) | 14,800 | | 3,042,140 |
Cobalt International Energy, Inc. (a) | 99,800 | | 2,076,838 |
Concho Resources, Inc. (a) | 7,000 | | 602,840 |
ConocoPhillips | 3,200 | | 185,120 |
Crew Energy, Inc. (a) | 378,000 | | 2,910,458 |
Denbury Resources, Inc. (a) | 251,900 | | 3,861,627 |
Devon Energy Corp. | 32,600 | | 1,897,646 |
Double Eagle Petroleum Co. (a)(d) | 284,610 | | 1,425,896 |
EOG Resources, Inc. | 14,700 | | 1,712,403 |
EQT Corp. | 4,600 | | 278,898 |
INPEX Corp. | 437 | | 2,490,730 |
Marathon Oil Corp. | 62,600 | | 1,881,756 |
Newfield Exploration Co. (a) | 9,100 | | 246,792 |
Nexen, Inc. | 10,400 | | 248,350 |
Noble Energy, Inc. | 15,800 | | 1,501,158 |
NOVATEK OAO GDR (Reg. S) | 8,700 | | 991,800 |
Oasis Petroleum, Inc. (a) | 3,150 | | 92,516 |
OGX Petroleo e Gas Participacoes SA (a) | 56,600 | | 131,255 |
Oil Search Ltd. ADR | 46,796 | | 361,410 |
Pacific Rubiales Energy Corp. | 1,700 | | 39,983 |
Painted Pony Petroleum Ltd. (a)(e) | 15,000 | | 162,203 |
Painted Pony Petroleum Ltd. Class A (a) | 213,100 | | 2,304,360 |
Common Stocks - continued |
| Shares | | Value |
OIL, GAS & CONSUMABLE FUELS - CONTINUED |
Oil & Gas Exploration & Production - continued |
Pengrowth Energy Corp. (d) | 54,200 | | $ 325,064 |
Penn West Petroleum Ltd. | 160,000 | | 2,077,797 |
PetroBakken Energy Ltd. Class A (d) | 132,900 | | 1,677,966 |
Petrominerales Ltd. | 241,126 | | 1,933,837 |
Pioneer Natural Resources Co. | 11,700 | | 1,236,105 |
QEP Resources, Inc. | 18,100 | | 524,900 |
Rosetta Resources, Inc. (a) | 13,200 | | 607,728 |
Santos Ltd. | 92,100 | | 1,100,407 |
SM Energy Co. | 5,700 | | 307,344 |
Southwestern Energy Co. (a) | 30,900 | | 1,072,230 |
Talisman Energy, Inc. | 86,500 | | 980,406 |
Tullow Oil PLC | 89,300 | | 2,023,275 |
Whiting Petroleum Corp. (a) | 30,100 | | 1,264,802 |
Woodside Petroleum Ltd. | 24,408 | | 871,583 |
| | 73,053,772 |
Oil & Gas Refining & Marketing - 0.8% |
Marathon Petroleum Corp. | 26,850 | | 1,474,871 |
Phillips 66 | 4,100 | | 193,356 |
Tesoro Corp. | 29,900 | | 1,127,529 |
Valero Energy Corp. | 60,700 | | 1,766,370 |
| | 4,562,126 |
Oil & Gas Storage & Transport - 0.3% |
Cheniere Energy, Inc. (a) | 73,900 | | 1,189,051 |
The Williams Companies, Inc. | 18,000 | | 629,820 |
| | 1,818,871 |
TOTAL OIL, GAS & CONSUMABLE FUELS | | 191,333,115 |
PAPER & FOREST PRODUCTS - 3.6% |
Paper Products - 3.6% |
Empresas CMPC SA | 333,075 | | 1,277,197 |
International Paper Co. | 275,700 | | 9,878,331 |
MeadWestvaco Corp. | 800 | | 23,752 |
Nine Dragons Paper (Holdings) Ltd. | 869,000 | | 612,221 |
Nippon Paper Group, Inc. (d) | 86,800 | | 992,715 |
Oji Holdings Corp. | 268,000 | | 785,569 |
Stora Enso Oyj (R Shares) | 487,600 | | 3,076,589 |
UPM-Kymmene Corp. | 405,300 | | 4,339,222 |
| | 20,985,596 |
Common Stocks - continued |
| Shares | | Value |
SPECIALTY RETAIL - 0.4% |
Specialty Stores - 0.4% |
Tsutsumi Jewelry Co. Ltd. | 95,500 | | $ 2,190,411 |
TRADING COMPANIES & DISTRIBUTORS - 0.1% |
Trading Companies & Distributors - 0.1% |
Mitsubishi Corp. | 28,900 | | 515,877 |
TOTAL COMMON STOCKS (Cost $614,116,238) |
586,197,228
|
Money Market Funds - 3.1% |
| | | |
Fidelity Cash Central Fund, 0.19% (b) | 1,525,856 | | 1,525,856 |
Fidelity Securities Lending Cash Central Fund, 0.19% (b)(c) | 16,641,647 | | 16,641,647 |
TOTAL MONEY MARKET FUNDS (Cost $18,167,503) |
18,167,503
|
TOTAL INVESTMENT PORTFOLIO - 102.6% (Cost $632,283,741) | 604,364,731 |
NET OTHER ASSETS (LIABILITIES) - (2.6)% | (15,234,186) |
NET ASSETS - 100% | $ 589,130,545 |
Legend |
(a) Non-income producing |
(b) Affiliated fund that is available only to investment companies and other accounts managed by Fidelity Investments. The rate quoted is the annualized seven-day yield of the fund at period end. A complete unaudited listing of the fund's holdings as of its most recent quarter end is available upon request. In addition, each Fidelity Central Fund's financial statements, which are not covered by the Fund's Report of Independent Registered Public Accounting Firm, are available on the SEC's website or upon request. |
(c) Investment made with cash collateral received from securities on loan. |
(d) Security or a portion of the security is on loan at period end. |
(e) Security exempt from registration under Rule 144A of the Securities Act of 1933. These securities may be resold in transactions exempt from registration, normally to qualified institutional buyers. At the end of the period, the value of these securities amounted to $162,203 or 0.0% of net assets. |
Affiliated Central Funds |
Information regarding fiscal year to date income earned by the Fund from investments in Fidelity Central Funds is as follows: |
Fund | Income earned |
Fidelity Cash Central Fund | $ 6,102 |
Fidelity Securities Lending Cash Central Fund | 447,820 |
Total | $ 453,922 |
Other Information |
The following is a summary of the inputs used, as of October 31, 2012, involving the Fund's assets and liabilities carried at fair value. The inputs or methodology used for valuing securities may not be an indication of the risk associated with investing in those securities. For more information on valuation inputs, and their aggregation into the levels used in the tables below, please refer to the Security Valuation section in the accompanying Notes to Financial Statements. |
Valuation Inputs at Reporting Date: |
Description | Total | Level 1 | Level 2 | Level 3 |
Investments in Securities: | | | | |
Common Stocks | $ 586,197,228 | $ 468,387,561 | $ 117,809,667 | $ - |
Money Market Funds | 18,167,503 | 18,167,503 | - | - |
Total Investments in Securities: | $ 604,364,731 | $ 486,555,064 | $ 117,809,667 | $ - |
The following is a summary of transfers between Level 1 and Level 2 for the period ended October 31, 2012. Transfers are assumed to have occurred at the beginning of the period, and are primarily attributable to the valuation techniques used for foreign equity securities, as discussed in the accompanying Notes to Financial Statements: |
Transfers | Total |
Level 1 to Level 2 | $ 0 |
Level 2 to Level 1 | $ 40,233,339 |
Distribution of investments by country or territory of incorporation, as a percentage of total net assets, is as follows. (Unaudited) |
United States of America | 31.3% |
Canada | 20.9% |
United Kingdom | 18.5% |
Switzerland | 4.3% |
Australia | 3.6% |
Brazil | 2.5% |
Russia | 2.3% |
Bermuda | 2.0% |
Japan | 1.7% |
Italy | 1.3% |
Korea (South) | 1.3% |
Finland | 1.3% |
Norway | 1.2% |
South Africa | 1.1% |
Bailiwick of Jersey | 1.1% |
Others (Individually Less Than 1%) | 5.6% |
| 100.0% |
See accompanying notes which are an integral part of the financial statements.
Annual Report
Statement of Assets and Liabilities
| October 31, 2012 |
| | |
Assets | | |
Investment in securities, at value (including securities loaned of $15,891,643) - See accompanying schedule: Unaffiliated issuers (cost $614,116,238) | $ 586,197,228 | |
Fidelity Central Funds (cost $18,167,503) | 18,167,503 | |
Total Investments (cost $632,283,741) | | $ 604,364,731 |
Receivable for investments sold | | 3,085,957 |
Receivable for fund shares sold | | 635,744 |
Dividends receivable | | 697,233 |
Distributions receivable from Fidelity Central Funds | | 25,559 |
Other receivables | | 25,267 |
Total assets | | 608,834,491 |
| | |
Liabilities | | |
Payable for investments purchased | $ 862,645 | |
Payable for fund shares redeemed | 1,560,012 | |
Accrued management fee | 352,531 | |
Distribution and service plan fees payable | 57,926 | |
Other affiliated payables | 173,018 | |
Other payables and accrued expenses | 56,167 | |
Collateral on securities loaned, at value | 16,641,647 | |
Total liabilities | | 19,703,946 |
| | |
Net Assets | | $ 589,130,545 |
Net Assets consist of: | | |
Paid in capital | | $ 653,044,854 |
Undistributed net investment income | | 4,752,569 |
Accumulated undistributed net realized gain (loss) on investments and foreign currency transactions | | (40,740,018) |
Net unrealized appreciation (depreciation) on investments and assets and liabilities in foreign currencies | | (27,926,860) |
Net Assets | | $ 589,130,545 |
See accompanying notes which are an integral part of the financial statements.
Annual Report
Financial Statements - continued
Statement of Assets and Liabilities - continued
| October 31, 2012 |
| | |
Calculation of Maximum Offering Price
Class A:
Net Asset Value and redemption price per share
($99,694,434 ÷ 6,832,148 shares) | | $ 14.59 |
| | |
Maximum offering price per share (100/94.25 of $14.59) | | $ 15.48 |
Class T:
Net Asset Value and redemption price per share ($16,692,439 ÷ 1,147,836 shares) | | $ 14.54 |
| | |
Maximum offering price per share (100/96.50 of $14.54) | | $ 15.07 |
Class B:
Net Asset Value and offering price per share ($3,096,607 ÷ 214,827 shares)A | | $ 14.41 |
| | |
Class C:
Net Asset Value and offering price per share ($31,865,429 ÷ 2,217,584 shares)A | | $ 14.37 |
| | |
Global Commodity Stock:
Net Asset Value, offering price and redemption price per share ($387,241,629 ÷ 26,407,116 shares) | | $ 14.66 |
| | |
Institutional Class:
Net Asset Value, offering price and redemption price per share ($50,540,007 ÷ 3,445,636 shares) | | $ 14.67 |
A Redemption price per share is equal to net asset value less any applicable contingent deferred sales charge.
See accompanying notes which are an integral part of the financial statements.
Annual Report
Statement of Operations
| Year ended October 31, 2012 |
| | |
Investment Income | | |
Dividends | | $ 14,713,564 |
Interest | | 7,665 |
Income from Fidelity Central Funds | | 453,922 |
Income before foreign taxes withheld | | 15,175,151 |
Less foreign taxes withheld | | (949,994) |
Total income | | 14,225,157 |
| | |
Expenses | | |
Management fee | $ 4,742,379 | |
Transfer agent fees | 1,946,370 | |
Distribution and service plan fees | 749,354 | |
Accounting and security lending fees | 334,777 | |
Custodian fees and expenses | 90,233 | |
Independent trustees' compensation | 4,478 | |
Registration fees | 112,635 | |
Audit | 54,137 | |
Legal | 3,454 | |
Interest | 1,155 | |
Miscellaneous | 9,469 | |
Total expenses before reductions | 8,048,441 | |
Expense reductions | (50,515) | 7,997,926 |
Net investment income (loss) | | 6,227,231 |
Realized and Unrealized Gain (Loss) Net realized gain (loss) on: | | |
Investment securities: | | |
Unaffiliated issuers | (27,052,701) | |
Foreign currency transactions | (554,431) | |
Total net realized gain (loss) | | (27,607,132) |
Change in net unrealized appreciation (depreciation) on: Investment securities (net of increase in deferred foreign taxes of $5,167) | (9,235,369) | |
Assets and liabilities in foreign currencies | 240,281 | |
Total change in net unrealized appreciation (depreciation) | | (8,995,088) |
Net gain (loss) | | (36,602,220) |
Net increase (decrease) in net assets resulting from operations | | $ (30,374,989) |
See accompanying notes which are an integral part of the financial statements.
Annual Report
Financial Statements - continued
Statement of Changes in Net Assets
| Year ended
October 31,
2012 | Year ended
October 31,
2011 |
Increase (Decrease) in Net Assets | | |
Operations | | |
Net investment income (loss) | $ 6,227,231 | $ 6,869,450 |
Net realized gain (loss) | (27,607,132) | (6,898,032) |
Change in net unrealized appreciation (depreciation) | (8,995,088) | (67,719,909) |
Net increase (decrease) in net assets resulting
from operations | (30,374,989) | (67,748,491) |
Distributions to shareholders from net investment income | (3,692,921) | (5,045,313) |
Distributions to shareholders from net realized gain | (671,463) | (2,104,800) |
Total distributions | (4,364,384) | (7,150,113) |
Share transactions - net increase (decrease) | (156,629,581) | 418,528,912 |
Redemption fees | 31,600 | 94,436 |
Total increase (decrease) in net assets | (191,337,354) | 343,724,744 |
| | |
Net Assets | | |
Beginning of period | 780,467,899 | 436,743,155 |
End of period (including undistributed net investment income of $4,752,569 and undistributed net investment income of $2,852,890, respectively) | $ 589,130,545 | $ 780,467,899 |
See accompanying notes which are an integral part of the financial statements.
Annual Report
Financial Highlights - Class A
Years ended October 31, | 2012 | 2011 | 2010 | 2009 I |
Selected Per-Share Data | | | | |
Net asset value, beginning of period | $ 15.14 | $ 15.60 | $ 13.29 | $ 10.00 |
Income from Investment Operations | | | | |
Net investment income (loss) E | .11 | .12 | .19 H | (.01) |
Net realized and unrealized gain (loss) | (.59) | (.38) | 2.20 | 3.29 |
Total from investment operations | (.48) | (.26) | 2.39 | 3.28 |
Distributions from net investment income | (.05) | (.13) | - K | - |
Distributions from net realized gain | (.01) | (.06) | (.08) | - |
Total distributions | (.07) M | (.20) L | (.08) | - |
Redemption fees added to paid in capital E | - K | - K | - K | .01 |
Net asset value, end of period | $ 14.59 | $ 15.14 | $ 15.60 | $ 13.29 |
Total Return B,C,D | (3.19)% | (1.80)% | 18.04% | 32.90% |
Ratios to Average Net Assets F,J | | | | |
Expenses before reductions | 1.34% | 1.32% | 1.37% | 1.65% A |
Expenses net of fee waivers, if any | 1.34% | 1.32% | 1.37% | 1.50% A |
Expenses net of all reductions | 1.33% | 1.31% | 1.36% | 1.48% A |
Net investment income (loss) | .80% | .71% | 1.35% H | (.15)% A |
Supplemental Data | | | | |
Net assets, end of period (000 omitted) | $ 99,694 | $ 127,979 | $ 60,370 | $ 15,705 |
Portfolio turnover rate G | 91% | 71% | 54% | 25% A |
A Annualized
B Total returns for periods of less than one year are not annualized.
C Total returns would have been lower if certain expenses had not been reduced during the applicable periods shown.
D Total returns do not include the effect of the sales charges.
E Calculated based on average shares outstanding during the period.
F Fees and expenses of any underlying Fidelity Central Funds are not included in the Fund's expense ratio. The Fund indirectly bears its proportionate share of the expenses of any underlying Fidelity Central Funds.
G Amount does not include the portfolio activity of any underlying Fidelity Central Funds.
H Investment income per share reflects a large, non-recurring dividend which amounted to $.13 per share. Excluding this non-recurring dividend, the ratio of net investment income (loss) to average net assets would have been .42%.
I For the period March 25, 2009 (commencement of operations) to October 31, 2009.
J Expense ratios reflect operating expenses of the class. Expenses before reductions do not reflect amounts reimbursed by the investment adviser or reductions from brokerage service arrangements or reductions from other expense offset arrangements and do not represent the amount paid by the class during periods when reimbursements or reductions occur. Expense ratios before reductions for start-up periods may not be representative of longer-term operating periods. Expenses net of fee waivers reflect expenses after reimbursement by the investment adviser but prior to reductions from brokerage service arrangements or other expense offset arrangements. Expenses net of all reductions represent the net expenses paid by the class.
K Amount represents less than $.01 per share.
L Total distributions of $.20 per share is comprised of distributions from net investment income of $.133 and distributions from net realized gain of $.062 per share.
M Total distributions of $.07 per share is comprised of distributions from net investment income of $.052 and distributions from net realized gain of $.014 per share.
See accompanying notes which are an integral part of the financial statements.
Annual Report
Financial Highlights - Class T
Years ended October 31, | 2012 | 2011 | 2010 | 2009 I |
Selected Per-Share Data | | | | |
Net asset value, beginning of period | $ 15.08 | $ 15.55 | $ 13.27 | $ 10.00 |
Income from Investment Operations | | | | |
Net investment income (loss) E | .08 | .07 | .16 H | (.03) |
Net realized and unrealized gain (loss) | (.60) | (.38) | 2.19 | 3.29 |
Total from investment operations | (.52) | (.31) | 2.35 | 3.26 |
Distributions from net investment income | (.01) | (.10) | - | - |
Distributions from net realized gain | (.01) | (.06) | (.07) | - |
Total distributions | (.02) | (.16) | (.07) | - |
Redemption fees added to paid in capital E | - K | - K | - K | .01 |
Net asset value, end of period | $ 14.54 | $ 15.08 | $ 15.55 | $ 13.27 |
Total Return B,C,D | (3.43)% | (2.09)% | 17.73% | 32.70% |
Ratios to Average Net Assets F,J | | | | |
Expenses before reductions | 1.61% | 1.60% | 1.63% | 2.04% A |
Expenses net of fee waivers, if any | 1.61% | 1.60% | 1.63% | 1.75% A |
Expenses net of all reductions | 1.60% | 1.59% | 1.61% | 1.73% A |
Net investment income (loss) | .53% | .43% | 1.10% H | (.40)% A |
Supplemental Data | | | | |
Net assets, end of period (000 omitted) | $ 16,692 | $ 20,831 | $ 11,762 | $ 4,665 |
Portfolio turnover rate G | 91% | 71% | 54% | 25% A |
A Annualized
B Total returns for periods of less than one year are not annualized.
C Total returns would have been lower if certain expenses had not been reduced during the applicable periods shown.
D Total returns do not include the effect of the sales charges.
E Calculated based on average shares outstanding during the period.
F Fees and expenses of any underlying Fidelity Central Funds are not included in the Fund's expense ratio. The Fund indirectly bears its proportionate share of the expenses of any underlying Fidelity Central Funds.
G Amount does not include the portfolio activity of any underlying Fidelity Central Funds.
H Investment income per share reflects a large, non-recurring dividend which amounted to $.13 per share. Excluding this non-recurring dividend, the ratio of net investment income (loss) to average net assets would have been .17%.
I For the period March 25, 2009 (commencement of operations) to October 31, 2009.
J Expense ratios reflect operating expenses of the class. Expenses before reductions do not reflect amounts reimbursed by the investment adviser or reductions from brokerage service arrangements or reductions from other expense offset arrangements and do not represent the amount paid by the class during periods when reimbursements or reductions occur. Expense ratios before reductions for start-up periods may not be representative of longer-term operating periods. Expenses net of fee waivers reflect expenses after reimbursement by the investment adviser but prior to reductions from brokerage service arrangements or other expense offset arrangements. Expenses net of all reductions represent the net expenses paid by the class.
K Amount represents less than $.01 per share.
See accompanying notes which are an integral part of the financial statements.
Annual Report
Financial Highlights - Class B
Years ended October 31, | 2012 | 2011 | 2010 | 2009 I |
Selected Per-Share Data | | | | |
Net asset value, beginning of period | $ 15.00 | $ 15.46 | $ 13.22 | $ 10.00 |
Income from Investment Operations | | | | |
Net investment income (loss) E | - K | (.01) | .08 H | (.07) |
Net realized and unrealized gain (loss) | (.59) | (.39) | 2.20 | 3.28 |
Total from investment operations | (.59) | (.40) | 2.28 | 3.21 |
Distributions from net realized gain | - | (.06) | (.04) | - |
Redemption fees added to paid in capital E | - K | - K | - K | .01 |
Net asset value, end of period | $ 14.41 | $ 15.00 | $ 15.46 | $ 13.22 |
Total Return B,C,D | (3.93)% | (2.62)% | 17.23% | 32.20% |
Ratios to Average Net Assets F,J | | | | |
Expenses before reductions | 2.10% | 2.11% | 2.16% | 2.66% A |
Expenses net of fee waivers, if any | 2.10% | 2.11% | 2.16% | 2.25% A |
Expenses net of all reductions | 2.10% | 2.10% | 2.15% | 2.23% A |
Net investment income (loss) | .03% | (.09)% | .56% H | (.90)% A |
Supplemental Data | | | | |
Net assets, end of period (000 omitted) | $ 3,097 | $ 4,324 | $ 4,348 | $ 2,726 |
Portfolio turnover rate G | 91% | 71% | 54% | 25% A |
A Annualized
B Total returns for periods of less than one year are not annualized.
C Total returns would have been lower if certain expenses had not been reduced during the applicable periods shown.
D Total returns do not include the effect of the contingent deferred sales charge.
E Calculated based on average shares outstanding during the period.
F Fees and expenses of any underlying Fidelity Central Funds are not included in the Fund's expense ratio. The Fund indirectly bears its proportionate share of the expenses of any underlying Fidelity Central Funds.
G Amount does not include the portfolio activity of any underlying Fidelity Central Funds.
H Investment income per share reflects a large, non-recurring dividend which amounted to $.13 per share. Excluding this non-recurring dividend, the ratio of net investment income (loss) to average net assets would have been (.37)%.
I For the period March 25, 2009 (commencement of operations) to October 31, 2009.
J Expense ratios reflect operating expenses of the class. Expenses before reductions do not reflect amounts reimbursed by the investment adviser or reductions from brokerage service arrangements or reductions from other expense offset arrangements and do not represent the amount paid by the class during periods when reimbursements or reductions occur. Expense ratios before reductions for start-up periods may not be representative of longer-term operating periods. Expenses net of fee waivers reflect expenses after reimbursement by the investment adviser but prior to reductions from brokerage service arrangements or other expense offset arrangements. Expenses net of all reductions represent the net expenses paid by the class.
K Amount represents less than $.01 per share.
See accompanying notes which are an integral part of the financial statements.
Annual Report
Financial Highlights - Class C
Years ended October 31, | 2012 | 2011 | 2010 | 2009 I |
Selected Per-Share Data | | | | |
Net asset value, beginning of period | $ 14.95 | $ 15.45 | $ 13.22 | $ 10.00 |
Income from Investment Operations | | | | |
Net investment income (loss) E | .01 | (.01) | .08 H | (.07) |
Net realized and unrealized gain (loss) | (.59) | (.38) | 2.19 | 3.28 |
Total from investment operations | (.58) | (.39) | 2.27 | 3.21 |
Distributions from net investment income | - | (.05) | - | - |
Distributions from net realized gain | - | (.06) | (.04) | - |
Total distributions | - | (.11) | (.04) | - |
Redemption fees added to paid in capital E | - K | - K | - K | .01 |
Net asset value, end of period | $ 14.37 | $ 14.95 | $ 15.45 | $ 13.22 |
Total Return B,C,D | (3.88)% | (2.58)% | 17.21% | 32.20% |
Ratios to Average Net Assets F,J | | | | |
Expenses before reductions | 2.10% | 2.09% | 2.14% | 2.53% A |
Expenses net of fee waivers, if any | 2.10% | 2.09% | 2.14% | 2.25% A |
Expenses net of all reductions | 2.09% | 2.08% | 2.13% | 2.23% A |
Net investment income (loss) | .03% | (.07)% | .58% H | (.90)% A |
Supplemental Data | | | | |
Net assets, end of period (000 omitted) | $ 31,865 | $ 37,185 | $ 14,338 | $ 4,798 |
Portfolio turnover rate G | 91% | 71% | 54% | 25% A |
A Annualized
B Total returns for periods of less than one year are not annualized.
C Total returns would have been lower if certain expenses had not been reduced during the applicable periods shown.
D Total returns do not include the effect of the contingent deferred sales charge.
E Calculated based on average shares outstanding during the period.
F Fees and expenses of any underlying Fidelity Central Funds are not included in the Fund's expense ratio. The Fund indirectly bears its proportionate share of the expenses of any underlying Fidelity Central Funds.
G Amount does not include the portfolio activity of any underlying Fidelity Central Funds.
H Investment income per share reflects a large, non-recurring dividend which amounted to $.13 per share. Excluding this non-recurring dividend, the ratio of net investment income (loss) to average net assets would have been (.34)%.
I For the period March 25, 2009 (commencement of operations) to October 31, 2009.
J Expense ratios reflect operating expenses of the class. Expenses before reductions do not reflect amounts reimbursed by the investment adviser or reductions from brokerage service arrangements or reductions from other expense offset arrangements and do not represent the amount paid by the class during periods when reimbursements or reductions occur. Expense ratios before reductions for start-up periods may not be representative of longer-term operating periods. Expenses net of fee waivers reflect expenses after reimbursement by the investment adviser but prior to reductions from brokerage service arrangements or other expense offset arrangements. Expenses net of all reductions represent the net expenses paid by the class.
K Amount represents less than $.01 per share.
See accompanying notes which are an integral part of the financial statements.
Annual Report
Financial Highlights - Global Commodity Stock
Years ended October 31, | 2012 | 2011 | 2010 | 2009 H |
Selected Per-Share Data | | | | |
Net asset value, beginning of period | $ 15.21 | $ 15.66 | $ 13.31 | $ 10.00 |
Income from Investment Operations | | | | |
Net investment income (loss) D | .15 | .16 | .23 G | .01 |
Net realized and unrealized gain (loss) | (.60) | (.39) | 2.21 | 3.29 |
Total from investment operations | (.45) | (.23) | 2.44 | 3.30 |
Distributions from net investment income | (.08) | (.16) | (.01) | - |
Distributions from net realized gain | (.01) | (.06) | (.08) | - |
Total distributions | (.10) K | (.22) | (.09) | - |
Redemption fees added to paid in capital D | - J | - J | - J | .01 |
Net asset value, end of period | $ 14.66 | $ 15.21 | $ 15.66 | $ 13.31 |
Total Return B,C | (2.96)% | (1.59)% | 18.38% | 33.10% |
Ratios to Average Net Assets E,I | | | | |
Expenses before reductions | 1.10% | 1.08% | 1.10% | 1.42% A |
Expenses net of fee waivers, if any | 1.10% | 1.08% | 1.10% | 1.25% A |
Expenses net of all reductions | 1.09% | 1.07% | 1.09% | 1.23% A |
Net investment income (loss) | 1.04% | .95% | 1.62% G | .10% A |
Supplemental Data | | | | |
Net assets, end of period (000 omitted) | $ 387,242 | $ 531,224 | $ 310,186 | $ 159,439 |
Portfolio turnover rate F | 91% | 71% | 54% | 25% A |
A Annualized
B Total returns for periods of less than one year are not annualized.
C Total returns would have been lower if certain expenses had not been reduced during the applicable periods shown.
D Calculated based on average shares outstanding during the period.
E Fees and expenses of any underlying Fidelity Central Funds are not included in the Fund's expense ratio. The Fund indirectly bears its proportionate share of the expenses of any underlying Fidelity Central Funds.
F Amount does not include the portfolio activity of any underlying Fidelity Central Funds.
G Investment income per share reflects a large, non-recurring dividend which amounted to $.13 per share. Excluding this non-recurring dividend, the ratio of net investment income (loss) to average net assets would have been .69%.
H For the period March 25, 2009 (commencement of operations) to October 31, 2009.
I Expense ratios reflect operating expenses of the class. Expenses before reductions do not reflect amounts reimbursed by the investment adviser or reductions from brokerage service arrangements or reductions from other expense offset arrangements and do not represent the amount paid by the class during periods when reimbursements or reductions occur. Expense ratios before reductions for start-up periods may not be representative of longer-term operating periods. Expenses net of fee waivers reflect expenses after reimbursement by the investment adviser but prior to reductions from brokerage service arrangements or other expense offset arrangements. Expenses net of all reductions represent the net expenses paid by the class.
J Amount represents less than $.01 per share.
K Total distributions of $.10 per share is comprised of distributions from net investment income of $.084 and distributions from net realized gain of $.014 per share.
See accompanying notes which are an integral part of the financial statements.
Annual Report
Financial Highlights - Institutional Class
Years ended October 31, | 2012 | 2011 | 2010 | 2009 H |
Selected Per-Share Data | | | | |
Net asset value, beginning of period | $ 15.22 | $ 15.66 | $ 13.31 | $ 10.00 |
Income from Investment Operations | | | | |
Net investment income (loss) D | .16 | .16 | .23 G | .01 |
Net realized and unrealized gain (loss) | (.60) | (.38) | 2.21 | 3.29 |
Total from investment operations | (.44) | (.22) | 2.44 | 3.30 |
Distributions from net investment income | (.09) | (.16) | (.01) | - |
Distributions from net realized gain | (.01) | (.06) | (.08) | - |
Total distributions | (.11) K | (.22) | (.09) | - |
Redemption fees added to paid in capital D | - J | - J | - J | .01 |
Net asset value, end of period | $ 14.67 | $ 15.22 | $ 15.66 | $ 13.31 |
Total Return B,C | (2.90)% | (1.50)% | 18.39% | 33.10% |
Ratios to Average Net Assets E,I | | | | |
Expenses before reductions | 1.04% | 1.03% | 1.09% | 1.36% A |
Expenses net of fee waivers, if any | 1.04% | 1.03% | 1.09% | 1.25% A |
Expenses net of all reductions | 1.03% | 1.03% | 1.07% | 1.23% A |
Net investment income (loss) | 1.10% | .99% | 1.64% G | .10% A |
Supplemental Data | | | | |
Net assets, end of period (000 omitted) | $ 50,540 | $ 58,925 | $ 35,739 | $ 9,811 |
Portfolio turnover rate F | 91% | 71% | 54% | 25% A |
A Annualized
B Total returns for periods of less than one year are not annualized.
C Total returns would have been lower if certain expenses had not been reduced during the applicable periods shown.
D Calculated based on average shares outstanding during the period.
E Fees and expenses of any underlying Fidelity Central Funds are not included in the Fund's expense ratio. The Fund indirectly bears its proportionate share of the expenses of any underlying Fidelity Central Funds.
F Amount does not include the portfolio activity of any underlying Fidelity Central Funds.
G Investment income per share reflects a large, non-recurring dividend which amounted to $.13 per share. Excluding this non-recurring dividend, the ratio of net investment income (loss) to average net assets would have been .71%.
H For the period March 25, 2009 (commencement of operations) to October 31, 2009.
I Expense ratios reflect operating expenses of the class. Expenses before reductions do not reflect amounts reimbursed by the investment adviser or reductions from brokerage service arrangements or reductions from other expense offset arrangements and do not represent the amount paid by the class during periods when reimbursements or reductions occur. Expense ratios before reductions for start-up periods may not be representative of longer-term operating periods. Expenses net of fee waivers reflect expenses after reimbursement by the investment adviser but prior to reductions from brokerage service arrangements or other expense offset arrangements. Expenses net of all reductions represent the net expenses paid by the class.
J Amount represents less than $.01 per share.
K Total distributions of $.11 per share is comprised of distributions from net investment income of $.093 and distributions from net realized gain of $.014 per share.
See accompanying notes which are an integral part of the financial statements.
Annual Report
Notes to Financial Statements
For the period ended October 31, 2012
1. Organization.
Fidelity® Global Commodity Stock Fund (the Fund) is a non-diversified fund of Fidelity Investment Trust (the Trust) and is authorized to issue an unlimited number of shares. The Trust is registered under the Investment Company Act of 1940, as amended (the 1940 Act), as an open-end management investment company organized as a Massachusetts business trust. The Fund offers Class A, Class T, Class C, Global Commodity Stock and Institutional Class shares, each of which, along with Class B shares, has equal rights as to assets and voting privileges. Effective after the close of business on September 1, 2010, Class B shares were closed to new accounts and additional purchases, except for exchanges and reinvestments. Each class has exclusive voting rights with respect to matters that affect that class. Class B shares will automatically convert to Class A shares after a holding period of seven years from the initial date of purchase. Investment income, realized and unrealized capital gains and losses, the common expenses of the Fund, and certain fund-level expense reductions, if any, are allocated on a pro-rata basis to each class based on the relative net assets of each class to the total net assets of the Fund. Each class differs with respect to transfer agent and distribution and service plan fees incurred. Certain expense reductions may also differ by class. The Fund's investments in emerging markets can be subject to social, economic, regulatory, and political uncertainties and can be extremely volatile.
2. Investments in Fidelity Central Funds.
The Fund invests in Fidelity Central Funds, which are open-end investment companies available only to other investment companies and accounts managed by Fidelity Management & Research Company (FMR) and its affiliates. The Fund's Schedule of Investments lists each of the Fidelity Central Funds held as of period end, if any, as an investment of the Fund, but does not include the underlying holdings of each Fidelity Central Fund. As an Investing Fund, the Fund indirectly bears its proportionate share of the expenses of the underlying Fidelity Central Funds.
The Money Market Central Funds seek preservation of capital and current income and are managed by Fidelity Investments Money Management, Inc. (FIMM), an affiliate of FMR.
A complete unaudited list of holdings for each Fidelity Central Fund is available upon request or at the Securities and Exchange Commission (the SEC) web site at www.sec.gov. In addition, the financial statements of the Fidelity Central Funds, which are not covered by the Fund's Report of Independent Registered Public Accounting Firm, are available on the SEC web site or upon request.
Annual Report
Notes to Financial Statements - continued
3. Significant Accounting Policies.
The financial statements have been prepared in conformity with accounting principles generally accepted in the United States of America (GAAP), which require management to make certain estimates and assumptions at the date of the financial statements. Actual results could differ from those estimates. Subsequent events, if any, through the date that the financial statements were issued have been evaluated in the preparation of the financial statements. The following summarizes the significant accounting policies of the Fund:
Security Valuation. Investments are valued as of 4:00 p.m. Eastern time on the last calendar day of the period. In accordance with valuation policies and procedures approved by the Board of Trustees (the Board), the Fund attempts to obtain prices from one or more third party pricing vendors or brokers to value its investments. When current market prices, quotations or rates are not readily available or reliable, securities will be fair valued in good faith by the FMR Fair Value Committee (the Committee), in accordance with procedures adopted by the Fund's Board. Factors used in determining fair value vary by security type and may include market or security specific events. The frequency with which these procedures are used cannot be predicted and they may be utilized to a significant extent. The Committee oversees the Fund's valuation policies and procedures and is responsible for approving and reporting to the Board all fair value determinations.
The Fund categorizes the inputs to valuation techniques used to value its investments into a disclosure hierarchy consisting of three levels as shown below:
Level 1 - quoted prices in active markets for identical investments
Level 2 - other significant observable inputs (including quoted prices for similar investments, interest rates, prepayment speeds, etc.)
Level 3 - unobservable inputs (including the Fund's own assumptions based on the best information available)
Valuation techniques used to value the Fund's investments by major category are as follows:
Equity securities, including restricted securities, for which market quotations are readily available, are valued at the last reported sale price or official closing price as reported by a third party pricing vendor on the primary market or exchange on which they are traded and are categorized as Level 1 in the hierarchy. In the event there were no sales during the day or closing prices are not available, securities are valued at the last quoted bid price or may be valued using the last available price and are generally categorized as Level 2 in the hierarchy. For foreign equity securities, when significant market or security specific events arise, comparisons to the valuation of American Depositary Receipts
Annual Report
3. Significant Accounting Policies - continued
Security Valuation - continued
(ADRs), futures contracts, Exchange-Traded Funds (ETFs) and certain indexes as well as quoted prices for similar securities are used and are categorized as Level 2 in the hierarchy. Utilizing these techniques may result in transfers between Level 1 and Level 2.
Investments in open-end mutual funds, including the Fidelity Central Funds, are valued at their closing net asset value (NAV) each business day and are categorized as Level 1 in the hierarchy.
Changes in valuation techniques may result in transfers in or out of an assigned level within the disclosure hierarchy. The aggregate value of investments by input level, as of October 31, 2012, including information on transfers between Levels 1 and 2, is included at the end of the Fund's Schedule of Investments.
Foreign Currency Translation. The Fund may use foreign currency contracts to facilitate transactions in foreign-denominated securities. Gains and losses from these transactions may arise from changes in the value of the foreign currency or if the counterparties do not perform under the contracts' terms.
Foreign-denominated assets, including investment securities, and liabilities are translated into U.S. dollars at the exchange rates at period end. Purchases and sales of investment securities, income and dividends received and expenses denominated in foreign currencies are translated into U.S. dollars at the exchange rate in effect on the transaction date.
The effects of exchange rate fluctuations on investments are included with the net realized and unrealized gain (loss) on investment securities. Other foreign currency transactions resulting in realized and unrealized gain (loss) are disclosed separately.
Investment Transactions and Income. For financial reporting purposes, the Fund's investment holdings and NAV include trades executed through the end of the last business day of the period. The NAV per share for processing shareholder transactions is calculated as of the close of business of the New York Stock Exchange (NYSE), normally 4:00 p.m. Eastern time and includes trades executed through the end of the prior business day. Gains and losses on securities sold are determined on the basis of identified cost. Dividend income is recorded on the ex-dividend date, except for certain dividends from foreign securities where the ex-dividend date may have passed, which are recorded as soon as the Fund is informed of the ex-dividend date. Non-cash dividends included in dividend income, if any, are recorded at the fair market value of the securities received. Distributions received on securities that represent a return of capital or capital gain are recorded as a reduction of cost of investments and/or as a realized gain. The Fund
Annual Report
Notes to Financial Statements - continued
3. Significant Accounting Policies - continued
Investment Transactions and Income - continued
estimates the components of distributions received that may be considered return of capital distributions or capital gain distributions. Interest income and distributions from the Fidelity Central Funds are accrued as earned. Interest income includes coupon interest and amortization of premium and accretion of discount on debt securities. Investment income is recorded net of foreign taxes withheld where recovery of such taxes is uncertain.
Expenses. Expenses directly attributable to a fund are charged to that fund. Expenses attributable to more than one fund are allocated among the respective funds on the basis of relative net assets or other appropriate methods. Expense estimates are accrued in the period to which they relate and adjustments are made when actual amounts are known.
Income Tax Information and Distributions to Shareholders. Each year, the Fund intends to qualify as a regulated investment company under Subchapter M of the Internal Revenue Code, including distributing substantially all of its taxable income and realized gains. As a result, no provision for income taxes is required. As of October 31, 2012, the Fund did not have any unrecognized tax benefits in the financial statements; nor is the Fund aware of any tax positions for which it is reasonably possible that the total amounts of unrecognized tax benefits will significantly change in the next twelve months. The Fund files a U.S. federal tax return, in addition to state and local tax returns as required. A fund's federal income tax returns are subject to examination by the Internal Revenue Service (IRS) for a period of three fiscal years after they are filed. State and local tax returns may be subject to examination for an additional fiscal year depending on the jurisdiction. Foreign taxes are provided for based on the Fund's understanding of the tax rules and rates that exist in the foreign markets in which it invests.
Distributions are declared and recorded on the ex-dividend date. Income dividends and capital gain distributions are declared separately for each class. Income and capital gain distributions are determined in accordance with income tax regulations, which may differ from GAAP. In addition, the Fund claimed a portion of the payment made to redeeming shareholders as a distribution for income tax purposes.
Capital accounts within the financial statements are adjusted for permanent book-tax differences. These adjustments have no impact on net assets or the results of operations. Temporary book-tax differences will reverse in a subsequent period.
Book-tax differences are primarily due to foreign currency transactions, certain foreign taxes, passive foreign investment companies (PFIC), partnerships, capital loss carryforwards and losses deferred due to wash sales.
Annual Report
3. Significant Accounting Policies - continued
Income Tax Information and Distributions to Shareholders - continued
The federal tax cost of investment securities and unrealized appreciation (depreciation) as of period end were as follows:
Gross unrealized appreciation | $ 39,956,815 |
Gross unrealized depreciation | (75,456,352) |
Net unrealized appreciation (depreciation) on securities and other investments | $ (35,499,537) |
| |
Tax Cost | $ 639,864,268 |
The tax-based components of distributable earnings as of period end were as follows:
Undistributed ordinary income | $ 4,752,569 |
Capital loss carryforward | $ (33,159,492) |
Net unrealized appreciation (depreciation) | $ (35,507,387) |
Capital loss carryforwards are only available to offset future capital gains of the Fund to the extent provided by regulations and may be limited. Under the Regulated Investment Company Modernization Act of 2010 (the Act), the Fund is permitted to carry forward capital losses incurred in taxable years beginning after December 22, 2010 for an unlimited period and such capital losses are required to be used prior to any losses that expire. Capital loss carryforwards were as follows:
Fiscal year of expiration | |
2019 | $ (6,952,413) |
No expiration | |
Short-term | (26,207,079) |
Total capital loss carryforward | $ (33,159,492) |
The tax character of distributions paid was as follows:
| October 31, 2012 | October 31, 2011 |
Ordinary Income | $ 4,364,384 | $ 5,112,665 |
Long-term Capital Gains | - | 2,037,448 |
Total | $ 4,364,384 | $ 7,150,113 |
Annual Report
Notes to Financial Statements - continued
3. Significant Accounting Policies - continued
Short-Term Trading (Redemption) Fees. Shares held by investors in the Fund less than 30 days are subject to a redemption fee equal to 1.00% of the net asset value of shares redeemed. All redemption fees, which reduce the proceeds of the shareholder redemption, are retained by the Fund and accounted for as an addition to paid in capital.
Restricted Securities. The Fund may invest in securities that are subject to legal or contractual restrictions on resale. These securities generally may be resold in transactions exempt from registration or to the public if the securities are registered. Disposal of these securities may involve time-consuming negotiations and expense, and prompt sale at an acceptable price may be difficult. Information regarding restricted securities is included at the end of the Fund's Schedule of Investments.
New Accounting Pronouncement. In December 2011, the Financial Accounting Standards Board issued Accounting Standard Update No. 2011-11, Disclosures about Offsetting Assets and Liabilities. The update creates new disclosure requirements requiring entities to disclose both gross and net information for derivatives and other financial instruments that are either offset in the Statement of Assets and Liabilities or subject to an enforceable master netting arrangement or similar agreement. The disclosure requirements are effective for annual reporting periods beginning on or after January 1, 2013, and interim periods within those annual periods. Management is currently evaluating the impact of the update's adoption on the Fund's financial statement disclosures.
4. Purchases and Sales of Investments.
Purchases and sales of securities, other than short-term securities, aggregated $608,021,633 and $755,930,501, respectively.
5. Fees and Other Transactions with Affiliates.
Management Fee. FMR and its affiliates provide the Fund with investment management related services for which the Fund pays a monthly management fee. The management fee is the sum of an individual fund fee rate that is based on an annual rate of .45% of the Fund's average net assets and an annualized group fee rate that averaged .26% during the period. The group fee rate is based upon the average net assets of all the mutual funds advised by FMR. The group fee rate decreases as assets under management increase and increases as assets under management decrease. For the period, the total annual management fee rate was .71% of the Fund's average net assets.
Annual Report
5. Fees and Other Transactions with Affiliates - continued
Distribution and Service Plan Fees. In accordance with Rule 12b-1 of the 1940 Act, the Fund has adopted separate Distribution and Service Plans for each class of shares. Certain classes pay Fidelity Distributors Corporation (FDC), an affiliate of FMR, separate Distribution and Service Fees, each of which is based on an annual percentage of each class' average net assets. In addition, FDC may pay financial intermediaries for selling shares of the Fund and providing shareholder support services. For the period, the Distribution and Service Fee rates, total fees and amounts retained by FDC were as follows:
| Distribution
Fee | Service
Fee | Total Fees | Retained
by FDC |
Class A | -% | .25% | $ 280,172 | $ 5,920 |
Class T | .25% | .25% | 93,536 | 148 |
Class B | .75% | .25% | 36,080 | 27,074 |
Class C | .75% | .25% | 339,566 | 113,885 |
| | | $ 749,354 | $ 147,027 |
Sales Load. FDC may receive a front-end sales charge of up to 5.75% for selling Class A shares and 3.50% for selling Class T shares, some of which is paid to financial intermediaries for selling shares of the Fund. Depending on the holding period, FDC may receive contingent deferred sales charges levied on Class A, Class T, Class B, and Class C redemptions. The deferred sales charges range from 5.00% to 1.00% for Class B shares, 1.00% for Class C shares, 1.00% for certain purchases of Class A shares and .25% for certain purchases of Class T shares.
For the period, sales charge amounts retained by FDC were as follows:
| Retained
by FDC |
Class A | $ 36,090 |
Class T | 5,451 |
Class B* | 24,757 |
Class C* | 11,858 |
| $ 78,156 |
* When Class B and Class C shares are initially sold, FDC pays commissions from its own resources to financial intermediaries through which the sales are made.
Annual Report
Notes to Financial Statements - continued
5. Fees and Other Transactions with Affiliates - continued
Transfer Agent Fees. Fidelity Investments Institutional Operations Company, Inc. (FIIOC), an affiliate of FMR, is the transfer, dividend disbursing and shareholder servicing agent for each class of the Fund. FIIOC receives account fees and asset-based fees that vary according to the account size and type of account of the shareholders of the respective classes of the Fund. FIIOC pays for typesetting, printing and mailing of shareholder reports, except proxy statements. For the period, transfer agent fees for each class were as follows:
| Amount | % of
Average
Net Assets |
Class A | $ 321,673 | .29 |
Class T | 56,848 | .30 |
Class B | 10,811 | .30 |
Class C | 101,040 | .30 |
Global Commodity Stock | 1,331,070 | .30 |
Institutional Class | 124,928 | .24 |
| $ 1,946,370 | |
Accounting and Security Lending Fees. Fidelity Service Company, Inc. (FSC), an affiliate of FMR, maintains the Fund's accounting records. The accounting fee is based on the level of average net assets for each month. Under a separate contract, FSC administers the security lending program. The security lending fee is based on the number and duration of lending transactions.
Brokerage Commissions. The Fund placed a portion of its portfolio transactions with brokerage firms which are affiliates of the investment adviser. The commissions paid to these affiliated firms were $6,902 for the period.
Interfund Lending Program. Pursuant to an Exemptive Order issued by the SEC, the Fund, along with other registered investment companies having management contracts with FMR, may participate in an interfund lending program. This program provides an alternative credit facility allowing the funds to borrow from, or lend money to, other participating affiliated funds. At period end, there were no interfund loans outstanding. The Fund's activity in this program during the period for which loans were outstanding was as follows:
Borrower or Lender | Average Loan
Balance | Weighted Average Interest Rate | Interest Expense |
Borrower | $ 2,814,765 | .41% | $ 1,098 |
Annual Report
6. Committed Line of Credit.
The Fund participates with other funds managed by FMR or an affiliate in a $4.25 billion credit facility (the "line of credit") to be utilized for temporary or emergency purposes to fund shareholder redemptions or for other short-term liquidity purposes. The Fund has agreed to pay commitment fees on its pro-rata portion of the line of credit, which amounted to $1,897 and is reflected in Miscellaneous expenses on the Statement of Operations. During the period, there were no borrowings on this line of credit.
7. Security Lending.
The Fund lends portfolio securities through a lending agent from time to time in order to earn additional income. For equity securities, a lending agent is used and may loan securities to certain qualified borrowers, including Fidelity Capital Markets (FCM), a broker-dealer affiliated with the Fund. On the settlement date of the loan, the Fund receives collateral (in the form of U.S. Treasury obligations, letters of credit and/or cash) against the loaned securities and maintains collateral in an amount not less than 100% of the market value of the loaned securities during the period of the loan. The market value of the loaned securities is determined at the close of business of the Fund and any additional required collateral is delivered to the Fund on the next business day. If the borrower defaults on its obligation to return the securities loaned because of insolvency or other reasons, a fund could experience delays and costs in recovering the securities loaned or in gaining access to the collateral. Any cash collateral received is invested in the Fidelity Securities Lending Cash Central Fund. The value of loaned securities and cash collateral at period end are disclosed on the Fund's Statement of Assets and Liabilities. Security lending income represents the income earned on investing cash collateral, less rebates paid to borrowers and any lending agent fees associated with the loan, plus any premium payments received for lending certain types of securities. Security lending income is presented in the Statement of Operations as a component of income from Fidelity Central Funds. Total security lending income during the period amounted to $447,820. During the period, there were no securities loaned to FCM.
8. Bank Borrowings.
The Fund is permitted to have bank borrowings for temporary or emergency purposes to fund shareholder redemptions or for other short-term liquidity requirements. The Fund has established borrowing arrangements with certain banks. The interest rate on the borrowings is the bank's base rate, as revised from time to time. The average loan balance during the period for which loans were outstanding amounted to $1,543,000. The weighted average interest rate was .66%. The interest expense amounted to $57 under the bank borrowing program. At period end, there were no bank borrowings outstanding.
Annual Report
Notes to Financial Statements - continued
9. Expense Reductions.
Many of the brokers with whom FMR places trades on behalf of the Fund provided services to the Fund in addition to trade execution. These services included payments of certain expenses on behalf of the Fund totaling $50,515 for the period.
10. Distributions to Shareholders.
Distributions to shareholders of each class were as follows:
Years ended October 31, | 2012 | 2011 |
From net investment income | | |
Class A | $ 437,422 | $ 597,144 |
Class T | 12,232 | 82,038 |
Class C | - | 56,214 |
Global Commodity Stock | 2,878,965 | 3,895,270 |
Institutional Class | 364,302 | 414,647 |
Total | $ 3,692,921 | $ 5,045,313 |
From net realized gain | | |
Class A | $ 117,768 | $ 275,211 |
Class T | 19,027 | 52,381 |
Class B | - | 16,866 |
Class C | - | 68,717 |
Global Commodity Stock | 479,827 | 1,532,256 |
Institutional Class | 54,841 | 159,369 |
Total | $ 671,463 | $ 2,104,800 |
11. Share Transactions.
Transactions for each class of shares were as follows:
| Shares | Dollars |
Years ended October 31, | 2012 | 2011 | 2012 | 2011 |
Class A | | | | |
Shares sold | 1,675,922 | 7,297,574 | $ 24,194,276 | $ 124,882,197 |
Reinvestment of distributions | 32,805 | 39,060 | 472,060 | 643,900 |
Shares redeemed | (3,329,384) | (2,752,883) | (47,357,051) | (44,565,640) |
Net increase (decrease) | (1,620,657) | 4,583,751 | $ (22,690,715) | $ 80,960,457 |
Class T | | | | |
Shares sold | 189,622 | 866,549 | $ 2,764,209 | $ 14,740,169 |
Reinvestment of distributions | 1,948 | 7,294 | 28,015 | 120,226 |
Shares redeemed | (424,718) | (249,100) | (6,023,857) | (4,030,489) |
Net increase (decrease) | (233,148) | 624,743 | $ (3,231,633) | $ 10,829,906 |
Annual Report
11. Share Transactions - continued
| Shares | Dollars |
Years ended October 31, | 2012 | 2011 | 2012 | 2011 |
Class B | | | | |
Shares sold | 7,831 | 82,231 | $ 113,787 | $ 1,397,980 |
Reinvestment of distributions | - | 917 | - | 14,988 |
Shares redeemed | (81,206) | (76,244) | (1,157,702) | (1,237,701) |
Net increase (decrease) | (73,375) | 6,904 | $ (1,043,915) | $ 175,267 |
Class C | | | | |
Shares sold | 492,632 | 2,215,036 | $ 7,143,884 | $ 37,885,797 |
Reinvestment of distributions | - | 6,435 | - | 105,874 |
Shares redeemed | (761,541) | (662,765) | (10,673,957) | (10,246,197) |
Net increase (decrease) | (268,909) | 1,558,706 | $ (3,530,073) | $ 27,745,474 |
Global Commodity Stock | | | | |
Shares sold | 7,606,851 | 32,339,719 | $ 109,989,271 | $ 553,926,075 |
Reinvestment of distributions | 210,059 | 293,921 | 3,031,159 | 4,855,462 |
Shares redeemed | (16,330,927) | (17,519,084) | (233,733,610) | (288,860,403) |
Net increase (decrease) | (8,514,017) | 15,114,556 | $ (120,713,180) | $ 269,921,134 |
Institutional Class | | | | |
Shares sold | 1,589,148 | 4,225,113 | $ 22,944,496 | $ 72,109,877 |
Reinvestment of distributions | 18,526 | 16,850 | 267,335 | 278,352 |
Shares redeemed | (2,034,602) | (2,651,317) | (28,631,896) | (43,491,555) |
Net increase (decrease) | (426,928) | 1,590,646 | $ (5,420,065) | $ 28,896,674 |
12. Other.
The Fund's organizational documents provide former and current trustees and officers with a limited indemnification against liabilities arising in connection with the performance of their duties to the Fund. In the normal course of business, the Fund may also enter into contracts that provide general indemnifications. The Fund's maximum exposure under these arrangements is unknown as this would be dependent on future claims that may be made against the Fund. The risk of material loss from such claims is considered remote.
At the end of the period, FMR or its affiliates were the owners of record of 13% of the total outstanding shares of the Fund.
Annual Report
To the Trustees of Fidelity Investment Trust and the Shareholders of Fidelity Global Commodity Stock Fund:
In our opinion, the accompanying statement of assets and liabilities, including the schedule of investments, and the related statements of operations and of changes in net assets and the financial highlights present fairly, in all material respects, the financial position of Fidelity Global Commodity Stock Fund (a fund of Fidelity Investment Trust) at October 31, 2012, the results of its operations for the year then ended, the changes in its net assets for each of the two years in the period then ended and the financial highlights for each of the periods indicated, in conformity with accounting principles generally accepted in the United States of America. These financial statements and financial highlights (hereafter referred to as "financial statements") are the responsibility of the Fidelity Global Commodity Stock Fund's management. Our responsibility is to express an opinion on these financial statements based on our audits. We conducted our audits of these financial statements in accordance with the standards of the Public Company Accounting Oversight Board (United States). Those standards require that we plan and perform the audit to obtain reasonable assurance about whether the financial statements are free of material misstatement. An audit includes examining, on a test basis, evidence supporting the amounts and disclosures in the financial statements, assessing the accounting principles used and significant estimates made by management, and evaluating the overall financial statement presentation. We believe that our audits, which included confirmation of securities at October 31, 2012 by correspondence with the custodian and brokers, provide a reasonable basis for our opinion.
PricewaterhouseCoopers LLP
Boston, Massachusetts
December 14, 2012
Annual Report
The Trustees, Members of the Advisory Board, and executive officers of the trust and fund, as applicable, are listed below. The Board of Trustees governs the fund and is responsible for protecting the interests of shareholders. The Trustees are experienced executives who meet periodically throughout the year to oversee the fund's activities, review contractual arrangements with companies that provide services to the fund, oversee management of the risks associated with such activities and contractual arrangements, and review the fund's performance. Except for James C. Curvey, each of the Trustees oversees 236 funds advised by FMR or an affiliate. Mr. Curvey oversees 443 funds advised by FMR or an affiliate.
The Trustees hold office without limit in time except that (a) any Trustee may resign; (b) any Trustee may be removed by written instrument, signed by at least two-thirds of the number of Trustees prior to such removal; (c) any Trustee who requests to be retired or who has become incapacitated by illness or injury may be retired by written instrument signed by a majority of the other Trustees; and (d) any Trustee may be removed at any special meeting of shareholders by a two-thirds vote of the outstanding voting securities of the trust. Each Trustee who is not an interested person (as defined in the 1940 Act) (Independent Trustee), shall retire not later than the last day of the calendar year in which his or her 75th birthday occurs. The Independent Trustees may waive this mandatory retirement age policy with respect to individual Trustees. The executive officers and Advisory Board Members hold office without limit in time, except that any officer and Advisory Board Member may resign or may be removed by a vote of a majority of the Trustees at any regular meeting or any special meeting of the Trustees. Except as indicated, each individual has held the office shown or other offices in the same company for the past five years.
Experience, Skills, Attributes, and Qualifications of the Fund's Trustees. The Governance and Nominating Committee has adopted a statement of policy that describes the experience, qualifications, attributes, and skills that are necessary and desirable for potential Independent Trustee candidates (Statement of Policy). The Board believes that each Trustee satisfied at the time he or she was initially elected or appointed a Trustee, and continues to satisfy, the standards contemplated by the Statement of Policy. The Governance and Nominating Committee also engages professional search firms to help identify potential Independent Trustee candidates who have the experience, qualifications, attributes, and skills consistent with the Statement of Policy. From time to time, additional criteria based on the composition and skills of the current Independent Trustees, as well as experience or skills that may be appropriate in light of future changes to board composition, business conditions, and regulatory or other developments, have also been considered by the professional search firms and the Governance and Nominating Committee. In addition, the Board takes into account the Trustees' commitment and participation in Board and committee meetings, as well as their leadership of standing and ad hoc committees throughout their tenure.
In determining that a particular Trustee was and continues to be qualified to serve as a Trustee, the Board has considered a variety of criteria, none of which, in isolation, was controlling. The Board believes that, collectively, the Trustees have balanced and diverse experience, qualifications, attributes, and skills, which allow the Board to operate effectively in governing the fund and protecting the interests of shareholders. Information about the specific experience, skills, attributes, and qualifications of each Trustee, which in each case led to the Board's conclusion that the Trustee should serve (or continue to serve) as a trustee of the fund, is provided below.
Annual Report
Trustees and Officers - continued
Board Structure and Oversight Function. James C. Curvey is an interested person (as defined in the 1940 Act) and currently serves as Chairman. The Trustees have determined that an interested Chairman is appropriate and benefits shareholders because an interested Chairman has a personal and professional stake in the quality and continuity of services provided to the fund. Independent Trustees exercise their informed business judgment to appoint an individual of their choosing to serve as Chairman, regardless of whether the Trustee happens to be independent or a member of management. The Independent Trustees have determined that they can act independently and effectively without having an Independent Trustee serve as Chairman and that a key structural component for assuring that they are in a position to do so is for the Independent Trustees to constitute a substantial majority for the Board. The Independent Trustees also regularly meet in executive session. Ned C. Lautenbach serves as Chairman of the Independent Trustees and as such (i) acts as a liaison between the Independent Trustees and management with respect to matters important to the Independent Trustees and (ii) with management prepares agendas for Board meetings.
Fidelity funds are overseen by different Boards of Trustees. The fund's Board oversees Fidelity's equity and high income funds and another Board oversees Fidelity's investment-grade bond, money market, and asset allocation funds. The asset allocation funds may invest in Fidelity funds overseen by the fund's Board. The use of separate Boards, each with its own committee structure, allows the Trustees of each group of Fidelity funds to focus on the unique issues of the funds they oversee, including common research, investment, and operational issues. On occasion, the separate Boards establish joint committees to address issues of overlapping consequences for the Fidelity funds overseen by each Board.
The Trustees operate using a system of committees to facilitate the timely and efficient consideration of all matters of importance to the Trustees, the fund, and fund shareholders and to facilitate compliance with legal and regulatory requirements and oversight of the fund's activities and associated risks. The Board, acting through its committees, has charged FMR and its affiliates with (i) identifying events or circumstances the occurrence of which could have demonstrably adverse effects on the fund's business and/or reputation; (ii) implementing processes and controls to lessen the possibility that such events or circumstances occur or to mitigate the effects of such events or circumstances if they do occur; and (iii) creating and maintaining a system designed to evaluate continuously business and market conditions in order to facilitate the identification and implementation processes described in (i) and (ii) above. Because the day-to-day operations and activities of the fund are carried out by or through FMR, its affiliates and other service providers, the fund's exposure to risks is mitigated but not eliminated by the processes overseen by the Trustees. While each of the Board's committees has responsibility for overseeing different aspects of the fund's activities, oversight is exercised primarily through the Operations, Audit, and Compliance Committees. In addition, the Independent Trustees have worked with FMR to enhance the Board's oversight of investment and financial risks, legal and regulatory risks, technology risks, and operational risks, including the development of additional risk reporting to the Board. For example, a working group comprised of Independent Trustees and FMR has worked and continues to work to review the Fidelity funds' valuation-related activities, reporting and risk management. Appropriate personnel, including but not limited to the fund's Chief Compliance Officer (CCO), FMR's internal auditor, the independent accountants, the fund's Treasurer and portfolio management personnel, make periodic reports to the Board's committees, as appropriate, including an annual review of FMR's risk management program for the Fidelity funds. The responsibilities of each standing committee, including their oversight responsibilities, are described further under "Standing Committees of the Fund's Trustees."
Annual Report
The fund's Statement of Additional Information (SAI) includes more information about the Trustees. To request a free copy, call Fidelity at 1-877-208-0098.
Interested Trustees*:
Correspondence intended for each Trustee who is an interested person may be sent to Fidelity Investments, 82 Devonshire Street, Boston, Massachusetts 02109.
Name, Age; Principal Occupations and Other Relevant Experience+ |
James C. Curvey (77) |
| Year of Election or Appointment: 2007 Mr. Curvey is Trustee and Chairman of the Board of Trustees of certain Trusts. Mr. Curvey also serves as Trustee (2007-present) of other investment companies advised by FMR. Mr. Curvey is a Director of Fidelity Investments Money Management, Inc. (2009-present), Director of Fidelity Research & Analysis Co. (2009-present) and Director of FMR and FMR Co., Inc. (2007-present). Mr. Curvey is also Vice Chairman (2007-present) and Director of FMR LLC. In addition, Mr. Curvey serves as an Overseer for the Boston Symphony Orchestra and a member of the Trustees of Villanova University. Previously, Mr. Curvey was the Vice Chairman (2006-2007) and Director (2000-2007) of FMR Corp. |
Ronald P. O'Hanley (55) |
| Year of Election or Appointment: 2011 Mr. O'Hanley is Director of FMR Co., Inc. (2010-present), Director of Fidelity Investments Money Management, Inc. (2010-present), Director of Fidelity Research & Analysis Company (2010-present), President of Fidelity Asset Management and Corporate Services and a member of Fidelity's Executive Committee (2010-present). Previously, Mr. O'Hanley served as President and Chief Executive Officer of BNY Mellon Asset Management (2007-2010). Mr. O'Hanley also served as Vice Chairman of Bank New York Mellon Corp. and a member of that firm's Executive Committee. Prior to the 2007 merger of The Bank of New York and Mellon Financial Corporation, he was Vice Chairman of Mellon Financial Corporation and President and Chief Executive Officer of Mellon Asset Management. He joined Mellon in February 1997. Mr. O'Hanley currently serves as Chairman of the Boston Public Library Foundation Board of Directors and sits on the Board of Directors of Beth Israel Deaconess Medical Center, the Board of Trustees of the Marine Biological Laboratory and the Advisory Board of the Maxwell School of Citizenship and Public Administration at Syracuse University. Mr. O'Hanley also chairs the Council on Asset Management for the Financial Services Roundtable and is a member of the Board of Directors of Institutional Investor's U.S. Institute. |
* Trustees have been determined to be "Interested Trustees" by virtue of, among other things, their affiliation with the trust or various entities under common control with FMR.
+ The information above includes each Trustee's principal occupation during the last five years and other information relating to the experience, attributes, and skills relevant to each Trustee's qualifications to serve as a Trustee, which led to the conclusion that each Trustee should serve as a Trustee for the fund.
Annual Report
Independent Trustees:
Correspondence intended for each Independent Trustee (that is, the Trustees other than the Interested Trustees) may be sent to Fidelity Investments, P.O. Box 55235, Boston, Massachusetts 02205-5235.
Name, Age; Principal Occupations and Other Relevant Experience+ |
Dennis J. Dirks (64) |
| Year of Election or Appointment: 2005 Prior to his retirement in May 2003, Mr. Dirks was Chief Operating Officer and a member of the Board of The Depository Trust & Clearing Corporation (DTCC). He also served as President, Chief Operating Officer, and Board member of The Depository Trust Company (DTC) and President and Board member of the National Securities Clearing Corporation (NSCC). In addition, Mr. Dirks served as Chief Executive Officer and Board member of the Government Securities Clearing Corporation, Chief Executive Officer and Board member of the Mortgage-Backed Securities Clearing Corporation, as a Trustee and a member of the Finance Committee of Manhattan College (2005-2008), and as a Trustee and a member of the Finance Committee of AHRC of Nassau County (2006-2008). Mr. Dirks is a member of the Independent Directors Council (IDC) Governing Council (2010-present) and Board of Directors for The Brookville Center for Children's Services, Inc. (2009-present). |
Alan J. Lacy (59) |
| Year of Election or Appointment: 2008 Mr. Lacy serves as Senior Adviser (2007-present) of Oak Hill Capital Partners, L.P. (private equity). Mr. Lacy also served as Chief Executive Officer (2000-2005) and Vice Chairman (2005-2006) of Sears Holdings Corporation and Sears, Roebuck and Co. (retail). In addition, Mr. Lacy serves as a member of the Board of Directors of Dave & Buster's Entertainment, Inc. (restaurant and entertainment complexes, 2010-present), Earth Fare, Inc. (retail grocery, 2012-present), The Hillman Companies, Inc. (hardware wholesalers, 2010-present), and Bristol-Myers Squibb Company (global pharmaceuticals, 2008-present). Mr. Lacy is a member of the Board of Trustees of The National Parks Conservation Association (2006-present). Previously, Mr. Lacy served as Chairman of the Board of Trustees of the National Parks Conservation Association (2008-2011) and as a member of the Board of Directors for the Western Union Company (global money transfer, 2006-2011). |
Ned C. Lautenbach (68) |
| Year of Election or Appointment: 2000 Mr. Lautenbach is Chairman of the Independent Trustees of the Equity and High Income Funds (2006-present). Mr. Lautenbach currently serves as the Lead Director of the Eaton Corporation Board of Directors (diversified industrial, 1997-present). Mr. Lautenbach is Chairman of the Board of Directors of the Philharmonic Center for the Arts in Naples, Florida (2012-present) and a member of the Council on Foreign Relations (1994-present). Previously, Mr. Lautenbach was a Partner/Advisory Partner at Clayton, Dubilier & Rice, LLC (private equity investment, 1998-2010), as well as a Director of Sony Corporation (2006-2007). |
Joseph Mauriello (68) |
| Year of Election or Appointment: 2008 Prior to his retirement in January 2006, Mr. Mauriello served in numerous senior management positions including Deputy Chairman and Chief Operating Officer (2004-2005), and Vice Chairman of Financial Services (2002-2004) of KPMG LLP US (professional services, 1965-2005). Mr. Mauriello currently serves as a member of the Board of Directors of XL Group plc. (global insurance and re-insurance, 2006-present). Previously, Mr. Mauriello served as a Director of the Hamilton Funds of the Bank of New York (2006-2007) and of Arcadia Resources Inc. (health care services and products, 2007-2012). |
Robert W. Selander (62) |
| Year of Election or Appointment: 2011 Previously, Mr. Selander served as a Member of the Advisory Board of Fidelity's Equity and High Income Funds (2011), Executive Vice Chairman (2010), Chief Executive Officer (2009-2010), and President and Chief Executive Officer (1997-2009) of Mastercard, Inc. |
Cornelia M. Small (68) |
| Year of Election or Appointment: 2005 Ms. Small is a member of the Board of Directors (2009-present) and Chair of the Investment Committee (2010-present) of the Teagle Foundation. Ms. Small also serves on the Investment Committee of the Berkshire Taconic Community Foundation (2008-present). Previously, Ms. Small served as Chairperson (2002-2008) and a member of the Investment Committee and Chairperson (2008-2012) and a member of the Board of Trustees of Smith College. In addition, Ms. Small served as Chief Investment Officer, Director of Global Equity Investments, and a member of the Board of Directors of Scudder, Stevens & Clark and Scudder Kemper Investments. |
William S. Stavropoulos (73) |
| Year of Election or Appointment: 2001 Mr. Stavropoulos is Vice Chairman of the Independent Trustees of the Equity and High Income Funds (2006-present). Mr. Stavropoulos serves as President and Founder of the Michigan Baseball Foundation, the Great Lakes Loons (2007-present). Mr. Stavropoulos is Chairman Emeritus of the Board of Directors of The Dow Chemical Company, where he previously served in numerous senior management positions, including President, CEO (1995-2000; 2002-2004), Chairman of the Executive Committee (2000-2006), and as a member of the Board of Directors (1990-2006). Currently, Mr. Stavropoulos is a Director of Univar Inc. (global distributor of commodity and specialty chemicals, Chairman from 2010-May 2012 and Lead Director from May 2012-present), Teradata Corporation (data warehousing and technology solutions, 2008-present), Maersk Inc. (industrial conglomerate), and Tyco International, Ltd. (multinational manufacturing and services, 2007-present), and a member of the Advisory Board for Metalmark Capital LLC (private equity investment, 2005-present). Mr. Stavropoulos is an operating advisor to Clayton, Dubilier & Rice, LLC (private equity investment). In addition, Mr. Stavropoulos is a member of the University of Notre Dame Advisory Council for the College of Science, a Trustee of the Rollin L. Gerstacker Foundation, and a Director of the Naples Philharmonic Center for the Arts. Previously, Mr. Stavropoulos served as a Director of Chemical Financial Corporation (bank holding company, 1993-2012). |
David M. Thomas (63) |
| Year of Election or Appointment: 2008 Previously, Mr. Thomas served as Executive Chairman (2005-2006) and Chairman and Chief Executive Officer (2000-2005) of IMS Health, Inc. (pharmaceutical and healthcare information solutions), and a Director of Fortune Brands, Inc. (consumer products, 2000-2011). In addition, Mr. Thomas serves as Non-Executive Chairman of the Board of Directors of Fortune Brands Home and Security (home and security products, 2011-present), and as a member of the Board of Directors of Interpublic Group of Companies, Inc. (marketing communication, 2004-present). |
Michael E. Wiley (62) |
| Year of Election or Appointment: 2008 Mr. Wiley also serves as a Director of Asia Pacific Exploration Consolidated (international oil and gas exploration and production, 2008-present). Mr. Wiley serves as a Director of Tesoro Corporation (independent oil refiner and marketer, 2005-present), and a Director of Bill Barrett Corporation (exploration and production, 2005-present). In addition, Mr. Wiley also serves as a Director of Post Oak Bank (privately-held bank, 2004-present). Previously, Mr. Wiley served as a member of the Board of Trustees of the University of Tulsa (2000-2006; 2007-2010), as a Senior Energy Advisor of Katzenbach Partners, LLC (consulting, 2006-2007), as an Advisory Director of Riverstone Holdings (private investment), Chairman, President, and CEO of Baker Hughes, Inc. (oilfield services, 2000-2004), and as Director of Spinnaker Exploration Company (exploration and production, 2001-2005). |
+ The information above includes each Trustee's principal occupation during the last five years and other information relating to the experience, attributes, and skills relevant to each Trustee's qualifications to serve as a Trustee, which led to the conclusion that each Trustee should serve as a Trustee for the fund.
Advisory Board Members and Executive Officers:
Correspondence intended for David A. Rosow and Garnett A. Smith may be sent to Fidelity Investments, P.O. Box 55235, Boston, Massachusetts 02205-5235. Correspondence intended for each executive officer, Edward C. Johnson 3d, and Peter S. Lynch may be sent to Fidelity Investments, 82 Devonshire Street, Boston, Massachusetts 02109.
Name, Age; Principal Occupation |
Edward C. Johnson 3d (82) |
| Year of Election or Appointment: 2011 Member of the Advisory Board of Fidelity's Equity and High Income Funds. Mr. Johnson serves as Chief Executive Officer, Chairman, and a Director of FMR LLC, and also serves as Chairman and Director of FIL Limited. Previously, Mr. Johnson served as a Trustee and Chairman of the Board of certain Fidelity Trusts, Chairman and a Director of FMR, Chairman and a Director of FMR Co., Inc., and President of FMR LLC (2006-2007). |
Peter S. Lynch (68) |
| Year of Election or Appointment: 2003 Member of the Advisory Board of Fidelity's Equity and High Income Funds. Mr. Lynch is Vice Chairman and a Director of FMR and FMR Co., Inc. In addition, Mr. Lynch serves as a Trustee of Boston College and as the Chairman of the Inner-City Scholarship Fund. Previously, Mr. Lynch served on the Special Olympics International Board of Directors (1997-2006). |
David A. Rosow (70) |
| Year of Election or Appointment: 2012 Member of the Advisory Board of Fidelity's Equity and High Income Funds. Chairman and Chief Executive Officer of International Golf Group, Inc. (golf course development, 1989-present). Previously, Mr. Rosow served as Chairman and Chief Executive Officer of Rosow & Company, Inc. (private investment company, 1989-2011), a Lead Director of Hudson United Bancorp (2001-2006) and as a Director of TD Banknorth (1996-2006). In addition, Mr. Rosow is a member (2008-present) and President (2009-present) of the Town Council of Palm Beach, Florida. |
Garnett A. Smith (65) |
| Year of Election or Appointment: 2012 Member of the Advisory Board of Fidelity's Equity and High Income Funds. Prior to Mr. Smith's retirement, he served as Chairman and Chief Executive Officer of Inbrand Corp. (manufacturer of personal absorbent products, 1990-1997). He also served as President (1986-1990) of Inbrand Corp. Prior to his employment with Inbrand Corp., he was employed by a retail fabric chain and North Carolina National Bank. In addition, Mr. Smith is a board member of the Jackson Hole Land Trust (2009-present). |
Kenneth B. Robins (43) |
| Year of Election or Appointment: 2008 President and Treasurer of Fidelity's Equity and High Income Funds. Mr. Robins also serves as President and Treasurer (2010-present) and Assistant Treasurer (2009-present) of other Fidelity funds and is an employee of Fidelity Investments (2004-present). Previously, Mr. Robins served as Deputy Treasurer of the Fidelity funds (2005-2008) and Treasurer and Chief Financial Officer of The North Carolina Capital Management Trust: Cash and Term Portfolios (2006-2008). |
Bruce T. Herring (47) |
| Year of Election or Appointment: 2006 Vice President of certain Equity Funds. Mr. Herring also serves as President of Fidelity Research & Analysis Company (2010-present), Chief Investment Officer and Director of Fidelity Management & Research (U.K.) Inc. (2010-present) and Group Chief Investment Officer of FMR. Previously, Mr. Herring served as Vice President (2005-2006) and Senior Vice President (2006-2007) of Fidelity Management & Research Company, Vice President of FMR Co., Inc. (2001-2007) and as a portfolio manager for Fidelity U.S. Equity Funds. |
Brian B. Hogan (48) |
| Year of Election or Appointment: 2009 Vice President of Equity and High Income Funds. Mr. Hogan also serves as President of FMR's Equity Division (2009-present). Previously, Mr. Hogan served as Senior Vice President, Equity Research of FMR (2006-2009) and as a portfolio manager. |
Scott C. Goebel (44) |
| Year of Election or Appointment: 2008 Secretary and Chief Legal Officer (CLO) of the Fidelity funds. Mr. Goebel also serves as Secretary of Fidelity Investments Money Management, Inc. (FIMM) (2010-present) and Fidelity Research and Analysis Company (FRAC) (2010-present); Secretary and CLO of The North Carolina Capital Management Trust: Cash and Term Portfolios (2008-present); General Counsel, Secretary, and Senior Vice President of FMR (2008-present) and FMR Co., Inc. (2008-present); employed by FMR LLC or an affiliate (2001-present); Chief Legal Officer of Fidelity Management & Research (Hong Kong) Limited (2008-present) and Assistant Secretary of Fidelity Management & Research (Japan) Inc. (2008-present), and Fidelity Management & Research (U.K.) Inc. (2008-present). Previously, Mr. Goebel served as Assistant Secretary of FIMM (2008-2010), FRAC (2008-2010), and the Funds (2007-2008) and as Vice President and Secretary of Fidelity Distributors Corporation (FDC) (2005-2007). |
William C. Coffey (43) |
| Year of Election or Appointment: 2009 Assistant Secretary of Fidelity's Equity and High Income Funds. Mr. Coffey also serves as Senior Vice President and Deputy General Counsel of FMR LLC (2010-present), and is an employee of Fidelity Investments. Previously, Mr. Coffey served as Vice President and Associate General Counsel of FMR LLC (2005-2009). |
Elizabeth Paige Baumann (44) |
| Year of Election or Appointment: 2012 Anti-Money Laundering (AML) Officer of the Fidelity funds. Ms. Baumann also serves as AML Officer of The North Carolina Capital Management Trust: Cash and Term Portfolios (2012-present), Chief AML Officer of FMR LLC (2012-present), and is an employee of Fidelity Investments. Previously, Ms. Baumann served as Vice President and Deputy Anti-Money Laundering Officer (2007-2012). |
Christine Reynolds (54) |
| Year of Election or Appointment: 2008 Chief Financial Officer of the Fidelity funds. Ms. Reynolds became President of Fidelity Pricing and Cash Management Services (FPCMS) in August 2008. Ms. Reynolds served as Chief Operating Officer of FPCMS (2007-2008). Previously, Ms. Reynolds served as President, Treasurer, and Anti-Money Laundering officer of the Fidelity funds (2004-2007). |
Joseph A. Hanlon (44) |
| Year of Election or Appointment: 2012 Chief Compliance Officer of Fidelity's Equity and High Income Funds. Mr. Hanlon serves as Compliance Officer of FMR, FMR Co., Inc., Fidelity Investments Money Management, Inc. (FIMM), Fidelity Research and Analysis Company (FRAC), Fidelity Management & Research (Japan) Inc., Fidelity Management & Research (U.K.) Inc., Fidelity Management & Research (Hong Kong), and Strategic Advisers, Inc. (2009-present), as Senior Vice President of the Fidelity Asset Management Division (2009-present), and is an employee of Fidelity Investments. |
Joseph F. Zambello (55) |
| Year of Election or Appointment: 2011 Deputy Treasurer of the Fidelity funds. Mr. Zambello is an employee of Fidelity Investments. Previously, Mr. Zambello served as Vice President of FMR's Program Management Group (2009-2011) and Vice President of the Transfer Agent Oversight Group (2005-2009). |
Adrien E. Deberghes (45) |
| Year of Election or Appointment: 2008 Deputy Treasurer of Fidelity's Equity and High Income Funds. Mr. Deberghes also serves as Vice President (2011-present) and Assistant Treasurer (2010-present) of other Fidelity funds, and is an employee of Fidelity Investments (2008-present). Previously, Mr. Deberghes served as Senior Vice President of Mutual Fund Administration at State Street Corporation (2007-2008), Senior Director of Mutual Fund Administration at Investors Bank & Trust (2005-2007), and Director of Finance for Dunkin' Brands (2000-2005). |
Stephen Sadoski (41) |
| Year of Election or Appointment: 2012 Deputy Treasurer of Fidelity's Equity and High Income Funds. Mr. Sadoski also serves as Assistant Treasurer of other Fidelity funds (2012-present) and is an employee of Fidelity Investments (2012-present). Previously, Mr. Sadoski served as an assistant chief accountant in the Division of Investment Management of the Securities and Exchange Commission (SEC) (2009-2012) and as a senior manager at Deloitte & Touche (1997-2009). |
Stephanie J. Dorsey (43) |
| Year of Election or Appointment: 2010 Assistant Treasurer of Fidelity's Equity and High Income Funds. Ms. Dorsey also serves as Deputy Treasurer of other Fidelity funds (2008-present) and is an employee of Fidelity Investments (2008-present). Previously, Ms. Dorsey served as Treasurer (2004-2008) of the JPMorgan Mutual Funds and Vice President (2004-2008) of JPMorgan Chase Bank. |
John R. Hebble (54) |
| Year of Election or Appointment: 2009 Assistant Treasurer of Fidelity's Equity and High Income Funds. Mr. Hebble also serves as President (2011-present), Treasurer, and Chief Financial Officer of The North Carolina Capital Management Trust: Cash and Term Portfolios (2008-present), President and Treasurer of other Fidelity funds (2008-present) and is an employee of Fidelity Investments. |
Gary W. Ryan (54) |
| Year of Election or Appointment: 2005 Assistant Treasurer of the Fidelity funds. Mr. Ryan is an employee of Fidelity Investments. Previously, Mr. Ryan served as Vice President of Fund Reporting in Fidelity Pricing and Cash Management Services (FPCMS) (1999-2005). |
Jonathan Davis (44) |
| Year of Election or Appointment: 2010 Assistant Treasurer of the Fidelity funds. Mr. Davis is also Assistant Treasurer of Fidelity Rutland Square Trust II and Fidelity Commonwealth Trust II. Mr. Davis is an employee of Fidelity Investments. Previously, Mr. Davis served as Vice President and Associate General Counsel of FMR LLC (2003-2010). |
Annual Report
Institutional Class designates 70% of the dividend distributed during the fiscal year as qualifying for the dividends-received deduction for corporate shareholders.
Institutional Class designates 100% of the dividend distributed during the fiscal year as amounts which may be taken into account as a dividend for the purposes of the maximum rate under section 1(h)(11) of the Internal Revenue Code.
The amounts per share which represent income derived from sources within, and taxes paid to, foreign countries or possessions of the United States are as follows:
| Pay Date | Income | Taxes |
Institutional Class | 12/12/2011 | $0.118 | $0.0107 |
The fund will notify shareholders in January 2013 of amounts for use in preparing 2012 income tax returns.
Annual Report
Board Approval of Investment Advisory Contracts and Management Fees
Fidelity Global Commodity Stock Fund
Each year, the Board of Trustees, including the Independent Trustees (together, the Board), votes on the renewal of the management contract and sub-advisory agreements (together, the Advisory Contracts) for the fund. The Board, assisted by the advice of fund counsel and Independent Trustees' counsel, requests and considers a broad range of information relevant to the renewal of the Advisory Contracts throughout the year.
The Board meets regularly and, at each of its meetings, considers factors that are relevant to its annual consideration of the renewal of the fund's Advisory Contracts, including the services and support provided to the fund and its shareholders. The Board has established various standing committees, each composed of and chaired by Independent Trustees with varying backgrounds, to which the Board has assigned specific subject matter responsibilities in order to enhance effective decision-making by the Board. The Board, acting directly and through its Committees, requests and receives information concerning the annual consideration of the renewal of the fund's Advisory Contracts. The Board also meets as needed to consider matters specifically related to the Board's annual consideration of the renewal of Advisory Contracts. Members of the Board may also meet with trustees of other Fidelity funds through ad hoc joint committees to discuss certain matters relevant to the Fidelity funds.
At its July 2012 meeting, the Board of Trustees, including the Independent Trustees, unanimously determined to renew the fund's Advisory Contracts. In reaching its determination, the Board considered all factors it believed relevant, including (i) the nature, extent, and quality of the services to be provided to the fund and its shareholders (including the investment performance of the fund); (ii) the competitiveness of the fund's management fee and total expense ratio relative to peer funds; (iii) the total costs of the services to be provided by and the profits to be realized by Fidelity from its relationship with the fund; (iv) the extent to which economies of scale exist and would be realized as the fund grows; and (v) whether fee levels reflect these economies of scale, if any, for the benefit of fund shareholders.
In considering whether to renew the Advisory Contracts for the fund, the Board reached a determination, with the assistance of fund counsel and Independent Trustees' counsel and through the exercise of its business judgment, that the renewal of the Advisory Contracts is in the best interests of the fund and its shareholders and that the compensation payable under the Advisory Contracts is fair and reasonable. The Board's decision to renew the Advisory Contracts was not based on any single factor, but rather was based on a comprehensive consideration of all the information provided to the Board at its meetings throughout the year. The Board, in reaching its determination to renew the Advisory Contracts, is aware that shareholders in the fund have a broad range of investment choices available to them, including a wide choice among mutual funds offered by Fidelity's competitors, and that the fund's shareholders, who have the opportunity to review and weigh the disclosure provided by the fund in its prospectus and other public disclosures, have chosen to invest in this fund, managed by Fidelity.
Annual Report
Nature, Extent, and Quality of Services Provided. The Board considered the staffing within the investment adviser, FMR, and the sub-advisers (together, the Investment Advisers), including the backgrounds of the fund's investment personnel, and also considered the fund's investment objective, strategies, and related investment philosophy. The Independent Trustees also had discussions with senior management of Fidelity's investment operations and investment groups. The Board considered the structure of the portfolio manager compensation program and whether this structure provides appropriate incentives to act in the best interests of the fund.
Resources Dedicated to Investment Management and Support Services. The Board and the Fund Oversight and Research Committees reviewed the general qualifications and capabilities of the Investment Advisers' investment staff, including its size, education, experience, and resources, as well as the Investment Advisers' approach to recruiting, training, managing, and compensating investment personnel. The Board also noted that FMR has continued to increase the resources devoted to non-U.S. offices, including expansion of Fidelity's global investment organization. The Board noted that Fidelity's analysts have extensive resources, tools and capabilities that allow them to conduct sophisticated quantitative and fundamental analysis, as well as credit analysis of issuers, counterparties and guarantors. The Board also believes that Fidelity's investment professionals have sufficient access to global information and data so as to provide competitive investment results over time, and that those professionals also have access to sophisticated tools that permit them to assess portfolio construction and risk and performance attribution characteristics continuously, as well as to transmit new information and research conclusions rapidly around the world. Additionally, in its deliberations, the Board considered the Investment Advisers' trading and risk management capabilities and resources, which are an integral part of the investment management process.
Shareholder and Administrative Services. The Board considered (i) the nature, extent, quality, and cost of advisory, administrative, and shareholder services performed by the Investment Advisers and their affiliates under the Advisory Contracts and under separate agreements covering transfer agency, pricing and bookkeeping, and securities lending services for the fund; (ii) the nature and extent of the supervision of third party service providers, principally custodians and subcustodians; and (iii) the resources devoted to, and the record of compliance with, the fund's compliance policies and procedures. The Board also reviewed the allocation of fund brokerage, including allocations to brokers affiliated with the Investment Advisers, the use of brokerage commissions to pay fund expenses, and the use of "soft" commission dollars to pay for research services.
Annual Report
Board Approval of Investment Advisory Contracts and
Management Fees - continued
The Board noted that the growth of fund assets over time across the complex allows Fidelity to reinvest in the development of services designed to enhance the value or convenience of the Fidelity funds as investment vehicles. These services include 24-hour access to account information and market information through telephone representatives and over the Internet, investor education materials and asset allocation tools, and the expanded availability of Fidelity Investor Centers.
Investment in a Large Fund Family. The Board considered the benefits to shareholders of investing in a Fidelity fund, including the benefits of investing in a fund that is part of a large family of funds offering a variety of investment disciplines and providing a large variety of mutual fund investor services. The Board noted that Fidelity had taken, or had made recommendations that resulted in the Fidelity funds taking, a number of actions over the previous year that benefited particular funds, including (i) continuing to dedicate additional resources to investment research and support of the senior management team that oversees asset management; (ii) persisting in efforts to enhance Fidelity's research capabilities, in particular, international research; (iii) launching new funds and making other enhancements to meet client needs for global and income-oriented solutions; (iv) continuing to launch dedicated lower cost underlying funds to meet investment management's portfolio construction needs related to expanding underlying fund options, specifically for the Freedom Fund product lines; (v) adopting a "Stock Selector" sector neutral investment approach and employing a team of portfolio managers who are sector specialists to manage certain funds; (vi) rationalizing product lines and gaining increased efficiencies through the mergers of several funds into other funds; (vii) strengthening the Spartan Index Fund product line by adding new funds and/or new low-cost institutional share classes, restructuring fund expenses to accommodate new classes, and reducing investment minimums for certain classes of shares; (viii) modifying the eligibility criteria for Institutional Class shares to increase their appeal to government entities and charitable investors; and (ix) reducing certain transfer agent fee rates.
Investment Performance. The Board considered whether the fund has operated in accordance with its investment objective, as well as its record of compliance with its investment restrictions. It also reviewed the fund's absolute investment performance for each class, as well as the fund's relative investment performance for each class measured against a third-party-sponsored index that reflects the market sector in which the fund invests. The Board noted that FMR believes that no meaningful peer group exists for the fund principally because most other funds in the fund's third-party peer group focus on different industries or sectors than the fund. Because the fund had been in existence less than three calendar years, the following chart considered by the Board shows, for the one-year period ended December 31, 2011, the total returns of Institutional Class (Class I) and Class B of the fund and the total return of a third-party-sponsored index ("benchmark").
Annual Report
Fidelity Global Commodity Stock Fund

The Board noted that the investment performance of the fund was lower than its benchmark for the period shown. The Board considered that the variations in performance among the fund's classes reflect the variations in class expenses, which result in lower performance for higher expense classes. The Board also reviewed the fund's performance since inception as well as performance in the current year. The Board noted that it is difficult to evaluate in any comprehensive fashion the performance of the fund, in light of its relatively recent commencement of operations.
Based on its review, the Board concluded that the nature, extent, and quality of services provided to the fund under the Advisory Contracts should benefit the fund's shareholders.
Competitiveness of Management Fee and Total Expense Ratio. The Board considered the fund's management fee and total expense ratio compared to "mapped groups" of competitive funds and classes. Fidelity creates "mapped groups" by combining similar Lipper investment objective categories that have comparable management fee characteristics. Combining Lipper investment objective categories aids the Board's management fee and total expense ratio comparisons by broadening the competitive group used for comparison and by reducing the number of universes to which various Fidelity funds are compared.
Management Fee. The Board considered two proprietary management fee comparisons for the 12-month (or shorter) periods shown in the chart below. The group of Lipper funds used by the Board for management fee comparisons is referred to below as the "Total Mapped Group." The Total Mapped Group comparison focuses on a fund's standing relative to the total universe of comparable funds available to investors in terms of gross management fees before expense reimbursements or caps. "TMG %" represents the percentage of funds in the Total Mapped Group that had management fees that were lower than the fund's. For example, a TMG % of 31% means that 69% of the funds in the Total Mapped Group had higher management fees than the fund. The "Asset-Size Peer Group" (ASPG) comparison focuses on a fund's standing relative to non-Fidelity funds similar in size to the fund within the Total Mapped Group. The ASPG represents at least 15% of the funds in the Total Mapped Group with comparable asset size and management fee characteristics, subject to a minimum of 50 funds (or all funds in the Total Mapped Group if fewer than 50). Additional information, such as the ASPG quartile in which the fund's management fee ranked, is also included in the chart and considered by the Board.
Annual Report
Board Approval of Investment Advisory Contracts and
Management Fees - continued
Fidelity Global Commodity Stock Fund

The Board noted that the fund's management fee ranked below the median of its Total Mapped Group and below the median of its ASPG for 2011.
Based on its review, the Board concluded that the fund's management fee is fair and reasonable in light of the services that the fund receives and the other factors considered.
Total Expense Ratio. In its review of each class's total expense ratio, the Board considered the fund's management fee as well as other fund or class expenses, as applicable, such as transfer agent fees, pricing and bookkeeping fees, fund-paid 12b-1 fees, and custodial, legal, and audit fees. The Board also noted the effects of any waivers and reimbursements on fees and expenses. As part of its review, the Board also considered the current and historical total expense ratios of each class of the fund compared to competitive fund median expenses. Each class of the fund is compared to those funds and classes in the Total Mapped Group (used by the Board for management fee comparisons) that have a similar sales load structure.
Annual Report
The Board noted that the total expense ratio of each of Class A, Class B, Class C, Institutional Class, and the retail class ranked below its competitive median for 2011 and the total expense ratio of Class T ranked above its competitive median for 2011. The Board considered that various factors, including 12b-1 fees, positive or negative performance adjustments, and relatively higher other expenses in the case of small fund size, can affect total expense ratios. The Board noted that the total expense ratio of Class T was above the competitive median primarily because of higher 12b-1 fees on Class T. Class T has a higher 12b-1 fee, but a lower front-end sales charge, than traditionally priced front-end sales charge classes. The Board considered that Class T is primarily sold load-waived in the retirement plan market where its 0.50% 12b-1 fee is comparable to competing no-load, higher 12b-1 fee classes designed specifically for retirement plans. The Board noted that the fund offers multiple classes, each of which has a different sales load and 12b-1 fee structure, and that the multiple structures are intended to offer a range of pricing options for the intermediary market. The Board also noted that the total expense ratios of the classes vary primarily by the level of their 12b-1 fees, although differences in transfer agent fees may also cause expenses to vary from class to class.
Fees Charged to Other Fidelity Clients. The Board also considered Fidelity fee structures and other information with respect to clients of FMR and its affiliates, such as other mutual funds advised or subadvised by FMR or its affiliates, pension plan clients, and other institutional clients. The Board noted the findings of the 2010 ad hoc joint committee (created with the board of other Fidelity funds), which reviewed and compared Fidelity's institutional investment advisory business with its business of providing services to the Fidelity funds, including the differences in services provided, fees charged, and costs incurred, as well as competition in their respective marketplaces.
Based on its review of total expense ratios and fees charged to other Fidelity clients, the Board concluded that the total expense ratio of each class of the fund was reasonable, although Class T was above the median of the universe presented for comparison, in light of the services that the fund and its shareholders receive and the other factors considered.
Costs of the Services and Profitability. The Board considered the revenues earned and the expenses incurred by Fidelity in conducting the business of developing, marketing, distributing, managing, administering and servicing the fund and its shareholders. The Board also considered the level of Fidelity's profits in respect of all the Fidelity funds.
On an annual basis, FMR presents to the Board Fidelity's profitability for the fund. Fidelity calculates the profitability for each fund, as well as aggregate profitability for groups of Fidelity funds and all Fidelity funds, using a series of detailed revenue and cost allocation methodologies which originate with the books and records of Fidelity on which Fidelity's audited financial statements are based. The Audit Committee of the Board reviews any significant changes from the prior year's methodologies.
Annual Report
Board Approval of Investment Advisory Contracts and
Management Fees - continued
PricewaterhouseCoopers LLP (PwC), independent registered public accounting firm and auditor to Fidelity and certain Fidelity funds, has been engaged annually by the Board as part of the Board's assessment of Fidelity's profitability analysis. PwC's engagement includes the review and assessment of Fidelity's methodologies used in determining the revenues and expenses attributable to Fidelity's mutual fund business, and completion of agreed-upon procedures surrounding the mathematical accuracy of fund profitability and its conformity to allocation methodologies. After considering PwC's reports issued under the engagement and information provided by Fidelity, the Board concluded that while other allocation methods may also be reasonable, Fidelity's profitability methodologies are reasonable in all material respects.
The Board also reviewed Fidelity's non-fund businesses and fall-out benefits related to the mutual fund business as well as cases where Fidelity's affiliates may benefit from or be related to the fund's business.
The Board considered the costs of the services provided by and the profits realized by Fidelity in connection with the operation of the fund and was satisfied that the profitability was not excessive in the circumstances.
Economies of Scale. The Board considered whether there have been economies of scale in respect of the management of the Fidelity funds, whether the Fidelity funds (including the fund) have appropriately benefited from any such economies of scale, and whether there is potential for realization of any further economies of scale. The Board considered the extent to which the fund will benefit from economies of scale through increased services to the fund, through waivers or reimbursements, or through fee or expense reductions. The Board also noted that in 2009, it and the board of other Fidelity funds created an ad hoc committee (the Economies of Scale Committee) to analyze whether FMR attains economies of scale in respect of the management and servicing of the Fidelity funds, whether the Fidelity funds have appropriately benefited from such economies of scale, and whether there is potential for realization of any further economies of scale.
The Board recognized that the fund's management contract incorporates a "group fee" structure, which provides for lower group fee rates as total fund assets under FMR's management increase, and for higher group fee rates as total fund assets under FMR's management decrease. FMR calculates the group fee rates based on a tiered asset "breakpoint" schedule that varies based on asset class. The Board considered that the group fee is designed to deliver the benefits of economies of scale to fund shareholders when total Fidelity fund assets increase, even if assets of any particular fund are unchanged or have declined, because some portion of Fidelity's costs are attributable to services provided to all Fidelity funds, and all funds benefit if those costs can be allocated among more assets. The Board concluded that, given the group fee structure, fund shareholders will benefit from lower management fees as assets under FMR's management increase at the fund complex level, regardless of whether Fidelity achieves any such economies of scale.
Annual Report
The Board concluded, taking into account the analysis of the Economies of Scale Committee, that economies of scale, if any, are being appropriately shared between fund shareholders and Fidelity.
Additional Information Requested by the Board. In order to develop fully the factual basis for consideration of the Fidelity funds' Advisory Contracts, the Board requested and received additional information on certain topics, including (i) fund performance trends, actions to be taken by FMR to improve certain funds' overall performance, and Fidelity's long-term strategies for certain funds; (ii) the potential to further rationalize the Fidelity fund lineup with the possibility of achieving savings for the funds and Fidelity; (iii) Fidelity's compensation structure for portfolio managers and other key investment personnel; (iv) the amount of the investment that each portfolio manager has made in the Fidelity fund(s) that he or she manages; (v) the realization of fall-out benefits in certain Fidelity business units; (vi) Fidelity's group fee structures, the potential impact of regulatory changes on such structures, and the rationale for the individual fee rates of certain funds; (vii) fund profitability methodology, including Fidelity's cost allocation methodology, and the impact of certain factors on fund profitability results; (viii) trends regarding industry use of performance fee structures and the possibility of implementing performance fee structures for additional funds; and (ix) the impact of net redemptions from the Fidelity funds.
Based on its evaluation of all of the conclusions noted above, and after considering all factors it believed relevant, the Board ultimately concluded that the advisory fee structures are fair and reasonable, and that the fund's Advisory Contracts should be renewed.
Annual Report
Investment Adviser
Fidelity Management & Research Company
Boston, MA
Investment Sub-Advisers
FMR Co., Inc.
Fidelity Management & Research
(U.K.) Inc.
FIL Investment Advisors
FIL Investments (Japan) Limited
FIL Investment Advisors
(U.K.) Limited
Fidelity Management & Research
(Hong Kong) Limited
Fidelity Management & Research
(Japan) Inc.
General Distributor
Fidelity Distributors Corporation
Smithfield, RI
Transfer and Service Agents
Fidelity Investments Institutional
Operations Company, Inc.
Boston, MA
Fidelity Service Company, Inc.
Boston, MA
Custodian
State Street Bank and Trust Company
Quincy, MA
(Fidelity Investment logo)(registered trademark)
AGCSI-UANN-1212
1.879388.103
Fidelity®
Global Commodity Stock
Fund
Annual Report
October 31, 2012
(Fidelity Cover Art)
Contents
Performance | (Click Here) | How the fund has done over time. |
Management's Discussion of Fund Performance | (Click Here) | The Portfolio Manager's review of fund performance and strategy. |
Shareholder Expense Example | (Click Here) | An example of shareholder expenses. |
Investment Changes | (Click Here) | A summary of major shifts in the fund's investments over the past six months. |
Investments | (Click Here) | A complete list of the fund's investments with their market values. |
Financial Statements | (Click Here) | Statements of assets and liabilities, operations, and changes in net assets, as well as financial highlights. |
Notes | (Click Here) | Notes to the financial statements. |
Report of Independent Registered Public Accounting Firm | (Click Here) | |
Trustees and Officers | (Click Here) | |
Distributions | (Click Here) | |
Board Approval of Investment Advisory Contracts and Management Fees | (Click Here) | |
To view a fund's proxy voting guidelines and proxy voting record for the 12-month period ended June 30, visit http://www.fidelity.com/proxyvotingresults or visit the Securities and Exchange Commission's (SEC) web site at http://www.sec.gov. You may also call 1-800-544-8544 to request a free copy of the proxy voting guidelines.
Standard & Poor's, S&P and S&P 500 are registered service marks of The McGraw-Hill Companies, Inc. and have been licensed for use by Fidelity Distributors Corporation.
Other third party marks appearing herein are the property of their respective owners.
All other marks appearing herein are registered or unregistered trademarks or service marks of FMR LLC or an affiliated company. © 2012 FMR LLC. All rights reserved.
Annual Report
This report and the financial statements contained herein are submitted for the general information of the shareholders of the fund. This report is not authorized for distribution to prospective investors in the fund unless preceded or accompanied by an effective prospectus.
A fund files its complete schedule of portfolio holdings with the SEC for the first and third quarters of each fiscal year on Form N-Q. Forms N-Q are available on the SEC's web site at http://www.sec.gov. A fund's Forms N-Q may be reviewed and copied at the SEC's Public Reference Room in Washington, DC. Information regarding the operation of the SEC's Public Reference Room may be obtained by calling 1-800-SEC-0330. For a complete list of a fund's portfolio holdings, view the most recent holdings listing, semiannual report, or annual report on Fidelity's web site at http://www.fidelity.com, http://www.advisor.fidelity.com, or http://www.401k.com, as applicable.
NOT FDIC INSURED • MAY LOSE VALUE • NO BANK GUARANTEE
Neither the fund nor Fidelity Distributors Corporation is a bank.
Annual Report
Average annual total return reflects the change in the value of an investment, assuming reinvestment of the class' distributions from dividend income and capital gains (the profits earned upon the sale of securities that have grown in value, if any) and assuming a constant rate of performance each year. The $10,000 table and the fund's returns do not reflect the deduction of taxes that a shareholder would pay on fund distributions or the redemption of fund shares. During periods of reimbursement by Fidelity, a fund's total return will be greater than it would be had the reimbursement not occurred. How a fund did yesterday is no guarantee of how it will do tomorrow.
Average Annual Total Returns
Periods ended October 31, 2012 | Past 1
year | Life of
fund A |
Fidelity® Global Commodity Stock Fund | -2.96% | 12.00% |
A From March 25, 2009
$10,000 Over Life of Fund
Let's say hypothetically that $10,000 was invested in Fidelity® Global Commodity Stock Fund, a class of the fund, on March 25, 2009, when the fund started. The chart shows how the value of your investment would have changed, and also shows how the MSCI® ACWI® (All Country World Index) Index performed over the same period.
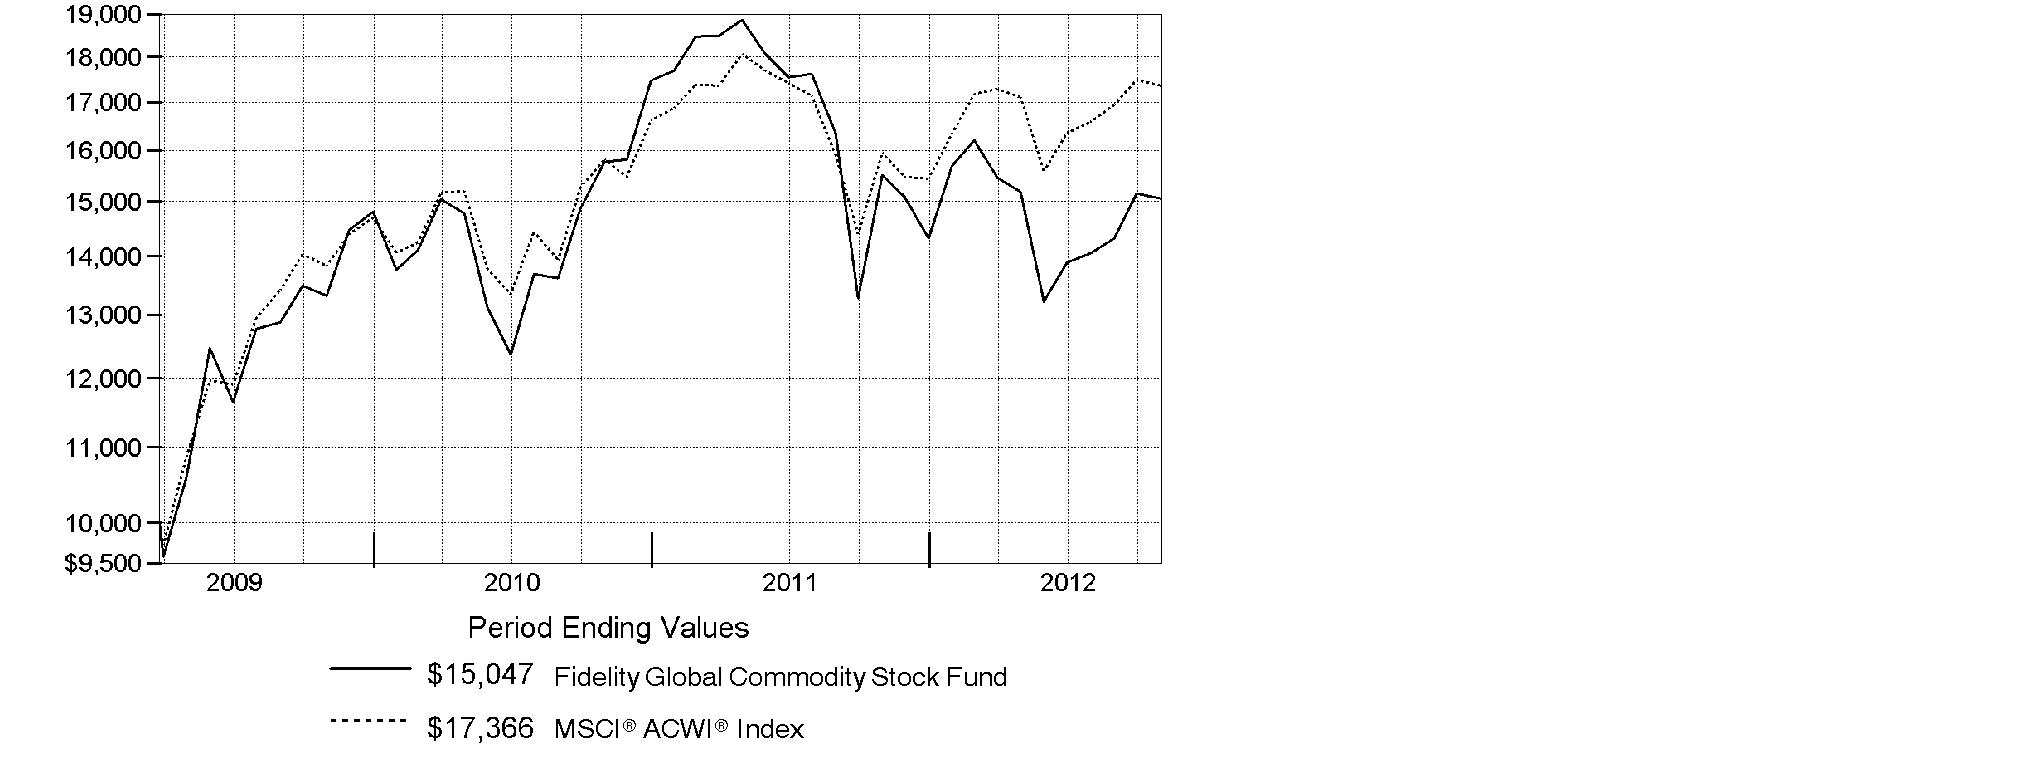
Annual Report
Market Recap: Global stocks experienced pendulum-like swings during the 12 months ending October 31, 2012, finishing the period with a solid advance. The market faced periodic bouts of volatility this past year, as a number of macroeconomic concerns - including the eurozone debt crisis, the strength and pace of the U.S. economic recovery, and a slowdown in China's once-blistering growth - dominated headlines and weighed on investors. While a stronger U.S. dollar provided an additional head wind for foreign investments, stocks worldwide rose 8.96% for the 12 months, as measured by the MSCI® ACWI® (All Country World Index) Index, largely buttressed in the summer by pledges of accommodative monetary action from eurozone officials, as well as signs that the U.S. housing market was on the mend. Within the index, the U.S. showed the most impressive gain among major markets, advancing 15%, closely followed by Asia-Pacific ex Japan (+10%). A number of core European components, most notably Germany (+11%), Switzerland (+10%) and the U.K. (+9%), benefited from optimism about the eurozone's ability to resolve its debt woes. However, continued weakness in peripheral European markets caused the region to lag the index overall. Elsewhere, results from Canada (+3%) and the generally more volatile emerging markets (+2%) each fell short of the MSCI index, while Japan was among the few benchmark constituents to finish in the red, returning about -3%.
Comments from S. Joseph Wickwire II, Portfolio Manager of Fidelity® Global Commodity Stock Fund: For the year, the fund's Retail Class shares returned -2.96%, in line with -2.63% for the MSCI® ACWI® (All Country World Index) Commodity Producers Sector Capped Index. The fund was hurt the most by its investments in coal stocks, while choices in oil/gas refining and marketing meaningfully contributed. Overweightings in coal producers Alpha Natural Resources and Peabody Energy detracted, as did oil/gas equipment and services providers such as Ion Geophysical. Underweighting several solid-performing paper-related names also hurt, including Swedish paper product maker Svenska Cellulosa. Conversely, investments in refiners such as Marathon Petroleum and Tesoro were standouts, while oil/gas exploration and production firm Nexen was the fund's top individual contributor after its stock surged in late July on a takeover bid from Hong Kong-based CNOOC. Cabot Oil & Gas was another contributor. In agriculture, the fund benefited in part from an overweighting in fertilizer maker CF Industries Holdings. Some of the stocks I've mentioned were not in the benchmark and/or were sold by period end.
The views expressed above reflect those of the portfolio manager(s) only through the end of the period as stated on the cover of this report and do not necessarily represent the views of Fidelity or any other person in the Fidelity organization. Any such views are subject to change at any time based upon market or other conditions and Fidelity disclaims any responsibility to update such views. These views may not be relied on as investment advice and, because investment decisions for a Fidelity fund are based on numerous factors, may not be relied on as an indication of trading intent on behalf of any Fidelity fund.
Annual Report
Shareholder Expense Example
As a shareholder of the Fund, you incur two types of costs: (1) transaction costs, including sales charges (loads) on purchase payments or redemption proceeds, redemption fees and (2) ongoing costs, including management fees, distribution and/or service (12b-1) fees and other Fund expenses. This Example is intended to help you understand your ongoing costs (in dollars) of investing in the Fund and to compare these costs with the ongoing costs of investing in other mutual funds.
The Example is based on an investment of $1,000 invested at the beginning of the period and held for the entire period (May 1, 2012 to October 31, 2012).
Actual Expenses
The first line of the accompanying table for each class of the Fund provides information about actual account values and actual expenses. You may use the information in this line, together with the amount you invested, to estimate the expenses that you paid over the period. Simply divide your account value by $1,000.00 (for example, an $8,600 account value divided by $1,000.00 = 8.6), then multiply the result by the number in the first line for a class of the Fund under the heading entitled "Expenses Paid During Period" to estimate the expenses you paid on your account during this period. A small balance maintenance fee of $12.00 that is charged once a year may apply for certain accounts with a value of less than $2,000. This fee is not included in the table below. If it was, the estimate of expenses you paid during the period would be higher, and your ending account value lower, by this amount. In addition, the Fund, as a shareholder in the underlying Fidelity Central Funds, will indirectly bear its pro-rata share of the fees and expenses incurred by the underlying Fidelity Central Funds. These fees and expenses are not included in the Fund's annualized expense ratio used to calculate the expense estimate in the table below.
Hypothetical Example for Comparison Purposes
The second line of the accompanying table for each class of the Fund provides information about hypothetical account values and hypothetical expenses based on a Class' actual expense ratio and an assumed rate of return of 5% per year before expenses, which is not the Class' actual return. The hypothetical account values and expenses may not be used to estimate the actual ending account balance or expenses you paid for the period. You may use this information to compare the ongoing costs of investing in the Fund and other funds. To do so, compare this 5% hypothetical example with the 5% hypothetical examples that appear in the shareholder reports of the other funds. A small balance maintenance fee of $12.00 that is charged once a year may apply for certain accounts with a value of less than $2,000. This fee is not included in the table below. If it was, the estimate of expenses you paid during the period would be higher, and your ending account value lower, by this amount. In addition, the Fund, as a shareholder in the underlying Fidelity Central Funds, will indirectly bear its pro-rata share of the fees and expenses incurred by the underlying Fidelity Central Funds. These fees and expenses are not included in the Fund's annualized expense ratio used to calculate the expense estimate in the table below.
Please note that the expenses shown in the table are meant to highlight your ongoing costs only and do not reflect any transaction costs. Therefore, the second line of the table is useful in comparing ongoing costs only, and will not help you determine the relative total costs of owning different funds. In addition, if these transactional costs were included, your costs would have been higher.
Annual Report
| Annualized Expense Ratio | Beginning
Account Value
May 1, 2012 | Ending
Account Value
October 31, 2012 | Expenses Paid
During Period*
May 1, 2012 to October 31, 2012 |
Class A | 1.33% | | | |
Actual | | $ 1,000.00 | $ 990.50 | $ 6.65 |
HypotheticalA | | $ 1,000.00 | $ 1,018.45 | $ 6.75 |
Class T | 1.59% | | | |
Actual | | $ 1,000.00 | $ 989.10 | $ 7.95 |
HypotheticalA | | $ 1,000.00 | $ 1,017.14 | $ 8.06 |
Class B | 2.09% | | | |
Actual | | $ 1,000.00 | $ 987.00 | $ 10.44 |
HypotheticalA | | $ 1,000.00 | $ 1,014.63 | $ 10.58 |
Class C | 2.09% | | | |
Actual | | $ 1,000.00 | $ 987.00 | $ 10.44 |
HypotheticalA | | $ 1,000.00 | $ 1,014.63 | $ 10.58 |
Global Commodity Stock | 1.08% | | | |
Actual | | $ 1,000.00 | $ 991.90 | $ 5.41 |
HypotheticalA | | $ 1,000.00 | $ 1,019.71 | $ 5.48 |
Institutional Class | 1.03% | | | |
Actual | | $ 1,000.00 | $ 992.60 | $ 5.16 |
HypotheticalA | | $ 1,000.00 | $ 1,019.96 | $ 5.23 |
A 5% return per year before expenses
* Expenses are equal to each Class' annualized expense ratio, multiplied by the average account value over the period, multiplied by 184/366 (to reflect the one-half year period).
Annual Report
Investment Changes (Unaudited)
Top Ten Stocks as of October 31, 2012 |
| % of fund's
net assets | % of fund's net assets
6 months ago |
BHP Billiton PLC | 5.7 | 5.6 |
Monsanto Co. | 5.0 | 4.6 |
Syngenta AG (Switzerland) | 3.9 | 1.8 |
Potash Corp. of Saskatchewan, Inc. | 3.4 | 4.1 |
Royal Dutch Shell PLC Class A (United Kingdom) | 3.2 | 3.0 |
Rio Tinto PLC | 2.9 | 2.7 |
Chevron Corp. | 2.0 | 3.1 |
BP PLC | 1.9 | 1.8 |
Agrium, Inc. | 1.7 | 1.4 |
International Paper Co. | 1.7 | 1.2 |
| 31.4 | |
Top Sectors (% of fund's net assets) |
As of October 31, 2012 |
 | Metals 35.2% | |
 | Energy 34.0% | |
 | Agriculture 28.7% | |
 | Other 1.6% | |
| Short-Term Investments
and Net Other Assets 0.5% | |

As of April 30, 2012 |
| Energy 37.0% | |
| Metals 36.8% | |
| Agriculture 23.5% | |
| Other 2.5% | |
| Short-Term Investments
and Net Other Assets 0.2% | |

Annual Report
Investments October 31, 2012
Showing Percentage of Net Assets
Common Stocks - 99.5% |
| Shares | | Value |
CHEMICALS - 21.2% |
Commodity Chemicals - 0.0% |
Braskem SA (PN-A) | 13,250 | | $ 87,547 |
Fertilizers & Agricultural Chemicals - 21.2% |
Agrium, Inc. | 94,300 | | 9,930,888 |
CF Industries Holdings, Inc. | 42,072 | | 8,632,754 |
China BlueChemical Ltd. (H Shares) | 2,450,000 | | 1,552,184 |
Incitec Pivot Ltd. | 838,984 | | 2,752,067 |
Israel Chemicals Ltd. | 337,000 | | 4,217,218 |
Israel Corp. Ltd. (Class A) | 1,000 | | 679,773 |
K&S AG | 74,207 | | 3,510,694 |
Monsanto Co. | 339,900 | | 29,255,193 |
Potash Corp. of Saskatchewan, Inc. | 501,600 | | 20,164,446 |
Sociedad Quimica y Minera de Chile SA (PN-B) sponsored ADR | 3,100 | | 179,335 |
Syngenta AG (Switzerland) | 58,362 | | 22,754,733 |
Taiwan Fertilizer Co. Ltd. | 93,000 | | 221,595 |
The Mosaic Co. | 181,700 | | 9,510,178 |
United Phosphorous Ltd. (a) | 252,256 | | 534,939 |
Uralkali OJSC GDR (Reg. S) | 137,900 | | 5,402,922 |
Yara International ASA | 115,400 | | 5,436,732 |
| | 124,735,651 |
Specialty Chemicals - 0.0% |
LyondellBasell Industries NV Class A | 3,900 | | 208,221 |
TOTAL CHEMICALS | | 125,031,419 |
CONSTRUCTION & ENGINEERING - 0.0% |
Construction & Engineering - 0.0% |
FLSmidth & Co. A/S | 3,100 | | 183,134 |
CONSTRUCTION MATERIALS - 0.1% |
Construction Materials - 0.1% |
Martin Marietta Materials, Inc. | 7,100 | | 584,401 |
CONTAINERS & PACKAGING - 0.1% |
Paper Packaging - 0.1% |
Klabin SA (PN) (non-vtg.) | 31,700 | | 186,200 |
Rock-Tenn Co. Class A | 9,000 | | 658,710 |
| | 844,910 |
Common Stocks - continued |
| Shares | | Value |
ENERGY EQUIPMENT & SERVICES - 1.5% |
Oil & Gas Drilling - 1.2% |
Eurasia Drilling Co. Ltd. GDR (Reg. S) | 8,000 | | $ 276,800 |
Noble Corp. | 56,600 | | 2,136,084 |
Ocean Rig UDW, Inc. (United States) (a) | 90,700 | | 1,439,409 |
Rowan Companies PLC (a) | 32,900 | | 1,043,259 |
Unit Corp. (a) | 14,400 | | 581,040 |
Vantage Drilling Co. (a) | 1,074,382 | | 1,976,863 |
| | 7,453,455 |
Oil & Gas Equipment & Services - 0.3% |
Cameron International Corp. (a) | 12,700 | | 643,128 |
National Oilwell Varco, Inc. | 4,200 | | 309,540 |
Superior Energy Services, Inc. (a) | 36,600 | | 744,078 |
| | 1,696,746 |
TOTAL ENERGY EQUIPMENT & SERVICES | | 9,150,201 |
FOOD PRODUCTS - 4.1% |
Agricultural Products - 4.0% |
Archer Daniels Midland Co. | 311,500 | | 8,360,660 |
Bunge Ltd. | 104,400 | | 7,415,532 |
China Agri-Industries Holdings Ltd. | 1,561,000 | | 976,878 |
Golden Agri-Resources Ltd. | 4,481,000 | | 2,295,971 |
Ingredion, Inc. | 10,400 | | 639,184 |
Viterra, Inc. | 200,600 | | 3,161,396 |
Wilmar International Ltd. | 214,000 | | 542,105 |
| | 23,391,726 |
Packaged Foods & Meats - 0.1% |
Tyson Foods, Inc. Class A | 46,300 | | 778,303 |
TOTAL FOOD PRODUCTS | | 24,170,029 |
MACHINERY - 0.7% |
Construction & Farm Machinery & Heavy Trucks - 0.7% |
Caterpillar, Inc. | 3,200 | | 271,392 |
Cummins, Inc. | 2,900 | | 271,382 |
Deere & Co. | 450 | | 38,448 |
Fiat Industrial SpA | 186,900 | | 2,024,002 |
Jain Irrigation Systems Ltd. | 442,016 | | 537,271 |
Joy Global, Inc. | 12,850 | | 802,483 |
| | 3,944,978 |
Common Stocks - continued |
| Shares | | Value |
METALS & MINING - 35.2% |
Aluminum - 0.2% |
Alcoa, Inc. | 135,300 | | $ 1,159,521 |
Diversified Metals & Mining - 18.2% |
Anglo American PLC (United Kingdom) | 286,151 | | 8,787,601 |
BHP Billiton PLC | 1,044,896 | | 33,490,228 |
Copper Mountain Mining Corp. (a) | 1,376,156 | | 5,566,629 |
Eurasian Natural Resources Corp. PLC | 86,200 | | 455,848 |
First Quantum Minerals Ltd. | 164,100 | | 3,688,656 |
Freeport-McMoRan Copper & Gold, Inc. | 239,200 | | 9,300,096 |
Glencore International PLC (d) | 698,800 | | 3,868,535 |
Grupo Mexico SA de CV Series B | 89,411 | | 286,519 |
Horsehead Holding Corp. (a) | 221,000 | | 2,000,050 |
Iluka Resources Ltd. | 344,446 | | 3,546,918 |
Inmet Mining Corp. | 16,800 | | 866,283 |
Ivanhoe Australia Ltd. (a) | 536,258 | | 487,080 |
Jiangxi Copper Co. Ltd. (H Shares) | 75,000 | | 194,031 |
Kazakhmys PLC | 28,100 | | 321,506 |
Korea Zinc Co. Ltd. | 1,100 | | 451,977 |
Norilsk Nickel OJSC sponsored ADR | 1,700 | | 25,789 |
OZ Minerals Ltd. | 531 | | 4,514 |
Rio Tinto PLC | 341,587 | | 17,064,470 |
Sterlite Industries (India) Ltd. | 148,488 | | 273,500 |
Sumitomo Metal Mining Co. Ltd. | 103,000 | | 1,356,044 |
Teck Resources Ltd. Class B (sub. vtg.) | 111,100 | | 3,526,278 |
Turquoise Hill Resources Ltd. (a)(d) | 510,014 | | 3,988,195 |
Walter Energy, Inc. | 26,800 | | 936,928 |
Xstrata PLC | 416,691 | | 6,583,812 |
| | 107,071,487 |
Gold - 9.3% |
Agnico-Eagle Mines Ltd. (Canada) | 32,400 | | 1,829,323 |
AngloGold Ashanti Ltd. sponsored ADR | 103,800 | | 3,527,124 |
Barrick Gold Corp. | 227,800 | | 9,212,358 |
Centerra Gold, Inc. | 40,500 | | 459,439 |
Eldorado Gold Corp. | 218,350 | | 3,226,880 |
Gold Fields Ltd. sponsored ADR | 156,900 | | 1,962,819 |
Goldcorp, Inc. | 185,810 | | 8,399,821 |
Harmony Gold Mining Co. Ltd. sponsored ADR | 158,500 | | 1,315,550 |
IAMGOLD Corp. | 97,900 | | 1,519,349 |
Kinross Gold Corp. | 264,705 | | 2,629,160 |
New Gold, Inc. (a) | 255,100 | | 2,985,851 |
Newcrest Mining Ltd. | 170,840 | | 4,687,108 |
Common Stocks - continued |
| Shares | | Value |
METALS & MINING - CONTINUED |
Gold - continued |
Newmont Mining Corp. | 99,000 | | $ 5,400,450 |
Osisko Mining Corp. (a) | 99,400 | | 976,334 |
Premier Gold Mines Ltd. (a) | 301,500 | | 1,693,532 |
Randgold Resources Ltd. sponsored ADR | 17,800 | | 2,128,702 |
Yamana Gold, Inc. | 150,200 | | 3,033,326 |
| | 54,987,126 |
Precious Metals & Minerals - 1.1% |
Aquarius Platinum Ltd. (United Kingdom) | 492,800 | | 298,221 |
Gem Diamonds Ltd. (a) | 223,600 | | 608,908 |
Impala Platinum Holdings Ltd. | 10,000 | | 179,917 |
Lonmin PLC (d) | 5,922 | | 49,026 |
Northam Platinum Ltd. | 30,500 | | 114,674 |
Pan American Silver Corp. | 92,300 | | 2,024,824 |
Silver Wheaton Corp. | 74,400 | | 2,998,348 |
| | 6,273,918 |
Steel - 6.4% |
African Minerals Ltd. (a) | 612,800 | | 2,702,186 |
Allegheny Technologies, Inc. | 28,000 | | 737,800 |
ArcelorMittal SA Class A unit (d) | 202,400 | | 2,989,448 |
Bradespar SA (PN) | 12,600 | | 186,111 |
Carpenter Technology Corp. | 3,400 | | 165,274 |
Cliffs Natural Resources, Inc. | 26,100 | | 946,647 |
Commercial Metals Co. | 19,550 | | 269,008 |
Eregli Demir ve Celik Fabrikalari T.A.S. | 149,000 | | 177,054 |
Fortescue Metals Group Ltd. (d) | 624,689 | | 2,645,710 |
Gerdau SA sponsored ADR | 179,500 | | 1,577,805 |
Hyundai Steel Co. | 30,714 | | 2,211,323 |
JFE Holdings, Inc. | 119,000 | | 1,677,001 |
Jindal Steel & Power Ltd. | 61,255 | | 442,122 |
London Mining PLC (a) | 1,327,900 | | 3,267,920 |
Maanshan Iron & Steel Ltd. (H Shares) (a) | 977,000 | | 252,127 |
Magnitogorsk Iron & Steel Works OJSC unit (a) | 143,600 | | 619,203 |
Nucor Corp. | 24,600 | | 987,198 |
POSCO | 15,694 | | 4,934,748 |
Reliance Steel & Aluminum Co. | 7,100 | | 385,814 |
Salzgitter AG | 4,700 | | 203,378 |
Sims Metal Management Ltd. | 21,500 | | 210,091 |
Tata Steel Ltd. | 63,017 | | 459,349 |
Thyssenkrupp AG (d) | 56,600 | | 1,287,871 |
Common Stocks - continued |
| Shares | | Value |
METALS & MINING - CONTINUED |
Steel - continued |
Usinas Siderurgicas de Minas Gerais SA - Usiminas (PN-A) (non-vtg.) | 58,700 | | $ 283,522 |
Vale SA (PN-A) sponsored ADR | 403,000 | | 7,169,370 |
Voestalpine AG | 23,100 | | 727,568 |
Yamato Kogyo Co. Ltd. | 9,100 | | 255,457 |
| | 37,771,105 |
TOTAL METALS & MINING | | 207,263,157 |
OIL, GAS & CONSUMABLE FUELS - 32.5% |
Coal & Consumable Fuels - 1.7% |
Alpha Natural Resources, Inc. (a)(d) | 484,337 | | 4,150,768 |
Banpu PCL (For. Reg.) | 8,950 | | 114,392 |
Cameco Corp. | 24,600 | | 477,098 |
China Shenhua Energy Co. Ltd. (H Shares) | 54,000 | | 229,934 |
Paladin Energy Ltd.: | | | |
(Australia) (a) | 46,842 | | 55,189 |
(Canada) (a) | 271,500 | | 320,771 |
Peabody Energy Corp. | 141,600 | | 3,950,640 |
Whitehaven Coal Ltd. | 138,200 | | 437,548 |
Yanzhou Coal Mining Co. Ltd. (H Shares) | 102,000 | | 152,044 |
| | 9,888,384 |
Integrated Oil & Gas - 17.3% |
BG Group PLC | 271,550 | | 5,028,504 |
BP PLC | 1,556,100 | | 11,113,052 |
Cenovus Energy, Inc. | 38,100 | | 1,343,943 |
Chevron Corp. | 105,900 | | 11,671,239 |
China Petroleum & Chemical Corp. (H Shares) | 508,000 | | 535,370 |
ENI SpA | 254,827 | | 5,863,806 |
Exxon Mobil Corp. | 69,961 | | 6,378,344 |
Gazprom OAO sponsored ADR | 474,100 | | 4,333,274 |
Hess Corp. | 51,900 | | 2,712,294 |
InterOil Corp. (a) | 41,300 | | 2,663,024 |
Lukoil Oil Co. sponsored ADR | 39,900 | | 2,401,980 |
Murphy Oil Corp. | 38,700 | | 2,322,000 |
Occidental Petroleum Corp. | 95,100 | | 7,509,096 |
OMV AG | 13,300 | | 486,134 |
Origin Energy Ltd. | 254,563 | | 3,001,870 |
Petroleo Brasileiro SA - Petrobras (PN) sponsored ADR (non-vtg.) | 259,600 | | 5,329,588 |
Common Stocks - continued |
| Shares | | Value |
OIL, GAS & CONSUMABLE FUELS - CONTINUED |
Integrated Oil & Gas - continued |
Repsol YPF SA | 72,671 | | $ 1,452,449 |
Royal Dutch Shell PLC Class A (United Kingdom) | 548,750 | | 18,829,121 |
StatoilHydro ASA | 64,600 | | 1,591,031 |
Suncor Energy, Inc. | 199,432 | | 6,693,327 |
Total SA | 14,900 | | 750,516 |
| | 102,009,962 |
Oil & Gas Exploration & Production - 12.4% |
Anadarko Petroleum Corp. | 127,800 | | 8,793,918 |
Apache Corp. | 90,000 | | 7,447,500 |
Baytex Energy Corp. | 4,300 | | 195,680 |
Bonavista Energy Corp. (d) | 45,000 | | 806,959 |
C&C Energia Ltd. (a) | 284,900 | | 1,660,193 |
Cabot Oil & Gas Corp. | 32,200 | | 1,512,756 |
Canadian Natural Resources Ltd. | 199,200 | | 6,003,424 |
Canadian Oil Sands Ltd. | 8,600 | | 182,548 |
Chesapeake Energy Corp. | 65,700 | | 1,331,082 |
Cimarex Energy Co. | 7,400 | | 423,132 |
CNOOC Ltd. | 120,000 | | 246,957 |
CNOOC Ltd. sponsored ADR (d) | 14,800 | | 3,042,140 |
Cobalt International Energy, Inc. (a) | 99,800 | | 2,076,838 |
Concho Resources, Inc. (a) | 7,000 | | 602,840 |
ConocoPhillips | 3,200 | | 185,120 |
Crew Energy, Inc. (a) | 378,000 | | 2,910,458 |
Denbury Resources, Inc. (a) | 251,900 | | 3,861,627 |
Devon Energy Corp. | 32,600 | | 1,897,646 |
Double Eagle Petroleum Co. (a)(d) | 284,610 | | 1,425,896 |
EOG Resources, Inc. | 14,700 | | 1,712,403 |
EQT Corp. | 4,600 | | 278,898 |
INPEX Corp. | 437 | | 2,490,730 |
Marathon Oil Corp. | 62,600 | | 1,881,756 |
Newfield Exploration Co. (a) | 9,100 | | 246,792 |
Nexen, Inc. | 10,400 | | 248,350 |
Noble Energy, Inc. | 15,800 | | 1,501,158 |
NOVATEK OAO GDR (Reg. S) | 8,700 | | 991,800 |
Oasis Petroleum, Inc. (a) | 3,150 | | 92,516 |
OGX Petroleo e Gas Participacoes SA (a) | 56,600 | | 131,255 |
Oil Search Ltd. ADR | 46,796 | | 361,410 |
Pacific Rubiales Energy Corp. | 1,700 | | 39,983 |
Painted Pony Petroleum Ltd. (a)(e) | 15,000 | | 162,203 |
Painted Pony Petroleum Ltd. Class A (a) | 213,100 | | 2,304,360 |
Common Stocks - continued |
| Shares | | Value |
OIL, GAS & CONSUMABLE FUELS - CONTINUED |
Oil & Gas Exploration & Production - continued |
Pengrowth Energy Corp. (d) | 54,200 | | $ 325,064 |
Penn West Petroleum Ltd. | 160,000 | | 2,077,797 |
PetroBakken Energy Ltd. Class A (d) | 132,900 | | 1,677,966 |
Petrominerales Ltd. | 241,126 | | 1,933,837 |
Pioneer Natural Resources Co. | 11,700 | | 1,236,105 |
QEP Resources, Inc. | 18,100 | | 524,900 |
Rosetta Resources, Inc. (a) | 13,200 | | 607,728 |
Santos Ltd. | 92,100 | | 1,100,407 |
SM Energy Co. | 5,700 | | 307,344 |
Southwestern Energy Co. (a) | 30,900 | | 1,072,230 |
Talisman Energy, Inc. | 86,500 | | 980,406 |
Tullow Oil PLC | 89,300 | | 2,023,275 |
Whiting Petroleum Corp. (a) | 30,100 | | 1,264,802 |
Woodside Petroleum Ltd. | 24,408 | | 871,583 |
| | 73,053,772 |
Oil & Gas Refining & Marketing - 0.8% |
Marathon Petroleum Corp. | 26,850 | | 1,474,871 |
Phillips 66 | 4,100 | | 193,356 |
Tesoro Corp. | 29,900 | | 1,127,529 |
Valero Energy Corp. | 60,700 | | 1,766,370 |
| | 4,562,126 |
Oil & Gas Storage & Transport - 0.3% |
Cheniere Energy, Inc. (a) | 73,900 | | 1,189,051 |
The Williams Companies, Inc. | 18,000 | | 629,820 |
| | 1,818,871 |
TOTAL OIL, GAS & CONSUMABLE FUELS | | 191,333,115 |
PAPER & FOREST PRODUCTS - 3.6% |
Paper Products - 3.6% |
Empresas CMPC SA | 333,075 | | 1,277,197 |
International Paper Co. | 275,700 | | 9,878,331 |
MeadWestvaco Corp. | 800 | | 23,752 |
Nine Dragons Paper (Holdings) Ltd. | 869,000 | | 612,221 |
Nippon Paper Group, Inc. (d) | 86,800 | | 992,715 |
Oji Holdings Corp. | 268,000 | | 785,569 |
Stora Enso Oyj (R Shares) | 487,600 | | 3,076,589 |
UPM-Kymmene Corp. | 405,300 | | 4,339,222 |
| | 20,985,596 |
Common Stocks - continued |
| Shares | | Value |
SPECIALTY RETAIL - 0.4% |
Specialty Stores - 0.4% |
Tsutsumi Jewelry Co. Ltd. | 95,500 | | $ 2,190,411 |
TRADING COMPANIES & DISTRIBUTORS - 0.1% |
Trading Companies & Distributors - 0.1% |
Mitsubishi Corp. | 28,900 | | 515,877 |
TOTAL COMMON STOCKS (Cost $614,116,238) |
586,197,228
|
Money Market Funds - 3.1% |
| | | |
Fidelity Cash Central Fund, 0.19% (b) | 1,525,856 | | 1,525,856 |
Fidelity Securities Lending Cash Central Fund, 0.19% (b)(c) | 16,641,647 | | 16,641,647 |
TOTAL MONEY MARKET FUNDS (Cost $18,167,503) |
18,167,503
|
TOTAL INVESTMENT PORTFOLIO - 102.6% (Cost $632,283,741) | 604,364,731 |
NET OTHER ASSETS (LIABILITIES) - (2.6)% | (15,234,186) |
NET ASSETS - 100% | $ 589,130,545 |
Legend |
(a) Non-income producing |
(b) Affiliated fund that is available only to investment companies and other accounts managed by Fidelity Investments. The rate quoted is the annualized seven-day yield of the fund at period end. A complete unaudited listing of the fund's holdings as of its most recent quarter end is available upon request. In addition, each Fidelity Central Fund's financial statements, which are not covered by the Fund's Report of Independent Registered Public Accounting Firm, are available on the SEC's website or upon request. |
(c) Investment made with cash collateral received from securities on loan. |
(d) Security or a portion of the security is on loan at period end. |
(e) Security exempt from registration under Rule 144A of the Securities Act of 1933. These securities may be resold in transactions exempt from registration, normally to qualified institutional buyers. At the end of the period, the value of these securities amounted to $162,203 or 0.0% of net assets. |
Affiliated Central Funds |
Information regarding fiscal year to date income earned by the Fund from investments in Fidelity Central Funds is as follows: |
Fund | Income earned |
Fidelity Cash Central Fund | $ 6,102 |
Fidelity Securities Lending Cash Central Fund | 447,820 |
Total | $ 453,922 |
Other Information |
The following is a summary of the inputs used, as of October 31, 2012, involving the Fund's assets and liabilities carried at fair value. The inputs or methodology used for valuing securities may not be an indication of the risk associated with investing in those securities. For more information on valuation inputs, and their aggregation into the levels used in the tables below, please refer to the Security Valuation section in the accompanying Notes to Financial Statements. |
Valuation Inputs at Reporting Date: |
Description | Total | Level 1 | Level 2 | Level 3 |
Investments in Securities: | | | | |
Common Stocks | $ 586,197,228 | $ 468,387,561 | $ 117,809,667 | $ - |
Money Market Funds | 18,167,503 | 18,167,503 | - | - |
Total Investments in Securities: | $ 604,364,731 | $ 486,555,064 | $ 117,809,667 | $ - |
The following is a summary of transfers between Level 1 and Level 2 for the period ended October 31, 2012. Transfers are assumed to have occurred at the beginning of the period, and are primarily attributable to the valuation techniques used for foreign equity securities, as discussed in the accompanying Notes to Financial Statements: |
Transfers | Total |
Level 1 to Level 2 | $ 0 |
Level 2 to Level 1 | $ 40,233,339 |
Distribution of investments by country or territory of incorporation, as a percentage of total net assets, is as follows. (Unaudited) |
United States of America | 31.3% |
Canada | 20.9% |
United Kingdom | 18.5% |
Switzerland | 4.3% |
Australia | 3.6% |
Brazil | 2.5% |
Russia | 2.3% |
Bermuda | 2.0% |
Japan | 1.7% |
Italy | 1.3% |
Korea (South) | 1.3% |
Finland | 1.3% |
Norway | 1.2% |
South Africa | 1.1% |
Bailiwick of Jersey | 1.1% |
Others (Individually Less Than 1%) | 5.6% |
| 100.0% |
See accompanying notes which are an integral part of the financial statements.
Annual Report
Statement of Assets and Liabilities
| October 31, 2012 |
| | |
Assets | | |
Investment in securities, at value (including securities loaned of $15,891,643) - See accompanying schedule: Unaffiliated issuers (cost $614,116,238) | $ 586,197,228 | |
Fidelity Central Funds (cost $18,167,503) | 18,167,503 | |
Total Investments (cost $632,283,741) | | $ 604,364,731 |
Receivable for investments sold | | 3,085,957 |
Receivable for fund shares sold | | 635,744 |
Dividends receivable | | 697,233 |
Distributions receivable from Fidelity Central Funds | | 25,559 |
Other receivables | | 25,267 |
Total assets | | 608,834,491 |
| | |
Liabilities | | |
Payable for investments purchased | $ 862,645 | |
Payable for fund shares redeemed | 1,560,012 | |
Accrued management fee | 352,531 | |
Distribution and service plan fees payable | 57,926 | |
Other affiliated payables | 173,018 | |
Other payables and accrued expenses | 56,167 | |
Collateral on securities loaned, at value | 16,641,647 | |
Total liabilities | | 19,703,946 |
| | |
Net Assets | | $ 589,130,545 |
Net Assets consist of: | | |
Paid in capital | | $ 653,044,854 |
Undistributed net investment income | | 4,752,569 |
Accumulated undistributed net realized gain (loss) on investments and foreign currency transactions | | (40,740,018) |
Net unrealized appreciation (depreciation) on investments and assets and liabilities in foreign currencies | | (27,926,860) |
Net Assets | | $ 589,130,545 |
See accompanying notes which are an integral part of the financial statements.
Annual Report
Statement of Assets and Liabilities - continued
| October 31, 2012 |
| | |
Calculation of Maximum Offering Price
Class A:
Net Asset Value and redemption price per share
($99,694,434 ÷ 6,832,148 shares) | | $ 14.59 |
| | |
Maximum offering price per share (100/94.25 of $14.59) | | $ 15.48 |
Class T:
Net Asset Value and redemption price per share ($16,692,439 ÷ 1,147,836 shares) | | $ 14.54 |
| | |
Maximum offering price per share (100/96.50 of $14.54) | | $ 15.07 |
Class B:
Net Asset Value and offering price per share ($3,096,607 ÷ 214,827 shares)A | | $ 14.41 |
| | |
Class C:
Net Asset Value and offering price per share ($31,865,429 ÷ 2,217,584 shares)A | | $ 14.37 |
| | |
Global Commodity Stock:
Net Asset Value, offering price and redemption price per share ($387,241,629 ÷ 26,407,116 shares) | | $ 14.66 |
| | |
Institutional Class:
Net Asset Value, offering price and redemption price per share ($50,540,007 ÷ 3,445,636 shares) | | $ 14.67 |
A Redemption price per share is equal to net asset value less any applicable contingent deferred sales charge.
See accompanying notes which are an integral part of the financial statements.
Annual Report
Financial Statements - continued
Statement of Operations
| Year ended October 31, 2012 |
| | |
Investment Income | | |
Dividends | | $ 14,713,564 |
Interest | | 7,665 |
Income from Fidelity Central Funds | | 453,922 |
Income before foreign taxes withheld | | 15,175,151 |
Less foreign taxes withheld | | (949,994) |
Total income | | 14,225,157 |
| | |
Expenses | | |
Management fee | $ 4,742,379 | |
Transfer agent fees | 1,946,370 | |
Distribution and service plan fees | 749,354 | |
Accounting and security lending fees | 334,777 | |
Custodian fees and expenses | 90,233 | |
Independent trustees' compensation | 4,478 | |
Registration fees | 112,635 | |
Audit | 54,137 | |
Legal | 3,454 | |
Interest | 1,155 | |
Miscellaneous | 9,469 | |
Total expenses before reductions | 8,048,441 | |
Expense reductions | (50,515) | 7,997,926 |
Net investment income (loss) | | 6,227,231 |
Realized and Unrealized Gain (Loss) Net realized gain (loss) on: | | |
Investment securities: | | |
Unaffiliated issuers | (27,052,701) | |
Foreign currency transactions | (554,431) | |
Total net realized gain (loss) | | (27,607,132) |
Change in net unrealized appreciation (depreciation) on: Investment securities (net of increase in deferred foreign taxes of $5,167) | (9,235,369) | |
Assets and liabilities in foreign currencies | 240,281 | |
Total change in net unrealized appreciation (depreciation) | | (8,995,088) |
Net gain (loss) | | (36,602,220) |
Net increase (decrease) in net assets resulting from operations | | $ (30,374,989) |
See accompanying notes which are an integral part of the financial statements.
Annual Report
Statement of Changes in Net Assets
| Year ended
October 31,
2012 | Year ended
October 31,
2011 |
Increase (Decrease) in Net Assets | | |
Operations | | |
Net investment income (loss) | $ 6,227,231 | $ 6,869,450 |
Net realized gain (loss) | (27,607,132) | (6,898,032) |
Change in net unrealized appreciation (depreciation) | (8,995,088) | (67,719,909) |
Net increase (decrease) in net assets resulting
from operations | (30,374,989) | (67,748,491) |
Distributions to shareholders from net investment income | (3,692,921) | (5,045,313) |
Distributions to shareholders from net realized gain | (671,463) | (2,104,800) |
Total distributions | (4,364,384) | (7,150,113) |
Share transactions - net increase (decrease) | (156,629,581) | 418,528,912 |
Redemption fees | 31,600 | 94,436 |
Total increase (decrease) in net assets | (191,337,354) | 343,724,744 |
| | |
Net Assets | | |
Beginning of period | 780,467,899 | 436,743,155 |
End of period (including undistributed net investment income of $4,752,569 and undistributed net investment income of $2,852,890, respectively) | $ 589,130,545 | $ 780,467,899 |
See accompanying notes which are an integral part of the financial statements.
Annual Report
Financial Highlights - Class A
Years ended October 31, | 2012 | 2011 | 2010 | 2009 I |
Selected Per-Share Data | | | | |
Net asset value, beginning of period | $ 15.14 | $ 15.60 | $ 13.29 | $ 10.00 |
Income from Investment Operations | | | | |
Net investment income (loss) E | .11 | .12 | .19 H | (.01) |
Net realized and unrealized gain (loss) | (.59) | (.38) | 2.20 | 3.29 |
Total from investment operations | (.48) | (.26) | 2.39 | 3.28 |
Distributions from net investment income | (.05) | (.13) | - K | - |
Distributions from net realized gain | (.01) | (.06) | (.08) | - |
Total distributions | (.07) M | (.20) L | (.08) | - |
Redemption fees added to paid in capital E | - K | - K | - K | .01 |
Net asset value, end of period | $ 14.59 | $ 15.14 | $ 15.60 | $ 13.29 |
Total Return B,C,D | (3.19)% | (1.80)% | 18.04% | 32.90% |
Ratios to Average Net Assets F,J | | | | |
Expenses before reductions | 1.34% | 1.32% | 1.37% | 1.65% A |
Expenses net of fee waivers, if any | 1.34% | 1.32% | 1.37% | 1.50% A |
Expenses net of all reductions | 1.33% | 1.31% | 1.36% | 1.48% A |
Net investment income (loss) | .80% | .71% | 1.35% H | (.15)% A |
Supplemental Data | | | | |
Net assets, end of period (000 omitted) | $ 99,694 | $ 127,979 | $ 60,370 | $ 15,705 |
Portfolio turnover rate G | 91% | 71% | 54% | 25% A |
A Annualized
B Total returns for periods of less than one year are not annualized.
C Total returns would have been lower if certain expenses had not been reduced during the applicable periods shown.
D Total returns do not include the effect of the sales charges.
E Calculated based on average shares outstanding during the period.
F Fees and expenses of any underlying Fidelity Central Funds are not included in the Fund's expense ratio. The Fund indirectly bears its proportionate share of the expenses of any underlying Fidelity Central Funds.
G Amount does not include the portfolio activity of any underlying Fidelity Central Funds.
H Investment income per share reflects a large, non-recurring dividend which amounted to $.13 per share. Excluding this non-recurring dividend, the ratio of net investment income (loss) to average net assets would have been .42%.
I For the period March 25, 2009 (commencement of operations) to October 31, 2009.
J Expense ratios reflect operating expenses of the class. Expenses before reductions do not reflect amounts reimbursed by the investment adviser or reductions from brokerage service arrangements or reductions from other expense offset arrangements and do not represent the amount paid by the class during periods when reimbursements or reductions occur. Expense ratios before reductions for start-up periods may not be representative of longer-term operating periods. Expenses net of fee waivers reflect expenses after reimbursement by the investment adviser but prior to reductions from brokerage service arrangements or other expense offset arrangements. Expenses net of all reductions represent the net expenses paid by the class.
K Amount represents less than $.01 per share.
L Total distributions of $.20 per share is comprised of distributions from net investment income of $.133 and distributions from net realized gain of $.062 per share.
M Total distributions of $.07 per share is comprised of distributions from net investment income of $.052 and distributions from net realized gain of $.014 per share.
See accompanying notes which are an integral part of the financial statements.
Annual Report
Financial Highlights - Class T
Years ended October 31, | 2012 | 2011 | 2010 | 2009 I |
Selected Per-Share Data | | | | |
Net asset value, beginning of period | $ 15.08 | $ 15.55 | $ 13.27 | $ 10.00 |
Income from Investment Operations | | | | |
Net investment income (loss) E | .08 | .07 | .16 H | (.03) |
Net realized and unrealized gain (loss) | (.60) | (.38) | 2.19 | 3.29 |
Total from investment operations | (.52) | (.31) | 2.35 | 3.26 |
Distributions from net investment income | (.01) | (.10) | - | - |
Distributions from net realized gain | (.01) | (.06) | (.07) | - |
Total distributions | (.02) | (.16) | (.07) | - |
Redemption fees added to paid in capital E | - K | - K | - K | .01 |
Net asset value, end of period | $ 14.54 | $ 15.08 | $ 15.55 | $ 13.27 |
Total Return B,C,D | (3.43)% | (2.09)% | 17.73% | 32.70% |
Ratios to Average Net Assets F,J | | | | |
Expenses before reductions | 1.61% | 1.60% | 1.63% | 2.04% A |
Expenses net of fee waivers, if any | 1.61% | 1.60% | 1.63% | 1.75% A |
Expenses net of all reductions | 1.60% | 1.59% | 1.61% | 1.73% A |
Net investment income (loss) | .53% | .43% | 1.10% H | (.40)% A |
Supplemental Data | | | | |
Net assets, end of period (000 omitted) | $ 16,692 | $ 20,831 | $ 11,762 | $ 4,665 |
Portfolio turnover rate G | 91% | 71% | 54% | 25% A |
A Annualized
B Total returns for periods of less than one year are not annualized.
C Total returns would have been lower if certain expenses had not been reduced during the applicable periods shown.
D Total returns do not include the effect of the sales charges.
E Calculated based on average shares outstanding during the period.
F Fees and expenses of any underlying Fidelity Central Funds are not included in the Fund's expense ratio. The Fund indirectly bears its proportionate share of the expenses of any underlying Fidelity Central Funds.
G Amount does not include the portfolio activity of any underlying Fidelity Central Funds.
H Investment income per share reflects a large, non-recurring dividend which amounted to $.13 per share. Excluding this non-recurring dividend, the ratio of net investment income (loss) to average net assets would have been .17%.
I For the period March 25, 2009 (commencement of operations) to October 31, 2009.
J Expense ratios reflect operating expenses of the class. Expenses before reductions do not reflect amounts reimbursed by the investment adviser or reductions from brokerage service arrangements or reductions from other expense offset arrangements and do not represent the amount paid by the class during periods when reimbursements or reductions occur. Expense ratios before reductions for start-up periods may not be representative of longer-term operating periods. Expenses net of fee waivers reflect expenses after reimbursement by the investment adviser but prior to reductions from brokerage service arrangements or other expense offset arrangements. Expenses net of all reductions represent the net expenses paid by the class.
K Amount represents less than $.01 per share.
See accompanying notes which are an integral part of the financial statements.
Annual Report
Financial Highlights - Class B
Years ended October 31, | 2012 | 2011 | 2010 | 2009 I |
Selected Per-Share Data | | | | |
Net asset value, beginning of period | $ 15.00 | $ 15.46 | $ 13.22 | $ 10.00 |
Income from Investment Operations | | | | |
Net investment income (loss) E | - K | (.01) | .08 H | (.07) |
Net realized and unrealized gain (loss) | (.59) | (.39) | 2.20 | 3.28 |
Total from investment operations | (.59) | (.40) | 2.28 | 3.21 |
Distributions from net realized gain | - | (.06) | (.04) | - |
Redemption fees added to paid in capital E | - K | - K | - K | .01 |
Net asset value, end of period | $ 14.41 | $ 15.00 | $ 15.46 | $ 13.22 |
Total Return B,C,D | (3.93)% | (2.62)% | 17.23% | 32.20% |
Ratios to Average Net Assets F,J | | | | |
Expenses before reductions | 2.10% | 2.11% | 2.16% | 2.66% A |
Expenses net of fee waivers, if any | 2.10% | 2.11% | 2.16% | 2.25% A |
Expenses net of all reductions | 2.10% | 2.10% | 2.15% | 2.23% A |
Net investment income (loss) | .03% | (.09)% | .56% H | (.90)% A |
Supplemental Data | | | | |
Net assets, end of period (000 omitted) | $ 3,097 | $ 4,324 | $ 4,348 | $ 2,726 |
Portfolio turnover rate G | 91% | 71% | 54% | 25% A |
A Annualized
B Total returns for periods of less than one year are not annualized.
C Total returns would have been lower if certain expenses had not been reduced during the applicable periods shown.
D Total returns do not include the effect of the contingent deferred sales charge.
E Calculated based on average shares outstanding during the period.
F Fees and expenses of any underlying Fidelity Central Funds are not included in the Fund's expense ratio. The Fund indirectly bears its proportionate share of the expenses of any underlying Fidelity Central Funds.
G Amount does not include the portfolio activity of any underlying Fidelity Central Funds.
H Investment income per share reflects a large, non-recurring dividend which amounted to $.13 per share. Excluding this non-recurring dividend, the ratio of net investment income (loss) to average net assets would have been (.37)%.
I For the period March 25, 2009 (commencement of operations) to October 31, 2009.
J Expense ratios reflect operating expenses of the class. Expenses before reductions do not reflect amounts reimbursed by the investment adviser or reductions from brokerage service arrangements or reductions from other expense offset arrangements and do not represent the amount paid by the class during periods when reimbursements or reductions occur. Expense ratios before reductions for start-up periods may not be representative of longer-term operating periods. Expenses net of fee waivers reflect expenses after reimbursement by the investment adviser but prior to reductions from brokerage service arrangements or other expense offset arrangements. Expenses net of all reductions represent the net expenses paid by the class.
K Amount represents less than $.01 per share.
See accompanying notes which are an integral part of the financial statements.
Annual Report
Financial Highlights - Class C
Years ended October 31, | 2012 | 2011 | 2010 | 2009 I |
Selected Per-Share Data | | | | |
Net asset value, beginning of period | $ 14.95 | $ 15.45 | $ 13.22 | $ 10.00 |
Income from Investment Operations | | | | |
Net investment income (loss) E | .01 | (.01) | .08 H | (.07) |
Net realized and unrealized gain (loss) | (.59) | (.38) | 2.19 | 3.28 |
Total from investment operations | (.58) | (.39) | 2.27 | 3.21 |
Distributions from net investment income | - | (.05) | - | - |
Distributions from net realized gain | - | (.06) | (.04) | - |
Total distributions | - | (.11) | (.04) | - |
Redemption fees added to paid in capital E | - K | - K | - K | .01 |
Net asset value, end of period | $ 14.37 | $ 14.95 | $ 15.45 | $ 13.22 |
Total Return B,C,D | (3.88)% | (2.58)% | 17.21% | 32.20% |
Ratios to Average Net Assets F,J | | | | |
Expenses before reductions | 2.10% | 2.09% | 2.14% | 2.53% A |
Expenses net of fee waivers, if any | 2.10% | 2.09% | 2.14% | 2.25% A |
Expenses net of all reductions | 2.09% | 2.08% | 2.13% | 2.23% A |
Net investment income (loss) | .03% | (.07)% | .58% H | (.90)% A |
Supplemental Data | | | | |
Net assets, end of period (000 omitted) | $ 31,865 | $ 37,185 | $ 14,338 | $ 4,798 |
Portfolio turnover rate G | 91% | 71% | 54% | 25% A |
A Annualized
B Total returns for periods of less than one year are not annualized.
C Total returns would have been lower if certain expenses had not been reduced during the applicable periods shown.
D Total returns do not include the effect of the contingent deferred sales charge.
E Calculated based on average shares outstanding during the period.
F Fees and expenses of any underlying Fidelity Central Funds are not included in the Fund's expense ratio. The Fund indirectly bears its proportionate share of the expenses of any underlying Fidelity Central Funds.
G Amount does not include the portfolio activity of any underlying Fidelity Central Funds.
H Investment income per share reflects a large, non-recurring dividend which amounted to $.13 per share. Excluding this non-recurring dividend, the ratio of net investment income (loss) to average net assets would have been (.34)%.
I For the period March 25, 2009 (commencement of operations) to October 31, 2009.
J Expense ratios reflect operating expenses of the class. Expenses before reductions do not reflect amounts reimbursed by the investment adviser or reductions from brokerage service arrangements or reductions from other expense offset arrangements and do not represent the amount paid by the class during periods when reimbursements or reductions occur. Expense ratios before reductions for start-up periods may not be representative of longer-term operating periods. Expenses net of fee waivers reflect expenses after reimbursement by the investment adviser but prior to reductions from brokerage service arrangements or other expense offset arrangements. Expenses net of all reductions represent the net expenses paid by the class.
K Amount represents less than $.01 per share.
See accompanying notes which are an integral part of the financial statements.
Annual Report
Financial Highlights - Global Commodity Stock
Years ended October 31, | 2012 | 2011 | 2010 | 2009 H |
Selected Per-Share Data | | | | |
Net asset value, beginning of period | $ 15.21 | $ 15.66 | $ 13.31 | $ 10.00 |
Income from Investment Operations | | | | |
Net investment income (loss) D | .15 | .16 | .23 G | .01 |
Net realized and unrealized gain (loss) | (.60) | (.39) | 2.21 | 3.29 |
Total from investment operations | (.45) | (.23) | 2.44 | 3.30 |
Distributions from net investment income | (.08) | (.16) | (.01) | - |
Distributions from net realized gain | (.01) | (.06) | (.08) | - |
Total distributions | (.10) K | (.22) | (.09) | - |
Redemption fees added to paid in capital D | - J | - J | - J | .01 |
Net asset value, end of period | $ 14.66 | $ 15.21 | $ 15.66 | $ 13.31 |
Total Return B,C | (2.96)% | (1.59)% | 18.38% | 33.10% |
Ratios to Average Net Assets E,I | | | | |
Expenses before reductions | 1.10% | 1.08% | 1.10% | 1.42% A |
Expenses net of fee waivers, if any | 1.10% | 1.08% | 1.10% | 1.25% A |
Expenses net of all reductions | 1.09% | 1.07% | 1.09% | 1.23% A |
Net investment income (loss) | 1.04% | .95% | 1.62% G | .10% A |
Supplemental Data | | | | |
Net assets, end of period (000 omitted) | $ 387,242 | $ 531,224 | $ 310,186 | $ 159,439 |
Portfolio turnover rate F | 91% | 71% | 54% | 25% A |
A Annualized
B Total returns for periods of less than one year are not annualized.
C Total returns would have been lower if certain expenses had not been reduced during the applicable periods shown.
D Calculated based on average shares outstanding during the period.
E Fees and expenses of any underlying Fidelity Central Funds are not included in the Fund's expense ratio. The Fund indirectly bears its proportionate share of the expenses of any underlying Fidelity Central Funds.
F Amount does not include the portfolio activity of any underlying Fidelity Central Funds.
G Investment income per share reflects a large, non-recurring dividend which amounted to $.13 per share. Excluding this non-recurring dividend, the ratio of net investment income (loss) to average net assets would have been .69%.
H For the period March 25, 2009 (commencement of operations) to October 31, 2009.
I Expense ratios reflect operating expenses of the class. Expenses before reductions do not reflect amounts reimbursed by the investment adviser or reductions from brokerage service arrangements or reductions from other expense offset arrangements and do not represent the amount paid by the class during periods when reimbursements or reductions occur. Expense ratios before reductions for start-up periods may not be representative of longer-term operating periods. Expenses net of fee waivers reflect expenses after reimbursement by the investment adviser but prior to reductions from brokerage service arrangements or other expense offset arrangements. Expenses net of all reductions represent the net expenses paid by the class.
J Amount represents less than $.01 per share.
K Total distributions of $.10 per share is comprised of distributions from net investment income of $.084 and distributions from net realized gain of $.014 per share.
See accompanying notes which are an integral part of the financial statements.
Annual Report
Financial Highlights - Institutional Class
Years ended October 31, | 2012 | 2011 | 2010 | 2009 H |
Selected Per-Share Data | | | | |
Net asset value, beginning of period | $ 15.22 | $ 15.66 | $ 13.31 | $ 10.00 |
Income from Investment Operations | | | | |
Net investment income (loss) D | .16 | .16 | .23 G | .01 |
Net realized and unrealized gain (loss) | (.60) | (.38) | 2.21 | 3.29 |
Total from investment operations | (.44) | (.22) | 2.44 | 3.30 |
Distributions from net investment income | (.09) | (.16) | (.01) | - |
Distributions from net realized gain | (.01) | (.06) | (.08) | - |
Total distributions | (.11) K | (.22) | (.09) | - |
Redemption fees added to paid in capital D | - J | - J | - J | .01 |
Net asset value, end of period | $ 14.67 | $ 15.22 | $ 15.66 | $ 13.31 |
Total Return B,C | (2.90)% | (1.50)% | 18.39% | 33.10% |
Ratios to Average Net Assets E,I | | | | |
Expenses before reductions | 1.04% | 1.03% | 1.09% | 1.36% A |
Expenses net of fee waivers, if any | 1.04% | 1.03% | 1.09% | 1.25% A |
Expenses net of all reductions | 1.03% | 1.03% | 1.07% | 1.23% A |
Net investment income (loss) | 1.10% | .99% | 1.64% G | .10% A |
Supplemental Data | | | | |
Net assets, end of period (000 omitted) | $ 50,540 | $ 58,925 | $ 35,739 | $ 9,811 |
Portfolio turnover rate F | 91% | 71% | 54% | 25% A |
A Annualized
B Total returns for periods of less than one year are not annualized.
C Total returns would have been lower if certain expenses had not been reduced during the applicable periods shown.
D Calculated based on average shares outstanding during the period.
E Fees and expenses of any underlying Fidelity Central Funds are not included in the Fund's expense ratio. The Fund indirectly bears its proportionate share of the expenses of any underlying Fidelity Central Funds.
F Amount does not include the portfolio activity of any underlying Fidelity Central Funds.
G Investment income per share reflects a large, non-recurring dividend which amounted to $.13 per share. Excluding this non-recurring dividend, the ratio of net investment income (loss) to average net assets would have been .71%.
H For the period March 25, 2009 (commencement of operations) to October 31, 2009.
I Expense ratios reflect operating expenses of the class. Expenses before reductions do not reflect amounts reimbursed by the investment adviser or reductions from brokerage service arrangements or reductions from other expense offset arrangements and do not represent the amount paid by the class during periods when reimbursements or reductions occur. Expense ratios before reductions for start-up periods may not be representative of longer-term operating periods. Expenses net of fee waivers reflect expenses after reimbursement by the investment adviser but prior to reductions from brokerage service arrangements or other expense offset arrangements. Expenses net of all reductions represent the net expenses paid by the class.
J Amount represents less than $.01 per share.
K Total distributions of $.11 per share is comprised of distributions from net investment income of $.093 and distributions from net realized gain of $.014 per share.
See accompanying notes which are an integral part of the financial statements.
Annual Report
Notes to Financial Statements
For the period ended October 31, 2012
1. Organization.
Fidelity® Global Commodity Stock Fund (the Fund) is a non-diversified fund of Fidelity Investment Trust (the Trust) and is authorized to issue an unlimited number of shares. The Trust is registered under the Investment Company Act of 1940, as amended (the 1940 Act), as an open-end management investment company organized as a Massachusetts business trust. The Fund offers Class A, Class T, Class C, Global Commodity Stock and Institutional Class shares, each of which, along with Class B shares, has equal rights as to assets and voting privileges. Effective after the close of business on September 1, 2010, Class B shares were closed to new accounts and additional purchases, except for exchanges and reinvestments. Each class has exclusive voting rights with respect to matters that affect that class. Class B shares will automatically convert to Class A shares after a holding period of seven years from the initial date of purchase. Investment income, realized and unrealized capital gains and losses, the common expenses of the Fund, and certain fund-level expense reductions, if any, are allocated on a pro-rata basis to each class based on the relative net assets of each class to the total net assets of the Fund. Each class differs with respect to transfer agent and distribution and service plan fees incurred. Certain expense reductions may also differ by class. The Fund's investments in emerging markets can be subject to social, economic, regulatory, and political uncertainties and can be extremely volatile.
2. Investments in Fidelity Central Funds.
The Fund invests in Fidelity Central Funds, which are open-end investment companies available only to other investment companies and accounts managed by Fidelity Management & Research Company (FMR) and its affiliates. The Fund's Schedule of Investments lists each of the Fidelity Central Funds held as of period end, if any, as an investment of the Fund, but does not include the underlying holdings of each Fidelity Central Fund. As an Investing Fund, the Fund indirectly bears its proportionate share of the expenses of the underlying Fidelity Central Funds.
The Money Market Central Funds seek preservation of capital and current income and are managed by Fidelity Investments Money Management, Inc. (FIMM), an affiliate of FMR.
A complete unaudited list of holdings for each Fidelity Central Fund is available upon request or at the Securities and Exchange Commission (the SEC) web site at www.sec.gov. In addition, the financial statements of the Fidelity Central Funds, which are not covered by the Fund's Report of Independent Registered Public Accounting Firm, are available on the SEC web site or upon request.
Annual Report
3. Significant Accounting Policies.
The financial statements have been prepared in conformity with accounting principles generally accepted in the United States of America (GAAP), which require management to make certain estimates and assumptions at the date of the financial statements. Actual results could differ from those estimates. Subsequent events, if any, through the date that the financial statements were issued have been evaluated in the preparation of the financial statements. The following summarizes the significant accounting policies of the Fund:
Security Valuation. Investments are valued as of 4:00 p.m. Eastern time on the last calendar day of the period. In accordance with valuation policies and procedures approved by the Board of Trustees (the Board), the Fund attempts to obtain prices from one or more third party pricing vendors or brokers to value its investments. When current market prices, quotations or rates are not readily available or reliable, securities will be fair valued in good faith by the FMR Fair Value Committee (the Committee), in accordance with procedures adopted by the Fund's Board. Factors used in determining fair value vary by security type and may include market or security specific events. The frequency with which these procedures are used cannot be predicted and they may be utilized to a significant extent. The Committee oversees the Fund's valuation policies and procedures and is responsible for approving and reporting to the Board all fair value determinations.
The Fund categorizes the inputs to valuation techniques used to value its investments into a disclosure hierarchy consisting of three levels as shown below:
Level 1 - quoted prices in active markets for identical investments
Level 2 - other significant observable inputs (including quoted prices for similar investments, interest rates, prepayment speeds, etc.)
Level 3 - unobservable inputs (including the Fund's own assumptions based on the best information available)
Valuation techniques used to value the Fund's investments by major category are as follows:
Equity securities, including restricted securities, for which market quotations are readily available, are valued at the last reported sale price or official closing price as reported by a third party pricing vendor on the primary market or exchange on which they are traded and are categorized as Level 1 in the hierarchy. In the event there were no sales during the day or closing prices are not available, securities are valued at the last quoted bid price or may be valued using the last available price and are generally categorized as Level 2 in the hierarchy. For foreign equity securities, when significant market or security specific events arise, comparisons to the valuation of American Depositary Receipts
Annual Report
Notes to Financial Statements - continued
3. Significant Accounting Policies - continued
Security Valuation - continued
(ADRs), futures contracts, Exchange-Traded Funds (ETFs) and certain indexes as well as quoted prices for similar securities are used and are categorized as Level 2 in the hierarchy. Utilizing these techniques may result in transfers between Level 1 and Level 2.
Investments in open-end mutual funds, including the Fidelity Central Funds, are valued at their closing net asset value (NAV) each business day and are categorized as Level 1 in the hierarchy.
Changes in valuation techniques may result in transfers in or out of an assigned level within the disclosure hierarchy. The aggregate value of investments by input level, as of October 31, 2012, including information on transfers between Levels 1 and 2, is included at the end of the Fund's Schedule of Investments.
Foreign Currency Translation. The Fund may use foreign currency contracts to facilitate transactions in foreign-denominated securities. Gains and losses from these transactions may arise from changes in the value of the foreign currency or if the counterparties do not perform under the contracts' terms.
Foreign-denominated assets, including investment securities, and liabilities are translated into U.S. dollars at the exchange rates at period end. Purchases and sales of investment securities, income and dividends received and expenses denominated in foreign currencies are translated into U.S. dollars at the exchange rate in effect on the transaction date.
The effects of exchange rate fluctuations on investments are included with the net realized and unrealized gain (loss) on investment securities. Other foreign currency transactions resulting in realized and unrealized gain (loss) are disclosed separately.
Investment Transactions and Income. For financial reporting purposes, the Fund's investment holdings and NAV include trades executed through the end of the last business day of the period. The NAV per share for processing shareholder transactions is calculated as of the close of business of the New York Stock Exchange (NYSE), normally 4:00 p.m. Eastern time and includes trades executed through the end of the prior business day. Gains and losses on securities sold are determined on the basis of identified cost. Dividend income is recorded on the ex-dividend date, except for certain dividends from foreign securities where the ex-dividend date may have passed, which are recorded as soon as the Fund is informed of the ex-dividend date. Non-cash dividends included in dividend income, if any, are recorded at the fair market value of the securities received. Distributions received on securities that represent a return of capital or capital gain are recorded as a reduction of cost of investments and/or as a realized gain. The Fund
Annual Report
3. Significant Accounting Policies - continued
Investment Transactions and Income - continued
estimates the components of distributions received that may be considered return of capital distributions or capital gain distributions. Interest income and distributions from the Fidelity Central Funds are accrued as earned. Interest income includes coupon interest and amortization of premium and accretion of discount on debt securities. Investment income is recorded net of foreign taxes withheld where recovery of such taxes is uncertain.
Expenses. Expenses directly attributable to a fund are charged to that fund. Expenses attributable to more than one fund are allocated among the respective funds on the basis of relative net assets or other appropriate methods. Expense estimates are accrued in the period to which they relate and adjustments are made when actual amounts are known.
Income Tax Information and Distributions to Shareholders. Each year, the Fund intends to qualify as a regulated investment company under Subchapter M of the Internal Revenue Code, including distributing substantially all of its taxable income and realized gains. As a result, no provision for income taxes is required. As of October 31, 2012, the Fund did not have any unrecognized tax benefits in the financial statements; nor is the Fund aware of any tax positions for which it is reasonably possible that the total amounts of unrecognized tax benefits will significantly change in the next twelve months. The Fund files a U.S. federal tax return, in addition to state and local tax returns as required. A fund's federal income tax returns are subject to examination by the Internal Revenue Service (IRS) for a period of three fiscal years after they are filed. State and local tax returns may be subject to examination for an additional fiscal year depending on the jurisdiction. Foreign taxes are provided for based on the Fund's understanding of the tax rules and rates that exist in the foreign markets in which it invests.
Distributions are declared and recorded on the ex-dividend date. Income dividends and capital gain distributions are declared separately for each class. Income and capital gain distributions are determined in accordance with income tax regulations, which may differ from GAAP. In addition, the Fund claimed a portion of the payment made to redeeming shareholders as a distribution for income tax purposes.
Capital accounts within the financial statements are adjusted for permanent book-tax differences. These adjustments have no impact on net assets or the results of operations. Temporary book-tax differences will reverse in a subsequent period.
Book-tax differences are primarily due to foreign currency transactions, certain foreign taxes, passive foreign investment companies (PFIC), partnerships, capital loss carryforwards and losses deferred due to wash sales.
Annual Report
Notes to Financial Statements - continued
3. Significant Accounting Policies - continued
Income Tax Information and Distributions to Shareholders - continued
The federal tax cost of investment securities and unrealized appreciation (depreciation) as of period end were as follows:
Gross unrealized appreciation | $ 39,956,815 |
Gross unrealized depreciation | (75,456,352) |
Net unrealized appreciation (depreciation) on securities and other investments | $ (35,499,537) |
| |
Tax Cost | $ 639,864,268 |
The tax-based components of distributable earnings as of period end were as follows:
Undistributed ordinary income | $ 4,752,569 |
Capital loss carryforward | $ (33,159,492) |
Net unrealized appreciation (depreciation) | $ (35,507,387) |
Capital loss carryforwards are only available to offset future capital gains of the Fund to the extent provided by regulations and may be limited. Under the Regulated Investment Company Modernization Act of 2010 (the Act), the Fund is permitted to carry forward capital losses incurred in taxable years beginning after December 22, 2010 for an unlimited period and such capital losses are required to be used prior to any losses that expire. Capital loss carryforwards were as follows:
Fiscal year of expiration | |
2019 | $ (6,952,413) |
No expiration | |
Short-term | (26,207,079) |
Total capital loss carryforward | $ (33,159,492) |
The tax character of distributions paid was as follows:
| October 31, 2012 | October 31, 2011 |
Ordinary Income | $ 4,364,384 | $ 5,112,665 |
Long-term Capital Gains | - | 2,037,448 |
Total | $ 4,364,384 | $ 7,150,113 |
Annual Report
3. Significant Accounting Policies - continued
Short-Term Trading (Redemption) Fees. Shares held by investors in the Fund less than 30 days are subject to a redemption fee equal to 1.00% of the net asset value of shares redeemed. All redemption fees, which reduce the proceeds of the shareholder redemption, are retained by the Fund and accounted for as an addition to paid in capital.
Restricted Securities. The Fund may invest in securities that are subject to legal or contractual restrictions on resale. These securities generally may be resold in transactions exempt from registration or to the public if the securities are registered. Disposal of these securities may involve time-consuming negotiations and expense, and prompt sale at an acceptable price may be difficult. Information regarding restricted securities is included at the end of the Fund's Schedule of Investments.
New Accounting Pronouncement. In December 2011, the Financial Accounting Standards Board issued Accounting Standard Update No. 2011-11, Disclosures about Offsetting Assets and Liabilities. The update creates new disclosure requirements requiring entities to disclose both gross and net information for derivatives and other financial instruments that are either offset in the Statement of Assets and Liabilities or subject to an enforceable master netting arrangement or similar agreement. The disclosure requirements are effective for annual reporting periods beginning on or after January 1, 2013, and interim periods within those annual periods. Management is currently evaluating the impact of the update's adoption on the Fund's financial statement disclosures.
4. Purchases and Sales of Investments.
Purchases and sales of securities, other than short-term securities, aggregated $608,021,633 and $755,930,501, respectively.
5. Fees and Other Transactions with Affiliates.
Management Fee. FMR and its affiliates provide the Fund with investment management related services for which the Fund pays a monthly management fee. The management fee is the sum of an individual fund fee rate that is based on an annual rate of .45% of the Fund's average net assets and an annualized group fee rate that averaged .26% during the period. The group fee rate is based upon the average net assets of all the mutual funds advised by FMR. The group fee rate decreases as assets under management increase and increases as assets under management decrease. For the period, the total annual management fee rate was .71% of the Fund's average net assets.
Annual Report
Notes to Financial Statements - continued
5. Fees and Other Transactions with Affiliates - continued
Distribution and Service Plan Fees. In accordance with Rule 12b-1 of the 1940 Act, the Fund has adopted separate Distribution and Service Plans for each class of shares. Certain classes pay Fidelity Distributors Corporation (FDC), an affiliate of FMR, separate Distribution and Service Fees, each of which is based on an annual percentage of each class' average net assets. In addition, FDC may pay financial intermediaries for selling shares of the Fund and providing shareholder support services. For the period, the Distribution and Service Fee rates, total fees and amounts retained by FDC were as follows:
| Distribution
Fee | Service
Fee | Total Fees | Retained
by FDC |
Class A | -% | .25% | $ 280,172 | $ 5,920 |
Class T | .25% | .25% | 93,536 | 148 |
Class B | .75% | .25% | 36,080 | 27,074 |
Class C | .75% | .25% | 339,566 | 113,885 |
| | | $ 749,354 | $ 147,027 |
Sales Load. FDC may receive a front-end sales charge of up to 5.75% for selling Class A shares and 3.50% for selling Class T shares, some of which is paid to financial intermediaries for selling shares of the Fund. Depending on the holding period, FDC may receive contingent deferred sales charges levied on Class A, Class T, Class B, and Class C redemptions. The deferred sales charges range from 5.00% to 1.00% for Class B shares, 1.00% for Class C shares, 1.00% for certain purchases of Class A shares and .25% for certain purchases of Class T shares.
For the period, sales charge amounts retained by FDC were as follows:
| Retained
by FDC |
Class A | $ 36,090 |
Class T | 5,451 |
Class B* | 24,757 |
Class C* | 11,858 |
| $ 78,156 |
* When Class B and Class C shares are initially sold, FDC pays commissions from its own resources to financial intermediaries through which the sales are made.
Annual Report
5. Fees and Other Transactions with Affiliates - continued
Transfer Agent Fees. Fidelity Investments Institutional Operations Company, Inc. (FIIOC), an affiliate of FMR, is the transfer, dividend disbursing and shareholder servicing agent for each class of the Fund. FIIOC receives account fees and asset-based fees that vary according to the account size and type of account of the shareholders of the respective classes of the Fund. FIIOC pays for typesetting, printing and mailing of shareholder reports, except proxy statements. For the period, transfer agent fees for each class were as follows:
| Amount | % of
Average
Net Assets |
Class A | $ 321,673 | .29 |
Class T | 56,848 | .30 |
Class B | 10,811 | .30 |
Class C | 101,040 | .30 |
Global Commodity Stock | 1,331,070 | .30 |
Institutional Class | 124,928 | .24 |
| $ 1,946,370 | |
Accounting and Security Lending Fees. Fidelity Service Company, Inc. (FSC), an affiliate of FMR, maintains the Fund's accounting records. The accounting fee is based on the level of average net assets for each month. Under a separate contract, FSC administers the security lending program. The security lending fee is based on the number and duration of lending transactions.
Brokerage Commissions. The Fund placed a portion of its portfolio transactions with brokerage firms which are affiliates of the investment adviser. The commissions paid to these affiliated firms were $6,902 for the period.
Interfund Lending Program. Pursuant to an Exemptive Order issued by the SEC, the Fund, along with other registered investment companies having management contracts with FMR, may participate in an interfund lending program. This program provides an alternative credit facility allowing the funds to borrow from, or lend money to, other participating affiliated funds. At period end, there were no interfund loans outstanding. The Fund's activity in this program during the period for which loans were outstanding was as follows:
Borrower or Lender | Average Loan
Balance | Weighted Average Interest Rate | Interest Expense |
Borrower | $ 2,814,765 | .41% | $ 1,098 |
Annual Report
Notes to Financial Statements - continued
6. Committed Line of Credit.
The Fund participates with other funds managed by FMR or an affiliate in a $4.25 billion credit facility (the "line of credit") to be utilized for temporary or emergency purposes to fund shareholder redemptions or for other short-term liquidity purposes. The Fund has agreed to pay commitment fees on its pro-rata portion of the line of credit, which amounted to $1,897 and is reflected in Miscellaneous expenses on the Statement of Operations. During the period, there were no borrowings on this line of credit.
7. Security Lending.
The Fund lends portfolio securities through a lending agent from time to time in order to earn additional income. For equity securities, a lending agent is used and may loan securities to certain qualified borrowers, including Fidelity Capital Markets (FCM), a broker-dealer affiliated with the Fund. On the settlement date of the loan, the Fund receives collateral (in the form of U.S. Treasury obligations, letters of credit and/or cash) against the loaned securities and maintains collateral in an amount not less than 100% of the market value of the loaned securities during the period of the loan. The market value of the loaned securities is determined at the close of business of the Fund and any additional required collateral is delivered to the Fund on the next business day. If the borrower defaults on its obligation to return the securities loaned because of insolvency or other reasons, a fund could experience delays and costs in recovering the securities loaned or in gaining access to the collateral. Any cash collateral received is invested in the Fidelity Securities Lending Cash Central Fund. The value of loaned securities and cash collateral at period end are disclosed on the Fund's Statement of Assets and Liabilities. Security lending income represents the income earned on investing cash collateral, less rebates paid to borrowers and any lending agent fees associated with the loan, plus any premium payments received for lending certain types of securities. Security lending income is presented in the Statement of Operations as a component of income from Fidelity Central Funds. Total security lending income during the period amounted to $447,820. During the period, there were no securities loaned to FCM.
8. Bank Borrowings.
The Fund is permitted to have bank borrowings for temporary or emergency purposes to fund shareholder redemptions or for other short-term liquidity requirements. The Fund has established borrowing arrangements with certain banks. The interest rate on the borrowings is the bank's base rate, as revised from time to time. The average loan balance during the period for which loans were outstanding amounted to $1,543,000. The weighted average interest rate was .66%. The interest expense amounted to $57 under the bank borrowing program. At period end, there were no bank borrowings outstanding.
Annual Report
9. Expense Reductions.
Many of the brokers with whom FMR places trades on behalf of the Fund provided services to the Fund in addition to trade execution. These services included payments of certain expenses on behalf of the Fund totaling $50,515 for the period.
10. Distributions to Shareholders.
Distributions to shareholders of each class were as follows:
Years ended October 31, | 2012 | 2011 |
From net investment income | | |
Class A | $ 437,422 | $ 597,144 |
Class T | 12,232 | 82,038 |
Class C | - | 56,214 |
Global Commodity Stock | 2,878,965 | 3,895,270 |
Institutional Class | 364,302 | 414,647 |
Total | $ 3,692,921 | $ 5,045,313 |
From net realized gain | | |
Class A | $ 117,768 | $ 275,211 |
Class T | 19,027 | 52,381 |
Class B | - | 16,866 |
Class C | - | 68,717 |
Global Commodity Stock | 479,827 | 1,532,256 |
Institutional Class | 54,841 | 159,369 |
Total | $ 671,463 | $ 2,104,800 |
11. Share Transactions.
Transactions for each class of shares were as follows:
| Shares | Dollars |
Years ended October 31, | 2012 | 2011 | 2012 | 2011 |
Class A | | | | |
Shares sold | 1,675,922 | 7,297,574 | $ 24,194,276 | $ 124,882,197 |
Reinvestment of distributions | 32,805 | 39,060 | 472,060 | 643,900 |
Shares redeemed | (3,329,384) | (2,752,883) | (47,357,051) | (44,565,640) |
Net increase (decrease) | (1,620,657) | 4,583,751 | $ (22,690,715) | $ 80,960,457 |
Class T | | | | |
Shares sold | 189,622 | 866,549 | $ 2,764,209 | $ 14,740,169 |
Reinvestment of distributions | 1,948 | 7,294 | 28,015 | 120,226 |
Shares redeemed | (424,718) | (249,100) | (6,023,857) | (4,030,489) |
Net increase (decrease) | (233,148) | 624,743 | $ (3,231,633) | $ 10,829,906 |
Annual Report
Notes to Financial Statements - continued
11. Share Transactions - continued
| Shares | Dollars |
Years ended October 31, | 2012 | 2011 | 2012 | 2011 |
Class B | | | | |
Shares sold | 7,831 | 82,231 | $ 113,787 | $ 1,397,980 |
Reinvestment of distributions | - | 917 | - | 14,988 |
Shares redeemed | (81,206) | (76,244) | (1,157,702) | (1,237,701) |
Net increase (decrease) | (73,375) | 6,904 | $ (1,043,915) | $ 175,267 |
Class C | | | | |
Shares sold | 492,632 | 2,215,036 | $ 7,143,884 | $ 37,885,797 |
Reinvestment of distributions | - | 6,435 | - | 105,874 |
Shares redeemed | (761,541) | (662,765) | (10,673,957) | (10,246,197) |
Net increase (decrease) | (268,909) | 1,558,706 | $ (3,530,073) | $ 27,745,474 |
Global Commodity Stock | | | | |
Shares sold | 7,606,851 | 32,339,719 | $ 109,989,271 | $ 553,926,075 |
Reinvestment of distributions | 210,059 | 293,921 | 3,031,159 | 4,855,462 |
Shares redeemed | (16,330,927) | (17,519,084) | (233,733,610) | (288,860,403) |
Net increase (decrease) | (8,514,017) | 15,114,556 | $ (120,713,180) | $ 269,921,134 |
Institutional Class | | | | |
Shares sold | 1,589,148 | 4,225,113 | $ 22,944,496 | $ 72,109,877 |
Reinvestment of distributions | 18,526 | 16,850 | 267,335 | 278,352 |
Shares redeemed | (2,034,602) | (2,651,317) | (28,631,896) | (43,491,555) |
Net increase (decrease) | (426,928) | 1,590,646 | $ (5,420,065) | $ 28,896,674 |
12. Other.
The Fund's organizational documents provide former and current trustees and officers with a limited indemnification against liabilities arising in connection with the performance of their duties to the Fund. In the normal course of business, the Fund may also enter into contracts that provide general indemnifications. The Fund's maximum exposure under these arrangements is unknown as this would be dependent on future claims that may be made against the Fund. The risk of material loss from such claims is considered remote.
At the end of the period, FMR or its affiliates were the owners of record of 13% of the total outstanding shares of the Fund.
Annual Report
To the Trustees of Fidelity Investment Trust and the Shareholders of Fidelity Global Commodity Stock Fund:
In our opinion, the accompanying statement of assets and liabilities, including the schedule of investments, and the related statements of operations and of changes in net assets and the financial highlights present fairly, in all material respects, the financial position of Fidelity Global Commodity Stock Fund (a fund of Fidelity Investment Trust) at October 31, 2012, the results of its operations for the year then ended, the changes in its net assets for each of the two years in the period then ended and the financial highlights for each of the periods indicated, in conformity with accounting principles generally accepted in the United States of America. These financial statements and financial highlights (hereafter referred to as "financial statements") are the responsibility of the Fidelity Global Commodity Stock Fund's management. Our responsibility is to express an opinion on these financial statements based on our audits. We conducted our audits of these financial statements in accordance with the standards of the Public Company Accounting Oversight Board (United States). Those standards require that we plan and perform the audit to obtain reasonable assurance about whether the financial statements are free of material misstatement. An audit includes examining, on a test basis, evidence supporting the amounts and disclosures in the financial statements, assessing the accounting principles used and significant estimates made by management, and evaluating the overall financial statement presentation. We believe that our audits, which included confirmation of securities at October 31, 2012 by correspondence with the custodian and brokers, provide a reasonable basis for our opinion.
PricewaterhouseCoopers LLP
Boston, Massachusetts
December 14, 2012
Annual Report
The Trustees, Members of the Advisory Board, and executive officers of the trust and fund, as applicable, are listed below. The Board of Trustees governs the fund and is responsible for protecting the interests of shareholders. The Trustees are experienced executives who meet periodically throughout the year to oversee the fund's activities, review contractual arrangements with companies that provide services to the fund, oversee management of the risks associated with such activities and contractual arrangements, and review the fund's performance. Except for James C. Curvey, each of the Trustees oversees 236 funds advised by FMR or an affiliate. Mr. Curvey oversees 443 funds advised by FMR or an affiliate.
The Trustees hold office without limit in time except that (a) any Trustee may resign; (b) any Trustee may be removed by written instrument, signed by at least two-thirds of the number of Trustees prior to such removal; (c) any Trustee who requests to be retired or who has become incapacitated by illness or injury may be retired by written instrument signed by a majority of the other Trustees; and (d) any Trustee may be removed at any special meeting of shareholders by a two-thirds vote of the outstanding voting securities of the trust. Each Trustee who is not an interested person (as defined in the 1940 Act) (Independent Trustee), shall retire not later than the last day of the calendar year in which his or her 75th birthday occurs. The Independent Trustees may waive this mandatory retirement age policy with respect to individual Trustees. The executive officers and Advisory Board Members hold office without limit in time, except that any officer and Advisory Board Member may resign or may be removed by a vote of a majority of the Trustees at any regular meeting or any special meeting of the Trustees. Except as indicated, each individual has held the office shown or other offices in the same company for the past five years.
Experience, Skills, Attributes, and Qualifications of the Fund's Trustees. The Governance and Nominating Committee has adopted a statement of policy that describes the experience, qualifications, attributes, and skills that are necessary and desirable for potential Independent Trustee candidates (Statement of Policy). The Board believes that each Trustee satisfied at the time he or she was initially elected or appointed a Trustee, and continues to satisfy, the standards contemplated by the Statement of Policy. The Governance and Nominating Committee also engages professional search firms to help identify potential Independent Trustee candidates who have the experience, qualifications, attributes, and skills consistent with the Statement of Policy. From time to time, additional criteria based on the composition and skills of the current Independent Trustees, as well as experience or skills that may be appropriate in light of future changes to board composition, business conditions, and regulatory or other developments, have also been considered by the professional search firms and the Governance and Nominating Committee. In addition, the Board takes into account the Trustees' commitment and participation in Board and committee meetings, as well as their leadership of standing and ad hoc committees throughout their tenure.
In determining that a particular Trustee was and continues to be qualified to serve as a Trustee, the Board has considered a variety of criteria, none of which, in isolation, was controlling. The Board believes that, collectively, the Trustees have balanced and diverse experience, qualifications, attributes, and skills, which allow the Board to operate effectively in governing the fund and protecting the interests of shareholders. Information about the specific experience, skills, attributes, and qualifications of each Trustee, which in each case led to the Board's conclusion that the Trustee should serve (or continue to serve) as a trustee of the fund, is provided below.
Annual Report
Trustees and Officers - continued
Board Structure and Oversight Function. James C. Curvey is an interested person (as defined in the 1940 Act) and currently serves as Chairman. The Trustees have determined that an interested Chairman is appropriate and benefits shareholders because an interested Chairman has a personal and professional stake in the quality and continuity of services provided to the fund. Independent Trustees exercise their informed business judgment to appoint an individual of their choosing to serve as Chairman, regardless of whether the Trustee happens to be independent or a member of management. The Independent Trustees have determined that they can act independently and effectively without having an Independent Trustee serve as Chairman and that a key structural component for assuring that they are in a position to do so is for the Independent Trustees to constitute a substantial majority for the Board. The Independent Trustees also regularly meet in executive session. Ned C. Lautenbach serves as Chairman of the Independent Trustees and as such (i) acts as a liaison between the Independent Trustees and management with respect to matters important to the Independent Trustees and (ii) with management prepares agendas for Board meetings.
Fidelity funds are overseen by different Boards of Trustees. The fund's Board oversees Fidelity's equity and high income funds and another Board oversees Fidelity's investment-grade bond, money market, and asset allocation funds. The asset allocation funds may invest in Fidelity funds overseen by the fund's Board. The use of separate Boards, each with its own committee structure, allows the Trustees of each group of Fidelity funds to focus on the unique issues of the funds they oversee, including common research, investment, and operational issues. On occasion, the separate Boards establish joint committees to address issues of overlapping consequences for the Fidelity funds overseen by each Board.
The Trustees operate using a system of committees to facilitate the timely and efficient consideration of all matters of importance to the Trustees, the fund, and fund shareholders and to facilitate compliance with legal and regulatory requirements and oversight of the fund's activities and associated risks. The Board, acting through its committees, has charged FMR and its affiliates with (i) identifying events or circumstances the occurrence of which could have demonstrably adverse effects on the fund's business and/or reputation; (ii) implementing processes and controls to lessen the possibility that such events or circumstances occur or to mitigate the effects of such events or circumstances if they do occur; and (iii) creating and maintaining a system designed to evaluate continuously business and market conditions in order to facilitate the identification and implementation processes described in (i) and (ii) above. Because the day-to-day operations and activities of the fund are carried out by or through FMR, its affiliates and other service providers, the fund's exposure to risks is mitigated but not eliminated by the processes overseen by the Trustees. While each of the Board's committees has responsibility for overseeing different aspects of the fund's activities, oversight is exercised primarily through the Operations, Audit, and Compliance Committees. In addition, the Independent Trustees have worked with FMR to enhance the Board's oversight of investment and financial risks, legal and regulatory risks, technology risks, and operational risks, including the development of additional risk reporting to the Board. For example, a working group comprised of Independent Trustees and FMR has worked and continues to work to review the Fidelity funds' valuation-related activities, reporting and risk management. Appropriate personnel, including but not limited to the fund's Chief Compliance Officer (CCO), FMR's internal auditor, the independent accountants, the fund's Treasurer and portfolio management personnel, make periodic reports to the Board's committees, as appropriate, including an annual review of FMR's risk management program for the Fidelity funds. The responsibilities of each standing committee, including their oversight responsibilities, are described further under "Standing Committees of the Fund's Trustees."
Annual Report
The fund's Statement of Additional Information (SAI) includes more information about the Trustees. To request a free copy, call Fidelity at 1-800-544-8544.
Interested Trustees*:
Correspondence intended for each Trustee who is an interested person may be sent to Fidelity Investments, 82 Devonshire Street, Boston, Massachusetts 02109.
Name, Age; Principal Occupations and Other Relevant Experience+ |
James C. Curvey (77) |
| Year of Election or Appointment: 2007 Mr. Curvey is Trustee and Chairman of the Board of Trustees of certain Trusts. Mr. Curvey also serves as Trustee (2007-present) of other investment companies advised by FMR. Mr. Curvey is a Director of Fidelity Investments Money Management, Inc. (2009-present), Director of Fidelity Research & Analysis Co. (2009-present) and Director of FMR and FMR Co., Inc. (2007-present). Mr. Curvey is also Vice Chairman (2007-present) and Director of FMR LLC. In addition, Mr. Curvey serves as an Overseer for the Boston Symphony Orchestra and a member of the Trustees of Villanova University. Previously, Mr. Curvey was the Vice Chairman (2006-2007) and Director (2000-2007) of FMR Corp. |
Ronald P. O'Hanley (55) |
| Year of Election or Appointment: 2011 Mr. O'Hanley is Director of FMR Co., Inc. (2010-present), Director of Fidelity Investments Money Management, Inc. (2010-present), Director of Fidelity Research & Analysis Company (2010-present), President of Fidelity Asset Management and Corporate Services and a member of Fidelity's Executive Committee (2010-present). Previously, Mr. O'Hanley served as President and Chief Executive Officer of BNY Mellon Asset Management (2007-2010). Mr. O'Hanley also served as Vice Chairman of Bank New York Mellon Corp. and a member of that firm's Executive Committee. Prior to the 2007 merger of The Bank of New York and Mellon Financial Corporation, he was Vice Chairman of Mellon Financial Corporation and President and Chief Executive Officer of Mellon Asset Management. He joined Mellon in February 1997. Mr. O'Hanley currently serves as Chairman of the Boston Public Library Foundation Board of Directors and sits on the Board of Directors of Beth Israel Deaconess Medical Center, the Board of Trustees of the Marine Biological Laboratory and the Advisory Board of the Maxwell School of Citizenship and Public Administration at Syracuse University. Mr. O'Hanley also chairs the Council on Asset Management for the Financial Services Roundtable and is a member of the Board of Directors of Institutional Investor's U.S. Institute. |
* Trustees have been determined to be "Interested Trustees" by virtue of, among other things, their affiliation with the trust or various entities under common control with FMR.
+ The information above includes each Trustee's principal occupation during the last five years and other information relating to the experience, attributes, and skills relevant to each Trustee's qualifications to serve as a Trustee, which led to the conclusion that each Trustee should serve as a Trustee for the fund.
Annual Report
Independent Trustees:
Correspondence intended for each Independent Trustee (that is, the Trustees other than the Interested Trustees) may be sent to Fidelity Investments, P.O. Box 55235, Boston, Massachusetts 02205-5235.
Name, Age; Principal Occupations and Other Relevant Experience+ |
Dennis J. Dirks (64) |
| Year of Election or Appointment: 2005 Prior to his retirement in May 2003, Mr. Dirks was Chief Operating Officer and a member of the Board of The Depository Trust & Clearing Corporation (DTCC). He also served as President, Chief Operating Officer, and Board member of The Depository Trust Company (DTC) and President and Board member of the National Securities Clearing Corporation (NSCC). In addition, Mr. Dirks served as Chief Executive Officer and Board member of the Government Securities Clearing Corporation, Chief Executive Officer and Board member of the Mortgage-Backed Securities Clearing Corporation, as a Trustee and a member of the Finance Committee of Manhattan College (2005-2008), and as a Trustee and a member of the Finance Committee of AHRC of Nassau County (2006-2008). Mr. Dirks is a member of the Independent Directors Council (IDC) Governing Council (2010-present) and Board of Directors for The Brookville Center for Children's Services, Inc. (2009-present). |
Alan J. Lacy (59) |
| Year of Election or Appointment: 2008 Mr. Lacy serves as Senior Adviser (2007-present) of Oak Hill Capital Partners, L.P. (private equity). Mr. Lacy also served as Chief Executive Officer (2000-2005) and Vice Chairman (2005-2006) of Sears Holdings Corporation and Sears, Roebuck and Co. (retail). In addition, Mr. Lacy serves as a member of the Board of Directors of Dave & Buster's Entertainment, Inc. (restaurant and entertainment complexes, 2010-present), Earth Fare, Inc. (retail grocery, 2012-present), The Hillman Companies, Inc. (hardware wholesalers, 2010-present), and Bristol-Myers Squibb Company (global pharmaceuticals, 2008-present). Mr. Lacy is a member of the Board of Trustees of The National Parks Conservation Association (2006-present). Previously, Mr. Lacy served as Chairman of the Board of Trustees of the National Parks Conservation Association (2008-2011) and as a member of the Board of Directors for the Western Union Company (global money transfer, 2006-2011). |
Ned C. Lautenbach (68) |
| Year of Election or Appointment: 2000 Mr. Lautenbach is Chairman of the Independent Trustees of the Equity and High Income Funds (2006-present). Mr. Lautenbach currently serves as the Lead Director of the Eaton Corporation Board of Directors (diversified industrial, 1997-present). Mr. Lautenbach is Chairman of the Board of Directors of the Philharmonic Center for the Arts in Naples, Florida (2012-present) and a member of the Council on Foreign Relations (1994-present). Previously, Mr. Lautenbach was a Partner/Advisory Partner at Clayton, Dubilier & Rice, LLC (private equity investment, 1998-2010), as well as a Director of Sony Corporation (2006-2007). |
Joseph Mauriello (68) |
| Year of Election or Appointment: 2008 Prior to his retirement in January 2006, Mr. Mauriello served in numerous senior management positions including Deputy Chairman and Chief Operating Officer (2004-2005), and Vice Chairman of Financial Services (2002-2004) of KPMG LLP US (professional services, 1965-2005). Mr. Mauriello currently serves as a member of the Board of Directors of XL Group plc. (global insurance and re-insurance, 2006-present). Previously, Mr. Mauriello served as a Director of the Hamilton Funds of the Bank of New York (2006-2007) and of Arcadia Resources Inc. (health care services and products, 2007-2012). |
Robert W. Selander (62) |
| Year of Election or Appointment: 2011 Previously, Mr. Selander served as a Member of the Advisory Board of Fidelity's Equity and High Income Funds (2011), Executive Vice Chairman (2010), Chief Executive Officer (2009-2010), and President and Chief Executive Officer (1997-2009) of Mastercard, Inc. |
Cornelia M. Small (68) |
| Year of Election or Appointment: 2005 Ms. Small is a member of the Board of Directors (2009-present) and Chair of the Investment Committee (2010-present) of the Teagle Foundation. Ms. Small also serves on the Investment Committee of the Berkshire Taconic Community Foundation (2008-present). Previously, Ms. Small served as Chairperson (2002-2008) and a member of the Investment Committee and Chairperson (2008-2012) and a member of the Board of Trustees of Smith College. In addition, Ms. Small served as Chief Investment Officer, Director of Global Equity Investments, and a member of the Board of Directors of Scudder, Stevens & Clark and Scudder Kemper Investments. |
William S. Stavropoulos (73) |
| Year of Election or Appointment: 2001 Mr. Stavropoulos is Vice Chairman of the Independent Trustees of the Equity and High Income Funds (2006-present). Mr. Stavropoulos serves as President and Founder of the Michigan Baseball Foundation, the Great Lakes Loons (2007-present). Mr. Stavropoulos is Chairman Emeritus of the Board of Directors of The Dow Chemical Company, where he previously served in numerous senior management positions, including President, CEO (1995-2000; 2002-2004), Chairman of the Executive Committee (2000-2006), and as a member of the Board of Directors (1990-2006). Currently, Mr. Stavropoulos is a Director of Univar Inc. (global distributor of commodity and specialty chemicals, Chairman from 2010-May 2012 and Lead Director from May 2012-present), Teradata Corporation (data warehousing and technology solutions, 2008-present), Maersk Inc. (industrial conglomerate), and Tyco International, Ltd. (multinational manufacturing and services, 2007-present), and a member of the Advisory Board for Metalmark Capital LLC (private equity investment, 2005-present). Mr. Stavropoulos is an operating advisor to Clayton, Dubilier & Rice, LLC (private equity investment). In addition, Mr. Stavropoulos is a member of the University of Notre Dame Advisory Council for the College of Science, a Trustee of the Rollin L. Gerstacker Foundation, and a Director of the Naples Philharmonic Center for the Arts. Previously, Mr. Stavropoulos served as a Director of Chemical Financial Corporation (bank holding company, 1993-2012). |
David M. Thomas (63) |
| Year of Election or Appointment: 2008 Previously, Mr. Thomas served as Executive Chairman (2005-2006) and Chairman and Chief Executive Officer (2000-2005) of IMS Health, Inc. (pharmaceutical and healthcare information solutions), and a Director of Fortune Brands, Inc. (consumer products, 2000-2011). In addition, Mr. Thomas serves as Non-Executive Chairman of the Board of Directors of Fortune Brands Home and Security (home and security products, 2011-present), and as a member of the Board of Directors of Interpublic Group of Companies, Inc. (marketing communication, 2004-present). |
Michael E. Wiley (62) |
| Year of Election or Appointment: 2008 Mr. Wiley also serves as a Director of Asia Pacific Exploration Consolidated (international oil and gas exploration and production, 2008-present). Mr. Wiley serves as a Director of Tesoro Corporation (independent oil refiner and marketer, 2005-present), and a Director of Bill Barrett Corporation (exploration and production, 2005-present). In addition, Mr. Wiley also serves as a Director of Post Oak Bank (privately-held bank, 2004-present). Previously, Mr. Wiley served as a member of the Board of Trustees of the University of Tulsa (2000-2006; 2007-2010), as a Senior Energy Advisor of Katzenbach Partners, LLC (consulting, 2006-2007), as an Advisory Director of Riverstone Holdings (private investment), Chairman, President, and CEO of Baker Hughes, Inc. (oilfield services, 2000-2004), and as Director of Spinnaker Exploration Company (exploration and production, 2001-2005). |
+ The information above includes each Trustee's principal occupation during the last five years and other information relating to the experience, attributes, and skills relevant to each Trustee's qualifications to serve as a Trustee, which led to the conclusion that each Trustee should serve as a Trustee for the fund.
Advisory Board Members and Executive Officers:
Correspondence intended for David A. Rosow and Garnett A. Smith may be sent to Fidelity Investments, P.O. Box 55235, Boston, Massachusetts 02205-5235. Correspondence intended for each executive officer, Edward C. Johnson 3d, and Peter S. Lynch may be sent to Fidelity Investments, 82 Devonshire Street, Boston, Massachusetts 02109.
Name, Age; Principal Occupation |
Edward C. Johnson 3d (82) |
| Year of Election or Appointment: 2011 Member of the Advisory Board of Fidelity's Equity and High Income Funds. Mr. Johnson serves as Chief Executive Officer, Chairman, and a Director of FMR LLC, and also serves as Chairman and Director of FIL Limited. Previously, Mr. Johnson served as a Trustee and Chairman of the Board of certain Fidelity Trusts, Chairman and a Director of FMR, Chairman and a Director of FMR Co., Inc., and President of FMR LLC (2006-2007). |
Peter S. Lynch (68) |
| Year of Election or Appointment: 2003 Member of the Advisory Board of Fidelity's Equity and High Income Funds. Mr. Lynch is Vice Chairman and a Director of FMR and FMR Co., Inc. In addition, Mr. Lynch serves as a Trustee of Boston College and as the Chairman of the Inner-City Scholarship Fund. Previously, Mr. Lynch served on the Special Olympics International Board of Directors (1997-2006). |
David A. Rosow (70) |
| Year of Election or Appointment: 2012 Member of the Advisory Board of Fidelity's Equity and High Income Funds. Chairman and Chief Executive Officer of International Golf Group, Inc. (golf course development, 1989-present). Previously, Mr. Rosow served as Chairman and Chief Executive Officer of Rosow & Company, Inc. (private investment company, 1989-2011), a Lead Director of Hudson United Bancorp (2001-2006) and as a Director of TD Banknorth (1996-2006). In addition, Mr. Rosow is a member (2008-present) and President (2009-present) of the Town Council of Palm Beach, Florida. |
Garnett A. Smith (65) |
| Year of Election or Appointment: 2012 Member of the Advisory Board of Fidelity's Equity and High Income Funds. Prior to Mr. Smith's retirement, he served as Chairman and Chief Executive Officer of Inbrand Corp. (manufacturer of personal absorbent products, 1990-1997). He also served as President (1986-1990) of Inbrand Corp. Prior to his employment with Inbrand Corp., he was employed by a retail fabric chain and North Carolina National Bank. In addition, Mr. Smith is a board member of the Jackson Hole Land Trust (2009-present). |
Kenneth B. Robins (43) |
| Year of Election or Appointment: 2008 President and Treasurer of Fidelity's Equity and High Income Funds. Mr. Robins also serves as President and Treasurer (2010-present) and Assistant Treasurer (2009-present) of other Fidelity funds and is an employee of Fidelity Investments (2004-present). Previously, Mr. Robins served as Deputy Treasurer of the Fidelity funds (2005-2008) and Treasurer and Chief Financial Officer of The North Carolina Capital Management Trust: Cash and Term Portfolios (2006-2008). |
Bruce T. Herring (47) |
| Year of Election or Appointment: 2006 Vice President of certain Equity Funds. Mr. Herring also serves as President of Fidelity Research & Analysis Company (2010-present), Chief Investment Officer and Director of Fidelity Management & Research (U.K.) Inc. (2010-present) and Group Chief Investment Officer of FMR. Previously, Mr. Herring served as Vice President (2005-2006) and Senior Vice President (2006-2007) of Fidelity Management & Research Company, Vice President of FMR Co., Inc. (2001-2007) and as a portfolio manager for Fidelity U.S. Equity Funds. |
Brian B. Hogan (48) |
| Year of Election or Appointment: 2009 Vice President of Equity and High Income Funds. Mr. Hogan also serves as President of FMR's Equity Division (2009-present). Previously, Mr. Hogan served as Senior Vice President, Equity Research of FMR (2006-2009) and as a portfolio manager. |
Scott C. Goebel (44) |
| Year of Election or Appointment: 2008 Secretary and Chief Legal Officer (CLO) of the Fidelity funds. Mr. Goebel also serves as Secretary of Fidelity Investments Money Management, Inc. (FIMM) (2010-present) and Fidelity Research and Analysis Company (FRAC) (2010-present); Secretary and CLO of The North Carolina Capital Management Trust: Cash and Term Portfolios (2008-present); General Counsel, Secretary, and Senior Vice President of FMR (2008-present) and FMR Co., Inc. (2008-present); employed by FMR LLC or an affiliate (2001-present); Chief Legal Officer of Fidelity Management & Research (Hong Kong) Limited (2008-present) and Assistant Secretary of Fidelity Management & Research (Japan) Inc. (2008-present), and Fidelity Management & Research (U.K.) Inc. (2008-present). Previously, Mr. Goebel served as Assistant Secretary of FIMM (2008-2010), FRAC (2008-2010), and the Funds (2007-2008) and as Vice President and Secretary of Fidelity Distributors Corporation (FDC) (2005-2007). |
William C. Coffey (43) |
| Year of Election or Appointment: 2009 Assistant Secretary of Fidelity's Equity and High Income Funds. Mr. Coffey also serves as Senior Vice President and Deputy General Counsel of FMR LLC (2010-present), and is an employee of Fidelity Investments. Previously, Mr. Coffey served as Vice President and Associate General Counsel of FMR LLC (2005-2009). |
Elizabeth Paige Baumann (44) |
| Year of Election or Appointment: 2012 Anti-Money Laundering (AML) Officer of the Fidelity funds. Ms. Baumann also serves as AML Officer of The North Carolina Capital Management Trust: Cash and Term Portfolios (2012-present), Chief AML Officer of FMR LLC (2012-present), and is an employee of Fidelity Investments. Previously, Ms. Baumann served as Vice President and Deputy Anti-Money Laundering Officer (2007-2012). |
Christine Reynolds (54) |
| Year of Election or Appointment: 2008 Chief Financial Officer of the Fidelity funds. Ms. Reynolds became President of Fidelity Pricing and Cash Management Services (FPCMS) in August 2008. Ms. Reynolds served as Chief Operating Officer of FPCMS (2007-2008). Previously, Ms. Reynolds served as President, Treasurer, and Anti-Money Laundering officer of the Fidelity funds (2004-2007). |
Joseph A. Hanlon (44) |
| Year of Election or Appointment: 2012 Chief Compliance Officer of Fidelity's Equity and High Income Funds. Mr. Hanlon serves as Compliance Officer of FMR, FMR Co., Inc., Fidelity Investments Money Management, Inc. (FIMM), Fidelity Research and Analysis Company (FRAC), Fidelity Management & Research (Japan) Inc., Fidelity Management & Research (U.K.) Inc., Fidelity Management & Research (Hong Kong), and Strategic Advisers, Inc. (2009-present), as Senior Vice President of the Fidelity Asset Management Division (2009-present), and is an employee of Fidelity Investments. |
Joseph F. Zambello (55) |
| Year of Election or Appointment: 2011 Deputy Treasurer of the Fidelity funds. Mr. Zambello is an employee of Fidelity Investments. Previously, Mr. Zambello served as Vice President of FMR's Program Management Group (2009-2011) and Vice President of the Transfer Agent Oversight Group (2005-2009). |
Adrien E. Deberghes (45) |
| Year of Election or Appointment: 2008 Deputy Treasurer of Fidelity's Equity and High Income Funds. Mr. Deberghes also serves as Vice President (2011-present) and Assistant Treasurer (2010-present) of other Fidelity funds, and is an employee of Fidelity Investments (2008-present). Previously, Mr. Deberghes served as Senior Vice President of Mutual Fund Administration at State Street Corporation (2007-2008), Senior Director of Mutual Fund Administration at Investors Bank & Trust (2005-2007), and Director of Finance for Dunkin' Brands (2000-2005). |
Stephen Sadoski (41) |
| Year of Election or Appointment: 2012 Deputy Treasurer of Fidelity's Equity and High Income Funds. Mr. Sadoski also serves as Assistant Treasurer of other Fidelity funds (2012-present) and is an employee of Fidelity Investments (2012-present). Previously, Mr. Sadoski served as an assistant chief accountant in the Division of Investment Management of the Securities and Exchange Commission (SEC) (2009-2012) and as a senior manager at Deloitte & Touche (1997-2009). |
Stephanie J. Dorsey (43) |
| Year of Election or Appointment: 2010 Assistant Treasurer of Fidelity's Equity and High Income Funds. Ms. Dorsey also serves as Deputy Treasurer of other Fidelity funds (2008-present) and is an employee of Fidelity Investments (2008-present). Previously, Ms. Dorsey served as Treasurer (2004-2008) of the JPMorgan Mutual Funds and Vice President (2004-2008) of JPMorgan Chase Bank. |
John R. Hebble (54) |
| Year of Election or Appointment: 2009 Assistant Treasurer of Fidelity's Equity and High Income Funds. Mr. Hebble also serves as President (2011-present), Treasurer, and Chief Financial Officer of The North Carolina Capital Management Trust: Cash and Term Portfolios (2008-present), President and Treasurer of other Fidelity funds (2008-present) and is an employee of Fidelity Investments. |
Gary W. Ryan (54) |
| Year of Election or Appointment: 2005 Assistant Treasurer of the Fidelity funds. Mr. Ryan is an employee of Fidelity Investments. Previously, Mr. Ryan served as Vice President of Fund Reporting in Fidelity Pricing and Cash Management Services (FPCMS) (1999-2005). |
Jonathan Davis (44) |
| Year of Election or Appointment: 2010 Assistant Treasurer of the Fidelity funds. Mr. Davis is also Assistant Treasurer of Fidelity Rutland Square Trust II and Fidelity Commonwealth Trust II. Mr. Davis is an employee of Fidelity Investments. Previously, Mr. Davis served as Vice President and Associate General Counsel of FMR LLC (2003-2010). |
Annual Report
The fund designates 75% of the dividend distributed during the fiscal year as qualifying for the dividends-received deduction for corporate shareholders.
The fund designates 100%of the dividend distributed during the fiscal year as amounts which may be taken into account as a dividend for the purposes of the maximum rate under section 1(h)(11) of the Internal Revenue Code.
The amounts per share which represent income derived from sources within, and taxes paid to, foreign countries or possessions of the United States are as follows:
| Pay Date | Income | Taxes |
Fidelity Global Commodity Stock Fund | 12/12/2011 | $0.109 | $0.0107 |
The fund will notify shareholders in January 2013 of amounts for use in preparing 2012 income tax returns.
Annual Report
Board Approval of Investment Advisory Contracts and Management Fees
Fidelity Global Commodity Stock Fund
Each year, the Board of Trustees, including the Independent Trustees (together, the Board), votes on the renewal of the management contract and sub-advisory agreements (together, the Advisory Contracts) for the fund. The Board, assisted by the advice of fund counsel and Independent Trustees' counsel, requests and considers a broad range of information relevant to the renewal of the Advisory Contracts throughout the year.
The Board meets regularly and, at each of its meetings, considers factors that are relevant to its annual consideration of the renewal of the fund's Advisory Contracts, including the services and support provided to the fund and its shareholders. The Board has established various standing committees, each composed of and chaired by Independent Trustees with varying backgrounds, to which the Board has assigned specific subject matter responsibilities in order to enhance effective decision-making by the Board. The Board, acting directly and through its Committees, requests and receives information concerning the annual consideration of the renewal of the fund's Advisory Contracts. The Board also meets as needed to consider matters specifically related to the Board's annual consideration of the renewal of Advisory Contracts. Members of the Board may also meet with trustees of other Fidelity funds through ad hoc joint committees to discuss certain matters relevant to the Fidelity funds.
At its July 2012 meeting, the Board of Trustees, including the Independent Trustees, unanimously determined to renew the fund's Advisory Contracts. In reaching its determination, the Board considered all factors it believed relevant, including (i) the nature, extent, and quality of the services to be provided to the fund and its shareholders (including the investment performance of the fund); (ii) the competitiveness of the fund's management fee and total expense ratio relative to peer funds; (iii) the total costs of the services to be provided by and the profits to be realized by Fidelity from its relationship with the fund; (iv) the extent to which economies of scale exist and would be realized as the fund grows; and (v) whether fee levels reflect these economies of scale, if any, for the benefit of fund shareholders.
In considering whether to renew the Advisory Contracts for the fund, the Board reached a determination, with the assistance of fund counsel and Independent Trustees' counsel and through the exercise of its business judgment, that the renewal of the Advisory Contracts is in the best interests of the fund and its shareholders and that the compensation payable under the Advisory Contracts is fair and reasonable. The Board's decision to renew the Advisory Contracts was not based on any single factor, but rather was based on a comprehensive consideration of all the information provided to the Board at its meetings throughout the year. The Board, in reaching its determination to renew the Advisory Contracts, is aware that shareholders in the fund have a broad range of investment choices available to them, including a wide choice among mutual funds offered by Fidelity's competitors, and that the fund's shareholders, who have the opportunity to review and weigh the disclosure provided by the fund in its prospectus and other public disclosures, have chosen to invest in this fund, managed by Fidelity.
Annual Report
Nature, Extent, and Quality of Services Provided. The Board considered the staffing within the investment adviser, FMR, and the sub-advisers (together, the Investment Advisers), including the backgrounds of the fund's investment personnel, and also considered the fund's investment objective, strategies, and related investment philosophy. The Independent Trustees also had discussions with senior management of Fidelity's investment operations and investment groups. The Board considered the structure of the portfolio manager compensation program and whether this structure provides appropriate incentives to act in the best interests of the fund.
Resources Dedicated to Investment Management and Support Services. The Board and the Fund Oversight and Research Committees reviewed the general qualifications and capabilities of the Investment Advisers' investment staff, including its size, education, experience, and resources, as well as the Investment Advisers' approach to recruiting, training, managing, and compensating investment personnel. The Board also noted that FMR has continued to increase the resources devoted to non-U.S. offices, including expansion of Fidelity's global investment organization. The Board noted that Fidelity's analysts have extensive resources, tools and capabilities that allow them to conduct sophisticated quantitative and fundamental analysis, as well as credit analysis of issuers, counterparties and guarantors. The Board also believes that Fidelity's investment professionals have sufficient access to global information and data so as to provide competitive investment results over time, and that those professionals also have access to sophisticated tools that permit them to assess portfolio construction and risk and performance attribution characteristics continuously, as well as to transmit new information and research conclusions rapidly around the world. Additionally, in its deliberations, the Board considered the Investment Advisers' trading and risk management capabilities and resources, which are an integral part of the investment management process.
Shareholder and Administrative Services. The Board considered (i) the nature, extent, quality, and cost of advisory, administrative, and shareholder services performed by the Investment Advisers and their affiliates under the Advisory Contracts and under separate agreements covering transfer agency, pricing and bookkeeping, and securities lending services for the fund; (ii) the nature and extent of the supervision of third party service providers, principally custodians and subcustodians; and (iii) the resources devoted to, and the record of compliance with, the fund's compliance policies and procedures. The Board also reviewed the allocation of fund brokerage, including allocations to brokers affiliated with the Investment Advisers, the use of brokerage commissions to pay fund expenses, and the use of "soft" commission dollars to pay for research services.
Annual Report
Board Approval of Investment Advisory Contracts and
Management Fees - continued
The Board noted that the growth of fund assets over time across the complex allows Fidelity to reinvest in the development of services designed to enhance the value or convenience of the Fidelity funds as investment vehicles. These services include 24-hour access to account information and market information through telephone representatives and over the Internet, investor education materials and asset allocation tools, and the expanded availability of Fidelity Investor Centers.
Investment in a Large Fund Family. The Board considered the benefits to shareholders of investing in a Fidelity fund, including the benefits of investing in a fund that is part of a large family of funds offering a variety of investment disciplines and providing a large variety of mutual fund investor services. The Board noted that Fidelity had taken, or had made recommendations that resulted in the Fidelity funds taking, a number of actions over the previous year that benefited particular funds, including (i) continuing to dedicate additional resources to investment research and support of the senior management team that oversees asset management; (ii) persisting in efforts to enhance Fidelity's research capabilities, in particular, international research; (iii) launching new funds and making other enhancements to meet client needs for global and income-oriented solutions; (iv) continuing to launch dedicated lower cost underlying funds to meet investment management's portfolio construction needs related to expanding underlying fund options, specifically for the Freedom Fund product lines; (v) adopting a "Stock Selector" sector neutral investment approach and employing a team of portfolio managers who are sector specialists to manage certain funds; (vi) rationalizing product lines and gaining increased efficiencies through the mergers of several funds into other funds; (vii) strengthening the Spartan Index Fund product line by adding new funds and/or new low-cost institutional share classes, restructuring fund expenses to accommodate new classes, and reducing investment minimums for certain classes of shares; (viii) modifying the eligibility criteria for Institutional Class shares to increase their appeal to government entities and charitable investors; and (ix) reducing certain transfer agent fee rates.
Investment Performance. The Board considered whether the fund has operated in accordance with its investment objective, as well as its record of compliance with its investment restrictions. It also reviewed the fund's absolute investment performance for each class, as well as the fund's relative investment performance for each class measured against a third-party-sponsored index that reflects the market sector in which the fund invests. The Board noted that FMR believes that no meaningful peer group exists for the fund principally because most other funds in the fund's third-party peer group focus on different industries or sectors than the fund. Because the fund had been in existence less than three calendar years, the following chart considered by the Board shows, for the one-year period ended December 31, 2011, the total returns of Institutional Class (Class I) and Class B of the fund and the total return of a third-party-sponsored index ("benchmark").
Annual Report
Fidelity Global Commodity Stock Fund

The Board noted that the investment performance of the fund was lower than its benchmark for the period shown. The Board considered that the variations in performance among the fund's classes reflect the variations in class expenses, which result in lower performance for higher expense classes. The Board also reviewed the fund's performance since inception as well as performance in the current year. The Board noted that it is difficult to evaluate in any comprehensive fashion the performance of the fund, in light of its relatively recent commencement of operations.
Based on its review, the Board concluded that the nature, extent, and quality of services provided to the fund under the Advisory Contracts should benefit the fund's shareholders.
Competitiveness of Management Fee and Total Expense Ratio. The Board considered the fund's management fee and total expense ratio compared to "mapped groups" of competitive funds and classes. Fidelity creates "mapped groups" by combining similar Lipper investment objective categories that have comparable management fee characteristics. Combining Lipper investment objective categories aids the Board's management fee and total expense ratio comparisons by broadening the competitive group used for comparison and by reducing the number of universes to which various Fidelity funds are compared.
Management Fee. The Board considered two proprietary management fee comparisons for the 12-month (or shorter) periods shown in the chart below. The group of Lipper funds used by the Board for management fee comparisons is referred to below as the "Total Mapped Group." The Total Mapped Group comparison focuses on a fund's standing relative to the total universe of comparable funds available to investors in terms of gross management fees before expense reimbursements or caps. "TMG %" represents the percentage of funds in the Total Mapped Group that had management fees that were lower than the fund's. For example, a TMG % of 31% means that 69% of the funds in the Total Mapped Group had higher management fees than the fund. The "Asset-Size Peer Group" (ASPG) comparison focuses on a fund's standing relative to non-Fidelity funds similar in size to the fund within the Total Mapped Group. The ASPG represents at least 15% of the funds in the Total Mapped Group with comparable asset size and management fee characteristics, subject to a minimum of 50 funds (or all funds in the Total Mapped Group if fewer than 50). Additional information, such as the ASPG quartile in which the fund's management fee ranked, is also included in the chart and considered by the Board.
Annual Report
Board Approval of Investment Advisory Contracts and
Management Fees - continued
Fidelity Global Commodity Stock Fund
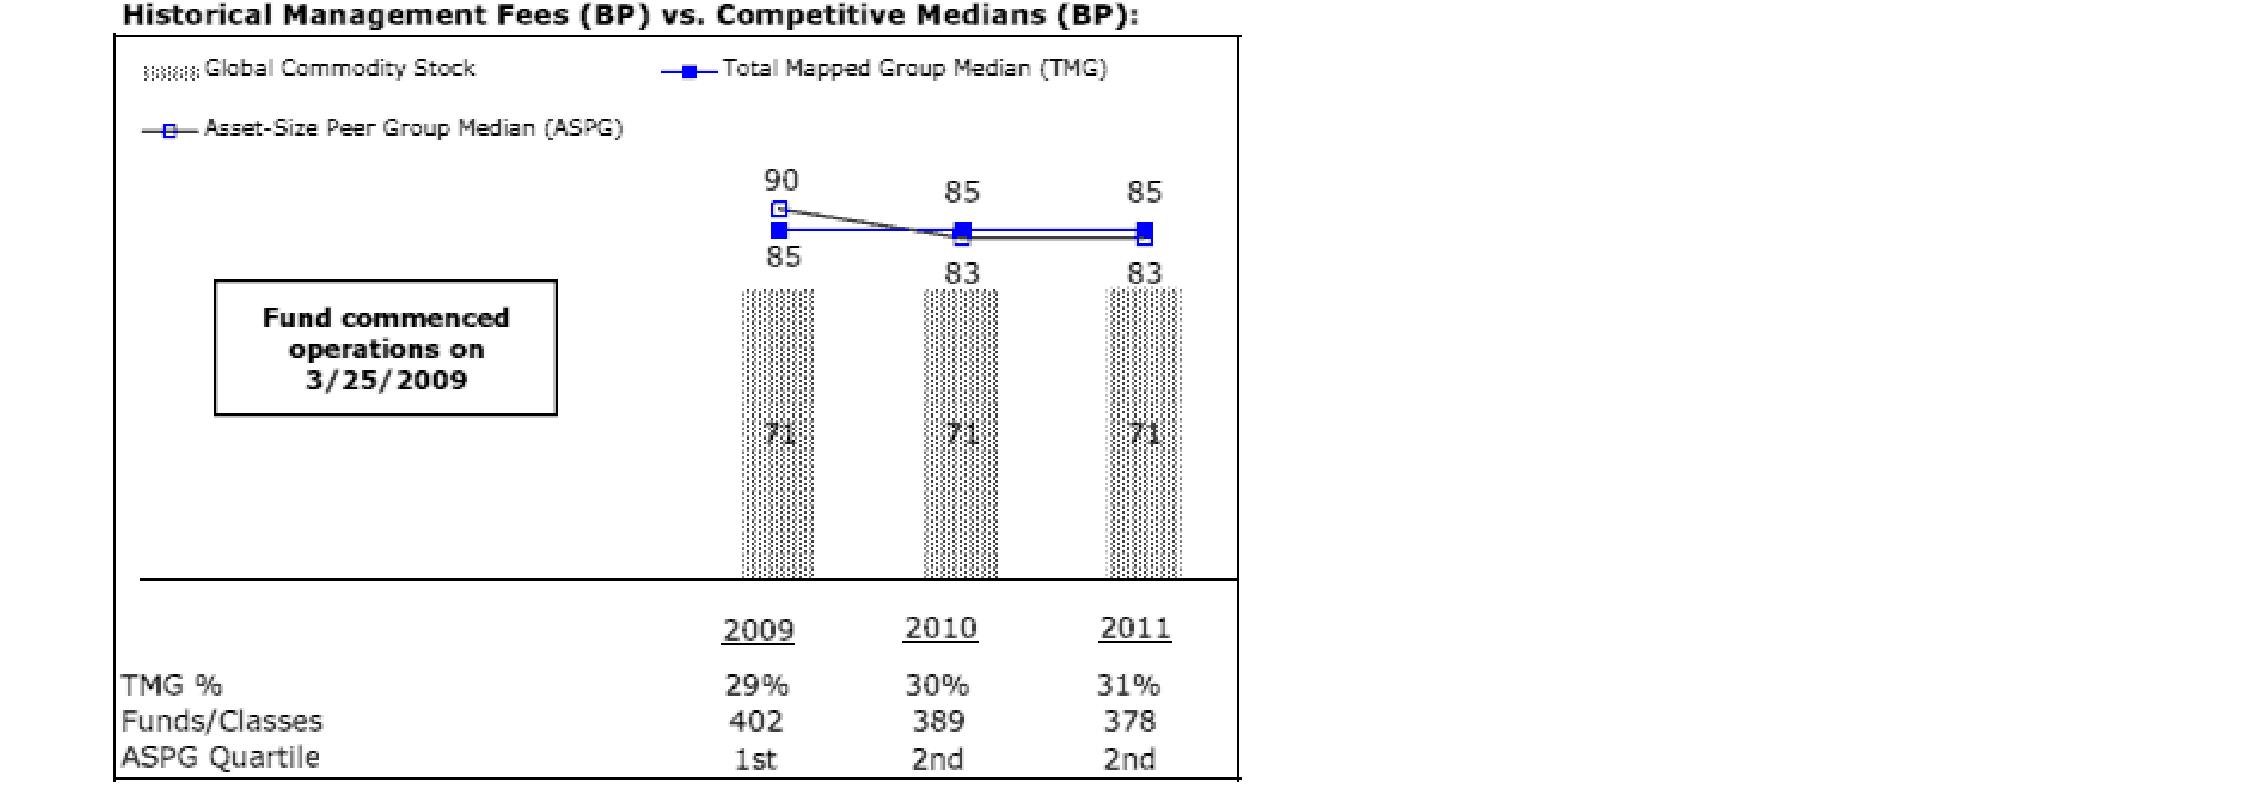
The Board noted that the fund's management fee ranked below the median of its Total Mapped Group and below the median of its ASPG for 2011.
Based on its review, the Board concluded that the fund's management fee is fair and reasonable in light of the services that the fund receives and the other factors considered.
Total Expense Ratio. In its review of each class's total expense ratio, the Board considered the fund's management fee as well as other fund or class expenses, as applicable, such as transfer agent fees, pricing and bookkeeping fees, fund-paid 12b-1 fees, and custodial, legal, and audit fees. The Board also noted the effects of any waivers and reimbursements on fees and expenses. As part of its review, the Board also considered the current and historical total expense ratios of each class of the fund compared to competitive fund median expenses. Each class of the fund is compared to those funds and classes in the Total Mapped Group (used by the Board for management fee comparisons) that have a similar sales load structure.
Annual Report
The Board noted that the total expense ratio of each of Class A, Class B, Class C, Institutional Class, and the retail class ranked below its competitive median for 2011 and the total expense ratio of Class T ranked above its competitive median for 2011. The Board considered that various factors, including 12b-1 fees, positive or negative performance adjustments, and relatively higher other expenses in the case of small fund size, can affect total expense ratios. The Board noted that the total expense ratio of Class T was above the competitive median primarily because of higher 12b-1 fees on Class T. Class T has a higher 12b-1 fee, but a lower front-end sales charge, than traditionally priced front-end sales charge classes. The Board considered that Class T is primarily sold load-waived in the retirement plan market where its 0.50% 12b-1 fee is comparable to competing no-load, higher 12b-1 fee classes designed specifically for retirement plans. The Board noted that the fund offers multiple classes, each of which has a different sales load and 12b-1 fee structure, and that the multiple structures are intended to offer a range of pricing options for the intermediary market. The Board also noted that the total expense ratios of the classes vary primarily by the level of their 12b-1 fees, although differences in transfer agent fees may also cause expenses to vary from class to class.
Fees Charged to Other Fidelity Clients. The Board also considered Fidelity fee structures and other information with respect to clients of FMR and its affiliates, such as other mutual funds advised or subadvised by FMR or its affiliates, pension plan clients, and other institutional clients. The Board noted the findings of the 2010 ad hoc joint committee (created with the board of other Fidelity funds), which reviewed and compared Fidelity's institutional investment advisory business with its business of providing services to the Fidelity funds, including the differences in services provided, fees charged, and costs incurred, as well as competition in their respective marketplaces.
Based on its review of total expense ratios and fees charged to other Fidelity clients, the Board concluded that the total expense ratio of each class of the fund was reasonable, although Class T was above the median of the universe presented for comparison, in light of the services that the fund and its shareholders receive and the other factors considered.
Costs of the Services and Profitability. The Board considered the revenues earned and the expenses incurred by Fidelity in conducting the business of developing, marketing, distributing, managing, administering and servicing the fund and its shareholders. The Board also considered the level of Fidelity's profits in respect of all the Fidelity funds.
On an annual basis, FMR presents to the Board Fidelity's profitability for the fund. Fidelity calculates the profitability for each fund, as well as aggregate profitability for groups of Fidelity funds and all Fidelity funds, using a series of detailed revenue and cost allocation methodologies which originate with the books and records of Fidelity on which Fidelity's audited financial statements are based. The Audit Committee of the Board reviews any significant changes from the prior year's methodologies.
Annual Report
Board Approval of Investment Advisory Contracts and
Management Fees - continued
PricewaterhouseCoopers LLP (PwC), independent registered public accounting firm and auditor to Fidelity and certain Fidelity funds, has been engaged annually by the Board as part of the Board's assessment of Fidelity's profitability analysis. PwC's engagement includes the review and assessment of Fidelity's methodologies used in determining the revenues and expenses attributable to Fidelity's mutual fund business, and completion of agreed-upon procedures surrounding the mathematical accuracy of fund profitability and its conformity to allocation methodologies. After considering PwC's reports issued under the engagement and information provided by Fidelity, the Board concluded that while other allocation methods may also be reasonable, Fidelity's profitability methodologies are reasonable in all material respects.
The Board also reviewed Fidelity's non-fund businesses and fall-out benefits related to the mutual fund business as well as cases where Fidelity's affiliates may benefit from or be related to the fund's business.
The Board considered the costs of the services provided by and the profits realized by Fidelity in connection with the operation of the fund and was satisfied that the profitability was not excessive in the circumstances.
Economies of Scale. The Board considered whether there have been economies of scale in respect of the management of the Fidelity funds, whether the Fidelity funds (including the fund) have appropriately benefited from any such economies of scale, and whether there is potential for realization of any further economies of scale. The Board considered the extent to which the fund will benefit from economies of scale through increased services to the fund, through waivers or reimbursements, or through fee or expense reductions. The Board also noted that in 2009, it and the board of other Fidelity funds created an ad hoc committee (the Economies of Scale Committee) to analyze whether FMR attains economies of scale in respect of the management and servicing of the Fidelity funds, whether the Fidelity funds have appropriately benefited from such economies of scale, and whether there is potential for realization of any further economies of scale.
The Board recognized that the fund's management contract incorporates a "group fee" structure, which provides for lower group fee rates as total fund assets under FMR's management increase, and for higher group fee rates as total fund assets under FMR's management decrease. FMR calculates the group fee rates based on a tiered asset "breakpoint" schedule that varies based on asset class. The Board considered that the group fee is designed to deliver the benefits of economies of scale to fund shareholders when total Fidelity fund assets increase, even if assets of any particular fund are unchanged or have declined, because some portion of Fidelity's costs are attributable to services provided to all Fidelity funds, and all funds benefit if those costs can be allocated among more assets. The Board concluded that, given the group fee structure, fund shareholders will benefit from lower management fees as assets under FMR's management increase at the fund complex level, regardless of whether Fidelity achieves any such economies of scale.
Annual Report
The Board concluded, taking into account the analysis of the Economies of Scale Committee, that economies of scale, if any, are being appropriately shared between fund shareholders and Fidelity.
Additional Information Requested by the Board. In order to develop fully the factual basis for consideration of the Fidelity funds' Advisory Contracts, the Board requested and received additional information on certain topics, including (i) fund performance trends, actions to be taken by FMR to improve certain funds' overall performance, and Fidelity's long-term strategies for certain funds; (ii) the potential to further rationalize the Fidelity fund lineup with the possibility of achieving savings for the funds and Fidelity; (iii) Fidelity's compensation structure for portfolio managers and other key investment personnel; (iv) the amount of the investment that each portfolio manager has made in the Fidelity fund(s) that he or she manages; (v) the realization of fall-out benefits in certain Fidelity business units; (vi) Fidelity's group fee structures, the potential impact of regulatory changes on such structures, and the rationale for the individual fee rates of certain funds; (vii) fund profitability methodology, including Fidelity's cost allocation methodology, and the impact of certain factors on fund profitability results; (viii) trends regarding industry use of performance fee structures and the possibility of implementing performance fee structures for additional funds; and (ix) the impact of net redemptions from the Fidelity funds.
Based on its evaluation of all of the conclusions noted above, and after considering all factors it believed relevant, the Board ultimately concluded that the advisory fee structures are fair and reasonable, and that the fund's Advisory Contracts should be renewed.
Annual Report
Investment Adviser
Fidelity Management & Research Company
Boston, MA
Investment Sub-Advisers
FMR Co., Inc.
Fidelity Management &
Research (U.K.) Inc.
FIL Investments (Japan) Limited
FIL Investment Advisors
FIL Investment Advisors
(U.K.) Limited
Fidelity Management & Research
(Hong Kong) Limited
Fidelity Management & Research
(Japan) Inc.
General Distributor
Fidelity Distributors Corporation
Smithfield, RI
Transfer and Service Agents
Fidelity Investments Institutional
Operations Company, Inc.
Boston, MA
Fidelity Service Company, Inc.
Boston, MA
Custodian
State Street Bank and Trust Company
Quincy, MA
The Fidelity Telephone Connection
Mutual Fund 24-Hour Service
Exchanges/Redemptions
and Account Assistance 1-800-544-6666
Product Information 1-800-544-6666
Retirement Accounts 1-800-544-4774
(8 a.m. - 9 p.m.)
TDD Service 1-800-544-0118
for the deaf and hearing impaired
(9 a.m. - 9 p.m. Eastern time)
Fidelity Automated Service
Telephone (FAST®) (automated graphic)
1-800-544-5555
(automated graphic)
Automated line for quickest service
(Fidelity Investment logo)(registered trademark)
Corporate Headquarters
82 Devonshire St., Boston, MA 02109
www.fidelity.com
GCS-UANN-1212
1.879379.103
(Fidelity Investment logo)(registered trademark)
Fidelity Advisor®
Worldwide Fund
Class A, Class T, Class B, and Class C
Annual Report
October 31, 2012
(Fidelity Cover Art)
Class A, Class T, Class B, and Class C are
classes of Fidelity® Worldwide Fund
(Fidelity Cover Art)
Contents
Performance | (Click Here) | How the fund has done over time. |
Management's Discussion of Fund Performance | (Click Here) | The Portfolio Manager's review of fund performance and strategy. |
Shareholder Expense Example | (Click Here) | An example of shareholder expenses. |
Investment Changes | (Click Here) | A summary of major shifts in the fund's investments over the past six months. |
Investments | (Click Here) | A complete list of the fund's investments with their market values. |
Financial Statements | (Click Here) | Statements of assets and liabilities, operations, and changes in net assets, as well as financial highlights. |
Notes | (Click Here) | Notes to the financial statements. |
Report of Independent Registered Public Accounting Firm | (Click Here) | |
Trustees and Officers | (Click Here) | |
Distributions | (Click Here) | |
Board Approval of Investment Advisory Contracts and Management Fees | (Click Here) | |
To view a fund's proxy voting guidelines and proxy voting record for the 12-month period ended June 30, visit http://www.fidelity.com/proxyvotingresults or visit the Securities and Exchange Commission's (SEC) web site at http://www.sec.gov. You may also call 1-877-208-0098 to request a free copy of the proxy voting guidelines.
Standard & Poor's, S&P and S&P 500 are registered service marks of The McGraw-Hill Companies, Inc. and have been licensed for use by Fidelity Distributors Corporation.
Other third party marks appearing herein are the property of their respective owners.
All other marks appearing herein are registered or unregistered trademarks or service marks of FMR LLC or an affiliated company. © 2012 FMR LLC. All rights reserved.
This report and the financial statements contained herein are submitted for the general information of the shareholders of the fund. This report is not authorized for distribution to prospective investors in the fund unless preceded or accompanied by an effective prospectus.
A fund files its complete schedule of portfolio holdings with the SEC for the first and third quarters of each fiscal year on Form N-Q. Forms N-Q are available on the SEC's web site at http://www.sec.gov. A fund's Forms N-Q may be reviewed and copied at the SEC's Public Reference Room in Washington, DC. Information regarding the operation of the SEC's Public Reference Room may be obtained by calling 1-800-SEC-0330. For a complete list of a fund's portfolio holdings, view the most recent holdings listing, semiannual report, or annual report on Fidelity's web site at http://www.fidelity.com, http://www.advisor.fidelity.com, or http://www.401k.com, as applicable.
NOT FDIC INSURED • MAY LOSE VALUE • NO BANK GUARANTEE
Neither the fund nor Fidelity Distributors Corporation is a bank.
Annual Report
Performance: The Bottom Line
Average annual total return reflects the change in the value of an investment, assuming reinvestment of the class' distributions from dividend income and capital gains (the profits earned upon the sale of securities that have grown in value, if any) and assuming a constant rate of performance each year. The $10,000 table and the fund's returns do not reflect the deduction of taxes that a shareholder would pay on fund distributions or the redemption of fund shares. During periods of reimbursement by Fidelity, a fund's total return will be greater than it would be had the reimbursement not occurred. How a fund did yesterday is no guarantee of how it will do tomorrow.
Average Annual Total Returns
Periods ended October 31, 2012 | Past 1
year | Past 5
years | Past 10 years |
Class A (incl. 5.75% sales charge) A | 3.86% | -3.27% | 8.18% |
Class T (incl. 3.50% sales charge) B | 6.13% | -3.00% | 8.33% |
Class B (incl. contingent deferred sales charge) C | 4.40% | -3.00% | 8.52% |
Class C (incl. contingent deferred sales charge) D | 8.41% | -2.65% | 8.53% |
A Class A shares bear a 0.25% 12b-1 fee. The initial offering of Class A took place on February 19, 2009. Returns prior to February 19, 2009 are those of Fidelity® Worldwide Fund, the original class of the fund, which does not bear a 12b-1 fee. Had Class A shares' 12b-1 fee been reflected, returns prior to February 19, 2009 would have been lower.
B Class T shares bear a 0.50% 12b-1 fee. The initial offering of Class T took place on February 19, 2009. Returns prior to February 19, 2009 are those of Fidelity Worldwide Fund, the original class of the fund, which does not bear a 12b-1 fee. Had Class T shares' 12b-1 fee been reflected, returns prior to February 19, 2009 would have been lower.
C Class B shares bear a 1.00% 12b-1 fee. The initial offering of Class B took place on February 19, 2009. Returns prior to February 19, 2009 are those of Fidelity Worldwide Fund, the original class of the fund, which does not bear a 12b-1 fee. Had Class B shares' 12b-1 fee been reflected, returns prior to February 19, 2009 would have been lower. Class B shares' contingent deferred sales charges included in the past one year, past five years, and past ten years total return figures are 5%, 2%, and 0%, respectively.
D Class C shares bear a 1.00% 12b-1 fee. The initial offering of Class C took place on February 19, 2009. Returns prior to February 19, 2009 are those of Fidelity Worldwide Fund, the original class of the fund, which does not bear a 12b-1 fee. Had Class C shares' 12b-1 fee been reflected, returns prior to February 19, 2009 would have been lower. Class C shares' contingent deferred sales charges included in the past one year, past five years, and past ten years total return figures are 1%, 0%, and 0%, respectively.
$10,000 Over 10 Years
Let's say hypothetically that $10,000 was invested in Fidelity Advisor® Worldwide Fund - Class A, on October 31, 2002, and the current 5.75% sales charge was paid. The chart shows how the value of your investment would have changed, and also shows how the MSCI® World Index performed over the same period. The initial offering of Class A took place on February 19, 2009. See above for additional information regarding the performance of Class A.

Annual Report
Market Recap: Returns for most domestic and international equities fluctuated during the 12 months ending October 31, 2012, as investor sentiment towards risk vacillated amid a changing global economic landscape. U.S. stocks overcame bouts of volatility to post strong gains for the past year, extending an uptrend that began in March 2009. The broad-based S&P 500® Index advanced 15.21%, while the blue-chip-laden Dow Jones Industrial AverageSM and technology-heavy Nasdaq Composite® Index rose 12.56% and 12.21%, respectively. Performance outside of the U.S. was relatively weak, as the MSCI® ACWI® (All Country World Index) ex USA Index rose 4.11%, hampered in part by a stronger U.S. dollar. International developed-markets generally struggled during the period as macroeconomic concerns ebbed and flowed, finishing with only a modest gain. The MSCI® EAFE® Index rose 4.76% for the year, largely buttressed in the summertime by pledges of accommodative monetary action from eurozone officials, as well as signs that the U.S. housing market was on the mend. Within the index, Asia-Pacific ex Japan showed the most impressive gain, advancing roughly 10%. A number of core European components, including Germany (+11%) and Switzerland (+10%), and the U.K. (+9%), benefited from optimism about the eurozone's ability to resolve its debt woes, which helped the region outpace the index overall. Elsewhere, Japan was among the few benchmark constituents to finish in the red, returning about -3%. Emerging-markets stocks gained 2.98% for the year, as measured by the MSCI Emerging Markets Index. A general uptrend in the final five months of the period lifted the index into positive territory for the full 12 months.
Comments from William Kennedy, Lead Portfolio Manager of Fidelity Advisor® Worldwide Fund and manager of its non-U.S. equity subportfolio, and Co-Portfolio Manager Stephen DuFour, who manages the fund's U.S. equity subportfolio: For the year, the fund's Class A, Class T, Class B and Class C shares returned 10.20%, 9.98%, 9.40% and 9.41%, respectively (excluding sales charges). By comparison, the MSCI® World Index returned 9.92%. Security selection, especially in information technology, helped relative performance, as did market weightings, notably in Europe ex U.K. Sector allocation and a small cash position modestly detracted. Individual contributors included card processor MasterCard, whose stock benefited from more people worldwide paying with plastic, and homebuilder PulteGroup, whose steep share price gains were driven by the U.S. housing recovery. Another standout was TJX Companies, whose stock climbed as more consumers tried to stretch their paychecks by shopping at stores such as T.J. Maxx. By contrast, our timing with discount retailer Wal-Mart Stores hurt, as the stock rose sharply - especially in May and June - when it was not in the portfolio. Elsewhere, the fund lost ground from investing in energy processing and pipeline company Keyera when its shares were pressured by the warm winter and low natural gas prices. Keyera was not in the MSCI index and not held at period end.
The views expressed above reflect those of the portfolio manager(s) only through the end of the period as stated on the cover of this report and do not necessarily represent the views of Fidelity or any other person in the Fidelity organization. Any such views are subject to change at any time based upon market or other conditions and Fidelity disclaims any responsibility to update such views. These views may not be relied on as investment advice and, because investment decisions for a Fidelity fund are based on numerous factors, may not be relied on as an indication of trading intent on behalf of any Fidelity fund.
Annual Report
Fidelity Worldwide Fund
As a shareholder of the Fund, you incur two types of costs: (1) transaction costs, including sales charges (loads) on purchase payments or redemption proceeds, redemption fees and (2) ongoing costs, including management fees, distribution and/or service (12b-1) fees and other Fund expenses. This Example is intended to help you understand your ongoing costs (in dollars) of investing in the Fund and to compare these costs with the ongoing costs of investing in other mutual funds.
The Example is based on an investment of $1,000 invested at the beginning of the period and held for the entire period (May 1, 2012 to October 31, 2012).
Actual Expenses
The first line of the accompanying table for each class of the Fund provides information about actual account values and actual expenses. You may use the information in this line, together with the amount you invested, to estimate the expenses that you paid over the period. Simply divide your account value by $1,000.00 (for example, an $8,600 account value divided by $1,000.00 = 8.6), then multiply the result by the number in the first line for a class of the Fund under the heading entitled "Expenses Paid During Period" to estimate the expenses you paid on your account during this period. A small balance maintenance fee of $12.00 that is charged once a year may apply for certain accounts with a value of less than $2,000. This fee is not included in the table below. If it was, the estimate of expenses you paid during the period would be higher, and your ending account value lower, by this amount. In addition, the Fund, as a shareholder in the underlying Fidelity Central Funds, will indirectly bear its pro-rata share of the fees and expenses incurred by the underlying Fidelity Central Funds. These fees and expenses are not included in the Fund's annualized expense ratio used to calculate the expense estimate in the table below.
Hypothetical Example for Comparison Purposes
The second line of the accompanying table for each class of the Fund provides information about hypothetical account values and hypothetical expenses based on a Class' actual expense ratio and an assumed rate of return of 5% per year before expenses, which is not the Class' actual return. The hypothetical account values and expenses may not be used to estimate the actual ending account balance or expenses you paid for the period. You may use this information to compare the ongoing costs of investing in the Fund and other funds. To do so, compare this 5% hypothetical example with the 5% hypothetical examples that appear in the shareholder reports of the other funds. A small balance maintenance fee of $12.00 that is charged once a year may apply for certain accounts with a value of less than $2,000. This fee is not included in the table below. If it was, the estimate of expenses you paid during the period would be higher, and your ending account value lower, by this amount. In addition, the Fund, as a shareholder in the underlying Fidelity Central Funds, will indirectly bear its pro-rata share of the fees and expenses incurred by the underlying Fidelity Central Funds. These fees and expenses are not included in the Fund's annualized expense ratio used to calculate the expense estimate in the table below.
Please note that the expenses shown in the table are meant to highlight your ongoing costs only and do not reflect any transaction costs. Therefore, the second line of the table is useful in comparing ongoing costs only, and will not help you determine the relative total costs of owning different funds. In addition, if these transactional costs were included, your costs would have been higher.
| Annualized Expense Ratio | Beginning
Account Value
May 1, 2012 | Ending
Account Value
October 31, 2012 | Expenses Paid
During Period*
May 1, 2012 to October 31, 2012 |
Class A | 1.45% | | | |
Actual | | $ 1,000.00 | $ 1,011.80 | $ 7.33 |
HypotheticalA | | $ 1,000.00 | $ 1,017.85 | $ 7.35 |
Class T | 1.71% | | | |
Actual | | $ 1,000.00 | $ 1,010.80 | $ 8.64 |
HypotheticalA | | $ 1,000.00 | $ 1,016.54 | $ 8.67 |
Class B | 2.20% | | | |
Actual | | $ 1,000.00 | $ 1,008.30 | $ 11.11 |
HypotheticalA | | $ 1,000.00 | $ 1,014.08 | $ 11.14 |
Class C | 2.20% | | | |
Actual | | $ 1,000.00 | $ 1,008.30 | $ 11.11 |
HypotheticalA | | $ 1,000.00 | $ 1,014.08 | $ 11.14 |
Worldwide | 1.13% | | | |
Actual | | $ 1,000.00 | $ 1,013.30 | $ 5.72 |
HypotheticalA | | $ 1,000.00 | $ 1,019.46 | $ 5.74 |
Institutional Class | 1.20% | | | |
Actual | | $ 1,000.00 | $ 1,013.30 | $ 6.07 |
HypotheticalA | | $ 1,000.00 | $ 1,019.10 | $ 6.09 |
A 5% return per year before expenses
* Expenses are equal to each Class' annualized expense ratio, multiplied by the average account value over the period, multiplied by 184/366 (to reflect the one-half year period).
Annual Report
Fidelity Worldwide Fund
Investment Changes (Unaudited)
Geographic Diversification (% of fund's net assets) |
As of October 31, 2012 |
 | United States of America | 54.0% | |
 | United Kingdom | 10.0% | |
 | Japan | 7.4% | |
 | Germany | 4.0% | |
 | France | 3.8% | |
 | Switzerland | 3.1% | |
 | Netherlands | 1.4% | |
 | Australia | 1.4% | |
 | Canada | 1.4% | |
| Other | 13.5% | |

Percentages are based on country or territory of incorporation and are adjusted for the effect of futures contracts, if applicable. |
As of April 30, 2012 |
| United States of America | 53.8% | |
| United Kingdom | 10.4% | |
| Japan | 7.7% | |
| France | 2.9% | |
| Netherlands | 2.5% | |
| Germany | 2.5% | |
| Switzerland | 2.0% | |
| Korea (South) | 1.8% | |
| Ireland | 1.7% | |
| Other | 14.7% | |

Percentages are based on country or territory of incorporation and are adjusted for the effect of futures contracts, if applicable. |
Asset Allocation |
| % of fund's
net assets | % of fund's net assets
6 months ago |
Stocks and Investment Companies | 95.6 | 98.0 |
Short-Term Investments and Net Other Assets (Liabilities) | 4.4 | 2.0 |
Top Ten Stocks as of October 31, 2012 |
| % of fund's
net assets | % of fund's net assets
6 months ago |
MasterCard, Inc. Class A (United States of America, IT Services) | 3.1 | 3.0 |
Amgen, Inc. (United States of America, Biotechnology) | 1.8 | 0.6 |
American Tower Corp. (United States of America, Real Estate Investment Trusts) | 1.8 | 0.8 |
Pioneer Natural Resources Co. (United States of America, Oil, Gas & Consumable Fuels) | 1.7 | 1.5 |
Gilead Sciences, Inc. (United States of America, Biotechnology) | 1.6 | 0.3 |
General Electric Co. (United States of America, Industrial Conglomerates) | 1.6 | 0.0 |
Apple, Inc. (United States of America, Computers & Peripherals) | 1.5 | 1.7 |
Phillips 66 (United States of America, Oil, Gas & Consumable Fuels) | 1.5 | 0.0 |
Wal-Mart Stores, Inc. (United States of America, Food & Staples Retailing) | 1.5 | 0.0 |
eBay, Inc. (United States of America, Internet Software & Services) | 1.4 | 0.0 |
| 17.5 | |
Market Sectors as of October 31, 2012 |
| % of fund's
net assets | % of fund's net assets
6 months ago |
Financials | 20.2 | 15.9 |
Consumer Discretionary | 16.4 | 17.8 |
Information Technology | 12.2 | 19.9 |
Health Care | 11.6 | 7.8 |
Industrials | 11.3 | 10.8 |
Energy | 8.8 | 7.3 |
Consumer Staples | 7.8 | 10.3 |
Materials | 3.9 | 4.8 |
Telecommunication Services | 2.5 | 2.1 |
Utilities | 0.9 | 1.3 |
Annual Report
Fidelity Worldwide Fund
Investments October 31, 2012
Showing Percentage of Net Assets
Common Stocks - 95.0% |
| Shares | | Value |
Australia - 1.4% |
Australia & New Zealand Banking Group Ltd. | 290,317 | | $ 7,669,703 |
Commonwealth Bank of Australia | 59,860 | | 3,588,451 |
Ramsay Health Care Ltd. | 86,433 | | 2,131,789 |
Spark Infrastructure Group unit | 1,274,589 | | 2,236,017 |
TOTAL AUSTRALIA | | 15,625,960 |
Bailiwick of Jersey - 0.8% |
Experian PLC | 300,300 | | 5,185,318 |
Wolseley PLC | 95,060 | | 4,155,689 |
TOTAL BAILIWICK OF JERSEY | | 9,341,007 |
Belgium - 1.2% |
Anheuser-Busch InBev SA NV | 165,711 | | 13,858,603 |
Bermuda - 0.2% |
Cheung Kong Infrastructure Holdings Ltd. | 398,000 | | 2,331,495 |
Brazil - 0.6% |
Arezzo Industria e Comercio SA | 34,300 | | 612,183 |
Qualicorp SA (a) | 329,000 | | 3,375,771 |
Souza Cruz SA | 112,500 | | 1,467,837 |
Totvs SA | 68,100 | | 1,384,766 |
TOTAL BRAZIL | | 6,840,557 |
British Virgin Islands - 0.1% |
Gem Diamonds Ltd. (a) | 43,875 | | 119,481 |
Mail.ru Group Ltd. GDR (Reg. S) | 41,300 | | 1,377,355 |
TOTAL BRITISH VIRGIN ISLANDS | | 1,496,836 |
Canada - 1.4% |
Canadian Pacific | 113,000 | | 10,395,434 |
Catamaran Corp. (a) | 60,150 | | 2,824,566 |
Goldcorp, Inc. | 35,100 | | 1,586,748 |
InterOil Corp. (a) | 10,500 | | 677,040 |
TOTAL CANADA | | 15,483,788 |
Cayman Islands - 0.2% |
Eurasia Drilling Co. Ltd. GDR (Reg. S) | 27,100 | | 937,660 |
Sands China Ltd. | 277,200 | | 1,042,623 |
TOTAL CAYMAN ISLANDS | | 1,980,283 |
Denmark - 0.8% |
Novo Nordisk A/S Series B | 48,916 | | 7,841,994 |
William Demant Holding A/S (a) | 19,000 | | 1,634,132 |
TOTAL DENMARK | | 9,476,126 |
France - 3.8% |
Arkema SA | 20,430 | | 1,862,627 |
Atos Origin SA | 24,076 | | 1,616,788 |
AXA SA | 237,737 | | 3,779,372 |
BNP Paribas SA | 136,530 | | 6,867,948 |
Bureau Veritas SA | 32,900 | | 3,493,768 |
Credit Agricole SA (a) | 218,100 | | 1,641,865 |
|
| Shares | | Value |
Iliad SA | 20,580 | | $ 3,170,296 |
Lafarge SA (Bearer) | 28,700 | | 1,680,674 |
LVMH Moet Hennessy - Louis Vuitton SA | 21,299 | | 3,461,880 |
PPR SA | 23,950 | | 4,210,955 |
Sanofi SA | 57,258 | | 5,028,826 |
Schneider Electric SA | 74,000 | | 4,626,465 |
Technip SA | 11,800 | | 1,329,098 |
TOTAL FRANCE | | 42,770,562 |
Germany - 3.4% |
Aareal Bank AG (a) | 63,891 | | 1,370,544 |
Allianz AG | 23,424 | | 2,904,335 |
BASF AG | 60,232 | | 4,990,996 |
Bayerische Motoren Werke AG (BMW) | 58,087 | | 4,626,538 |
Brenntag AG | 17,900 | | 2,256,074 |
Fresenius Medical Care AG & Co. KGaA | 22,400 | | 1,573,920 |
Fresenius SE & Co. KGaA | 15,800 | | 1,802,167 |
GEA Group AG | 59,653 | | 1,862,620 |
Gerry Weber International AG (Bearer) | 19,400 | | 880,589 |
GSW Immobilien AG | 32,983 | | 1,357,128 |
HeidelbergCement Finance AG | 31,600 | | 1,674,787 |
MTU Aero Engines Holdings AG | 17,300 | | 1,452,588 |
SAP AG | 75,739 | | 5,523,119 |
Siemens AG | 27,761 | | 2,797,170 |
Wirecard AG | 97,400 | | 2,225,700 |
TOTAL GERMANY | | 37,298,275 |
Hong Kong - 0.9% |
AIA Group Ltd. | 931,000 | | 3,687,938 |
HKT Trust / HKT Ltd. unit | 1,451,000 | | 1,346,145 |
Techtronic Industries Co. Ltd. | 2,334,000 | | 4,445,112 |
TOTAL HONG KONG | | 9,479,195 |
India - 0.5% |
Apollo Hospitals Enterprise Ltd. | 25,151 | | 364,585 |
Housing Development Finance Corp. Ltd. | 205,593 | | 2,912,997 |
Titan Industries Ltd. | 374,259 | | 1,803,649 |
TOTAL INDIA | | 5,081,231 |
Indonesia - 0.3% |
PT Media Nusantara Citra Tbk | 2,557,500 | | 752,203 |
PT Sarana Menara Nusantara Tbk (a) | 371,000 | | 753,198 |
PT Tower Bersama Infrastructure Tbk (a) | 3,318,000 | | 1,727,218 |
TOTAL INDONESIA | | 3,232,619 |
Ireland - 1.3% |
Accenture PLC Class A | 88,000 | | 5,932,080 |
Alkermes PLC (a) | 84,000 | | 1,556,520 |
James Hardie Industries NV CDI | 365,087 | | 3,497,972 |
Paddy Power PLC (Ireland) | 29,700 | | 2,191,943 |
Trinity Biotech PLC sponsored ADR | 35,000 | | 494,900 |
XL Group PLC Class A | 25,000 | | 618,500 |
TOTAL IRELAND | | 14,291,915 |
Common Stocks - continued |
| Shares | | Value |
Israel - 0.2% |
Check Point Software Technologies Ltd. (a) | 44,700 | | $ 1,990,491 |
Italy - 1.3% |
ENI SpA | 175,500 | | 4,038,418 |
Fiat Industrial SpA | 193,937 | | 2,100,208 |
Prada SpA | 253,200 | | 2,064,792 |
Prysmian SpA | 95,200 | | 1,831,159 |
Saipem SpA | 90,615 | | 4,070,839 |
TOTAL ITALY | | 14,105,416 |
Japan - 7.4% |
ABC-Mart, Inc. | 70,200 | | 3,077,790 |
Aeon Credit Service Co. Ltd. | 128,500 | | 2,726,782 |
Aozora Bank Ltd. | 474,000 | | 1,335,964 |
Calbee, Inc. | 21,000 | | 1,928,222 |
Chiyoda Corp. | 171,000 | | 2,758,963 |
Cosmos Pharmaceutical Corp. | 22,900 | | 2,257,585 |
Credit Saison Co. Ltd. | 48,900 | | 1,073,803 |
Daito Trust Construction Co. Ltd. | 13,300 | | 1,342,829 |
Don Quijote Co. Ltd. | 109,500 | | 4,313,886 |
Fanuc Corp. | 17,600 | | 2,802,155 |
Fast Retailing Co. Ltd. | 12,900 | | 2,873,130 |
Hitachi Ltd. | 530,000 | | 2,808,343 |
Honda Motor Co. Ltd. | 95,300 | | 2,865,028 |
Japan Tobacco, Inc. | 167,600 | | 4,631,412 |
JS Group Corp. | 116,000 | | 2,564,700 |
JSR Corp. | 137,200 | | 2,351,116 |
Kakaku.com, Inc. | 54,300 | | 1,860,334 |
Keyence Corp. | 18,460 | | 4,897,693 |
Mitsubishi Estate Co. Ltd. | 163,000 | | 3,224,064 |
Mitsubishi UFJ Financial Group, Inc. | 910,900 | | 4,120,883 |
Nintendo Co. Ltd. | 12,500 | | 1,609,671 |
ORIX Corp. | 79,370 | | 8,152,750 |
Park24 Co. Ltd. | 83,900 | | 1,441,949 |
Rakuten, Inc. | 480,600 | | 4,322,570 |
Seven Bank Ltd. | 795,700 | | 2,272,574 |
Ship Healthcare Holdings, Inc. | 33,300 | | 1,110,834 |
So-net M3, Inc. | 330 | | 634,123 |
Softbank Corp. | 47,800 | | 1,513,098 |
Suzuki Motor Corp. | 86,200 | | 1,952,269 |
Unicharm Corp. | 38,600 | | 2,088,839 |
USS Co. Ltd. | 12,140 | | 1,275,894 |
TOTAL JAPAN | | 82,189,253 |
Korea (South) - 1.1% |
Hyundai Motor Co. | 16,534 | | 3,404,398 |
Kia Motors Corp. | 17,240 | | 958,199 |
LG Household & Health Care Ltd. | 3,511 | | 2,064,120 |
NHN Corp. | 3,893 | | 901,554 |
Orion Corp. | 742 | | 696,867 |
Samsung Electronics Co. Ltd. | 3,934 | | 4,726,631 |
TOTAL KOREA (SOUTH) | | 12,751,769 |
|
| Shares | | Value |
Luxembourg - 0.3% |
Brait SA | 360,653 | | $ 1,418,379 |
Samsonite International SA | 798,000 | | 1,657,770 |
TOTAL LUXEMBOURG | | 3,076,149 |
Netherlands - 1.4% |
AEGON NV | 292,700 | | 1,636,970 |
ASML Holding NV | 59,100 | | 3,248,727 |
Gemalto NV | 33,993 | | 3,067,459 |
ING Groep NV (Certificaten Van Aandelen) (a) | 309,500 | | 2,753,973 |
LyondellBasell Industries NV Class A | 29,000 | | 1,548,310 |
Randstad Holding NV | 42,858 | | 1,399,037 |
Yandex NV (a) | 98,600 | | 2,295,408 |
TOTAL NETHERLANDS | | 15,949,884 |
Norway - 0.5% |
DnB NOR ASA | 326,400 | | 4,076,207 |
Gjensidige Forsikring ASA | 109,900 | | 1,605,716 |
TOTAL NORWAY | | 5,681,923 |
Poland - 0.2% |
Eurocash SA | 215,900 | | 2,636,663 |
Qatar - 0.1% |
Commercial Bank of Qatar GDR (Reg. S) | 306,102 | | 1,208,956 |
Russia - 0.3% |
Mobile TeleSystems OJSC sponsored ADR | 178,700 | | 3,062,918 |
South Africa - 0.3% |
Distell Group Ltd. | 126,410 | | 1,399,591 |
Shoprite Holdings Ltd. | 95,600 | | 1,965,883 |
TOTAL SOUTH AFRICA | | 3,365,474 |
Spain - 1.1% |
Amadeus IT Holding SA Class A | 63,100 | | 1,562,133 |
Banco Bilbao Vizcaya Argentaria SA | 402,808 | | 3,365,846 |
Grifols SA ADR | 71,850 | | 1,807,746 |
Inditex SA | 39,477 | | 5,036,989 |
TOTAL SPAIN | | 11,772,714 |
Sweden - 1.1% |
Atlas Copco AB (A Shares) | 176,100 | | 4,330,219 |
Intrum Justitia AB | 115,000 | | 1,664,430 |
Svenska Handelsbanken AB (A Shares) | 115,600 | | 3,959,704 |
Swedish Match Co. AB | 78,000 | | 2,657,661 |
TOTAL SWEDEN | | 12,612,014 |
Switzerland - 3.1% |
ACE Ltd. | 48,000 | | 3,775,200 |
Adecco SA (Reg.) | 35,860 | | 1,734,279 |
Partners Group Holding AG | 13,818 | | 2,924,437 |
Roche Holding AG (participation certificate) | 23,638 | | 4,545,867 |
Common Stocks - continued |
| Shares | | Value |
Switzerland - continued |
Schindler Holding AG (participation certificate) | 33,294 | | $ 4,386,528 |
SGS SA (Reg.) | 780 | | 1,651,627 |
Swatch Group AG (Bearer) | 2,200 | | 910,426 |
Syngenta AG (Switzerland) | 5,030 | | 1,961,144 |
UBS AG | 248,020 | | 3,721,191 |
UBS AG (NY Shares) | 225,000 | | 3,379,500 |
Zurich Financial Services AG | 20,820 | | 5,130,667 |
TOTAL SWITZERLAND | | 34,120,866 |
Turkey - 0.1% |
Boyner Buyuk Magazacilik A/S (a) | 280,000 | | 643,570 |
United Kingdom - 10.0% |
Aberdeen Asset Management PLC | 355,842 | | 1,863,409 |
Aggreko PLC | 86,400 | | 2,997,702 |
Anglo American PLC (United Kingdom) | 45,018 | | 1,382,488 |
Ashmore Group PLC | 187,900 | | 1,102,824 |
Barclays PLC | 772,037 | | 2,854,788 |
Bellway PLC | 60,700 | | 990,321 |
BG Group PLC | 274,063 | | 5,075,039 |
BHP Billiton PLC | 272,542 | | 8,735,313 |
British American Tobacco PLC (United Kingdom) | 145,200 | | 7,201,863 |
British Land Co. PLC | 332,855 | | 2,838,810 |
Diageo PLC | 244,804 | | 6,998,587 |
Domino's Pizza UK & IRL PLC | 149,600 | | 1,220,363 |
GlaxoSmithKline PLC | 169,900 | | 3,807,028 |
Hikma Pharmaceuticals PLC | 121,783 | | 1,453,319 |
HSBC Holdings PLC (United Kingdom) | 715,328 | | 7,052,627 |
Intertek Group PLC | 46,500 | | 2,115,360 |
Jazztel PLC (a) | 353,900 | | 2,343,995 |
Legal & General Group PLC | 2,217,925 | | 4,796,096 |
Lloyds Banking Group PLC (a) | 2,942,200 | | 1,937,448 |
London Stock Exchange Group PLC | 93,500 | | 1,471,889 |
Meggitt PLC | 416,600 | | 2,595,033 |
Next PLC | 43,800 | | 2,520,529 |
Ocado Group PLC (a)(d) | 898,900 | | 935,637 |
Persimmon PLC | 145,600 | | 1,867,948 |
Rolls-Royce Group PLC | 271,600 | | 3,745,227 |
Rolls-Royce Group PLC Class C | 20,641,600 | | 33,310 |
Rotork PLC | 44,510 | | 1,636,242 |
Royal Dutch Shell PLC Class B (United Kingdom) | 371,647 | | 13,146,061 |
SABMiller PLC | 68,400 | | 2,930,050 |
Standard Chartered PLC (United Kingdom) | 106,579 | | 2,517,101 |
Taylor Wimpey PLC | 1,367,400 | | 1,348,258 |
The Weir Group PLC | 47,100 | | 1,324,053 |
Ultra Electronics Holdings PLC | 36,900 | | 1,008,137 |
Vodafone Group PLC | 2,244,100 | | 6,094,158 |
Vodafone Group PLC sponsored ADR | 47,212 | | 1,285,111 |
TOTAL UNITED KINGDOM | | 111,226,124 |
|
| Shares | | Value |
United States of America - 49.6% |
Abbott Laboratories | 147,000 | | $ 9,631,440 |
American International Group, Inc. (a) | 332,000 | | 11,596,760 |
American Tower Corp. | 259,000 | | 19,500,110 |
Amgen, Inc. | 234,000 | | 20,251,530 |
Apple, Inc. | 28,600 | | 17,019,860 |
Beam, Inc. | 54,900 | | 3,050,244 |
Berkshire Hathaway, Inc. Class B (a) | 109,000 | | 9,412,150 |
Cabela's, Inc. Class A (a) | 263,000 | | 11,785,030 |
Cabot Oil & Gas Corp. | 291,000 | | 13,671,180 |
Capital One Financial Corp. | 165,000 | | 9,928,050 |
Citigroup, Inc. | 336,000 | | 12,563,040 |
Citrix Systems, Inc. (a) | 18,209 | | 1,125,498 |
Clean Harbors, Inc. (a) | 13,000 | | 758,550 |
Cognizant Technology Solutions Corp. Class A (a) | 23,300 | | 1,552,945 |
Comcast Corp. Class A | 404,000 | | 15,154,040 |
Constellation Brands, Inc. Class A (sub. vtg.) (a) | 69,000 | | 2,438,460 |
Crown Castle International Corp. (a) | 44,000 | | 2,937,000 |
Discover Financial Services | 211,000 | | 8,651,000 |
Discovery Communications, Inc. (a) | 254,000 | | 14,991,080 |
DISH Network Corp. Class A | 45,000 | | 1,603,350 |
Dollar General Corp. (a) | 23,900 | | 1,162,018 |
Eastman Chemical Co. | 13,000 | | 770,120 |
eBay, Inc. (a) | 324,800 | | 15,684,592 |
Estee Lauder Companies, Inc. Class A | 89,700 | | 5,527,314 |
Facebook, Inc. Class A | 88,000 | | 1,858,120 |
Foot Locker, Inc. | 71,000 | | 2,378,500 |
Freeport-McMoRan Copper & Gold, Inc. | 108,000 | | 4,199,040 |
G-III Apparel Group Ltd. (a) | 68,000 | | 2,513,280 |
General Electric Co. | 832,800 | | 17,538,768 |
Georgia Gulf Corp. (d) | 35,200 | | 1,245,728 |
Gilead Sciences, Inc. (a) | 270,000 | | 18,133,200 |
GNC Holdings, Inc. | 159,000 | | 6,148,530 |
Home Depot, Inc. | 134,000 | | 8,224,920 |
International Paper Co. | 90,000 | | 3,224,700 |
J.B. Hunt Transport Services, Inc. | 164,600 | | 9,662,020 |
James River Coal Co. (a)(d) | 310,000 | | 1,553,100 |
Johnson & Johnson | 128,000 | | 9,064,960 |
Lumber Liquidators Holdings, Inc. (a) | 25,000 | | 1,395,500 |
M&T Bank Corp. | 80,000 | | 8,328,000 |
Marathon Petroleum Corp. | 66,000 | | 3,625,380 |
MasterCard, Inc. Class A | 74,400 | | 34,293,189 |
Medivation, Inc. (a) | 44,000 | | 2,249,280 |
Merck & Co., Inc. | 148,000 | | 6,753,240 |
Michael Kors Holdings Ltd. | 33,200 | | 1,815,708 |
Noble Energy, Inc. | 78,000 | | 7,410,780 |
Ocwen Financial Corp. (a) | 73,000 | | 2,815,610 |
Onyx Pharmaceuticals, Inc. (a) | 101,000 | | 7,914,360 |
Palo Alto Networks, Inc. | 3,300 | | 181,434 |
Peabody Energy Corp. | 224,000 | | 6,249,600 |
Pfizer, Inc. | 365,000 | | 9,077,550 |
Common Stocks - continued |
| Shares | | Value |
United States of America - continued |
Phillips 66 | 360,000 | | $ 16,977,600 |
Pioneer Natural Resources Co. | 183,900 | | 19,429,035 |
Prestige Brands Holdings, Inc. (a) | 304,000 | | 5,286,560 |
PulteGroup, Inc. (a) | 384,000 | | 6,658,560 |
PVH Corp. | 50,000 | | 5,499,500 |
Ralph Lauren Corp. | 9,000 | | 1,383,210 |
Realogy Holdings Corp. | 78,800 | | 2,800,552 |
Royal Gold, Inc. | 24,200 | | 2,131,536 |
salesforce.com, Inc. (a) | 77,000 | | 11,240,460 |
SBA Communications Corp. Class A (a) | 54,000 | | 3,598,020 |
Sempra Energy | 75,800 | | 5,287,050 |
Sirius XM Radio, Inc. (a) | 415,000 | | 1,162,000 |
The Cooper Companies, Inc. | 25,000 | | 2,399,500 |
The Travelers Companies, Inc. | 70,000 | | 4,965,800 |
TJX Companies, Inc. | 237,500 | | 9,887,125 |
Toll Brothers, Inc. (a) | 108,000 | | 3,565,080 |
Total System Services, Inc. | 67,900 | | 1,527,071 |
Under Armour, Inc. Class A (sub. vtg.) (a) | 67,200 | | 3,511,872 |
Union Pacific Corp. | 120,400 | | 14,812,812 |
United Rentals, Inc. (a) | 88,000 | | 3,578,080 |
Urban Outfitters, Inc. (a) | 63,000 | | 2,252,880 |
USG Corp. (a) | 61,000 | | 1,629,310 |
Visa, Inc. Class A | 36,000 | | 4,995,360 |
Wal-Mart Stores, Inc. | 215,000 | | 16,129,300 |
Watson Pharmaceuticals, Inc. (a) | 19,100 | | 1,641,645 |
Wells Fargo & Co. | 230,000 | | 7,748,700 |
Whirlpool Corp. | 16,000 | | 1,562,880 |
Workday, Inc. | 16,250 | | 788,125 |
TOTAL UNITED STATES OF AMERICA | | 551,069,481 |
TOTAL COMMON STOCKS (Cost $954,498,052) |
1,056,052,117
|
Nonconvertible Preferred Stocks - 0.6% |
| | | |
Germany - 0.6% |
Volkswagen AG
(Cost $4,272,812) | 28,900 | |
5,978,414
|
Investment Companies - 0.0% |
| Shares | | Value |
Cyprus - 0.0% |
Aisi Realty Public Ltd. (a)
(Cost $430,048) | 31,822 | | $ 37,744 |
Money Market Funds - 4.8% |
| | | |
Fidelity Cash Central Fund, 0.19% (b) | 51,411,090 | | 51,411,090 |
Fidelity Securities Lending Cash Central Fund, 0.19% (b)(c) | 2,317,903 | | 2,317,903 |
TOTAL MONEY MARKET FUNDS (Cost $53,728,993) |
53,728,993
|
TOTAL INVESTMENT PORTFOLIO - 100.4% (Cost $1,012,929,905) | 1,115,797,268 |
NET OTHER ASSETS (LIABILITIES) - (0.4)% | (3,962,689) |
NET ASSETS - 100% | $ 1,111,834,579 |
Legend |
(a) Non-income producing |
(b) Affiliated fund that is available only to investment companies and other accounts managed by Fidelity Investments. The rate quoted is the annualized seven-day yield of the fund at period end. A complete unaudited listing of the fund's holdings as of its most recent quarter end is available upon request. In addition, each Fidelity Central Fund's financial statements, which are not covered by the Fund's Report of Independent Registered Public Accounting Firm, are available on the SEC's website or upon request. |
(c) Investment made with cash collateral received from securities on loan. |
(d) Security or a portion of the security is on loan at period end. |
Affiliated Central Funds |
Information regarding fiscal year to date income earned by the Fund from investments in Fidelity Central Funds is as follows: |
Fund | Income earned |
Fidelity Cash Central Fund | $ 40,337 |
Fidelity Securities Lending Cash Central Fund | 279,543 |
Total | $ 319,880 |
Other Information |
Categorizations in the Schedule of Investments are based on country or territory of incorporation. |
The following is a summary of the inputs used, as of October 31, 2012, involving the Fund's assets and liabilities carried at fair value. The inputs or methodology used for valuing securities may not be an indication of the risk associated with investing in those securities. For more information on valuation inputs, and their aggregation into the levels used in the tables below, please refer to the Security Valuation section in the accompanying Notes to Financial Statements. |
Valuation Inputs at Reporting Date: |
Description | Total | Level 1 | Level 2 | Level 3 |
Investments in Securities: | | | | |
Equities: | | | | |
Consumer Discretionary | $ 176,900,919 | $ 174,035,891 | $ 2,865,028 | $ - |
Consumer Staples | 87,215,661 | 59,156,608 | 28,059,053 | - |
Energy | 98,190,830 | 81,006,351 | 17,184,479 | - |
Financials | 224,349,940 | 196,906,214 | 27,443,726 | - |
Health Care | 129,104,792 | 110,853,024 | 18,251,768 | - |
Industrials | 128,324,984 | 125,527,814 | 2,797,170 | - |
Information Technology | 137,294,906 | 131,771,787 | 5,523,119 | - |
Materials | 42,962,780 | 32,266,323 | 10,696,457 | - |
Telecommunication Services | 27,831,157 | 21,736,999 | 6,094,158 | - |
Utilities | 9,854,562 | 9,854,562 | - | - |
Investment Companies | 37,744 | 37,744 | - | - |
Money Market Funds | 53,728,993 | 53,728,993 | - | - |
Total Investments in Securities: | $ 1,115,797,268 | $ 996,882,310 | $ 118,914,958 | $ - |
The following is a summary of transfers between Level 1 and Level 2 for the period ended October 31, 2012. Transfers are assumed to have occurred at the beginning of the period, and are primarily attributable to the valuation techniques used for foreign equity securities, as discussed in the accompanying Notes to Financial Statements. |
Transfers | Total |
Level 1 to Level 2 | $ 0 |
Level 2 to Level 1 | $ 90,641,463 |
See accompanying notes which are an integral part of the financial statements.
Annual Report
Fidelity Worldwide Fund
Statement of Assets and Liabilities
| October 31, 2012 |
| | |
Assets | | |
Investment in securities, at value (including securities loaned of $2,205,469) - See accompanying schedule: Unaffiliated issuers (cost $959,200,912) | $ 1,062,068,275 | |
Fidelity Central Funds (cost $53,728,993) | 53,728,993 | |
Total Investments (cost $1,012,929,905) | | $ 1,115,797,268 |
Foreign currency held at value (cost $44) | | 44 |
Receivable for investments sold | | 10,574,510 |
Receivable for fund shares sold | | 940,937 |
Dividends receivable | | 1,164,537 |
Distributions receivable from Fidelity Central Funds | | 22,934 |
Other receivables | | 304,491 |
Total assets | | 1,128,804,721 |
| | |
Liabilities | | |
Payable for investments purchased | $ 10,558,754 | |
Payable for fund shares redeemed | 2,935,923 | |
Accrued management fee | 817,065 | |
Distribution and service plan fees payable | 7,965 | |
Other affiliated payables | 252,086 | |
Other payables and accrued expenses | 80,446 | |
Collateral on securities loaned, at value | 2,317,903 | |
Total liabilities | | 16,970,142 |
| | |
Net Assets | | $ 1,111,834,579 |
Net Assets consist of: | | |
Paid in capital | | $ 1,006,383,968 |
Undistributed net investment income | | 7,478,979 |
Accumulated undistributed net realized gain (loss) on investments and foreign currency transactions | | (4,823,058) |
Net unrealized appreciation (depreciation) on investments and assets and liabilities in foreign currencies | | 102,794,690 |
Net Assets | | $ 1,111,834,579 |
Statement of Assets and Liabilities - continued
| October 31, 2012 |
| | |
Calculation of Maximum Offering Price Class A:
Net Asset Value and redemption price per share ($18,723,279 ÷ 950,719 shares) | | $ 19.69 |
| | |
Maximum offering price per share (100/94.25 of $19.69) | | $ 20.89 |
Class T:
Net Asset Value and redemption price per share ($5,550,095 ÷ 283,053 shares) | | $ 19.61 |
| | |
Maximum offering price per share (100/96.50 of $19.61) | | $ 20.32 |
Class B:
Net Asset Value and offering price per share ($303,960 ÷ 15,635 shares)A | | $ 19.44 |
| | |
Class C:
Net Asset Value and offering price per share ($1,726,205 ÷ 88,954 shares)A | | $ 19.41 |
| | |
Worldwide:
Net Asset Value, offering price and redemption price per share ($1,081,240,346 ÷ 54,468,873 shares) | | $ 19.85 |
| | |
Institutional Class:
Net Asset Value, offering price and redemption price per share ($4,290,694 ÷ 216,909 shares) | | $ 19.78 |
A Redemption price per share is equal to net asset value less any applicable contingent deferred sales charge.
See accompanying notes which are an integral part of the financial statements.
Annual Report
Fidelity Worldwide Fund
Financial Statements - continued
Statement of Operations
| Year ended October 31, 2012 |
Investment Income | | |
Dividends | | $ 21,411,923 |
Interest | | 1,045 |
Income from Fidelity Central Funds | | 319,880 |
Income before foreign taxes withheld | | 21,732,848 |
Less foreign taxes withheld | | (812,686) |
Total income | | 20,920,162 |
| | |
Expenses | | |
Management fee
Basic fee | $ 7,679,076 | |
Performance adjustment | 954,154 | |
Transfer agent fees | 2,526,973 | |
Distribution and service plan fees | 76,255 | |
Accounting and security lending fees | 503,914 | |
Custodian fees and expenses | 178,378 | |
Independent trustees' compensation | 7,299 | |
Registration fees | 91,889 | |
Audit | 78,615 | |
Legal | 6,059 | |
Interest | 56 | |
Miscellaneous | 12,139 | |
Total expenses before reductions | 12,114,807 | |
Expense reductions | (206,687) | 11,908,120 |
Net investment income (loss) | | 9,012,042 |
Realized and Unrealized Gain (Loss) Net realized gain (loss) on: | | |
Investment securities: | | |
Unaffiliated issuers | 52,952,242 | |
Foreign currency transactions | (72,889) | |
Total net realized gain (loss) | | 52,879,353 |
Change in net unrealized appreciation (depreciation) on: Investment securities | 45,677,356 | |
Assets and liabilities in foreign currencies | (88,023) | |
Total change in net unrealized appreciation (depreciation) | | 45,589,333 |
Net gain (loss) | | 98,468,686 |
Net increase (decrease) in net assets resulting from operations | | $ 107,480,728 |
Statement of Changes in Net Assets
| Year ended
October 31,
2012 | Year ended
October 31,
2011 |
Increase (Decrease) in Net Assets | | |
Operations | | |
Net investment income (loss) | $ 9,012,042 | $ 7,182,199 |
Net realized gain (loss) | 52,879,353 | 120,543,178 |
Change in net unrealized appreciation (depreciation) | 45,589,333 | (94,457,618) |
Net increase (decrease) in net assets resulting from operations | 107,480,728 | 33,267,759 |
Distributions to shareholders from net investment income | (4,089,511) | (6,244,141) |
Distributions to shareholders from net realized gain | - | (2,870,519) |
Total distributions | (4,089,511) | (9,114,660) |
Share transactions - net increase (decrease) | (126,253,328) | 12,558,124 |
Redemption fees | 23,898 | 33,448 |
Total increase (decrease) in net assets | (22,838,213) | 36,744,671 |
| | |
Net Assets | | |
Beginning of period | 1,134,672,792 | 1,097,928,121 |
End of period (including undistributed net investment income of $7,478,979 and undistributed net investment income of $2,700,979, respectively) | $ 1,111,834,579 | $ 1,134,672,792 |
See accompanying notes which are an integral part of the financial statements.
Annual Report
Financial Highlights - Class A
Years ended October 31, | 2012 | 2011 | 2010 | 2009 H |
Selected Per-Share Data | | | | |
Net asset value, beginning of period | $ 17.89 | $ 17.50 | $ 14.96 | $ 10.88 |
Income from Investment Operations | | | | |
Net investment income (loss) E | .10 | .05 | .03 | (.01) |
Net realized and unrealized gain (loss) | 1.72 | .47 | 2.63 | 4.09 |
Total from investment operations | 1.82 | .52 | 2.66 | 4.08 |
Distributions from net investment income | (.02) | (.08) | (.10) | - |
Distributions from net realized gain | - | (.05) | (.02) | - |
Total distributions | (.02) | (.13) | (.12) | - |
Redemption fees added to paid in capital E,J | - | - | - | - |
Net asset value, end of period | $ 19.69 | $ 17.89 | $ 17.50 | $ 14.96 |
Total Return B,C,D | 10.20% | 2.94% | 17.85% | 37.50% |
Ratios to Average Net Assets F,I | | | | |
Expenses before reductions | 1.43% | 1.41% | 1.43% | 1.52% A |
Expenses net of fee waivers, if any | 1.43% | 1.40% | 1.43% | 1.52% A |
Expenses net of all reductions | 1.41% | 1.38% | 1.41% | 1.49% A |
Net investment income (loss) | .52% | .28% | .21% | (.06)% A |
Supplemental Data | | | | |
Net assets, end of period (000 omitted) | $ 18,723 | $ 13,153 | $ 7,530 | $ 993 |
Portfolio turnover rate G | 186% | 203% | 166% | 224% |
A Annualized
B Total returns for periods of less than one year are not annualized.
C Total returns would have been lower if certain expenses had not been reduced during the applicable periods shown.
D Total returns do not include the effect of the sales charges.
E Calculated based on average shares outstanding during the period.
F Fees and expenses of any underlying Fidelity Central Funds are not included in the Fund's expense ratio. The Fund indirectly bears its proportionate share of the expenses of any underlying Fidelity Central Funds.
G Amount does not include the portfolio activity of any underlying Fidelity Central Funds.
H For the period February 19, 2009 (commencement of sale of shares) to October 31, 2009.
I Expense ratios reflect operating expenses of the class. Expenses before reductions do not reflect amounts reimbursed by the investment adviser or reductions from brokerage service arrangements or reductions from other expense offset arrangements and do not represent the amount paid by the class during periods when reimbursements or reductions occur. Expense ratios before reductions for start-up periods may not be representative of longer-term operating periods. Expenses net of fee waivers reflect expenses after reimbursement by the investment adviser but prior to reductions from brokerage service arrangements or other expense offset arrangements. Expenses net of all reductions represent the net expenses paid by the class.
J Amount represents less than $.01 per share.
Financial Highlights - Class T
Years ended October 31, | 2012 | 2011 | 2010 | 2009 H |
Selected Per-Share Data | | | | |
Net asset value, beginning of period | $ 17.83 | $ 17.46 | $ 14.94 | $ 10.88 |
Income from Investment Operations | | | | |
Net investment income (loss) E | .05 | .01 | (.01) | (.01) |
Net realized and unrealized gain (loss) | 1.73 | .45 | 2.62 | 4.07 |
Total from investment operations | 1.78 | .46 | 2.61 | 4.06 |
Distributions from net investment income | - | (.04) | (.08) | - |
Distributions from net realized gain | - | (.05) | (.02) | - |
Total distributions | - | (.09) | (.09) K | - |
Redemption fees added to paid in capital E,J | - | - | - | - |
Net asset value, end of period | $ 19.61 | $ 17.83 | $ 17.46 | $ 14.94 |
Total Return B,C,D | 9.98% | 2.61% | 17.53% | 37.32% |
Ratios to Average Net Assets F,I | | | | |
Expenses before reductions | 1.68% | 1.66% | 1.70% | 1.73% A |
Expenses net of fee waivers, if any | 1.68% | 1.65% | 1.70% | 1.73% A |
Expenses net of all reductions | 1.66% | 1.63% | 1.68% | 1.70% A |
Net investment income (loss) | .26% | .03% | (.05)% | (.08)% A |
Supplemental Data | | | | |
Net assets, end of period (000 omitted) | $ 5,550 | $ 2,187 | $ 1,120 | $ 458 |
Portfolio turnover rate G | 186% | 203% | 166% | 224% |
A Annualized
B Total returns for periods of less than one year are not annualized.
C Total returns would have been lower if certain expenses had not been reduced during the applicable periods shown.
D Total returns do not include the effect of the sales charges.
E Calculated based on average shares outstanding during the period.
F Fees and expenses of any underlying Fidelity Central Funds are not included in the Fund's expense ratio. The Fund indirectly bears its proportionate share of the expenses of any underlying Fidelity Central Funds.
G Amount does not include the portfolio activity of any underlying Fidelity Central Funds.
H For the period February 19, 2009 (commencement of sale of shares) to October 31, 2009.
I Expense ratios reflect operating expenses of the class. Expenses before reductions do not reflect amounts reimbursed by the investment adviser or reductions from brokerage service arrangements or reductions from other expense offset arrangements and do not represent the amount paid by the class during periods when reimbursements or reductions occur. Expense ratios before reductions for start-up periods may not be representative of longer-term operating periods. Expenses net of fee waivers reflect expenses after reimbursement by the investment adviser but prior to reductions from brokerage service arrangements or other expense offset arrangements. Expenses net of all reductions represent the net expenses paid by the class.
J Amount represents less than $.01 per share.
K Total distributions of $.09 per share is comprised of distributions from net investment income of $.075 and distributions from net realized gain of $.015 per share.
See accompanying notes which are an integral part of the financial statements.
Annual Report
Financial Highlights - Class B
Years ended October 31, | 2012 | 2011 | 2010 | 2009 H |
Selected Per-Share Data | | | | |
Net asset value, beginning of period | $ 17.77 | $ 17.39 | $ 14.89 | $ 10.88 |
Income from Investment Operations | | | | |
Net investment income (loss) E | (.04) | (.09) | (.09) | (.03) |
Net realized and unrealized gain (loss) | 1.71 | .47 | 2.61 | 4.04 |
Total from investment operations | 1.67 | .38 | 2.52 | 4.01 |
Distributions from net investment income | - | - | (.01) | - |
Distributions from net realized gain | - | - | (.01) | - |
Total distributions | - | - | (.02) | - |
Redemption fees added to paid in capital E,J | - | - | - | - |
Net asset value, end of period | $ 19.44 | $ 17.77 | $ 17.39 | $ 14.89 |
Total Return B,C,D | 9.40% | 2.19% | 16.92% | 36.86% |
Ratios to Average Net Assets F,I | | | | |
Expenses before reductions | 2.18% | 2.16% | 2.19% | 2.20% A |
Expenses net of fee waivers, if any | 2.18% | 2.16% | 2.19% | 2.20% A |
Expenses net of all reductions | 2.16% | 2.13% | 2.17% | 2.17% A |
Net investment income (loss) | (.23)% | (.47)% | (.55)% | (.30)% A |
Supplemental Data | | | | |
Net assets, end of period (000 omitted) | $ 304 | $ 256 | $ 305 | $ 224 |
Portfolio turnover rate G | 186% | 203% | 166% | 224% |
A Annualized
B Total returns for periods of less than one year are not annualized.
C Total returns would have been lower if certain expenses had not been reduced during the applicable periods shown.
D Total returns do not include the effect of the contingent deferred sales charge.
E Calculated based on average shares outstanding during the period.
F Fees and expenses of any underlying Fidelity Central Funds are not included in the Fund's expense ratio. The Fund indirectly bears its proportionate share of the expenses of any underlying Fidelity Central Funds.
G Amount does not include the portfolio activity of any underlying Fidelity Central Funds.
H For the period February 19, 2009 (commencement of sale of shares) to October 31, 2009.
I Expense ratios reflect operating expenses of the class. Expenses before reductions do not reflect amounts reimbursed by the investment adviser or reductions from brokerage service arrangements or reductions from other expense offset arrangements and do not represent the amount paid by the class during periods when reimbursements or reductions occur. Expense ratios before reductions for start-up periods may not be representative of longer-term operating periods. Expenses net of fee waivers reflect expenses after reimbursement by the investment adviser but prior to reductions from brokerage service arrangements or other expense offset arrangements. Expenses net of all reductions represent the net expenses paid by the class.
J Amount represents less than $.01 per share.
Financial Highlights - Class C
Years ended October 31, | 2012 | 2011 | 2010 | 2009 H |
Selected Per-Share Data | | | | |
Net asset value, beginning of period | $ 17.74 | $ 17.36 | $ 14.89 | $ 10.88 |
Income from Investment Operations | | | | |
Net investment income (loss) E | (.04) | (.09) | (.09) | (.04) |
Net realized and unrealized gain (loss) | 1.71 | .47 | 2.61 | 4.05 |
Total from investment operations | 1.67 | .38 | 2.52 | 4.01 |
Distributions from net investment income | - | - | (.03) | - |
Distributions from net realized gain | - | - | (.02) | - |
Total distributions | - | - | (.05) | - |
Redemption fees added to paid in capital E,J | - | - | - | - |
Net asset value, end of period | $ 19.41 | $ 17.74 | $ 17.36 | $ 14.89 |
Total Return B,C,D | 9.41% | 2.19% | 16.94% | 36.86% |
Ratios to Average Net Assets F,I | | | | |
Expenses before reductions | 2.18% | 2.16% | 2.19% | 2.18% A |
Expenses net of fee waivers, if any | 2.18% | 2.15% | 2.19% | 2.18% A |
Expenses net of all reductions | 2.16% | 2.13% | 2.16% | 2.15% A |
Net investment income (loss) | (.23)% | (.47)% | (.54)% | (.39)% A |
Supplemental Data | | | | |
Net assets, end of period (000 omitted) | $ 1,726 | $ 1,297 | $ 710 | $ 335 |
Portfolio turnover rate G | 186% | 203% | 166% | 224% |
A Annualized
B Total returns for periods of less than one year are not annualized.
C Total returns would have been lower if certain expenses had not been reduced during the applicable periods shown.
D Total returns do not include the effect of the contingent deferred sales charge.
E Calculated based on average shares outstanding during the period.
F Fees and expenses of any underlying Fidelity Central Funds are not included in the Fund's expense ratio. The Fund indirectly bears its proportionate share of the expenses of any underlying Fidelity Central Funds.
G Amount does not include the portfolio activity of any underlying Fidelity Central Funds.
H For the period February 19, 2009 (commencement of sale of shares) to October 31, 2009.
I Expense ratios reflect operating expenses of the class. Expenses before reductions do not reflect amounts reimbursed by the investment adviser or reductions from brokerage service arrangements or reductions from other expense offset arrangements and do not represent the amount paid by the class during periods when reimbursements or reductions occur. Expense ratios before reductions for start-up periods may not be representative of longer-term operating periods. Expenses net of fee waivers reflect expenses after reimbursement by the investment adviser but prior to reductions from brokerage service arrangements or other expense offset arrangements. Expenses net of all reductions represent the net expenses paid by the class.
J Amount represents less than $.01 per share.
See accompanying notes which are an integral part of the financial statements.
Annual Report
Financial Highlights - Worldwide
Years ended October 31, | 2012 | 2011 | 2010 | 2009 | 2008 |
Selected Per-Share Data | | | | | |
Net asset value, beginning of period | $ 18.02 | $ 17.58 | $ 14.98 | $ 13.40 | $ 25.18 |
Income from Investment Operations | | | | | |
Net investment income (loss) B | .16 | .11 | .08 | .12 | .16 |
Net realized and unrealized gain (loss) | 1.74 | .48 | 2.63 | 1.63 | (9.44) |
Total from investment operations | 1.90 | .59 | 2.71 | 1.75 | (9.28) |
Distributions from net investment income | (.07) | (.10) | (.10) | (.17) | (.12) |
Distributions from net realized gain | - | (.05) | (.02) | - | (2.38) |
Total distributions | (.07) | (.15) | (.11) G | (.17) | (2.50) |
Redemption fees added to paid in capital B,F | - | - | - | - | - |
Net asset value, end of period | $ 19.85 | $ 18.02 | $ 17.58 | $ 14.98 | $ 13.40 |
Total Return A | 10.56% | 3.32% | 18.18% | 13.39% | (40.66)% |
Ratios to Average Net Assets C,E | | | | | |
Expenses before reductions | 1.11% | 1.08% | 1.15% | 1.27% | 1.21% |
Expenses net of fee waivers, if any | 1.11% | 1.08% | 1.15% | 1.27% | 1.21% |
Expenses net of all reductions | 1.09% | 1.05% | 1.12% | 1.24% | 1.19% |
Net investment income (loss) | .84% | .60% | .50% | .92% | .84% |
Supplemental Data | | | | | |
Net assets, end of period (000 omitted) | $ 1,081,240 | $ 1,114,694 | $ 1,087,928 | $ 991,996 | $ 934,885 |
Portfolio turnover rate D | 186% | 203% | 166% | 224% | 264% |
A Total returns would have been lower if certain expenses had not been reduced during the applicable periods shown.
B Calculated based on average shares outstanding during the period.
C Fees and expenses of any underlying Fidelity Central Funds are not included in the Fund's expense ratio. The Fund indirectly bears its proportionate share of the expenses of any underlying Fidelity Central Funds.
D Amount does not include the portfolio activity of any underlying Fidelity Central Funds.
E Expense ratios reflect operating expenses of the class. Expenses before reductions do not reflect amounts reimbursed by the investment adviser or reductions from brokerage service arrangements or reductions from other expense offset arrangements and do not represent the amount paid by the class during periods when reimbursements or reductions occur. Expenses net of fee waivers reflect expenses after reimbursement by the investment adviser but prior to reductions from brokerage service arrangements or other expense offset arrangements. Expenses net of all reductions represent the net expenses paid by the class.
F Amount represents less than $.01 per share.
G Total distributions of $.11 per share is comprised of distributions from net investment income of $.097 and distributions from net realized gain of $.015 per share.
Financial Highlights - Institutional Class
Years ended October 31, | 2012 | 2011 | 2010 | 2009 G |
Selected Per-Share Data | | | | |
Net asset value, beginning of period | $ 17.98 | $ 17.57 | $ 15.00 | $ 10.88 |
Income from Investment Operations | | | | |
Net investment income (loss) D | .14 | .10 | .07 | .06 |
Net realized and unrealized gain (loss) | 1.74 | .47 | 2.63 | 4.06 |
Total from investment operations | 1.88 | .57 | 2.70 | 4.12 |
Distributions from net investment income | (.08) | (.11) | (.11) | - |
Distributions from net realized gain | - | (.05) | (.02) | - |
Total distributions | (.08) | (.16) | (.13) | - |
Redemption fees added to paid in capital D,I | - | - | - | - |
Net asset value, end of period | $ 19.78 | $ 17.98 | $ 17.57 | $ 15.00 |
Total Return B,C | 10.49% | 3.23% | 18.08% | 37.87% |
Ratios to Average Net Assets E,H | | | | |
Expenses before reductions | 1.18% | 1.13% | 1.21% | 1.17% A |
Expenses net of fee waivers, if any | 1.18% | 1.13% | 1.21% | 1.17% A |
Expenses net of all reductions | 1.16% | 1.10% | 1.19% | 1.15% A |
Net investment income (loss) | .77% | .56% | .44% | .62% A |
Supplemental Data | | | | |
Net assets, end of period (000 omitted) | $ 4,291 | $ 3,086 | $ 335 | $ 290 |
Portfolio turnover rate F | 186% | 203% | 166% | 224% |
A Annualized
B Total returns for periods of less than one year are not annualized.
C Total returns would have been lower if certain expenses had not been reduced during the applicable periods shown.
D Calculated based on average shares outstanding during the period.
E Fees and expenses of any underlying Fidelity Central Funds are not included in the Fund's expense ratio. The Fund indirectly bears its proportionate share of the expenses of any underlying Fidelity Central Funds.
F Amount does not include the portfolio activity of any underlying Fidelity Central Funds.
G For the period February 19, 2009 (commencement of sale of shares) to October 31, 2009.
H Expense ratios reflect operating expenses of the class. Expenses before reductions do not reflect amounts reimbursed by the investment adviser or reductions from brokerage service arrangements or reductions from other expense offset arrangements and do not represent the amount paid by the class during periods when reimbursements or reductions occur. Expense ratios before reductions for start-up periods may not be representative of longer-term operating periods. Expenses net of fee waivers reflect expenses after reimbursement by the investment adviser but prior to reductions from brokerage service arrangements or other expense offset arrangements. Expenses net of all reductions represent the net expenses paid by the class.
I Amount represents less than $.01 per share.
See accompanying notes which are an integral part of the financial statements.
Annual Report
Fidelity Worldwide Fund
Notes to Financial Statements
For the period ended October 31, 2012
1. Organization.
Fidelity Worldwide Fund (the Fund) is a fund of Fidelity Investment Trust (the Trust) and is authorized to issue an unlimited number of shares. The Trust is registered under the Investment Company Act of 1940, as amended (the 1940 Act), as an open-end management investment company organized as a Massachusetts business trust. The Fund offers Class A, Class T, Class C, Worldwide and Institutional Class shares, each of which, along with Class B shares, has equal rights as to assets and voting privileges. Effective after the close of business on September 1, 2010, Class B shares were closed to new accounts and additional purchases, except for exchanges and reinvestments. Each class has exclusive voting rights with respect to matters that affect that class. Class B shares will automatically convert to Class A shares after a holding period of seven years from the initial date of purchase. Investment income, realized and unrealized capital gains and losses, the common expenses of the Fund, and certain fund-level expense reductions, if any, are allocated on a pro-rata basis to each class based on the relative net assets of each class to the total net assets of the Fund. Each class differs with respect to transfer agent and distribution and service plan fees incurred. Certain expense reductions may also differ by class.
2. Investments in Fidelity Central Funds.
The Fund invests in Fidelity Central Funds, which are open-end investment companies available only to other investment companies and accounts managed by Fidelity Management & Research Company (FMR) and its affiliates. The Fund's Schedule of Investments lists each of the Fidelity Central Funds held as of period end, as an investment of the Fund, but does not include the underlying holdings of each Fidelity Central Fund. As an Investing Fund, the Fund indirectly bears its proportionate share of the expenses of the underlying Fidelity Central Funds.
The Money Market Central Funds seek preservation of capital and current income and are managed by Fidelity Investments Money Management, Inc. (FIMM), an affiliate of FMR.
A complete unaudited list of holdings for each Fidelity Central Fund is available upon request or at the Securities and Exchange Commission (the SEC) web site at www.sec.gov. In addition, the financial statements of the Fidelity Central Funds, which are not covered by the Fund's Report of Independent Registered Public Accounting Firm, are available on the SEC web site or upon request.
3. Significant Accounting Policies.
The financial statements have been prepared in conformity with accounting principles generally accepted in the United States of America (GAAP), which require management to make certain estimates and assumptions at the date of the financial statements. Actual results could differ from those estimates. Subsequent events, if any, through the date that the financial statements were issued have been evaluated in the preparation of the financial statements. The following summarizes the significant accounting policies of the Fund:
Security Valuation. Investments are valued as of 4:00 p.m. Eastern time on the last calendar day of the period. In accordance with valuation policies and procedures approved by the Board of Trustees (the Board), the Fund attempts to obtain prices from one or more third party pricing vendors or brokers to value its investments. When current market prices, quotations or rates are not readily available or reliable, securities will be fair valued in good faith by the FMR Fair Value Committee (the Committee), in accordance with procedures adopted by the Fund's Board. Factors used in determining fair value vary by security type and may include market or security specific events. The frequency with which these procedures are used cannot be predicted and they may be utilized to a significant extent. The Committee oversees the Fund's valuation policies and procedures and is responsible for approving and reporting to the Board all fair value determinations.
The Fund categorizes the inputs to valuation techniques used to value its investments into a disclosure hierarchy consisting of three levels as shown below:
Level 1 - quoted prices in active markets for identical investments
Level 2 - other significant observable inputs (including quoted prices for similar investments, interest rates, prepayment speeds, etc.)
Level 3 - unobservable inputs (including the Fund's own assumptions based on the best information available)
Valuation techniques used to value the Fund's investments by major category are as follows:
Equity securities, including restricted securities, for which market quotations are readily available, are valued at the last reported sale price or official closing price as reported by a third party pricing vendor on the primary market or exchange on which they are traded and are categorized as Level 1 in the hierarchy. In the event there were no sales during the day or closing prices are not available, securities are valued at the last quoted bid price or may be valued using the last available price and are generally categorized as Level 2 in the hierarchy. For foreign equity securities, when significant market or security specific events arise, comparisons to the valuation of American Depositary Receipts (ADRs), futures contracts, Exchange-Traded Funds (ETFs) and certain indexes as well as quoted prices for similar securities are used and are categorized as Level 2 in the hierarchy. Utilizing these techniques may result in transfers between Level 1 and Level 2.
Annual Report
3. Significant Accounting Policies - continued
Security Valuation - continued
Investments in open-end mutual funds, including the Fidelity Central Funds, are valued at their closing net asset value (NAV) each business day and are categorized as Level 1 in the hierarchy.
Changes in valuation techniques may result in transfers in or out of an assigned level within the disclosure hierarchy. The aggregate value of investments by input level, as of October 31, 2012, including information on transfers between Levels 1 and 2, is included at the end of the Fund's Schedule of Investments.
Foreign Currency Translation. The Fund may use foreign currency contracts to facilitate transactions in foreign-denominated securities. Gains and losses from these transactions may arise from changes in the value of the foreign currency or if the counterparties do not perform under the contracts' terms.
Foreign-denominated assets, including investment securities, and liabilities are translated into U.S. dollars at the exchange rates at period end. Purchases and sales of investment securities, income and dividends received and expenses denominated in foreign currencies are translated into U.S. dollars at the exchange rate in effect on the transaction date.
The effects of exchange rate fluctuations on investments are included with the net realized and unrealized gain (loss) on investment securities. Other foreign currency transactions resulting in realized and unrealized gain (loss) are disclosed separately.
Investment Transactions and Income. For financial reporting purposes, the Fund's investment holdings and NAV include trades executed through the end of the last business day of the period. The NAV per share for processing shareholder transactions is calculated as of the close of business of the New York Stock Exchange (NYSE), normally 4:00 p.m. Eastern time and includes trades executed through the end of the prior business day. Gains and losses on securities sold are determined on the basis of identified cost and may include proceeds received from litigation. Dividend income is recorded on the ex-dividend date, except for certain dividends from foreign securities where the ex-dividend date may have passed, which are recorded as soon as the Fund is informed of the ex-dividend date. Non-cash dividends included in dividend income, if any, are recorded at the fair market value of the securities received. Interest income and distributions from the Fidelity Central Funds are accrued as earned. Distributions received on securities that represent a return of capital or capital gain are recorded as a reduction of cost of investments and/or as a realized gain. The Fund estimates the components of distributions received that may be considered return of capital distributions or capital gain distributions. Interest income includes coupon interest and amortization of premium and accretion of discount on debt securities. Investment income is recorded net of foreign taxes withheld where recovery of such taxes is uncertain.
Expenses. Expenses directly attributable to a fund are charged to that fund. Expenses attributable to more than one fund are allocated among the respective funds on the basis of relative net assets or other appropriate methods. Expense estimates are accrued in the period to which they relate and adjustments are made when actual amounts are known.
Income Tax Information and Distributions to Shareholders. Each year, the Fund intends to qualify as a regulated investment company under Subchapter M of the Internal Revenue Code, including distributing substantially all of its taxable income and realized gains. As a result, no provision for income taxes is required. As of October 31, 2012, the Fund did not have any unrecognized tax benefits in the financial statements; nor is the Fund aware of any tax positions for which it is reasonably possible that the total amounts of unrecognized tax benefits will significantly change in the next twelve months. The Fund files a U.S. federal tax return, in addition to state and local tax returns as required. A fund's federal income tax returns are subject to examination by the Internal Revenue Service (IRS) for a period of three fiscal years after they are filed. State and local tax returns may be subject to examination for an additional fiscal year depending on the jurisdiction. Foreign taxes are provided for based on the Fund's understanding of the tax rules and rates that exist in the foreign markets in which it invests.
Distributions are declared and recorded on the ex-dividend date. Income dividends and capital gain distributions are declared separately for each class. Income and capital gain distributions are determined in accordance with income tax regulations, which may differ from GAAP. In addition, the Fund claimed a portion of the payment made to redeeming shareholders as a distribution for income tax purposes.
Capital accounts within the financial statements are adjusted for permanent book-tax differences. These adjustments have no impact on net assets or the results of operations. Temporary book-tax differences will reverse in a subsequent period.
Book-tax differences are primarily due to foreign currency transactions, passive foreign investment companies (PFIC), deferred trustees compensation, capital loss carryforwards and losses deferred due to wash sales.
Annual Report
Fidelity Worldwide Fund
Notes to Financial Statements - continued
3. Significant Accounting Policies - continued
Income Tax Information and Distributions to Shareholders - continued
The federal tax cost of investment securities and unrealized appreciation (depreciation) as of period end were as follows:
Gross unrealized appreciation | $ 122,955,424 |
Gross unrealized depreciation | (29,246,711) |
Net unrealized appreciation (depreciation) on securities and other investments | $ 93,708,713 |
| |
Tax Cost | $ 1,022,088,555 |
The tax-based components of distributable earnings as of period end were as follows:
Undistributed ordinary income | $ 8,068,312 |
Undistributed long-term capital gain | $ 3,746,668 |
Net unrealized appreciation (depreciation) | $ 93,636,040 |
The tax character of distributions paid was as follows:
| October 31, 2012 | October 31, 2011 |
Ordinary Income | $ 4,089,511 | $ 9,114,660 |
Short-Term Trading (Redemption) Fees. Shares held by investors in the Fund less than 30 days are subject to a redemption fee equal to 1.00% of the net asset value of shares redeemed. All redemption fees, which reduce the proceeds of the shareholder redemption, are retained by the Fund and accounted for as an addition to paid in capital.
New Accounting Pronouncement. In December 2011, the Financial Accounting Standards Board issued Accounting Standard Update No. 2011-11, Disclosures about Offsetting Assets and Liabilities. The update creates new disclosure requirements requiring entities to disclose both gross and net information for derivatives and other financial instruments that are either offset in the Statement of Assets and Liabilities or subject to an enforceable master netting arrangement or similar agreement. The disclosure requirements are effective for annual reporting periods beginning on or after January 1, 2013, and interim periods within those annual periods. Management is currently evaluating the impact of the update's adoption on the Fund's financial statement disclosures.
4. Purchases and Sales of Investments.
Purchases and sales of securities, other than short-term securities, aggregated $1,976,525,810 and $2,106,835,705, respectively.
5. Fees and Other Transactions with Affiliates.
Management Fee. FMR and its affiliates provide the Fund with investment management related services for which the Fund pays a monthly management fee. The management fee is the sum of an individual fund fee rate that is based on an annual rate of .45% of the Fund's average net assets and an annualized group fee rate that averaged .26% during the period. The group fee rate is based upon the average net assets of all the mutual funds advised by FMR. The group fee rate decreases as assets under management increase and increases as assets under management decrease. In addition, the management fee is subject to a performance adjustment (up to a maximum of ± .20% of the Fund's average net assets over a 36 month performance period). The upward or downward adjustment to the management fee is based on the relative investment performance of Worldwide as compared to an appropriate benchmark index. For the period, the total annual management fee rate, including the performance adjustment, was .80% of the Fund's average net assets.
Annual Report
5. Fees and Other Transactions with Affiliates - continued
Distribution and Service Plan Fees. In accordance with Rule 12b-1 of the 1940 Act, the Fund has adopted separate Distribution and Service Plans for each class of shares. Certain classes pay Fidelity Distributors Corporation (FDC), an affiliate of FMR, separate Distribution and Service Fees, each of which is based on an annual percentage of each class' average net assets. In addition, FDC may pay financial intermediaries for selling shares of the Fund and providing shareholder support services. For the period, the Distribution and Service Fee rates, total fees and amounts retained by FDC were as follows:
| Distribution
Fee | Service
Fee | Total Fees | Retained
by FDC |
Class A | -% | .25% | $ 37,612 | $ 2,060 |
Class T | .25% | .25% | 20,552 | 83 |
Class B | .75% | .25% | 2,828 | 2,126 |
Class C | .75% | .25% | 15,263 | 5,004 |
| | | $ 76,255 | $ 9,273 |
Sales Load. FDC may receive a front-end sales charge of up to 5.75% for selling Class A shares and 3.50% for selling Class T shares, some of which is paid to financial intermediaries for selling shares of the Fund. Depending on the holding period, FDC may receive contingent deferred sales charges levied on Class A, Class T, Class B and Class C redemptions. The deferred sales charges range from 5.00% to 1.00% for Class B shares, 1.00% for Class C shares, 1.00% for certain purchases of Class A shares and .25% for certain purchases of Class T shares.
For the period, sales charge amounts retained by FDC were as follows:
| Retained
by FDC |
Class A | $ 7,220 |
Class T | 1,258 |
Class B* | 616 |
Class C* | 1,466 |
| $ 10,560 |
* When Class B and Class C shares are initially sold, FDC pays commissions from its own resources to financial intermediaries through which the sales are made.
Transfer Agent Fees. Fidelity Investments Institutional Operations Company, Inc. (FIIOC), an affiliate of FMR, is the transfer, dividend disbursing and shareholder servicing agent for each class of the Fund. FIIOC receives account fees and asset-based fees that vary according to the account size and type of account of the shareholders of the respective classes of the Fund. FIIOC pays for typesetting, printing and mailing of shareholder reports, except proxy statements. For the period, transfer agent fees for each class were as follows:
| Amount | % of
Average
Net Assets |
Class A | $ 45,131 | .30 |
Class T | 12,753 | .31 |
Class B | 850 | .30 |
Class C | 4,641 | .30 |
Worldwide | 2,452,307 | .23 |
Institutional Class | 11,291 | .31 |
| $ 2,526,973 | |
Accounting and Security Lending Fees. Fidelity Service Company, Inc. (FSC), an affiliate of FMR, maintains the Fund's accounting records. The accounting fee is based on the level of average net assets for each month. Under a separate contract, FSC administers the security lending program. The security lending fee is based on the number and duration of lending transactions.
Brokerage Commissions. The Fund placed a portion of its portfolio transactions with brokerage firms which are affiliates of the investment adviser. The commissions paid to these affiliated firms were $46,686 for the period.
Annual Report
Fidelity Worldwide Fund
Notes to Financial Statements - continued
5. Fees and Other Transactions with Affiliates - continued
Interfund Lending Program. Pursuant to an Exemptive Order issued by the SEC, the Fund, along with other registered investment companies having management contracts with FMR, may participate in an interfund lending program. This program provides an alternative credit facility allowing the funds to borrow from, or lend money to, other participating affiliated funds. At period end, there were no interfund loans outstanding. The Fund's activity in this program during the period for which loans were outstanding was as follows:
Borrower or Lender | Average Loan
Balance | Weighted Average Interest Rate | Interest
Expense |
Borrower | $ 6,075,000 | .33% | $ 56 |
6. Committed Line of Credit.
The Fund participates with other funds managed by FMR or an affiliate in a $4.25 billion credit facility (the "line of credit") to be utilized for temporary or emergency purposes to fund shareholder redemptions or for other short-term liquidity purposes. The Fund has agreed to pay commitment fees on its pro-rata portion of the line of credit, which amounted to $2,986 and is reflected in Miscellaneous expenses on the Statement of Operations. During the period, there were no borrowings on this line of credit.
7. Security Lending.
The Fund lends portfolio securities through a lending agent from time to time in order to earn additional income. For equity securities, a lending agent is used and may loan securities to certain qualified borrowers, including Fidelity Capital Markets (FCM), a broker-dealer affiliated with the Fund. On the settlement date of the loan, the Fund receives collateral (in the form of U.S. Treasury obligations, letters of credit and/or cash) against the loaned securities and maintains collateral in an amount not less than 100% of the market value of the loaned securities during the period of the loan. The market value of the loaned securities is determined at the close of business of the Fund and any additional required collateral is delivered to the Fund on the next business day. If the borrower defaults on its obligation to return the securities loaned because of insolvency or other reasons, a fund could experience delays and costs in recovering the securities loaned or in gaining access to the collateral. Any cash collateral received is invested in the Fidelity Securities Lending Cash Central Fund. The value of loaned securities and cash collateral at period end are disclosed on the Fund's Statement of Assets and Liabilities. At period end, there were no security loans outstanding with FCM. Security lending income represents the income earned on investing cash collateral, less rebates paid to borrowers and any lending agent fees associated with the loan, plus any premium payments received for lending certain types of securities. Security lending income is presented in the Statement of Operations as a component of income from Fidelity Central Funds. Total security lending income during the period amounted to $279,543, including $261 from securities loaned to FCM.
8. Expense Reductions.
Many of the brokers with whom FMR places trades on behalf of the Fund provided services to the Fund in addition to trade execution. These services included payments of certain expenses on behalf of the Fund totaling $206,687 for the period.
9. Distributions to Shareholders.
Distributions to shareholders of each class were as follows:
Years ended October 31, | 2012 | 2011 |
From net investment income | | |
Class A | $ 16,598 | $ 36,687 |
Class T | - | 3,024 |
Class B | - | - |
Class C | - | - |
Worldwide | 4,059,519 | 6,199,611 |
Institutional Class | 13,394 | 4,819 |
Total | $ 4,089,511 | $ 6,244,141 |
From net realized gain | | |
Class A | $ - | $ 20,664 |
Class T | - | 3,280 |
Class B | - | - |
Class C | - | - |
Worldwide | - | 2,844,643 |
Institutional Class | - | 1,932 |
Total | $ - | $ 2,870,519 |
Annual Report
10. Share Transactions.
Transactions for each class of shares were as follows:
| Shares | Dollars |
Years ended October 31, | 2012 | 2011 | 2012 | 2011 |
Class A | | | | |
Shares sold | 433,206 | 446,295 | $ 8,109,308 | $ 8,440,354 |
Reinvestment of distributions | 720 | 2,409 | 12,524 | 44,007 |
Shares redeemed | (218,566) | (143,732) | (4,053,305) | (2,654,718) |
Net increase (decrease) | 215,360 | 304,972 | $ 4,068,527 | $ 5,829,643 |
Class T | | | | |
Shares sold | 202,603 | 307,740 | $ 3,780,147 | $ 5,853,479 |
Reinvestment of distributions | - | 344 | - | 6,293 |
Shares redeemed | (42,181) | (249,620) | (800,428) | (4,835,753) |
Net increase (decrease) | 160,422 | 58,464 | $ 2,979,719 | $ 1,024,019 |
Class B | | | | |
Shares sold | 4,060 | 3,768 | $ 73,532 | $ 71,519 |
Reinvestment of distributions | - | - | - | - |
Shares redeemed | (2,808) | (6,939) | (51,407) | (128,598) |
Net increase (decrease) | 1,252 | (3,171) | $ 22,125 | $ (57,079) |
Class C | | | | |
Shares sold | 38,075 | 41,472 | $ 696,495 | $ 784,669 |
Reinvestment of distributions | - | - | - | - |
Shares redeemed | (22,245) | (9,227) | (407,626) | (167,760) |
Net increase (decrease) | 15,830 | 32,245 | $ 288,869 | $ 616,909 |
Worldwide | | | | |
Shares sold | 8,155,382 | 12,255,493 | $ 150,136,706 | $ 231,984,939 |
Reinvestment of distributions | 226,349 | 480,262 | 3,956,581 | 8,805,760 |
Shares redeemed | (15,784,478) | (12,736,797) | (288,554,381) | (238,335,100) |
Net increase (decrease) | (7,402,747) | (1,042) | $ (134,461,094) | $ 2,455,599 |
Institutional Class | | | | |
Shares sold | 111,552 | 162,911 | $ 2,100,045 | $ 2,875,496 |
Reinvestment of distributions | 745 | 360 | 12,982 | 6,581 |
Shares redeemed | (67,062) | (10,647) | (1,264,501) | (193,044) |
Net increase (decrease) | 45,235 | 152,624 | $ 848,526 | $ 2,689,033 |
11. Other.
The Fund's organizational documents provide former and current trustees and officers with a limited indemnification against liabilities arising in connection with the performance of their duties to the Fund. In the normal course of business, the Fund may also enter into contracts that provide general indemnifications. The Fund's maximum exposure under these arrangements is unknown as this would be dependent on future claims that may be made against the Fund. The risk of material loss from such claims is considered remote.
Annual Report
Report of Independent Registered Public Accounting Firm
To the Trustees of Fidelity Investment Trust and Shareholders of Fidelity Worldwide Fund:
We have audited the accompanying statement of assets and liabilities of Fidelity Worldwide Fund (the Fund), a fund of Fidelity Investment Trust, including the schedule of investments, as of October 31, 2012, and the related statement of operations for the year then ended, the statement of changes in net assets for each of the two years in the period then ended, and the financial highlights for each of the five years in the period then ended. These financial statements and financial highlights are the responsibility of the Fund's management. Our responsibility is to express an opinion on these financial statements and financial highlights based on our audits.
We conducted our audits in accordance with the standards of the Public Company Accounting Oversight Board (United States). Those standards require that we plan and perform the audit to obtain reasonable assurance about whether the financial statements and financial highlights are free of material misstatement. The Fund is not required to have, nor were we engaged to perform, an audit of its internal control over financial reporting. Our audits included consideration of internal control over financial reporting as a basis for designing audit procedures that are appropriate in the circumstances, but not for the purpose of expressing an opinion on the effectiveness of the Fund's internal control over financial reporting. Accordingly, we express no such opinion. An audit also includes examining, on a test basis, evidence supporting the amounts and disclosures in the financial statements, assessing the accounting principles used and significant estimates made by management, as well as evaluating the overall financial statement presentation. Our procedures included confirmation of securities owned as of October 31, 2012, by correspondence with the custodians and brokers; where replies were not received from brokers, we performed other auditing procedures. We believe that our audits provide a reasonable basis for our opinion.
In our opinion, the financial statements and financial highlights referred to above present fairly, in all material respects, the financial position of Fidelity Worldwide Fund as of October 31, 2012, the results of its operations for the year then ended, the changes in its net assets for each of the two years in the period then ended, and the financial highlights for each of the five years in the period then ended, in conformity with accounting principles generally accepted in the United States of America.
DELOITTE & TOUCHE LLP
Boston, Massachusetts
December 14, 2012
Annual Report
The Trustees, Members of the Advisory Board, and executive officers of the trust and fund, as applicable, are listed below. The Board of Trustees governs the fund and is responsible for protecting the interests of shareholders. The Trustees are experienced executives who meet periodically throughout the year to oversee the fund's activities, review contractual arrangements with companies that provide services to the fund, oversee management of the risks associated with such activities and contractual arrangements, and review the fund's performance. Except for James C. Curvey, each of the Trustees oversees 236 funds advised by FMR or an affiliate. Mr. Curvey oversees 443 funds advised by FMR or an affiliate.
The Trustees hold office without limit in time except that (a) any Trustee may resign; (b) any Trustee may be removed by written instrument, signed by at least two-thirds of the number of Trustees prior to such removal; (c) any Trustee who requests to be retired or who has become incapacitated by illness or injury may be retired by written instrument signed by a majority of the other Trustees; and (d) any Trustee may be removed at any special meeting of shareholders by a two-thirds vote of the outstanding voting securities of the trust. Each Trustee who is not an interested person (as defined in the 1940 Act) (Independent Trustee), shall retire not later than the last day of the calendar year in which his or her 75th birthday occurs. The Independent Trustees may waive this mandatory retirement age policy with respect to individual Trustees. The executive officers and Advisory Board Members hold office without limit in time, except that any officer and Advisory Board Member may resign or may be removed by a vote of a majority of the Trustees at any regular meeting or any special meeting of the Trustees. Except as indicated, each individual has held the office shown or other offices in the same company for the past five years.
Experience, Skills, Attributes, and Qualifications of the Fund's Trustees. The Governance and Nominating Committee has adopted a statement of policy that describes the experience, qualifications, attributes, and skills that are necessary and desirable for potential Independent Trustee candidates (Statement of Policy). The Board believes that each Trustee satisfied at the time he or she was initially elected or appointed a Trustee, and continues to satisfy, the standards contemplated by the Statement of Policy. The Governance and Nominating Committee also engages professional search firms to help identify potential Independent Trustee candidates who have the experience, qualifications, attributes, and skills consistent with the Statement of Policy. From time to time, additional criteria based on the composition and skills of the current Independent Trustees, as well as experience or skills that may be appropriate in light of future changes to board composition, business conditions, and regulatory or other developments, have also been considered by the professional search firms and the Governance and Nominating Committee. In addition, the Board takes into account the Trustees' commitment and participation in Board and committee meetings, as well as their leadership of standing and ad hoc committees throughout their tenure.
In determining that a particular Trustee was and continues to be qualified to serve as a Trustee, the Board has considered a variety of criteria, none of which, in isolation, was controlling. The Board believes that, collectively, the Trustees have balanced and diverse experience, qualifications, attributes, and skills, which allow the Board to operate effectively in governing the fund and protecting the interests of shareholders. Information about the specific experience, skills, attributes, and qualifications of each Trustee, which in each case led to the Board's conclusion that the Trustee should serve (or continue to serve) as a trustee of the fund, is provided below.
Board Structure and Oversight Function. James C. Curvey is an interested person (as defined in the 1940 Act) and currently serves as Chairman. The Trustees have determined that an interested Chairman is appropriate and benefits shareholders because an interested Chairman has a personal and professional stake in the quality and continuity of services provided to the fund. Independent Trustees exercise their informed business judgment to appoint an individual of their choosing to serve as Chairman, regardless of whether the Trustee happens to be independent or a member of management. The Independent Trustees have determined that they can act independently and effectively without having an Independent Trustee serve as Chairman and that a key structural component for assuring that they are in a position to do so is for the Independent Trustees to constitute a substantial majority for the Board. The Independent Trustees also regularly meet in executive session. Ned C. Lautenbach serves as Chairman of the Independent Trustees and as such (i) acts as a liaison between the Independent Trustees and management with respect to matters important to the Independent Trustees and (ii) with management prepares agendas for Board meetings.
Fidelity funds are overseen by different Boards of Trustees. The fund's Board oversees Fidelity's equity and high income funds and another Board oversees Fidelity's investment-grade bond, money market, and asset allocation funds. The asset allocation funds may invest in Fidelity funds overseen by the fund's Board. The use of separate Boards, each with its own committee structure, allows the Trustees of each group of Fidelity funds to focus on the unique issues of the funds they oversee, including common research, investment, and operational issues. On occasion, the separate Boards establish joint committees to address issues of overlapping consequences for the Fidelity funds overseen by each Board.
The Trustees operate using a system of committees to facilitate the timely and efficient consideration of all matters of importance to the Trustees, the fund, and fund shareholders and to facilitate compliance with legal and regulatory requirements and oversight of the fund's activities and associated risks. The Board, acting through its committees, has charged FMR and its affiliates with (i) identifying events or circumstances the occurrence of which could have demonstrably adverse effects on the fund's business and/or reputation; (ii) implementing processes and controls to lessen the possibility that such events or circumstances occur or to mitigate the effects of such events or circumstances if they do occur; and (iii) creating and maintaining a system designed to evaluate continuously business and market conditions in order to facilitate the identification and implementation processes described in (i) and (ii) above. Because the day-to-day operations and activities of the fund are carried out by or through FMR, its affiliates and other service providers, the fund's exposure to risks is mitigated but not eliminated by the processes overseen by the Trustees. While each of the Board's committees has responsibility for overseeing different aspects of the fund's activities, oversight is exercised primarily through the Operations, Audit, and Compliance Committees. In addition, the Independent Trustees have worked with FMR to enhance the Board's oversight of investment and financial risks, legal and regulatory risks, technology risks, and operational risks, including the development of additional risk reporting to the Board. For example, a working group comprised of Independent Trustees and FMR has worked and continues to work to review the Fidelity funds' valuation-related activities, reporting and risk management. Appropriate personnel, including but not limited to the fund's Chief Compliance Officer (CCO), FMR's internal auditor, the independent accountants, the fund's Treasurer and portfolio management personnel, make periodic reports to the Board's committees, as appropriate, including an annual review of FMR's risk management program for the Fidelity funds. The responsibilities of each standing committee, including their oversight responsibilities, are described further under "Standing Committees of the Fund's Trustees."
Annual Report
The fund's Statement of Additional Information (SAI) includes more information about the Trustees. To request a free copy, call Fidelity at 1-877-208-0098.
Interested Trustees*:
Correspondence intended for each Trustee who is an interested person may be sent to Fidelity Investments, 82 Devonshire Street, Boston, Massachusetts 02109.
Name, Age; Principal Occupations and Other Relevant Experience+ |
James C. Curvey (77) |
| Year of Election or Appointment: 2007 Mr. Curvey is Trustee and Chairman of the Board of Trustees of certain Trusts. Mr. Curvey also serves as Trustee (2007-present) of other investment companies advised by FMR. Mr. Curvey is a Director of Fidelity Investments Money Management, Inc. (2009-present), Director of Fidelity Research & Analysis Co. (2009-present) and Director of FMR and FMR Co., Inc. (2007-present). Mr. Curvey is also Vice Chairman (2007-present) and Director of FMR LLC. In addition, Mr. Curvey serves as an Overseer for the Boston Symphony Orchestra and a member of the Trustees of Villanova University. Previously, Mr. Curvey was the Vice Chairman (2006-2007) and Director (2000-2007) of FMR Corp. |
Ronald P. O'Hanley (55) |
| Year of Election or Appointment: 2011 Mr. O'Hanley is Director of FMR Co., Inc. (2010-present), Director of Fidelity Investments Money Management, Inc. (2010-present), Director of Fidelity Research & Analysis Company (2010-present), President of Fidelity Asset Management and Corporate Services and a member of Fidelity's Executive Committee (2010-present). Previously, Mr. O'Hanley served as President and Chief Executive Officer of BNY Mellon Asset Management (2007-2010). Mr. O'Hanley also served as Vice Chairman of Bank New York Mellon Corp. and a member of that firm's Executive Committee. Prior to the 2007 merger of The Bank of New York and Mellon Financial Corporation, he was Vice Chairman of Mellon Financial Corporation and President and Chief Executive Officer of Mellon Asset Management. He joined Mellon in February 1997. Mr. O'Hanley currently serves as Chairman of the Boston Public Library Foundation Board of Directors and sits on the Board of Directors of Beth Israel Deaconess Medical Center, the Board of Trustees of the Marine Biological Laboratory and the Advisory Board of the Maxwell School of Citizenship and Public Administration at Syracuse University. Mr. O'Hanley also chairs the Council on Asset Management for the Financial Services Roundtable and is a member of the Board of Directors of Institutional Investor's U.S. Institute. |
* Trustees have been determined to be "Interested Trustees" by virtue of, among other things, their affiliation with the trust or various entities under common control with FMR.
+ The information above includes each Trustee's principal occupation during the last five years and other information relating to the experience, attributes, and skills relevant to each Trustee's qualifications to serve as a Trustee, which led to the conclusion that each Trustee should serve as a Trustee for the fund.
Independent Trustees:
Correspondence intended for each Independent Trustee (that is, the Trustees other than the Interested Trustees) may be sent to Fidelity Investments, P.O. Box 55235, Boston, Massachusetts 02205-5235.
Name, Age; Principal Occupations and Other Relevant Experience+ |
Dennis J. Dirks (64) |
| Year of Election or Appointment: 2005 Prior to his retirement in May 2003, Mr. Dirks was Chief Operating Officer and a member of the Board of The Depository Trust & Clearing Corporation (DTCC). He also served as President, Chief Operating Officer, and Board member of The Depository Trust Company (DTC) and President and Board member of the National Securities Clearing Corporation (NSCC). In addition, Mr. Dirks served as Chief Executive Officer and Board member of the Government Securities Clearing Corporation, Chief Executive Officer and Board member of the Mortgage-Backed Securities Clearing Corporation, as a Trustee and a member of the Finance Committee of Manhattan College (2005-2008), and as a Trustee and a member of the Finance Committee of AHRC of Nassau County (2006-2008). Mr. Dirks is a member of the Independent Directors Council (IDC) Governing Council (2010-present) and Board of Directors for The Brookville Center for Children's Services, Inc. (2009-present). |
Alan J. Lacy (59) |
| Year of Election or Appointment: 2008 Mr. Lacy serves as Senior Adviser (2007-present) of Oak Hill Capital Partners, L.P. (private equity). Mr. Lacy also served as Chief Executive Officer (2000-2005) and Vice Chairman (2005-2006) of Sears Holdings Corporation and Sears, Roebuck and Co. (retail). In addition, Mr. Lacy serves as a member of the Board of Directors of Dave & Buster's Entertainment, Inc. (restaurant and entertainment complexes, 2010-present), Earth Fare, Inc. (retail grocery, 2012-present), The Hillman Companies, Inc. (hardware wholesalers, 2010-present), and Bristol-Myers Squibb Company (global pharmaceuticals, 2008-present). Mr. Lacy is a member of the Board of Trustees of The National Parks Conservation Association (2006-present). Previously, Mr. Lacy served as Chairman of the Board of Trustees of the National Parks Conservation Association (2008-2011) and as a member of the Board of Directors for the Western Union Company (global money transfer, 2006-2011). |
Ned C. Lautenbach (68) |
| Year of Election or Appointment: 2000 Mr. Lautenbach is Chairman of the Independent Trustees of the Equity and High Income Funds (2006-present). Mr. Lautenbach currently serves as the Lead Director of the Eaton Corporation Board of Directors (diversified industrial, 1997-present). Mr. Lautenbach is Chairman of the Board of Directors of the Philharmonic Center for the Arts in Naples, Florida (2012-present) and a member of the Council on Foreign Relations (1994-present). Previously, Mr. Lautenbach was a Partner/Advisory Partner at Clayton, Dubilier & Rice, LLC (private equity investment, 1998-2010), as well as a Director of Sony Corporation (2006-2007). |
Joseph Mauriello (68) |
| Year of Election or Appointment: 2008 Prior to his retirement in January 2006, Mr. Mauriello served in numerous senior management positions including Deputy Chairman and Chief Operating Officer (2004-2005), and Vice Chairman of Financial Services (2002-2004) of KPMG LLP US (professional services, 1965-2005). Mr. Mauriello currently serves as a member of the Board of Directors of XL Group plc. (global insurance and re-insurance, 2006-present). Previously, Mr. Mauriello served as a Director of the Hamilton Funds of the Bank of New York (2006-2007) and of Arcadia Resources Inc. (health care services and products, 2007-2012). |
Robert W. Selander (62) |
| Year of Election or Appointment: 2011 Previously, Mr. Selander served as a Member of the Advisory Board of Fidelity's Equity and High Income Funds (2011), Executive Vice Chairman (2010), Chief Executive Officer (2009-2010), and President and Chief Executive Officer (1997-2009) of Mastercard, Inc. |
Cornelia M. Small (68) |
| Year of Election or Appointment: 2005 Ms. Small is a member of the Board of Directors (2009-present) and Chair of the Investment Committee (2010-present) of the Teagle Foundation. Ms. Small also serves on the Investment Committee of the Berkshire Taconic Community Foundation (2008-present). Previously, Ms. Small served as Chairperson (2002-2008) and a member of the Investment Committee and Chairperson (2008-2012) and a member of the Board of Trustees of Smith College. In addition, Ms. Small served as Chief Investment Officer, Director of Global Equity Investments, and a member of the Board of Directors of Scudder, Stevens & Clark and Scudder Kemper Investments. |
William S. Stavropoulos (73) |
| Year of Election or Appointment: 2001 Mr. Stavropoulos is Vice Chairman of the Independent Trustees of the Equity and High Income Funds (2006-present). Mr. Stavropoulos serves as President and Founder of the Michigan Baseball Foundation, the Great Lakes Loons (2007-present). Mr. Stavropoulos is Chairman Emeritus of the Board of Directors of The Dow Chemical Company, where he previously served in numerous senior management positions, including President, CEO (1995-2000; 2002-2004), Chairman of the Executive Committee (2000-2006), and as a member of the Board of Directors (1990-2006). Currently, Mr. Stavropoulos is a Director of Univar Inc. (global distributor of commodity and specialty chemicals, Chairman from 2010-May 2012 and Lead Director from May 2012-present), Teradata Corporation (data warehousing and technology solutions, 2008-present), Maersk Inc. (industrial conglomerate), and Tyco International, Ltd. (multinational manufacturing and services, 2007-present), and a member of the Advisory Board for Metalmark Capital LLC (private equity investment, 2005-present). Mr. Stavropoulos is an operating advisor to Clayton, Dubilier & Rice, LLC (private equity investment). In addition, Mr. Stavropoulos is a member of the University of Notre Dame Advisory Council for the College of Science, a Trustee of the Rollin L. Gerstacker Foundation, and a Director of the Naples Philharmonic Center for the Arts. Previously, Mr. Stavropoulos served as a Director of Chemical Financial Corporation (bank holding company, 1993-2012). |
David M. Thomas (63) |
| Year of Election or Appointment: 2008 Previously, Mr. Thomas served as Executive Chairman (2005-2006) and Chairman and Chief Executive Officer (2000-2005) of IMS Health, Inc. (pharmaceutical and healthcare information solutions), and a Director of Fortune Brands, Inc. (consumer products, 2000-2011). In addition, Mr. Thomas serves as Non-Executive Chairman of the Board of Directors of Fortune Brands Home and Security (home and security products, 2011-present), and as a member of the Board of Directors of Interpublic Group of Companies, Inc. (marketing communication, 2004-present). |
Michael E. Wiley (62) |
| Year of Election or Appointment: 2008 Mr. Wiley also serves as a Director of Asia Pacific Exploration Consolidated (international oil and gas exploration and production, 2008-present). Mr. Wiley serves as a Director of Tesoro Corporation (independent oil refiner and marketer, 2005-present), and a Director of Bill Barrett Corporation (exploration and production, 2005-present). In addition, Mr. Wiley also serves as a Director of Post Oak Bank (privately-held bank, 2004-present). Previously, Mr. Wiley served as a member of the Board of Trustees of the University of Tulsa (2000-2006; 2007-2010), as a Senior Energy Advisor of Katzenbach Partners, LLC (consulting, 2006-2007), as an Advisory Director of Riverstone Holdings (private investment), Chairman, President, and CEO of Baker Hughes, Inc. (oilfield services, 2000-2004), and as Director of Spinnaker Exploration Company (exploration and production, 2001-2005). |
+ The information above includes each Trustee's principal occupation during the last five years and other information relating to the experience, attributes, and skills relevant to each Trustee's qualifications to serve as a Trustee, which led to the conclusion that each Trustee should serve as a Trustee for the fund.
Advisory Board Members and Executive Officers:
Correspondence intended for David A. Rosow and Garnett A. Smith may be sent to Fidelity Investments, P.O. Box 55235, Boston, Massachusetts 02205-5235. Correspondence intended for each executive officer, Edward C. Johnson 3d, and Peter S. Lynch may be sent to Fidelity Investments, 82 Devonshire Street, Boston, Massachusetts 02109.
Name, Age; Principal Occupation |
Edward C. Johnson 3d (82) |
| Year of Election or Appointment: 2011 Member of the Advisory Board of Fidelity's Equity and High Income Funds. Mr. Johnson serves as Chief Executive Officer, Chairman, and a Director of FMR LLC, and also serves as Chairman and Director of FIL Limited. Previously, Mr. Johnson served as a Trustee and Chairman of the Board of certain Fidelity Trusts, Chairman and a Director of FMR, Chairman and a Director of FMR Co., Inc., and President of FMR LLC (2006-2007). |
Peter S. Lynch (68) |
| Year of Election or Appointment: 2003 Member of the Advisory Board of Fidelity's Equity and High Income Funds. Mr. Lynch is Vice Chairman and a Director of FMR and FMR Co., Inc. In addition, Mr. Lynch serves as a Trustee of Boston College and as the Chairman of the Inner-City Scholarship Fund. Previously, Mr. Lynch served on the Special Olympics International Board of Directors (1997-2006). |
David A. Rosow (70) |
| Year of Election or Appointment: 2012 Member of the Advisory Board of Fidelity's Equity and High Income Funds. Chairman and Chief Executive Officer of International Golf Group, Inc. (golf course development, 1989-present). Previously, Mr. Rosow served as Chairman and Chief Executive Officer of Rosow & Company, Inc. (private investment company, 1989-2011), a Lead Director of Hudson United Bancorp (2001-2006) and as a Director of TD Banknorth (1996-2006). In addition, Mr. Rosow is a member (2008-present) and President (2009-present) of the Town Council of Palm Beach, Florida. |
Garnett A. Smith (65) |
| Year of Election or Appointment: 2012 Member of the Advisory Board of Fidelity's Equity and High Income Funds. Prior to Mr. Smith's retirement, he served as Chairman and Chief Executive Officer of Inbrand Corp. (manufacturer of personal absorbent products, 1990-1997). He also served as President (1986-1990) of Inbrand Corp. Prior to his employment with Inbrand Corp., he was employed by a retail fabric chain and North Carolina National Bank. In addition, Mr. Smith is a board member of the Jackson Hole Land Trust (2009-present). |
Kenneth B. Robins (43) |
| Year of Election or Appointment: 2008 President and Treasurer of Fidelity's Equity and High Income Funds. Mr. Robins also serves as President and Treasurer (2010-present) and Assistant Treasurer (2009-present) of other Fidelity funds and is an employee of Fidelity Investments (2004-present). Previously, Mr. Robins served as Deputy Treasurer of the Fidelity funds (2005-2008) and Treasurer and Chief Financial Officer of The North Carolina Capital Management Trust: Cash and Term Portfolios (2006-2008). |
Bruce T. Herring (47) |
| Year of Election or Appointment: 2006 Vice President of certain Equity Funds. Mr. Herring also serves as President of Fidelity Research & Analysis Company (2010-present), Chief Investment Officer and Director of Fidelity Management & Research (U.K.) Inc. (2010-present) and Group Chief Investment Officer of FMR. Previously, Mr. Herring served as Vice President (2005-2006) and Senior Vice President (2006-2007) of Fidelity Management & Research Company, Vice President of FMR Co., Inc. (2001-2007) and as a portfolio manager for Fidelity U.S. Equity Funds. |
Brian B. Hogan (48) |
| Year of Election or Appointment: 2009 Vice President of Equity and High Income Funds. Mr. Hogan also serves as President of FMR's Equity Division (2009-present). Previously, Mr. Hogan served as Senior Vice President, Equity Research of FMR (2006-2009) and as a portfolio manager. |
Scott C. Goebel (44) |
| Year of Election or Appointment: 2008 Secretary and Chief Legal Officer (CLO) of the Fidelity funds. Mr. Goebel also serves as Secretary of Fidelity Investments Money Management, Inc. (FIMM) (2010-present) and Fidelity Research and Analysis Company (FRAC) (2010-present); Secretary and CLO of The North Carolina Capital Management Trust: Cash and Term Portfolios (2008-present); General Counsel, Secretary, and Senior Vice President of FMR (2008-present) and FMR Co., Inc. (2008-present); employed by FMR LLC or an affiliate (2001-present); Chief Legal Officer of Fidelity Management & Research (Hong Kong) Limited (2008-present) and Assistant Secretary of Fidelity Management & Research (Japan) Inc. (2008-present), and Fidelity Management & Research (U.K.) Inc. (2008-present). Previously, Mr. Goebel served as Assistant Secretary of FIMM (2008-2010), FRAC (2008-2010), and the Funds (2007-2008) and as Vice President and Secretary of Fidelity Distributors Corporation (FDC) (2005-2007). |
William C. Coffey (43) |
| Year of Election or Appointment: 2009 Assistant Secretary of Fidelity's Equity and High Income Funds. Mr. Coffey also serves as Senior Vice President and Deputy General Counsel of FMR LLC (2010-present), and is an employee of Fidelity Investments. Previously, Mr. Coffey served as Vice President and Associate General Counsel of FMR LLC (2005-2009). |
Elizabeth Paige Baumann (44) |
| Year of Election or Appointment: 2012 Anti-Money Laundering (AML) Officer of the Fidelity funds. Ms. Baumann also serves as AML Officer of The North Carolina Capital Management Trust: Cash and Term Portfolios (2012-present), Chief AML Officer of FMR LLC (2012-present), and is an employee of Fidelity Investments. Previously, Ms. Baumann served as Vice President and Deputy Anti-Money Laundering Officer (2007-2012). |
Christine Reynolds (54) |
| Year of Election or Appointment: 2008 Chief Financial Officer of the Fidelity funds. Ms. Reynolds became President of Fidelity Pricing and Cash Management Services (FPCMS) in August 2008. Ms. Reynolds served as Chief Operating Officer of FPCMS (2007-2008). Previously, Ms. Reynolds served as President, Treasurer, and Anti-Money Laundering officer of the Fidelity funds (2004-2007). |
Joseph A. Hanlon (44) |
| Year of Election or Appointment: 2012 Chief Compliance Officer of Fidelity's Equity and High Income Funds. Mr. Hanlon serves as Compliance Officer of FMR, FMR Co., Inc., Fidelity Investments Money Management, Inc. (FIMM), Fidelity Research and Analysis Company (FRAC), Fidelity Management & Research (Japan) Inc., Fidelity Management & Research (U.K.) Inc., Fidelity Management & Research (Hong Kong), and Strategic Advisers, Inc. (2009-present), as Senior Vice President of the Fidelity Asset Management Division (2009-present), and is an employee of Fidelity Investments. |
Joseph F. Zambello (55) |
| Year of Election or Appointment: 2011 Deputy Treasurer of the Fidelity funds. Mr. Zambello is an employee of Fidelity Investments. Previously, Mr. Zambello served as Vice President of FMR's Program Management Group (2009-2011) and Vice President of the Transfer Agent Oversight Group (2005-2009). |
Adrien E. Deberghes (45) |
| Year of Election or Appointment: 2008 Deputy Treasurer of Fidelity's Equity and High Income Funds. Mr. Deberghes also serves as Vice President (2011-present) and Assistant Treasurer (2010-present) of other Fidelity funds, and is an employee of Fidelity Investments (2008-present). Previously, Mr. Deberghes served as Senior Vice President of Mutual Fund Administration at State Street Corporation (2007-2008), Senior Director of Mutual Fund Administration at Investors Bank & Trust (2005-2007), and Director of Finance for Dunkin' Brands (2000-2005). |
Stephen Sadoski (41) |
| Year of Election or Appointment: 2012 Deputy Treasurer of Fidelity's Equity and High Income Funds. Mr. Sadoski also serves as Assistant Treasurer of other Fidelity funds (2012-present) and is an employee of Fidelity Investments (2012-present). Previously, Mr. Sadoski served as an assistant chief accountant in the Division of Investment Management of the Securities and Exchange Commission (SEC) (2009-2012) and as a senior manager at Deloitte & Touche (1997-2009). |
Stephanie J. Dorsey (43) |
| Year of Election or Appointment: 2010 Assistant Treasurer of Fidelity's Equity and High Income Funds. Ms. Dorsey also serves as Deputy Treasurer of other Fidelity funds (2008-present) and is an employee of Fidelity Investments (2008-present). Previously, Ms. Dorsey served as Treasurer (2004-2008) of the JPMorgan Mutual Funds and Vice President (2004-2008) of JPMorgan Chase Bank. |
John R. Hebble (54) |
| Year of Election or Appointment: 2009 Assistant Treasurer of Fidelity's Equity and High Income Funds. Mr. Hebble also serves as President (2011-present), Treasurer, and Chief Financial Officer of The North Carolina Capital Management Trust: Cash and Term Portfolios (2008-present), President and Treasurer of other Fidelity funds (2008-present) and is an employee of Fidelity Investments. |
Gary W. Ryan (54) |
| Year of Election or Appointment: 2005 Assistant Treasurer of the Fidelity funds. Mr. Ryan is an employee of Fidelity Investments. Previously, Mr. Ryan served as Vice President of Fund Reporting in Fidelity Pricing and Cash Management Services (FPCMS) (1999-2005). |
Jonathan Davis (44) |
| Year of Election or Appointment: 2010 Assistant Treasurer of the Fidelity funds. Mr. Davis is also Assistant Treasurer of Fidelity Rutland Square Trust II and Fidelity Commonwealth Trust II. Mr. Davis is an employee of Fidelity Investments. Previously, Mr. Davis served as Vice President and Associate General Counsel of FMR LLC (2003-2010). |
Annual Report
The Board of Trustees of Fidelity Worldwide voted to pay to shareholders of record at the opening of business on record date, the following distributions per share derived from capital gains realized from sales of portfolio securities, and dividends derived from net investment income:
| Pay Date | Record Date | Dividends | Capital Gains |
Class A | 12/10/12 | 12/07/12 | $0.109 | $0.08 |
Class T | 12/10/12 | 12/07/12 | $0.074 | $0.08 |
Class B | 12/10/12 | 12/07/12 | $0.000 | $0.07 |
Class C | 12/10/12 | 12/07/12 | $0.000 | $0.07 |
The fund hereby designates as a capital gain dividend with respect to the taxable year ended October 31 2012, $3,746,668, or, if subsequently determined to be different, the net capital gain of such year.
Class A designates 100% of the dividends distributed during the fiscal year as qualifying for the dividends-received deduction for corporate shareholders.
Class A designate 100% of the dividends distributed during the fiscal year as amounts which may be taken into account as a dividend for purposes of the maximum rate under section 1(h)(11) of the Internal Revenue Code.
The funds will notify shareholders in January 2013 of amounts for use in preparing 2012 income tax returns.
Annual Report
Board Approval of Investment Advisory Contracts and Management Fees
Fidelity Worldwide Fund
Each year, the Board of Trustees, including the Independent Trustees (together, the Board), votes on the renewal of the management contract and sub-advisory agreements (together, the Advisory Contracts) for the fund. The Board, assisted by the advice of fund counsel and Independent Trustees' counsel, requests and considers a broad range of information relevant to the renewal of the Advisory Contracts throughout the year.
The Board meets regularly and, at each of its meetings, considers factors that are relevant to its annual consideration of the renewal of the fund's Advisory Contracts, including the services and support provided to the fund and its shareholders. The Board has established various standing committees, each composed of and chaired by Independent Trustees with varying backgrounds, to which the Board has assigned specific subject matter responsibilities in order to enhance effective decision-making by the Board. The Board, acting directly and through its Committees, requests and receives information concerning the annual consideration of the renewal of the fund's Advisory Contracts. The Board also meets as needed to consider matters specifically related to the Board's annual consideration of the renewal of Advisory Contracts. Members of the Board may also meet with trustees of other Fidelity funds through ad hoc joint committees to discuss certain matters relevant to the Fidelity funds.
At its July 2012 meeting, the Board of Trustees, including the Independent Trustees, unanimously determined to renew the fund's Advisory Contracts. In reaching its determination, the Board considered all factors it believed relevant, including (i) the nature, extent, and quality of the services to be provided to the fund and its shareholders (including the investment performance of the fund); (ii) the competitiveness of the fund's management fee and total expense ratio relative to peer funds; (iii) the total costs of the services to be provided by and the profits to be realized by Fidelity from its relationship with the fund; (iv) the extent to which economies of scale exist and would be realized as the fund grows; and (v) whether fee levels reflect these economies of scale, if any, for the benefit of fund shareholders.
In considering whether to renew the Advisory Contracts for the fund, the Board reached a determination, with the assistance of fund counsel and Independent Trustees' counsel and through the exercise of its business judgment, that the renewal of the Advisory Contracts is in the best interests of the fund and its shareholders and that the compensation payable under the Advisory Contracts is fair and reasonable. The Board's decision to renew the Advisory Contracts was not based on any single factor, but rather was based on a comprehensive consideration of all the information provided to the Board at its meetings throughout the year. The Board, in reaching its determination to renew the Advisory Contracts, is aware that shareholders in the fund have a broad range of investment choices available to them, including a wide choice among mutual funds offered by Fidelity's competitors, and that the fund's shareholders, who have the opportunity to review and weigh the disclosure provided by the fund in its prospectus and other public disclosures, have chosen to invest in this fund, managed by Fidelity.
Nature, Extent, and Quality of Services Provided. The Board considered the staffing within the investment adviser, FMR, and the sub-advisers (together, the Investment Advisers), including the backgrounds of the fund's investment personnel, and also considered the fund's investment objective, strategies, and related investment philosophy. The Independent Trustees also had discussions with senior management of Fidelity's investment operations and investment groups. The Board considered the structure of the portfolio manager compensation program and whether this structure provides appropriate incentives to act in the best interests of the fund.
Resources Dedicated to Investment Management and Support Services. The Board and the Fund Oversight and Research Committees reviewed the general qualifications and capabilities of the Investment Advisers' investment staff, including its size, education, experience, and resources, as well as the Investment Advisers' approach to recruiting, training, managing, and compensating investment personnel. The Board also noted that FMR has continued to increase the resources devoted to non-U.S. offices, including expansion of Fidelity's global investment organization. The Board noted that Fidelity's analysts have extensive resources, tools and capabilities that allow them to conduct sophisticated quantitative and fundamental analysis, as well as credit analysis of issuers, counterparties and guarantors. The Board also believes that Fidelity's investment professionals have sufficient access to global information and data so as to provide competitive investment results over time, and that those professionals also have access to sophisticated tools that permit them to assess portfolio construction and risk and performance attribution characteristics continuously, as well as to transmit new information and research conclusions rapidly around the world. Additionally, in its deliberations, the Board considered the Investment Advisers' trading and risk management capabilities and resources, which are an integral part of the investment management process.
Shareholder and Administrative Services. The Board considered (i) the nature, extent, quality, and cost of advisory, administrative, and shareholder services performed by the Investment Advisers and their affiliates under the Advisory Contracts and under separate agreements covering transfer agency, pricing and bookkeeping, and securities lending services for the fund; (ii) the nature and extent of the supervision of third party service providers, principally custodians and subcustodians; and (iii) the resources devoted to, and the record of compliance with, the fund's compliance policies and procedures. The Board also reviewed the allocation of fund brokerage, including allocations to brokers affiliated with the Investment Advisers, the use of brokerage commissions to pay fund expenses, and the use of "soft" commission dollars to pay for research services.
The Board noted that the growth of fund assets over time across the complex allows Fidelity to reinvest in the development of services designed to enhance the value or convenience of the Fidelity funds as investment vehicles. These services include 24-hour access to account information and market information through telephone representatives and over the Internet, investor education materials and asset allocation tools, and the expanded availability of Fidelity Investor Centers.
Annual Report
Board Approval of Investment Advisory Contracts and Management Fees - continued
Investment in a Large Fund Family. The Board considered the benefits to shareholders of investing in a Fidelity fund, including the benefits of investing in a fund that is part of a large family of funds offering a variety of investment disciplines and providing a large variety of mutual fund investor services. The Board noted that Fidelity had taken, or had made recommendations that resulted in the Fidelity funds taking, a number of actions over the previous year that benefited particular funds, including (i) continuing to dedicate additional resources to investment research and support of the senior management team that oversees asset management; (ii) persisting in efforts to enhance Fidelity's research capabilities, in particular, international research; (iii) launching new funds and making other enhancements to meet client needs for global and income-oriented solutions; (iv) continuing to launch dedicated lower cost underlying funds to meet investment management's portfolio construction needs related to expanding underlying fund options, specifically for the Freedom Fund product lines; (v) adopting a "Stock Selector" sector neutral investment approach and employing a team of portfolio managers who are sector specialists to manage certain funds; (vi) rationalizing product lines and gaining increased efficiencies through the mergers of several funds into other funds; (vii) strengthening the Spartan Index Fund product line by adding new funds and/or new low-cost institutional share classes, restructuring fund expenses to accommodate new classes, and reducing investment minimums for certain classes of shares; (viii) modifying the eligibility criteria for Institutional Class shares to increase their appeal to government entities and charitable investors; and (ix) reducing certain transfer agent fee rates.
Investment Performance. The Board considered whether the fund has operated in accordance with its investment objective, as well as its record of compliance with its investment restrictions. It also reviewed the fund's absolute investment performance for each class, as well as the fund's relative investment performance for each class measured over multiple periods against (i) a broad-based securities market index, and (ii) a peer group of mutual funds deemed appropriate by Fidelity and reviewed by the Board. The following charts considered by the Board show, over the one-, three-, and five-year periods ended December 31, 2011, as available, the cumulative total returns of the retail class and Class C of the fund, the cumulative total returns of a broad-based securities market index ("benchmark"), and a range of cumulative total returns of a peer group of mutual funds identified by Morningstar, Inc. as having an investment style similar to that of the fund based on underlying portfolio holdings. The returns of the retail class and Class C show the performance of the highest performing class (based on five-year performance) and the lowest performing class (based on one-year performance), respectively. The box within each chart shows the 25th percentile return (top of box) and the 75th percentile return (bottom of box) of the peer group. Returns shown above the box are in the first quartile and returns shown below the box are in the fourth quartile. The percentage beaten numbers noted below each chart correspond to the percentile box and represent the percentage of funds in the peer group whose performance was equal to or lower than that of the class indicated.
Fidelity Worldwide Fund

The Board reviewed the fund's relative investment performance against its peer group and noted that the performance of the retail class of the fund was in the second quartile for the one- and three-year periods and the first quartile for the five-year period. The Board also noted that the investment performance of the retail class of the fund compared favorably to its benchmark for the three- and five-year periods, although the fund's one-year total return was lower than its benchmark. The Board considered that the variations in performance among the fund's classes reflect the variations in class expenses, which result in lower performance for higher expense classes. The Board also reviewed the fund's performance since inception as well as performance in the current year.
The Board also considered that the fund's management fee is subject to upward or downward adjustment depending upon whether, and to what extent, the fund's investment performance for the performance period exceeds, or is exceeded by, the record (over the same period) of a Board-approved performance adjustment index. The Board noted that the performance adjustment provides FMR with a strong economic incentive to seek to achieve superior performance for the fund's shareholders and helps to more closely align the interests of FMR and the fund's shareholders.
Annual Report
Based on its review, the Board concluded that the nature, extent, and quality of services provided to the fund under the Advisory Contracts should benefit the fund's shareholders.
Competitiveness of Management Fee and Total Expense Ratio. The Board considered the fund's management fee and total expense ratio compared to "mapped groups" of competitive funds and classes. Fidelity creates "mapped groups" by combining similar Lipper investment objective categories that have comparable management fee characteristics. Combining Lipper investment objective categories aids the Board's management fee and total expense ratio comparisons by broadening the competitive group used for comparison and by reducing the number of universes to which various Fidelity funds are compared.
Management Fee. The Board considered two proprietary management fee comparisons for the 12-month periods shown in the chart below. The group of Lipper funds used by the Board for management fee comparisons is referred to below as the "Total Mapped Group." The Total Mapped Group comparison focuses on a fund's standing relative to the total universe of comparable funds available to investors in terms of gross management fees before expense reimbursements or caps, and without giving effect to the fund's performance adjustment. "TMG %" represents the percentage of funds in the Total Mapped Group that had management fees that were lower than the fund's. For example, a TMG % of 17% means that 83% of the funds in the Total Mapped Group had higher management fees than the fund. The "Asset-Size Peer Group" (ASPG) comparison focuses on a fund's standing relative to non-Fidelity funds similar in size to the fund within the Total Mapped Group. The ASPG represents at least 15% of the funds in the Total Mapped Group with comparable asset size and management fee characteristics, subject to a minimum of 50 funds (or all funds in the Total Mapped Group if fewer than 50). Additional information, such as the ASPG quartile in which the fund's management fee ranked and the impact of the fund's performance adjustment, is also included in the chart and considered by the Board.
Fidelity Worldwide Fund

The Board noted that the fund's management fee ranked below the median of its Total Mapped Group and below the median of its ASPG for 2011. The Board also noted the effect of the fund's positive performance adjustment on the fund's management fee ranking. The Board noted that the performance adjustment for each year represents calculations for performance periods that differ from the periods shown in the performance charts above.
Based on its review, the Board concluded that the fund's management fee is fair and reasonable in light of the services that the fund receives and the other factors considered.
Total Expense Ratio. In its review of each class's total expense ratio, the Board considered the fund's management fee as well as other fund or class expenses, as applicable, such as transfer agent fees, pricing and bookkeeping fees, fund-paid 12b-1 fees, and custodial, legal, and audit fees. The Board also noted the effects of any waivers and reimbursements on fees and expenses, as well as the impact of the fund's performance adjustment. As part of its review, the Board also considered the current and historical total expense ratios of each class of the fund compared to competitive fund median expenses. Each class of the fund is compared to those funds and classes in the Total Mapped Group (used by the Board for management fee comparisons) that have a similar sales load structure.
Annual Report
Board Approval of Investment Advisory Contracts and Management Fees - continued
The Board noted that the total expense ratio of each of Class A, Class B, Class C, and the retail class of the fund ranked below its competitive median for 2011 and the total expense ratio of each of Class T and Institutional Class ranked above its competitive median for 2011. The Board considered that various factors, including 12b-1 fees, positive or negative performance adjustments, and relatively higher other expenses in the case of small fund size, can affect total expense ratios. The Board noted that the total expense ratio of Class T was above the competitive median primarily because of higher 12b-1 fees on Class T. Class T has a higher 12b-1 fee, but a lower front-end sales charge, than traditionally priced front-end sales charge classes. The Board considered that Class T is primarily sold load-waived in the retirement plan market where its 0.50% 12b-1 fee is comparable to competing no-load, higher 12b-1 fee classes designed specifically for retirement plans. The Board noted that the fund offers multiple classes, each of which has a different sales load and 12b-1 fee structure, and that the multiple structures are intended to offer a range of pricing options for the intermediary market. The Board also noted that the total expense ratios of the classes vary primarily by the level of their 12b-1 fees, although differences in transfer agent fees may also cause expenses to vary from class to class.
Fees Charged to Other Fidelity Clients. The Board also considered Fidelity fee structures and other information with respect to clients of FMR and its affiliates, such as other mutual funds advised or subadvised by FMR or its affiliates, pension plan clients, and other institutional clients. The Board noted the findings of the 2010 ad hoc joint committee (created with the board of other Fidelity funds), which reviewed and compared Fidelity's institutional investment advisory business with its business of providing services to the Fidelity funds, including the differences in services provided, fees charged, and costs incurred, as well as competition in their respective marketplaces.
Based on its review of total expense ratios and fees charged to other Fidelity clients, the Board concluded that the total expense ratio of each class of the fund was reasonable, although in some cases above the median of the universe presented for comparison, in light of the services that the fund and its shareholders receive and the other factors considered.
Costs of the Services and Profitability. The Board considered the revenues earned and the expenses incurred by Fidelity in conducting the business of developing, marketing, distributing, managing, administering and servicing the fund and its shareholders. The Board also considered the level of Fidelity's profits in respect of all the Fidelity funds.
On an annual basis, FMR presents to the Board Fidelity's profitability for the fund. Fidelity calculates the profitability for each fund, as well as aggregate profitability for groups of Fidelity funds and all Fidelity funds, using a series of detailed revenue and cost allocation methodologies which originate with the books and records of Fidelity on which Fidelity's audited financial statements are based. The Audit Committee of the Board reviews any significant changes from the prior year's methodologies.
PricewaterhouseCoopers LLP (PwC), independent registered public accounting firm and auditor to Fidelity and certain Fidelity funds, has been engaged annually by the Board as part of the Board's assessment of Fidelity's profitability analysis. PwC's engagement includes the review and assessment of Fidelity's methodologies used in determining the revenues and expenses attributable to Fidelity's mutual fund business, and completion of agreed-upon procedures surrounding the mathematical accuracy of fund profitability and its conformity to allocation methodologies. After considering PwC's reports issued under the engagement and information provided by Fidelity, the Board concluded that while other allocation methods may also be reasonable, Fidelity's profitability methodologies are reasonable in all material respects.
The Board also reviewed Fidelity's non-fund businesses and fall-out benefits related to the mutual fund business as well as cases where Fidelity's affiliates may benefit from or be related to the fund's business.
The Board considered the costs of the services provided by and the profits realized by Fidelity in connection with the operation of the fund and was satisfied that the profitability was not excessive in the circumstances.
Economies of Scale. The Board considered whether there have been economies of scale in respect of the management of the Fidelity funds, whether the Fidelity funds (including the fund) have appropriately benefited from any such economies of scale, and whether there is potential for realization of any further economies of scale. The Board considered the extent to which the fund will benefit from economies of scale through increased services to the fund, through waivers or reimbursements, or through fee or expense reductions. The Board also noted that in 2009, it and the board of other Fidelity funds created an ad hoc committee (the Economies of Scale Committee) to analyze whether FMR attains economies of scale in respect of the management and servicing of the Fidelity funds, whether the Fidelity funds have appropriately benefited from such economies of scale, and whether there is potential for realization of any further economies of scale.
The Board recognized that the fund's management contract incorporates a "group fee" structure, which provides for lower group fee rates as total fund assets under FMR's management increase, and for higher group fee rates as total fund assets under FMR's management decrease. FMR calculates the group fee rates based on a tiered asset "breakpoint" schedule that varies based on asset class. The Board considered that the group fee is designed to deliver the benefits of economies of scale to fund shareholders when total Fidelity fund assets increase, even if assets of any particular fund are unchanged or have declined, because some portion of Fidelity's costs are attributable to services provided to all Fidelity funds, and all funds benefit if those costs can be allocated among more assets. The Board concluded that, given the group fee structure, fund shareholders will benefit from lower management fees as assets under FMR's management increase at the fund complex level, regardless of whether Fidelity achieves any such economies of scale.
Annual Report
The Board concluded, taking into account the analysis of the Economies of Scale Committee, that economies of scale, if any, are being appropriately shared between fund shareholders and Fidelity.
Additional Information Requested by the Board. In order to develop fully the factual basis for consideration of the Fidelity funds' Advisory Contracts, the Board requested and received additional information on certain topics, including (i) fund performance trends, actions to be taken by FMR to improve certain funds' overall performance, and Fidelity's long-term strategies for certain funds; (ii) the potential to further rationalize the Fidelity fund lineup with the possibility of achieving savings for the funds and Fidelity; (iii) Fidelity's compensation structure for portfolio managers and other key investment personnel; (iv) the amount of the investment that each portfolio manager has made in the Fidelity fund(s) that he or she manages; (v) the realization of fall-out benefits in certain Fidelity business units; (vi) Fidelity's group fee structures, the potential impact of regulatory changes on such structures, and the rationale for the individual fee rates of certain funds; (vii) fund profitability methodology, including Fidelity's cost allocation methodology, and the impact of certain factors on fund profitability results; (viii) trends regarding industry use of performance fee structures and the possibility of implementing performance fee structures for additional funds; and (ix) the impact of net redemptions from the Fidelity funds.
Based on its evaluation of all of the conclusions noted above, and after considering all factors it believed relevant, the Board ultimately concluded that the advisory fee structures are fair and reasonable, and that the fund's Advisory Contracts should be renewed.
Annual Report
Investment Adviser
Fidelity Management & Research Company
Boston, MA
Investment Sub-Advisers
FMR Co., Inc.
Fidelity Management & Research
(U.K.) Inc.
FIL Investments (Japan) Limited
FIL Investment Advisors
FIL Investment Advisors
(UK) Limited
Fidelity Management & Research
(Hong Kong) Limited
Fidelity Management & Research
(Japan) Inc.
General Distributor
Fidelity Distributors Corporation
Smithfield, RI
Transfer and Service Agents
Fidelity Investments Institutional
Operations Company, Inc.
Boston, MA
Fidelity Service Company, Inc.
Boston, MA
Custodian
JPMorgan Chase Bank
New York, NY
(Fidelity Investment logo)(registered trademark)
Corporate Headquarters
82 Devonshire St., Boston, MA 02109
www.fidelity.com
AWLD-UANN-1212
1.883445.103
(Fidelity Investment logo)(registered trademark)
Fidelity Advisor®
Worldwide Fund
Institutional Class
Annual Report
October 31, 2012
(Fidelity Cover Art)
Institutional Class is a class of
Fidelity® Worldwide Fund
Contents
Performance | 3 | How the fund has done over time. |
Management's Discussion of Fund Performance | 4 | The Portfolio Manager's review of fund performance and strategy. |
Shareholder Expense Example | 5 | An example of shareholder expenses. |
Investment Changes | 6 | A summary of major shifts in the fund's investments over the past six months. |
Investments | 7 | A complete list of the fund's investments with their market values. |
Financial Statements | 12 | Statements of assets and liabilities, operations, and changes in net assets, as well as financial highlights. |
Notes | 17 | Notes to the financial statements. |
Report of Independent Registered Public Accounting Firm | 23 | |
Trustees and Officers | 24 | |
Distributions | 30 | |
Board Approval of Investment Advisory Contracts and Management Fees | 31 | |
To view a fund's proxy voting guidelines and proxy voting record for the 12-month period ended June 30, visit http://www.fidelity.com/proxyvotingresults or visit the Securities and Exchange Commission's (SEC) web site at http://www.sec.gov. You may also call 1-877-208-0098 to request a free copy of the proxy voting guidelines.
Standard & Poor's, S&P and S&P 500 are registered service marks of The McGraw-Hill Companies, Inc. and have been licensed for use by Fidelity Distributors Corporation.
Other third party marks appearing herein are the property of their respective owners.
All other marks appearing herein are registered or unregistered trademarks or service marks of FMR LLC or an affiliated company. © 2012 FMR LLC. All rights reserved.
This report and the financial statements contained herein are submitted for the general information of the shareholders of the fund. This report is not authorized for distribution to prospective investors in the fund unless preceded or accompanied by an effective prospectus.
A fund files its complete schedule of portfolio holdings with the SEC for the first and third quarters of each fiscal year on Form N-Q. Forms N-Q are available on the SEC's web site at http://www.sec.gov. A fund's Forms N-Q may be reviewed and copied at the SEC's Public Reference Room in Washington, DC. Information regarding the operation of the SEC's Public Reference Room may be obtained by calling 1-800-SEC-0330. For a complete list of a fund's portfolio holdings, view the most recent holdings listing, semiannual report, or annual report on Fidelity's web site at http://www.fidelity.com, http://www.advisor.fidelity.com, or http://www.401k.com, as applicable.
NOT FDIC INSURED • MAY LOSE VALUE • NO BANK GUARANTEE
Neither the fund nor Fidelity Distributors Corporation is a bank.
Annual Report
Performance: The Bottom Line
Average annual total return reflects the change in the value of an investment, assuming reinvestment of the class' distributions from dividend income and capital gains (the profits earned upon the sale of securities that have grown in value, if any) and assuming a constant rate of performance each year. The $10,000 table and the fund's returns do not reflect the deduction of taxes that a shareholder would pay on fund distributions or the redemption of fund shares. During periods of reimbursement by Fidelity, a fund's total return will be greater than it would be had the reimbursement not occurred. How a fund did yesterday is no guarantee of how it will do tomorrow.
Average Annual Total Returns
Periods ended October 31, 2012 | Past 1
year | Past 5
years | Past 10
years |
Institutional Class A | 10.49% | -1.93% | 8.93% |
A The initial offering of Institutional Class took place on February 19, 2009. Returns prior to February 19, 2009 are those of Fidelity® Worldwide Fund, the original class of the fund.
$10,000 Over 10 Years
Let's say hypothetically that $10,000 was invested in Fidelity Advisor® Worldwide Fund - Institutional Class, on October 31, 2002. The chart shows how the value of your investment would have changed, and also shows how the MSCI® World Index performed over the same period. The initial offering of Institutional Class took place on February 19, 2009. See above for additional information regarding the performance of Institutional Class.
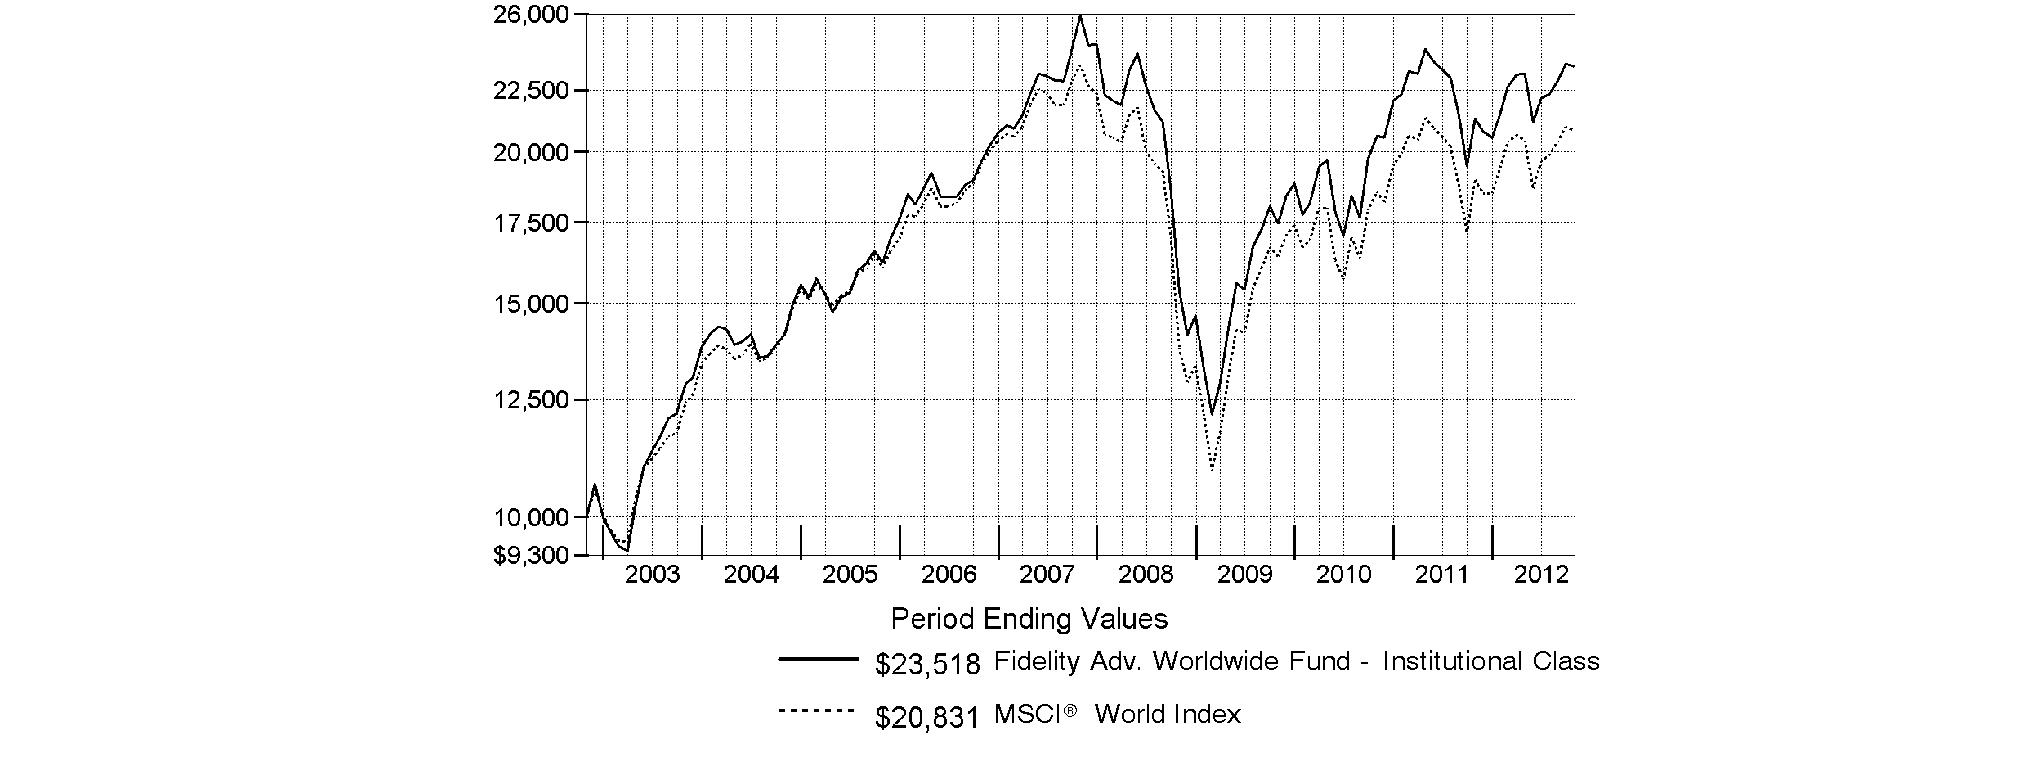
Annual Report
Management's Discussion of Fund Performance
Market Recap: Returns for most domestic and international equities fluctuated during the 12 months ending October 31, 2012, as investor sentiment towards risk vacillated amid a changing global economic landscape. U.S. stocks overcame bouts of volatility to post strong gains for the past year, extending an uptrend that began in March 2009. The broad-based S&P 500® Index advanced 15.21%, while the blue-chip-laden Dow Jones Industrial AverageSM and technology-heavy Nasdaq Composite® Index rose 12.56% and 12.21%, respectively. Performance outside of the U.S. was relatively weak, as the MSCI® ACWI® (All Country World Index) ex USA Index rose 4.11%, hampered in part by a stronger U.S. dollar. International developed-markets generally struggled during the period as macroeconomic concerns ebbed and flowed, finishing with only a modest gain. The MSCI® EAFE® Index rose 4.76% for the year, largely buttressed in the summertime by pledges of accommodative monetary action from eurozone officials, as well as signs that the U.S. housing market was on the mend. Within the index, Asia-Pacific ex Japan showed the most impressive gain, advancing roughly 10%. A number of core European components, including Germany (+11%) and Switzerland (+10%), and the U.K. (+9%), benefited from optimism about the eurozone's ability to resolve its debt woes, which helped the region outpace the index overall. Elsewhere, Japan was among the few benchmark constituents to finish in the red, returning about -3%. Emerging-markets stocks gained 2.98% for the year, as measured by the MSCI Emerging Markets Index. A general uptrend in the final five months of the period lifted the index into positive territory for the full 12 months.
Comments from William Kennedy, Lead Portfolio Manager of Fidelity Advisor® Worldwide Fund and manager of its non-U.S. equity subportfolio, and Co-Portfolio Manager Stephen DuFour, who manages the fund's U.S. equity subportfolio: For the year, the fund's Institutional Class shares returned 10.49%. By comparison, the MSCI® World Index returned 9.92%. Security selection, especially in information technology, helped relative performance, as did market weightings, notably in Europe ex U.K. Sector allocation and a small cash position modestly detracted. Individual contributors included card processor MasterCard, whose stock benefited from more people worldwide paying with plastic, and homebuilder PulteGroup, whose steep share price gains were driven by the U.S. housing recovery. Another standout was TJX Companies, whose stock climbed as more consumers tried to stretch their paychecks by shopping at stores such as T.J. Maxx. By contrast, our timing with discount retailer Wal-Mart Stores hurt, as the stock rose sharply - especially in May and June - when it was not in the portfolio. Elsewhere, the fund lost ground from investing in energy processing and pipeline company Keyera when its shares were pressured by the warm winter and low natural gas prices. Keyera was not in the MSCI index and not held at period end.
The views expressed above reflect those of the portfolio manager(s) only through the end of the period as stated on the cover of this report and do not necessarily represent the views of Fidelity or any other person in the Fidelity organization. Any such views are subject to change at any time based upon market or other conditions and Fidelity disclaims any responsibility to update such views. These views may not be relied on as investment advice and, because investment decisions for a Fidelity fund are based on numerous factors, may not be relied on as an indication of trading intent on behalf of any Fidelity fund.
Annual Report
Fidelity Worldwide Fund
Shareholder Expense Example
As a shareholder of the Fund, you incur two types of costs: (1) transaction costs, including sales charges (loads) on purchase payments or redemption proceeds, redemption fees and (2) ongoing costs, including management fees, distribution and/or service (12b-1) fees and other Fund expenses. This Example is intended to help you understand your ongoing costs (in dollars) of investing in the Fund and to compare these costs with the ongoing costs of investing in other mutual funds.
The Example is based on an investment of $1,000 invested at the beginning of the period and held for the entire period (May 1, 2012 to October 31, 2012).
Actual Expenses
The first line of the accompanying table for each class of the Fund provides information about actual account values and actual expenses. You may use the information in this line, together with the amount you invested, to estimate the expenses that you paid over the period. Simply divide your account value by $1,000.00 (for example, an $8,600 account value divided by $1,000.00 = 8.6), then multiply the result by the number in the first line for a class of the Fund under the heading entitled "Expenses Paid During Period" to estimate the expenses you paid on your account during this period. A small balance maintenance fee of $12.00 that is charged once a year may apply for certain accounts with a value of less than $2,000. This fee is not included in the table below. If it was, the estimate of expenses you paid during the period would be higher, and your ending account value lower, by this amount. In addition, the Fund, as a shareholder in the underlying Fidelity Central Funds, will indirectly bear its pro-rata share of the fees and expenses incurred by the underlying Fidelity Central Funds. These fees and expenses are not included in the Fund's annualized expense ratio used to calculate the expense estimate in the table below.
Hypothetical Example for Comparison Purposes
The second line of the accompanying table for each class of the Fund provides information about hypothetical account values and hypothetical expenses based on a Class' actual expense ratio and an assumed rate of return of 5% per year before expenses, which is not the Class' actual return. The hypothetical account values and expenses may not be used to estimate the actual ending account balance or expenses you paid for the period. You may use this information to compare the ongoing costs of investing in the Fund and other funds. To do so, compare this 5% hypothetical example with the 5% hypothetical examples that appear in the shareholder reports of the other funds. A small balance maintenance fee of $12.00 that is charged once a year may apply for certain accounts with a value of less than $2,000. This fee is not included in the table below. If it was, the estimate of expenses you paid during the period would be higher, and your ending account value lower, by this amount. In addition, the Fund, as a shareholder in the underlying Fidelity Central Funds, will indirectly bear its pro-rata share of the fees and expenses incurred by the underlying Fidelity Central Funds. These fees and expenses are not included in the Fund's annualized expense ratio used to calculate the expense estimate in the table below.
Please note that the expenses shown in the table are meant to highlight your ongoing costs only and do not reflect any transaction costs. Therefore, the second line of the table is useful in comparing ongoing costs only, and will not help you determine the relative total costs of owning different funds. In addition, if these transactional costs were included, your costs would have been higher.
| Annualized Expense Ratio | Beginning
Account Value
May 1, 2012 | Ending
Account Value
October 31, 2012 | Expenses Paid
During Period*
May 1, 2012 to October 31, 2012 |
Class A | 1.45% | | | |
Actual | | $ 1,000.00 | $ 1,011.80 | $ 7.33 |
HypotheticalA | | $ 1,000.00 | $ 1,017.85 | $ 7.35 |
Class T | 1.71% | | | |
Actual | | $ 1,000.00 | $ 1,010.80 | $ 8.64 |
HypotheticalA | | $ 1,000.00 | $ 1,016.54 | $ 8.67 |
Class B | 2.20% | | | |
Actual | | $ 1,000.00 | $ 1,008.30 | $ 11.11 |
HypotheticalA | | $ 1,000.00 | $ 1,014.08 | $ 11.14 |
Class C | 2.20% | | | |
Actual | | $ 1,000.00 | $ 1,008.30 | $ 11.11 |
HypotheticalA | | $ 1,000.00 | $ 1,014.08 | $ 11.14 |
Worldwide | 1.13% | | | |
Actual | | $ 1,000.00 | $ 1,013.30 | $ 5.72 |
HypotheticalA | | $ 1,000.00 | $ 1,019.46 | $ 5.74 |
Institutional Class | 1.20% | | | |
Actual | | $ 1,000.00 | $ 1,013.30 | $ 6.07 |
HypotheticalA | | $ 1,000.00 | $ 1,019.10 | $ 6.09 |
A 5% return per year before expenses
* Expenses are equal to each Class' annualized expense ratio, multiplied by the average account value over the period, multiplied by 184/366 (to reflect the one-half year period).
Annual Report
Fidelity Worldwide Fund
Investment Changes (Unaudited)
Geographic Diversification (% of fund's net assets) |
As of October 31, 2012 |
 | United States of America | 54.0% | |
 | United Kingdom | 10.0% | |
 | Japan | 7.4% | |
 | Germany | 4.0% | |
 | France | 3.8% | |
 | Switzerland | 3.1% | |
 | Netherlands | 1.4% | |
 | Australia | 1.4% | |
 | Canada | 1.4% | |
| Other | 13.5% | |

Percentages are based on country or territory of incorporation and are adjusted for the effect of futures contracts, if applicable. |
As of April 30, 2012 |
| United States of America | 53.8% | |
| United Kingdom | 10.4% | |
| Japan | 7.7% | |
| France | 2.9% | |
| Netherlands | 2.5% | |
| Germany | 2.5% | |
| Switzerland | 2.0% | |
| Korea (South) | 1.8% | |
| Ireland | 1.7% | |
| Other | 14.7% | |

Percentages are based on country or territory of incorporation and are adjusted for the effect of futures contracts, if applicable. |
Asset Allocation |
| % of fund's
net assets | % of fund's net assets
6 months ago |
Stocks and Investment Companies | 95.6 | 98.0 |
Short-Term Investments and Net Other Assets (Liabilities) | 4.4 | 2.0 |
Top Ten Stocks as of October 31, 2012 |
| % of fund's
net assets | % of fund's net assets
6 months ago |
MasterCard, Inc. Class A (United States of America, IT Services) | 3.1 | 3.0 |
Amgen, Inc. (United States of America, Biotechnology) | 1.8 | 0.6 |
American Tower Corp. (United States of America, Real Estate Investment Trusts) | 1.8 | 0.8 |
Pioneer Natural Resources Co. (United States of America, Oil, Gas & Consumable Fuels) | 1.7 | 1.5 |
Gilead Sciences, Inc. (United States of America, Biotechnology) | 1.6 | 0.3 |
General Electric Co. (United States of America, Industrial Conglomerates) | 1.6 | 0.0 |
Apple, Inc. (United States of America, Computers & Peripherals) | 1.5 | 1.7 |
Phillips 66 (United States of America, Oil, Gas & Consumable Fuels) | 1.5 | 0.0 |
Wal-Mart Stores, Inc. (United States of America, Food & Staples Retailing) | 1.5 | 0.0 |
eBay, Inc. (United States of America, Internet Software & Services) | 1.4 | 0.0 |
| 17.5 | |
Market Sectors as of October 31, 2012 |
| % of fund's
net assets | % of fund's net assets
6 months ago |
Financials | 20.2 | 15.9 |
Consumer Discretionary | 16.4 | 17.8 |
Information Technology | 12.2 | 19.9 |
Health Care | 11.6 | 7.8 |
Industrials | 11.3 | 10.8 |
Energy | 8.8 | 7.3 |
Consumer Staples | 7.8 | 10.3 |
Materials | 3.9 | 4.8 |
Telecommunication Services | 2.5 | 2.1 |
Utilities | 0.9 | 1.3 |
Annual Report
Fidelity Worldwide Fund
Investments October 31, 2012
Showing Percentage of Net Assets
Common Stocks - 95.0% |
| Shares | | Value |
Australia - 1.4% |
Australia & New Zealand Banking Group Ltd. | 290,317 | | $ 7,669,703 |
Commonwealth Bank of Australia | 59,860 | | 3,588,451 |
Ramsay Health Care Ltd. | 86,433 | | 2,131,789 |
Spark Infrastructure Group unit | 1,274,589 | | 2,236,017 |
TOTAL AUSTRALIA | | 15,625,960 |
Bailiwick of Jersey - 0.8% |
Experian PLC | 300,300 | | 5,185,318 |
Wolseley PLC | 95,060 | | 4,155,689 |
TOTAL BAILIWICK OF JERSEY | | 9,341,007 |
Belgium - 1.2% |
Anheuser-Busch InBev SA NV | 165,711 | | 13,858,603 |
Bermuda - 0.2% |
Cheung Kong Infrastructure Holdings Ltd. | 398,000 | | 2,331,495 |
Brazil - 0.6% |
Arezzo Industria e Comercio SA | 34,300 | | 612,183 |
Qualicorp SA (a) | 329,000 | | 3,375,771 |
Souza Cruz SA | 112,500 | | 1,467,837 |
Totvs SA | 68,100 | | 1,384,766 |
TOTAL BRAZIL | | 6,840,557 |
British Virgin Islands - 0.1% |
Gem Diamonds Ltd. (a) | 43,875 | | 119,481 |
Mail.ru Group Ltd. GDR (Reg. S) | 41,300 | | 1,377,355 |
TOTAL BRITISH VIRGIN ISLANDS | | 1,496,836 |
Canada - 1.4% |
Canadian Pacific | 113,000 | | 10,395,434 |
Catamaran Corp. (a) | 60,150 | | 2,824,566 |
Goldcorp, Inc. | 35,100 | | 1,586,748 |
InterOil Corp. (a) | 10,500 | | 677,040 |
TOTAL CANADA | | 15,483,788 |
Cayman Islands - 0.2% |
Eurasia Drilling Co. Ltd. GDR (Reg. S) | 27,100 | | 937,660 |
Sands China Ltd. | 277,200 | | 1,042,623 |
TOTAL CAYMAN ISLANDS | | 1,980,283 |
Denmark - 0.8% |
Novo Nordisk A/S Series B | 48,916 | | 7,841,994 |
William Demant Holding A/S (a) | 19,000 | | 1,634,132 |
TOTAL DENMARK | | 9,476,126 |
France - 3.8% |
Arkema SA | 20,430 | | 1,862,627 |
Atos Origin SA | 24,076 | | 1,616,788 |
AXA SA | 237,737 | | 3,779,372 |
BNP Paribas SA | 136,530 | | 6,867,948 |
Bureau Veritas SA | 32,900 | | 3,493,768 |
Credit Agricole SA (a) | 218,100 | | 1,641,865 |
|
| Shares | | Value |
Iliad SA | 20,580 | | $ 3,170,296 |
Lafarge SA (Bearer) | 28,700 | | 1,680,674 |
LVMH Moet Hennessy - Louis Vuitton SA | 21,299 | | 3,461,880 |
PPR SA | 23,950 | | 4,210,955 |
Sanofi SA | 57,258 | | 5,028,826 |
Schneider Electric SA | 74,000 | | 4,626,465 |
Technip SA | 11,800 | | 1,329,098 |
TOTAL FRANCE | | 42,770,562 |
Germany - 3.4% |
Aareal Bank AG (a) | 63,891 | | 1,370,544 |
Allianz AG | 23,424 | | 2,904,335 |
BASF AG | 60,232 | | 4,990,996 |
Bayerische Motoren Werke AG (BMW) | 58,087 | | 4,626,538 |
Brenntag AG | 17,900 | | 2,256,074 |
Fresenius Medical Care AG & Co. KGaA | 22,400 | | 1,573,920 |
Fresenius SE & Co. KGaA | 15,800 | | 1,802,167 |
GEA Group AG | 59,653 | | 1,862,620 |
Gerry Weber International AG (Bearer) | 19,400 | | 880,589 |
GSW Immobilien AG | 32,983 | | 1,357,128 |
HeidelbergCement Finance AG | 31,600 | | 1,674,787 |
MTU Aero Engines Holdings AG | 17,300 | | 1,452,588 |
SAP AG | 75,739 | | 5,523,119 |
Siemens AG | 27,761 | | 2,797,170 |
Wirecard AG | 97,400 | | 2,225,700 |
TOTAL GERMANY | | 37,298,275 |
Hong Kong - 0.9% |
AIA Group Ltd. | 931,000 | | 3,687,938 |
HKT Trust / HKT Ltd. unit | 1,451,000 | | 1,346,145 |
Techtronic Industries Co. Ltd. | 2,334,000 | | 4,445,112 |
TOTAL HONG KONG | | 9,479,195 |
India - 0.5% |
Apollo Hospitals Enterprise Ltd. | 25,151 | | 364,585 |
Housing Development Finance Corp. Ltd. | 205,593 | | 2,912,997 |
Titan Industries Ltd. | 374,259 | | 1,803,649 |
TOTAL INDIA | | 5,081,231 |
Indonesia - 0.3% |
PT Media Nusantara Citra Tbk | 2,557,500 | | 752,203 |
PT Sarana Menara Nusantara Tbk (a) | 371,000 | | 753,198 |
PT Tower Bersama Infrastructure Tbk (a) | 3,318,000 | | 1,727,218 |
TOTAL INDONESIA | | 3,232,619 |
Ireland - 1.3% |
Accenture PLC Class A | 88,000 | | 5,932,080 |
Alkermes PLC (a) | 84,000 | | 1,556,520 |
James Hardie Industries NV CDI | 365,087 | | 3,497,972 |
Paddy Power PLC (Ireland) | 29,700 | | 2,191,943 |
Trinity Biotech PLC sponsored ADR | 35,000 | | 494,900 |
XL Group PLC Class A | 25,000 | | 618,500 |
TOTAL IRELAND | | 14,291,915 |
Common Stocks - continued |
| Shares | | Value |
Israel - 0.2% |
Check Point Software Technologies Ltd. (a) | 44,700 | | $ 1,990,491 |
Italy - 1.3% |
ENI SpA | 175,500 | | 4,038,418 |
Fiat Industrial SpA | 193,937 | | 2,100,208 |
Prada SpA | 253,200 | | 2,064,792 |
Prysmian SpA | 95,200 | | 1,831,159 |
Saipem SpA | 90,615 | | 4,070,839 |
TOTAL ITALY | | 14,105,416 |
Japan - 7.4% |
ABC-Mart, Inc. | 70,200 | | 3,077,790 |
Aeon Credit Service Co. Ltd. | 128,500 | | 2,726,782 |
Aozora Bank Ltd. | 474,000 | | 1,335,964 |
Calbee, Inc. | 21,000 | | 1,928,222 |
Chiyoda Corp. | 171,000 | | 2,758,963 |
Cosmos Pharmaceutical Corp. | 22,900 | | 2,257,585 |
Credit Saison Co. Ltd. | 48,900 | | 1,073,803 |
Daito Trust Construction Co. Ltd. | 13,300 | | 1,342,829 |
Don Quijote Co. Ltd. | 109,500 | | 4,313,886 |
Fanuc Corp. | 17,600 | | 2,802,155 |
Fast Retailing Co. Ltd. | 12,900 | | 2,873,130 |
Hitachi Ltd. | 530,000 | | 2,808,343 |
Honda Motor Co. Ltd. | 95,300 | | 2,865,028 |
Japan Tobacco, Inc. | 167,600 | | 4,631,412 |
JS Group Corp. | 116,000 | | 2,564,700 |
JSR Corp. | 137,200 | | 2,351,116 |
Kakaku.com, Inc. | 54,300 | | 1,860,334 |
Keyence Corp. | 18,460 | | 4,897,693 |
Mitsubishi Estate Co. Ltd. | 163,000 | | 3,224,064 |
Mitsubishi UFJ Financial Group, Inc. | 910,900 | | 4,120,883 |
Nintendo Co. Ltd. | 12,500 | | 1,609,671 |
ORIX Corp. | 79,370 | | 8,152,750 |
Park24 Co. Ltd. | 83,900 | | 1,441,949 |
Rakuten, Inc. | 480,600 | | 4,322,570 |
Seven Bank Ltd. | 795,700 | | 2,272,574 |
Ship Healthcare Holdings, Inc. | 33,300 | | 1,110,834 |
So-net M3, Inc. | 330 | | 634,123 |
Softbank Corp. | 47,800 | | 1,513,098 |
Suzuki Motor Corp. | 86,200 | | 1,952,269 |
Unicharm Corp. | 38,600 | | 2,088,839 |
USS Co. Ltd. | 12,140 | | 1,275,894 |
TOTAL JAPAN | | 82,189,253 |
Korea (South) - 1.1% |
Hyundai Motor Co. | 16,534 | | 3,404,398 |
Kia Motors Corp. | 17,240 | | 958,199 |
LG Household & Health Care Ltd. | 3,511 | | 2,064,120 |
NHN Corp. | 3,893 | | 901,554 |
Orion Corp. | 742 | | 696,867 |
Samsung Electronics Co. Ltd. | 3,934 | | 4,726,631 |
TOTAL KOREA (SOUTH) | | 12,751,769 |
|
| Shares | | Value |
Luxembourg - 0.3% |
Brait SA | 360,653 | | $ 1,418,379 |
Samsonite International SA | 798,000 | | 1,657,770 |
TOTAL LUXEMBOURG | | 3,076,149 |
Netherlands - 1.4% |
AEGON NV | 292,700 | | 1,636,970 |
ASML Holding NV | 59,100 | | 3,248,727 |
Gemalto NV | 33,993 | | 3,067,459 |
ING Groep NV (Certificaten Van Aandelen) (a) | 309,500 | | 2,753,973 |
LyondellBasell Industries NV Class A | 29,000 | | 1,548,310 |
Randstad Holding NV | 42,858 | | 1,399,037 |
Yandex NV (a) | 98,600 | | 2,295,408 |
TOTAL NETHERLANDS | | 15,949,884 |
Norway - 0.5% |
DnB NOR ASA | 326,400 | | 4,076,207 |
Gjensidige Forsikring ASA | 109,900 | | 1,605,716 |
TOTAL NORWAY | | 5,681,923 |
Poland - 0.2% |
Eurocash SA | 215,900 | | 2,636,663 |
Qatar - 0.1% |
Commercial Bank of Qatar GDR (Reg. S) | 306,102 | | 1,208,956 |
Russia - 0.3% |
Mobile TeleSystems OJSC sponsored ADR | 178,700 | | 3,062,918 |
South Africa - 0.3% |
Distell Group Ltd. | 126,410 | | 1,399,591 |
Shoprite Holdings Ltd. | 95,600 | | 1,965,883 |
TOTAL SOUTH AFRICA | | 3,365,474 |
Spain - 1.1% |
Amadeus IT Holding SA Class A | 63,100 | | 1,562,133 |
Banco Bilbao Vizcaya Argentaria SA | 402,808 | | 3,365,846 |
Grifols SA ADR | 71,850 | | 1,807,746 |
Inditex SA | 39,477 | | 5,036,989 |
TOTAL SPAIN | | 11,772,714 |
Sweden - 1.1% |
Atlas Copco AB (A Shares) | 176,100 | | 4,330,219 |
Intrum Justitia AB | 115,000 | | 1,664,430 |
Svenska Handelsbanken AB (A Shares) | 115,600 | | 3,959,704 |
Swedish Match Co. AB | 78,000 | | 2,657,661 |
TOTAL SWEDEN | | 12,612,014 |
Switzerland - 3.1% |
ACE Ltd. | 48,000 | | 3,775,200 |
Adecco SA (Reg.) | 35,860 | | 1,734,279 |
Partners Group Holding AG | 13,818 | | 2,924,437 |
Roche Holding AG (participation certificate) | 23,638 | | 4,545,867 |
Common Stocks - continued |
| Shares | | Value |
Switzerland - continued |
Schindler Holding AG (participation certificate) | 33,294 | | $ 4,386,528 |
SGS SA (Reg.) | 780 | | 1,651,627 |
Swatch Group AG (Bearer) | 2,200 | | 910,426 |
Syngenta AG (Switzerland) | 5,030 | | 1,961,144 |
UBS AG | 248,020 | | 3,721,191 |
UBS AG (NY Shares) | 225,000 | | 3,379,500 |
Zurich Financial Services AG | 20,820 | | 5,130,667 |
TOTAL SWITZERLAND | | 34,120,866 |
Turkey - 0.1% |
Boyner Buyuk Magazacilik A/S (a) | 280,000 | | 643,570 |
United Kingdom - 10.0% |
Aberdeen Asset Management PLC | 355,842 | | 1,863,409 |
Aggreko PLC | 86,400 | | 2,997,702 |
Anglo American PLC (United Kingdom) | 45,018 | | 1,382,488 |
Ashmore Group PLC | 187,900 | | 1,102,824 |
Barclays PLC | 772,037 | | 2,854,788 |
Bellway PLC | 60,700 | | 990,321 |
BG Group PLC | 274,063 | | 5,075,039 |
BHP Billiton PLC | 272,542 | | 8,735,313 |
British American Tobacco PLC (United Kingdom) | 145,200 | | 7,201,863 |
British Land Co. PLC | 332,855 | | 2,838,810 |
Diageo PLC | 244,804 | | 6,998,587 |
Domino's Pizza UK & IRL PLC | 149,600 | | 1,220,363 |
GlaxoSmithKline PLC | 169,900 | | 3,807,028 |
Hikma Pharmaceuticals PLC | 121,783 | | 1,453,319 |
HSBC Holdings PLC (United Kingdom) | 715,328 | | 7,052,627 |
Intertek Group PLC | 46,500 | | 2,115,360 |
Jazztel PLC (a) | 353,900 | | 2,343,995 |
Legal & General Group PLC | 2,217,925 | | 4,796,096 |
Lloyds Banking Group PLC (a) | 2,942,200 | | 1,937,448 |
London Stock Exchange Group PLC | 93,500 | | 1,471,889 |
Meggitt PLC | 416,600 | | 2,595,033 |
Next PLC | 43,800 | | 2,520,529 |
Ocado Group PLC (a)(d) | 898,900 | | 935,637 |
Persimmon PLC | 145,600 | | 1,867,948 |
Rolls-Royce Group PLC | 271,600 | | 3,745,227 |
Rolls-Royce Group PLC Class C | 20,641,600 | | 33,310 |
Rotork PLC | 44,510 | | 1,636,242 |
Royal Dutch Shell PLC Class B (United Kingdom) | 371,647 | | 13,146,061 |
SABMiller PLC | 68,400 | | 2,930,050 |
Standard Chartered PLC (United Kingdom) | 106,579 | | 2,517,101 |
Taylor Wimpey PLC | 1,367,400 | | 1,348,258 |
The Weir Group PLC | 47,100 | | 1,324,053 |
Ultra Electronics Holdings PLC | 36,900 | | 1,008,137 |
Vodafone Group PLC | 2,244,100 | | 6,094,158 |
Vodafone Group PLC sponsored ADR | 47,212 | | 1,285,111 |
TOTAL UNITED KINGDOM | | 111,226,124 |
|
| Shares | | Value |
United States of America - 49.6% |
Abbott Laboratories | 147,000 | | $ 9,631,440 |
American International Group, Inc. (a) | 332,000 | | 11,596,760 |
American Tower Corp. | 259,000 | | 19,500,110 |
Amgen, Inc. | 234,000 | | 20,251,530 |
Apple, Inc. | 28,600 | | 17,019,860 |
Beam, Inc. | 54,900 | | 3,050,244 |
Berkshire Hathaway, Inc. Class B (a) | 109,000 | | 9,412,150 |
Cabela's, Inc. Class A (a) | 263,000 | | 11,785,030 |
Cabot Oil & Gas Corp. | 291,000 | | 13,671,180 |
Capital One Financial Corp. | 165,000 | | 9,928,050 |
Citigroup, Inc. | 336,000 | | 12,563,040 |
Citrix Systems, Inc. (a) | 18,209 | | 1,125,498 |
Clean Harbors, Inc. (a) | 13,000 | | 758,550 |
Cognizant Technology Solutions Corp. Class A (a) | 23,300 | | 1,552,945 |
Comcast Corp. Class A | 404,000 | | 15,154,040 |
Constellation Brands, Inc. Class A (sub. vtg.) (a) | 69,000 | | 2,438,460 |
Crown Castle International Corp. (a) | 44,000 | | 2,937,000 |
Discover Financial Services | 211,000 | | 8,651,000 |
Discovery Communications, Inc. (a) | 254,000 | | 14,991,080 |
DISH Network Corp. Class A | 45,000 | | 1,603,350 |
Dollar General Corp. (a) | 23,900 | | 1,162,018 |
Eastman Chemical Co. | 13,000 | | 770,120 |
eBay, Inc. (a) | 324,800 | | 15,684,592 |
Estee Lauder Companies, Inc. Class A | 89,700 | | 5,527,314 |
Facebook, Inc. Class A | 88,000 | | 1,858,120 |
Foot Locker, Inc. | 71,000 | | 2,378,500 |
Freeport-McMoRan Copper & Gold, Inc. | 108,000 | | 4,199,040 |
G-III Apparel Group Ltd. (a) | 68,000 | | 2,513,280 |
General Electric Co. | 832,800 | | 17,538,768 |
Georgia Gulf Corp. (d) | 35,200 | | 1,245,728 |
Gilead Sciences, Inc. (a) | 270,000 | | 18,133,200 |
GNC Holdings, Inc. | 159,000 | | 6,148,530 |
Home Depot, Inc. | 134,000 | | 8,224,920 |
International Paper Co. | 90,000 | | 3,224,700 |
J.B. Hunt Transport Services, Inc. | 164,600 | | 9,662,020 |
James River Coal Co. (a)(d) | 310,000 | | 1,553,100 |
Johnson & Johnson | 128,000 | | 9,064,960 |
Lumber Liquidators Holdings, Inc. (a) | 25,000 | | 1,395,500 |
M&T Bank Corp. | 80,000 | | 8,328,000 |
Marathon Petroleum Corp. | 66,000 | | 3,625,380 |
MasterCard, Inc. Class A | 74,400 | | 34,293,189 |
Medivation, Inc. (a) | 44,000 | | 2,249,280 |
Merck & Co., Inc. | 148,000 | | 6,753,240 |
Michael Kors Holdings Ltd. | 33,200 | | 1,815,708 |
Noble Energy, Inc. | 78,000 | | 7,410,780 |
Ocwen Financial Corp. (a) | 73,000 | | 2,815,610 |
Onyx Pharmaceuticals, Inc. (a) | 101,000 | | 7,914,360 |
Palo Alto Networks, Inc. | 3,300 | | 181,434 |
Peabody Energy Corp. | 224,000 | | 6,249,600 |
Pfizer, Inc. | 365,000 | | 9,077,550 |
Common Stocks - continued |
| Shares | | Value |
United States of America - continued |
Phillips 66 | 360,000 | | $ 16,977,600 |
Pioneer Natural Resources Co. | 183,900 | | 19,429,035 |
Prestige Brands Holdings, Inc. (a) | 304,000 | | 5,286,560 |
PulteGroup, Inc. (a) | 384,000 | | 6,658,560 |
PVH Corp. | 50,000 | | 5,499,500 |
Ralph Lauren Corp. | 9,000 | | 1,383,210 |
Realogy Holdings Corp. | 78,800 | | 2,800,552 |
Royal Gold, Inc. | 24,200 | | 2,131,536 |
salesforce.com, Inc. (a) | 77,000 | | 11,240,460 |
SBA Communications Corp. Class A (a) | 54,000 | | 3,598,020 |
Sempra Energy | 75,800 | | 5,287,050 |
Sirius XM Radio, Inc. (a) | 415,000 | | 1,162,000 |
The Cooper Companies, Inc. | 25,000 | | 2,399,500 |
The Travelers Companies, Inc. | 70,000 | | 4,965,800 |
TJX Companies, Inc. | 237,500 | | 9,887,125 |
Toll Brothers, Inc. (a) | 108,000 | | 3,565,080 |
Total System Services, Inc. | 67,900 | | 1,527,071 |
Under Armour, Inc. Class A (sub. vtg.) (a) | 67,200 | | 3,511,872 |
Union Pacific Corp. | 120,400 | | 14,812,812 |
United Rentals, Inc. (a) | 88,000 | | 3,578,080 |
Urban Outfitters, Inc. (a) | 63,000 | | 2,252,880 |
USG Corp. (a) | 61,000 | | 1,629,310 |
Visa, Inc. Class A | 36,000 | | 4,995,360 |
Wal-Mart Stores, Inc. | 215,000 | | 16,129,300 |
Watson Pharmaceuticals, Inc. (a) | 19,100 | | 1,641,645 |
Wells Fargo & Co. | 230,000 | | 7,748,700 |
Whirlpool Corp. | 16,000 | | 1,562,880 |
Workday, Inc. | 16,250 | | 788,125 |
TOTAL UNITED STATES OF AMERICA | | 551,069,481 |
TOTAL COMMON STOCKS (Cost $954,498,052) |
1,056,052,117
|
Nonconvertible Preferred Stocks - 0.6% |
| | | |
Germany - 0.6% |
Volkswagen AG
(Cost $4,272,812) | 28,900 | |
5,978,414
|
Investment Companies - 0.0% |
| Shares | | Value |
Cyprus - 0.0% |
Aisi Realty Public Ltd. (a)
(Cost $430,048) | 31,822 | | $ 37,744 |
Money Market Funds - 4.8% |
| | | |
Fidelity Cash Central Fund, 0.19% (b) | 51,411,090 | | 51,411,090 |
Fidelity Securities Lending Cash Central Fund, 0.19% (b)(c) | 2,317,903 | | 2,317,903 |
TOTAL MONEY MARKET FUNDS (Cost $53,728,993) |
53,728,993
|
TOTAL INVESTMENT PORTFOLIO - 100.4% (Cost $1,012,929,905) | 1,115,797,268 |
NET OTHER ASSETS (LIABILITIES) - (0.4)% | (3,962,689) |
NET ASSETS - 100% | $ 1,111,834,579 |
Legend |
(a) Non-income producing |
(b) Affiliated fund that is available only to investment companies and other accounts managed by Fidelity Investments. The rate quoted is the annualized seven-day yield of the fund at period end. A complete unaudited listing of the fund's holdings as of its most recent quarter end is available upon request. In addition, each Fidelity Central Fund's financial statements, which are not covered by the Fund's Report of Independent Registered Public Accounting Firm, are available on the SEC's website or upon request. |
(c) Investment made with cash collateral received from securities on loan. |
(d) Security or a portion of the security is on loan at period end. |
Affiliated Central Funds |
Information regarding fiscal year to date income earned by the Fund from investments in Fidelity Central Funds is as follows: |
Fund | Income earned |
Fidelity Cash Central Fund | $ 40,337 |
Fidelity Securities Lending Cash Central Fund | 279,543 |
Total | $ 319,880 |
Other Information |
Categorizations in the Schedule of Investments are based on country or territory of incorporation. |
The following is a summary of the inputs used, as of October 31, 2012, involving the Fund's assets and liabilities carried at fair value. The inputs or methodology used for valuing securities may not be an indication of the risk associated with investing in those securities. For more information on valuation inputs, and their aggregation into the levels used in the tables below, please refer to the Security Valuation section in the accompanying Notes to Financial Statements. |
Valuation Inputs at Reporting Date: |
Description | Total | Level 1 | Level 2 | Level 3 |
Investments in Securities: | | | | |
Equities: | | | | |
Consumer Discretionary | $ 176,900,919 | $ 174,035,891 | $ 2,865,028 | $ - |
Consumer Staples | 87,215,661 | 59,156,608 | 28,059,053 | - |
Energy | 98,190,830 | 81,006,351 | 17,184,479 | - |
Financials | 224,349,940 | 196,906,214 | 27,443,726 | - |
Health Care | 129,104,792 | 110,853,024 | 18,251,768 | - |
Industrials | 128,324,984 | 125,527,814 | 2,797,170 | - |
Information Technology | 137,294,906 | 131,771,787 | 5,523,119 | - |
Materials | 42,962,780 | 32,266,323 | 10,696,457 | - |
Telecommunication Services | 27,831,157 | 21,736,999 | 6,094,158 | - |
Utilities | 9,854,562 | 9,854,562 | - | - |
Investment Companies | 37,744 | 37,744 | - | - |
Money Market Funds | 53,728,993 | 53,728,993 | - | - |
Total Investments in Securities: | $ 1,115,797,268 | $ 996,882,310 | $ 118,914,958 | $ - |
The following is a summary of transfers between Level 1 and Level 2 for the period ended October 31, 2012. Transfers are assumed to have occurred at the beginning of the period, and are primarily attributable to the valuation techniques used for foreign equity securities, as discussed in the accompanying Notes to Financial Statements. |
Transfers | Total |
Level 1 to Level 2 | $ 0 |
Level 2 to Level 1 | $ 90,641,463 |
See accompanying notes which are an integral part of the financial statements.
Annual Report
Fidelity Worldwide Fund
Financial Statements
Statement of Assets and Liabilities
| October 31, 2012 |
| | |
Assets | | |
Investment in securities, at value (including securities loaned of $2,205,469) - See accompanying schedule: Unaffiliated issuers (cost $959,200,912) | $ 1,062,068,275 | |
Fidelity Central Funds (cost $53,728,993) | 53,728,993 | |
Total Investments (cost $1,012,929,905) | | $ 1,115,797,268 |
Foreign currency held at value (cost $44) | | 44 |
Receivable for investments sold | | 10,574,510 |
Receivable for fund shares sold | | 940,937 |
Dividends receivable | | 1,164,537 |
Distributions receivable from Fidelity Central Funds | | 22,934 |
Other receivables | | 304,491 |
Total assets | | 1,128,804,721 |
| | |
Liabilities | | |
Payable for investments purchased | $ 10,558,754 | |
Payable for fund shares redeemed | 2,935,923 | |
Accrued management fee | 817,065 | |
Distribution and service plan fees payable | 7,965 | |
Other affiliated payables | 252,086 | |
Other payables and accrued expenses | 80,446 | |
Collateral on securities loaned, at value | 2,317,903 | |
Total liabilities | | 16,970,142 |
| | |
Net Assets | | $ 1,111,834,579 |
Net Assets consist of: | | |
Paid in capital | | $ 1,006,383,968 |
Undistributed net investment income | | 7,478,979 |
Accumulated undistributed net realized gain (loss) on investments and foreign currency transactions | | (4,823,058) |
Net unrealized appreciation (depreciation) on investments and assets and liabilities in foreign currencies | | 102,794,690 |
Net Assets | | $ 1,111,834,579 |
Statement of Assets and Liabilities - continued
| October 31, 2012 |
| | |
Calculation of Maximum Offering Price Class A:
Net Asset Value and redemption price per share ($18,723,279 ÷ 950,719 shares) | | $ 19.69 |
| | |
Maximum offering price per share (100/94.25 of $19.69) | | $ 20.89 |
Class T:
Net Asset Value and redemption price per share ($5,550,095 ÷ 283,053 shares) | | $ 19.61 |
| | |
Maximum offering price per share (100/96.50 of $19.61) | | $ 20.32 |
Class B:
Net Asset Value and offering price per share ($303,960 ÷ 15,635 shares)A | | $ 19.44 |
| | |
Class C:
Net Asset Value and offering price per share ($1,726,205 ÷ 88,954 shares)A | | $ 19.41 |
| | |
Worldwide:
Net Asset Value, offering price and redemption price per share ($1,081,240,346 ÷ 54,468,873 shares) | | $ 19.85 |
| | |
Institutional Class:
Net Asset Value, offering price and redemption price per share ($4,290,694 ÷ 216,909 shares) | | $ 19.78 |
A Redemption price per share is equal to net asset value less any applicable contingent deferred sales charge.
See accompanying notes which are an integral part of the financial statements.
Annual Report
Fidelity Worldwide Fund
Financial Statements - continued
Statement of Operations
| Year ended October 31, 2012 |
Investment Income | | |
Dividends | | $ 21,411,923 |
Interest | | 1,045 |
Income from Fidelity Central Funds | | 319,880 |
Income before foreign taxes withheld | | 21,732,848 |
Less foreign taxes withheld | | (812,686) |
Total income | | 20,920,162 |
| | |
Expenses | | |
Management fee
Basic fee | $ 7,679,076 | |
Performance adjustment | 954,154 | |
Transfer agent fees | 2,526,973 | |
Distribution and service plan fees | 76,255 | |
Accounting and security lending fees | 503,914 | |
Custodian fees and expenses | 178,378 | |
Independent trustees' compensation | 7,299 | |
Registration fees | 91,889 | |
Audit | 78,615 | |
Legal | 6,059 | |
Interest | 56 | |
Miscellaneous | 12,139 | |
Total expenses before reductions | 12,114,807 | |
Expense reductions | (206,687) | 11,908,120 |
Net investment income (loss) | | 9,012,042 |
Realized and Unrealized Gain (Loss) Net realized gain (loss) on: | | |
Investment securities: | | |
Unaffiliated issuers | 52,952,242 | |
Foreign currency transactions | (72,889) | |
Total net realized gain (loss) | | 52,879,353 |
Change in net unrealized appreciation (depreciation) on: Investment securities | 45,677,356 | |
Assets and liabilities in foreign currencies | (88,023) | |
Total change in net unrealized appreciation (depreciation) | | 45,589,333 |
Net gain (loss) | | 98,468,686 |
Net increase (decrease) in net assets resulting from operations | | $ 107,480,728 |
Statement of Changes in Net Assets
| Year ended
October 31,
2012 | Year ended
October 31,
2011 |
Increase (Decrease) in Net Assets | | |
Operations | | |
Net investment income (loss) | $ 9,012,042 | $ 7,182,199 |
Net realized gain (loss) | 52,879,353 | 120,543,178 |
Change in net unrealized appreciation (depreciation) | 45,589,333 | (94,457,618) |
Net increase (decrease) in net assets resulting from operations | 107,480,728 | 33,267,759 |
Distributions to shareholders from net investment income | (4,089,511) | (6,244,141) |
Distributions to shareholders from net realized gain | - | (2,870,519) |
Total distributions | (4,089,511) | (9,114,660) |
Share transactions - net increase (decrease) | (126,253,328) | 12,558,124 |
Redemption fees | 23,898 | 33,448 |
Total increase (decrease) in net assets | (22,838,213) | 36,744,671 |
| | |
Net Assets | | |
Beginning of period | 1,134,672,792 | 1,097,928,121 |
End of period (including undistributed net investment income of $7,478,979 and undistributed net investment income of $2,700,979, respectively) | $ 1,111,834,579 | $ 1,134,672,792 |
See accompanying notes which are an integral part of the financial statements.
Annual Report
Financial Highlights - Class A
Years ended October 31, | 2012 | 2011 | 2010 | 2009 H |
Selected Per-Share Data | | | | |
Net asset value, beginning of period | $ 17.89 | $ 17.50 | $ 14.96 | $ 10.88 |
Income from Investment Operations | | | | |
Net investment income (loss) E | .10 | .05 | .03 | (.01) |
Net realized and unrealized gain (loss) | 1.72 | .47 | 2.63 | 4.09 |
Total from investment operations | 1.82 | .52 | 2.66 | 4.08 |
Distributions from net investment income | (.02) | (.08) | (.10) | - |
Distributions from net realized gain | - | (.05) | (.02) | - |
Total distributions | (.02) | (.13) | (.12) | - |
Redemption fees added to paid in capital E,J | - | - | - | - |
Net asset value, end of period | $ 19.69 | $ 17.89 | $ 17.50 | $ 14.96 |
Total Return B,C,D | 10.20% | 2.94% | 17.85% | 37.50% |
Ratios to Average Net Assets F,I | | | | |
Expenses before reductions | 1.43% | 1.41% | 1.43% | 1.52% A |
Expenses net of fee waivers, if any | 1.43% | 1.40% | 1.43% | 1.52% A |
Expenses net of all reductions | 1.41% | 1.38% | 1.41% | 1.49% A |
Net investment income (loss) | .52% | .28% | .21% | (.06)% A |
Supplemental Data | | | | |
Net assets, end of period (000 omitted) | $ 18,723 | $ 13,153 | $ 7,530 | $ 993 |
Portfolio turnover rate G | 186% | 203% | 166% | 224% |
A Annualized
B Total returns for periods of less than one year are not annualized.
C Total returns would have been lower if certain expenses had not been reduced during the applicable periods shown.
D Total returns do not include the effect of the sales charges.
E Calculated based on average shares outstanding during the period.
F Fees and expenses of any underlying Fidelity Central Funds are not included in the Fund's expense ratio. The Fund indirectly bears its proportionate share of the expenses of any underlying Fidelity Central Funds.
G Amount does not include the portfolio activity of any underlying Fidelity Central Funds.
H For the period February 19, 2009 (commencement of sale of shares) to October 31, 2009.
I Expense ratios reflect operating expenses of the class. Expenses before reductions do not reflect amounts reimbursed by the investment adviser or reductions from brokerage service arrangements or reductions from other expense offset arrangements and do not represent the amount paid by the class during periods when reimbursements or reductions occur. Expense ratios before reductions for start-up periods may not be representative of longer-term operating periods. Expenses net of fee waivers reflect expenses after reimbursement by the investment adviser but prior to reductions from brokerage service arrangements or other expense offset arrangements. Expenses net of all reductions represent the net expenses paid by the class.
J Amount represents less than $.01 per share.
Financial Highlights - Class T
Years ended October 31, | 2012 | 2011 | 2010 | 2009 H |
Selected Per-Share Data | | | | |
Net asset value, beginning of period | $ 17.83 | $ 17.46 | $ 14.94 | $ 10.88 |
Income from Investment Operations | | | | |
Net investment income (loss) E | .05 | .01 | (.01) | (.01) |
Net realized and unrealized gain (loss) | 1.73 | .45 | 2.62 | 4.07 |
Total from investment operations | 1.78 | .46 | 2.61 | 4.06 |
Distributions from net investment income | - | (.04) | (.08) | - |
Distributions from net realized gain | - | (.05) | (.02) | - |
Total distributions | - | (.09) | (.09) K | - |
Redemption fees added to paid in capital E,J | - | - | - | - |
Net asset value, end of period | $ 19.61 | $ 17.83 | $ 17.46 | $ 14.94 |
Total Return B,C,D | 9.98% | 2.61% | 17.53% | 37.32% |
Ratios to Average Net Assets F,I | | | | |
Expenses before reductions | 1.68% | 1.66% | 1.70% | 1.73% A |
Expenses net of fee waivers, if any | 1.68% | 1.65% | 1.70% | 1.73% A |
Expenses net of all reductions | 1.66% | 1.63% | 1.68% | 1.70% A |
Net investment income (loss) | .26% | .03% | (.05)% | (.08)% A |
Supplemental Data | | | | |
Net assets, end of period (000 omitted) | $ 5,550 | $ 2,187 | $ 1,120 | $ 458 |
Portfolio turnover rate G | 186% | 203% | 166% | 224% |
A Annualized
B Total returns for periods of less than one year are not annualized.
C Total returns would have been lower if certain expenses had not been reduced during the applicable periods shown.
D Total returns do not include the effect of the sales charges.
E Calculated based on average shares outstanding during the period.
F Fees and expenses of any underlying Fidelity Central Funds are not included in the Fund's expense ratio. The Fund indirectly bears its proportionate share of the expenses of any underlying Fidelity Central Funds.
G Amount does not include the portfolio activity of any underlying Fidelity Central Funds.
H For the period February 19, 2009 (commencement of sale of shares) to October 31, 2009.
I Expense ratios reflect operating expenses of the class. Expenses before reductions do not reflect amounts reimbursed by the investment adviser or reductions from brokerage service arrangements or reductions from other expense offset arrangements and do not represent the amount paid by the class during periods when reimbursements or reductions occur. Expense ratios before reductions for start-up periods may not be representative of longer-term operating periods. Expenses net of fee waivers reflect expenses after reimbursement by the investment adviser but prior to reductions from brokerage service arrangements or other expense offset arrangements. Expenses net of all reductions represent the net expenses paid by the class.
J Amount represents less than $.01 per share.
K Total distributions of $.09 per share is comprised of distributions from net investment income of $.075 and distributions from net realized gain of $.015 per share.
See accompanying notes which are an integral part of the financial statements.
Annual Report
Financial Highlights - Class B
Years ended October 31, | 2012 | 2011 | 2010 | 2009 H |
Selected Per-Share Data | | | | |
Net asset value, beginning of period | $ 17.77 | $ 17.39 | $ 14.89 | $ 10.88 |
Income from Investment Operations | | | | |
Net investment income (loss) E | (.04) | (.09) | (.09) | (.03) |
Net realized and unrealized gain (loss) | 1.71 | .47 | 2.61 | 4.04 |
Total from investment operations | 1.67 | .38 | 2.52 | 4.01 |
Distributions from net investment income | - | - | (.01) | - |
Distributions from net realized gain | - | - | (.01) | - |
Total distributions | - | - | (.02) | - |
Redemption fees added to paid in capital E,J | - | - | - | - |
Net asset value, end of period | $ 19.44 | $ 17.77 | $ 17.39 | $ 14.89 |
Total Return B,C,D | 9.40% | 2.19% | 16.92% | 36.86% |
Ratios to Average Net Assets F,I | | | | |
Expenses before reductions | 2.18% | 2.16% | 2.19% | 2.20% A |
Expenses net of fee waivers, if any | 2.18% | 2.16% | 2.19% | 2.20% A |
Expenses net of all reductions | 2.16% | 2.13% | 2.17% | 2.17% A |
Net investment income (loss) | (.23)% | (.47)% | (.55)% | (.30)% A |
Supplemental Data | | | | |
Net assets, end of period (000 omitted) | $ 304 | $ 256 | $ 305 | $ 224 |
Portfolio turnover rate G | 186% | 203% | 166% | 224% |
A Annualized
B Total returns for periods of less than one year are not annualized.
C Total returns would have been lower if certain expenses had not been reduced during the applicable periods shown.
D Total returns do not include the effect of the contingent deferred sales charge.
E Calculated based on average shares outstanding during the period.
F Fees and expenses of any underlying Fidelity Central Funds are not included in the Fund's expense ratio. The Fund indirectly bears its proportionate share of the expenses of any underlying Fidelity Central Funds.
G Amount does not include the portfolio activity of any underlying Fidelity Central Funds.
H For the period February 19, 2009 (commencement of sale of shares) to October 31, 2009.
I Expense ratios reflect operating expenses of the class. Expenses before reductions do not reflect amounts reimbursed by the investment adviser or reductions from brokerage service arrangements or reductions from other expense offset arrangements and do not represent the amount paid by the class during periods when reimbursements or reductions occur. Expense ratios before reductions for start-up periods may not be representative of longer-term operating periods. Expenses net of fee waivers reflect expenses after reimbursement by the investment adviser but prior to reductions from brokerage service arrangements or other expense offset arrangements. Expenses net of all reductions represent the net expenses paid by the class.
J Amount represents less than $.01 per share.
Financial Highlights - Class C
Years ended October 31, | 2012 | 2011 | 2010 | 2009 H |
Selected Per-Share Data | | | | |
Net asset value, beginning of period | $ 17.74 | $ 17.36 | $ 14.89 | $ 10.88 |
Income from Investment Operations | | | | |
Net investment income (loss) E | (.04) | (.09) | (.09) | (.04) |
Net realized and unrealized gain (loss) | 1.71 | .47 | 2.61 | 4.05 |
Total from investment operations | 1.67 | .38 | 2.52 | 4.01 |
Distributions from net investment income | - | - | (.03) | - |
Distributions from net realized gain | - | - | (.02) | - |
Total distributions | - | - | (.05) | - |
Redemption fees added to paid in capital E,J | - | - | - | - |
Net asset value, end of period | $ 19.41 | $ 17.74 | $ 17.36 | $ 14.89 |
Total Return B,C,D | 9.41% | 2.19% | 16.94% | 36.86% |
Ratios to Average Net Assets F,I | | | | |
Expenses before reductions | 2.18% | 2.16% | 2.19% | 2.18% A |
Expenses net of fee waivers, if any | 2.18% | 2.15% | 2.19% | 2.18% A |
Expenses net of all reductions | 2.16% | 2.13% | 2.16% | 2.15% A |
Net investment income (loss) | (.23)% | (.47)% | (.54)% | (.39)% A |
Supplemental Data | | | | |
Net assets, end of period (000 omitted) | $ 1,726 | $ 1,297 | $ 710 | $ 335 |
Portfolio turnover rate G | 186% | 203% | 166% | 224% |
A Annualized
B Total returns for periods of less than one year are not annualized.
C Total returns would have been lower if certain expenses had not been reduced during the applicable periods shown.
D Total returns do not include the effect of the contingent deferred sales charge.
E Calculated based on average shares outstanding during the period.
F Fees and expenses of any underlying Fidelity Central Funds are not included in the Fund's expense ratio. The Fund indirectly bears its proportionate share of the expenses of any underlying Fidelity Central Funds.
G Amount does not include the portfolio activity of any underlying Fidelity Central Funds.
H For the period February 19, 2009 (commencement of sale of shares) to October 31, 2009.
I Expense ratios reflect operating expenses of the class. Expenses before reductions do not reflect amounts reimbursed by the investment adviser or reductions from brokerage service arrangements or reductions from other expense offset arrangements and do not represent the amount paid by the class during periods when reimbursements or reductions occur. Expense ratios before reductions for start-up periods may not be representative of longer-term operating periods. Expenses net of fee waivers reflect expenses after reimbursement by the investment adviser but prior to reductions from brokerage service arrangements or other expense offset arrangements. Expenses net of all reductions represent the net expenses paid by the class.
J Amount represents less than $.01 per share.
See accompanying notes which are an integral part of the financial statements.
Annual Report
Financial Highlights - Worldwide
Years ended October 31, | 2012 | 2011 | 2010 | 2009 | 2008 |
Selected Per-Share Data | | | | | |
Net asset value, beginning of period | $ 18.02 | $ 17.58 | $ 14.98 | $ 13.40 | $ 25.18 |
Income from Investment Operations | | | | | |
Net investment income (loss) B | .16 | .11 | .08 | .12 | .16 |
Net realized and unrealized gain (loss) | 1.74 | .48 | 2.63 | 1.63 | (9.44) |
Total from investment operations | 1.90 | .59 | 2.71 | 1.75 | (9.28) |
Distributions from net investment income | (.07) | (.10) | (.10) | (.17) | (.12) |
Distributions from net realized gain | - | (.05) | (.02) | - | (2.38) |
Total distributions | (.07) | (.15) | (.11) G | (.17) | (2.50) |
Redemption fees added to paid in capital B,F | - | - | - | - | - |
Net asset value, end of period | $ 19.85 | $ 18.02 | $ 17.58 | $ 14.98 | $ 13.40 |
Total Return A | 10.56% | 3.32% | 18.18% | 13.39% | (40.66)% |
Ratios to Average Net Assets C,E | | | | | |
Expenses before reductions | 1.11% | 1.08% | 1.15% | 1.27% | 1.21% |
Expenses net of fee waivers, if any | 1.11% | 1.08% | 1.15% | 1.27% | 1.21% |
Expenses net of all reductions | 1.09% | 1.05% | 1.12% | 1.24% | 1.19% |
Net investment income (loss) | .84% | .60% | .50% | .92% | .84% |
Supplemental Data | | | | | |
Net assets, end of period (000 omitted) | $ 1,081,240 | $ 1,114,694 | $ 1,087,928 | $ 991,996 | $ 934,885 |
Portfolio turnover rate D | 186% | 203% | 166% | 224% | 264% |
A Total returns would have been lower if certain expenses had not been reduced during the applicable periods shown.
B Calculated based on average shares outstanding during the period.
C Fees and expenses of any underlying Fidelity Central Funds are not included in the Fund's expense ratio. The Fund indirectly bears its proportionate share of the expenses of any underlying Fidelity Central Funds.
D Amount does not include the portfolio activity of any underlying Fidelity Central Funds.
E Expense ratios reflect operating expenses of the class. Expenses before reductions do not reflect amounts reimbursed by the investment adviser or reductions from brokerage service arrangements or reductions from other expense offset arrangements and do not represent the amount paid by the class during periods when reimbursements or reductions occur. Expenses net of fee waivers reflect expenses after reimbursement by the investment adviser but prior to reductions from brokerage service arrangements or other expense offset arrangements. Expenses net of all reductions represent the net expenses paid by the class.
F Amount represents less than $.01 per share.
G Total distributions of $.11 per share is comprised of distributions from net investment income of $.097 and distributions from net realized gain of $.015 per share.
Financial Highlights - Institutional Class
Years ended October 31, | 2012 | 2011 | 2010 | 2009 G |
Selected Per-Share Data | | | | |
Net asset value, beginning of period | $ 17.98 | $ 17.57 | $ 15.00 | $ 10.88 |
Income from Investment Operations | | | | |
Net investment income (loss) D | .14 | .10 | .07 | .06 |
Net realized and unrealized gain (loss) | 1.74 | .47 | 2.63 | 4.06 |
Total from investment operations | 1.88 | .57 | 2.70 | 4.12 |
Distributions from net investment income | (.08) | (.11) | (.11) | - |
Distributions from net realized gain | - | (.05) | (.02) | - |
Total distributions | (.08) | (.16) | (.13) | - |
Redemption fees added to paid in capital D,I | - | - | - | - |
Net asset value, end of period | $ 19.78 | $ 17.98 | $ 17.57 | $ 15.00 |
Total Return B,C | 10.49% | 3.23% | 18.08% | 37.87% |
Ratios to Average Net Assets E,H | | | | |
Expenses before reductions | 1.18% | 1.13% | 1.21% | 1.17% A |
Expenses net of fee waivers, if any | 1.18% | 1.13% | 1.21% | 1.17% A |
Expenses net of all reductions | 1.16% | 1.10% | 1.19% | 1.15% A |
Net investment income (loss) | .77% | .56% | .44% | .62% A |
Supplemental Data | | | | |
Net assets, end of period (000 omitted) | $ 4,291 | $ 3,086 | $ 335 | $ 290 |
Portfolio turnover rate F | 186% | 203% | 166% | 224% |
A Annualized
B Total returns for periods of less than one year are not annualized.
C Total returns would have been lower if certain expenses had not been reduced during the applicable periods shown.
D Calculated based on average shares outstanding during the period.
E Fees and expenses of any underlying Fidelity Central Funds are not included in the Fund's expense ratio. The Fund indirectly bears its proportionate share of the expenses of any underlying Fidelity Central Funds.
F Amount does not include the portfolio activity of any underlying Fidelity Central Funds.
G For the period February 19, 2009 (commencement of sale of shares) to October 31, 2009.
H Expense ratios reflect operating expenses of the class. Expenses before reductions do not reflect amounts reimbursed by the investment adviser or reductions from brokerage service arrangements or reductions from other expense offset arrangements and do not represent the amount paid by the class during periods when reimbursements or reductions occur. Expense ratios before reductions for start-up periods may not be representative of longer-term operating periods. Expenses net of fee waivers reflect expenses after reimbursement by the investment adviser but prior to reductions from brokerage service arrangements or other expense offset arrangements. Expenses net of all reductions represent the net expenses paid by the class.
I Amount represents less than $.01 per share.
See accompanying notes which are an integral part of the financial statements.
Annual Report
Fidelity Worldwide Fund
Notes to Financial Statements
For the period ended October 31, 2012
1. Organization.
Fidelity Worldwide Fund (the Fund) is a fund of Fidelity Investment Trust (the Trust) and is authorized to issue an unlimited number of shares. The Trust is registered under the Investment Company Act of 1940, as amended (the 1940 Act), as an open-end management investment company organized as a Massachusetts business trust. The Fund offers Class A, Class T, Class C, Worldwide and Institutional Class shares, each of which, along with Class B shares, has equal rights as to assets and voting privileges. Effective after the close of business on September 1, 2010, Class B shares were closed to new accounts and additional purchases, except for exchanges and reinvestments. Each class has exclusive voting rights with respect to matters that affect that class. Class B shares will automatically convert to Class A shares after a holding period of seven years from the initial date of purchase. Investment income, realized and unrealized capital gains and losses, the common expenses of the Fund, and certain fund-level expense reductions, if any, are allocated on a pro-rata basis to each class based on the relative net assets of each class to the total net assets of the Fund. Each class differs with respect to transfer agent and distribution and service plan fees incurred. Certain expense reductions may also differ by class.
2. Investments in Fidelity Central Funds.
The Fund invests in Fidelity Central Funds, which are open-end investment companies available only to other investment companies and accounts managed by Fidelity Management & Research Company (FMR) and its affiliates. The Fund's Schedule of Investments lists each of the Fidelity Central Funds held as of period end, as an investment of the Fund, but does not include the underlying holdings of each Fidelity Central Fund. As an Investing Fund, the Fund indirectly bears its proportionate share of the expenses of the underlying Fidelity Central Funds.
The Money Market Central Funds seek preservation of capital and current income and are managed by Fidelity Investments Money Management, Inc. (FIMM), an affiliate of FMR.
A complete unaudited list of holdings for each Fidelity Central Fund is available upon request or at the Securities and Exchange Commission (the SEC) web site at www.sec.gov. In addition, the financial statements of the Fidelity Central Funds, which are not covered by the Fund's Report of Independent Registered Public Accounting Firm, are available on the SEC web site or upon request.
3. Significant Accounting Policies.
The financial statements have been prepared in conformity with accounting principles generally accepted in the United States of America (GAAP), which require management to make certain estimates and assumptions at the date of the financial statements. Actual results could differ from those estimates. Subsequent events, if any, through the date that the financial statements were issued have been evaluated in the preparation of the financial statements. The following summarizes the significant accounting policies of the Fund:
Security Valuation. Investments are valued as of 4:00 p.m. Eastern time on the last calendar day of the period. In accordance with valuation policies and procedures approved by the Board of Trustees (the Board), the Fund attempts to obtain prices from one or more third party pricing vendors or brokers to value its investments. When current market prices, quotations or rates are not readily available or reliable, securities will be fair valued in good faith by the FMR Fair Value Committee (the Committee), in accordance with procedures adopted by the Fund's Board. Factors used in determining fair value vary by security type and may include market or security specific events. The frequency with which these procedures are used cannot be predicted and they may be utilized to a significant extent. The Committee oversees the Fund's valuation policies and procedures and is responsible for approving and reporting to the Board all fair value determinations.
The Fund categorizes the inputs to valuation techniques used to value its investments into a disclosure hierarchy consisting of three levels as shown below:
Level 1 - quoted prices in active markets for identical investments
Level 2 - other significant observable inputs (including quoted prices for similar investments, interest rates, prepayment speeds, etc.)
Level 3 - unobservable inputs (including the Fund's own assumptions based on the best information available)
Valuation techniques used to value the Fund's investments by major category are as follows:
Equity securities, including restricted securities, for which market quotations are readily available, are valued at the last reported sale price or official closing price as reported by a third party pricing vendor on the primary market or exchange on which they are traded and are categorized as Level 1 in the hierarchy. In the event there were no sales during the day or closing prices are not available, securities are valued at the last quoted bid price or may be valued using the last available price and are generally categorized as Level 2 in the hierarchy. For foreign equity securities, when significant market or security specific events arise, comparisons to the valuation of American Depositary Receipts (ADRs), futures contracts, Exchange-Traded Funds (ETFs) and certain indexes as well as quoted prices for similar securities are used and are categorized as Level 2 in the hierarchy. Utilizing these techniques may result in transfers between Level 1 and Level 2.
Annual Report
3. Significant Accounting Policies - continued
Security Valuation - continued
Investments in open-end mutual funds, including the Fidelity Central Funds, are valued at their closing net asset value (NAV) each business day and are categorized as Level 1 in the hierarchy.
Changes in valuation techniques may result in transfers in or out of an assigned level within the disclosure hierarchy. The aggregate value of investments by input level, as of October 31, 2012, including information on transfers between Levels 1 and 2, is included at the end of the Fund's Schedule of Investments.
Foreign Currency Translation. The Fund may use foreign currency contracts to facilitate transactions in foreign-denominated securities. Gains and losses from these transactions may arise from changes in the value of the foreign currency or if the counterparties do not perform under the contracts' terms.
Foreign-denominated assets, including investment securities, and liabilities are translated into U.S. dollars at the exchange rates at period end. Purchases and sales of investment securities, income and dividends received and expenses denominated in foreign currencies are translated into U.S. dollars at the exchange rate in effect on the transaction date.
The effects of exchange rate fluctuations on investments are included with the net realized and unrealized gain (loss) on investment securities. Other foreign currency transactions resulting in realized and unrealized gain (loss) are disclosed separately.
Investment Transactions and Income. For financial reporting purposes, the Fund's investment holdings and NAV include trades executed through the end of the last business day of the period. The NAV per share for processing shareholder transactions is calculated as of the close of business of the New York Stock Exchange (NYSE), normally 4:00 p.m. Eastern time and includes trades executed through the end of the prior business day. Gains and losses on securities sold are determined on the basis of identified cost and may include proceeds received from litigation. Dividend income is recorded on the ex-dividend date, except for certain dividends from foreign securities where the ex-dividend date may have passed, which are recorded as soon as the Fund is informed of the ex-dividend date. Non-cash dividends included in dividend income, if any, are recorded at the fair market value of the securities received. Interest income and distributions from the Fidelity Central Funds are accrued as earned. Distributions received on securities that represent a return of capital or capital gain are recorded as a reduction of cost of investments and/or as a realized gain. The Fund estimates the components of distributions received that may be considered return of capital distributions or capital gain distributions. Interest income includes coupon interest and amortization of premium and accretion of discount on debt securities. Investment income is recorded net of foreign taxes withheld where recovery of such taxes is uncertain.
Expenses. Expenses directly attributable to a fund are charged to that fund. Expenses attributable to more than one fund are allocated among the respective funds on the basis of relative net assets or other appropriate methods. Expense estimates are accrued in the period to which they relate and adjustments are made when actual amounts are known.
Income Tax Information and Distributions to Shareholders. Each year, the Fund intends to qualify as a regulated investment company under Subchapter M of the Internal Revenue Code, including distributing substantially all of its taxable income and realized gains. As a result, no provision for income taxes is required. As of October 31, 2012, the Fund did not have any unrecognized tax benefits in the financial statements; nor is the Fund aware of any tax positions for which it is reasonably possible that the total amounts of unrecognized tax benefits will significantly change in the next twelve months. The Fund files a U.S. federal tax return, in addition to state and local tax returns as required. A fund's federal income tax returns are subject to examination by the Internal Revenue Service (IRS) for a period of three fiscal years after they are filed. State and local tax returns may be subject to examination for an additional fiscal year depending on the jurisdiction. Foreign taxes are provided for based on the Fund's understanding of the tax rules and rates that exist in the foreign markets in which it invests.
Distributions are declared and recorded on the ex-dividend date. Income dividends and capital gain distributions are declared separately for each class. Income and capital gain distributions are determined in accordance with income tax regulations, which may differ from GAAP. In addition, the Fund claimed a portion of the payment made to redeeming shareholders as a distribution for income tax purposes.
Capital accounts within the financial statements are adjusted for permanent book-tax differences. These adjustments have no impact on net assets or the results of operations. Temporary book-tax differences will reverse in a subsequent period.
Book-tax differences are primarily due to foreign currency transactions, passive foreign investment companies (PFIC), deferred trustees compensation, capital loss carryforwards and losses deferred due to wash sales.
Annual Report
Fidelity Worldwide Fund
Notes to Financial Statements - continued
3. Significant Accounting Policies - continued
Income Tax Information and Distributions to Shareholders - continued
The federal tax cost of investment securities and unrealized appreciation (depreciation) as of period end were as follows:
Gross unrealized appreciation | $ 122,955,424 |
Gross unrealized depreciation | (29,246,711) |
Net unrealized appreciation (depreciation) on securities and other investments | $ 93,708,713 |
| |
Tax Cost | $ 1,022,088,555 |
The tax-based components of distributable earnings as of period end were as follows:
Undistributed ordinary income | $ 8,068,312 |
Undistributed long-term capital gain | $ 3,746,668 |
Net unrealized appreciation (depreciation) | $ 93,636,040 |
The tax character of distributions paid was as follows:
| October 31, 2012 | October 31, 2011 |
Ordinary Income | $ 4,089,511 | $ 9,114,660 |
Short-Term Trading (Redemption) Fees. Shares held by investors in the Fund less than 30 days are subject to a redemption fee equal to 1.00% of the net asset value of shares redeemed. All redemption fees, which reduce the proceeds of the shareholder redemption, are retained by the Fund and accounted for as an addition to paid in capital.
New Accounting Pronouncement. In December 2011, the Financial Accounting Standards Board issued Accounting Standard Update No. 2011-11, Disclosures about Offsetting Assets and Liabilities. The update creates new disclosure requirements requiring entities to disclose both gross and net information for derivatives and other financial instruments that are either offset in the Statement of Assets and Liabilities or subject to an enforceable master netting arrangement or similar agreement. The disclosure requirements are effective for annual reporting periods beginning on or after January 1, 2013, and interim periods within those annual periods. Management is currently evaluating the impact of the update's adoption on the Fund's financial statement disclosures.
4. Purchases and Sales of Investments.
Purchases and sales of securities, other than short-term securities, aggregated $1,976,525,810 and $2,106,835,705, respectively.
5. Fees and Other Transactions with Affiliates.
Management Fee. FMR and its affiliates provide the Fund with investment management related services for which the Fund pays a monthly management fee. The management fee is the sum of an individual fund fee rate that is based on an annual rate of .45% of the Fund's average net assets and an annualized group fee rate that averaged .26% during the period. The group fee rate is based upon the average net assets of all the mutual funds advised by FMR. The group fee rate decreases as assets under management increase and increases as assets under management decrease. In addition, the management fee is subject to a performance adjustment (up to a maximum of ± .20% of the Fund's average net assets over a 36 month performance period). The upward or downward adjustment to the management fee is based on the relative investment performance of Worldwide as compared to an appropriate benchmark index. For the period, the total annual management fee rate, including the performance adjustment, was .80% of the Fund's average net assets.
Annual Report
5. Fees and Other Transactions with Affiliates - continued
Distribution and Service Plan Fees. In accordance with Rule 12b-1 of the 1940 Act, the Fund has adopted separate Distribution and Service Plans for each class of shares. Certain classes pay Fidelity Distributors Corporation (FDC), an affiliate of FMR, separate Distribution and Service Fees, each of which is based on an annual percentage of each class' average net assets. In addition, FDC may pay financial intermediaries for selling shares of the Fund and providing shareholder support services. For the period, the Distribution and Service Fee rates, total fees and amounts retained by FDC were as follows:
| Distribution
Fee | Service
Fee | Total Fees | Retained
by FDC |
Class A | -% | .25% | $ 37,612 | $ 2,060 |
Class T | .25% | .25% | 20,552 | 83 |
Class B | .75% | .25% | 2,828 | 2,126 |
Class C | .75% | .25% | 15,263 | 5,004 |
| | | $ 76,255 | $ 9,273 |
Sales Load. FDC may receive a front-end sales charge of up to 5.75% for selling Class A shares and 3.50% for selling Class T shares, some of which is paid to financial intermediaries for selling shares of the Fund. Depending on the holding period, FDC may receive contingent deferred sales charges levied on Class A, Class T, Class B and Class C redemptions. The deferred sales charges range from 5.00% to 1.00% for Class B shares, 1.00% for Class C shares, 1.00% for certain purchases of Class A shares and .25% for certain purchases of Class T shares.
For the period, sales charge amounts retained by FDC were as follows:
| Retained
by FDC |
Class A | $ 7,220 |
Class T | 1,258 |
Class B* | 616 |
Class C* | 1,466 |
| $ 10,560 |
* When Class B and Class C shares are initially sold, FDC pays commissions from its own resources to financial intermediaries through which the sales are made.
Transfer Agent Fees. Fidelity Investments Institutional Operations Company, Inc. (FIIOC), an affiliate of FMR, is the transfer, dividend disbursing and shareholder servicing agent for each class of the Fund. FIIOC receives account fees and asset-based fees that vary according to the account size and type of account of the shareholders of the respective classes of the Fund. FIIOC pays for typesetting, printing and mailing of shareholder reports, except proxy statements. For the period, transfer agent fees for each class were as follows:
| Amount | % of
Average
Net Assets |
Class A | $ 45,131 | .30 |
Class T | 12,753 | .31 |
Class B | 850 | .30 |
Class C | 4,641 | .30 |
Worldwide | 2,452,307 | .23 |
Institutional Class | 11,291 | .31 |
| $ 2,526,973 | |
Accounting and Security Lending Fees. Fidelity Service Company, Inc. (FSC), an affiliate of FMR, maintains the Fund's accounting records. The accounting fee is based on the level of average net assets for each month. Under a separate contract, FSC administers the security lending program. The security lending fee is based on the number and duration of lending transactions.
Brokerage Commissions. The Fund placed a portion of its portfolio transactions with brokerage firms which are affiliates of the investment adviser. The commissions paid to these affiliated firms were $46,686 for the period.
Annual Report
Fidelity Worldwide Fund
Notes to Financial Statements - continued
5. Fees and Other Transactions with Affiliates - continued
Interfund Lending Program. Pursuant to an Exemptive Order issued by the SEC, the Fund, along with other registered investment companies having management contracts with FMR, may participate in an interfund lending program. This program provides an alternative credit facility allowing the funds to borrow from, or lend money to, other participating affiliated funds. At period end, there were no interfund loans outstanding. The Fund's activity in this program during the period for which loans were outstanding was as follows:
Borrower or Lender | Average Loan
Balance | Weighted Average Interest Rate | Interest
Expense |
Borrower | $ 6,075,000 | .33% | $ 56 |
6. Committed Line of Credit.
The Fund participates with other funds managed by FMR or an affiliate in a $4.25 billion credit facility (the "line of credit") to be utilized for temporary or emergency purposes to fund shareholder redemptions or for other short-term liquidity purposes. The Fund has agreed to pay commitment fees on its pro-rata portion of the line of credit, which amounted to $2,986 and is reflected in Miscellaneous expenses on the Statement of Operations. During the period, there were no borrowings on this line of credit.
7. Security Lending.
The Fund lends portfolio securities through a lending agent from time to time in order to earn additional income. For equity securities, a lending agent is used and may loan securities to certain qualified borrowers, including Fidelity Capital Markets (FCM), a broker-dealer affiliated with the Fund. On the settlement date of the loan, the Fund receives collateral (in the form of U.S. Treasury obligations, letters of credit and/or cash) against the loaned securities and maintains collateral in an amount not less than 100% of the market value of the loaned securities during the period of the loan. The market value of the loaned securities is determined at the close of business of the Fund and any additional required collateral is delivered to the Fund on the next business day. If the borrower defaults on its obligation to return the securities loaned because of insolvency or other reasons, a fund could experience delays and costs in recovering the securities loaned or in gaining access to the collateral. Any cash collateral received is invested in the Fidelity Securities Lending Cash Central Fund. The value of loaned securities and cash collateral at period end are disclosed on the Fund's Statement of Assets and Liabilities. At period end, there were no security loans outstanding with FCM. Security lending income represents the income earned on investing cash collateral, less rebates paid to borrowers and any lending agent fees associated with the loan, plus any premium payments received for lending certain types of securities. Security lending income is presented in the Statement of Operations as a component of income from Fidelity Central Funds. Total security lending income during the period amounted to $279,543, including $261 from securities loaned to FCM.
8. Expense Reductions.
Many of the brokers with whom FMR places trades on behalf of the Fund provided services to the Fund in addition to trade execution. These services included payments of certain expenses on behalf of the Fund totaling $206,687 for the period.
9. Distributions to Shareholders.
Distributions to shareholders of each class were as follows:
Years ended October 31, | 2012 | 2011 |
From net investment income | | |
Class A | $ 16,598 | $ 36,687 |
Class T | - | 3,024 |
Class B | - | - |
Class C | - | - |
Worldwide | 4,059,519 | 6,199,611 |
Institutional Class | 13,394 | 4,819 |
Total | $ 4,089,511 | $ 6,244,141 |
From net realized gain | | |
Class A | $ - | $ 20,664 |
Class T | - | 3,280 |
Class B | - | - |
Class C | - | - |
Worldwide | - | 2,844,643 |
Institutional Class | - | 1,932 |
Total | $ - | $ 2,870,519 |
Annual Report
10. Share Transactions.
Transactions for each class of shares were as follows:
| Shares | Dollars |
Years ended October 31, | 2012 | 2011 | 2012 | 2011 |
Class A | | | | |
Shares sold | 433,206 | 446,295 | $ 8,109,308 | $ 8,440,354 |
Reinvestment of distributions | 720 | 2,409 | 12,524 | 44,007 |
Shares redeemed | (218,566) | (143,732) | (4,053,305) | (2,654,718) |
Net increase (decrease) | 215,360 | 304,972 | $ 4,068,527 | $ 5,829,643 |
Class T | | | | |
Shares sold | 202,603 | 307,740 | $ 3,780,147 | $ 5,853,479 |
Reinvestment of distributions | - | 344 | - | 6,293 |
Shares redeemed | (42,181) | (249,620) | (800,428) | (4,835,753) |
Net increase (decrease) | 160,422 | 58,464 | $ 2,979,719 | $ 1,024,019 |
Class B | | | | |
Shares sold | 4,060 | 3,768 | $ 73,532 | $ 71,519 |
Reinvestment of distributions | - | - | - | - |
Shares redeemed | (2,808) | (6,939) | (51,407) | (128,598) |
Net increase (decrease) | 1,252 | (3,171) | $ 22,125 | $ (57,079) |
Class C | | | | |
Shares sold | 38,075 | 41,472 | $ 696,495 | $ 784,669 |
Reinvestment of distributions | - | - | - | - |
Shares redeemed | (22,245) | (9,227) | (407,626) | (167,760) |
Net increase (decrease) | 15,830 | 32,245 | $ 288,869 | $ 616,909 |
Worldwide | | | | |
Shares sold | 8,155,382 | 12,255,493 | $ 150,136,706 | $ 231,984,939 |
Reinvestment of distributions | 226,349 | 480,262 | 3,956,581 | 8,805,760 |
Shares redeemed | (15,784,478) | (12,736,797) | (288,554,381) | (238,335,100) |
Net increase (decrease) | (7,402,747) | (1,042) | $ (134,461,094) | $ 2,455,599 |
Institutional Class | | | | |
Shares sold | 111,552 | 162,911 | $ 2,100,045 | $ 2,875,496 |
Reinvestment of distributions | 745 | 360 | 12,982 | 6,581 |
Shares redeemed | (67,062) | (10,647) | (1,264,501) | (193,044) |
Net increase (decrease) | 45,235 | 152,624 | $ 848,526 | $ 2,689,033 |
11. Other.
The Fund's organizational documents provide former and current trustees and officers with a limited indemnification against liabilities arising in connection with the performance of their duties to the Fund. In the normal course of business, the Fund may also enter into contracts that provide general indemnifications. The Fund's maximum exposure under these arrangements is unknown as this would be dependent on future claims that may be made against the Fund. The risk of material loss from such claims is considered remote.
Annual Report
Report of Independent Registered Public Accounting Firm
To the Trustees of Fidelity Investment Trust and Shareholders of Fidelity Worldwide Fund:
We have audited the accompanying statement of assets and liabilities of Fidelity Worldwide Fund (the Fund), a fund of Fidelity Investment Trust, including the schedule of investments, as of October 31, 2012, and the related statement of operations for the year then ended, the statement of changes in net assets for each of the two years in the period then ended, and the financial highlights for each of the five years in the period then ended. These financial statements and financial highlights are the responsibility of the Fund's management. Our responsibility is to express an opinion on these financial statements and financial highlights based on our audits.
We conducted our audits in accordance with the standards of the Public Company Accounting Oversight Board (United States). Those standards require that we plan and perform the audit to obtain reasonable assurance about whether the financial statements and financial highlights are free of material misstatement. The Fund is not required to have, nor were we engaged to perform, an audit of its internal control over financial reporting. Our audits included consideration of internal control over financial reporting as a basis for designing audit procedures that are appropriate in the circumstances, but not for the purpose of expressing an opinion on the effectiveness of the Fund's internal control over financial reporting. Accordingly, we express no such opinion. An audit also includes examining, on a test basis, evidence supporting the amounts and disclosures in the financial statements, assessing the accounting principles used and significant estimates made by management, as well as evaluating the overall financial statement presentation. Our procedures included confirmation of securities owned as of October 31, 2012, by correspondence with the custodians and brokers; where replies were not received from brokers, we performed other auditing procedures. We believe that our audits provide a reasonable basis for our opinion.
In our opinion, the financial statements and financial highlights referred to above present fairly, in all material respects, the financial position of Fidelity Worldwide Fund as of October 31, 2012, the results of its operations for the year then ended, the changes in its net assets for each of the two years in the period then ended, and the financial highlights for each of the five years in the period then ended, in conformity with accounting principles generally accepted in the United States of America.
DELOITTE & TOUCHE LLP
Boston, Massachusetts
December 14, 2012
Annual Report
Trustees and Officers
The Trustees, Members of the Advisory Board, and executive officers of the trust and fund, as applicable, are listed below. The Board of Trustees governs the fund and is responsible for protecting the interests of shareholders. The Trustees are experienced executives who meet periodically throughout the year to oversee the fund's activities, review contractual arrangements with companies that provide services to the fund, oversee management of the risks associated with such activities and contractual arrangements, and review the fund's performance. Except for James C. Curvey, each of the Trustees oversees 236 funds advised by FMR or an affiliate. Mr. Curvey oversees 443 funds advised by FMR or an affiliate.
The Trustees hold office without limit in time except that (a) any Trustee may resign; (b) any Trustee may be removed by written instrument, signed by at least two-thirds of the number of Trustees prior to such removal; (c) any Trustee who requests to be retired or who has become incapacitated by illness or injury may be retired by written instrument signed by a majority of the other Trustees; and (d) any Trustee may be removed at any special meeting of shareholders by a two-thirds vote of the outstanding voting securities of the trust. Each Trustee who is not an interested person (as defined in the 1940 Act) (Independent Trustee), shall retire not later than the last day of the calendar year in which his or her 75th birthday occurs. The Independent Trustees may waive this mandatory retirement age policy with respect to individual Trustees. The executive officers and Advisory Board Members hold office without limit in time, except that any officer and Advisory Board Member may resign or may be removed by a vote of a majority of the Trustees at any regular meeting or any special meeting of the Trustees. Except as indicated, each individual has held the office shown or other offices in the same company for the past five years.
Experience, Skills, Attributes, and Qualifications of the Fund's Trustees. The Governance and Nominating Committee has adopted a statement of policy that describes the experience, qualifications, attributes, and skills that are necessary and desirable for potential Independent Trustee candidates (Statement of Policy). The Board believes that each Trustee satisfied at the time he or she was initially elected or appointed a Trustee, and continues to satisfy, the standards contemplated by the Statement of Policy. The Governance and Nominating Committee also engages professional search firms to help identify potential Independent Trustee candidates who have the experience, qualifications, attributes, and skills consistent with the Statement of Policy. From time to time, additional criteria based on the composition and skills of the current Independent Trustees, as well as experience or skills that may be appropriate in light of future changes to board composition, business conditions, and regulatory or other developments, have also been considered by the professional search firms and the Governance and Nominating Committee. In addition, the Board takes into account the Trustees' commitment and participation in Board and committee meetings, as well as their leadership of standing and ad hoc committees throughout their tenure.
In determining that a particular Trustee was and continues to be qualified to serve as a Trustee, the Board has considered a variety of criteria, none of which, in isolation, was controlling. The Board believes that, collectively, the Trustees have balanced and diverse experience, qualifications, attributes, and skills, which allow the Board to operate effectively in governing the fund and protecting the interests of shareholders. Information about the specific experience, skills, attributes, and qualifications of each Trustee, which in each case led to the Board's conclusion that the Trustee should serve (or continue to serve) as a trustee of the fund, is provided below.
Board Structure and Oversight Function. James C. Curvey is an interested person (as defined in the 1940 Act) and currently serves as Chairman. The Trustees have determined that an interested Chairman is appropriate and benefits shareholders because an interested Chairman has a personal and professional stake in the quality and continuity of services provided to the fund. Independent Trustees exercise their informed business judgment to appoint an individual of their choosing to serve as Chairman, regardless of whether the Trustee happens to be independent or a member of management. The Independent Trustees have determined that they can act independently and effectively without having an Independent Trustee serve as Chairman and that a key structural component for assuring that they are in a position to do so is for the Independent Trustees to constitute a substantial majority for the Board. The Independent Trustees also regularly meet in executive session. Ned C. Lautenbach serves as Chairman of the Independent Trustees and as such (i) acts as a liaison between the Independent Trustees and management with respect to matters important to the Independent Trustees and (ii) with management prepares agendas for Board meetings.
Fidelity funds are overseen by different Boards of Trustees. The fund's Board oversees Fidelity's equity and high income funds and another Board oversees Fidelity's investment-grade bond, money market, and asset allocation funds. The asset allocation funds may invest in Fidelity funds overseen by the fund's Board. The use of separate Boards, each with its own committee structure, allows the Trustees of each group of Fidelity funds to focus on the unique issues of the funds they oversee, including common research, investment, and operational issues. On occasion, the separate Boards establish joint committees to address issues of overlapping consequences for the Fidelity funds overseen by each Board.
The Trustees operate using a system of committees to facilitate the timely and efficient consideration of all matters of importance to the Trustees, the fund, and fund shareholders and to facilitate compliance with legal and regulatory requirements and oversight of the fund's activities and associated risks. The Board, acting through its committees, has charged FMR and its affiliates with (i) identifying events or circumstances the occurrence of which could have demonstrably adverse effects on the fund's business and/or reputation; (ii) implementing processes and controls to lessen the possibility that such events or circumstances occur or to mitigate the effects of such events or circumstances if they do occur; and (iii) creating and maintaining a system designed to evaluate continuously business and market conditions in order to facilitate the identification and implementation processes described in (i) and (ii) above. Because the day-to-day operations and activities of the fund are carried out by or through FMR, its affiliates and other service providers, the fund's exposure to risks is mitigated but not eliminated by the processes overseen by the Trustees. While each of the Board's committees has responsibility for overseeing different aspects of the fund's activities, oversight is exercised primarily through the Operations, Audit, and Compliance Committees. In addition, the Independent Trustees have worked with FMR to enhance the Board's oversight of investment and financial risks, legal and regulatory risks, technology risks, and operational risks, including the development of additional risk reporting to the Board. For example, a working group comprised of Independent Trustees and FMR has worked and continues to work to review the Fidelity funds' valuation-related activities, reporting and risk management. Appropriate personnel, including but not limited to the fund's Chief Compliance Officer (CCO), FMR's internal auditor, the independent accountants, the fund's Treasurer and portfolio management personnel, make periodic reports to the Board's committees, as appropriate, including an annual review of FMR's risk management program for the Fidelity funds. The responsibilities of each standing committee, including their oversight responsibilities, are described further under "Standing Committees of the Fund's Trustees."
Annual Report
The fund's Statement of Additional Information (SAI) includes more information about the Trustees. To request a free copy, call Fidelity at 1-877-208-0098.
Interested Trustees*:
Correspondence intended for each Trustee who is an interested person may be sent to Fidelity Investments, 82 Devonshire Street, Boston, Massachusetts 02109.
Name, Age; Principal Occupations and Other Relevant Experience+ |
James C. Curvey (77) |
| Year of Election or Appointment: 2007 Mr. Curvey is Trustee and Chairman of the Board of Trustees of certain Trusts. Mr. Curvey also serves as Trustee (2007-present) of other investment companies advised by FMR. Mr. Curvey is a Director of Fidelity Investments Money Management, Inc. (2009-present), Director of Fidelity Research & Analysis Co. (2009-present) and Director of FMR and FMR Co., Inc. (2007-present). Mr. Curvey is also Vice Chairman (2007-present) and Director of FMR LLC. In addition, Mr. Curvey serves as an Overseer for the Boston Symphony Orchestra and a member of the Trustees of Villanova University. Previously, Mr. Curvey was the Vice Chairman (2006-2007) and Director (2000-2007) of FMR Corp. |
Ronald P. O'Hanley (55) |
| Year of Election or Appointment: 2011 Mr. O'Hanley is Director of FMR Co., Inc. (2010-present), Director of Fidelity Investments Money Management, Inc. (2010-present), Director of Fidelity Research & Analysis Company (2010-present), President of Fidelity Asset Management and Corporate Services and a member of Fidelity's Executive Committee (2010-present). Previously, Mr. O'Hanley served as President and Chief Executive Officer of BNY Mellon Asset Management (2007-2010). Mr. O'Hanley also served as Vice Chairman of Bank New York Mellon Corp. and a member of that firm's Executive Committee. Prior to the 2007 merger of The Bank of New York and Mellon Financial Corporation, he was Vice Chairman of Mellon Financial Corporation and President and Chief Executive Officer of Mellon Asset Management. He joined Mellon in February 1997. Mr. O'Hanley currently serves as Chairman of the Boston Public Library Foundation Board of Directors and sits on the Board of Directors of Beth Israel Deaconess Medical Center, the Board of Trustees of the Marine Biological Laboratory and the Advisory Board of the Maxwell School of Citizenship and Public Administration at Syracuse University. Mr. O'Hanley also chairs the Council on Asset Management for the Financial Services Roundtable and is a member of the Board of Directors of Institutional Investor's U.S. Institute. |
* Trustees have been determined to be "Interested Trustees" by virtue of, among other things, their affiliation with the trust or various entities under common control with FMR.
+ The information above includes each Trustee's principal occupation during the last five years and other information relating to the experience, attributes, and skills relevant to each Trustee's qualifications to serve as a Trustee, which led to the conclusion that each Trustee should serve as a Trustee for the fund.
Independent Trustees:
Correspondence intended for each Independent Trustee (that is, the Trustees other than the Interested Trustees) may be sent to Fidelity Investments, P.O. Box 55235, Boston, Massachusetts 02205-5235.
Name, Age; Principal Occupations and Other Relevant Experience+ |
Dennis J. Dirks (64) |
| Year of Election or Appointment: 2005 Prior to his retirement in May 2003, Mr. Dirks was Chief Operating Officer and a member of the Board of The Depository Trust & Clearing Corporation (DTCC). He also served as President, Chief Operating Officer, and Board member of The Depository Trust Company (DTC) and President and Board member of the National Securities Clearing Corporation (NSCC). In addition, Mr. Dirks served as Chief Executive Officer and Board member of the Government Securities Clearing Corporation, Chief Executive Officer and Board member of the Mortgage-Backed Securities Clearing Corporation, as a Trustee and a member of the Finance Committee of Manhattan College (2005-2008), and as a Trustee and a member of the Finance Committee of AHRC of Nassau County (2006-2008). Mr. Dirks is a member of the Independent Directors Council (IDC) Governing Council (2010-present) and Board of Directors for The Brookville Center for Children's Services, Inc. (2009-present). |
Alan J. Lacy (59) |
| Year of Election or Appointment: 2008 Mr. Lacy serves as Senior Adviser (2007-present) of Oak Hill Capital Partners, L.P. (private equity). Mr. Lacy also served as Chief Executive Officer (2000-2005) and Vice Chairman (2005-2006) of Sears Holdings Corporation and Sears, Roebuck and Co. (retail). In addition, Mr. Lacy serves as a member of the Board of Directors of Dave & Buster's Entertainment, Inc. (restaurant and entertainment complexes, 2010-present), Earth Fare, Inc. (retail grocery, 2012-present), The Hillman Companies, Inc. (hardware wholesalers, 2010-present), and Bristol-Myers Squibb Company (global pharmaceuticals, 2008-present). Mr. Lacy is a member of the Board of Trustees of The National Parks Conservation Association (2006-present). Previously, Mr. Lacy served as Chairman of the Board of Trustees of the National Parks Conservation Association (2008-2011) and as a member of the Board of Directors for the Western Union Company (global money transfer, 2006-2011). |
Ned C. Lautenbach (68) |
| Year of Election or Appointment: 2000 Mr. Lautenbach is Chairman of the Independent Trustees of the Equity and High Income Funds (2006-present). Mr. Lautenbach currently serves as the Lead Director of the Eaton Corporation Board of Directors (diversified industrial, 1997-present). Mr. Lautenbach is Chairman of the Board of Directors of the Philharmonic Center for the Arts in Naples, Florida (2012-present) and a member of the Council on Foreign Relations (1994-present). Previously, Mr. Lautenbach was a Partner/Advisory Partner at Clayton, Dubilier & Rice, LLC (private equity investment, 1998-2010), as well as a Director of Sony Corporation (2006-2007). |
Joseph Mauriello (68) |
| Year of Election or Appointment: 2008 Prior to his retirement in January 2006, Mr. Mauriello served in numerous senior management positions including Deputy Chairman and Chief Operating Officer (2004-2005), and Vice Chairman of Financial Services (2002-2004) of KPMG LLP US (professional services, 1965-2005). Mr. Mauriello currently serves as a member of the Board of Directors of XL Group plc. (global insurance and re-insurance, 2006-present). Previously, Mr. Mauriello served as a Director of the Hamilton Funds of the Bank of New York (2006-2007) and of Arcadia Resources Inc. (health care services and products, 2007-2012). |
Robert W. Selander (62) |
| Year of Election or Appointment: 2011 Previously, Mr. Selander served as a Member of the Advisory Board of Fidelity's Equity and High Income Funds (2011), Executive Vice Chairman (2010), Chief Executive Officer (2009-2010), and President and Chief Executive Officer (1997-2009) of Mastercard, Inc. |
Cornelia M. Small (68) |
| Year of Election or Appointment: 2005 Ms. Small is a member of the Board of Directors (2009-present) and Chair of the Investment Committee (2010-present) of the Teagle Foundation. Ms. Small also serves on the Investment Committee of the Berkshire Taconic Community Foundation (2008-present). Previously, Ms. Small served as Chairperson (2002-2008) and a member of the Investment Committee and Chairperson (2008-2012) and a member of the Board of Trustees of Smith College. In addition, Ms. Small served as Chief Investment Officer, Director of Global Equity Investments, and a member of the Board of Directors of Scudder, Stevens & Clark and Scudder Kemper Investments. |
William S. Stavropoulos (73) |
| Year of Election or Appointment: 2001 Mr. Stavropoulos is Vice Chairman of the Independent Trustees of the Equity and High Income Funds (2006-present). Mr. Stavropoulos serves as President and Founder of the Michigan Baseball Foundation, the Great Lakes Loons (2007-present). Mr. Stavropoulos is Chairman Emeritus of the Board of Directors of The Dow Chemical Company, where he previously served in numerous senior management positions, including President, CEO (1995-2000; 2002-2004), Chairman of the Executive Committee (2000-2006), and as a member of the Board of Directors (1990-2006). Currently, Mr. Stavropoulos is a Director of Univar Inc. (global distributor of commodity and specialty chemicals, Chairman from 2010-May 2012 and Lead Director from May 2012-present), Teradata Corporation (data warehousing and technology solutions, 2008-present), Maersk Inc. (industrial conglomerate), and Tyco International, Ltd. (multinational manufacturing and services, 2007-present), and a member of the Advisory Board for Metalmark Capital LLC (private equity investment, 2005-present). Mr. Stavropoulos is an operating advisor to Clayton, Dubilier & Rice, LLC (private equity investment). In addition, Mr. Stavropoulos is a member of the University of Notre Dame Advisory Council for the College of Science, a Trustee of the Rollin L. Gerstacker Foundation, and a Director of the Naples Philharmonic Center for the Arts. Previously, Mr. Stavropoulos served as a Director of Chemical Financial Corporation (bank holding company, 1993-2012). |
David M. Thomas (63) |
| Year of Election or Appointment: 2008 Previously, Mr. Thomas served as Executive Chairman (2005-2006) and Chairman and Chief Executive Officer (2000-2005) of IMS Health, Inc. (pharmaceutical and healthcare information solutions), and a Director of Fortune Brands, Inc. (consumer products, 2000-2011). In addition, Mr. Thomas serves as Non-Executive Chairman of the Board of Directors of Fortune Brands Home and Security (home and security products, 2011-present), and as a member of the Board of Directors of Interpublic Group of Companies, Inc. (marketing communication, 2004-present). |
Michael E. Wiley (62) |
| Year of Election or Appointment: 2008 Mr. Wiley also serves as a Director of Asia Pacific Exploration Consolidated (international oil and gas exploration and production, 2008-present). Mr. Wiley serves as a Director of Tesoro Corporation (independent oil refiner and marketer, 2005-present), and a Director of Bill Barrett Corporation (exploration and production, 2005-present). In addition, Mr. Wiley also serves as a Director of Post Oak Bank (privately-held bank, 2004-present). Previously, Mr. Wiley served as a member of the Board of Trustees of the University of Tulsa (2000-2006; 2007-2010), as a Senior Energy Advisor of Katzenbach Partners, LLC (consulting, 2006-2007), as an Advisory Director of Riverstone Holdings (private investment), Chairman, President, and CEO of Baker Hughes, Inc. (oilfield services, 2000-2004), and as Director of Spinnaker Exploration Company (exploration and production, 2001-2005). |
+ The information above includes each Trustee's principal occupation during the last five years and other information relating to the experience, attributes, and skills relevant to each Trustee's qualifications to serve as a Trustee, which led to the conclusion that each Trustee should serve as a Trustee for the fund.
Advisory Board Members and Executive Officers:
Correspondence intended for David A. Rosow and Garnett A. Smith may be sent to Fidelity Investments, P.O. Box 55235, Boston, Massachusetts 02205-5235. Correspondence intended for each executive officer, Edward C. Johnson 3d, and Peter S. Lynch may be sent to Fidelity Investments, 82 Devonshire Street, Boston, Massachusetts 02109.
Name, Age; Principal Occupation |
Edward C. Johnson 3d (82) |
| Year of Election or Appointment: 2011 Member of the Advisory Board of Fidelity's Equity and High Income Funds. Mr. Johnson serves as Chief Executive Officer, Chairman, and a Director of FMR LLC, and also serves as Chairman and Director of FIL Limited. Previously, Mr. Johnson served as a Trustee and Chairman of the Board of certain Fidelity Trusts, Chairman and a Director of FMR, Chairman and a Director of FMR Co., Inc., and President of FMR LLC (2006-2007). |
Peter S. Lynch (68) |
| Year of Election or Appointment: 2003 Member of the Advisory Board of Fidelity's Equity and High Income Funds. Mr. Lynch is Vice Chairman and a Director of FMR and FMR Co., Inc. In addition, Mr. Lynch serves as a Trustee of Boston College and as the Chairman of the Inner-City Scholarship Fund. Previously, Mr. Lynch served on the Special Olympics International Board of Directors (1997-2006). |
David A. Rosow (70) |
| Year of Election or Appointment: 2012 Member of the Advisory Board of Fidelity's Equity and High Income Funds. Chairman and Chief Executive Officer of International Golf Group, Inc. (golf course development, 1989-present). Previously, Mr. Rosow served as Chairman and Chief Executive Officer of Rosow & Company, Inc. (private investment company, 1989-2011), a Lead Director of Hudson United Bancorp (2001-2006) and as a Director of TD Banknorth (1996-2006). In addition, Mr. Rosow is a member (2008-present) and President (2009-present) of the Town Council of Palm Beach, Florida. |
Garnett A. Smith (65) |
| Year of Election or Appointment: 2012 Member of the Advisory Board of Fidelity's Equity and High Income Funds. Prior to Mr. Smith's retirement, he served as Chairman and Chief Executive Officer of Inbrand Corp. (manufacturer of personal absorbent products, 1990-1997). He also served as President (1986-1990) of Inbrand Corp. Prior to his employment with Inbrand Corp., he was employed by a retail fabric chain and North Carolina National Bank. In addition, Mr. Smith is a board member of the Jackson Hole Land Trust (2009-present). |
Kenneth B. Robins (43) |
| Year of Election or Appointment: 2008 President and Treasurer of Fidelity's Equity and High Income Funds. Mr. Robins also serves as President and Treasurer (2010-present) and Assistant Treasurer (2009-present) of other Fidelity funds and is an employee of Fidelity Investments (2004-present). Previously, Mr. Robins served as Deputy Treasurer of the Fidelity funds (2005-2008) and Treasurer and Chief Financial Officer of The North Carolina Capital Management Trust: Cash and Term Portfolios (2006-2008). |
Bruce T. Herring (47) |
| Year of Election or Appointment: 2006 Vice President of certain Equity Funds. Mr. Herring also serves as President of Fidelity Research & Analysis Company (2010-present), Chief Investment Officer and Director of Fidelity Management & Research (U.K.) Inc. (2010-present) and Group Chief Investment Officer of FMR. Previously, Mr. Herring served as Vice President (2005-2006) and Senior Vice President (2006-2007) of Fidelity Management & Research Company, Vice President of FMR Co., Inc. (2001-2007) and as a portfolio manager for Fidelity U.S. Equity Funds. |
Brian B. Hogan (48) |
| Year of Election or Appointment: 2009 Vice President of Equity and High Income Funds. Mr. Hogan also serves as President of FMR's Equity Division (2009-present). Previously, Mr. Hogan served as Senior Vice President, Equity Research of FMR (2006-2009) and as a portfolio manager. |
Scott C. Goebel (44) |
| Year of Election or Appointment: 2008 Secretary and Chief Legal Officer (CLO) of the Fidelity funds. Mr. Goebel also serves as Secretary of Fidelity Investments Money Management, Inc. (FIMM) (2010-present) and Fidelity Research and Analysis Company (FRAC) (2010-present); Secretary and CLO of The North Carolina Capital Management Trust: Cash and Term Portfolios (2008-present); General Counsel, Secretary, and Senior Vice President of FMR (2008-present) and FMR Co., Inc. (2008-present); employed by FMR LLC or an affiliate (2001-present); Chief Legal Officer of Fidelity Management & Research (Hong Kong) Limited (2008-present) and Assistant Secretary of Fidelity Management & Research (Japan) Inc. (2008-present), and Fidelity Management & Research (U.K.) Inc. (2008-present). Previously, Mr. Goebel served as Assistant Secretary of FIMM (2008-2010), FRAC (2008-2010), and the Funds (2007-2008) and as Vice President and Secretary of Fidelity Distributors Corporation (FDC) (2005-2007). |
William C. Coffey (43) |
| Year of Election or Appointment: 2009 Assistant Secretary of Fidelity's Equity and High Income Funds. Mr. Coffey also serves as Senior Vice President and Deputy General Counsel of FMR LLC (2010-present), and is an employee of Fidelity Investments. Previously, Mr. Coffey served as Vice President and Associate General Counsel of FMR LLC (2005-2009). |
Elizabeth Paige Baumann (44) |
| Year of Election or Appointment: 2012 Anti-Money Laundering (AML) Officer of the Fidelity funds. Ms. Baumann also serves as AML Officer of The North Carolina Capital Management Trust: Cash and Term Portfolios (2012-present), Chief AML Officer of FMR LLC (2012-present), and is an employee of Fidelity Investments. Previously, Ms. Baumann served as Vice President and Deputy Anti-Money Laundering Officer (2007-2012). |
Christine Reynolds (54) |
| Year of Election or Appointment: 2008 Chief Financial Officer of the Fidelity funds. Ms. Reynolds became President of Fidelity Pricing and Cash Management Services (FPCMS) in August 2008. Ms. Reynolds served as Chief Operating Officer of FPCMS (2007-2008). Previously, Ms. Reynolds served as President, Treasurer, and Anti-Money Laundering officer of the Fidelity funds (2004-2007). |
Joseph A. Hanlon (44) |
| Year of Election or Appointment: 2012 Chief Compliance Officer of Fidelity's Equity and High Income Funds. Mr. Hanlon serves as Compliance Officer of FMR, FMR Co., Inc., Fidelity Investments Money Management, Inc. (FIMM), Fidelity Research and Analysis Company (FRAC), Fidelity Management & Research (Japan) Inc., Fidelity Management & Research (U.K.) Inc., Fidelity Management & Research (Hong Kong), and Strategic Advisers, Inc. (2009-present), as Senior Vice President of the Fidelity Asset Management Division (2009-present), and is an employee of Fidelity Investments. |
Joseph F. Zambello (55) |
| Year of Election or Appointment: 2011 Deputy Treasurer of the Fidelity funds. Mr. Zambello is an employee of Fidelity Investments. Previously, Mr. Zambello served as Vice President of FMR's Program Management Group (2009-2011) and Vice President of the Transfer Agent Oversight Group (2005-2009). |
Adrien E. Deberghes (45) |
| Year of Election or Appointment: 2008 Deputy Treasurer of Fidelity's Equity and High Income Funds. Mr. Deberghes also serves as Vice President (2011-present) and Assistant Treasurer (2010-present) of other Fidelity funds, and is an employee of Fidelity Investments (2008-present). Previously, Mr. Deberghes served as Senior Vice President of Mutual Fund Administration at State Street Corporation (2007-2008), Senior Director of Mutual Fund Administration at Investors Bank & Trust (2005-2007), and Director of Finance for Dunkin' Brands (2000-2005). |
Stephen Sadoski (41) |
| Year of Election or Appointment: 2012 Deputy Treasurer of Fidelity's Equity and High Income Funds. Mr. Sadoski also serves as Assistant Treasurer of other Fidelity funds (2012-present) and is an employee of Fidelity Investments (2012-present). Previously, Mr. Sadoski served as an assistant chief accountant in the Division of Investment Management of the Securities and Exchange Commission (SEC) (2009-2012) and as a senior manager at Deloitte & Touche (1997-2009). |
Stephanie J. Dorsey (43) |
| Year of Election or Appointment: 2010 Assistant Treasurer of Fidelity's Equity and High Income Funds. Ms. Dorsey also serves as Deputy Treasurer of other Fidelity funds (2008-present) and is an employee of Fidelity Investments (2008-present). Previously, Ms. Dorsey served as Treasurer (2004-2008) of the JPMorgan Mutual Funds and Vice President (2004-2008) of JPMorgan Chase Bank. |
John R. Hebble (54) |
| Year of Election or Appointment: 2009 Assistant Treasurer of Fidelity's Equity and High Income Funds. Mr. Hebble also serves as President (2011-present), Treasurer, and Chief Financial Officer of The North Carolina Capital Management Trust: Cash and Term Portfolios (2008-present), President and Treasurer of other Fidelity funds (2008-present) and is an employee of Fidelity Investments. |
Gary W. Ryan (54) |
| Year of Election or Appointment: 2005 Assistant Treasurer of the Fidelity funds. Mr. Ryan is an employee of Fidelity Investments. Previously, Mr. Ryan served as Vice President of Fund Reporting in Fidelity Pricing and Cash Management Services (FPCMS) (1999-2005). |
Jonathan Davis (44) |
| Year of Election or Appointment: 2010 Assistant Treasurer of the Fidelity funds. Mr. Davis is also Assistant Treasurer of Fidelity Rutland Square Trust II and Fidelity Commonwealth Trust II. Mr. Davis is an employee of Fidelity Investments. Previously, Mr. Davis served as Vice President and Associate General Counsel of FMR LLC (2003-2010). |
Annual Report
Distributions (Unaudited)
The Board of Trustees of Fidelity Worldwide voted to pay on December 10, 2012, to shareholders of record at the opening of business on December 7, 2012, a distribution of $0.08 per share derived from capital gains realized from sales of portfolio securities and a dividend of $0.151 per share from net investment income.
The fund hereby designates as a capital gain dividend with respect to the taxable year ended October 31, 2012, $3,746,668, or, if subsequently determined to be different, the net capital gain of such year.
Class I designates 84% of the dividends distributed in during the fiscal year as qualifying for the dividends-received deduction for corporate shareholders.
Class I designates 100% of the dividends distributed during the fiscal year as amounts which may be taken into account as a dividend for the purposes of the maximum rate under section 1(h)(11) of the Internal Revenue Code.
The fund will notify shareholders in January 2013 of amounts for use in preparing 2012 income tax returns.
Annual Report
Board Approval of Investment Advisory Contracts and Management Fees
Fidelity Worldwide Fund
Each year, the Board of Trustees, including the Independent Trustees (together, the Board), votes on the renewal of the management contract and sub-advisory agreements (together, the Advisory Contracts) for the fund. The Board, assisted by the advice of fund counsel and Independent Trustees' counsel, requests and considers a broad range of information relevant to the renewal of the Advisory Contracts throughout the year.
The Board meets regularly and, at each of its meetings, considers factors that are relevant to its annual consideration of the renewal of the fund's Advisory Contracts, including the services and support provided to the fund and its shareholders. The Board has established various standing committees, each composed of and chaired by Independent Trustees with varying backgrounds, to which the Board has assigned specific subject matter responsibilities in order to enhance effective decision-making by the Board. The Board, acting directly and through its Committees, requests and receives information concerning the annual consideration of the renewal of the fund's Advisory Contracts. The Board also meets as needed to consider matters specifically related to the Board's annual consideration of the renewal of Advisory Contracts. Members of the Board may also meet with trustees of other Fidelity funds through ad hoc joint committees to discuss certain matters relevant to the Fidelity funds.
At its July 2012 meeting, the Board of Trustees, including the Independent Trustees, unanimously determined to renew the fund's Advisory Contracts. In reaching its determination, the Board considered all factors it believed relevant, including (i) the nature, extent, and quality of the services to be provided to the fund and its shareholders (including the investment performance of the fund); (ii) the competitiveness of the fund's management fee and total expense ratio relative to peer funds; (iii) the total costs of the services to be provided by and the profits to be realized by Fidelity from its relationship with the fund; (iv) the extent to which economies of scale exist and would be realized as the fund grows; and (v) whether fee levels reflect these economies of scale, if any, for the benefit of fund shareholders.
In considering whether to renew the Advisory Contracts for the fund, the Board reached a determination, with the assistance of fund counsel and Independent Trustees' counsel and through the exercise of its business judgment, that the renewal of the Advisory Contracts is in the best interests of the fund and its shareholders and that the compensation payable under the Advisory Contracts is fair and reasonable. The Board's decision to renew the Advisory Contracts was not based on any single factor, but rather was based on a comprehensive consideration of all the information provided to the Board at its meetings throughout the year. The Board, in reaching its determination to renew the Advisory Contracts, is aware that shareholders in the fund have a broad range of investment choices available to them, including a wide choice among mutual funds offered by Fidelity's competitors, and that the fund's shareholders, who have the opportunity to review and weigh the disclosure provided by the fund in its prospectus and other public disclosures, have chosen to invest in this fund, managed by Fidelity.
Nature, Extent, and Quality of Services Provided. The Board considered the staffing within the investment adviser, FMR, and the sub-advisers (together, the Investment Advisers), including the backgrounds of the fund's investment personnel, and also considered the fund's investment objective, strategies, and related investment philosophy. The Independent Trustees also had discussions with senior management of Fidelity's investment operations and investment groups. The Board considered the structure of the portfolio manager compensation program and whether this structure provides appropriate incentives to act in the best interests of the fund.
Resources Dedicated to Investment Management and Support Services. The Board and the Fund Oversight and Research Committees reviewed the general qualifications and capabilities of the Investment Advisers' investment staff, including its size, education, experience, and resources, as well as the Investment Advisers' approach to recruiting, training, managing, and compensating investment personnel. The Board also noted that FMR has continued to increase the resources devoted to non-U.S. offices, including expansion of Fidelity's global investment organization. The Board noted that Fidelity's analysts have extensive resources, tools and capabilities that allow them to conduct sophisticated quantitative and fundamental analysis, as well as credit analysis of issuers, counterparties and guarantors. The Board also believes that Fidelity's investment professionals have sufficient access to global information and data so as to provide competitive investment results over time, and that those professionals also have access to sophisticated tools that permit them to assess portfolio construction and risk and performance attribution characteristics continuously, as well as to transmit new information and research conclusions rapidly around the world. Additionally, in its deliberations, the Board considered the Investment Advisers' trading and risk management capabilities and resources, which are an integral part of the investment management process.
Shareholder and Administrative Services. The Board considered (i) the nature, extent, quality, and cost of advisory, administrative, and shareholder services performed by the Investment Advisers and their affiliates under the Advisory Contracts and under separate agreements covering transfer agency, pricing and bookkeeping, and securities lending services for the fund; (ii) the nature and extent of the supervision of third party service providers, principally custodians and subcustodians; and (iii) the resources devoted to, and the record of compliance with, the fund's compliance policies and procedures. The Board also reviewed the allocation of fund brokerage, including allocations to brokers affiliated with the Investment Advisers, the use of brokerage commissions to pay fund expenses, and the use of "soft" commission dollars to pay for research services.
The Board noted that the growth of fund assets over time across the complex allows Fidelity to reinvest in the development of services designed to enhance the value or convenience of the Fidelity funds as investment vehicles. These services include 24-hour access to account information and market information through telephone representatives and over the Internet, investor education materials and asset allocation tools, and the expanded availability of Fidelity Investor Centers.
Annual Report
Board Approval of Investment Advisory Contracts and Management Fees - continued
Investment in a Large Fund Family. The Board considered the benefits to shareholders of investing in a Fidelity fund, including the benefits of investing in a fund that is part of a large family of funds offering a variety of investment disciplines and providing a large variety of mutual fund investor services. The Board noted that Fidelity had taken, or had made recommendations that resulted in the Fidelity funds taking, a number of actions over the previous year that benefited particular funds, including (i) continuing to dedicate additional resources to investment research and support of the senior management team that oversees asset management; (ii) persisting in efforts to enhance Fidelity's research capabilities, in particular, international research; (iii) launching new funds and making other enhancements to meet client needs for global and income-oriented solutions; (iv) continuing to launch dedicated lower cost underlying funds to meet investment management's portfolio construction needs related to expanding underlying fund options, specifically for the Freedom Fund product lines; (v) adopting a "Stock Selector" sector neutral investment approach and employing a team of portfolio managers who are sector specialists to manage certain funds; (vi) rationalizing product lines and gaining increased efficiencies through the mergers of several funds into other funds; (vii) strengthening the Spartan Index Fund product line by adding new funds and/or new low-cost institutional share classes, restructuring fund expenses to accommodate new classes, and reducing investment minimums for certain classes of shares; (viii) modifying the eligibility criteria for Institutional Class shares to increase their appeal to government entities and charitable investors; and (ix) reducing certain transfer agent fee rates.
Investment Performance. The Board considered whether the fund has operated in accordance with its investment objective, as well as its record of compliance with its investment restrictions. It also reviewed the fund's absolute investment performance for each class, as well as the fund's relative investment performance for each class measured over multiple periods against (i) a broad-based securities market index, and (ii) a peer group of mutual funds deemed appropriate by Fidelity and reviewed by the Board. The following charts considered by the Board show, over the one-, three-, and five-year periods ended December 31, 2011, as available, the cumulative total returns of the retail class and Class C of the fund, the cumulative total returns of a broad-based securities market index ("benchmark"), and a range of cumulative total returns of a peer group of mutual funds identified by Morningstar, Inc. as having an investment style similar to that of the fund based on underlying portfolio holdings. The returns of the retail class and Class C show the performance of the highest performing class (based on five-year performance) and the lowest performing class (based on one-year performance), respectively. The box within each chart shows the 25th percentile return (top of box) and the 75th percentile return (bottom of box) of the peer group. Returns shown above the box are in the first quartile and returns shown below the box are in the fourth quartile. The percentage beaten numbers noted below each chart correspond to the percentile box and represent the percentage of funds in the peer group whose performance was equal to or lower than that of the class indicated.
Fidelity Worldwide Fund
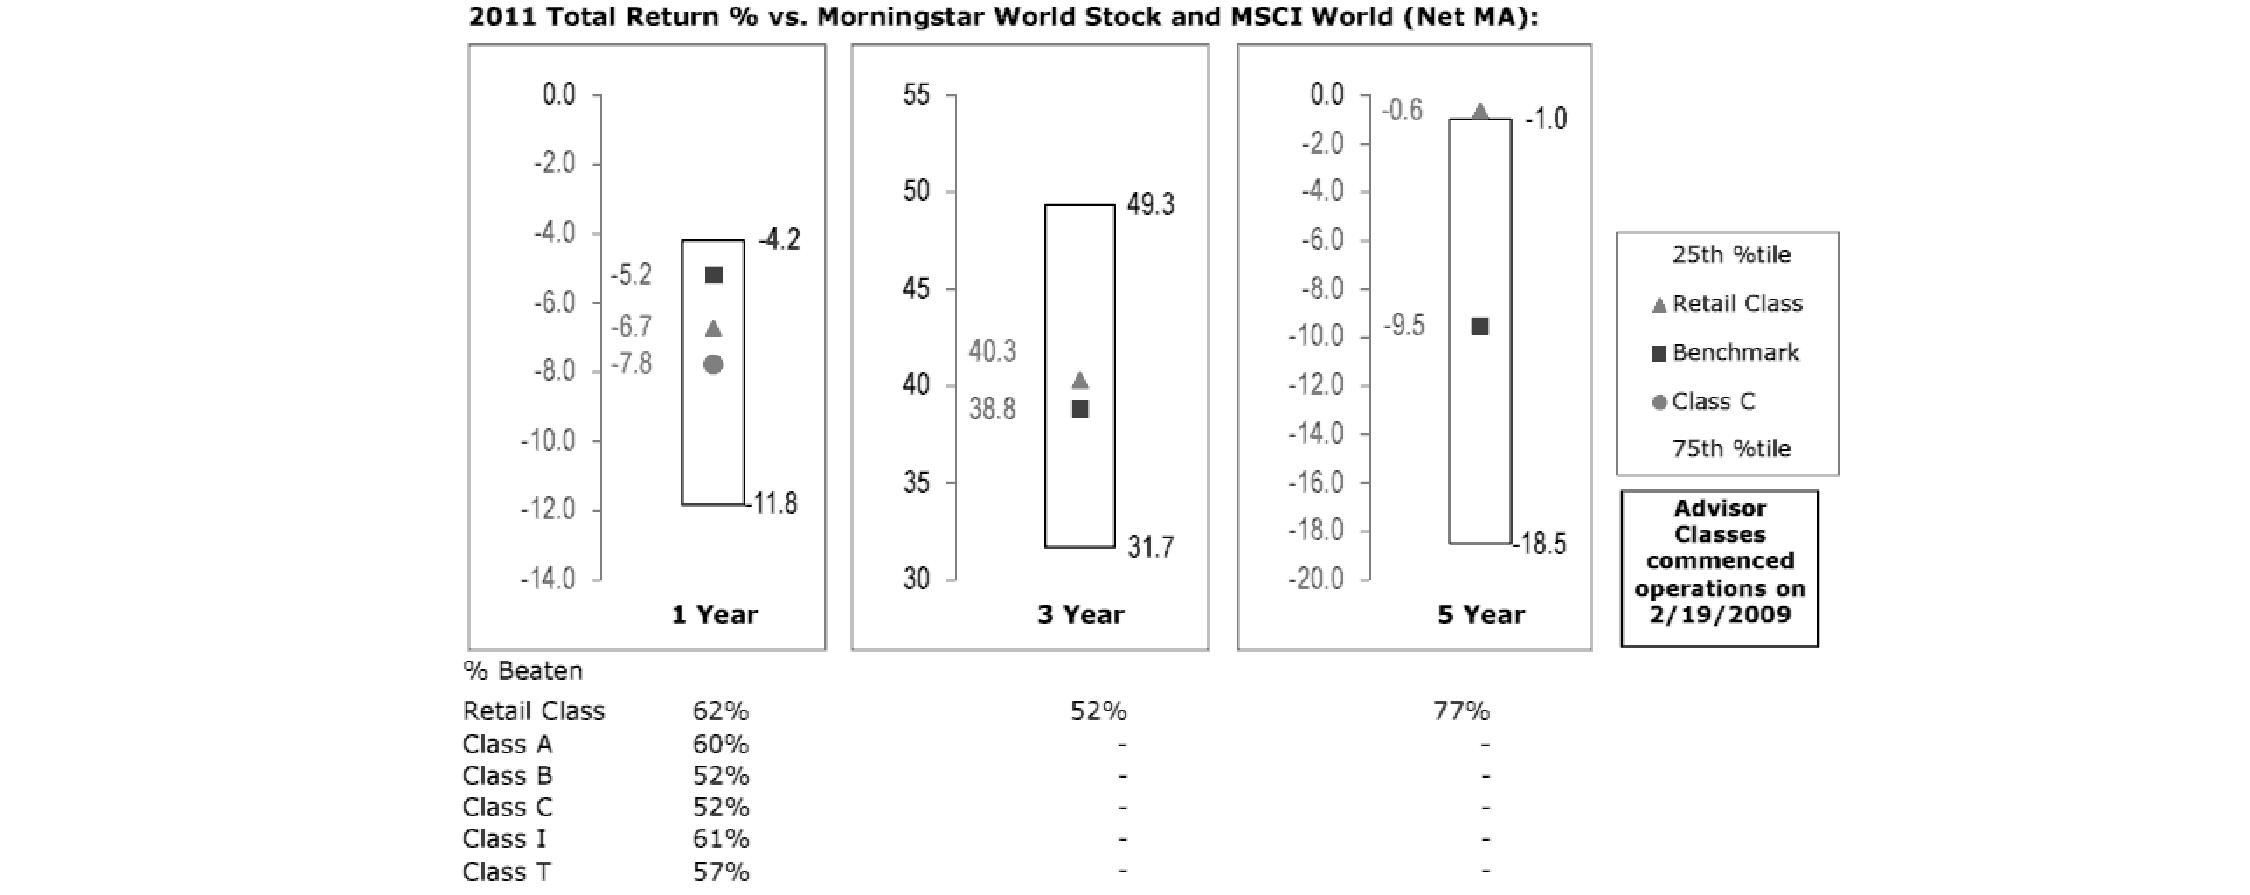
The Board reviewed the fund's relative investment performance against its peer group and noted that the performance of the retail class of the fund was in the second quartile for the one- and three-year periods and the first quartile for the five-year period. The Board also noted that the investment performance of the retail class of the fund compared favorably to its benchmark for the three- and five-year periods, although the fund's one-year total return was lower than its benchmark. The Board considered that the variations in performance among the fund's classes reflect the variations in class expenses, which result in lower performance for higher expense classes. The Board also reviewed the fund's performance since inception as well as performance in the current year.
The Board also considered that the fund's management fee is subject to upward or downward adjustment depending upon whether, and to what extent, the fund's investment performance for the performance period exceeds, or is exceeded by, the record (over the same period) of a Board-approved performance adjustment index. The Board noted that the performance adjustment provides FMR with a strong economic incentive to seek to achieve superior performance for the fund's shareholders and helps to more closely align the interests of FMR and the fund's shareholders.
Annual Report
Based on its review, the Board concluded that the nature, extent, and quality of services provided to the fund under the Advisory Contracts should benefit the fund's shareholders.
Competitiveness of Management Fee and Total Expense Ratio. The Board considered the fund's management fee and total expense ratio compared to "mapped groups" of competitive funds and classes. Fidelity creates "mapped groups" by combining similar Lipper investment objective categories that have comparable management fee characteristics. Combining Lipper investment objective categories aids the Board's management fee and total expense ratio comparisons by broadening the competitive group used for comparison and by reducing the number of universes to which various Fidelity funds are compared.
Management Fee. The Board considered two proprietary management fee comparisons for the 12-month periods shown in the chart below. The group of Lipper funds used by the Board for management fee comparisons is referred to below as the "Total Mapped Group." The Total Mapped Group comparison focuses on a fund's standing relative to the total universe of comparable funds available to investors in terms of gross management fees before expense reimbursements or caps, and without giving effect to the fund's performance adjustment. "TMG %" represents the percentage of funds in the Total Mapped Group that had management fees that were lower than the fund's. For example, a TMG % of 17% means that 83% of the funds in the Total Mapped Group had higher management fees than the fund. The "Asset-Size Peer Group" (ASPG) comparison focuses on a fund's standing relative to non-Fidelity funds similar in size to the fund within the Total Mapped Group. The ASPG represents at least 15% of the funds in the Total Mapped Group with comparable asset size and management fee characteristics, subject to a minimum of 50 funds (or all funds in the Total Mapped Group if fewer than 50). Additional information, such as the ASPG quartile in which the fund's management fee ranked and the impact of the fund's performance adjustment, is also included in the chart and considered by the Board.
Fidelity Worldwide Fund

The Board noted that the fund's management fee ranked below the median of its Total Mapped Group and below the median of its ASPG for 2011. The Board also noted the effect of the fund's positive performance adjustment on the fund's management fee ranking. The Board noted that the performance adjustment for each year represents calculations for performance periods that differ from the periods shown in the performance charts above.
Based on its review, the Board concluded that the fund's management fee is fair and reasonable in light of the services that the fund receives and the other factors considered.
Total Expense Ratio. In its review of each class's total expense ratio, the Board considered the fund's management fee as well as other fund or class expenses, as applicable, such as transfer agent fees, pricing and bookkeeping fees, fund-paid 12b-1 fees, and custodial, legal, and audit fees. The Board also noted the effects of any waivers and reimbursements on fees and expenses, as well as the impact of the fund's performance adjustment. As part of its review, the Board also considered the current and historical total expense ratios of each class of the fund compared to competitive fund median expenses. Each class of the fund is compared to those funds and classes in the Total Mapped Group (used by the Board for management fee comparisons) that have a similar sales load structure.
Annual Report
Board Approval of Investment Advisory Contracts and Management Fees - continued
The Board noted that the total expense ratio of each of Class A, Class B, Class C, and the retail class of the fund ranked below its competitive median for 2011 and the total expense ratio of each of Class T and Institutional Class ranked above its competitive median for 2011. The Board considered that various factors, including 12b-1 fees, positive or negative performance adjustments, and relatively higher other expenses in the case of small fund size, can affect total expense ratios. The Board noted that the total expense ratio of Class T was above the competitive median primarily because of higher 12b-1 fees on Class T. Class T has a higher 12b-1 fee, but a lower front-end sales charge, than traditionally priced front-end sales charge classes. The Board considered that Class T is primarily sold load-waived in the retirement plan market where its 0.50% 12b-1 fee is comparable to competing no-load, higher 12b-1 fee classes designed specifically for retirement plans. The Board noted that the fund offers multiple classes, each of which has a different sales load and 12b-1 fee structure, and that the multiple structures are intended to offer a range of pricing options for the intermediary market. The Board also noted that the total expense ratios of the classes vary primarily by the level of their 12b-1 fees, although differences in transfer agent fees may also cause expenses to vary from class to class.
Fees Charged to Other Fidelity Clients. The Board also considered Fidelity fee structures and other information with respect to clients of FMR and its affiliates, such as other mutual funds advised or subadvised by FMR or its affiliates, pension plan clients, and other institutional clients. The Board noted the findings of the 2010 ad hoc joint committee (created with the board of other Fidelity funds), which reviewed and compared Fidelity's institutional investment advisory business with its business of providing services to the Fidelity funds, including the differences in services provided, fees charged, and costs incurred, as well as competition in their respective marketplaces.
Based on its review of total expense ratios and fees charged to other Fidelity clients, the Board concluded that the total expense ratio of each class of the fund was reasonable, although in some cases above the median of the universe presented for comparison, in light of the services that the fund and its shareholders receive and the other factors considered.
Costs of the Services and Profitability. The Board considered the revenues earned and the expenses incurred by Fidelity in conducting the business of developing, marketing, distributing, managing, administering and servicing the fund and its shareholders. The Board also considered the level of Fidelity's profits in respect of all the Fidelity funds.
On an annual basis, FMR presents to the Board Fidelity's profitability for the fund. Fidelity calculates the profitability for each fund, as well as aggregate profitability for groups of Fidelity funds and all Fidelity funds, using a series of detailed revenue and cost allocation methodologies which originate with the books and records of Fidelity on which Fidelity's audited financial statements are based. The Audit Committee of the Board reviews any significant changes from the prior year's methodologies.
PricewaterhouseCoopers LLP (PwC), independent registered public accounting firm and auditor to Fidelity and certain Fidelity funds, has been engaged annually by the Board as part of the Board's assessment of Fidelity's profitability analysis. PwC's engagement includes the review and assessment of Fidelity's methodologies used in determining the revenues and expenses attributable to Fidelity's mutual fund business, and completion of agreed-upon procedures surrounding the mathematical accuracy of fund profitability and its conformity to allocation methodologies. After considering PwC's reports issued under the engagement and information provided by Fidelity, the Board concluded that while other allocation methods may also be reasonable, Fidelity's profitability methodologies are reasonable in all material respects.
The Board also reviewed Fidelity's non-fund businesses and fall-out benefits related to the mutual fund business as well as cases where Fidelity's affiliates may benefit from or be related to the fund's business.
The Board considered the costs of the services provided by and the profits realized by Fidelity in connection with the operation of the fund and was satisfied that the profitability was not excessive in the circumstances.
Economies of Scale. The Board considered whether there have been economies of scale in respect of the management of the Fidelity funds, whether the Fidelity funds (including the fund) have appropriately benefited from any such economies of scale, and whether there is potential for realization of any further economies of scale. The Board considered the extent to which the fund will benefit from economies of scale through increased services to the fund, through waivers or reimbursements, or through fee or expense reductions. The Board also noted that in 2009, it and the board of other Fidelity funds created an ad hoc committee (the Economies of Scale Committee) to analyze whether FMR attains economies of scale in respect of the management and servicing of the Fidelity funds, whether the Fidelity funds have appropriately benefited from such economies of scale, and whether there is potential for realization of any further economies of scale.
The Board recognized that the fund's management contract incorporates a "group fee" structure, which provides for lower group fee rates as total fund assets under FMR's management increase, and for higher group fee rates as total fund assets under FMR's management decrease. FMR calculates the group fee rates based on a tiered asset "breakpoint" schedule that varies based on asset class. The Board considered that the group fee is designed to deliver the benefits of economies of scale to fund shareholders when total Fidelity fund assets increase, even if assets of any particular fund are unchanged or have declined, because some portion of Fidelity's costs are attributable to services provided to all Fidelity funds, and all funds benefit if those costs can be allocated among more assets. The Board concluded that, given the group fee structure, fund shareholders will benefit from lower management fees as assets under FMR's management increase at the fund complex level, regardless of whether Fidelity achieves any such economies of scale.
Annual Report
The Board concluded, taking into account the analysis of the Economies of Scale Committee, that economies of scale, if any, are being appropriately shared between fund shareholders and Fidelity.
Additional Information Requested by the Board. In order to develop fully the factual basis for consideration of the Fidelity funds' Advisory Contracts, the Board requested and received additional information on certain topics, including (i) fund performance trends, actions to be taken by FMR to improve certain funds' overall performance, and Fidelity's long-term strategies for certain funds; (ii) the potential to further rationalize the Fidelity fund lineup with the possibility of achieving savings for the funds and Fidelity; (iii) Fidelity's compensation structure for portfolio managers and other key investment personnel; (iv) the amount of the investment that each portfolio manager has made in the Fidelity fund(s) that he or she manages; (v) the realization of fall-out benefits in certain Fidelity business units; (vi) Fidelity's group fee structures, the potential impact of regulatory changes on such structures, and the rationale for the individual fee rates of certain funds; (vii) fund profitability methodology, including Fidelity's cost allocation methodology, and the impact of certain factors on fund profitability results; (viii) trends regarding industry use of performance fee structures and the possibility of implementing performance fee structures for additional funds; and (ix) the impact of net redemptions from the Fidelity funds.
Based on its evaluation of all of the conclusions noted above, and after considering all factors it believed relevant, the Board ultimately concluded that the advisory fee structures are fair and reasonable, and that the fund's Advisory Contracts should be renewed.
Annual Report
Investment Adviser
Fidelity Management & Research Company
Boston, MA
Investment Sub-Advisers
FMR Co., Inc.
Fidelity Management & Research
(U.K.) Inc.
FIL Investments (Japan) Limited
FIL Investment Advisors
FIL Investment Advisors
(UK) Limited
Fidelity Management & Research
(Hong Kong) Limited
Fidelity Management & Research
(Japan) Inc.
General Distributor
Fidelity Distributors Corporation
Smithfield, RI
Transfer and Service Agents
Fidelity Investments Institutional
Operations Company, Inc.
Boston, MA
Fidelity Service Company, Inc.
Boston, MA
Custodian
JPMorgan Chase Bank
New York, NY
(Fidelity Investment logo)(registered trademark)
Corporate Headquarters
82 Devonshire St., Boston, MA 02109
www.fidelity.com
AWLDI-UANN-1212
1.883436.103
Fidelity®
Series Emerging Markets
Series International Growth
Series International Small Cap
Series International Value
Funds -
Fidelity Series Emerging Markets Fund
Fidelity Series International Growth Fund
Fidelity Series International Small Cap Fund
Fidelity Series International Value Fund
Class F
Annual Report
October 31, 2012
(Fidelity Cover Art)
Contents
Shareholder Expense Example | (Click Here) | An example of shareholder expenses. |
Fidelity® Series Emerging Markets Fund |
Performance | (Click Here) | How the fund has done over time. |
Management's Discussion of Fund Performance | (Click Here) | The Portfolio Manager's review of fund performance and strategy. |
Investment Changes | (Click Here) | A summary of major shifts in the Fund's investments over the past six months. |
Investments | (Click Here) | A complete list of the fund's investments with their market values. |
Financial Statements | (Click Here) | Statements of assets and liabilities, operations, and changes in net assets, as well as financial highlights. |
Fidelity Series International Growth Fund |
Performance | (Click Here) | How the fund has done over time. |
Management's Discussion of Fund Performance | (Click Here) | The Portfolio Manager's review of fund performance and strategy. |
Investment Changes | (Click Here) | A summary of major shifts in the Fund's investments over the past six months. |
Investments | (Click Here) | A complete list of the fund's investments with their market values. |
Financial Statements | (Click Here) | Statements of assets and liabilities, operations, and changes in net assets, as well as financial highlights. |
Fidelity Series International Small Cap Fund |
Performance | (Click Here) | How the fund has done over time. |
Management's Discussion of Fund Performance | (Click Here) | The Portfolio Manager's review of fund performance and strategy. |
Investment Changes | (Click Here) | A summary of major shifts in the Fund's investments over the past six months. |
Investments | (Click Here) | A complete list of the fund's investments with their market values. |
Financial Statements | (Click Here) | Statements of assets and liabilities, operations, and changes in net assets, as well as financial highlights. |
Fidelity Series International Value Fund |
Performance | (Click Here) | How the fund has done over time. |
Management's Discussion of Fund Performance | (Click Here) | The Portfolio Manager's review of fund performance and strategy. |
Investment Changes | (Click Here) | A summary of major shifts in the Fund's investments over the past six months. |
Investments | (Click Here) | A complete list of the fund's investments with their market values. |
Financial Statements | (Click Here) | Statements of assets and liabilities, operations, and changes in net assets, as well as financial highlights. |
Notes | (Click Here) | Notes to the Financial Statements. |
Reports of Independent Registered Public Accounting Firms | (Click Here) | |
Trustees and Officers | (Click Here) | |
Distributions | (Click Here) | |
Board Approval of Investment Advisory Contracts and Management Fees | (Click Here) | |
To view a fund's proxy voting guidelines and proxy voting record for the 12-month period ended June 30, visit http://www.fidelity.com/proxyvotingresults or visit the Securities and Exchange Commission's (SEC) web site at http://www.sec.gov. You may also call 1-800-544-8544 for Fidelity Series Emerging Markets Fund, Fidelity Series International Growth Fund, Fidelity Series International Small Cap Fund, and Fidelity Series International Value Fund or 1-800-835-5092 for Class F of each fund to request a free copy of the proxy voting guidelines.
Standard & Poor's, S&P and S&P 500 are registered service marks of The McGraw-Hill Companies, Inc. and have been licensed for use by Fidelity Distributors Corporation.
Other third party marks appearing herein are the property of their respective owners.
All other marks appearing herein are registered or unregistered trademarks or service marks of FMR LLC or an affiliated company.. © 2012 FMR LLC. All rights reserved.
This report and the financial statements contained herein are submitted for the general information of the shareholders of the funds. This report is not authorized for distribution to prospective investors in the funds unless preceded or accompanied by an effective prospectus.
A fund files its complete schedule of portfolio holdings with the SEC for the first and third quarters of each fiscal year on Form N-Q. Forms N-Q are available on the SEC's web site at http://www.sec.gov. A fund's Forms N-Q may be reviewed and copied at the SEC's Public Reference Room in Washington, DC. Information regarding the operation of the SEC's Public Reference Room may be obtained by calling 1-800-SEC-0330. For a complete list of a fund's portfolio holdings, view the most recent holdings listing, semiannual report, or annual report on Fidelity's web site at http://www.fidelity.com, http://www.advisor.fidelity.com, or http://www.401k.com, as applicable.
NOT FDIC INSURED • MAY LOSE VALUE • NO BANK GUARANTEE
Neither the funds nor Fidelity Distributors Corporation is a bank.
Annual Report
Shareholder Expense Example
As a shareholder of a Fund you incur two types of costs: (1) transaction costs and (2) ongoing costs, including management fees and other Fund expenses. This Example is intended to help you understand your ongoing costs (in dollars) of investing in the Funds and to compare these costs with the ongoing costs of investing in other mutual funds.
The Example is based on an investment of $1,000 invested at the beginning of the period and held for the entire period (May 1, 2012 to October 31, 2012).
Actual Expenses
The first line of the accompanying table for each class of each fund provides information about actual account values and actual expenses. You may use the information in this line, together with the amount you invested, to estimate the expenses that you paid over the period. Simply divide your account value by $1,000.00 (for example, an $8,600 account value divided by $1,000.00 = 8.6), then multiply the result by the number in the first line for a class of the fund under the heading entitled "Expenses Paid During Period" to estimate the expenses you paid on your account during this period. In addition, each Fund, as a shareholder in the underlying Fidelity Central Funds, will indirectly bear its pro-rata share of the fees and expenses incurred by the underlying Fidelity Central Funds. These fees and expenses are not included in the Fund's annualized expense ratio used to calculate the expense estimate in the table below.
Hypothetical Example for Comparison Purposes
The second line of the accompanying table for each class of each fund provides information about hypothetical account values and hypothetical expenses based on a Class' actual expense ratio and an assumed rate of return of 5% per year before expenses, which is not the Class' actual return. The hypothetical account values and expenses may not be used to estimate the actual ending account balance or expenses you paid for the period. You may use this information to compare the ongoing costs of investing in the Fund and other funds. To do so, compare this 5% hypothetical example with the 5% hypothetical examples that appear in the shareholder reports of the other funds. In addition, each Fund, as a shareholder in the underlying Fidelity Central Funds, will indirectly bear its pro-rata share of the fees and expenses incurred by the underlying Fidelity Central Funds. These fees and expenses are not included in the Fund's annualized expense ratio used to calculate the expense estimate in the table below.
Please note that the expenses shown in the table are meant to highlight your ongoing costs only and do not reflect any transaction costs. Therefore, the second line of the table is useful in comparing ongoing costs only, and will not help you determine the relative total costs of owning different funds.
Annual Report
| Annualized
Expense Ratio | Beginning
Account Value
May 1, 2012 | Ending
Account Value
October 31, 2012 | Expenses Paid
During Period*
May 1, 2012
to October 31, 2012 |
Fidelity Series Emerging Markets Fund | | | |
Series Emerging Markets | 1.10% | | | |
Actual | | $ 1,000.00 | $ 986.00 | $ 5.49 |
HypotheticalA | | $ 1,000.00 | $ 1,019.61 | $ 5.58 |
Class F | .91% | | | |
Actual | | $ 1,000.00 | $ 987.30 | $ 4.55 |
HypotheticalA | | $ 1,000.00 | $ 1,020.56 | $ 4.62 |
Fidelity Series International Growth Fund | | |
Series International Growth | 1.06% | | | |
Actual | | $ 1,000.00 | $ 1,012.30 | $ 5.36 |
HypotheticalA | | $ 1,000.00 | $ 1,019.81 | $ 5.38 |
Class F | .87% | | | |
Actual | | $ 1,000.00 | $ 1,013.10 | $ 4.40 |
HypotheticalA | | $ 1,000.00 | $ 1,020.76 | $ 4.42 |
Fidelity Series International Small Cap Fund | | |
Series International Small Cap | 1.24% | | | |
Actual | | $ 1,000.00 | $ 1,025.60 | $ 6.31 |
HypotheticalA | | $ 1,000.00 | $ 1,018.90 | $ 6.29 |
Class F | 1.04% | | | |
Actual | | $ 1,000.00 | $ 1,027.20 | $ 5.30 |
HypotheticalA | | $ 1,000.00 | $ 1,019.91 | $ 5.28 |
Fidelity Series International Value Fund | | |
Series International Value | .92% | | | |
Actual | | $ 1,000.00 | $ 1,061.40 | $ 4.77 |
HypotheticalA | | $ 1,000.00 | $ 1,020.51 | $ 4.67 |
Class F | .72% | | | |
Actual | | $ 1,000.00 | $ 1,062.40 | $ 3.73 |
HypotheticalA | | $ 1,000.00 | $ 1,021.52 | $ 3.66 |
A 5% return per year before expenses
* Expenses are equal to each Class' annualized expense ratio, multiplied by the average account value over the period, multiplied by 184 / 366 (to reflect the one-half year period).
Annual Report
Fidelity® Series Emerging Markets Fund
Average annual total return reflects the change in the value of an investment, assuming reinvestment of the class' distributions from dividend income and capital gains (the profits earned upon the sale of securities that have grown in value, if any) and assuming a constant rate of performance each year. The $10,000 table and the fund's returns do not reflect the deduction of taxes that a shareholder would pay on fund distributions or the redemption of fund shares. During periods of reimbursement by Fidelity, a fund's total return will be greater than it would be had the reimbursement not occurred. How a fund did yesterday is no guarantee of how it will do tomorrow.
Average Annual Total Returns
Periods ended October 31, 2012 | Past 1
year | Life of
fund A |
Fidelity Series Emerging Markets Fund | 5.40% | 18.81% |
Class F B | 5.60% | 19.03% |
A From December 9, 2008.
B The initial offering of Class F shares took place on June 26, 2009. Returns prior to June 26, 2009 are those of Fidelity Series Emerging Markets Fund, the original class of the fund.
$10,000 Over Life of Fund
Let's say hypothetically that $10,000 was invested in Fidelity Series Emerging Markets Fund, a class of the fund, on December 9, 2008, when the fund started. The chart shows how the value of your investment would have changed, and also shows how the MSCI® Emerging Markets (EM) Index performed over the same period.
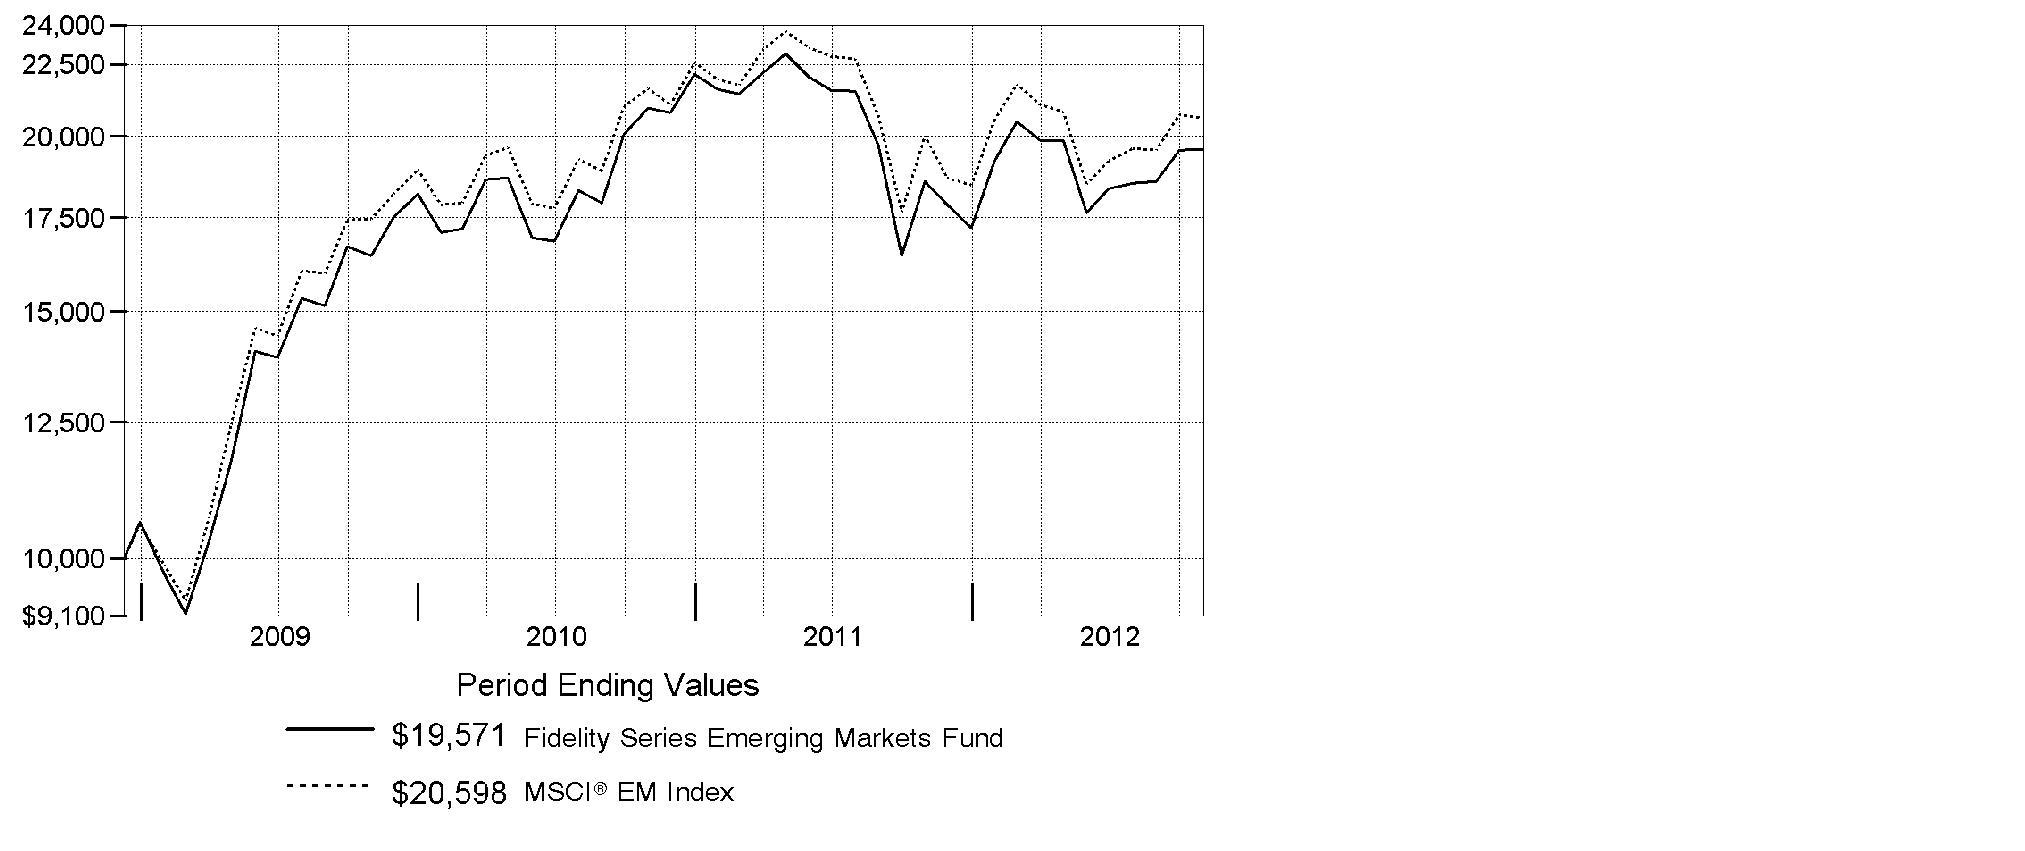
Annual Report
Fidelity Series Emerging Markets Fund
Market Recap: Emerging-markets stocks gained 2.98% for the year ending October 31, 2012, as measured by the MSCI® Emerging Markets Index. After some early choppiness, the index rallied strongly in the first two months of 2012 but retreated from March through May amid renewed concerns about Europe's sovereign debt crisis and continued economic sluggishness in key countries such as China and Brazil. A general uptrend in the final five months of the period lifted the index into positive territory for the full year, despite the head wind of a generally stronger U.S. dollar. Major benchmark component Brazil was a drag on performance, falling roughly 13%. The nation's inflation rate crept higher while economic growth ebbed, creating an unfavorable backdrop for stocks here. India's market retreated about 5%, while Russia gave up 4%. Conversely, Hong Kong advanced approximately 17%, aided by rebounding shares of property developers, while South Africa added 7%, China rose roughly 5% and South Korea and Taiwan gained about 4% and 1%, respectively. Sentiment about Chinese stocks improved following the government's September approval of massive outlays for infrastructure projects, in hopes of halting that nation's economic slowdown. However, China's ongoing transition to new Communist Party leadership created uncertainty that kept some investors on the sidelines.
Comments from Timothy Gannon and Douglas Chow, Co-Portfolio Managers of Fidelity® Series Emerging Markets Fund, along with James Hayes, Per Johansson, Sam Polyak and Gregory Lee: For the year, the fund's Series Emerging Markets and Class F shares gained 5.40% and 5.60%, respectively, ahead of the MSCI index. Our picks were strongest in consumer staples and telecommunication services. The top relative contributor was Colombia-based energy firm Ecopetrol. In consumer staples, we benefited from positions in Uni-President China Holdings, a beverage and instant noodles company operating in China that gained market share, and confectionary products maker Orion, a South Korean snack food company that has grown in China. Conversely, results were hampered by security selection in information technology. The fund was hurt by shares of BW Offshore, a Bermuda-based oil-services company that faced a difficult operating environment. In the materials sector, shares of Australia-headquartered Aquarius Platinum lost significant ground because the platinum producer was pressured by weak global demand for autos and cost inflation due to labor unrest in South Africa. BW and Aquarius were not in the index.
Note to shareholders: Gregory Lee was named Co-Portfolio Manager on May 2, 2012, and is responsible for the fund's industrials sector assets.
The views expressed above reflect those of the portfolio manager(s) only through the end of the period as stated on the cover of this report and do not necessarily represent the views of Fidelity or any other person in the Fidelity organization. Any such views are subject to change at any time based upon market or other conditions and Fidelity disclaims any responsibility to update such views. These views may not be relied on as investment advice and, because investment decisions for a Fidelity fund are based on numerous factors, may not be relied on as an indication of trading intent on behalf of any Fidelity fund.
Annual Report
Fidelity Series Emerging Markets Fund
Investment Changes (Unaudited)
Geographic Diversification (% of fund's net assets) |
As of October 31, 2012 |
 | Korea (South) 14.4% | |
 | Brazil 13.1% | |
 | Russia 9.0% | |
 | China 8.8% | |
 | Taiwan 7.5% | |
 | Cayman Islands 6.1% | |
 | Mexico 4.6% | |
 | India 4.3% | |
 | United States of America 4.1% | |
| Other 28.1% | |

Percentages are based on country or territory of incorporation and are adjusted for the effect of futures contracts, if applicable. |
As of April 30, 2012 |
| Korea (South) 13.5% | |
| Brazil 12.6% | |
| China 8.5% | |
| Taiwan 8.4% | |
| Russia 7.0% | |
| Cayman Islands 5.1% | |
| South Africa 4.9% | |
| Hong Kong 4.1% | |
| United States of America 4.1% | |
| Other 31.8% | |

Percentages are based on country or territory of incorporation and are adjusted for the effect of futures contracts, if applicable. |
Asset Allocation |
| % of fund's
net assets | % of fund's net assets
6 months ago |
Stocks | 97.1 | 97.0 |
Short-Term Investments and Net Other Assets (Liabilities) | 2.9 | 3.0 |
Top Ten Stocks as of October 31, 2012 |
| % of fund's
net assets | % of fund's net assets
6 months ago |
Samsung Electronics Co. Ltd. (Korea (South), Semiconductors & Semiconductor Equipment) | 4.6 | 4.4 |
Taiwan Semiconductor Manufacturing Co. Ltd. (Taiwan, Semiconductors & Semiconductor Equipment) | 2.6 | 2.6 |
Vale SA (PN-A) sponsored ADR (Brazil, Metals & Mining) | 2.1 | 2.0 |
China Construction Bank Corp. (H Shares) (China, Commercial Banks) | 1.8 | 1.7 |
Industrial & Commercial Bank of China Ltd. (H Shares) (China, Commercial Banks) | 1.7 | 2.1 |
Petroleo Brasileiro SA - Petrobras sponsored ADR (Brazil, Oil, Gas & Consumable Fuels) | 1.7 | 0.6 |
America Movil SAB de CV Series L sponsored ADR (Mexico, Wireless Telecommunication Services) | 1.5 | 1.3 |
Mobile TeleSystems OJSC (Russia, Wireless Telecommunication Services) | 1.5 | 0.9 |
Sberbank (Savings Bank of the Russian Federation) (Russia, Commercial Banks) | 1.4 | 1.2 |
PT Telkomunikasi Indonesia Tbk (Indonesia, Diversified Telecommunication Services) | 1.3 | 1.2 |
| 20.2 | |
Market Sectors as of October 31, 2012 |
| % of fund's
net assets | % of fund's net assets
6 months ago |
Financials | 24.6 | 21.7 |
Information Technology | 13.3 | 14.2 |
Energy | 12.1 | 14.0 |
Materials | 11.9 | 12.2 |
Consumer Staples | 9.1 | 8.2 |
Consumer Discretionary | 8.0 | 8.3 |
Telecommunication Services | 7.2 | 7.9 |
Industrials | 6.7 | 6.2 |
Utilities | 3.1 | 3.2 |
Health Care | 1.1 | 1.1 |
Annual Report
Fidelity Series Emerging Markets Fund
Investments October 31, 2012
Showing Percentage of Net Assets
Common Stocks - 94.6% |
| Shares | | Value |
Australia - 0.2% |
Paladin Energy Ltd. (Australia) (a) | 11,417,191 | | $ 13,451,583 |
Austria - 0.4% |
Erste Bank AG (a) | 922,626 | | 23,169,820 |
Bailiwick of Jersey - 0.3% |
Atrium European Real Estate Ltd. | 3,032,372 | | 17,140,514 |
Bermuda - 1.9% |
Aquarius Platinum Ltd. (Australia) | 9,262,261 | | 5,528,447 |
BW Offshore Ltd. | 30,807,621 | | 18,102,105 |
Cosco International Holdings Ltd. | 1,526,000 | | 618,272 |
GP Investments Ltd. (depositary receipt) (a) | 6,551,400 | | 15,128,168 |
Kunlun Energy Co. Ltd. | 20,180,000 | | 37,495,500 |
Pacific Basin Shipping Ltd. | 21,601,000 | | 11,566,913 |
Seadrill Ltd. | 469,408 | | 19,002,572 |
TOTAL BERMUDA | | 107,441,977 |
Brazil - 13.1% |
Anhanguera Educacional Participacoes SA | 2,454,116 | | 43,015,450 |
Arezzo Industria e Comercio SA | 753,000 | | 13,439,477 |
Banco do Brasil SA | 2,099,357 | | 22,398,792 |
Banco do Estado Rio Grande do Sul SA | 2,488,900 | | 19,668,076 |
BM&F Bovespa SA | 6,251,900 | | 40,016,100 |
BR Properties SA | 3,456,900 | | 45,273,893 |
Braskem SA (PN-A) | 2,692,600 | | 17,791,139 |
CCR SA | 2,553,300 | | 22,452,396 |
Cia.Hering SA | 1,055,700 | | 24,252,954 |
Companhia de Bebidas das Americas (AmBev) (PN) sponsored ADR | 702,000 | | 28,634,580 |
Companhia de Saneamento de Minas Gerais | 537,800 | | 12,693,992 |
Companhia Paranaense de Energia-Copel: | | | |
(PN-B) | 89,700 | | 1,324,930 |
(PN-B) sponsored ADR (d) | 1,109,100 | | 16,370,316 |
Estacio Participacoes SA | 1,021,600 | | 19,465,754 |
Fibria Celulose SA (a) | 1,529,200 | | 12,980,187 |
Gerdau SA sponsored ADR (d) | 2,706,300 | | 23,788,377 |
Itau Unibanco Holdings SA sponsored ADR | 4,190,160 | | 61,092,533 |
Lojas Americanas SA (PN) | 4,172,988 | | 34,928,139 |
Mills Estruturas e Servicos de Engenharia SA | 1,361,400 | | 20,872,946 |
Multiplus SA | 425,500 | | 9,886,189 |
Petroleo Brasileiro SA - Petrobras: | | | |
(PN) sponsored ADR (non-vtg.) | 1,181,400 | | 24,254,142 |
sponsored ADR | 3,565,116 | | 75,616,110 |
Sul America SA unit | 499,200 | | 3,932,547 |
Common Stocks - continued |
| Shares | | Value |
Brazil - continued |
TIM Participacoes SA sponsored ADR | 260,100 | | $ 4,520,538 |
Ultrapar Participacoes SA | 1,797,200 | | 37,695,143 |
Vale SA (PN-A) sponsored ADR | 6,757,400 | | 120,214,146 |
TOTAL BRAZIL | | 756,578,846 |
Canada - 2.2% |
Banro Corp. (a) | 1,531,100 | | 7,082,535 |
Barrick Gold Corp. | 442,900 | | 17,911,120 |
First Quantum Minerals Ltd. | 990,800 | | 22,271,299 |
Goldcorp, Inc. | 552,800 | | 24,990,158 |
Pan American Silver Corp. | 299,700 | | 6,593,400 |
Torex Gold Resources, Inc. (a) | 3,713,700 | | 7,734,164 |
Uranium One, Inc. (a)(d) | 4,999,100 | | 10,861,624 |
Yamana Gold, Inc. | 1,379,400 | | 27,857,320 |
TOTAL CANADA | | 125,301,620 |
Cayman Islands - 6.1% |
21Vianet Group, Inc. ADR (a)(d) | 1,122,534 | | 12,437,677 |
Ajisen (China) Holdings Ltd. | 17,563,000 | | 12,146,719 |
Anta Sports Products Ltd. | 15,565,000 | | 13,255,269 |
Baidu.com, Inc. sponsored ADR (a) | 286,926 | | 30,592,050 |
Belle International Holdings Ltd. | 11,701,000 | | 21,801,465 |
China Liansu Group Holdings Ltd. | 20,894,000 | | 12,320,641 |
Eurasia Drilling Co. Ltd. GDR (Reg. S) | 966,300 | | 33,433,980 |
Geely Automobile Holdings Ltd. | 32,860,000 | | 14,119,109 |
Gourmet Master Co. Ltd. | 1,798,000 | | 12,741,732 |
Greatview Aseptic Pack Co. Ltd. | 42,872,000 | | 22,459,251 |
Haitian International Holdings Ltd. | 9,766,000 | | 12,059,357 |
Hengan International Group Co. Ltd. | 5,489,000 | | 50,002,697 |
SINA Corp. (a) | 99,025 | | 5,409,736 |
Spreadtrum Communications, Inc. ADR (d) | 255,550 | | 5,890,428 |
Tencent Holdings Ltd. | 518,100 | | 18,317,224 |
Uni-President China Holdings Ltd. | 29,240,000 | | 36,785,569 |
Veripos (a)(e) | 2,543,575 | | 7,361,301 |
Xueda Education Group sponsored ADR (a)(d) | 2,360,100 | | 6,797,088 |
Yingde Gases Group Co. Ltd. | 24,432,000 | | 23,170,844 |
TOTAL CAYMAN ISLANDS | | 351,102,137 |
Chile - 1.2% |
Aguas Andinas SA | 20,871,972 | | 14,007,191 |
Embotelladora Andina SA Class A | 2,773,532 | | 13,949,803 |
Empresa Nacional de Telecomunicaciones SA (ENTEL) | 889,697 | | 18,121,232 |
Common Stocks - continued |
| Shares | | Value |
Chile - continued |
Enersis SA | 15,625,219 | | $ 5,348,589 |
Inversiones La Construccion SA | 994,846 | | 17,574,958 |
TOTAL CHILE | | 69,001,773 |
China - 8.8% |
BBMG Corp. (H Shares) | 14,688,500 | | 12,622,552 |
China Communications Construction Co. Ltd. (H Shares) | 24,567,000 | | 23,045,282 |
China Construction Bank Corp. (H Shares) | 134,633,000 | | 101,451,826 |
China Pacific Insurance Group Co. Ltd. (H Shares) | 15,284,600 | | 47,924,308 |
China Shenhua Energy Co. Ltd. (H Shares) | 17,183,000 | | 73,165,851 |
China Suntien Green Energy Corp. Ltd. (H Shares) (e) | 110,770,600 | | 22,582,764 |
China Telecom Corp. Ltd. (H Shares) | 30,295,682 | | 17,924,424 |
Dongfeng Motor Group Co. Ltd. (H Shares) | 20,690,000 | | 25,628,738 |
Industrial & Commercial Bank of China Ltd. (H Shares) | 151,341,000 | | 100,177,332 |
Maanshan Iron & Steel Ltd. (H Shares) (a) | 59,964,000 | | 15,474,481 |
PICC Property & Casualty Co. Ltd. (H Shares) | 14,004,000 | | 18,647,787 |
Shanghai Electric Group Co. Ltd. (H Shares) | 63,029,000 | | 25,618,073 |
Weichai Power Co. Ltd. (H Shares) | 6,991,000 | | 24,761,511 |
TOTAL CHINA | | 509,024,929 |
Colombia - 0.9% |
Ecopetrol SA ADR (d) | 871,558 | | 51,604,949 |
Cyprus - 0.2% |
Globaltrans Investment PLC: | | | |
GDR (f) | 384,000 | | 7,104,000 |
GDR (Reg. S) | 239,500 | | 4,430,750 |
TOTAL CYPRUS | | 11,534,750 |
Czech Republic - 0.3% |
Ceske Energeticke Zavody A/S | 449,903 | | 16,587,485 |
Egypt - 0.2% |
Orascom Telecom Holding SAE unit (a) | 3,584,100 | | 10,770,221 |
Hong Kong - 1.0% |
China Resources Power Holdings Co. Ltd. | 6,147,000 | | 13,166,393 |
Lenovo Group Ltd. | 40,402,000 | | 32,477,785 |
Sinotruk Hong Kong Ltd. | 24,648,000 | | 14,152,631 |
TOTAL HONG KONG | | 59,796,809 |
India - 4.3% |
Axis Bank Ltd. | 1,141,627 | | 25,092,242 |
Bharti Airtel Ltd. | 4,018,450 | | 20,138,928 |
Grasim Industries Ltd. | 175,551 | | 11,420,145 |
Common Stocks - continued |
| Shares | | Value |
India - continued |
Housing Development and Infrastructure Ltd. (a) | 2,806,885 | | $ 5,005,494 |
Indiabulls Real Estate Ltd. | 9,312,693 | | 9,917,615 |
ITC Ltd. | 10,802,924 | | 56,730,158 |
JK Cement Ltd. (a) | 1,118,165 | | 5,238,054 |
Larsen & Toubro Ltd. | 854,523 | | 25,837,389 |
Lupin Ltd. (a) | 1,228,397 | | 12,932,357 |
Maruti Suzuki India Ltd. | 914,820 | | 24,447,907 |
Phoenix Mills Ltd. (a) | 285,635 | | 1,065,458 |
Power Grid Corp. of India Ltd. | 5,189,791 | | 10,995,933 |
SREI Infrastructure Finance Ltd. (e) | 35,431,645 | | 17,681,250 |
State Bank of India | 574,903 | | 22,547,887 |
TOTAL INDIA | | 249,050,817 |
Indonesia - 2.4% |
PT Bakrieland Development Tbk (a) | 1,147,621,000 | | 7,766,273 |
PT Bank Tabungan Negara Tbk | 113,098,000 | | 17,897,786 |
PT Indo Tambangraya Megah Tbk | 3,939,500 | | 16,672,566 |
PT Jasa Marga Tbk | 32,824,000 | | 19,820,759 |
PT Telkomunikasi Indonesia Tbk: | | | |
Series B | 4,552,000 | | 4,623,262 |
sponsored ADR | 1,700,379 | | 69,120,406 |
TOTAL INDONESIA | | 135,901,052 |
Israel - 0.6% |
Bezeq Israeli Telecommunication Corp. Ltd. | 10,900,700 | | 13,293,092 |
Check Point Software Technologies Ltd. (a) | 143,439 | | 6,387,339 |
NICE Systems Ltd. sponsored ADR (a) | 421,900 | | 14,049,270 |
TOTAL ISRAEL | | 33,729,701 |
Italy - 0.0% |
Saipem SpA | 500 | | 22,462 |
Kazakhstan - 0.3% |
JSC Halyk Bank of Kazakhstan GDR unit (a) | 2,219,489 | | 15,780,567 |
Kenya - 0.7% |
Equity Bank Ltd. | 76,772,200 | | 21,864,073 |
Safaricom Ltd. | 310,976,319 | | 16,069,240 |
TOTAL KENYA | | 37,933,313 |
Korea (South) - 13.1% |
AMOREPACIFIC Group, Inc. | 75,476 | | 32,535,148 |
E-Mart Co. Ltd. | 187,080 | | 40,579,301 |
Common Stocks - continued |
| Shares | | Value |
Korea (South) - continued |
GS Engineering & Construction Corp. | 340,595 | | $ 19,180,181 |
Hana Financial Group, Inc. | 1,477,950 | | 43,037,747 |
Hyundai Heavy Industries Co. Ltd. | 105,249 | | 22,105,458 |
Hyundai Industrial Development & Construction Co. | 400,890 | | 7,206,549 |
KB Financial Group, Inc. | 1,649,472 | | 56,105,811 |
Kia Motors Corp. | 127,640 | | 7,094,233 |
Korea Electric Power Corp. (a) | 781,220 | | 20,268,478 |
Korean Reinsurance Co. | 1,258,660 | | 12,352,028 |
KT&G Corp. | 526,405 | | 40,120,569 |
LG Chemical Ltd. | 132,060 | | 37,062,847 |
LS Industrial Systems Ltd. | 398,968 | | 24,955,627 |
Orion Corp. | 25,862 | | 24,288,915 |
POSCO sponsored ADR (d) | 327,700 | | 25,685,126 |
S-Oil Corp. | 118 | | 10,812 |
Samsung Electronics Co. Ltd. | 217,878 | | 261,776,537 |
Samsung Fire & Marine Insurance Co. Ltd. | 179,333 | | 39,227,863 |
Shinhan Financial Group Co. Ltd. | 878,560 | | 30,176,530 |
Shinhan Financial Group Co. Ltd. sponsored ADR | 359,062 | | 12,287,102 |
TOTAL KOREA (SOUTH) | | 756,056,862 |
Luxembourg - 0.4% |
Subsea 7 SA | 1,135,800 | | 24,922,137 |
Malaysia - 0.7% |
Axiata Group Bhd | 10,628,300 | | 22,784,898 |
Petronas Dagangan Bhd | 2,440,800 | | 17,692,995 |
TOTAL MALAYSIA | | 40,477,893 |
Mexico - 4.6% |
America Movil SAB de CV Series L sponsored ADR | 3,429,300 | | 86,726,997 |
CEMEX SA de CV sponsored ADR | 2,973,713 | | 26,882,366 |
Desarrolladora Homex SAB de CV sponsored ADR (a)(d) | 550,004 | | 7,287,553 |
El Puerto de Liverpool SA Class C | 1,580,000 | | 14,160,150 |
Fibra Uno Administracion SA de CV | 7,050,999 | | 18,577,934 |
Fomento Economico Mexicano SAB de CV sponsored ADR | 415,100 | | 37,612,211 |
Grupo Comercial Chedraui de CV | 5,726,700 | | 15,425,440 |
Grupo Televisa SA de CV (CPO) sponsored ADR | 2,541,600 | | 57,440,160 |
TOTAL MEXICO | | 264,112,811 |
Netherlands - 0.2% |
ASML Holding NV (Netherlands) | 212,546 | | 11,684,136 |
Nigeria - 1.5% |
Guaranty Trust Bank PLC | 45,618,414 | | 5,750,953 |
Common Stocks - continued |
| Shares | | Value |
Nigeria - continued |
Guaranty Trust Bank PLC GDR (Reg. S) | 5,164,877 | | $ 32,022,237 |
Zenith Bank PLC | 441,095,434 | | 50,608,305 |
TOTAL NIGERIA | | 88,381,495 |
Norway - 1.2% |
ElectroMagnetic GeoServices ASA (a) | 7,661,999 | | 16,664,408 |
Petroleum Geo-Services ASA | 645,000 | | 11,120,885 |
TGS Nopec Geophysical Co. ASA | 1,243,333 | | 42,307,299 |
TOTAL NORWAY | | 70,092,592 |
Panama - 0.5% |
Copa Holdings SA Class A | 312,200 | | 28,978,404 |
Peru - 0.3% |
Compania de Minas Buenaventura SA sponsored ADR | 450,100 | | 16,095,576 |
Philippines - 1.5% |
Metro Pacific Investments Corp. | 214,905,000 | | 21,647,365 |
Metropolitan Bank & Trust Co. | 10,274,188 | | 23,748,123 |
Robinsons Land Corp. | 84,328,250 | | 38,983,862 |
TOTAL PHILIPPINES | | 84,379,350 |
Poland - 1.0% |
Eurocash SA | 1,092,509 | | 13,342,185 |
Powszechny Zaklad Ubezpieczen SA | 400,300 | | 46,767,388 |
TOTAL POLAND | | 60,109,573 |
Russia - 7.8% |
Bank St. Petersburg OJSC | 3,007,189 | | 5,534,904 |
DIXY Group OJSC (a) | 1,386,880 | | 14,651,215 |
Gazprom OAO sponsored ADR | 5,169,796 | | 47,251,935 |
LSR Group OJSC GDR (Reg. S) | 1,787,300 | | 8,605,850 |
Lukoil Oil Co. (a) | 236,900 | | 14,383,713 |
Magnit OJSC | 242,482 | | 34,542,987 |
Magnitogorsk Iron & Steel Works OJSC unit (a) | 2,311,700 | | 9,968,050 |
Mobile TeleSystems OJSC (a) | 6,229,400 | | 45,832,480 |
Mobile TeleSystems OJSC sponsored ADR | 2,215,500 | | 37,973,670 |
NOVATEK OAO GDR (Reg. S) | 378,000 | | 43,092,000 |
OGK-4 OJSC (a) | 451,705,400 | | 37,109,405 |
Raspadskaya OAO (a) | 2,844,310 | | 5,608,728 |
Rosneft Oil Co. OJSC | 1,062,800 | | 7,887,263 |
RusHydro JSC sponsored ADR | 4,984,900 | | 11,834,153 |
Sberbank (Savings Bank of the Russian Federation) | 28,191,600 | | 82,528,662 |
Sistema JSFC (a) | 12,205,700 | | 9,181,856 |
Common Stocks - continued |
| Shares | | Value |
Russia - continued |
TNK-BP Holding | 3,619,214 | | $ 7,388,317 |
Uralkali OJSC GDR (Reg. S) | 675,887 | | 26,481,253 |
TOTAL RUSSIA | | 449,856,441 |
Singapore - 1.2% |
First Resources Ltd. | 21,508,000 | | 36,146,417 |
Global Logistic Properties Ltd. | 14,913,000 | | 31,420,241 |
TOTAL SINGAPORE | | 67,566,658 |
South Africa - 3.9% |
AngloGold Ashanti Ltd. | 680,400 | | 22,987,540 |
Aspen Pharmacare Holdings Ltd. | 1,289,800 | | 23,503,244 |
Blue Label Telecoms Ltd. | 13,358,432 | | 10,383,977 |
Impala Platinum Holdings Ltd. | 2,172,900 | | 39,094,232 |
JSE Ltd. | 4,063,649 | | 32,961,362 |
Life Healthcare Group Holdings Ltd. | 5,323,100 | | 20,130,492 |
Naspers Ltd. Class N | 866,500 | | 56,254,319 |
Reunert Ltd. | 1,377,300 | | 12,132,674 |
Wilson Bayly Holmes-Ovcon Ltd. | 260,300 | | 4,265,958 |
TOTAL SOUTH AFRICA | | 221,713,798 |
Taiwan - 7.5% |
Asia Cement Corp. | 13,801,052 | | 17,198,161 |
Cheng Uei Precision Industries Co. Ltd. | 10,292,851 | | 22,798,612 |
Chinatrust Financial Holding Co. Ltd. | 47,770,722 | | 26,330,319 |
Chroma ATE, Inc. | 5,621,612 | | 10,700,501 |
Hon Hai Precision Industry Co. Ltd. (Foxconn) | 15,777,000 | | 47,908,932 |
MediaTek, Inc. | 2,793,000 | | 31,028,021 |
Synnex Technology International Corp. | 11,781,739 | | 24,926,788 |
Taiwan Fertilizer Co. Ltd. | 7,362,000 | | 17,541,773 |
Taiwan Mobile Co. Ltd. | 7,387,000 | | 25,795,070 |
Taiwan Semiconductor Manufacturing Co. Ltd. | 30,826,284 | | 93,937,568 |
Taiwan Semiconductor Manufacturing Co. Ltd. sponsored ADR | 3,480,151 | | 55,334,401 |
Unified-President Enterprises Corp. | 21,891,270 | | 38,671,329 |
Yuanta Financial Holding Co. Ltd. | 42,674,000 | | 19,284,382 |
TOTAL TAIWAN | | 431,455,857 |
Thailand - 1.0% |
Bangkok Bank Public Co. Ltd. (For. Reg.) | 6,907,000 | | 40,761,885 |
PTT Global Chemical PCL (For. Reg.) | 9,201,986 | | 18,301,961 |
TOTAL THAILAND | | 59,063,846 |
Common Stocks - continued |
| Shares | | Value |
Turkey - 1.1% |
Aygaz A/S | 3,880,022 | | $ 17,879,488 |
TAV Havalimanlari Holding A/S | 4,605,000 | | 22,864,435 |
Turkiye Is Bankasi A/S Series C | 6,321,000 | | 21,510,795 |
TOTAL TURKEY | | 62,254,718 |
United Kingdom - 0.8% |
Evraz PLC | 2,412,300 | | 9,194,910 |
Hikma Pharmaceuticals PLC | 1,104,436 | | 13,179,987 |
Kazakhmys PLC | 2,030,200 | | 23,228,508 |
TOTAL UNITED KINGDOM | | 45,603,405 |
United States of America - 1.2% |
Cognizant Technology Solutions Corp. Class A (a) | 481,665 | | 32,102,972 |
CTC Media, Inc. | 1,560,000 | | 13,088,400 |
Universal Display Corp. (a)(d) | 680,883 | | 22,319,345 |
TOTAL UNITED STATES OF AMERICA | | 67,510,717 |
TOTAL COMMON STOCKS (Cost $5,011,834,862) |
5,445,241,594
|
Nonconvertible Preferred Stocks - 2.5% |
| | | |
Korea (South) - 1.3% |
Hyundai Motor Co. Series 2 | 742,061 | | 48,662,196 |
Samsung Electronics Co. Ltd. | 35,099 | | 25,495,643 |
TOTAL KOREA (SOUTH) | | 74,157,839 |
Russia - 1.2% |
Sberbank (Savings Bank of the Russian Federation) (a) | 15,560,800 | | 32,768,196 |
Surgutneftegaz JSC | 61,136,550 | | 37,866,438 |
TOTAL RUSSIA | | 70,634,634 |
TOTAL NONCONVERTIBLE PREFERRED STOCKS (Cost $140,112,856) |
144,792,473
|
Money Market Funds - 3.5% |
| Shares | | Value |
Fidelity Cash Central Fund, 0.19% (b) | 136,343,028 | | $ 136,343,028 |
Fidelity Securities Lending Cash Central Fund, 0.19% (b)(c) | 63,552,588 | | 63,552,588 |
TOTAL MONEY MARKET FUNDS (Cost $199,895,616) |
199,895,616
|
TOTAL INVESTMENT PORTFOLIO - 100.6% (Cost $5,351,843,334) | | 5,789,929,683 |
NET OTHER ASSETS (LIABILITIES) - (0.6)% | | (36,506,344) |
NET ASSETS - 100% | $ 5,753,423,339 |
Legend |
(a) Non-income producing |
(b) Affiliated fund that is available only to investment companies and other accounts managed by Fidelity Investments. The rate quoted is the annualized seven-day yield of the fund at period end. A complete unaudited listing of the fund's holdings as of its most recent quarter end is available upon request. In addition, each Fidelity Central Fund's financial statements, which are not covered by the Fund's Report of Independent Registered Public Accounting Firm, are available on the SEC's website or upon request. |
(c) Investment made with cash collateral received from securities on loan. |
(d) Security or a portion of the security is on loan at period end. |
(e) Affiliated company |
(f) Security exempt from registration under Rule 144A of the Securities Act of 1933. These securities may be resold in transactions exempt from registration, normally to qualified institutional buyers. At the end of the period, the value of these securities amounted to $7,104,000 or 0.1% of net assets. |
Affiliated Central Funds |
Information regarding fiscal year to date income earned by the Fund from investments in Fidelity Central Funds is as follows: |
Fund | Income earned |
Fidelity Cash Central Fund | $ 245,351 |
Fidelity Securities Lending Cash Central Fund | 432,747 |
Total | $ 678,098 |
Other Affiliated Issuers |
An affiliated company is a company in which the Fund has ownership of at least 5% of the voting securities. Fiscal year to date transactions with companies which are or were affiliates are as follows: |
Affiliate | Value,
beginning of
period | Purchases | Sales
Proceeds | Dividend
Income | Value,
end of
period |
Asia Pacific Systems, Inc. | $ 6,859,480 | $ 3,930,582 | $ 9,382,778 | $ - | $ - |
China Suntien Green Energy Corp. Ltd. (H Shares) | 5,673,154 | 17,269,514 | 641,524 | 765,000 | 22,582,764 |
SREI Infrastructure Finance Ltd. | 22,963,624 | 5,096,230 | 4,160,863 | 285,589 | 17,681,250 |
Veripos | - | 5,502,835 | - | - | 7,361,301 |
Total | $ 35,496,258 | $ 31,799,161 | $ 14,185,165 | $ 1,050,589 | $ 47,625,315 |
Other Information |
Categorizations in the Schedule of Investments are based on country or territory of incorporation. |
The following is a summary of the inputs used, as of October 31, 2012, involving the Fund's assets and liabilities carried at fair value. The inputs or methodology used for valuing securities may not be an indication of the risk associated with investing in those securities. For more information on valuation inputs, and their aggregation into the levels used in the tables below, please refer to the Security Valuation section in the accompanying Notes to Financial Statements. |
Valuation Inputs at Reporting Date: |
Description | Total | Level 1 | Level 2 | Level 3 |
Investments in Securities: | | | | |
Equities: | | | | |
Consumer Discretionary | $ 470,026,812 | $ 470,026,812 | $ - | $ - |
Consumer Staples | 514,018,524 | 514,018,524 | - | - |
Energy | 704,549,553 | 704,549,553 | - | - |
Financials | 1,411,215,143 | 1,355,109,332 | 56,105,811 | - |
Health Care | 69,746,080 | 69,746,080 | - | - |
Industrials | 393,981,673 | 393,981,673 | - | - |
Information Technology | 765,574,965 | 659,953,261 | 105,621,704 | - |
Materials | 680,458,650 | 646,050,965 | 34,407,685 | - |
Telecommunica-
tion Services | 402,876,314 | 380,328,628 | 22,547,686 | - |
Utilities | 177,586,353 | 157,317,875 | 20,268,478 | - |
Money Market Funds | 199,895,616 | 199,895,616 | - | - |
Total Investments in Securities: | $ 5,789,929,683 | $ 5,550,978,319 | $ 238,951,364 | $ - |
The following is a summary of transfers between Level 1 and Level 2 for the period ended October 31, 2012. Transfers are assumed to have occurred at the beginning of the period, and are primarily attributable to the valuation techniques used for foreign equity securities, as discussed in the accompanying Notes to Financial Statements: |
Transfers | Total |
Level 1 to Level 2 | $ 0 |
Level 2 to Level 1 | $ 1,189,220,064 |
See accompanying notes which are an integral part of the financial statements.
Annual Report
Fidelity Series Emerging Markets Fund
Statement of Assets and Liabilities
| October 31, 2012 |
| | |
Assets | | |
Investment in securities, at value (including securities loaned of $59,320,549) - See accompanying schedule: Unaffiliated issuers (cost $5,092,553,100) | $ 5,542,408,752 | |
Fidelity Central Funds (cost $199,895,616) | 199,895,616 | |
Other affiliated issuers (cost $59,394,618) | 47,625,315 | |
Total Investments (cost $5,351,843,334) | | $ 5,789,929,683 |
Cash | | 21,456,142 |
Foreign currency held at value (cost $2,330,196) | | 2,331,098 |
Receivable for investments sold | | 42,873,973 |
Receivable for fund shares sold | | 3,219,112 |
Dividends receivable | | 7,383,221 |
Distributions receivable from Fidelity Central Funds | | 72,767 |
Other receivables | | 2,349,606 |
Total assets | | 5,869,615,602 |
| | |
Liabilities | | |
Payable for investments purchased | $ 43,313,062 | |
Payable for fund shares redeemed | 3,837,603 | |
Accrued management fee | 3,875,103 | |
Other affiliated payables | 650,278 | |
Other payables and accrued expenses | 963,629 | |
Collateral on securities loaned, at value | 63,552,588 | |
Total liabilities | | 116,192,263 |
| | |
Net Assets | | $ 5,753,423,339 |
Net Assets consist of: | | |
Paid in capital | | $ 5,567,408,558 |
Undistributed net investment income | | 73,362,140 |
Accumulated undistributed net realized gain (loss) on investments and foreign currency transactions | | (324,986,441) |
Net unrealized appreciation (depreciation) on investments and assets and liabilities in foreign currencies | | 437,639,082 |
Net Assets | | $ 5,753,423,339 |
See accompanying notes which are an integral part of the financial statements.
Annual Report
Statement of Assets and Liabilities - continued
| October 31, 2012 |
| | |
Series Emerging Markets: Net Asset Value, offering price and redemption price per share ($3,182,643,705 ÷ 195,907,010 shares) | | $ 16.25 |
| | |
Class F: Net Asset Value, offering price and redemption price per share ($2,570,779,634 ÷ 157,719,674 shares) | | $ 16.30 |
See accompanying notes which are an integral part of the financial statements.
Annual Report
Fidelity Series Emerging Markets Fund
Financial Statements - continued
Statement of Operations
| Year ended October 31, 2012 |
| | |
Investment Income | | |
Dividends (including $1,050,589 earned from other affiliated issuers) | | $ 143,476,164 |
Interest | | 5,413 |
Income from Fidelity Central Funds | | 678,098 |
Income before foreign taxes withheld | | 144,159,675 |
Less foreign taxes withheld | | (15,024,574) |
Total income | | 129,135,101 |
| | |
Expenses | | |
Management fee | $ 42,802,976 | |
Transfer agent fees | 6,529,370 | |
Accounting and security lending fees | 1,570,123 | |
Custodian fees and expenses | 3,140,060 | |
Independent trustees' compensation | 34,154 | |
Audit | 94,786 | |
Legal | 25,493 | |
Miscellaneous | 46,956 | |
Total expenses before reductions | 54,243,918 | |
Expense reductions | (1,691,372) | 52,552,546 |
Net investment income (loss) | | 76,582,555 |
Realized and Unrealized Gain (Loss) Net realized gain (loss) on: | | |
Investment securities: | | |
Unaffiliated issuers (net of foreign taxes of $(6,486)) | (271,293,702) | |
Other affiliated issuers | (4,642,756) | |
Foreign currency transactions | (4,893,298) | |
Total net realized gain (loss) | | (280,829,756) |
Change in net unrealized appreciation (depreciation) on: Investment securities (net of increase in deferred foreign taxes of $6,783) | 510,086,112 | |
Assets and liabilities in foreign currencies | (368,922) | |
Total change in net unrealized appreciation (depreciation) | | 509,717,190 |
Net gain (loss) | | 228,887,434 |
Net increase (decrease) in net assets resulting from operations | | $ 305,469,989 |
See accompanying notes which are an integral part of the financial statements.
Annual Report
Statement of Changes in Net Assets
| Year ended
October 31,
2012 | Year ended
October 31,
2011 |
Increase (Decrease) in Net Assets | | |
Operations | | |
Net investment income (loss) | $ 76,582,555 | $ 38,993,493 |
Net realized gain (loss) | (280,829,756) | 128,215,965 |
Change in net unrealized appreciation (depreciation) | 509,717,190 | (660,224,875) |
Net increase (decrease) in net assets resulting
from operations | 305,469,989 | (493,015,417) |
Distributions to shareholders from net investment income | (31,500,009) | (16,826,992) |
Distributions to shareholders from net realized gain | (158,430,172) | (109,835,879) |
Total distributions | (189,930,181) | (126,662,871) |
Share transactions - net increase (decrease) | 781,840,186 | 2,596,312,470 |
Total increase (decrease) in net assets | 897,379,994 | 1,976,634,182 |
| | |
Net Assets | | |
Beginning of period | 4,856,043,345 | 2,879,409,163 |
End of period (including undistributed net investment income of $73,362,140 and undistributed net investment income of $28,150,121, respectively) | $ 5,753,423,339 | $ 4,856,043,345 |
See accompanying notes which are an integral part of the financial statements.
Annual Report
Financial Highlights - Series Emerging Markets
Years ended October 31, | 2012 | 2011 | 2010 | 2009 G |
Selected Per-Share Data | | | | |
Net asset value, beginning of period | $ 16.06 | $ 18.85 | $ 16.38 | $ 10.00 |
Income from Investment Operations | | | | |
Net investment income (loss) D | .21 | .18 | .15 | .15 |
Net realized and unrealized gain (loss) | .59 | (2.19) | 4.03 | 6.27 |
Total from investment operations | .80 | (2.01) | 4.18 | 6.42 |
Distributions from net investment income | (.09) | (.10) | (.09) | (.04) |
Distributions from net realized gain | (.52) | (.68) | (1.62) | - |
Total distributions | (.61) | (.78) | (1.71) | (.04) |
Net asset value, end of period | $ 16.25 | $ 16.06 | $ 18.85 | $ 16.38 |
Total Return B, C | 5.40% | (11.26)% | 27.32% | 64.35% |
Ratios to Average Net Assets E, H | | | | |
Expenses before reductions | 1.10% | 1.12% | 1.15% | 1.21% A |
Expenses net of fee waivers, if any | 1.10% | 1.12% | 1.15% | 1.21% A |
Expenses net of all reductions | 1.07% | 1.07% | 1.08% | 1.09% A |
Net investment income (loss) | 1.37% | 1.00% | .89% | 1.15% A |
Supplemental Data | | | | |
Net assets, end of period (000 omitted) | $ 3,182,644 | $ 3,384,616 | $ 2,425,249 | $ 910,106 |
Portfolio turnover rate F | 80% | 104% | 92% | 109% A |
A Annualized
B Total returns for periods of less than one year are not annualized.
C Total returns would have been lower if certain expenses had not been reduced during the applicable periods shown.
D Calculated based on average shares outstanding during the period.
E Fees and expenses of any underlying Fidelity Central Funds are not included in the Fund's expense ratio. The Fund indirectly bears its proportionate share of the expenses of any underlying Fidelity Central Funds.
F Amount does not include the portfolio activity of any underlying Fidelity Central Funds.
G For the period December 9, 2008 (commencement of operations) to October 31, 2009.
H Expense ratios reflect operating expenses of the class. Expenses before reductions do not reflect amounts reimbursed by the investment adviser or reductions from brokerage service arrangements or reductions from other expense offset arrangements and do not represent the amount paid by the class during periods when reimbursements or reductions occur. Expense ratios before reductions for start-up periods may not be representative of longer-term operating periods. Expenses net of fee waivers reflect expenses after reimbursement by the investment adviser but prior to reductions from brokerage service arrangements or other expense offset arrangements. Expenses net of all reductions represent the net expenses paid by the class.
See accompanying notes which are an integral part of the financial statements.
Annual Report
Financial Highlights - Class F
Years ended October 31, | 2012 | 2011 | 2010 | 2009 G |
Selected Per-Share Data | | | | |
Net asset value, beginning of period | $ 16.11 | $ 18.90 | $ 16.40 | $ 13.91 |
Income from Investment Operations | | | | |
Net investment income (loss) D | .25 | .21 | .19 | .02 |
Net realized and unrealized gain (loss) | .58 | (2.19) | 4.03 | 2.47 |
Total from investment operations | .83 | (1.98) | 4.22 | 2.49 |
Distributions from net investment income | (.12) | (.13) | (.10) | - |
Distributions from net realized gain | (.52) | (.68) | (1.62) | - |
Total distributions | (.64) | (.81) | (1.72) | - |
Net asset value, end of period | $ 16.30 | $ 16.11 | $ 18.90 | $ 16.40 |
Total Return B, C | 5.60% | (11.07)% | 27.59% | 17.90% |
Ratios to Average Net Assets E, H | | | | |
Expenses before reductions | .90% | .91% | .92% | .93% A |
Expenses net of fee waivers, if any | .90% | .91% | .92% | .93% A |
Expenses net of all reductions | .87% | .86% | .85% | .82% A |
Net investment income (loss) | 1.57% | 1.21% | 1.13% | .28% A |
Supplemental Data | | | | |
Net assets, end of period (000 omitted) | $ 2,570,780 | $ 1,471,427 | $ 454,160 | $ 8,025 |
Portfolio turnover rate F | 80% | 104% | 92% | 109% A |
A Annualized
B Total returns for periods of less than one year are not annualized.
C Total returns would have been lower if certain expenses had not been reduced during the applicable periods shown.
D Calculated based on average shares outstanding during the period.
E Fees and expenses of any underlying Fidelity Central Funds are not included in the Fund's expense ratio. The Fund indirectly bears its proportionate share of the expenses of any underlying Fidelity Central Funds.
F Amount does not include the portfolio activity of any underlying Fidelity Central Funds.
G For the period June 26, 2009 (commencement of operations) to October 31, 2009.
H Expense ratios reflect operating expenses of the class. Expenses before reductions do not reflect amounts reimbursed by the investment adviser or reductions from brokerage service arrangements or reductions from other expense offset arrangements and do not represent the amount paid by the class during periods when reimbursements or reductions occur. Expense ratios before reductions for start-up periods may not be representative of longer-term operating periods. Expenses net of fee waivers reflect expenses after reimbursement by the investment adviser but prior to reductions from brokerage service arrangements or other expense offset arrangements. Expenses net of all reductions represent the net expenses paid by the class.
See accompanying notes which are an integral part of the financial statements.
Annual Report
Fidelity Series International Growth Fund
Average annual total return reflects the change in the value of an investment, assuming reinvestment of the class' distributions from dividend income and capital gains (the profits earned upon the sale of securities that have grown in value, if any) and assuming a constant rate of performance each year. The $10,000 table and the fund's returns do not reflect the deduction of taxes that a shareholder would pay on fund distributions or the redemption of fund shares. During periods of reimbursement by Fidelity, a fund's total return will be greater than it would be had the reimbursement not occurred. How a fund did yesterday is no guarantee of how it will do tomorrow.
Average Annual Total Returns
Periods ended October 31, 2012 | Past 1
year | Life of
fund A |
Fidelity Series International Growth Fund | 11.00% | 5.70% |
Class F | 11.23% | 5.95% |
A From December 3, 2009.
$10,000 Over Life of Fund
Let's say hypothetically that $10,000 was invested in Fidelity Series International Growth Fund, a class of the fund, on December 3, 2009, when the fund started. The chart shows how the value of your investment would have changed, and also shows how the MSCI EAFE ® Growth Index performed over the same period.
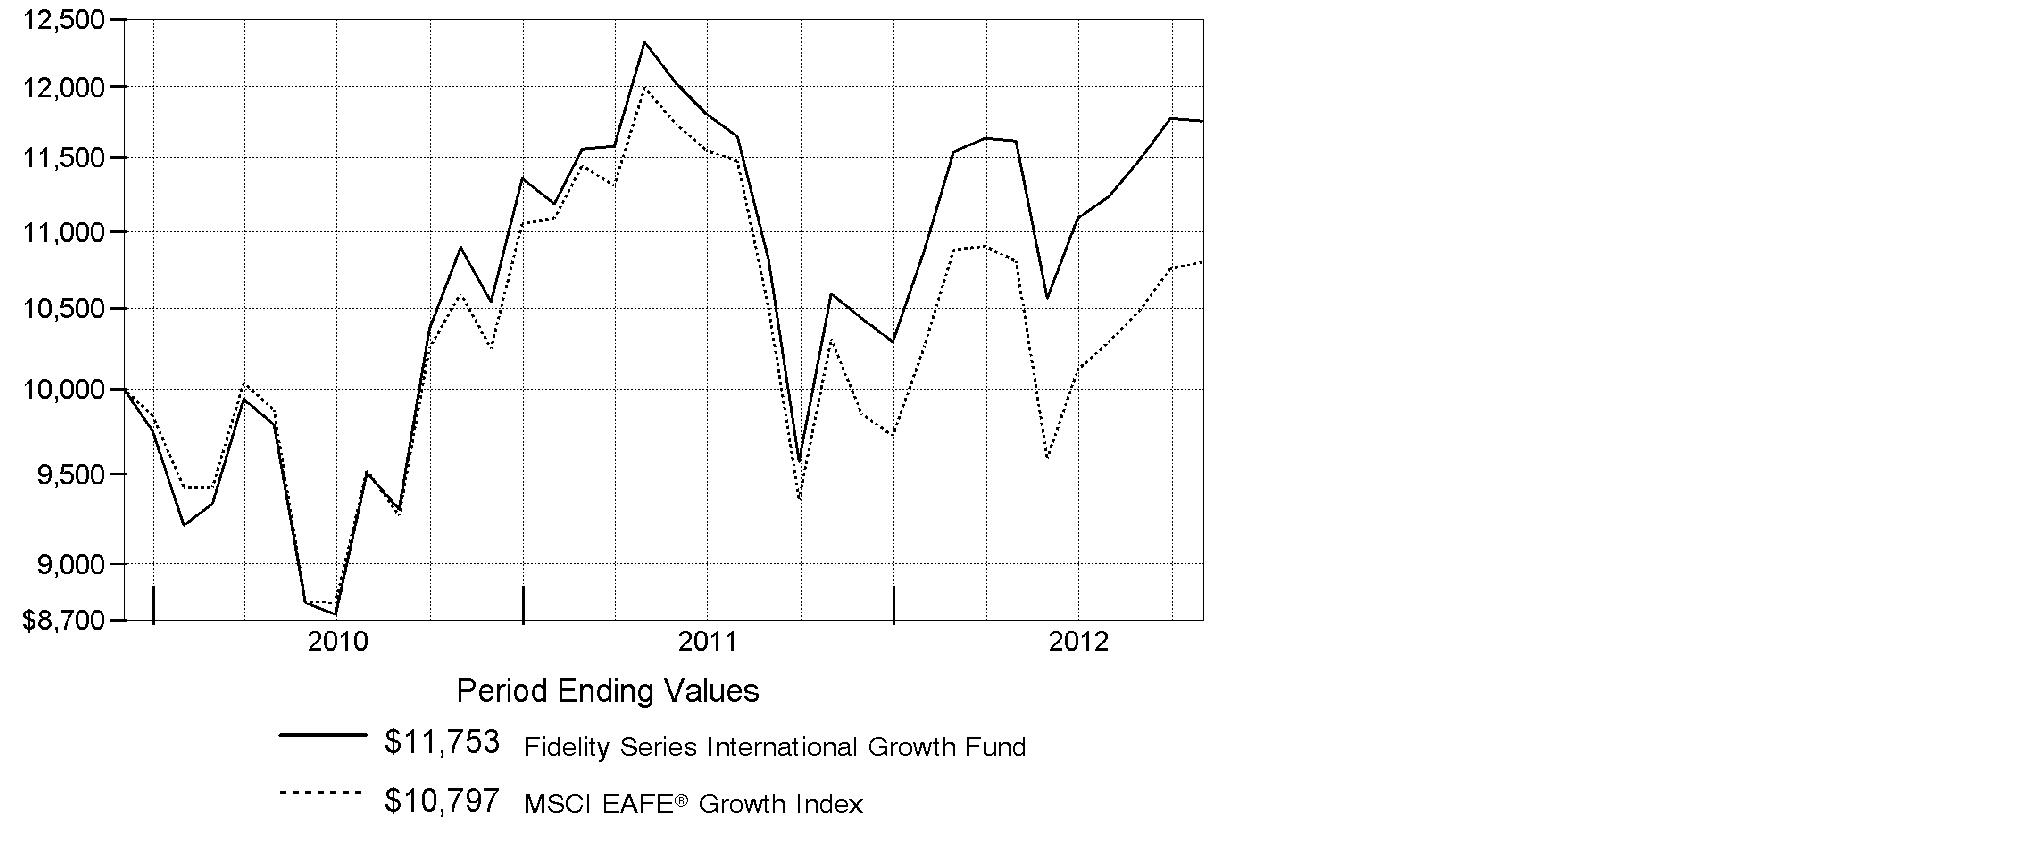
Annual Report
Fidelity Series International Growth Fund
Market Recap: International stocks experienced pendulum-like swings during the 12 months ending October 31, 2012, finishing the period with a modest advance. The market faced periodic bouts of volatility this past year, as a number of macroeconomic concerns - including the eurozone debt crisis, the strength and pace of the U.S. economic recovery, and a slowdown in China's once-blistering growth - dominated headlines and weighed on investors. While a stronger U.S. dollar provided an additional head wind, foreign developed- and emerging-markets stocks still managed a gain for the 12 months, as the MSCI® ACWI® (All Country World Index) ex USA Index rose 4.11%, largely buttressed in the summertime by pledges of accommodative monetary action from eurozone officials, as well as signs that the U.S. housing market was on the mend. Within the index, Asia-Pacific ex Japan showed the most impressive gains, advancing roughly 11%. A number of core European components, most notably Germany (+11%), Switzerland (+10%) and the U.K. (+9%), benefited from optimism about the eurozone's ability to resolve its debt woes, which also helped the region outpace the index overall. Elsewhere, results from Canada (+3%) and the generally more volatile emerging markets (+2%) each fell short of the MSCI index, while Japan was among the few benchmark constituents to finish in the red, returning about -3%.
Comments from Jed Weiss, Portfolio Manager of Fidelity® Series International Growth Fund: For the year, the fund's Series International Growth and Class F shares gained 11.00% and 11.23%, respectively, easily outpacing the 4.77% advance of the MSCI® EAFE® Growth Index. Following the fund's bottom-up stock selection strategy, portfolio positioning in Japan and Europe was especially helpful. An out-of-benchmark allocation to globally oriented U.S.-based stocks also contributed, while stock picking in Canada was modestly negative. In sector terms, security selection was very strong in information technology, materials, industrials, consumer discretionary and health care, while my picks in only two groups - energy and telecommunication services - had a negative impact. The top individual contributor was Belgian brewer Anheuser-Busch InBev, while in health care, Australian biotechnology company CSL and Denmark's Novo Nordisk also added value. U.S.-based credit card networks MasterCard and Visa, neither of which is in the index, were additional contributors. In contrast, not owning Diageo, a strong-performing U.K.-based spirits company and benchmark component, hurt. Other notable detractors were U.K. natural gas producer BG Group and Bharti Airtel, an Indian telecommunication services provider and non-index stock that I sold before period end.
The views expressed above reflect those of the portfolio manager(s) only through the end of the period as stated on the cover of this report and do not necessarily represent the views of Fidelity or any other person in the Fidelity organization. Any such views are subject to change at any time based upon market or other conditions and Fidelity disclaims any responsibility to update such views. These views may not be relied on as investment advice and, because investment decisions for a Fidelity fund are based on numerous factors, may not be relied on as an indication of trading intent on behalf of any Fidelity fund.
Annual Report
Fidelity Series International Growth Fund
Investment Changes (Unaudited)
Geographic Diversification (% of fund's net assets) |
As of October 31, 2012 |
| United States of America 18.9% | |
| United Kingdom 18.3% | |
| Japan 10.7% | |
| Switzerland 8.9% | |
| Australia 5.3% | |
| Belgium 4.7% | |
| France 3.5% | |
| Germany 3.3% | |
| Denmark 3.2% | |
| Other 23.2% | |

Percentages are based on country or territory of incorporation and are adjusted for the effect of futures contracts, if applicable. |
As of April 30, 2012 |
| United Kingdom 18.3% | |
| United States of America 17.6% | |
| Japan 10.4% | |
| Switzerland 9.3% | |
| Belgium 4.2% | |
| Australia 4.0% | |
| Germany 3.8% | |
| France 3.5% | |
| Denmark 3.3% | |
| Other 25.6% | |

Percentages are based on country or territory of incorporation and are adjusted for the effect of futures contracts, if applicable. |
Asset Allocation |
| % of fund's
net assets | % of fund's net assets
6 months ago |
Stocks | 97.2 | 97.9 |
Short-Term Investments and Net Other Assets (Liabilities) | 2.8 | 2.1 |
Top Ten Stocks as of October 31, 2012 |
| % of fund's
net assets | % of fund's net assets
6 months ago |
Nestle SA (Switzerland, Food Products) | 5.0 | 4.8 |
Anheuser-Busch InBev SA NV (Belgium, Beverages) | 3.7 | 3.3 |
Novo Nordisk A/S Series B sponsored ADR (Denmark, Pharmaceuticals) | 2.7 | 2.5 |
Linde AG (Germany, Chemicals) | 2.5 | 2.3 |
GlaxoSmithKline PLC sponsored ADR (United Kingdom, Pharmaceuticals) | 2.5 | 1.7 |
BG Group PLC (United Kingdom, Oil, Gas & Consumable Fuels) | 2.4 | 2.8 |
Roche Holding AG (participation certificate) (Switzerland, Pharmaceuticals) | 2.2 | 2.0 |
Philip Morris International, Inc. (United States of America, Tobacco) | 2.1 | 1.8 |
Standard Chartered PLC (United Kingdom) (United Kingdom, Commercial Banks) | 2.0 | 1.9 |
CSL Ltd. (Australia, Biotechnology) | 2.0 | 1.5 |
| 27.1 | |
Market Sectors as of October 31, 2012 |
| % of fund's
net assets | % of fund's net assets
6 months ago |
Consumer Staples | 23.2 | 22.2 |
Consumer Discretionary | 14.3 | 15.1 |
Industrials | 14.1 | 13.4 |
Materials | 12.8 | 13.7 |
Health Care | 11.4 | 9.5 |
Information Technology | 8.3 | 7.6 |
Financials | 7.6 | 11.2 |
Energy | 5.5 | 4.7 |
Telecommunication Services | 0.0 | 0.5 |
Annual Report
Fidelity Series International Growth Fund
Investments October 31, 2012
Showing Percentage of Net Assets
Common Stocks - 97.2% |
| Shares | | Value |
Australia - 5.3% |
Coca-Cola Amatil Ltd. | 6,254,199 | | $ 87,319,704 |
CSL Ltd. | 3,637,640 | | 179,362,480 |
Newcrest Mining Ltd. | 1,582,820 | | 43,425,714 |
Newcrest Mining Ltd. sponsored ADR | 775,486 | | 21,519,737 |
Sydney Airport unit | 7,293,521 | | 25,665,824 |
Woodside Petroleum Ltd. | 1,831,844 | | 65,413,171 |
WorleyParsons Ltd. | 2,359,520 | | 60,424,225 |
TOTAL AUSTRALIA | | 483,130,855 |
Austria - 1.1% |
Andritz AG | 1,507,298 | | 90,787,710 |
Zumtobel AG | 1,035,497 | | 11,063,420 |
TOTAL AUSTRIA | | 101,851,130 |
Bailiwick of Jersey - 1.1% |
Informa PLC | 3,498,713 | | 22,595,485 |
Randgold Resources Ltd. sponsored ADR | 637,465 | | 76,234,439 |
TOTAL BAILIWICK OF JERSEY | | 98,829,924 |
Belgium - 4.7% |
Anheuser-Busch InBev SA NV | 3,982,181 | | 333,034,413 |
Umicore SA | 1,761,453 | | 90,399,634 |
TOTAL BELGIUM | | 423,434,047 |
Bermuda - 0.9% |
Lazard Ltd. Class A | 867,948 | | 25,569,748 |
Li & Fung Ltd. | 25,863,000 | | 43,382,817 |
Trinity Ltd. | 18,060,000 | | 12,653,570 |
TOTAL BERMUDA | | 81,606,135 |
Brazil - 1.1% |
Arezzo Industria e Comercio SA | 1,436,200 | | 25,633,170 |
Iguatemi Empresa de Shopping Centers SA | 1,994,400 | | 25,334,443 |
Multiplan Empreendimentos Imobiliarios SA | 1,534,800 | | 44,962,261 |
TOTAL BRAZIL | | 95,929,874 |
Canada - 2.0% |
Agnico-Eagle Mines Ltd. (Canada) | 725,500 | | 40,962,148 |
Fairfax Financial Holdings Ltd. (sub. vtg.) | 85,200 | | 31,606,961 |
First Quantum Minerals Ltd. | 1,246,615 | | 28,021,534 |
Common Stocks - continued |
| Shares | | Value |
Canada - continued |
Goldcorp, Inc. | 1,345,700 | | $ 60,834,398 |
Open Text Corp. (a) | 418,500 | | 22,493,197 |
TOTAL CANADA | | 183,918,238 |
Cayman Islands - 1.7% |
Baidu.com, Inc. sponsored ADR (a) | 368,820 | | 39,323,588 |
Sands China Ltd. | 30,076,800 | | 113,126,847 |
TOTAL CAYMAN ISLANDS | | 152,450,435 |
Denmark - 3.2% |
Novo Nordisk A/S Series B sponsored ADR | 1,570,166 | | 251,681,908 |
William Demant Holding A/S (a) | 497,500 | | 42,788,449 |
TOTAL DENMARK | | 294,470,357 |
Finland - 1.5% |
Nokian Tyres PLC | 2,676,392 | | 111,008,176 |
Outotec Oyj | 548,918 | | 26,730,306 |
TOTAL FINLAND | | 137,738,482 |
France - 3.5% |
Alstom SA | 2,281,801 | | 77,931,611 |
Danone SA | 2,145,705 | | 131,896,302 |
Remy Cointreau SA (d) | 432,301 | | 44,837,362 |
Safran SA | 1,569,786 | | 62,454,445 |
TOTAL FRANCE | | 317,119,720 |
Germany - 3.3% |
alstria office REIT-AG | 612,930 | | 7,402,678 |
Linde AG | 1,359,819 | | 228,688,190 |
Siemens AG sponsored ADR (d) | 592,255 | | 59,764,452 |
TOTAL GERMANY | | 295,855,320 |
Ireland - 1.8% |
CRH PLC sponsored ADR | 3,351,500 | | 62,505,475 |
Elan Corp. PLC sponsored ADR (a) | 3,010,831 | | 32,516,975 |
James Hardie Industries NV CDI | 7,313,193 | | 70,069,176 |
TOTAL IRELAND | | 165,091,626 |
Israel - 0.2% |
Azrieli Group | 899,186 | | 20,073,752 |
Common Stocks - continued |
| Shares | | Value |
Italy - 0.9% |
Fiat Industrial SpA | 5,353,700 | | $ 57,977,002 |
Interpump Group SpA | 2,890,349 | | 21,953,470 |
TOTAL ITALY | | 79,930,472 |
Japan - 10.7% |
Autobacs Seven Co. Ltd. | 843,600 | | 34,608,418 |
Denso Corp. | 3,980,100 | | 124,593,133 |
Fanuc Corp. | 836,000 | | 133,102,342 |
Fast Retailing Co. Ltd. | 345,800 | | 77,017,712 |
Japan Tobacco, Inc. | 1,420,200 | | 39,245,411 |
JS Group Corp. | 1,563,800 | | 34,574,809 |
Keyence Corp. | 458,000 | | 121,513,716 |
Kobayashi Pharmaceutical Co. Ltd. | 705,500 | | 37,250,188 |
Mitsui Fudosan Co. Ltd. | 2,740,000 | | 55,362,896 |
Nintendo Co. Ltd. | 361,100 | | 46,500,163 |
Osaka Securities Exchange Co. Ltd. | 749 | | 2,791,275 |
SHO-BOND Holdings Co. Ltd. | 849,400 | | 25,674,586 |
SMC Corp. | 253,000 | | 39,868,971 |
Unicharm Corp. | 1,090,500 | | 59,012,401 |
USS Co. Ltd. | 975,780 | | 102,552,852 |
Yamato Kogyo Co. Ltd. | 1,574,000 | | 44,185,569 |
TOTAL JAPAN | | 977,854,442 |
Netherlands - 2.2% |
ASML Holding NV | 2,980,400 | | 163,832,588 |
D.E. Master Blenders 1753 NV (a) | 2,911,841 | | 35,586,769 |
TOTAL NETHERLANDS | | 199,419,357 |
Portugal - 1.2% |
Jeronimo Martins SGPS SA | 6,117,479 | | 107,043,801 |
South Africa - 0.6% |
Clicks Group Ltd. | 5,270,927 | | 36,340,530 |
JSE Ltd. | 2,444,907 | | 19,831,306 |
TOTAL SOUTH AFRICA | | 56,171,836 |
Spain - 1.7% |
Inditex SA | 882,703 | | 112,626,730 |
Prosegur Compania de Seguridad SA (Reg.) | 7,458,459 | | 40,602,583 |
TOTAL SPAIN | | 153,229,313 |
Sweden - 3.2% |
ASSA ABLOY AB (B Shares) | 2,135,539 | | 71,185,707 |
Fagerhult AB | 335,870 | | 8,304,464 |
Common Stocks - continued |
| Shares | | Value |
Sweden - continued |
H&M Hennes & Mauritz AB (B Shares) | 3,501,525 | | $ 118,514,129 |
Intrum Justitia AB | 1,097,000 | | 15,877,218 |
Swedish Match Co. AB | 2,364,400 | | 80,561,203 |
TOTAL SWEDEN | | 294,442,721 |
Switzerland - 8.9% |
Nestle SA | 7,235,365 | | 459,153,941 |
Roche Holding AG (participation certificate) | 1,049,429 | | 201,817,603 |
Schindler Holding AG: | | | |
(participation certificate) | 383,924 | | 50,582,492 |
(Reg.) | 79,700 | | 10,312,305 |
Swatch Group AG (Bearer) | 119,120 | | 49,295,445 |
UBS AG (NY Shares) | 2,829,713 | | 42,502,289 |
TOTAL SWITZERLAND | | 813,664,075 |
Turkey - 2.0% |
Anadolu Efes Biracilik Ve Malt Sanayii A/S | 1,540,623 | | 23,120,089 |
Coca-Cola Icecek A/S | 3,117,007 | | 60,514,278 |
Turkiye Garanti Bankasi A/S | 12,891,000 | | 61,560,368 |
Turkiye Petrol Rafinerile A/S | 1,510,000 | | 36,897,071 |
TOTAL TURKEY | | 182,091,806 |
United Kingdom - 18.3% |
Anglo American PLC (United Kingdom) | 1,579,500 | | 48,505,912 |
Babcock International Group PLC | 3,851,500 | | 60,786,203 |
BG Group PLC | 11,838,372 | | 219,220,383 |
BHP Billiton PLC ADR (d) | 2,664,890 | | 170,499,662 |
GlaxoSmithKline PLC sponsored ADR | 5,044,568 | | 226,501,103 |
InterContinental Hotel Group PLC ADR | 4,009,187 | | 98,706,184 |
Johnson Matthey PLC | 2,170,027 | | 78,757,305 |
Reckitt Benckiser Group PLC | 2,397,387 | | 145,079,373 |
Rexam PLC | 6,282,808 | | 45,290,383 |
Rolls-Royce Group PLC | 7,041,111 | | 97,093,356 |
Rolls-Royce Group PLC Class C | 535,124,436 | | 863,557 |
Rotork PLC | 1,473,797 | | 54,178,583 |
SABMiller PLC | 3,211,183 | | 137,557,426 |
Serco Group PLC | 5,453,002 | | 49,850,765 |
Shaftesbury PLC | 2,730,400 | | 24,145,883 |
Standard Chartered PLC (United Kingdom) | 7,676,008 | | 181,286,056 |
Common Stocks - continued |
| Shares | | Value |
United Kingdom - continued |
Unite Group PLC | 4,500,300 | | $ 20,559,739 |
Victrex PLC | 497,107 | | 11,431,442 |
TOTAL UNITED KINGDOM | | 1,670,313,315 |
United States of America - 16.1% |
Allergan, Inc. | 607,800 | | 54,653,376 |
Amazon.com, Inc. (a) | 252,701 | | 58,833,847 |
Autoliv, Inc. (d) | 1,530,900 | | 88,179,840 |
Berkshire Hathaway, Inc. Class B (a) | 1,065,682 | | 92,021,641 |
BorgWarner, Inc. (a) | 934,957 | | 61,538,870 |
CME Group, Inc. | 718,000 | | 40,157,740 |
Cummins, Inc. | 349,596 | | 32,715,194 |
Cymer, Inc. (a) | 457,779 | | 36,480,409 |
FMC Technologies, Inc. (a) | 1,145,609 | | 46,855,408 |
Freeport-McMoRan Copper & Gold, Inc. | 625,400 | | 24,315,552 |
Martin Marietta Materials, Inc. (d) | 268,300 | | 22,083,773 |
MasterCard, Inc. Class A | 364,991 | | 168,235,302 |
Mead Johnson Nutrition Co. Class A | 1,402,800 | | 86,496,648 |
Mohawk Industries, Inc. (a) | 589,215 | | 49,181,776 |
National Oilwell Varco, Inc. | 947,211 | | 69,809,451 |
Philip Morris International, Inc. | 2,128,792 | | 188,525,820 |
PriceSmart, Inc. | 338,975 | | 28,131,535 |
ResMed, Inc. | 1,333,300 | | 53,252,002 |
Solera Holdings, Inc. | 514,041 | | 24,062,259 |
SS&C Technologies Holdings, Inc. (a) | 922,800 | | 22,174,884 |
Union Pacific Corp. | 778,300 | | 95,754,249 |
Visa, Inc. Class A | 890,099 | | 123,510,137 |
TOTAL UNITED STATES OF AMERICA | | 1,466,969,713 |
TOTAL COMMON STOCKS (Cost $7,559,520,031) |
8,852,630,746
|
Money Market Funds - 3.9% |
| Shares | | Value |
Fidelity Cash Central Fund, 0.19% (b) | 268,054,407 | | $ 268,054,407 |
Fidelity Securities Lending Cash Central Fund, 0.19% (b)(c) | 90,071,620 | | 90,071,620 |
TOTAL MONEY MARKET FUNDS (Cost $358,126,027) |
358,126,027
|
TOTAL INVESTMENT PORTFOLIO - 101.1% (Cost $7,917,646,058) | | 9,210,756,773 |
NET OTHER ASSETS (LIABILITIES) - (1.1)% | | (101,248,953) |
NET ASSETS - 100% | $ 9,109,507,820 |
Legend |
(a) Non-income producing |
(b) Affiliated fund that is available only to investment companies and other accounts managed by Fidelity Investments. The rate quoted is the annualized seven-day yield of the fund at period end. A complete unaudited listing of the fund's holdings as of its most recent quarter end is available upon request. In addition, each Fidelity Central Fund's financial statements, which are not covered by the Fund's Report of Independent Registered Public Accounting Firm, are available on the SEC's website or upon request. |
(c) Investment made with cash collateral received from securities on loan. |
(d) Security or a portion of the security is on loan at period end. |
Affiliated Central Funds |
Information regarding fiscal year to date income earned by the Fund from investments in Fidelity Central Funds is as follows: |
Fund | Income earned |
Fidelity Cash Central Fund | $ 414,798 |
Fidelity Securities Lending Cash Central Fund | 3,513,538 |
Total | $ 3,928,336 |
Other Information |
Categorizations in the Schedule of Investments are based on country or territory of incorporation. |
The following is a summary of the inputs used, as of October 31, 2012, involving the Fund's assets and liabilities carried at fair value. The inputs or methodology used for valuing securities may not be an indication of the risk associated with investing in those securities. For more information on valuation inputs, and their aggregation into the levels used in the tables below, please refer to the Security Valuation section in the accompanying Notes to Financial Statements. |
Valuation Inputs at Reporting Date: |
Description | Total | Level 1 | Level 2 | Level 3 |
Investments in Securities: | | | | |
Equities: | | | | |
Consumer Discretionary | $ 1,304,049,001 | $ 1,304,049,001 | $ - | $ - |
Consumer Staples | 2,120,707,194 | 1,787,672,781 | 333,034,413 | - |
Energy | 498,619,709 | 498,619,709 | - | - |
Financials | 695,169,036 | 695,169,036 | - | - |
Health Care | 1,042,573,896 | 1,042,573,896 | - | - |
Industrials | 1,255,655,624 | 1,255,655,624 | - | - |
Information Technology | 768,126,243 | 768,126,243 | - | - |
Materials | 1,167,730,043 | 1,167,730,043 | - | - |
Money Market Funds | 358,126,027 | 358,126,027 | - | - |
Total Investments in Securities: | $ 9,210,756,773 | $ 8,877,722,360 | $ 333,034,413 | $ - |
The following is a summary of transfers between Level 1 and Level 2 for the period ended October 31, 2012. Transfers are assumed to have occurred at the beginning of the period, and are primarily attributable to the valuation techniques used for foreign equity securities, as discussed in the accompanying Notes to Financial Statements: |
Transfers | Total |
Level 1 to Level 2 | $ 0 |
Level 2 to Level 1 | $ 926,744,491 |
See accompanying notes which are an integral part of the financial statements.
Annual Report
Fidelity Series International Growth Fund
Statement of Assets and Liabilities
| October 31, 2012 |
| | |
Assets | | |
Investment in securities, at value (including securities loaned of $89,088,941) - See accompanying schedule: Unaffiliated issuers (cost $7,559,520,031) | $ 8,852,630,746 | |
Fidelity Central Funds (cost $358,126,027) | 358,126,027 | |
Total Investments (cost $7,917,646,058) | | $ 9,210,756,773 |
Foreign currency held at value (cost $129,439) | | 129,449 |
Receivable for investments sold | | 7,115,082 |
Receivable for fund shares sold | | 5,097,417 |
Dividends receivable | | 18,551,712 |
Distributions receivable from Fidelity Central Funds | | 82,795 |
Other receivables | | 120,816 |
Total assets | | 9,241,854,044 |
| | |
Liabilities | | |
Payable for investments purchased | $ 28,624,242 | |
Payable for fund shares redeemed | 6,056,263 | |
Accrued management fee | 6,343,835 | |
Other affiliated payables | 972,716 | |
Other payables and accrued expenses | 277,548 | |
Collateral on securities loaned, at value | 90,071,620 | |
Total liabilities | | 132,346,224 |
| | |
Net Assets | | $ 9,109,507,820 |
Net Assets consist of: | | |
Paid in capital | | $ 8,047,297,843 |
Undistributed net investment income | | 115,582,243 |
Accumulated undistributed net realized gain (loss) on investments and foreign currency transactions | | (346,041,912) |
Net unrealized appreciation (depreciation) on investments and assets and liabilities in foreign currencies | | 1,292,669,646 |
Net Assets | | $ 9,109,507,820 |
See accompanying notes which are an integral part of the financial statements.
Annual Report
Statement of Assets and Liabilities - continued
| October 31, 2012 |
| | |
Series International Growth:
Net Asset Value, offering price and redemption price per share ($5,045,151,111 ÷ 436,664,982 shares) | | $ 11.55 |
| | |
Class F: Net Asset Value, offering price and redemption price per share ($4,064,356,709 ÷ 350,685,892 shares) | | $ 11.59 |
See accompanying notes which are an integral part of the financial statements.
Annual Report
Fidelity Series International Growth Fund
Financial Statements - continued
Statement of Operations
| Year ended October 31, 2012 |
| | |
Investment Income | | |
Dividends | | $ 210,743,281 |
Interest | | 2,848 |
Income from Fidelity Central Funds | | 3,928,336 |
Income before foreign taxes withheld | | 214,674,465 |
Less foreign taxes withheld | | (13,904,387) |
Total income | | 200,770,078 |
| | |
Expenses | | |
Management fee
Basic fee | $ 58,483,415 | |
Performance adjustment | 9,026,682 | |
Transfer agent fees | 10,136,552 | |
Accounting and security lending fees | 1,739,716 | |
Custodian fees and expenses | 904,423 | |
Independent trustees' compensation | 53,195 | |
Audit | 71,001 | |
Legal | 32,372 | |
Miscellaneous | 76,903 | |
Total expenses before reductions | 80,524,259 | |
Expense reductions | (686,362) | 79,837,897 |
Net investment income (loss) | | 120,932,181 |
Realized and Unrealized Gain (Loss) Net realized gain (loss) on: | | |
Investment securities: | | |
Unaffiliated issuers | (173,096,752) | |
Foreign currency transactions | (1,476,292) | |
Total net realized gain (loss) | | (174,573,044) |
Change in net unrealized appreciation (depreciation) on: Investment securities (net of decrease in deferred foreign taxes of $37,564) | 937,994,877 | |
Assets and liabilities in foreign currencies | (466,709) | |
Total change in net unrealized appreciation (depreciation) | | 937,528,168 |
Net gain (loss) | | 762,955,124 |
Net increase (decrease) in net assets resulting from operations | | $ 883,887,305 |
See accompanying notes which are an integral part of the financial statements.
Annual Report
Statement of Changes in Net Assets
| Year ended
October 31,
2012 | Year ended
October 31,
2011 |
Increase (Decrease) in Net Assets | | |
Operations | | |
Net investment income (loss) | $ 120,932,181 | $ 88,532,076 |
Net realized gain (loss) | (174,573,044) | (130,475,418) |
Change in net unrealized appreciation (depreciation) | 937,528,168 | (207,710,996) |
Net increase (decrease) in net assets resulting
from operations | 883,887,305 | (249,654,338) |
Distributions to shareholders from net investment income | (86,292,993) | (25,269,633) |
Distributions to shareholders from net realized gain | (4,902,084) | (4,689,987) |
Total distributions | (91,195,077) | (29,959,620) |
Share transactions - net increase (decrease) | 1,153,946,734 | 2,754,034,772 |
Total increase (decrease) in net assets | 1,946,638,962 | 2,474,420,814 |
| | |
Net Assets | | |
Beginning of period | 7,162,868,858 | 4,688,448,044 |
End of period (including undistributed net investment income of $115,582,243 and undistributed net investment income of $81,593,479, respectively) | $ 9,109,507,820 | $ 7,162,868,858 |
See accompanying notes which are an integral part of the financial statements.
Annual Report
Financial Highlights - Series International Growth
Years ended October 31, | 2012 | 2011 | 2010 G |
Selected Per-Share Data | | | |
Net asset value, beginning of period | $ 10.53 | $ 10.89 | $ 10.00 |
Income from Investment Operations | | | |
Net investment income (loss) D | .15 | .16 | .09 |
Net realized and unrealized gain (loss) | .99 | (.46) | .80 |
Total from investment operations | 1.14 | (.30) | .89 |
Distributions from net investment income | (.12) | (.05) | - |
Distributions from net realized gain | (.01) | (.01) | - |
Total distributions | (.12) I | (.06) | - |
Net asset value, end of period | $ 11.55 | $ 10.53 | $ 10.89 |
Total Return B,C | 11.00% | (2.77)% | 8.90% |
Ratios to Average Net Assets E,H | | | |
Expenses before reductions | 1.05% | 1.00% | 1.01% A |
Expenses net of fee waivers, if any | 1.05% | 1.00% | 1.01% A |
Expenses net of all reductions | 1.04% | .98% | .99% A |
Net investment income (loss) | 1.38% | 1.40% | 1.06% A |
Supplemental Data | | | |
Net assets, end of period (000 omitted) | $ 5,045,151 | $ 4,996,927 | $ 3,944,123 |
Portfolio turnover rate F | 27% | 23% | 63% A |
A Annualized
B Total returns for periods of less than one year are not annualized.
C Total returns would have been lower if certain expenses had not been reduced during the applicable periods shown.
D Calculated based on average shares outstanding during the period.
E Fees and expenses of any underlying Fidelity Central Funds are not included in the Fund's expense ratio. The Fund indirectly bears its proportionate share of the expenses of any underlying Fidelity Central Funds.
F Amount does not include the portfolio activity of any underlying Fidelity Central Funds.
G For the period December 3, 2009 (commencement of operations) to October 31, 2010.
H Expense ratios reflect operating expenses of the class. Expenses before reductions do not reflect amounts reimbursed by the investment adviser or reductions from brokerage service arrangements or reductions from other expense offset arrangements and do not represent the amount paid by the class during periods when reimbursements or reductions occur. Expense ratios before reductions for start-up periods may not be representative of longer-term operating periods. Expenses net of fee waivers reflect expenses after reimbursement by the investment adviser but prior to reductions from brokerage service arrangements or other expense offset arrangements. Expenses net of all reductions represent the net expenses paid by the class.
I Total distributions of $.12 per share is comprised of distributions from net investment income of $.115 and distributions from net realized gain of $.007 per share.
See accompanying notes which are an integral part of the financial statements.
Annual Report
Financial Highlights - Class F
Years ended October 31, | 2012 | 2011 | 2010 G |
Selected Per-Share Data | | | |
Net asset value, beginning of period | $ 10.57 | $ 10.91 | $ 10.00 |
Income from Investment Operations | | | |
Net investment income (loss) D | .17 | .18 | .11 |
Net realized and unrealized gain (loss) | 1.00 | (.45) | .80 |
Total from investment operations | 1.17 | (.27) | .91 |
Distributions from net investment income | (.14) | (.06) | - |
Distributions from net realized gain | (.01) | (.01) | - |
Total distributions | (.15) | (.07) | - |
Net asset value, end of period | $ 11.59 | $ 10.57 | $ 10.91 |
Total Return B,C | 11.23% | (2.50)% | 9.10% |
Ratios to Average Net Assets E,H | | | |
Expenses before reductions | .85% | .79% | .78% A |
Expenses net of fee waivers, if any | .85% | .79% | .78% A |
Expenses net of all reductions | .84% | .77% | .75% A |
Net investment income (loss) | 1.58% | 1.62% | 1.29% A |
Supplemental Data | | | |
Net assets, end of period (000 omitted) | $ 4,064,357 | $ 2,165,942 | $ 744,325 |
Portfolio turnover rate F | 27% | 23% | 63% A |
A Annualized
B Total returns for periods of less than one year are not annualized.
C Total returns would have been lower if certain expenses had not been reduced during the applicable periods shown.
D Calculated based on average shares outstanding during the period.
E Fees and expenses of any underlying Fidelity Central Funds are not included in the Fund's expense ratio. The Fund indirectly bears its proportionate share of the expenses of any underlying Fidelity Central Funds.
F Amount does not include the portfolio activity of any underlying Fidelity Central Funds.
G For the period December 3, 2009 (commencement of operations) to October 31, 2010.
H Expense ratios reflect operating expenses of the class. Expenses before reductions do not reflect amounts reimbursed by the investment adviser or reductions from brokerage service arrangements or reductions from other expense offset arrangements and do not represent the amount paid by the class during periods when reimbursements or reductions occur. Expense ratios before reductions for start-up periods may not be representative of longer-term operating periods. Expenses net of fee waivers reflect expenses after reimbursement by the investment adviser but prior to reductions from brokerage service arrangements or other expense offset arrangements. Expenses net of all reductions represent the net expenses paid by the class.
See accompanying notes which are an integral part of the financial statements.
Annual Report
Fidelity Series International Small Cap Fund
Average annual total return reflects the change in the value of an investment, assuming reinvestment of the class' distributions from dividend income and capital gains (the profits earned upon the sale of securities that have grown in value, if any) and assuming a constant rate of performance each year. The $10,000 table and the fund's returns do not reflect the deduction of taxes that a shareholder would pay on fund distributions or the redemption of fund shares. During periods of reimbursement by Fidelity, a fund's total return will be greater than it would be had the reimbursement not occurred. How a fund did yesterday is no guarantee of how it will do tomorrow.
Average Annual Total Returns
Periods ended October 31, 2012 | Past 1
year | Life of
fund A |
Fidelity Series International Small Cap Fund | 12.07% | 8.69% |
Class F | 12.25% | 8.92% |
A From December 3, 2009.
$10,000 Over Life of Fund
Let's say hypothetically that $10,000 was invested in Fidelity Series International Small Cap Fund, a class of the fund, on December 3, 2009, when the fund started. The chart shows how the value of your investment would have changed, and also shows how the MSCI EAFE Small Cap Index performed over the same period.
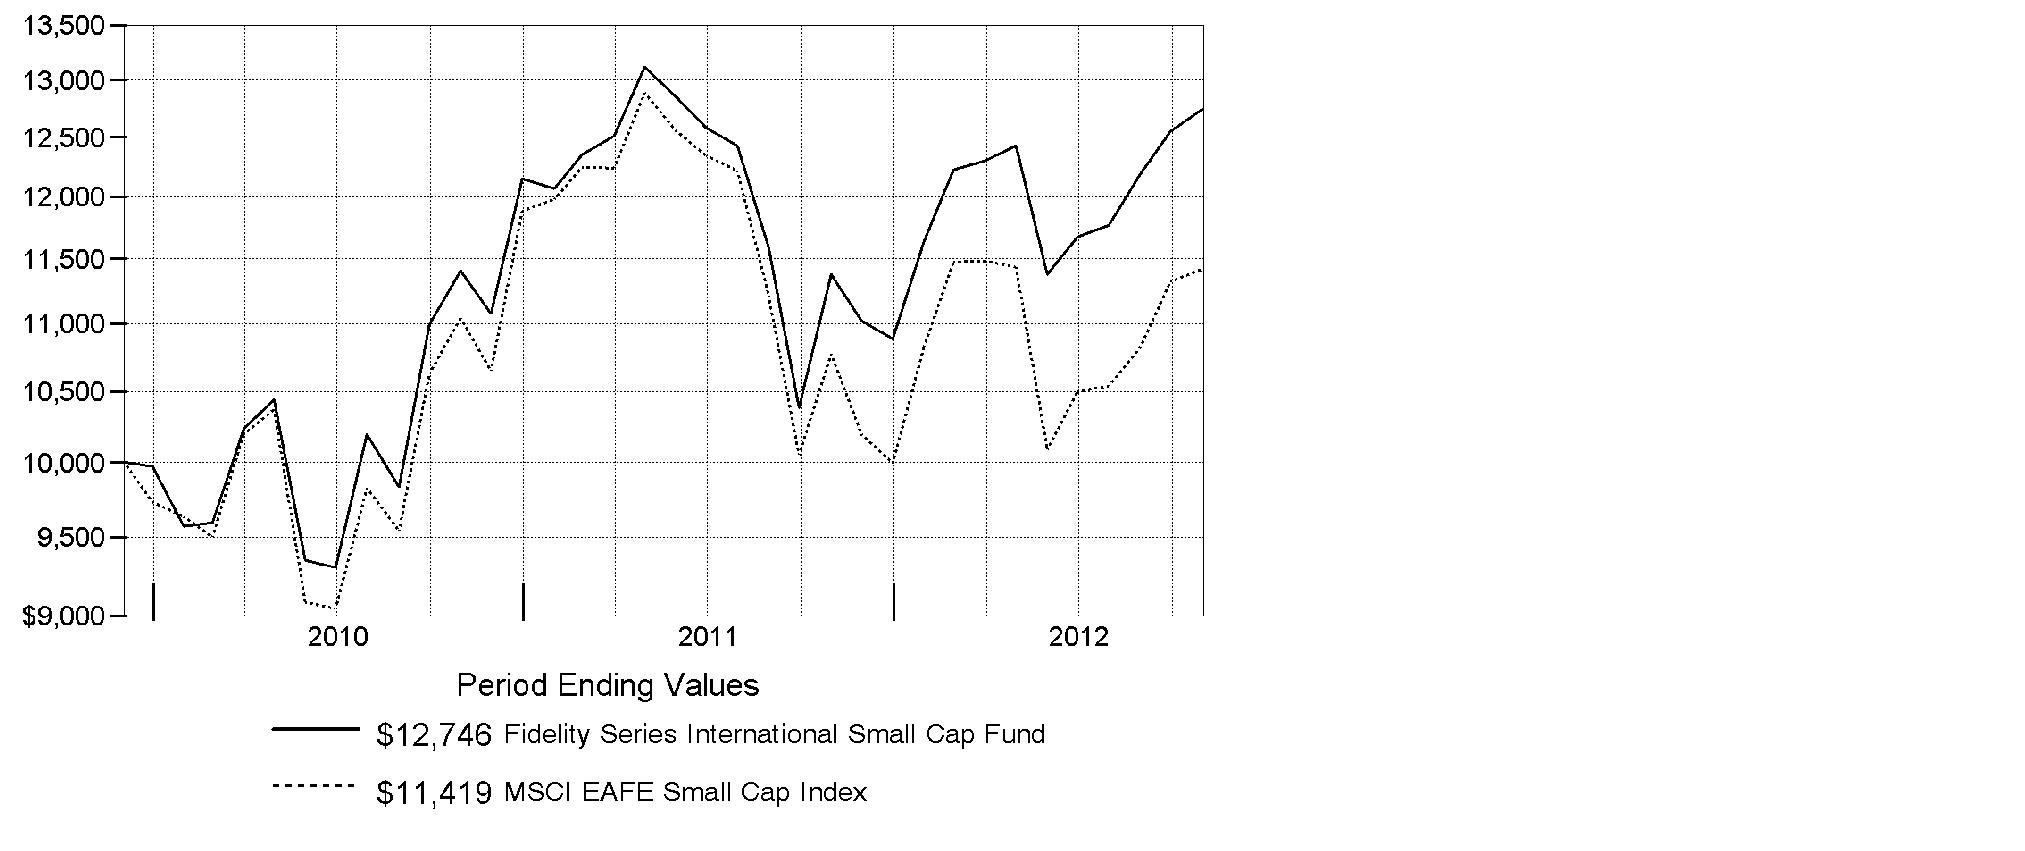
Annual Report
Fidelity Series International Small Cap Fund
Market Recap: International stocks experienced pendulum-like swings during the 12 months ending October 31, 2012, finishing the period with a modest advance. The market faced periodic bouts of volatility this past year, as a number of macroeconomic concerns - including the eurozone debt crisis, the strength and pace of the U.S. economic recovery, and a slowdown in China's once-blistering growth - dominated headlines and weighed on investors. While a stronger U.S. dollar provided an additional head wind, foreign developed- and emerging-markets stocks still managed a gain for the 12 months, as the MSCI® ACWI® (All Country World Index) ex USA Index rose 4.11%, largely buttressed in the summertime by pledges of accommodative monetary action from eurozone officials, as well as signs that the U.S. housing market was on the mend. Within the index, Asia-Pacific ex Japan showed the most impressive gains, advancing roughly 11%. A number of core European components, most notably Germany (+11%), Switzerland (+10%) and the U.K. (+9%), benefited from optimism about the eurozone's ability to resolve its debt woes, which also helped the region outpace the index overall. Elsewhere, results from Canada (+3%) and the generally more volatile emerging markets (+2%) each fell short of the MSCI index, while Japan was among the few benchmark constituents to finish in the red, returning about -3%.
Comments from Jed Weiss, Portfolio Manager of Fidelity® Series International Small Cap Fund: For the year, the fund's Series International Small Cap and Class F shares gained 12.07% and 12.25%, respectively, easily outpacing the 5.99% advance of the benchmark MSCI® EAFE® Small Cap Index. Security selection in emerging markets and Japan was very helpful to relative performance. An out-of-benchmark allocation to globally oriented U.S.-based stocks also contributed, while stock picking in Canada hurt. In sector terms, security selection helped in consumer discretionary, materials, industrials and financials, while energy and telecommunication services were detractors. The top individual contributor was Cymer, a U.S. laser manufacturer that gained sharply after in October after agreeing to be acquired by ASML Holding. Unite Group, a U.K.-based owner of student housing properties, added value, while better housing data lifted shares of U.S. carpet manufacturer Mohawk Industries and building products company James Hardie Industries, incorporated in Ireland and listed in Australia. In contrast, Austrian lighting company Zumtobel was hurt by weakness in its lighting-components business. Other disappointments were Nippon Thompson, a Japanese maker of linear motion guides, and Canadian energy producer Petrominerales. Most of the names I've mentioned were not in the index, and I sold Braskem before period end.
The views expressed above reflect those of the portfolio manager(s) only through the end of the period as stated on the cover of this report and do not necessarily represent the views of Fidelity or any other person in the Fidelity organization. Any such views are subject to change at any time based upon market or other conditions and Fidelity disclaims any responsibility to update such views. These views may not be relied on as investment advice and, because investment decisions for a Fidelity fund are based on numerous factors, may not be relied on as an indication of trading intent on behalf of any Fidelity fund.
Annual Report
Fidelity Series International Small Cap Fund
Investment Changes (Unaudited)
Geographic Diversification (% of fund's net assets) |
As of October 31, 2012 |
| Japan 19.7% | |
| United Kingdom 18.9% | |
| United States of America 18.8% | |
| Germany 4.7% | |
| Canada 3.3% | |
| France 2.8% | |
| Turkey 2.7% | |
| Brazil 2.5% | |
| Sweden 2.3% | |
| Other 24.3% | |

Percentages are based on country or territory of incorporation and are adjusted for the effect of futures contracts, if applicable. |
As of April 30, 2012 |
| Japan 20.8% | |
| United States of America 17.9% | |
| United Kingdom 17.3% | |
| Germany 4.6% | |
| Brazil 3.3% | |
| Canada 3.1% | |
| France 3.0% | |
| South Africa 2.6% | |
| Finland 2.4% | |
| Other 25.0% | |

Percentages are based on country or territory of incorporation and are adjusted for the effect of futures contracts, if applicable. |
Asset Allocation |
| % of fund's
net assets | % of fund's net assets
6 months ago |
Stocks | 93.7 | 94.6 |
Short-Term Investments and Net Other Assets (Liabilities) | 6.3 | 5.4 |
Top Ten Stocks as of October 31, 2012 |
| % of fund's
net assets | % of fund's net assets
6 months ago |
PriceSmart, Inc. (United States of America, Food & Staples Retailing) | 2.5 | 2.6 |
USS Co. Ltd. (Japan, Specialty Retail) | 2.0 | 2.0 |
Andritz AG (Austria, Machinery) | 1.6 | 1.4 |
Spirax-Sarco Engineering PLC (United Kingdom, Machinery) | 1.5 | 1.6 |
Kobayashi Pharmaceutical Co. Ltd. (Japan, Personal Products) | 1.5 | 1.4 |
Prosegur Compania de Seguridad SA (Reg.) (Spain, Commercial Services & Supplies) | 1.4 | 1.5 |
Unite Group PLC (United Kingdom, Real Estate Management & Development) | 1.4 | 1.0 |
Coca-Cola Icecek A/S (Turkey, Beverages) | 1.3 | 1.0 |
Interpump Group SpA (Italy, Machinery) | 1.3 | 1.3 |
Meggitt PLC (United Kingdom, Aerospace & Defense) | 1.2 | 1.3 |
| 15.7 | |
Market Sectors as of October 31, 2012 |
| % of fund's
net assets | % of fund's net assets
6 months ago |
Industrials | 23.5 | 23.3 |
Consumer Discretionary | 18.2 | 19.0 |
Financials | 14.1 | 15.1 |
Consumer Staples | 11.6 | 11.4 |
Materials | 9.5 | 9.6 |
Information Technology | 7.3 | 7.8 |
Health Care | 5.3 | 4.9 |
Energy | 4.2 | 3.5 |
Annual Report
Fidelity Series International Small Cap Fund
Investments October 31, 2012
Showing Percentage of Net Assets
Common Stocks - 93.0% |
| Shares | | Value |
Australia - 1.0% |
Ramsay Health Care Ltd. | 328,640 | | $ 8,105,599 |
Sydney Airport unit | 3,067,350 | | 10,793,972 |
TOTAL AUSTRALIA | | 18,899,571 |
Austria - 2.0% |
Andritz AG | 487,524 | | 29,364,590 |
Zumtobel AG | 792,019 | | 8,462,061 |
TOTAL AUSTRIA | | 37,826,651 |
Bailiwick of Jersey - 1.6% |
Informa PLC | 2,889,412 | | 18,660,480 |
Randgold Resources Ltd. sponsored ADR | 88,600 | | 10,595,674 |
TOTAL BAILIWICK OF JERSEY | | 29,256,154 |
Belgium - 1.5% |
Gimv NV | 268,916 | | 12,997,634 |
Umicore SA | 311,281 | | 15,975,271 |
TOTAL BELGIUM | | 28,972,905 |
Bermuda - 1.0% |
GP Investments Ltd. (depositary receipt) (a) | 1,640,300 | | 3,787,699 |
Lazard Ltd. Class A | 173,001 | | 5,096,609 |
Trinity Ltd. | 13,342,000 | | 9,347,947 |
TOTAL BERMUDA | | 18,232,255 |
Brazil - 1.8% |
Arezzo Industria e Comercio SA | 562,000 | | 10,030,526 |
Banco Pine SA | 1,215,064 | | 8,495,068 |
Iguatemi Empresa de Shopping Centers SA | 435,800 | | 5,535,876 |
Multiplan Empreendimentos Imobiliarios SA | 332,700 | | 9,746,510 |
TOTAL BRAZIL | | 33,807,980 |
British Virgin Islands - 0.2% |
Gem Diamonds Ltd. (a) | 1,699,569 | | 4,628,272 |
Canada - 3.3% |
Agnico-Eagle Mines Ltd. (Canada) | 115,040 | | 6,495,225 |
Baytex Energy Corp. (d) | 103,600 | | 4,714,513 |
Copper Mountain Mining Corp. (a) | 913,100 | | 3,693,541 |
Eldorado Gold Corp. | 548,500 | | 8,105,993 |
Fairfax Financial Holdings Ltd. (sub. vtg.) | 23,368 | | 8,668,914 |
Open Text Corp. (a) | 144,000 | | 7,739,595 |
Painted Pony Petroleum Ltd. Class A (a) | 489,200 | | 5,289,972 |
Common Stocks - continued |
| Shares | | Value |
Canada - continued |
Pason Systems, Inc. | 553,400 | | $ 9,015,087 |
Petrominerales Ltd. | 465,650 | | 3,734,525 |
TAG Oil Ltd. (a) | 720,800 | | 5,051,915 |
TOTAL CANADA | | 62,509,280 |
Cayman Islands - 0.2% |
Vantage Drilling Co. (a) | 1,748,469 | | 3,217,183 |
Denmark - 0.3% |
William Demant Holding A/S (a) | 56,364 | | 4,847,695 |
Finland - 2.0% |
Nokian Tyres PLC | 451,100 | | 18,710,184 |
Outotec Oyj | 374,700 | | 18,246,524 |
TOTAL FINLAND | | 36,956,708 |
France - 2.8% |
Laurent-Perrier Group | 115,724 | | 9,869,715 |
Remy Cointreau SA | 142,254 | | 14,754,289 |
Saft Groupe SA | 404,249 | | 8,988,660 |
Vetoquinol SA | 173,829 | | 5,812,958 |
Virbac SA | 77,200 | | 13,458,444 |
TOTAL FRANCE | | 52,884,066 |
Germany - 4.7% |
alstria office REIT-AG | 788,729 | | 9,525,895 |
Bilfinger Berger AG | 177,898 | | 17,406,672 |
CompuGROUP Holding AG | 563,646 | | 10,227,977 |
CTS Eventim AG | 701,354 | | 20,817,474 |
Fielmann AG | 177,295 | | 17,258,049 |
Software AG (Bearer) | 334,000 | | 13,381,375 |
TOTAL GERMANY | | 88,617,442 |
India - 0.7% |
Jyothy Laboratories Ltd. | 3,838,686 | | 12,652,931 |
Ireland - 1.5% |
FBD Holdings PLC | 405,300 | | 5,069,431 |
James Hardie Industries NV CDI | 2,326,724 | | 22,292,812 |
TOTAL IRELAND | | 27,362,243 |
Israel - 0.9% |
Azrieli Group | 350,813 | | 7,831,676 |
Common Stocks - continued |
| Shares | | Value |
Israel - continued |
Ituran Location & Control Ltd. | 627,995 | | $ 7,762,018 |
Strauss Group Ltd. | 114,055 | | 1,288,667 |
TOTAL ISRAEL | | 16,882,361 |
Italy - 2.1% |
Azimut Holding SpA | 1,244,064 | | 15,754,062 |
Interpump Group SpA (d) | 3,148,466 | | 23,913,982 |
TOTAL ITALY | | 39,668,044 |
Japan - 19.7% |
Air Water, Inc. | 383,000 | | 4,797,695 |
Aozora Bank Ltd. | 3,960,000 | | 11,161,218 |
Asahi Co. Ltd. (d) | 523,900 | | 7,888,360 |
Autobacs Seven Co. Ltd. | 495,100 | | 20,311,318 |
Azbil Corp. | 340,500 | | 6,965,257 |
Cosmos Pharmaceutical Corp. | 65,300 | | 6,437,567 |
Daikoku Denki Co. Ltd. | 168,200 | | 4,256,094 |
Daikokutenbussan Co. Ltd. | 492,000 | | 15,641,939 |
FCC Co. Ltd. | 861,200 | | 15,480,671 |
Fields Corp. | 260,800 | | 3,750,450 |
GCA Savvian Group Corp. (d) | 5,863 | | 6,962,450 |
Glory Ltd. | 455,800 | | 11,065,269 |
Goldcrest Co. Ltd. | 539,580 | | 8,117,695 |
Iwatsuka Confectionary Co. Ltd. | 5,700 | | 213,348 |
Kamigumi Co. Ltd. | 1,202,000 | | 9,696,705 |
Kobayashi Pharmaceutical Co. Ltd. | 518,200 | | 27,360,804 |
Kyoto Kimono Yuzen Co. Ltd. | 378,500 | | 4,575,379 |
Meiko Network Japan Co. Ltd. | 439,400 | | 4,458,399 |
Miraial Co. Ltd. | 102,000 | | 1,942,127 |
Nabtesco Corp. | 547,400 | | 10,189,608 |
Nagaileben Co. Ltd. | 562,400 | | 8,256,705 |
Nihon M&A Center, Inc. | 577,100 | | 17,313,723 |
Nihon Parkerizing Co. Ltd. | 897,000 | | 13,539,835 |
Nippon Seiki Co. Ltd. | 715,000 | | 6,869,661 |
Nippon Thompson Co. Ltd. | 2,394,000 | | 8,276,888 |
NS Tool Co., Ltd. | 1,000 | | 17,036 |
Obic Co. Ltd. | 55,250 | | 11,371,132 |
Osaka Securities Exchange Co. Ltd. | 860 | | 3,204,935 |
OSG Corp. | 926,000 | | 12,121,633 |
Seven Bank Ltd. | 5,687,900 | | 16,245,036 |
SHO-BOND Holdings Co. Ltd. | 438,900 | | 13,266,513 |
Shoei Co. Ltd. | 326,600 | | 1,779,670 |
Common Stocks - continued |
| Shares | | Value |
Japan - continued |
The Nippon Synthetic Chemical Industry Co. Ltd. | 1,586,000 | | $ 10,410,422 |
Tocalo Co. Ltd. | 184,500 | | 2,678,636 |
Tsutsumi Jewelry Co. Ltd. | 205,100 | | 4,704,223 |
USS Co. Ltd. | 364,680 | | 38,327,260 |
Yamato Kogyo Co. Ltd. | 687,400 | | 19,296,798 |
TOTAL JAPAN | | 368,952,459 |
Korea (South) - 0.6% |
Woongjin Coway Co. Ltd. | 335,720 | | 12,224,012 |
Netherlands - 2.3% |
Aalberts Industries NV | 1,036,300 | | 18,804,803 |
ASM International NV unit | 348,300 | | 11,048,076 |
Heijmans NV unit | 531,700 | | 4,502,302 |
QIAGEN NV (a)(d) | 462,545 | | 8,071,410 |
TOTAL NETHERLANDS | | 42,426,591 |
Papua New Guinea - 0.4% |
Oil Search Ltd. ADR | 995,877 | | 7,691,250 |
Philippines - 0.6% |
Jollibee Food Corp. | 4,214,900 | | 10,839,779 |
Portugal - 0.7% |
Jeronimo Martins SGPS SA | 779,100 | | 13,632,711 |
South Africa - 2.2% |
African Rainbow Minerals Ltd. | 431,227 | | 9,026,740 |
City Lodge Hotels Ltd. | 497,298 | | 5,276,584 |
Clicks Group Ltd. | 2,463,907 | | 16,987,465 |
JSE Ltd. | 405,495 | | 3,289,080 |
Mr Price Group Ltd. | 500,600 | | 7,733,604 |
TOTAL SOUTH AFRICA | | 42,313,473 |
Spain - 1.9% |
Grifols SA (a) | 251,200 | | 8,712,866 |
Prosegur Compania de Seguridad SA (Reg.) | 4,947,079 | | 26,931,057 |
TOTAL SPAIN | | 35,643,923 |
Sweden - 2.3% |
Fagerhult AB | 351,395 | | 8,688,323 |
Intrum Justitia AB | 1,473,703 | | 21,329,356 |
Swedish Match Co. AB | 408,400 | | 13,915,241 |
TOTAL SWEDEN | | 43,932,920 |
Common Stocks - continued |
| Shares | | Value |
Switzerland - 0.5% |
Zehnder Group AG | 155,803 | | $ 9,176,199 |
Thailand - 0.1% |
Thai Re Insurance PCL (a) | 14,758,599 | | 1,905,577 |
Turkey - 2.7% |
Albaraka Turk Katilim Bankasi A/S | 15,695,756 | | 12,434,016 |
Boyner Buyuk Magazacilik A/S (a)(e) | 5,673,500 | | 13,040,346 |
Coca-Cola Icecek A/S | 1,309,910 | | 25,430,889 |
TOTAL TURKEY | | 50,905,251 |
United Kingdom - 18.9% |
AMEC PLC | 554,564 | | 9,486,233 |
Babcock International Group PLC | 1,048,800 | | 16,552,660 |
Bellway PLC | 979,500 | | 15,980,555 |
Berendsen PLC | 830,091 | | 7,541,719 |
Britvic PLC (d) | 2,331,200 | | 13,513,011 |
Dechra Pharmaceuticals PLC | 1,311,734 | | 13,060,722 |
Derwent London PLC | 288,800 | | 9,609,972 |
Elementis PLC | 2,031,328 | | 6,860,970 |
Great Portland Estates PLC | 2,377,500 | | 17,940,365 |
H&T Group PLC | 1,059,892 | | 4,917,402 |
InterContinental Hotel Group PLC ADR | 537,693 | | 13,238,002 |
Johnson Matthey PLC | 397,290 | | 14,418,940 |
Meggitt PLC | 3,765,482 | | 23,455,470 |
Persimmon PLC | 967,400 | | 12,411,077 |
Rotork PLC | 582,800 | | 21,424,442 |
Serco Group PLC | 2,253,565 | | 20,601,852 |
Shaftesbury PLC | 1,997,955 | | 17,668,615 |
Spectris PLC | 639,907 | | 17,844,191 |
Spirax-Sarco Engineering PLC | 878,100 | | 27,419,606 |
Ted Baker PLC | 565,849 | | 8,656,556 |
Ultra Electronics Holdings PLC | 648,210 | | 17,709,608 |
Unite Group PLC | 5,639,825 | | 25,765,689 |
Victrex PLC | 812,100 | | 18,675,001 |
TOTAL UNITED KINGDOM | | 354,752,658 |
United States of America - 12.5% |
ANSYS, Inc. (a) | 74,815 | | 5,302,887 |
Autoliv, Inc. (d) | 307,700 | | 17,723,520 |
BPZ Energy, Inc. (a)(d) | 1,385,020 | | 3,988,858 |
Broadridge Financial Solutions, Inc. | 258,395 | | 5,930,165 |
Cymer, Inc. (a) | 247,704 | | 19,739,532 |
Dril-Quip, Inc. (a) | 202,631 | | 14,034,223 |
Common Stocks - continued |
| Shares | | Value |
United States of America - continued |
Evercore Partners, Inc. Class A | 262,900 | | $ 7,334,910 |
Greenhill & Co., Inc. (d) | 194,405 | | 9,277,007 |
Kansas City Southern | 205,400 | | 16,526,484 |
Martin Marietta Materials, Inc. (d) | 114,800 | | 9,449,188 |
Mohawk Industries, Inc. (a) | 221,862 | | 18,518,821 |
Oceaneering International, Inc. | 251,669 | | 13,169,839 |
PriceSmart, Inc. | 555,999 | | 46,142,356 |
ResMed, Inc. (d) | 492,500 | | 19,670,450 |
Solera Holdings, Inc. | 335,172 | | 15,689,401 |
SS&C Technologies Holdings, Inc. (a) | 544,088 | | 13,074,435 |
TOTAL UNITED STATES OF AMERICA | | 235,572,076 |
TOTAL COMMON STOCKS (Cost $1,489,014,315) |
1,747,190,620
|
Nonconvertible Preferred Stocks - 0.7% |
| | | |
Brazil - 0.7% |
Banco ABC Brasil SA
(Cost $13,918,787) | 2,251,479 | |
12,792,431
|
Money Market Funds - 8.9% |
| | | |
Fidelity Cash Central Fund, 0.19% (b) | 119,157,510 | | 119,157,510 |
Fidelity Securities Lending Cash Central Fund, 0.19% (b)(c) | 47,511,271 | | 47,511,271 |
TOTAL MONEY MARKET FUNDS (Cost $166,668,781) |
166,668,781
|
TOTAL INVESTMENT PORTFOLIO - 102.6% (Cost $1,669,601,883) | | 1,926,651,832 |
NET OTHER ASSETS (LIABILITIES) - (2.6)% | | (49,599,467) |
NET ASSETS - 100% | $ 1,877,052,365 |
Legend |
(a) Non-income producing |
(b) Affiliated fund that is available only to investment companies and other accounts managed by Fidelity Investments. The rate quoted is the annualized seven-day yield of the fund at period end. A complete unaudited listing of the fund's holdings as of its most recent quarter end is available upon request. In addition, each Fidelity Central Fund's financial statements, which are not covered by the Fund's Report of Independent Registered Public Accounting Firm, are available on the SEC's website or upon request. |
(c) Investment made with cash collateral received from securities on loan. |
(d) Security or a portion of the security is on loan at period end. |
(e) Affiliated company |
Affiliated Central Funds |
Information regarding fiscal year to date income earned by the Fund from investments in Fidelity Central Funds is as follows: |
Fund | Income earned |
Fidelity Cash Central Fund | $ 140,614 |
Fidelity Securities Lending Cash Central Fund | 646,132 |
Total | $ 786,746 |
Other Affiliated Issuers |
An affiliated company is a company in which the Fund has ownership of at least 5% of the voting securities. Fiscal year to date transactions with companies which are or were affiliates are as follows: |
Affiliate | Value,
beginning of
period | Purchases | Sales
Proceeds | Dividend
Income | Value,
end of
period |
Boyner Buyuk Magazacilik A/S | $ 3,751,446 | $ 5,172,658 | $ - | $ - | $ 13,040,346 |
Other Information |
Categorizations in the Schedule of Investments are based on country or territory of incorporation. |
All investments are categorized as Level 1 under the Fair Value Hierarchy. The inputs or methodology used for valuing securities may not be an indication of the risk associated with investing in those securities. For more information on valuation inputs, please refer to the Security Valuation section in the accompanying Notes to Financial Statements. |
The following is a summary of transfers between Level 1 and Level 2 for the period ended October 31, 2012. Transfers are assumed to have occurred at the beginning of the period, and are primarily attributable to the valuation techniques used for foreign equity securities, as discussed in the accompanying Notes to Financial Statements: |
Transfers | Total |
Level 1 to Level 2 | $ 0 |
Level 2 to Level 1 | $ 347,100,340 |
See accompanying notes which are an integral part of the financial statements.
Annual Report
Fidelity Series International Small Cap Fund
Statement of Assets and Liabilities
| October 31, 2012 |
| | |
Assets | | |
Investment in securities, at value (including securities loaned of $46,595,117) - See accompanying schedule: Unaffiliated issuers (cost $1,492,950,047) | $ 1,746,942,705 | |
Fidelity Central Funds (cost $166,668,781) | 166,668,781 | |
Other affiliated issuers (cost $9,983,055) | 13,040,346 | |
Total Investments (cost $1,669,601,883) | | $ 1,926,651,832 |
Foreign currency held at value (cost $347) | | 347 |
Receivable for investments sold | | 3,397,265 |
Receivable for fund shares sold | | 1,046,030 |
Dividends receivable | | 4,721,494 |
Distributions receivable from Fidelity Central Funds | | 45,503 |
Other receivables | | 24,220 |
Total assets | | 1,935,886,691 |
| | |
Liabilities | | |
Payable for investments purchased | $ 7,256,326 | |
Payable for fund shares redeemed | 1,243,766 | |
Accrued management fee | 1,519,609 | |
Other affiliated payables | 236,310 | |
Other payables and accrued expenses | 1,067,044 | |
Collateral on securities loaned, at value | 47,511,271 | |
Total liabilities | | 58,834,326 |
| | |
Net Assets | | $ 1,877,052,365 |
Net Assets consist of: | | |
Paid in capital | | $ 1,634,951,263 |
Undistributed net investment income | | 19,938,812 |
Accumulated undistributed net realized gain (loss) on investments and foreign currency transactions | | (33,830,682) |
Net unrealized appreciation (depreciation) on investments and assets and liabilities in foreign currencies | | 255,992,972 |
Net Assets | | $ 1,877,052,365 |
See accompanying notes which are an integral part of the financial statements.
Annual Report
Fidelity Series International Small Cap Fund
Financial Statements - continued
Statement of Assets and Liabilities - continued
| October 31, 2012 |
| | |
Series International Small Cap: Net Asset Value, offering price and redemption price per share ($1,040,584,807 ÷ 83,673,234 shares) | | $ 12.44 |
| | |
Class F:
Net Asset Value, offering price and redemption price per share ($836,467,558 ÷ 67,051,122 shares) | | $ 12.48 |
See accompanying notes which are an integral part of the financial statements.
Annual Report
Statement of Operations
| Year ended October 31, 2012 |
| | |
Investment Income | | |
Dividends | | $ 44,413,592 |
Interest | | 919 |
Income from Fidelity Central Funds | | 786,746 |
Income before foreign taxes withheld | | 45,201,257 |
Less foreign taxes withheld | | (3,027,973) |
Total income | | 42,173,284 |
| | |
Expenses | | |
Management fee
Basic fee | $ 14,560,492 | |
Performance adjustment | 1,631,481 | |
Transfer agent fees | 2,088,327 | |
Accounting and security lending fees | 768,199 | |
Custodian fees and expenses | 264,284 | |
Independent trustees' compensation | 10,992 | |
Audit | 62,010 | |
Legal | 6,723 | |
Miscellaneous | 16,317 | |
Total expenses before reductions | 19,408,825 | |
Expense reductions | (111,709) | 19,297,116 |
Net investment income (loss) | | 22,876,168 |
Realized and Unrealized Gain (Loss) Net realized gain (loss) on: | | |
Investment securities: | | |
Unaffiliated issuers | (16,622,357) | |
Investment not meeting investment restrictions | (3,732) | |
Foreign currency transactions | (286,885) | |
Payment from investment advisor for loss on investment not meeting investment restrictions | 3,732 | |
Total net realized gain (loss) | | (16,909,242) |
Change in net unrealized appreciation (depreciation) on: Investment securities (net of increase in deferred foreign taxes of $960,122) | 197,434,749 | |
Assets and liabilities in foreign currencies | (69,398) | |
Total change in net unrealized appreciation (depreciation) | | 197,365,351 |
Net gain (loss) | | 180,456,109 |
Net increase (decrease) in net assets resulting from operations | | $ 203,332,277 |
See accompanying notes which are an integral part of the financial statements.
Annual Report
Fidelity Series International Small Cap Fund
Financial Statements - continued
Statement of Changes in Net Assets
| Year ended
October 31,
2012 | Year ended
October 31,
2011 |
Increase (Decrease) in Net Assets | | |
Operations | | |
Net investment income (loss) | $ 22,876,168 | $ 19,114,079 |
Net realized gain (loss) | (16,909,242) | (12,977,539) |
Change in net unrealized appreciation (depreciation) | 197,365,351 | (37,975,541) |
Net increase (decrease) in net assets resulting
from operations | 203,332,277 | (31,839,001) |
Distributions to shareholders from net investment income | (16,161,385) | (8,192,680) |
Distributions to shareholders from net realized gain | (1,284,494) | (6,124,182) |
Total distributions | (17,445,879) | (14,316,862) |
Share transactions - net increase (decrease) | 103,425,618 | 801,569,467 |
Total increase (decrease) in net assets | 289,312,016 | 755,413,604 |
| | |
Net Assets | | |
Beginning of period | 1,587,740,349 | 832,326,745 |
End of period (including undistributed net investment income of $19,938,812 and undistributed net investment income of $13,229,687, respectively) | $ 1,877,052,365 | $ 1,587,740,349 |
See accompanying notes which are an integral part of the financial statements.
Annual Report
Financial Highlights - Series International Small Cap
Years ended October 31, | 2012 | 2011 | 2010 H |
Selected Per-Share Data | | | |
Net asset value, beginning of period | $ 11.22 | $ 11.40 | $ 10.00 |
Income from Investment Operations | | | |
Net investment income (loss) D | .15 | .17 G | .06 |
Net realized and unrealized gain (loss) | 1.19 | (.19) | 1.34 |
Total from investment operations | 1.34 | (.02) | 1.40 |
Distributions from net investment income | (.11) | (.09) | - |
Distributions from net realized gain | (.01) | (.07) | - |
Total distributions | (.12) | (.16) | - |
Net asset value, end of period | $ 12.44 | $ 11.22 | $ 11.40 |
Total Return B, C | 12.07% | (.23)% | 14.00% |
Ratios to Average Net Assets E, I | | | |
Expenses before reductions | 1.22% | 1.14% | 1.21% A |
Expenses net of fee waivers, if any | 1.22% | 1.14% | 1.21% A |
Expenses net of all reductions | 1.22% | 1.13% | 1.18% A |
Net investment income (loss) | 1.27% | 1.47% G | .68% A |
Supplemental Data | | | |
Net assets, end of period (000 omitted) | $ 1,040,585 | $ 1,107,242 | $ 701,814 |
Portfolio turnover rate F | 25% | 22% | 21% A |
A Annualized
B Total returns for periods of less than one year are not annualized.
C Total returns would have been lower if certain expenses had not been reduced during the applicable periods shown.
D Calculated based on average shares outstanding during the period.
E Fees and expenses of any underlying Fidelity Central Funds are not included in the Fund's expense ratio. The Fund indirectly bears its proportionate share of the expenses of any underlying Fidelity Central Funds.
F Amount does not include the portfolio activity of any underlying Fidelity Central Funds.
G Investment income per share reflects a large, non-recurring dividend which amounted to $.06 per share. Excluding this non-recurring dividend, the ratio of net investment income (loss) to average net assets would have been 1.00%.
H For the period December 3, 2009 (commencement of operations) to October 31, 2010.
I Expense ratios reflect operating expenses of the class. Expenses before reductions do not reflect amounts reimbursed by the investment adviser or reductions from brokerage service arrangements or reductions from other expense offset arrangements and do not represent the amount paid by the class during periods when reimbursements or reductions occur. Expense ratios before reductions for start-up periods may not be representative of longer-term operating periods. Expenses net of fee waivers reflect expenses after reimbursement by the investment adviser but prior to reductions from brokerage service arrangements or other expense offset arrangements. Expenses net of all reductions represent the net expenses paid by the class.
See accompanying notes which are an integral part of the financial statements.
Annual Report
Financial Highlights - Class F
Years ended October 31, | 2012 | 2011 | 2010 H |
Selected Per-Share Data | | | |
Net asset value, beginning of period | $ 11.26 | $ 11.43 | $ 10.00 |
Income from Investment Operations | | | |
Net investment income (loss) D | .17 | .20 G | .09 |
Net realized and unrealized gain (loss) | 1.19 | (.20) | 1.34 |
Total from investment operations | 1.36 | - | 1.43 |
Distributions from net investment income | (.13) | (.10) | - |
Distributions from net realized gain | (.01) | (.07) | - |
Total distributions | (.14) | (.17) | - |
Net asset value, end of period | $ 12.48 | $ 11.26 | $ 11.43 |
Total Return B, C | 12.25% | (.03)% | 14.30% |
Ratios to Average Net Assets E, I | | | |
Expenses before reductions | 1.02% | .93% | .98% A |
Expenses net of fee waivers, if any | 1.02% | .93% | .98% A |
Expenses net of all reductions | 1.01% | .92% | .94% A |
Net investment income (loss) | 1.47% | 1.68% G | .92% A |
Supplemental Data | | | |
Net assets, end of period (000 omitted) | $ 836,468 | $ 480,498 | $ 130,513 |
Portfolio turnover rate F | 25% | 22% | 21% A |
A Annualized
B Total returns for periods of less than one year are not annualized.
C Total returns would have been lower if certain expenses had not been reduced during the applicable periods shown.
D Calculated based on average shares outstanding during the period.
E Fees and expenses of any underlying Fidelity Central Funds are not included in the Fund's expense ratio. The Fund indirectly bears its proportionate share of the expenses of any underlying Fidelity Central Funds.
F Amount does not include the portfolio activity of any underlying Fidelity Central Funds.
G Investment income per share reflects a large, non-recurring dividend which amounted to $.06 per share. Excluding this non-recurring dividend, the ratio of net investment income (loss) to average net assets would have been 1.21%.
H For the period December 3, 2009 (commencement of operations) to October 31, 2010.
I Expense ratios reflect operating expenses of the class. Expenses before reductions do not reflect amounts reimbursed by the investment adviser or reductions from brokerage service arrangements or reductions from other expense offset arrangements and do not represent the amount paid by the class during periods when reimbursements or reductions occur. Expense ratios before reductions for start-up periods may not be representative of longer-term operating periods. Expenses net of fee waivers reflect expenses after reimbursement by the investment adviser but prior to reductions from brokerage service arrangements or other expense offset arrangements. Expenses net of all reductions represent the net expenses paid by the class.
See accompanying notes which are an integral part of the financial statements.
Annual Report
Fidelity Series International Value Fund
Average annual total return reflects the change in the value of an investment, assuming reinvestment of the class' distributions from dividend income and capital gains (the profits earned upon the sale of securities that have grown in value, if any) and assuming a constant rate of performance each year. The $10,000 table and the fund's returns do not reflect the deduction of taxes that a shareholder would pay on fund distributions or the redemption of fund shares. During periods of reimbursement by Fidelity, a fund's total return will be greater than it would be had the reimbursement not occurred. How a fund did yesterday is no guarantee of how it will do tomorrow.
Average Annual Total Returns
Periods ended October 31, 2012 | Past 1
year | Life of
fund A |
Fidelity Series International Value Fund | 9.56% | -1.49% |
Class F | 9.77% | -1.27% |
A From December 3, 2009.
$10,000 Over Life of Fund
Let's say hypothetically that $10,000 was invested in Fidelity Series International Value Fund, a class of the fund, on December 3, 2009, when the fund started. The chart shows how the value of your investment would have changed, and also shows how the MSCI EAFE Value Index performed over the same period.
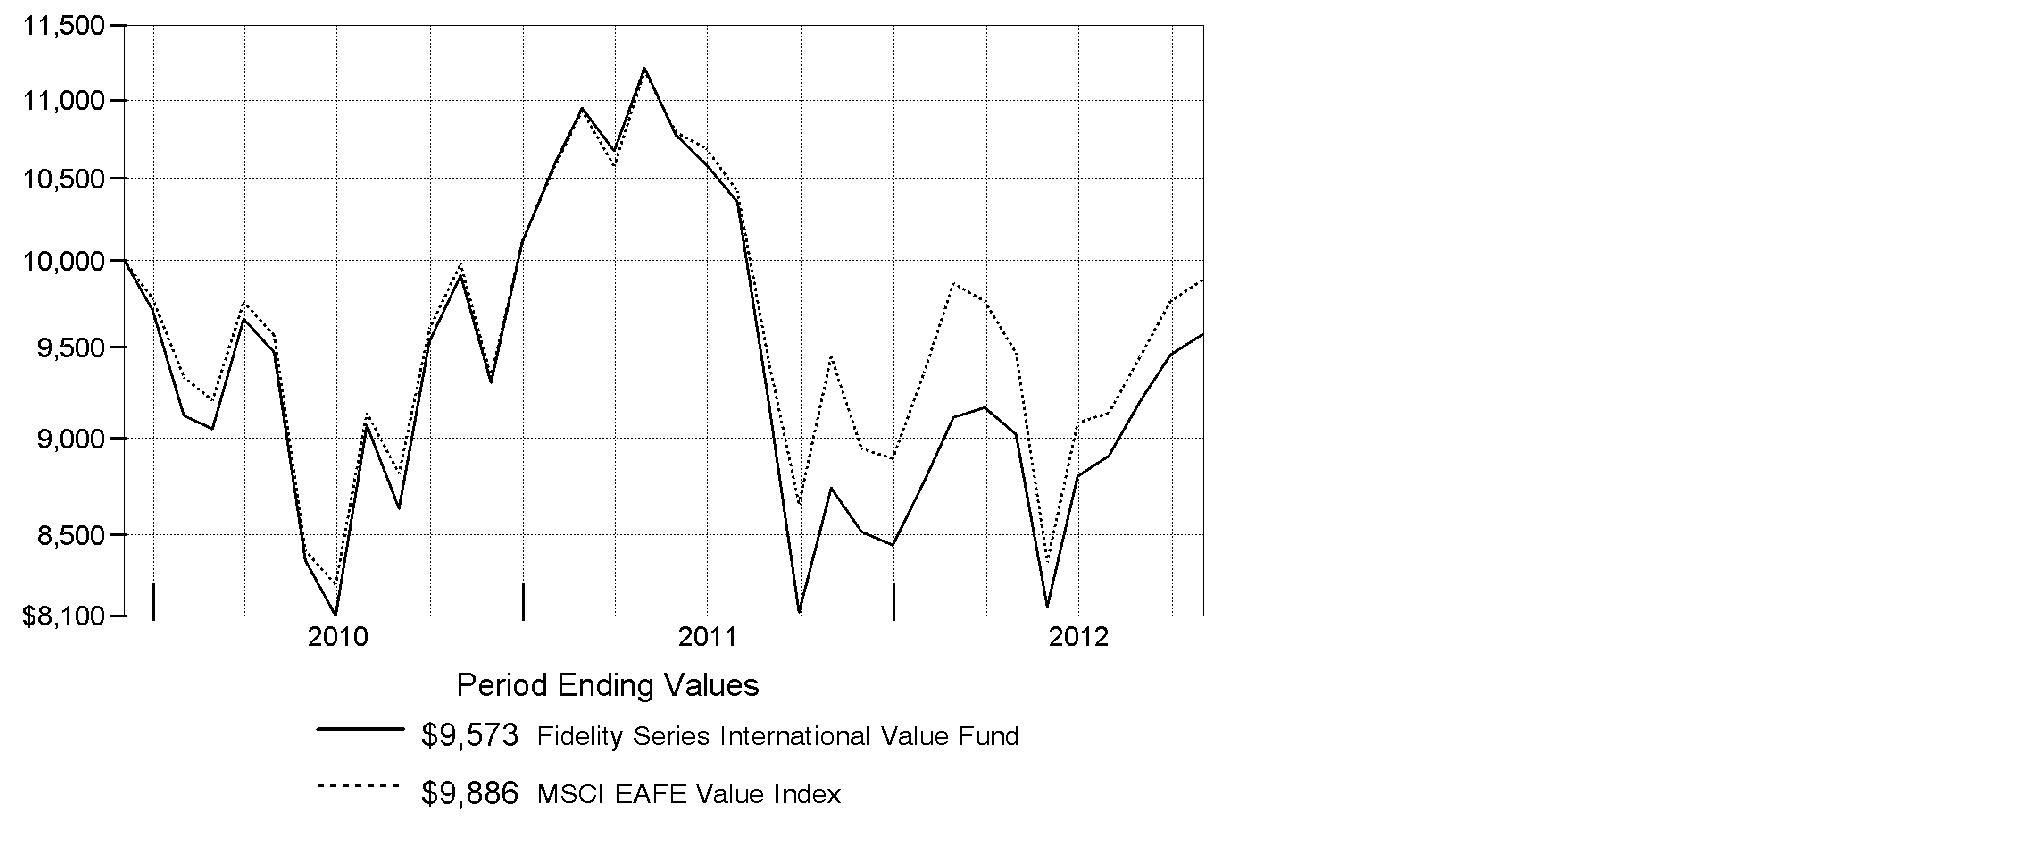
Annual Report
Fidelity Series International Value Fund
Market Recap: International stocks experienced pendulum-like swings during the 12 months ending October 31, 2012, finishing the period with a modest advance. The market faced periodic bouts of volatility this past year, as a number of macroeconomic concerns - including the eurozone debt crisis, the strength and pace of the U.S. economic recovery, and a slowdown in China's once-blistering growth - dominated headlines and weighed on investors. While a stronger U.S. dollar provided an additional head wind, foreign developed- and emerging-markets stocks still managed a gain for the 12 months, as the MSCI® ACWI® (All Country World Index) ex USA Index rose 4.11%, largely buttressed in the summertime by pledges of accommodative monetary action from eurozone officials, as well as signs that the U.S. housing market was on the mend. Within the index, Asia-Pacific ex Japan showed the most impressive gains, advancing roughly 11%. A number of core European components, most notably Germany (+11%), Switzerland (+10%) and the U.K. (+9%), benefited from optimism about the eurozone's ability to resolve its debt woes, which also helped the region outpace the index overall. Elsewhere, results from Canada (+3%) and the generally more volatile emerging markets (+2%) each fell short of the MSCI index, while Japan was among the few benchmark constituents to finish in the red, returning about -3%.
Comments from Alex Zavratsky, Portfolio Manager of Fidelity® Series International Value Fund: For the year, the fund's Series International Value and Class F shares rose 9.56% and 9.77%, respectively, easily outpacing the 4.64% gain of the benchmark MSCI® EAFE® Value Index. Investments in two pharmaceuticals firms - France's Sanofi and non-index Roche Holding of Switzerland - were standouts. Within this industry, I focused on companies where product patent cliffs were either behind them or were well understood so they could focus on future growth. Elsewhere, I avoided benchmark components Telefonica - Spain's telecom giant - and France Telecom, as I believed pressure on both companies' cash flow, too much debt, poor business fundamentals and unsustainable dividend yields would hamper each stock. That proved to be the right call. Similarly, I did not invest in Finnish mobile device maker Nokia. Given the strength of competitors Samsung Electronics and Apple, I believed Nokia, with its non-differentiated product, was at a technological and brand disadvantage. Individual detractors included Repsol, a Spain-based integrated oil and gas company that suffered because Argentina moved to nationalize the company's local unit. An untimely investment in Japanese electronics manufacturer Hitachi also hurt.
The views expressed above reflect those of the portfolio manager(s) only through the end of the period as stated on the cover of this report and do not necessarily represent the views of Fidelity or any other person in the Fidelity organization. Any such views are subject to change at any time based upon market or other conditions and Fidelity disclaims any responsibility to update such views. These views may not be relied on as investment advice and, because investment decisions for a Fidelity fund are based on numerous factors, may not be relied on as an indication of trading intent on behalf of any Fidelity fund.
Annual Report
Fidelity Series International Value Fund
Investment Changes (Unaudited)
Geographic Diversification (% of fund's net assets) |
As of October 31, 2012 |
| United Kingdom 26.2% | |
| Japan 17.1% | |
| Germany 10.2% | |
| Switzerland 9.8% | |
 | France 9.8% | |
| Australia 8.3% | |
| Italy 3.3% | |
| Netherlands 2.8% | |
| Singapore 2.5% | |
| Other 10.0% | |

Percentages are based on country or territory of incorporation and are adjusted for the effect of futures contracts, if applicable. |
As of April 30, 2012 |
| United Kingdom 27.4% | |
| Japan 22.4% | |
| Germany 10.6% | |
| Switzerland 9.6% | |
| Australia 7.4% | |
| France 7.4% | |
| Netherlands 3.4% | |
| Italy 2.6% | |
| Spain 1.9% | |
| Other 7.3% | |

Percentages are based on country or territory of incorporation and are adjusted for the effect of futures contracts, if applicable. |
Asset Allocation |
| % of fund's
net assets | % of fund's net assets
6 months ago |
Stocks | 98.7 | 98.7 |
Short-Term Investments and Net Other Assets (Liabilities) | 1.3 | 1.3 |
Top Ten Stocks as of October 31, 2012 |
| % of fund's
net assets | % of fund's net assets
6 months ago |
Royal Dutch Shell PLC Class A sponsored ADR (United Kingdom, Oil, Gas & Consumable Fuels) | 4.5 | 5.1 |
Sanofi SA (France, Pharmaceuticals) | 3.5 | 3.2 |
Roche Holding AG (participation certificate) (Switzerland, Pharmaceuticals) | 3.0 | 3.8 |
Vodafone Group PLC sponsored ADR (United Kingdom, Wireless Telecommunication Services) | 3.0 | 3.4 |
HSBC Holdings PLC sponsored ADR (United Kingdom, Commercial Banks) | 2.6 | 2.3 |
Commonwealth Bank of Australia (Australia, Commercial Banks) | 2.5 | 2.3 |
ENI SpA (Italy, Oil, Gas & Consumable Fuels) | 2.5 | 1.9 |
Australia & New Zealand Banking Group Ltd. (Australia, Commercial Banks) | 2.1 | 2.4 |
BHP Billiton PLC (United Kingdom, Metals & Mining) | 1.9 | 0.0 |
BNP Paribas SA (France, Commercial Banks) | 1.9 | 1.0 |
| 27.5 | |
Market Sectors as of October 31, 2012 |
| % of fund's
net assets | % of fund's net assets
6 months ago |
Financials | 32.4 | 27.0 |
Health Care | 11.8 | 13.2 |
Energy | 11.0 | 11.8 |
Consumer Discretionary | 8.6 | 9.1 |
Industrials | 7.8 | 7.3 |
Consumer Staples | 7.3 | 9.0 |
Telecommunication Services | 6.8 | 7.0 |
Utilities | 6.1 | 6.9 |
Materials | 5.6 | 4.7 |
Information Technology | 1.3 | 2.7 |
Annual Report
Fidelity Series International Value Fund
Investments October 31, 2012
Showing Percentage of Net Assets
Common Stocks - 97.4% |
| Shares | | Value |
Australia - 8.3% |
Australia & New Zealand Banking Group Ltd. | 7,293,685 | | $ 192,687,288 |
Commonwealth Bank of Australia | 3,831,138 | | 229,666,715 |
Origin Energy Ltd. | 3,051,905 | | 35,988,821 |
Sydney Airport unit | 15,487,629 | | 54,500,804 |
Telstra Corp. Ltd. | 18,640,770 | | 80,109,213 |
Transurban Group unit | 5,897,456 | | 37,220,874 |
Westfield Group unit | 9,011,302 | | 99,715,581 |
Woolworths Ltd. | 1,141,869 | | 34,860,176 |
TOTAL AUSTRALIA | | 764,749,472 |
Bailiwick of Jersey - 0.5% |
Wolseley PLC | 1,071,651 | | 46,848,818 |
Belgium - 0.2% |
KBC Groupe SA | 793,563 | | 18,627,524 |
Bermuda - 0.4% |
Cheung Kong Infrastructure Holdings Ltd. | 5,416,000 | | 31,727,073 |
Canada - 0.5% |
Suncor Energy, Inc. | 1,378,500 | | 46,265,151 |
Cayman Islands - 0.4% |
ENN Energy Holdings Ltd. | 9,740,000 | | 40,530,706 |
Finland - 0.7% |
Sampo OYJ (A Shares) | 2,170,167 | | 68,015,002 |
France - 9.8% |
Arkema SA | 603,301 | | 55,003,671 |
Atos Origin SA | 841,262 | | 56,493,714 |
BNP Paribas SA | 3,423,475 | | 172,213,054 |
Compagnie de St. Gobain | 1,331,000 | | 46,907,526 |
GDF Suez | 3,179,825 | | 72,971,692 |
Pernod Ricard SA | 443,200 | | 47,696,889 |
PPR SA | 238,375 | | 41,911,748 |
Sanofi SA | 3,706,357 | | 325,519,978 |
Schneider Electric SA | 497,755 | | 31,119,541 |
Unibail-Rodamco | 229,592 | | 51,735,269 |
TOTAL FRANCE | | 901,573,082 |
Germany - 8.9% |
Allianz AG | 1,276,355 | | 158,254,886 |
BASF AG | 650,626 | | 53,912,738 |
Bayer AG | 1,943,246 | | 169,234,027 |
Daimler AG (Germany) | 1,786,503 | | 83,418,621 |
Deutsche Post AG | 3,223,907 | | 63,912,713 |
Common Stocks - continued |
| Shares | | Value |
Germany - continued |
Fresenius SE & Co. KGaA | 466,500 | | $ 53,209,550 |
HeidelbergCement Finance AG | 859,007 | | 45,527,005 |
RWE AG | 1,857,100 | | 84,861,611 |
Siemens AG | 1,099,448 | | 110,779,260 |
TOTAL GERMANY | | 823,110,411 |
Hong Kong - 1.1% |
Cheung Kong Holdings Ltd. | 6,221,000 | | 91,909,665 |
Hysan Development Co. Ltd. | 2,283,000 | | 10,089,322 |
TOTAL HONG KONG | | 101,998,987 |
Italy - 3.3% |
ENI SpA | 9,889,600 | | 227,568,867 |
Fiat Industrial SpA | 2,479,371 | | 26,849,935 |
Saipem SpA | 1,082,665 | | 48,638,248 |
TOTAL ITALY | | 303,057,050 |
Japan - 17.1% |
Aeon Credit Service Co. Ltd. | 2,677,600 | | 56,818,920 |
Air Water, Inc. | 3,746,000 | | 46,924,715 |
Aozora Bank Ltd. | 10,546,000 | | 29,723,788 |
Astellas Pharma, Inc. | 2,188,500 | | 108,698,515 |
Chubu Electric Power Co., Inc. | 2,875,500 | | 29,644,701 |
Credit Saison Co. Ltd. | 1,957,300 | | 42,980,670 |
Denso Corp. | 1,949,400 | | 61,024,058 |
Hitachi Ltd. | 12,847,000 | | 68,073,168 |
Honda Motor Co. Ltd. | 4,007,300 | | 120,472,453 |
INPEX Corp. | 5,343 | | 30,453,025 |
Itochu Corp. | 4,826,600 | | 48,308,322 |
Japan Retail Fund Investment Corp. | 20,776 | | 37,866,817 |
Japan Tobacco, Inc. | 3,292,400 | | 90,981,265 |
JSR Corp. | 2,282,900 | | 39,120,721 |
Mitsubishi Corp. | 3,452,600 | | 61,630,402 |
Mitsubishi Estate Co. Ltd. | 3,707,000 | | 73,322,723 |
Nippon Telegraph & Telephone Corp. | 956,200 | | 43,725,239 |
ORIX Corp. | 511,900 | | 52,581,485 |
Santen Pharmaceutical Co. Ltd. | 1,059,800 | | 46,398,609 |
Seven & i Holdings Co., Ltd. | 4,046,900 | | 124,808,565 |
Seven Bank Ltd. | 15,661,400 | | 44,730,041 |
Softbank Corp. | 1,589,000 | | 50,299,424 |
Sumitomo Mitsui Financial Group, Inc. | 5,227,500 | | 159,736,741 |
Sumitomo Realty & Development Co. Ltd. | 1,571,000 | | 43,373,218 |
Common Stocks - continued |
| Shares | | Value |
Japan - continued |
Toyo Suisan Kaisha Ltd. | 1,328,000 | | $ 33,087,711 |
USS Co. Ltd. | 319,610 | | 33,590,478 |
TOTAL JAPAN | | 1,578,375,774 |
Netherlands - 2.8% |
ING Groep NV (Certificaten Van Aandelen) (a) | 12,174,852 | | 108,333,472 |
Koninklijke Philips Electronics NV | 2,943,670 | | 73,727,345 |
Unilever NV (Certificaten Van Aandelen) (Bearer) | 2,180,569 | | 80,146,023 |
TOTAL NETHERLANDS | | 262,206,840 |
Norway - 1.1% |
Orkla ASA (A Shares) | 4,111,100 | | 32,520,760 |
Telenor ASA | 3,656,889 | | 71,902,418 |
TOTAL NORWAY | | 104,423,178 |
Singapore - 2.5% |
Ascendas Real Estate Investment Trust | 24,648,000 | | 47,687,555 |
ComfortDelgro Corp. Ltd. | 21,310,000 | | 29,524,430 |
Singapore Telecommunications Ltd. | 21,261,000 | | 56,124,299 |
United Overseas Bank Ltd. | 6,249,491 | | 93,604,034 |
TOTAL SINGAPORE | | 226,940,318 |
Spain - 2.1% |
Banco Bilbao Vizcaya Argentaria SA sponsored ADR | 15,532,578 | | 128,920,397 |
Repsol YPF SA | 3,401,101 | | 67,976,558 |
TOTAL SPAIN | | 196,896,955 |
Sweden - 1.0% |
Svenska Handelsbanken AB (A Shares) | 2,608,400 | | 89,346,814 |
Switzerland - 9.8% |
Nestle SA | 2,647,492 | | 168,008,995 |
Roche Holding AG (participation certificate) | 1,454,320 | | 279,682,929 |
Swisscom AG | 131,877 | | 54,787,084 |
Syngenta AG (Switzerland) | 249,020 | | 97,090,292 |
UBS AG (NY Shares) | 11,232,358 | | 168,710,017 |
Zurich Financial Services AG | 542,466 | | 133,679,745 |
TOTAL SWITZERLAND | | 901,959,062 |
United Kingdom - 26.2% |
Barclays PLC | 32,741,760 | | 121,070,351 |
BHP Billiton PLC | 5,386,046 | | 172,629,540 |
BP PLC sponsored ADR | 3,404,170 | | 146,004,851 |
Common Stocks - continued |
| Shares | | Value |
United Kingdom - continued |
British American Tobacco PLC (United Kingdom) | 1,369,700 | | $ 67,936,585 |
British Land Co. PLC | 6,865,800 | | 58,556,134 |
Bunzl PLC | 3,479,218 | | 57,549,528 |
Centrica PLC | 16,000,322 | | 83,684,304 |
Compass Group PLC | 7,513,600 | | 82,450,490 |
GlaxoSmithKline PLC sponsored ADR | 2,361,700 | | 106,040,330 |
HSBC Holdings PLC sponsored ADR (d) | 4,894,089 | | 241,572,233 |
Imperial Tobacco Group PLC | 1,021,195 | | 38,562,110 |
Kingfisher PLC | 9,320,271 | | 43,542,500 |
Legal & General Group PLC | 36,962,626 | | 79,928,907 |
National Grid PLC | 11,161,500 | | 127,291,992 |
Next PLC | 746,600 | | 42,964,086 |
Prudential PLC | 5,441,810 | | 74,735,658 |
Reed Elsevier PLC | 8,567,692 | | 83,786,245 |
Royal Dutch Shell PLC Class A sponsored ADR | 6,108,538 | | 418,312,684 |
Scottish & Southern Energy PLC | 4,068,302 | | 95,064,420 |
Vodafone Group PLC sponsored ADR | 10,222,372 | | 278,252,966 |
TOTAL UNITED KINGDOM | | 2,419,935,914 |
United States of America - 0.7% |
Virgin Media, Inc. | 1,807,000 | | 59,370,702 |
TOTAL COMMON STOCKS (Cost $8,363,232,093) |
8,985,958,833
|
Nonconvertible Preferred Stocks - 1.3% |
| | | |
Germany - 1.3% |
ProSiebenSat.1 Media AG | 1,655,920 | | 46,145,895 |
Volkswagen AG | 354,850 | | 73,406,237 |
TOTAL NONCONVERTIBLE PREFERRED STOCKS (Cost $101,607,806) |
119,552,132
|
Money Market Funds - 1.4% |
| Shares | | Value |
Fidelity Cash Central Fund, 0.19% (b) | 81,990,587 | | $ 81,990,587 |
Fidelity Securities Lending Cash Central Fund, 0.19% (b)(c) | 42,529,030 | | 42,529,030 |
TOTAL MONEY MARKET FUNDS (Cost $124,519,617) |
124,519,617
|
TOTAL INVESTMENT PORTFOLIO - 100.1% (Cost $8,589,359,516) | | 9,230,030,582 |
NET OTHER ASSETS (LIABILITIES) - (0.1)% | | (7,762,819) |
NET ASSETS - 100% | $ 9,222,267,763 |
Legend |
(a) Non-income producing |
(b) Affiliated fund that is available only to investment companies and other accounts managed by Fidelity Investments. The rate quoted is the annualized seven-day yield of the fund at period end. A complete unaudited listing of the fund's holdings as of its most recent quarter end is available upon request. In addition, each Fidelity Central Fund's financial statements, which are not covered by the Fund's Report of Independent Registered Public Accounting Firm, are available on the SEC's website or upon request. |
(c) Investment made with cash collateral received from securities on loan. |
(d) Security or a portion of the security is on loan at period end. |
Affiliated Central Funds |
Information regarding fiscal year to date income earned by the Fund from investments in Fidelity Central Funds is as follows: |
Fund | Income earned |
Fidelity Cash Central Fund | $ 106,177 |
Fidelity Securities Lending Cash Central Fund | 11,387,633 |
Total | $ 11,493,810 |
Other Information |
Categorizations in the Schedule of Investments are based on country or territory of incorporation. |
The following is a summary of the inputs used, as of October 31, 2012, involving the Fund's assets and liabilities carried at fair value. The inputs or methodology used for valuing securities may not be an indication of the risk associated with investing in those securities. For more information on valuation inputs, and their aggregation into the levels used in the tables below, please refer to the Security Valuation section in the accompanying Notes to Financial Statements. |
Valuation Inputs at Reporting Date: |
Description | Total | Level 1 | Level 2 | Level 3 |
Investments in Securities: | | | | |
Equities: | | | | |
Consumer Discretionary | $ 772,083,513 | $ 651,611,060 | $ 120,472,453 | $ - |
Consumer Staples | 686,088,319 | 538,005,711 | 148,082,608 | - |
Energy | 1,021,208,205 | 793,639,338 | 227,568,867 | - |
Financials | 2,980,194,026 | 2,516,317,804 | 463,876,222 | - |
Health Care | 1,088,783,938 | 763,263,960 | 325,519,978 | - |
Industrials | 721,400,258 | 536,893,653 | 184,506,605 | - |
Information Technology | 124,566,882 | 124,566,882 | - | - |
Materials | 510,208,682 | 240,488,850 | 269,719,832 | - |
Telecommunication Services | 635,200,643 | 591,475,404 | 43,725,239 | - |
Utilities | 565,776,499 | 438,484,507 | 127,291,992 | - |
Money Market Funds | 124,519,617 | 124,519,617 | - | - |
Total Investments in Securities: | $ 9,230,030,582 | $ 7,319,266,786 | $ 1,910,763,796 | $ - |
The following is a summary of transfers between Level 1 and Level 2 for the period ended October 31, 2012. Transfers are assumed to have occurred at the beginning of the period, and are primarily attributable to the valuation techniques used for foreign equity securities, as discussed in the accompanying Notes to Financial Statements: |
Transfers | Total |
Level 1 to Level 2 | $ 0 |
Level 2 to Level 1 | $ 1,185,553,800 |
See accompanying notes which are an integral part of the financial statements.
Annual Report
Fidelity Series International Value Fund
Statement of Assets and Liabilities
| October 31, 2012 |
| | |
Assets | | |
Investment in securities, at value (including securities loaned of $41,568,968) - See accompanying schedule: Unaffiliated issuers (cost $8,464,839,899) | $ 9,105,510,965 | |
Fidelity Central Funds (cost $124,519,617) | 124,519,617 | |
Total Investments (cost $8,589,359,516) | | $ 9,230,030,582 |
Receivable for investments sold | | 31,154,520 |
Receivable for fund shares sold | | 5,166,389 |
Dividends receivable | | 31,649,843 |
Distributions receivable from Fidelity Central Funds | | 73,278 |
Other receivables | | 464,602 |
Total assets | | 9,298,539,214 |
| | |
Liabilities | | |
Payable to custodian bank | $ 5,651 | |
Payable for investments purchased | 21,132,415 | |
Payable for fund shares redeemed | 6,107,362 | |
Accrued management fee | 5,264,039 | |
Other affiliated payables | 974,590 | |
Other payables and accrued expenses | 258,364 | |
Collateral on securities loaned, at value | 42,529,030 | |
Total liabilities | | 76,271,451 |
| | |
Net Assets | | $ 9,222,267,763 |
Net Assets consist of: | | |
Paid in capital | | $ 9,225,875,275 |
Undistributed net investment income | | 242,455,171 |
Accumulated undistributed net realized gain (loss) on investments and foreign currency transactions | | (886,167,575) |
Net unrealized appreciation (depreciation) on investments and assets and liabilities in foreign currencies | | 640,104,892 |
Net Assets | | $ 9,222,267,763 |
See accompanying notes which are an integral part of the financial statements.
Annual Report
Fidelity Series International Value Fund
Financial Statements - continued
Statement of Assets and Liabilities - continued
| October 31, 2012 |
| | |
Series International Value:
Net Asset Value, offering price and redemption price per share ($5,107,633,099 ÷ 557,663,099 shares) | | $ 9.16 |
| | |
Class F:
Net Asset Value, offering price and redemption price per share ($4,114,634,664 ÷ 447,841,060 shares) | | $ 9.19 |
See accompanying notes which are an integral part of the financial statements.
Annual Report
Statement of Operations
| Year ended October 31, 2012 |
| | |
Investment Income | | |
Dividends | | $ 351,999,701 |
Interest | | 10,234 |
Income from Fidelity Central Funds | | 11,493,810 |
Income before foreign taxes withheld | | 363,503,745 |
Less foreign taxes withheld | | (26,642,524) |
Total income | | 336,861,221 |
| | |
Expenses | | |
Management fee
Basic fee | $ 56,397,277 | |
Performance adjustment | (3,270,328) | |
Transfer agent fees | 9,750,910 | |
Accounting and security lending fees | 1,732,281 | |
Custodian fees and expenses | 748,213 | |
Independent trustees' compensation | 50,958 | |
Audit | 74,019 | |
Legal | 30,624 | |
Interest | 737 | |
Miscellaneous | 74,884 | |
Total expenses before reductions | 65,589,575 | |
Expense reductions | (2,430,730) | 63,158,845 |
Net investment income (loss) | | 273,702,376 |
Realized and Unrealized Gain (Loss) Net realized gain (loss) on: | | |
Investment securities: | | |
Unaffiliated issuers | 90,035,881 | |
Foreign currency transactions | (1,752,342) | |
Total net realized gain (loss) | | 88,283,539 |
Change in net unrealized appreciation (depreciation) on: Investment securities | 445,557,567 | |
Assets and liabilities in foreign currencies | (424,386) | |
Total change in net unrealized appreciation (depreciation) | | 445,133,181 |
Net gain (loss) | | 533,416,720 |
Net increase (decrease) in net assets resulting from operations | | $ 807,119,096 |
See accompanying notes which are an integral part of the financial statements.
Annual Report
Fidelity Series International Value Fund
Financial Statements - continued
Statement of Changes in Net Assets
| Year ended
October 31,
2012 | Year ended
October 31,
2011 |
Increase (Decrease) in Net Assets | | |
Operations | | |
Net investment income (loss) | $ 273,702,376 | $ 184,261,271 |
Net realized gain (loss) | 88,283,539 | (943,882,298) |
Change in net unrealized appreciation (depreciation) | 445,133,181 | (137,967,980) |
Net increase (decrease) in net assets resulting
from operations | 807,119,096 | (897,589,007) |
Distributions to shareholders from net investment income | (180,442,293) | (69,464,545) |
Distributions to shareholders from net realized gain | - | (19,166,449) |
Total distributions | (180,442,293) | (88,630,994) |
Share transactions - net increase (decrease) | 2,136,137,238 | 2,850,091,917 |
Total increase (decrease) in net assets | 2,762,814,041 | 1,863,871,916 |
| | |
Net Assets | | |
Beginning of period | 6,459,453,722 | 4,595,581,806 |
End of period (including undistributed net investment income of $242,455,171 and undistributed net investment income of $149,195,087, respectively) | $ 9,222,267,763 | $ 6,459,453,722 |
See accompanying notes which are an integral part of the financial statements.
Annual Report
Financial Highlights - Series International Value
Years ended October 31, | 2012 | 2011 | 2010 H |
Selected Per-Share Data | | | |
Net asset value, beginning of period | $ 8.59 | $ 9.91 | $ 10.00 |
Income from Investment Operations | | | |
Net investment income (loss) D | .29 | .30 | .18 |
Net realized and unrealized gain (loss) | .50 | (1.45) | (.27) G |
Total from investment operations | .79 | (1.15) | (.09) |
Distributions from net investment income | (.22) | (.13) | - |
Distributions from net realized gain | - | (.04) | - |
Total distributions | (.22) | (.17) | - |
Net asset value, end of period | $ 9.16 | $ 8.59 | $ 9.91 |
Total Return B, C | 9.56% | (11.84)% | (.90)% |
Ratios to Average Net Assets E, I | | | |
Expenses before reductions | .90% | .95% | 1.01% A |
Expenses net of fee waivers, if any | .90% | .95% | 1.01% A |
Expenses net of all reductions | .87% | .93% | .99% A |
Net investment income (loss) | 3.35% | 3.05% | 2.24% A |
Supplemental Data | | | |
Net assets, end of period (000 omitted) | $ 5,107,633 | $ 4,503,487 | $ 3,865,058 |
Portfolio turnover rate F | 63% | 78% | 72% A |
A Annualized
B Total returns for periods of less than one year are not annualized.
C Total returns would have been lower if certain expenses had not been reduced during the applicable periods shown.
D Calculated based on average shares outstanding during the period.
E Fees and expenses of any underlying Fidelity Central Funds are not included in the Fund's expense ratio. The Fund indirectly bears its proportionate share of the expenses of any underlying Fidelity Central Funds.
F Amount does not include the portfolio activity of any underlying Fidelity Central Funds.
G The amount shown for a share outstanding does not correspond with the aggregate net gain (loss) on investments for the period due to the timing of sales and repurchases of shares in relation to fluctuating market values of the investments of the Fund.
H For the period December 3, 2009 (commencement of operations) to October 31, 2010.
I Expense ratios reflect operating expenses of the class. Expenses before reductions do not reflect amounts reimbursed by the investment adviser or reductions from brokerage service arrangements or reductions from other expense offset arrangements and do not represent the amount paid by the class during periods when reimbursements or reductions occur. Expense ratios before reductions for start-up periods may not be representative of longer-term operating periods. Expenses net of fee waivers reflect expenses after reimbursement by the investment adviser but prior to reductions from brokerage service arrangements or other expense offset arrangements. Expenses net of all reductions represent the net expenses paid by the class.
See accompanying notes which are an integral part of the financial statements.
Annual Report
Financial Highlights - Class F
Years ended October 31, | 2012 | 2011 | 2010 H |
Selected Per-Share Data | | | |
Net asset value, beginning of period | $ 8.62 | $ 9.93 | $ 10.00 |
Income from Investment Operations | | | |
Net investment income (loss) D | .30 | .31 | .20 |
Net realized and unrealized gain (loss) | .51 | (1.44) | (.27) G |
Total from investment operations | .81 | (1.13) | (.07) |
Distributions from net investment income | (.24) | (.14) | - |
Distributions from net realized gain | - | (.04) | - |
Total distributions | (.24) | (.18) | - |
Net asset value, end of period | $ 9.19 | $ 8.62 | $ 9.93 |
Total Return B, C | 9.77% | (11.61)% | (.70)% |
Ratios to Average Net Assets E, I | | | |
Expenses before reductions | .70% | .74% | .78% A |
Expenses net of fee waivers, if any | .70% | .74% | .78% A |
Expenses net of all reductions | .67% | .72% | .75% A |
Net investment income (loss) | 3.55% | 3.26% | 2.47% A |
Supplemental Data | | | |
Net assets, end of period (000 omitted) | $ 4,114,635 | $ 1,955,967 | $ 730,524 |
Portfolio turnover rate F | 63% | 78% | 72% A |
A Annualized
B Total returns for periods of less than one year are not annualized.
C Total returns would have been lower if certain expenses had not been reduced during the applicable periods shown.
D Calculated based on average shares outstanding during the period.
E Fees and expenses of any underlying Fidelity Central Funds are not included in the Fund's expense ratio. The Fund indirectly bears its proportionate share of the expenses of any underlying Fidelity Central Funds.
F Amount does not include the portfolio activity of any underlying Fidelity Central Funds.
G The amount shown for a share outstanding does not correspond with the aggregate net gain (loss) on investments for the period due to the timing of sales and repurchases of shares in relation to fluctuating market values of the investments of the Fund.
H For the period December 3, 2009 (commencement of operations) to October 31, 2010.
I Expense ratios reflect operating expenses of the class. Expenses before reductions do not reflect amounts reimbursed by the investment adviser or reductions from brokerage service arrangements or reductions from other expense offset arrangements and do not represent the amount paid by the class during periods when reimbursements or reductions occur. Expense ratios before reductions for start-up periods may not be representative of longer-term operating periods. Expenses net of fee waivers reflect expenses after reimbursement by the investment adviser but prior to reductions from brokerage service arrangements or other expense offset arrangements. Expenses net of all reductions represent the net expenses paid by the class.
See accompanying notes which are an integral part of the financial statements.
Annual Report
Notes to Financial Statements
For the period ended October 31, 2012
1. Organization.
Fidelity Series Emerging Markets Fund, Fidelity Series International Growth Fund, Fidelity Series International Small Cap Fund and Fidelity Series International Value Fund (the Funds) are funds of Fidelity Investment Trust (the Trust). The Trust is registered under the Investment Company Act of 1940, as amended (the 1940 Act), as an open-end management investment company organized as a Massachusetts business trust. Each Fund is authorized to issue an unlimited number of shares. Shares of the Funds are only available for purchase by mutual funds for which Fidelity Management & Research Company (FMR) or an affiliate serves as an investment manager. Fidelity Series Emerging Markets Fund offers Series Emerging Markets shares and Class F shares. Fidelity Series International Growth Fund offers Series International Growth shares and Class F shares. Fidelity Series International Small Cap Fund offers Series International Small Cap shares and Class F shares. Fidelity Series International Value Fund offers Series International Value shares and Class F shares. All classes have equal rights as to assets and voting privileges. Each class has exclusive voting rights with respect to matters that affect that class. Investment income, realized and unrealized capital gains and losses, the common expenses of each Fund, and certain fund-level expense reductions, if any, are allocated on a pro-rata basis to each class based on the relative net assets of each class to the total net assets of each Fund. Each class differs with respect to transfer agent fees incurred and certain class-level expense reductions. Certain Funds' investments in emerging markets can be subject to social, economic, regulatory, and political uncertainties and can be extremely volatile.
2. Investments in Fidelity Central Funds.
The Funds invest in Fidelity Central Funds, which are open-end investment companies available only to other investment companies and accounts managed by FMR and its affiliates. The Funds' Schedules of Investments list each of the Fidelity Central Funds held as of period end, if any, as an investment of each Fund, but does not include the underlying holdings of each Fidelity Central Fund. As an Investing Fund, each Fund indirectly bears its proportionate share of the expenses of the underlying Fidelity Central Funds.
The Money Market Central Funds seek preservation of capital and current income and are managed by Fidelity Investments Money Management, Inc. (FIMM), an affiliate of FMR.
A complete unaudited list of holdings for each Fidelity Central Fund is available upon request or at the Securities and Exchange Commission (the SEC) web site at www.sec.gov. In addition, the financial statements of the Fidelity Central Funds, which are not covered by the Funds' Reports of Independent Registered Public Accounting Firm, are available on the SEC web site or upon request.
Annual Report
Notes to Financial Statements - continued
3. Significant Accounting Policies.
The financial statements have been prepared in conformity with accounting principles generally accepted in the United States of America (GAAP), which require management to make certain estimates and assumptions at the date of the financial statements. Actual results could differ from those estimates. Subsequent events, if any, through the date that the financial statements were issued have been evaluated in the preparation of the financial statements. The following summarizes the significant accounting policies of the Funds:
Security Valuation. Investments are valued as of 4:00 p.m. Eastern time on the last calendar day of the period. In accordance with valuation policies and procedures approved by the Board of Trustees (the Board), each Fund attempts to obtain prices from one or more third party pricing vendors or brokers to value its investments. When current market prices, quotations or rates are not readily available or reliable, securities will be fair valued in good faith by the FMR Fair Value Committee (the Committee), in accordance with procedures adopted by each Fund's Board. Factors used in determining fair value vary by security type and may include market or security specific events. The frequency with which these procedures are used cannot be predicted and they may be utilized to a significant extent. The Committee oversees each Fund's valuation policies and procedures and is responsible for approving and reporting to the Board all fair value determinations.
Each Fund categorizes the inputs to valuation techniques used to value their investments into a disclosure hierarchy consisting of three levels as shown below:
Level 1 - quoted prices in active markets for identical investments
Level 2 - other significant observable inputs (including quoted prices for similar investments, interest rates, prepayment speeds, etc.)
Level 3 - unobservable inputs (including the Fund's own assumptions based on the best information available)
Valuation techniques used to value each Fund's investments by major category are as follows:
Equity securities, including restricted securities, for which market quotations are readily available, are valued at the last reported sale price or official closing price as reported by a third party pricing vendor on the primary market or exchange on which they are traded and are categorized as Level 1 in the hierarchy. In the event there were no sales during the day or closing prices are not available, securities are valued at the last quoted bid price or may be valued using the last available price and are generally categorized as Level 2 in the hierarchy. For foreign equity securities, when significant market or security specific events arise, comparisons to the valuation of American Depositary Receipts
Annual Report
3. Significant Accounting Policies - continued
Security Valuation - continued
(ADRs), futures contracts, Exchange-Traded Funds (ETFs)and certain indexes as well as quoted prices for similar securities are used and are categorized as Level 2 in the hierarchy. Utilizing these techniques may result in transfers between Level 1 and Level 2.
Investments in open-end mutual funds, including the Fidelity Central Funds, are valued at their closing net asset value (NAV) each business day and are categorized as Level 1 in the hierarchy.
Changes in valuation techniques may result in transfers in or out of an assigned level within the disclosure hierarchy. The aggregate value of investments by input level, as of October 31, 2012, including information on transfers between Levels 1 and 2, is included at the end of each applicable Fund's Schedule of Investments.
Foreign Currency Translation. The Funds may use foreign currency contracts to facilitate transactions in foreign-denominated securities. Gains and losses from these transactions may arise from changes in the value of the foreign currency or if the counterparties do not perform under the contracts' terms.
Foreign-denominated assets, including investment securities, and liabilities are translated into U.S. dollars at the exchange rates at period end. Purchases and sales of investment securities, income and dividends received and expenses denominated in foreign currencies are translated into U.S. dollars at the exchange rate in effect on the transaction date.
The effects of exchange rate fluctuations on investments are included with the net realized and unrealized gain (loss) on investment securities. Other foreign currency transactions resulting in realized and unrealized gain (loss) are disclosed separately.
Investment Transactions and Income. For financial reporting purposes, the Funds' investment holdings and NAV include trades executed through the end of the last business day of the period. The NAV per share for processing shareholder transactions is calculated as of the close of business of the New York Stock Exchange (NYSE), normally 4:00 p.m. Eastern time and includes trades executed through the end of the prior business day. Gains and losses on securities sold are determined on the basis of identified cost. Dividend income is recorded on the ex-dividend date, except for certain dividends from foreign securities where the ex-dividend date may have passed, which are recorded as soon as the Funds are informed of the ex-dividend date. Non-cash dividends included in dividend income, if any, are recorded at the fair market value of the securities received. Distributions received on securities that represent a return of capital or capital gain are recorded as a reduction of cost of investments and/or as a realized gain. The Funds estimate the components of distributions received that may be considered return
Annual Report
Notes to Financial Statements - continued
3. Significant Accounting Policies - continued
Investment Transactions and Income - continued
of capital distributions or capital gain distributions. Interest income and distributions from the Fidelity Central Funds are accrued as earned. Interest income includes coupon interest and amortization of premium and accretion of discount on debt securities. Investment income is recorded net of foreign taxes withheld where recovery of such taxes is uncertain.
Expenses. Expenses directly attributable to a fund are charged to that fund. Expenses attributable to more than one fund are allocated among the respective funds on the basis of relative net assets or other appropriate methods. Expense estimates are accrued in the period to which they relate and adjustments are made when actual amounts are known.
Income Tax Information and Distributions to Shareholders. Each year, each Fund intends to qualify as a regulated investment company under Subchapter M of the Internal Revenue Code, including distributing substantially all of its taxable income and realized gains. As a result, no provision for income taxes is required. As of October 31, 2012, each Fund did not have any unrecognized tax benefits in the financial statements; nor is each Fund aware of any tax positions for which it is reasonably possible that the total amounts of unrecognized tax benefits will significantly change in the next twelve months. Each Fund files a U.S. federal tax return, in addition to state and local tax returns as required. A fund's federal income tax returns are subject to examination by the Internal Revenue Service (IRS) for a period of three fiscal years after they are filed. State and local tax returns may be subject to examination for an additional fiscal year depending on the jurisdiction. Foreign taxes are provided for based on each Fund's understanding of the tax rules and rates that exist in the foreign markets in which it invests. Fidelity Series Emerging Markets Fund and Fidelity Series International Small Cap Fund are subject to a tax imposed on capital gains by certain countries in which they invest. An estimated deferred tax liability for net unrealized appreciation on the applicable securities is included in Other payables and accrued expenses on the Statement of Assets & Liabilities.
Distributions are declared and recorded on the ex-dividend date. Income dividends and capital gain distributions are declared separately for each class. Income and capital gain distributions are determined in accordance with income tax regulations, which may differ from GAAP.
Capital accounts within the financial statements are adjusted for permanent book-tax differences. These adjustments have no impact on net assets or the results of operations. Temporary book-tax differences will reverse in a subsequent period.
Annual Report
3. Significant Accounting Policies - continued
Income Tax Information and Distributions to Shareholders - continued
Book-tax differences are primarily due to foreign currency transactions, certain foreign taxes, passive foreign investment companies (PFIC), partnerships, capital loss carryforwards and losses deferred due to wash sales.
The federal tax cost of investment securities and unrealized appreciation (depreciation) as of period end were as follows for each Fund:
| Tax cost | Gross unrealized
appreciation | Gross unrealized
depreciation | Net unrealized
appreciation
(depreciation) on
securities and
other investments |
Fidelity Series Emerging Markets Fund | $ 5,388,970,193 | $ 791,214,882 | $ (390,255,392) | $ 400,959,490 |
Fidelity Series International Growth Fund | 7,938,378,488 | 1,518,714,379 | (246,336,094) | 1,272,378,285 |
Fidelity Series International Small Cap Fund | 1,677,569,934 | 327,019,745 | (77,937,847) | 249,081,898 |
Fidelity Series International Value Fund | 8,697,347,497 | 879,524,951 | (346,841,866) | 532,683,085 |
The tax-based components of distributable earnings as of period end were as follows for each Fund:
| Undistributed
ordinary income | Capital loss
carryforward | Net unrealized
appreciation
(depreciation) |
Fidelity Series Emerging Markets Fund | $ 76,006,739 | $ (290,504,181) | $ 400,512,223 |
Fidelity Series International Growth Fund | 115,582,243 | (325,309,483) | 1,271,937,216 |
Fidelity Series International Small Cap Fund | 21,040,992 | (26,964,812) | 248,985,043 |
Fidelity Series International Value Fund | 297,037,400 | (832,761,824) | 532,116,911 |
Annual Report
Notes to Financial Statements - continued
3. Significant Accounting Policies - continued
Income Tax Information and Distributions to Shareholders - continued
Capital loss carryforwards are only available to offset future capital gains of the Funds to the extent provided by regulations and may be limited. Under the Regulated Investment Company Modernization Act of 2010 (the Act), the Funds are permitted to carry forward capital losses incurred in taxable years beginning after December 22, 2010 for an unlimited period and such capital losses are required to be used prior to any losses that expire. Capital loss carryforwards were as follows:
| Fiscal year of expiration | |
| 2018 | 2019 | Total with
expiration |
| | | |
Fidelity Series International Growth Fund | $ (27,059,158) | $ (128,916,542) | $ (155,975,700) |
Fidelity Series International Small Cap Fund | - | (9,932,450) | (9,932,450) |
Fidelity Series International Value Fund | - | (832,761,824) | (832,761,824) |
| No expiration | | |
| Short-term | Long-term | Total no
expiration | Total capital loss
carryfoward |
Fidelity Series Emerging Markets Fund | $ (258,307,406) | $ (32,196,775) | $ (290,504,181) | $ (290,504,181) |
Fidelity Series International Growth Fund | (140,624,568) | (28,709,215) | (169,333,783) | (325,309,483) |
Fidelity Series International Small Cap Fund | (17,032,362) | - | (17,032,362) | (26,964,812) |
Fidelity Series International Value Fund | - | - | - | (832,761,824) |
The tax character of distributions paid was as follows:
October 31, 2012 | | | |
| Ordinary Income | Long-term
Capital Gains | Total |
Fidelity Series Emerging Markets Fund | $ 37,299,957 | $ 152,630,224 | $ 189,930,181 |
Fidelity Series International Growth Fund | 91,195,077 | - | 91,195,077 |
Fidelity Series International Small Cap Fund | 17,445,879 | - | 17,445,879 |
Fidelity Series International Value Fund | 180,442,293 | - | 180,442,293 |
Annual Report
3. Significant Accounting Policies - continued
Income Tax Information and Distributions to Shareholders - continued
October 31, 2011 | | | |
| Ordinary Income | Long-term
Capital Gains | Total |
Fidelity Series Emerging Markets Fund | $ 65,102,939 | $ 61,559,932 | $ 126,662,871 |
Fidelity Series International Growth Fund | 29,959,620 | - | 29,959,620 |
Fidelity Series International Small Cap Fund | 14,316,862 | - | 14,316,862 |
Fidelity Series International Value Fund | 88,630,994 | - | 88,630,994 |
Restricted Securities. The Funds may invest in securities that are subject to legal or contractual restrictions on resale. These securities generally may be resold in transactions exempt from registration or to the public if the securities are registered. Disposal of these securities may involve time-consuming negotiations and expense, and prompt sale at an acceptable price may be difficult. Information regarding restricted securities is included at the end of each applicable Fund's Schedule of Investments.
New Accounting Pronouncement. In December 2011, the Financial Accounting Standards Board issued Accounting Standard Update No. 2011-11, Disclosures about Offsetting Assets and Liabilities. The update creates new disclosure requirements requiring entities to disclose both gross and net information for derivatives and other financial instruments that are either offset in the Statement of Assets and Liabilities or subject to an enforceable master netting arrangement or similar agreement. The disclosure requirements are effective for annual reporting periods beginning on or after January 1, 2013, and interim periods within those annual periods. Management is currently evaluating the impact of the update's adoption on the Funds' financial statement disclosures.
4. Purchases and Sales of Investments.
Purchases and sales of securities, other than short-term securities, are noted in the table below.
| Purchases ($) | Sales ($) |
Fidelity Series Emerging Markets Fund | 4,754,785,458 | 4,114,929,797 |
Fidelity Series International Growth Fund | 3,370,284,668 | 2,157,268,925 |
Fidelity Series International Small Cap Fund | 502,307,426 | 402,674,614 |
Fidelity Series International Value Fund | 7,153,218,030 | 4,951,132,011 |
Fidelity Series International Small Cap Fund realized a loss on the sale of an investment not meeting the investment restrictions of the Fund. The loss was fully reimbursed by the Fund's investment advisor.
Annual Report
Notes to Financial Statements - continued
5. Fees and Other Transactions with Affiliates.
Management Fee. FMR and its affiliates provide the Funds with investment management related services for which the Funds pay a monthly management fee. The management fee is the sum of an individual fund fee rate and an annualized group fee rate. The individual fund fee rate is applied to each Fund's average net assets. The group fee rate is based upon the average net assets of all the mutual funds advised by FMR. The group fee rate decreases as assets under management increase and increases as assets under management decrease. In addition, the management fee for Fidelity Series International Growth Fund, Fidelity Series International Small Cap Fund and Fidelity Series International Value Fund is subject to a performance adjustment (up to a maximum ± .20% of each applicable Fund's average net assets over a 36 month performance period). The upward or downward adjustment to the management fee is based on each applicable Fund's relative investment performance of the retail class as compared to an appropriate benchmark index. Each applicable Fund's performance adjustment took effect in December 2010. Subsequent months will be added until the performance period includes 36 months.
For the period, each Fund's annual management fee rate expressed as a percentage of each Fund's average net assets, including the performance adjustment, if applicable was as follows:
| Individual Rate | Group Rate | Total |
Fidelity Series Emerging Markets Fund | .55% | .26% | .81% |
Fidelity Series International Growth Fund | .45% | .26% | .82% |
Fidelity Series International Small Cap Fund | .60% | .26% | .95% |
Fidelity Series International Value Fund | .45% | .26% | .67% |
Transfer Agent Fees. Fidelity Investments Institutional Operations Company, Inc. (FIIOC), an affiliate of FMR, is the transfer, dividend disbursing and shareholder servicing agent for each class of the Funds. FIIOC receives account fees and asset-based fees that vary according to the account size and type of account of the shareholders of the respective classes of each Fund except for Class F. FIIOC receives no fees for providing transfer agency services to Class F. FIIOC pays for typesetting, printing and mailing of shareholder reports, except proxy statements. For the period, transfer agent fees for each class were as follows:
Fidelity Series Emerging Markets Fund | Amount | % of
Average
Net Assets |
Series Emerging Markets | $ 6,529,370 | .20 |
Fidelity Series International Growth Fund | | |
Series International Growth | $ 10,136,552 | .20 |
Fidelity Series International Small Cap Fund | | |
Series International Small Cap | $ 2,088,327 | .20 |
Fidelity Series International Value Fund | | |
Series International Value | $ 9,750,910 | .20 |
Annual Report
5. Fees and Other Transactions with Affiliates - continued
Accounting and Security Lending Fees. Fidelity Service Company, Inc. (FSC), an affiliate of FMR, maintains each Fund's accounting records. The accounting fee is based on the level of average net assets for each month. Under a separate contract, FSC administers the security lending program. The security lending fee is based on the number and duration of lending transactions.
Brokerage Commissions. Certain Funds placed a portion of their portfolio transactions with brokerage firms which are affiliates of the investment adviser. The commissions paid to these affiliated firms were as follows:
| Amount |
Fidelity Series Emerging Markets Fund | $ 16,317 |
Fidelity Series International Growth Fund | 10,110 |
Fidelity Series International Small Cap Fund | 1,126 |
Fidelity Series International Value Fund | 2,999 |
Interfund Lending Program. Pursuant to an Exemptive Order issued by the SEC, the Funds, along with other registered investment companies having management contracts with FMR, may participate in an interfund lending program. This program provides an alternative credit facility allowing the funds to borrow from, or lend money to, other participating affiliated funds. At period end, there were no interfund loans outstanding. Each applicable fund's activity in this program during the period for which loans were outstanding was as follows:
| Borrower or
Lender | Average Loan
Balance | Weighted
Average
Interest Rate | Interest Expense |
Fidelity Series International Value Fund | Borrower | $ 10,489,429 | .36% | $ 737 |
6. Committed Line of Credit.
Certain Funds participate with other funds managed by FMR or an affiliate in a $4.25 billion credit facility (the "line of credit") to be utilized for temporary or emergency purposes to fund shareholder redemptions or for other short-term liquidity purposes. The participating funds have agreed to pay commitment fees on their pro-rata portion of the line of credit, which are reflected in Miscellaneous expenses on the Statement of Operations, and are as follows:
Fidelity Series Emerging Markets Fund | $ 14,216 |
Fidelity Series International Growth Fund | 22,054 |
Fidelity Series International Small Cap Fund | 4,579 |
Fidelity Series International Value Fund | 21,030 |
During the period, there were no borrowings on this line of credit.
Annual Report
Notes to Financial Statements - continued
7. Security Lending.
Certain Funds lend portfolio securities through a lending agent from time to time in order to earn additional income. For equity securities, a lending agent is used and may loan securities to certain qualified borrowers, including Fidelity Capital Markets (FCM), a broker-dealer affiliated with the Funds. On the settlement date of the loan, each applicable Fund receives collateral (in the form of U.S. Treasury obligations, letters of credit and/or cash) against the loaned securities and maintains collateral in an amount not less than 100% of the market value of the loaned securities during the period of the loan. The market value of the loaned securities is determined at the close of business of the Funds and any additional required collateral is delivered to the Funds on the next business day. If the borrower defaults on its obligation to return the securities loaned because of insolvency or other reasons, a fund could experience delays and costs in recovering the securities loaned or in gaining access to the collateral. Any cash collateral received is invested in the Fidelity Securities Lending Cash Central Fund. The value of loaned securities and cash collateral at period end are disclosed on each applicable Fund's Statement of Assets and Liabilities. At period end, there were no security loans outstanding with FCM. Security lending income represents the income earned on investing cash collateral, less rebates paid to borrowers and any lending agent fees associated with the loan, plus any premium payments received for lending certain types of securities. Security lending income is presented on each applicable Fund's Statement of Operations as a component of income from Fidelity Central Funds. Security lending activity as of and during the period was as follows:
| Total Security
Lending Income | Security Lending
Income From
Securities Loaned
to FCM |
Fidelity Series Emerging Markets Fund | $ 432,747 | $ 274 |
Fidelity Series International Growth Fund | $ 3,513,538 | $ 580 |
Fidelity Series International Small Cap Fund | $ 646,132 | $ - |
Fidelity Series International Value Fund | $ 11,387,633 | $ 454 |
Annual Report
8. Expense Reductions.
Many of the brokers with whom FMR places trades on behalf of certain Funds provided services to these Funds in addition to trade execution. These services included payments of expenses on behalf of each applicable Fund. In addition, through arrangements with each applicable Fund's custodian, credits realized as a result of uninvested cash balances were used to reduce the Fund's expenses. All of the applicable expense reductions are noted in the table below.
| Brokerage
Service
reduction | Custody
expense
reduction |
| | |
Fidelity Series Emerging Markets Fund | $ 1,691,243 | $ 129 |
Fidelity Series International Growth Fund | 686,282 | 80 |
Fidelity Series International Small Cap Fund | 111,705 | 4 |
Fidelity Series International Value Fund | 2,430,587 | 143 |
9. Distributions to Shareholders.
Distributions to shareholders of each class were as follows:
Years ended October 31, | 2012 | 2011 |
Fidelity Series Emerging Markets Fund | | |
From net investment income | | |
Series Emerging Markets | $ 19,056,860 | $ 12,963,515 |
Class F | 12,443,149 | 3,863,477 |
Total | $ 31,500,009 | $ 16,826,992 |
From net realized gain | | |
Series Emerging Markets | $ 106,349,572 | $ 89,686,359 |
Class F | 52,080,600 | 20,149,520 |
Total | $ 158,430,172 | $ 109,835,879 |
Fidelity Series International Growth Fund | | |
From net investment income | | |
Series International Growth | $ 54,043,921 | $ 20,001,889 |
Class F | 32,249,072 | 5,267,744 |
Total | $ 86,292,993 | $ 25,269,633 |
From net realized gain | | |
Series International Growth | $ 3,289,630 | $ 3,829,643 |
Class F | 1,612,454 | 860,344 |
Total | $ 4,902,084 | $ 4,689,987 |
Fidelity Series International Small Cap Fund | | |
From net investment income | | |
Series International Small Cap | $ 10,151,789 | $ 6,519,818 |
Class F | 6,009,596 | 1,672,862 |
Total | $ 16,161,385 | $ 8,192,680 |
Annual Report
Notes to Financial Statements - continued
9. Distributions to Shareholders - continued
Years ended October 31, | 2012 | 2011 |
From net realized gain | | |
Series International Small Cap | $ 861,944 | $ 5,000,638 |
Class F | 422,550 | 1,123,544 |
Total | $ 1,284,494 | $ 6,124,182 |
Fidelity Series International Value Fund | | |
From net investment income | | |
Series International Value | $ 118,015,488 | $ 55,879,024 |
Class F | 62,426,805 | 13,585,521 |
Total | $ 180,442,293 | $ 69,464,545 |
From net realized gain | | |
Series International Value | $ - | $ 15,652,284 |
Class F | - | 3,514,165 |
Total | $ - | $ 19,166,449 |
10. Share Transactions.
Transactions for each class of shares were as follows:
| Shares | Dollars |
Years ended October 31, | 2012 | 2011 | 2012 | 2011 |
Fidelity Series Emerging
Markets Fund | | | | |
Series Emerging Markets | | | |
Shares sold | 31,451,952 | 110,983,487 | $ 484,451,657 | $ 1,927,221,177 |
Reinvestment of distributions | 8,531,050 | 5,501,065 | 125,406,431 | 102,649,874 |
Shares redeemed | (54,815,665) | (34,406,501) | (853,291,218) | (605,551,460) |
Net increase (decrease) | (14,832,663) | 82,078,051 | $ (243,433,130) | $ 1,424,319,591 |
Class F | | | | |
Shares sold | 67,812,678 | 70,265,019 | $ 1,052,327,163 | $ 1,219,851,930 |
Reinvestment of distributions | 4,383,407 | 1,285,492 | 64,523,749 | 24,012,997 |
Shares redeemed | (5,795,660) | (4,258,591) | (91,577,596) | (71,872,048) |
Net increase (decrease) | 66,400,425 | 67,291,920 | $ 1,025,273,316 | $ 1,171,992,879 |
Fidelity Series International
Growth Fund | | | | |
Series International Growth | | | | |
Shares sold | 74,889,920 | 199,240,913 | $ 802,763,519 | $ 2,197,620,267 |
Reinvestment of distributions | 5,615,431 | 2,139,059 | 57,333,551 | 23,831,532 |
Shares redeemed | (118,422,240) | (89,024,200) | (1,274,656,413) | (974,623,034) |
Net increase (decrease) | (37,916,889) | 112,355,772 | $ (414,559,343) | $ 1,246,828,765 |
Annual Report
10. Share Transactions - continued
| Shares | Dollars |
Years ended October 31, | 2012 | 2011 | 2012 | 2011 |
Class F | | | | |
Shares sold | 152,782,939 | 146,529,108 | $ 1,648,033,706 | $ 1,611,081,104 |
Reinvestment of distributions | 3,310,022 | 549,703 | 33,861,526 | 6,128,088 |
Shares redeemed | (10,402,417) | (10,293,869) | (113,389,155) | (110,003,185) |
Net increase (decrease) | 145,690,544 | 136,784,942 | $ 1,568,506,077 | $ 1,507,206,007 |
Fidelity Series International
Small Cap Fund | | | | |
Series International Small Cap | | | | |
Shares sold | 10,958,013 | 53,908,450 | $ 125,024,787 | $ 631,399,700 |
Reinvestment of distributions | 1,029,321 | 981,018 | 11,013,733 | 11,520,456 |
Shares redeemed | (26,995,589) | (17,761,732) | (307,921,860) | (206,339,970) |
Net increase (decrease) | (15,008,255) | 37,127,736 | $ (171,883,340) | $ 436,580,186 |
Class F | | | | |
Shares sold | 28,473,754 | 33,128,289 | $ 323,989,745 | $ 386,033,238 |
Reinvestment of distributions | 600,014 | 238,000 | 6,432,146 | 2,796,406 |
Shares redeemed | (4,713,797) | (2,098,084) | (55,112,933) | (23,840,363) |
Net increase (decrease) | 24,359,971 | 31,268,205 | $ 275,308,958 | $ 364,989,281 |
Fidelity Series International
Value Fund | | | | |
Series International Value | | | | |
Shares sold | 161,153,053 | 234,577,356 | $ 1,352,278,473 | $ 2,316,609,509 |
Reinvestment of distributions | 14,462,682 | 7,268,202 | 118,015,488 | 71,531,308 |
Shares redeemed | (141,961,766) | (107,758,811) | (1,195,927,164) | (1,035,580,685) |
Net increase (decrease) | 33,653,969 | 134,086,747 | $ 274,366,797 | $ 1,352,560,132 |
Class F | | | | |
Shares sold | 225,653,958 | 165,152,487 | $ 1,901,915,436 | $ 1,606,189,266 |
Reinvestment of distributions | 7,640,980 | 1,734,189 | 62,426,805 | 17,099,686 |
Shares redeemed | (12,312,893) | (13,565,563) | (102,571,800) | (125,757,167) |
Net increase (decrease) | 220,982,045 | 153,321,113 | $ 1,861,770,441 | $ 1,497,531,785 |
Annual Report
Notes to Financial Statements - continued
11. Other.
The Funds' organizational documents provide former and current trustees and officers with a limited indemnification against liabilities arising in connection with the performance of their duties to the Funds. In the normal course of business, the Funds may also enter into contracts that provide general indemnifications. The Funds' maximum exposure under these arrangements is unknown as this would be dependent on future claims that may be made against the Funds. The risk of material loss from such claims is considered remote.
At the end of the period, mutual funds managed by FMR or an FMR affiliate were the owners of record of all of the outstanding shares of the Funds.
Annual Report
To the Trustees of Fidelity Investment Trust and the Shareholders of Fidelity Series Emerging Markets Fund, Fidelity Series International Small Cap Fund and Fidelity Series International Value Fund:
We have audited the accompanying statements of assets and liabilities of Fidelity Series Emerging Markets Fund, Fidelity Series International Small Cap Fund and Fidelity Series International Value Fund (the Funds), including the schedules of investments, as of October 31, 2012, and the related statements of operations for the year then ended, the statements of changes in net assets for each of the two years in the period then ended, and the financial highlights for each of the periods presented. These financial statements and financial highlights are the responsibility of the Funds' management. Our responsibility is to express an opinion on these financial statements and financial highlights based on our audits.
We conducted our audits in accordance with the standards of the Public Company Accounting Oversight Board (United States). Those standards require that we plan and perform the audit to obtain reasonable assurance about whether the financial statements and financial highlights are free of material misstatement. The Funds are not required to have, nor were we engaged to perform, an audit of their internal control over financial reporting. Our audits included consideration of internal control over financial reporting as a basis for designing audit procedures that are appropriate in the circumstances, but not for the purpose of expressing an opinion on the effectiveness of the Funds' internal control over financial reporting. Accordingly, we express no such opinion. An audit also includes examining, on a test basis, evidence supporting the amounts and disclosures in the financial statements, assessing the accounting principles used and significant estimates made by management, as well as evaluating the overall financial statement presentation. Our procedures included confirmation of securities owned as of October 31, 2012, by correspondence with the custodians and brokers; where replies were not received from brokers, we performed other auditing procedures. We believe that our audits provide a reasonable basis for our opinion.
In our opinion, the financial statements and financial highlights referred to above present fairly, in all material respects, the financial position of Fidelity Series Emerging Markets Fund, Fidelity Series International Small Cap Fund and Fidelity Series International Value Fund as of October 31, 2012, the results of their operations for the year then ended, the changes in their net assets for each of the two years in the period then ended, and the financial highlights for each of the periods presented, in conformity with accounting principles generally accepted in the United States of America.
DELOITTE & TOUCHE LLP
Boston, Massachusetts
December 18, 2012
Annual Report
Report of Independent Registered Public Accounting Firm
To the Trustees of Fidelity Investment Trust and the Shareholders of Fidelity Series International Growth Fund:
In our opinion, the accompanying statement of assets and liabilities, including the schedule of investments, and the related statements of operations and of changes in net assets and the financial highlights present fairly, in all material respects, the financial position of Fidelity Series International Growth Fund (a fund of Fidelity Investment Trust) at October 31, 2012, the results of its operations for the year then ended, the changes in its net assets for each of the periods indicated and the financial highlights for each of the periods indicated, in conformity with accounting principles generally accepted in the United States of America. These financial statements and financial highlights (hereafter referred to as "financial statements") are the responsibility of the Fidelity Series International Growth Fund's management. Our responsibility is to express an opinion on these financial statements based on our audits. We conducted our audits of these financial statements in accordance with the standards of the Public Company Accounting Oversight Board (United States). Those standards require that we plan and perform the audit to obtain reasonable assurance about whether the financial statements are free of material misstatement. An audit includes examining, on a test basis, evidence supporting the amounts and disclosures in the financial statements, assessing the accounting principles used and significant estimates made by management, and evaluating the overall financial statement presentation. We believe that our audits, which included confirmation of securities at October 31, 2012 by correspondence with the custodian and brokers, provide a reasonable basis for our opinion.
PricewaterhouseCoopers LLP
Boston, Massachusetts
December 18, 2012
Annual Report
The Trustees, Members of the Advisory Board, and executive officers of the trust and funds, as applicable, are listed below. The Board of Trustees governs each fund and is responsible for protecting the interests of shareholders. The Trustees are experienced executives who meet periodically throughout the year to oversee each fund's activities, review contractual arrangements with companies that provide services to each fund, oversee management of the risks associated with such activities and contractual arrangements, and review each fund's performance. Except for James C. Curvey, each of the Trustees oversees 236 funds advised by FMR or an affiliate. Mr. Curvey oversees 443 funds advised by FMR or an affiliate.
The Trustees hold office without limit in time except that (a) any Trustee may resign; (b) any Trustee may be removed by written instrument, signed by at least two-thirds of the number of Trustees prior to such removal; (c) any Trustee who requests to be retired or who has become incapacitated by illness or injury may be retired by written instrument signed by a majority of the other Trustees; and (d) any Trustee may be removed at any special meeting of shareholders by a two-thirds vote of the outstanding voting securities of the trust. Each Trustee who is not an interested person (as defined in the 1940 Act) (Independent Trustee), shall retire not later than the last day of the calendar year in which his or her 75th birthday occurs. The Independent Trustees may waive this mandatory retirement age policy with respect to individual Trustees. The executive officers and Advisory Board Members hold office without limit in time, except that any officer and Advisory Board Member may resign or may be removed by a vote of a majority of the Trustees at any regular meeting or any special meeting of the Trustees. Except as indicated, each individual has held the office shown or other offices in the same company for the past five years.
Experience, Skills, Attributes, and Qualifications of the Funds' Trustees. The Governance and Nominating Committee has adopted a statement of policy that describes the experience, qualifications, attributes, and skills that are necessary and desirable for potential Independent Trustee candidates (Statement of Policy). The Board believes that each Trustee satisfied at the time he or she was initially elected or appointed a Trustee, and continues to satisfy, the standards contemplated by the Statement of Policy. The Governance and Nominating Committee also engages professional search firms to help identify potential Independent Trustee candidates who have the experience, qualifications, attributes, and skills consistent with the Statement of Policy. From time to time, additional criteria based on the composition and skills of the current Independent Trustees, as well as experience or skills that may be appropriate in light of future changes to board composition, business conditions, and regulatory or other developments, have also been considered by the professional search firms and the Governance and Nominating Committee. In addition, the Board takes into account the Trustees' commitment and participation in Board and committee meetings, as well as their leadership of standing and ad hoc committees throughout their tenure.
In determining that a particular Trustee was and continues to be qualified to serve as a Trustee, the Board has considered a variety of criteria, none of which, in isolation, was controlling. The Board believes that, collectively, the Trustees have balanced and diverse experience, qualifications, attributes, and skills, which allow the Board to operate effectively in governing each fund and protecting the interests of shareholders. Information about the specific experience, skills, attributes, and qualifications of each Trustee, which in each case led to the Board's conclusion that the Trustee should serve (or continue to serve) as a trustee of the funds, is provided below.
Annual Report
Trustees and Officers - continued
Board Structure and Oversight Function. James C. Curvey is an interested person (as defined in the 1940 Act) and currently serves as Chairman. The Trustees have determined that an interested Chairman is appropriate and benefits shareholders because an interested Chairman has a personal and professional stake in the quality and continuity of services provided to the funds. Independent Trustees exercise their informed business judgment to appoint an individual of their choosing to serve as Chairman, regardless of whether the Trustee happens to be independent or a member of management. The Independent Trustees have determined that they can act independently and effectively without having an Independent Trustee serve as Chairman and that a key structural component for assuring that they are in a position to do so is for the Independent Trustees to constitute a substantial majority for the Board. The Independent Trustees also regularly meet in executive session. Ned C. Lautenbach serves as Chairman of the Independent Trustees and as such (i) acts as a liaison between the Independent Trustees and management with respect to matters important to the Independent Trustees and (ii) with management prepares agendas for Board meetings.
Fidelity funds are overseen by different Boards of Trustees. The funds' Board oversees Fidelity's equity and high income funds and another Board oversees Fidelity's investment-grade bond, money market, and asset allocation funds. The asset allocation funds may invest in Fidelity funds overseen by the funds' Board. The use of separate Boards, each with its own committee structure, allows the Trustees of each group of Fidelity funds to focus on the unique issues of the funds they oversee, including common research, investment, and operational issues. On occasion, the separate Boards establish joint committees to address issues of overlapping consequences for the Fidelity funds overseen by each Board.
The Trustees operate using a system of committees to facilitate the timely and efficient consideration of all matters of importance to the Trustees, each fund, and fund shareholders and to facilitate compliance with legal and regulatory requirements and oversight of the funds' activities and associated risks. The Board, acting through its committees, has charged FMR and its affiliates with (i) identifying events or circumstances the occurrence of which could have demonstrably adverse effects on the funds' business and/or reputation; (ii) implementing processes and controls to lessen the possibility that such events or circumstances occur or to mitigate the effects of such events or circumstances if they do occur; and (iii) creating and maintaining a system designed to evaluate continuously business and market conditions in order to facilitate the identification and implementation processes described in (i) and (ii) above. Because the day-to-day operations and activities of the funds are carried out by or through FMR, its affiliates and other service providers, the funds' exposure to risks is mitigated but not eliminated by the processes overseen by the Trustees. While each of the Board's committees has responsibility for overseeing different aspects of the funds' activities, oversight is exercised primarily through the Operations, Audit, and Compliance Committees. In addition, the Independent Trustees have worked with FMR to enhance the Board's oversight of investment and financial risks, legal and regulatory risks, technology risks, and operational risks, including the development of additional risk reporting to the Board. For example, a working group comprised of Independent Trustees and FMR has worked and continues to work to review the Fidelity funds' valuation-related activities, reporting and risk management. Appropriate personnel, including but not limited to the funds' Chief Compliance Officer (CCO), FMR's internal auditor, the independent accountants, the funds' Treasurer and portfolio management personnel, make periodic reports to the Board's committees, as appropriate, including an annual review of FMR's risk management program for the Fidelity funds. The responsibilities of each standing committee, including their oversight responsibilities, are described further under "Standing Committees of the Funds' Trustees."
Annual Report
The funds' Statements of Additional Information (SAIs) includes more information about the Trustees. To request a free copy, call Fidelity at 1-800-544-8544 for Series Class or 1-800-835-5092 for Class F.
Interested Trustees*:
Correspondence intended for each Trustee who is an interested person may be sent to Fidelity Investments, 82 Devonshire Street, Boston, Massachusetts 02109.
Name, Age; Principal Occupations and Other Relevant Experience+ |
James C. Curvey (77) |
| Year of Election or Appointment: 2007 Mr. Curvey is Trustee and Chairman of the Board of Trustees of certain Trusts. Mr. Curvey also serves as Trustee (2007-present) of other investment companies advised by FMR. Mr. Curvey is a Director of Fidelity Investments Money Management, Inc. (2009-present), Director of Fidelity Research & Analysis Co. (2009-present) and Director of FMR and FMR Co., Inc. (2007-present). Mr. Curvey is also Vice Chairman (2007-present) and Director of FMR LLC. In addition, Mr. Curvey serves as an Overseer for the Boston Symphony Orchestra and a member of the Trustees of Villanova University. Previously, Mr. Curvey was the Vice Chairman (2006-2007) and Director (2000-2007) of FMR Corp. |
Ronald P. O'Hanley (55) |
| Year of Election or Appointment: 2011 Mr. O'Hanley is Director of FMR Co., Inc. (2010-present), Director of Fidelity Investments Money Management, Inc. (2010-present), Director of Fidelity Research & Analysis Company (2010-present), President of Fidelity Asset Management and Corporate Services and a member of Fidelity's Executive Committee (2010-present). Previously, Mr. O'Hanley served as President and Chief Executive Officer of BNY Mellon Asset Management (2007-2010). Mr. O'Hanley also served as Vice Chairman of Bank New York Mellon Corp. and a member of that firm's Executive Committee. Prior to the 2007 merger of The Bank of New York and Mellon Financial Corporation, he was Vice Chairman of Mellon Financial Corporation and President and Chief Executive Officer of Mellon Asset Management. He joined Mellon in February 1997. Mr. O'Hanley currently serves as Chairman of the Boston Public Library Foundation Board of Directors and sits on the Board of Directors of Beth Israel Deaconess Medical Center, the Board of Trustees of the Marine Biological Laboratory and the Advisory Board of the Maxwell School of Citizenship and Public Administration at Syracuse University. Mr. O'Hanley also chairs the Council on Asset Management for the Financial Services Roundtable and is a member of the Board of Directors of Institutional Investor's U.S. Institute. |
* Trustees have been determined to be "Interested Trustees" by virtue of, among other things, their affiliation with the trust or various entities under common control with FMR.
+ The information above includes each Trustee's principal occupation during the last five years and other information relating to the experience, attributes, and skills relevant to each Trustee's qualifications to serve as a Trustee, which led to the conclusion that each Trustee should serve as a Trustee for each fund.
Annual Report
Independent Trustees:
Correspondence intended for each Independent Trustee (that is, the Trustees other than the Interested Trustees) may be sent to Fidelity Investments, P.O. Box 55235, Boston, Massachusetts 02205-5235.
Name, Age; Principal Occupations and Other Relevant Experience+ |
Dennis J. Dirks (64) |
| Year of Election or Appointment: 2005 Prior to his retirement in May 2003, Mr. Dirks was Chief Operating Officer and a member of the Board of The Depository Trust & Clearing Corporation (DTCC). He also served as President, Chief Operating Officer, and Board member of The Depository Trust Company (DTC) and President and Board member of the National Securities Clearing Corporation (NSCC). In addition, Mr. Dirks served as Chief Executive Officer and Board member of the Government Securities Clearing Corporation, Chief Executive Officer and Board member of the Mortgage-Backed Securities Clearing Corporation, as a Trustee and a member of the Finance Committee of Manhattan College (2005-2008), and as a Trustee and a member of the Finance Committee of AHRC of Nassau County (2006-2008). Mr. Dirks is a member of the Independent Directors Council (IDC) Governing Council (2010-present) and Board of Directors for The Brookville Center for Children's Services, Inc. (2009-present). |
Alan J. Lacy (59) |
| Year of Election or Appointment: 2008 Mr. Lacy serves as Senior Adviser (2007-present) of Oak Hill Capital Partners, L.P. (private equity). Mr. Lacy also served as Chief Executive Officer (2000-2005) and Vice Chairman (2005-2006) of Sears Holdings Corporation and Sears, Roebuck and Co. (retail). In addition, Mr. Lacy serves as a member of the Board of Directors of Dave & Buster's Entertainment, Inc. (restaurant and entertainment complexes, 2010-present), Earth Fare, Inc. (retail grocery, 2012-present), The Hillman Companies, Inc. (hardware wholesalers, 2010-present), and Bristol-Myers Squibb Company (global pharmaceuticals, 2008-present). Mr. Lacy is a member of the Board of Trustees of The National Parks Conservation Association (2006-present). Previously, Mr. Lacy served as Chairman of the Board of Trustees of the National Parks Conservation Association (2008-2011) and as a member of the Board of Directors for the Western Union Company (global money transfer, 2006-2011). |
Ned C. Lautenbach (68) |
| Year of Election or Appointment: 2000 Mr. Lautenbach is Chairman of the Independent Trustees of the Equity and High Income Funds (2006-present). Mr. Lautenbach currently serves as the Lead Director of the Eaton Corporation Board of Directors (diversified industrial, 1997-present). Mr. Lautenbach is Chairman of the Board of Directors of the Philharmonic Center for the Arts in Naples, Florida (2012-present) and a member of the Council on Foreign Relations (1994-present). Previously, Mr. Lautenbach was a Partner/Advisory Partner at Clayton, Dubilier & Rice, LLC (private equity investment, 1998-2010), as well as a Director of Sony Corporation (2006-2007). |
Joseph Mauriello (68) |
| Year of Election or Appointment: 2008 Prior to his retirement in January 2006, Mr. Mauriello served in numerous senior management positions including Deputy Chairman and Chief Operating Officer (2004-2005), and Vice Chairman of Financial Services (2002-2004) of KPMG LLP US (professional services, 1965-2005). Mr. Mauriello currently serves as a member of the Board of Directors of XL Group plc. (global insurance and re-insurance, 2006-present). Previously, Mr. Mauriello served as a Director of the Hamilton Funds of the Bank of New York (2006-2007) and of Arcadia Resources Inc. (health care services and products, 2007-2012). |
Robert W. Selander (62) |
| Year of Election or Appointment: 2011 Previously, Mr. Selander served as a Member of the Advisory Board of Fidelity's Equity and High Income Funds (2011), Executive Vice Chairman (2010), Chief Executive Officer (2009-2010), and President and Chief Executive Officer (1997-2009) of Mastercard, Inc. |
Cornelia M. Small (68) |
| Year of Election or Appointment: 2005 Ms. Small is a member of the Board of Directors (2009-present) and Chair of the Investment Committee (2010-present) of the Teagle Foundation. Ms. Small also serves on the Investment Committee of the Berkshire Taconic Community Foundation (2008-present). Previously, Ms. Small served as Chairperson (2002-2008) and a member of the Investment Committee and Chairperson (2008-2012) and a member of the Board of Trustees of Smith College. In addition, Ms. Small served as Chief Investment Officer, Director of Global Equity Investments, and a member of the Board of Directors of Scudder, Stevens & Clark and Scudder Kemper Investments. |
William S. Stavropoulos (73) |
| Year of Election or Appointment: 2001 Mr. Stavropoulos is Vice Chairman of the Independent Trustees of the Equity and High Income Funds (2006-present). Mr. Stavropoulos serves as President and Founder of the Michigan Baseball Foundation, the Great Lakes Loons (2007-present). Mr. Stavropoulos is Chairman Emeritus of the Board of Directors of The Dow Chemical Company, where he previously served in numerous senior management positions, including President, CEO (1995-2000; 2002-2004), Chairman of the Executive Committee (2000-2006), and as a member of the Board of Directors (1990-2006). Currently, Mr. Stavropoulos is a Director of Univar Inc. (global distributor of commodity and specialty chemicals, Chairman from 2010-May 2012 and Lead Director from May 2012-present), Teradata Corporation (data warehousing and technology solutions, 2008-present), Maersk Inc. (industrial conglomerate), and Tyco International, Ltd. (multinational manufacturing and services, 2007-present), and a member of the Advisory Board for Metalmark Capital LLC (private equity investment, 2005-present). Mr. Stavropoulos is an operating advisor to Clayton, Dubilier & Rice, LLC (private equity investment). In addition, Mr. Stavropoulos is a member of the University of Notre Dame Advisory Council for the College of Science, a Trustee of the Rollin L. Gerstacker Foundation, and a Director of the Naples Philharmonic Center for the Arts. Previously, Mr. Stavropoulos served as a Director of Chemical Financial Corporation (bank holding company, 1993-2012). |
David M. Thomas (63) |
| Year of Election or Appointment: 2008 Previously, Mr. Thomas served as Executive Chairman (2005-2006) and Chairman and Chief Executive Officer (2000-2005) of IMS Health, Inc. (pharmaceutical and healthcare information solutions), and a Director of Fortune Brands, Inc. (consumer products, 2000-2011). In addition, Mr. Thomas serves as Non-Executive Chairman of the Board of Directors of Fortune Brands Home and Security (home and security products, 2011-present), and as a member of the Board of Directors of Interpublic Group of Companies, Inc. (marketing communication, 2004-present). |
Michael E. Wiley (62) |
| Year of Election or Appointment: 2008 Mr. Wiley also serves as a Director of Asia Pacific Exploration Consolidated (international oil and gas exploration and production, 2008-present). Mr. Wiley serves as a Director of Tesoro Corporation (independent oil refiner and marketer, 2005-present), and a Director of Bill Barrett Corporation (exploration and production, 2005-present). In addition, Mr. Wiley also serves as a Director of Post Oak Bank (privately-held bank, 2004-present). Previously, Mr. Wiley served as a member of the Board of Trustees of the University of Tulsa (2000-2006; 2007-2010), as a Senior Energy Advisor of Katzenbach Partners, LLC (consulting, 2006-2007), as an Advisory Director of Riverstone Holdings (private investment), Chairman, President, and CEO of Baker Hughes, Inc. (oilfield services, 2000-2004), and as Director of Spinnaker Exploration Company (exploration and production, 2001-2005). |
+ The information above includes each Trustee's principal occupation during the last five years and other information relating to the experience, attributes, and skills relevant to each Trustee's qualifications to serve as a Trustee, which led to the conclusion that each Trustee should serve as a Trustee for each fund.
Advisory Board Members and Executive Officers:
Correspondence intended for David A. Rosow and Garnett A. Smith may be sent to Fidelity Investments, P.O. Box 55235, Boston, Massachusetts 02205-5235. Correspondence intended for each executive officer, Edward C. Johnson 3d, and Peter S. Lynch may be sent to Fidelity Investments, 82 Devonshire Street, Boston, Massachusetts 02109.
Name, Age; Principal Occupation |
Edward C. Johnson 3d (82) |
| Year of Election or Appointment: 2011 Member of the Advisory Board of Fidelity's Equity and High Income Funds. Mr. Johnson serves as Chief Executive Officer, Chairman, and a Director of FMR LLC, and also serves as Chairman and Director of FIL Limited. Previously, Mr. Johnson served as a Trustee and Chairman of the Board of certain Fidelity Trusts, Chairman and a Director of FMR, Chairman and a Director of FMR Co., Inc., and President of FMR LLC (2006-2007). |
Peter S. Lynch (68) |
| Year of Election or Appointment: 2003 Member of the Advisory Board of Fidelity's Equity and High Income Funds. Mr. Lynch is Vice Chairman and a Director of FMR and FMR Co., Inc. In addition, Mr. Lynch serves as a Trustee of Boston College and as the Chairman of the Inner-City Scholarship Fund. Previously, Mr. Lynch served on the Special Olympics International Board of Directors (1997-2006). |
David A. Rosow (70) |
| Year of Election or Appointment: 2012 Member of the Advisory Board of Fidelity's Equity and High Income Funds. Chairman and Chief Executive Officer of International Golf Group, Inc. (golf course development, 1989-present). Previously, Mr. Rosow served as Chairman and Chief Executive Officer of Rosow & Company, Inc. (private investment company, 1989-2011), a Lead Director of Hudson United Bancorp (2001-2006) and as a Director of TD Banknorth (1996-2006). In addition, Mr. Rosow is a member (2008-present) and President (2009-present) of the Town Council of Palm Beach, Florida. |
Garnett A. Smith (65) |
| Year of Election or Appointment: 2012 Member of the Advisory Board of Fidelity's Equity and High Income Funds. Prior to Mr. Smith's retirement, he served as Chairman and Chief Executive Officer of Inbrand Corp. (manufacturer of personal absorbent products, 1990-1997). He also served as President (1986-1990) of Inbrand Corp. Prior to his employment with Inbrand Corp., he was employed by a retail fabric chain and North Carolina National Bank. In addition, Mr. Smith is a board member of the Jackson Hole Land Trust (2009-present). |
Kenneth B. Robins (43) |
| Year of Election or Appointment: 2008 President and Treasurer of Fidelity's Equity and High Income Funds. Mr. Robins also serves as President and Treasurer (2010-present) and Assistant Treasurer (2009-present) of other Fidelity funds and is an employee of Fidelity Investments (2004-present). Previously, Mr. Robins served as Deputy Treasurer of the Fidelity funds (2005-2008) and Treasurer and Chief Financial Officer of The North Carolina Capital Management Trust: Cash and Term Portfolios (2006-2008). |
Bruce T. Herring (47) |
| Year of Election or Appointment: 2006 Vice President of certain Equity Funds. Mr. Herring also serves as President of Fidelity Research & Analysis Company (2010-present), Chief Investment Officer and Director of Fidelity Management & Research (U.K.) Inc. (2010-present) and Group Chief Investment Officer of FMR. Previously, Mr. Herring served as Vice President (2005-2006) and Senior Vice President (2006-2007) of Fidelity Management & Research Company, Vice President of FMR Co., Inc. (2001-2007) and as a portfolio manager for Fidelity U.S. Equity Funds. |
Brian B. Hogan (48) |
| Year of Election or Appointment: 2009 Vice President of Equity and High Income Funds. Mr. Hogan also serves as President of FMR's Equity Division (2009-present). Previously, Mr. Hogan served as Senior Vice President, Equity Research of FMR (2006-2009) and as a portfolio manager. |
Scott C. Goebel (44) |
| Year of Election or Appointment: 2008 Secretary and Chief Legal Officer (CLO) of the Fidelity funds. Mr. Goebel also serves as Secretary of Fidelity Investments Money Management, Inc. (FIMM) (2010-present) and Fidelity Research and Analysis Company (FRAC) (2010-present); Secretary and CLO of The North Carolina Capital Management Trust: Cash and Term Portfolios (2008-present); General Counsel, Secretary, and Senior Vice President of FMR (2008-present) and FMR Co., Inc. (2008-present); employed by FMR LLC or an affiliate (2001-present); Chief Legal Officer of Fidelity Management & Research (Hong Kong) Limited (2008-present) and Assistant Secretary of Fidelity Management & Research (Japan) Inc. (2008-present), and Fidelity Management & Research (U.K.) Inc. (2008-present). Previously, Mr. Goebel served as Assistant Secretary of FIMM (2008-2010), FRAC (2008-2010), and the Funds (2007-2008) and as Vice President and Secretary of Fidelity Distributors Corporation (FDC) (2005-2007). |
William C. Coffey (43) |
| Year of Election or Appointment: 2009 Assistant Secretary of Fidelity's Equity and High Income Funds. Mr. Coffey also serves as Senior Vice President and Deputy General Counsel of FMR LLC (2010-present), and is an employee of Fidelity Investments. Previously, Mr. Coffey served as Vice President and Associate General Counsel of FMR LLC (2005-2009). |
Elizabeth Paige Baumann (44) |
| Year of Election or Appointment: 2012 Anti-Money Laundering (AML) Officer of the Fidelity funds. Ms. Baumann also serves as AML Officer of The North Carolina Capital Management Trust: Cash and Term Portfolios (2012-present), Chief AML Officer of FMR LLC (2012-present), and is an employee of Fidelity Investments. Previously, Ms. Baumann served as Vice President and Deputy Anti-Money Laundering Officer (2007-2012). |
Christine Reynolds (54) |
| Year of Election or Appointment: 2008 Chief Financial Officer of the Fidelity funds. Ms. Reynolds became President of Fidelity Pricing and Cash Management Services (FPCMS) in August 2008. Ms. Reynolds served as Chief Operating Officer of FPCMS (2007-2008). Previously, Ms. Reynolds served as President, Treasurer, and Anti-Money Laundering officer of the Fidelity funds (2004-2007). |
Joseph A. Hanlon (44) |
| Year of Election or Appointment: 2012 Chief Compliance Officer of Fidelity's Equity and High Income Funds. Mr. Hanlon serves as Compliance Officer of FMR, FMR Co., Inc., Fidelity Investments Money Management, Inc. (FIMM), Fidelity Research and Analysis Company (FRAC), Fidelity Management & Research (Japan) Inc., Fidelity Management & Research (U.K.) Inc., Fidelity Management & Research (Hong Kong), and Strategic Advisers, Inc. (2009-present), as Senior Vice President of the Fidelity Asset Management Division (2009-present), and is an employee of Fidelity Investments. |
Joseph F. Zambello (55) |
| Year of Election or Appointment: 2011 Deputy Treasurer of the Fidelity funds. Mr. Zambello is an employee of Fidelity Investments. Previously, Mr. Zambello served as Vice President of FMR's Program Management Group (2009-2011) and Vice President of the Transfer Agent Oversight Group (2005-2009). |
Adrien E. Deberghes (45) |
| Year of Election or Appointment: 2008 Deputy Treasurer of Fidelity's Equity and High Income Funds. Mr. Deberghes also serves as Vice President (2011-present) and Assistant Treasurer (2010-present) of other Fidelity funds, and is an employee of Fidelity Investments (2008-present). Previously, Mr. Deberghes served as Senior Vice President of Mutual Fund Administration at State Street Corporation (2007-2008), Senior Director of Mutual Fund Administration at Investors Bank & Trust (2005-2007), and Director of Finance for Dunkin' Brands (2000-2005). |
Stephen Sadoski (41) |
| Year of Election or Appointment: 2012 Deputy Treasurer of Fidelity's Equity and High Income Funds. Mr. Sadoski also serves as Assistant Treasurer of other Fidelity funds (2012-present) and is an employee of Fidelity Investments (2012-present). Previously, Mr. Sadoski served as an assistant chief accountant in the Division of Investment Management of the Securities and Exchange Commission (SEC) (2009-2012) and as a senior manager at Deloitte & Touche (1997-2009). |
Stephanie J. Dorsey (43) |
| Year of Election or Appointment: 2010 Assistant Treasurer of Fidelity's Equity and High Income Funds. Ms. Dorsey also serves as Deputy Treasurer of other Fidelity funds (2008-present) and is an employee of Fidelity Investments (2008-present). Previously, Ms. Dorsey served as Treasurer (2004-2008) of the JPMorgan Mutual Funds and Vice President (2004-2008) of JPMorgan Chase Bank. |
John R. Hebble (54) |
| Year of Election or Appointment: 2009 Assistant Treasurer of Fidelity's Equity and High Income Funds. Mr. Hebble also serves as President (2011-present), Treasurer, and Chief Financial Officer of The North Carolina Capital Management Trust: Cash and Term Portfolios (2008-present), President and Treasurer of other Fidelity funds (2008-present) and is an employee of Fidelity Investments. |
Gary W. Ryan (54) |
| Year of Election or Appointment: 2005 Assistant Treasurer of the Fidelity funds. Mr. Ryan is an employee of Fidelity Investments. Previously, Mr. Ryan served as Vice President of Fund Reporting in Fidelity Pricing and Cash Management Services (FPCMS) (1999-2005). |
Jonathan Davis (44) |
| Year of Election or Appointment: 2010 Assistant Treasurer of the Fidelity funds. Mr. Davis is also Assistant Treasurer of Fidelity Rutland Square Trust II and Fidelity Commonwealth Trust II. Mr. Davis is an employee of Fidelity Investments. Previously, Mr. Davis served as Vice President and Associate General Counsel of FMR LLC (2003-2010). |
Annual Report
The Board of Trustees of each fund voted to pay to shareholders of record at the opening of business on record date, the following distributions per share derived from capital gains realized from sales of portfolio securities, and dividends derived from net investment income:
Fund | Pay Date | Record Date | Dividends | Capital Gains |
Series Emerging Markets Fund | 12/10/12 | 12/07/12 | $0.222 | $0.009 |
Class F | 12/10/12 | 12/07/12 | $0.255 | $0.009 |
Series International Growth Fund | 12/10/12 | 12/07/12 | $0.187 | $0.000 |
Class F | 12/10/12 | 12/07/12 | $0.210 | $0.000 |
Series International Small Cap Fund | 12/10/12 | 12/07/12 | $0.124 | $0.010 |
Class F | 12/10/12 | 12/07/12 | $0.152 | $0.010 |
Series International Value Fund | 12/10/12 | 12/07/12 | $0.256 | $0.057 |
Class F | 12/10/12 | 12/07/12 | $0.274 | $0.057 |
A percentage of the dividends distributed during the fiscal year for the following funds qualifies for the dividends-received deduction for corporate shareholders
Fund | December 9, 2011 |
Series Emerging Markets Fund | 0% |
Class F | 0% |
Series International Growth Fund | 9% |
Class F | 7% |
Series International Small Cap Fund | 5% |
Class F | 4% |
Series International Value Fund | 0% |
Class F | 0% |
A percentage of the dividends distributed during the fiscal year for the following funds may be taken into account as a dividend for purposes of the maximum rate under section 1(h)(11) of the Internal Revenue Code.
Fund | December 9, 2011 |
Series Emerging Markets Fund | 100% |
Class F | 100% |
Series International Growth Fund | 100% |
Class F | 100% |
Series International Small Cap Fund | 97% |
Class F | 82% |
Series International Value Fund | 73% |
Class F | 67% |
Annual Report
Distributions - continued
The amounts per share which represent income derived from sources within, and taxes paid to, foreign countries or possessions of the United States are as follows:
Fund | Pay Date | Income | Taxes |
Series Emerging Markets Fund | 12/12/11 | $0.132 | $0.0203 |
Class F | 12/12/11 | $0.163 | $0.0203 |
Series International Growth Fund | 12/12/11 | $0.072 | $0.0071 |
Class F | 12/12/11 | $0.085 | $0.0071 |
Series International Small Cap Fund | 12/12/11 | $0.088 | $0.0080 |
Class F | 12/12/11 | $0.104 | $0.0080 |
Series International Value Fund | 12/12/11 | $0.185 | $0.0089 |
Class F | 12/12/11 | $0.199 | $0.0089 |
The fund will notify shareholders in January 2013 of amounts for use in preparing 2012 income tax returns.
Annual Report
Board Approval of Investment Advisory Contracts and Management Fees
Fidelity Series Emerging Markets Fund
Fidelity Series International Growth Fund
Fidelity Series International Small Cap Fund
Fidelity Series International Value Fund
Each year, the Board of Trustees, including the Independent Trustees (together, the Board), votes on the renewal of the management contract and sub-advisory agreements (together, the Advisory Contracts) for each fund. The Board, assisted by the advice of fund counsel and Independent Trustees' counsel, requests and considers a broad range of information relevant to the renewal of the Advisory Contracts throughout the year.
The Board meets regularly and, at each of its meetings, considers factors that are relevant to its annual consideration of the renewal of each fund's Advisory Contracts, including the services and support provided to each fund and its shareholders. The Board has established various standing committees, each composed of and chaired by Independent Trustees with varying backgrounds, to which the Board has assigned specific subject matter responsibilities in order to enhance effective decision-making by the Board. The Board, acting directly and through its Committees, requests and receives information concerning the annual consideration of the renewal of each fund's Advisory Contracts. The Board also meets as needed to consider matters specifically related to the Board's annual consideration of the renewal of Advisory Contracts. Members of the Board may also meet with trustees of other Fidelity funds through ad hoc joint committees to discuss certain matters relevant to the Fidelity funds.
At its July 2012 meeting, the Board of Trustees, including the Independent Trustees, unanimously determined to renew each fund's Advisory Contracts. In reaching its determination, the Board considered all factors it believed relevant, including (i) the nature, extent, and quality of the services to be provided to each fund and its shareholders (including the investment performance of each fund); (ii) the competitiveness of each fund's management fee and total expense ratio relative to peer funds; (iii) the total costs of the services to be provided by and the profits to be realized by Fidelity from its relationship with each fund; (iv) the extent to which economies of scale exist and would be realized as each fund grows; and (v) whether fee levels reflect these economies of scale, if any, for the benefit of fund shareholders.
In considering whether to renew the Advisory Contracts for each fund, the Board reached a determination, with the assistance of fund counsel and Independent Trustees' counsel and through the exercise of its business judgment, that the renewal of the Advisory Contracts is in the best interests of each fund and its shareholders and that the compensation payable under the Advisory Contracts is fair and reasonable. The Board's decision to renew the Advisory Contracts was not based on any single factor, but rather was based on a comprehensive consideration of all the information provided to the Board at its meetings throughout the year. The Board, in reaching its determination to renew the Advisory Contracts, is aware that shareholders in each fund have a broad range of investment choices available to them, including a wide choice among mutual funds offered by Fidelity's competitors, and that each fund's shareholders, who have the opportunity to review and weigh the disclosure provided by the fund in its prospectus and other public disclosures, have chosen to invest in that fund, managed by Fidelity.
Annual Report
Board Approval of Investment Advisory Contracts and
Management Fees - continued
Nature, Extent, and Quality of Services Provided. The Board considered the staffing within the investment adviser, FMR, and the sub-advisers (together, the Investment Advisers), including the backgrounds of the funds' investment personnel, and also considered the funds' investment objectives, strategies, and related investment philosophies. The Independent Trustees also had discussions with senior management of Fidelity's investment operations and investment groups. The Board considered the structure of the portfolio manager compensation program and whether this structure provides appropriate incentives to act in the best interests of each fund.
Resources Dedicated to Investment Management and Support Services. The Board and the Fund Oversight and Research Committees reviewed the general qualifications and capabilities of the Investment Advisers' investment staff, including its size, education, experience, and resources, as well as the Investment Advisers' approach to recruiting, training, managing, and compensating investment personnel. The Board also noted that FMR has continued to increase the resources devoted to non-U.S. offices, including expansion of Fidelity's global investment organization. The Board noted that Fidelity's analysts have extensive resources, tools and capabilities that allow them to conduct sophisticated quantitative and fundamental analysis, as well as credit analysis of issuers, counterparties and guarantors. The Board also believes that Fidelity's investment professionals have sufficient access to global information and data so as to provide competitive investment results over time, and that those professionals also have access to sophisticated tools that permit them to assess portfolio construction and risk and performance attribution characteristics continuously, as well as to transmit new information and research conclusions rapidly around the world. Additionally, in its deliberations, the Board considered the Investment Advisers' trading and risk management capabilities and resources, which are an integral part of the investment management process.
Shareholder and Administrative Services. The Board considered (i) the nature, extent, quality, and cost of advisory, administrative, and shareholder services performed by the Investment Advisers and their affiliates under the Advisory Contracts and under separate agreements covering transfer agency, pricing and bookkeeping, and securities lending services for each fund; (ii) the nature and extent of the supervision of third party service providers, principally custodians and subcustodians; and (iii) the resources devoted to, and the record of compliance with, each fund's compliance policies and procedures. The Board also reviewed the allocation of fund brokerage, including allocations to brokers affiliated with the Investment Advisers, the use of brokerage commissions to pay fund expenses, and the use of "soft" commission dollars to pay for research services.
Annual Report
The Board noted that the growth of fund assets over time across the complex allows Fidelity to reinvest in the development of services designed to enhance the value or convenience of the Fidelity funds as investment vehicles. These services include 24-hour access to account information and market information through telephone representatives and over the Internet, investor education materials and asset allocation tools, and the expanded availability of Fidelity Investor Centers.
Investment in a Large Fund Family. The Board considered the benefits to shareholders of investing in a Fidelity fund, including the benefits of investing in a fund that is part of a large family of funds offering a variety of investment disciplines and providing a large variety of mutual fund investor services. The Board noted that Fidelity had taken, or had made recommendations that resulted in the Fidelity funds taking, a number of actions over the previous year that benefited particular funds, including (i) continuing to dedicate additional resources to investment research and support of the senior management team that oversees asset management; (ii) persisting in efforts to enhance Fidelity's research capabilities, in particular, international research; (iii) launching new funds and making other enhancements to meet client needs for global and income-oriented solutions; (iv) continuing to launch dedicated lower cost underlying funds to meet investment management's portfolio construction needs related to expanding underlying fund options, specifically for the Freedom Fund product lines; (v) adopting a "Stock Selector" sector neutral investment approach and employing a team of portfolio managers who are sector specialists to manage certain funds; (vi) rationalizing product lines and gaining increased efficiencies through the mergers of several funds into other funds; (vii) strengthening the Spartan Index Fund product line by adding new funds and/or new low-cost institutional share classes, restructuring fund expenses to accommodate new classes, and reducing investment minimums for certain classes of shares; (viii) modifying the eligibility criteria for Institutional Class shares to increase their appeal to government entities and charitable investors; and (ix) reducing certain transfer agent fee rates.
Investment Performance (Fidelity Series Emerging Markets Fund). The Board considered whether the fund has operated in accordance with its investment objective, as well as its record of compliance with its investment restrictions. It also reviewed the fund's absolute investment performance for each class, as well as the fund's relative investment performance for each class measured over multiple periods against (i) a broad-based securities market index, and (ii) a peer group of mutual funds deemed appropriate by Fidelity and reviewed by the Board. Because the fund had been in existence less than five calendar years, the following charts considered by the Board show, over the one- and three-year periods ended December 31, 2011, as available, the cumulative total returns of Class F and the retail class of the fund, the cumulative total returns of a broad-based securities market index ("benchmark"), and a range of cumulative total returns of a peer group of mutual funds identified by Morningstar, Inc. as having an investment style similar to that of the fund based on underlying portfolio holdings. The box within each chart shows the 25th percentile return (top of box) and the 75th percentile return (bottom of box) of the peer group. Returns shown above the box are in the first quartile and returns shown below the box are in the fourth quartile. The percentage beaten numbers noted below each chart correspond to the percentile box and represent the percentage of funds in the peer group whose performance was equal to or lower than that of the class indicated.
Annual Report
Board Approval of Investment Advisory Contracts and
Management Fees - continued
Fidelity Series Emerging Markets Fund
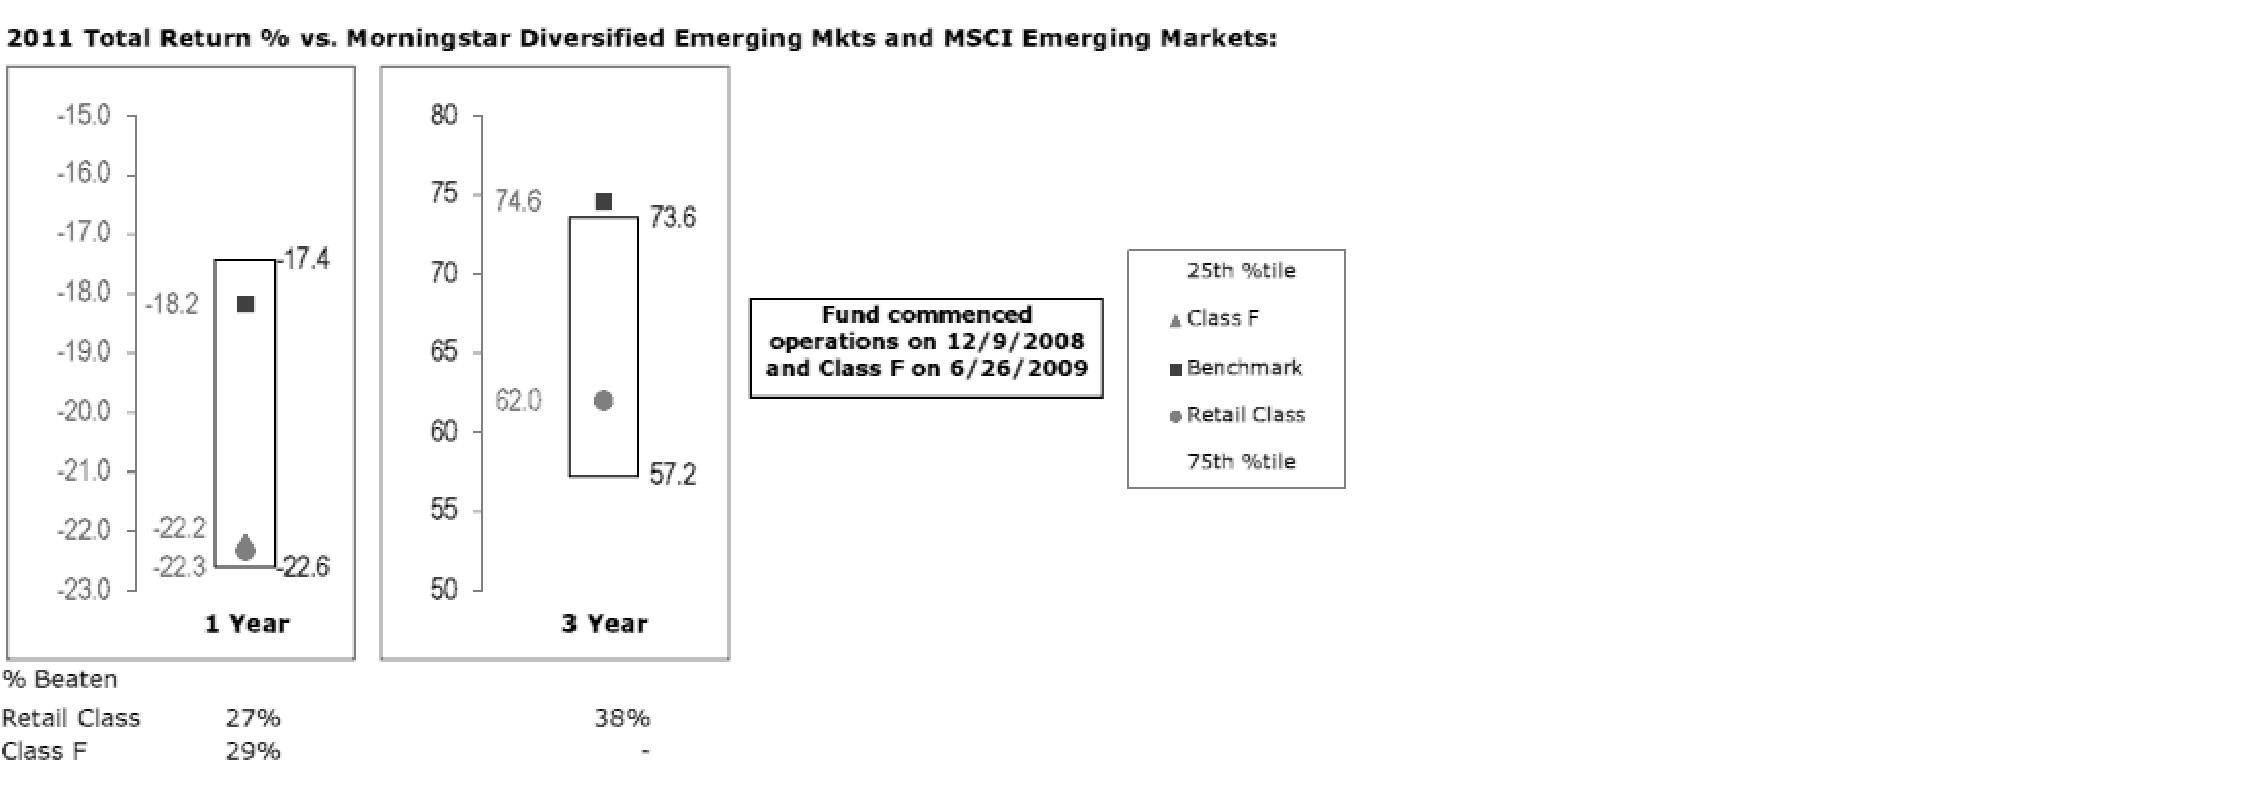
The Board reviewed the fund's relative investment performance against its peer group and noted that the performance of the retail class of the fund (the class with the longer performance record) was in the third quartile for all the periods shown. The Board also noted that the investment performance of the retail class of the fund was lower than its benchmark for all the periods shown. The Board considered that the variations in performance between the fund's classes reflect the variations in class expenses, which result in lower performance for the higher expense class. The Board discussed with FMR actions to improve the fund's disappointing performance relative to its peer group and benchmark. The Board noted that there was a portfolio management change for the fund in May 2012. The Board also reviewed the fund's performance since inception as well as performance in the current year. The Board will continue to closely monitor the performance of the fund in the coming year and discuss with FMR other appropriate actions to address the performance of the fund.
Annual Report
Investment Performance (Fidelity Series International Growth Fund, Fidelity Series International Small Cap Fund, and Fidelity Series International Value Fund). The Board considered whether each fund has operated in accordance with its investment objective, as well as its record of compliance with its investment restrictions. It also reviewed each fund's absolute investment performance for each class, as well as each fund's relative investment performance for each class measured against (i) a broad-based securities market index, and (ii) a peer group of mutual funds deemed appropriate by Fidelity and reviewed by the Board. Because each fund had been in existence less than three calendar years, for each fund the following chart considered by the Board shows, for the one-year period ended December 31, 2011, the total returns of Class F and the retail class of the fund, the total return of a broad-based securities market index ("benchmark"), and a range of total returns of a custom peer group of mutual funds defined by FMR based on categories assigned by Morningstar, Inc. (for Fidelity Series International Small Cap Fund, a peer group of mutual funds identified by Lipper Inc. as having an investment objective similar to that of the fund). The box within each chart shows the 25th percentile return (top of box) and the 75th percentile return (bottom of box) of the peer group. Returns shown above the box are in the first quartile and returns shown below the box are in the fourth quartile. The percentage beaten numbers noted below each chart correspond to the percentile box and represent the percentage of funds in the peer group whose performance was equal to or lower than that of the class indicated. Each of Fidelity Series International Growth Fund's and Fidelity Series International Value Fund's custom peer group, defined by FMR, is a peer group that FMR believes provides a more meaningful performance comparison than the peer group assigned by Morningstar, Inc., which assigns mutual funds to categories based on their investment styles as measured by their underlying portfolio holdings.
Annual Report
Board Approval of Investment Advisory Contracts and
Management Fees - continued
Fidelity Series International Growth Fund
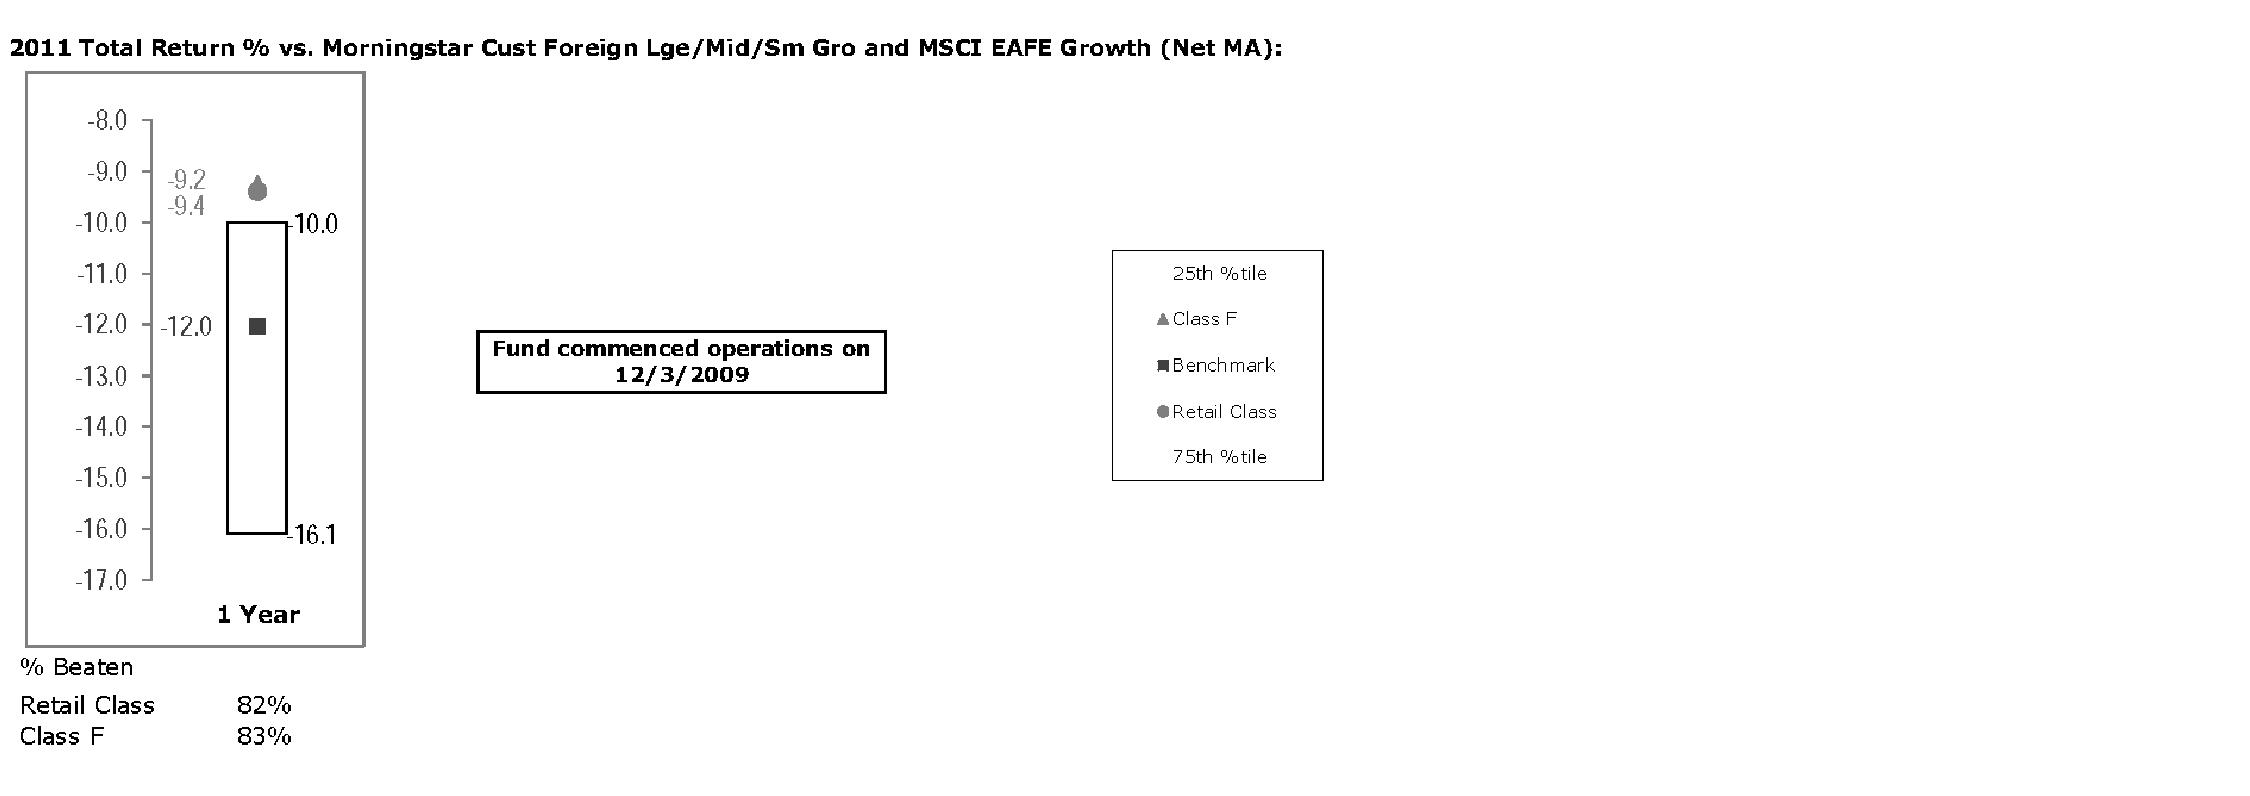
The Board reviewed the fund's relative investment performance against its peer group and noted that the performance of Class F of the fund was in the first quartile for the period shown. The Board also noted that the investment performance of Class F of the fund compared favorably to its benchmark for the period shown. The Board considered that the variations in performance between the fund's classes reflect the variations in class expenses, which result in lower performance for the higher expense class. The Board also reviewed the fund's performance since inception as well as performance in the current year. The Board noted that it is difficult to evaluate in any comprehensive fashion the performance of the fund, in light of its relatively recent commencement of operations.
Annual Report
Fidelity Series International Small Cap Fund
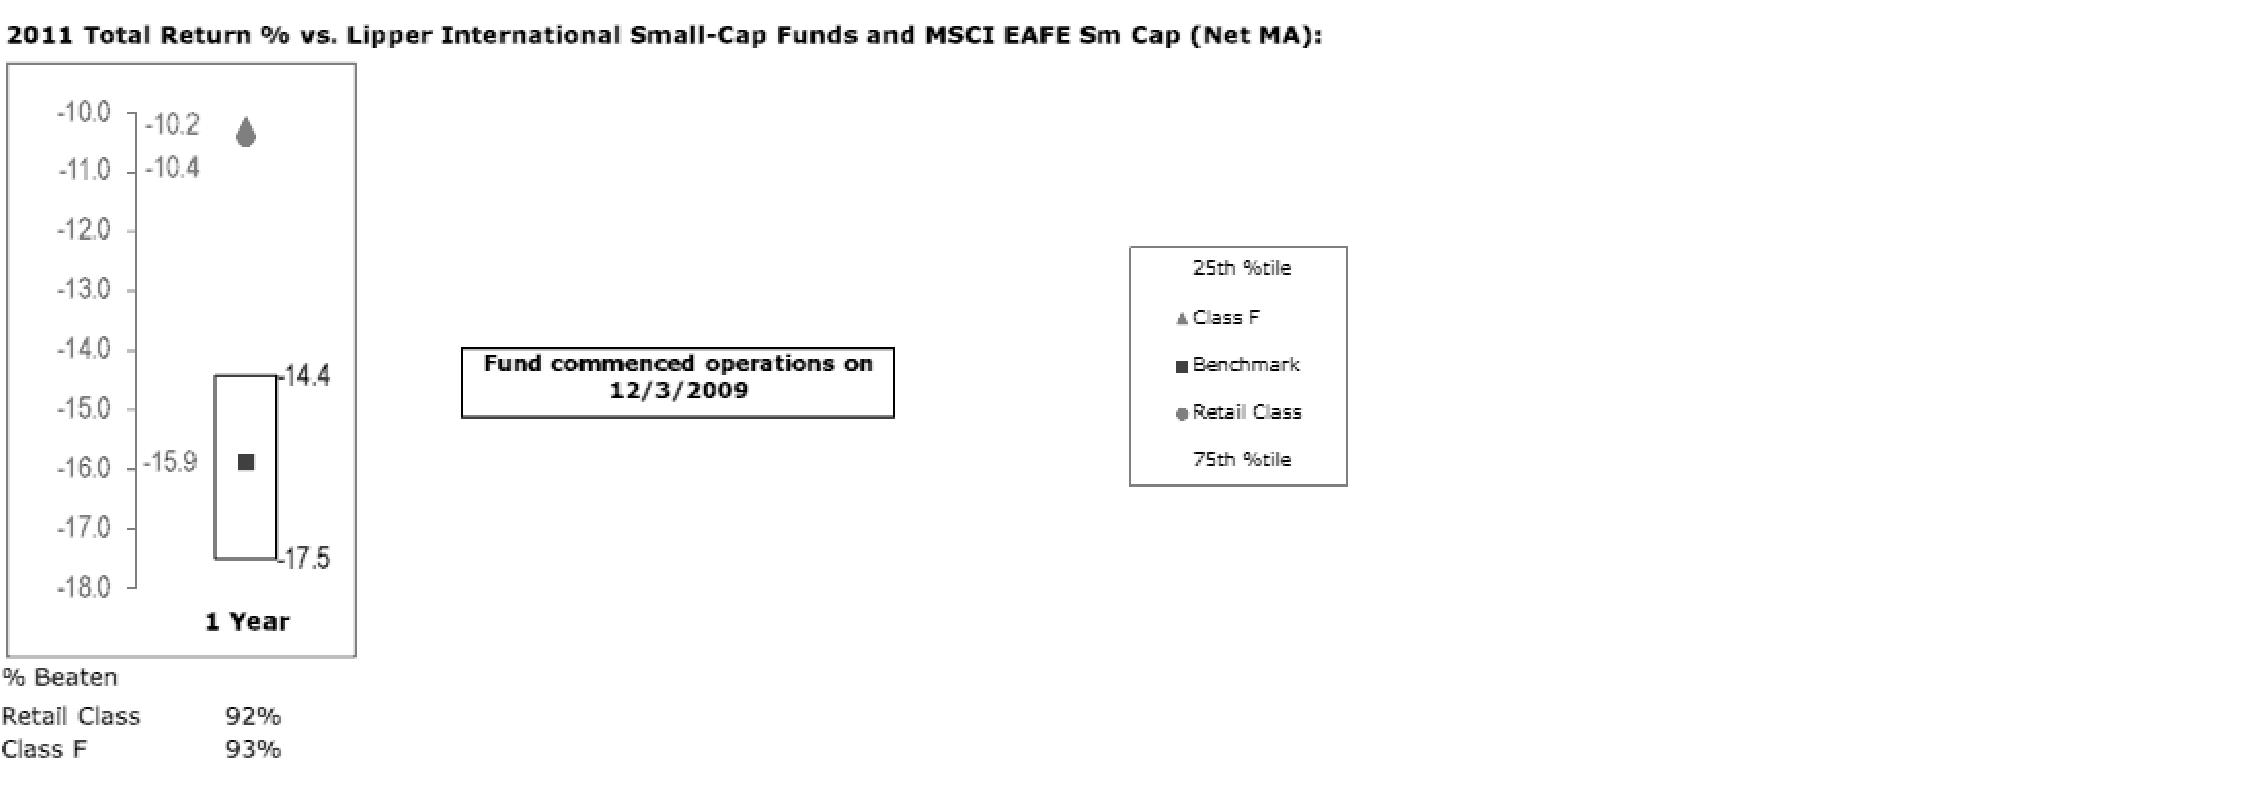
The Board reviewed the fund's relative investment performance against its peer group and noted that the performance of Class F of the fund was in the first quartile for the period shown. The Board also noted that the investment performance of Class F of the fund compared favorably to its benchmark for the period shown. The Board considered that the variations in performance between the fund's classes reflect the variations in class expenses, which result in lower performance for the higher expense class. The Board also reviewed the fund's performance since inception as well as performance in the current year. The Board noted that it is difficult to evaluate in any comprehensive fashion the performance of the fund, in light of its relatively recent commencement of operations.
Annual Report
Board Approval of Investment Advisory Contracts and
Management Fees - continued
Fidelity Series International Value Fund
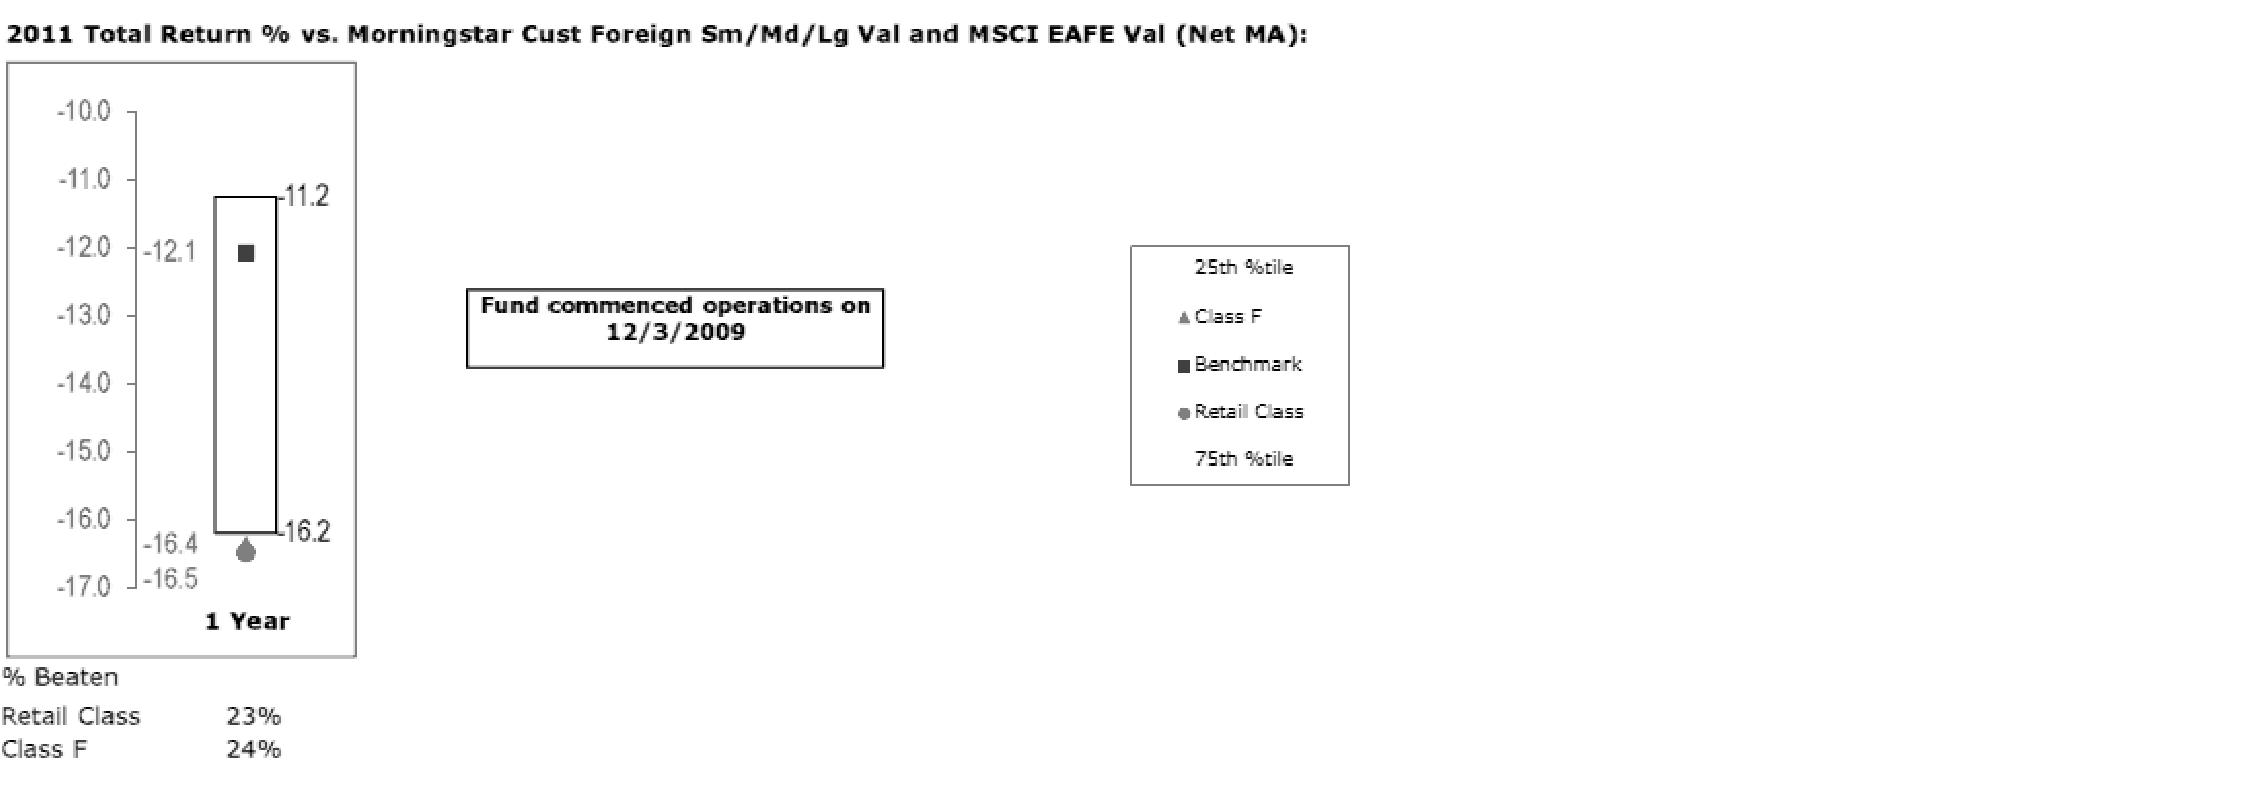
The Board reviewed the fund's relative investment performance against its peer group and noted that the performance of Class F of the fund was in the fourth quartile for the period shown. The Board also noted that the investment performance of the fund was lower than its benchmark for the period shown. The Board considered that the variations in performance between the fund's classes reflect the variations in class expenses, which result in lower performance for the higher expense class. The Board noted that there was a portfolio management change for the fund in September 2011. The Board also reviewed the fund's performance since inception as well as performance in the current year. The Board noted that it is difficult to evaluate in any comprehensive fashion the performance of the fund, in light of its relatively recent commencement of operations.
The Board also considered that each fund's management fee (except Series Emerging Markets Fund) is subject to upward or downward adjustment depending upon whether, and to what extent, the fund's investment performance for the performance period exceeds, or is exceeded by, the record (over the same period) of a Board-approved performance adjustment index. The Board noted that the performance adjustment provides FMR with a strong economic incentive to seek to achieve superior performance for each fund's shareholders and helps to more closely align the interests of FMR and each fund's shareholders.
Based on its review, the Board concluded that the nature, extent, and quality of services provided to each fund under the Advisory Contracts should benefit each fund's shareholders.
Annual Report
Competitiveness of Management Fee and Total Expense Ratio. The Board considered each fund's management fee and total expense ratio compared to "mapped groups" of competitive funds and classes. Fidelity creates "mapped groups" by combining similar Lipper investment objective categories that have comparable management fee characteristics. Combining Lipper investment objective categories aids the Board's management fee and total expense ratio comparisons by broadening the competitive group used for comparison and by reducing the number of universes to which various Fidelity funds are compared.
Management Fee. The Board considered two proprietary management fee comparisons for the 12-month (or shorter) periods shown in the charts below. The group of Lipper funds used by the Board for management fee comparisons is referred to below as the "Total Mapped Group." For Fidelity Series International Small Cap Fund, the Total Mapped Group is broader than the Lipper peer group used by the Board for performance comparisons because the Total Mapped Group combines several Lipper investment objective categories while the Lipper peer group does not. The Total Mapped Group comparison focuses on a fund's standing relative to the total universe of comparable funds available to investors in terms of gross management fees before expense reimbursements or caps, and without giving effect to a fund's performance adjustment (if applicable). "TMG %" represents the percentage of funds in the Total Mapped Group that had management fees that were lower than a fund's. For example, a TMG % of 19% would mean that 81% of the funds in the Total Mapped Group had higher management fees than a fund. The "Asset-Size Peer Group" (ASPG) comparison focuses on a fund's standing relative to non-Fidelity funds similar in size to the fund within the Total Mapped Group. The ASPG represents at least 15% of the funds in the Total Mapped Group with comparable asset size and management fee characteristics, subject to a minimum of 50 funds (or all funds in the Total Mapped Group if fewer than 50). Additional information, such as the ASPG quartile in which a fund's management fee ranked and the impact of a fund's performance adjustment (if applicable), is also included in the charts and considered by the Board.
Annual Report
Board Approval of Investment Advisory Contracts and
Management Fees - continued
Fidelity Series Emerging Markets Fund
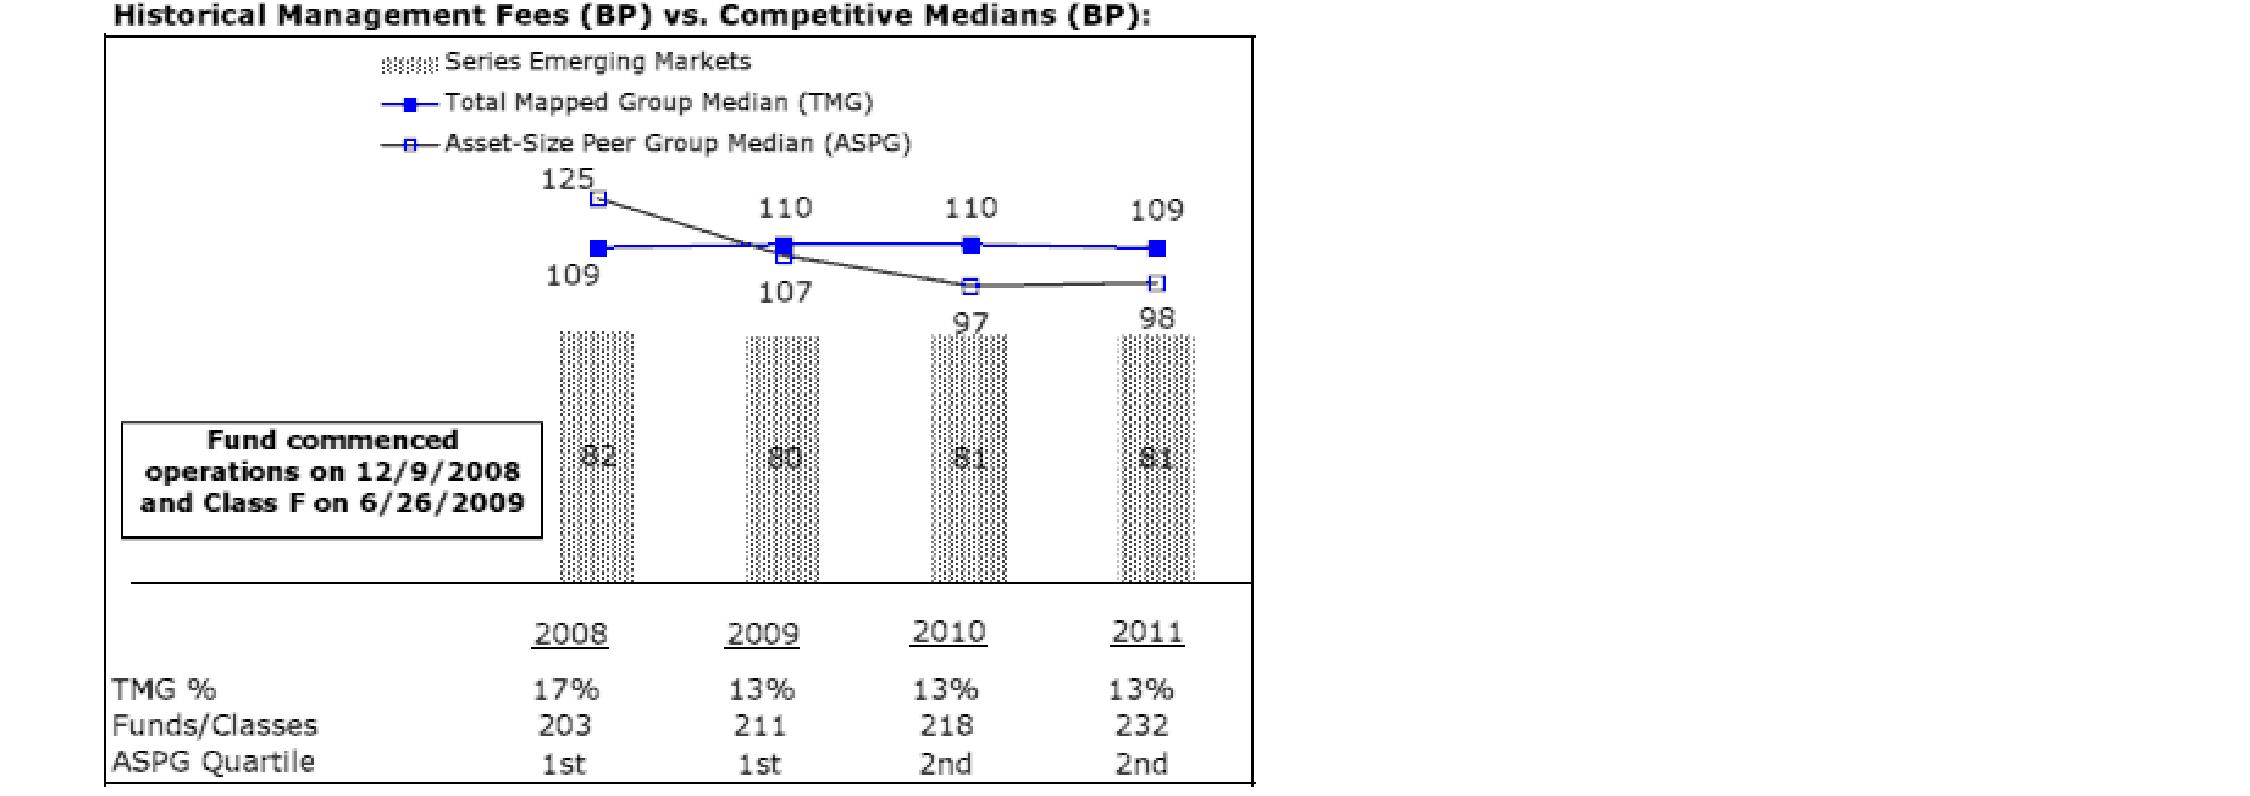
Fidelity Series International Growth Fund
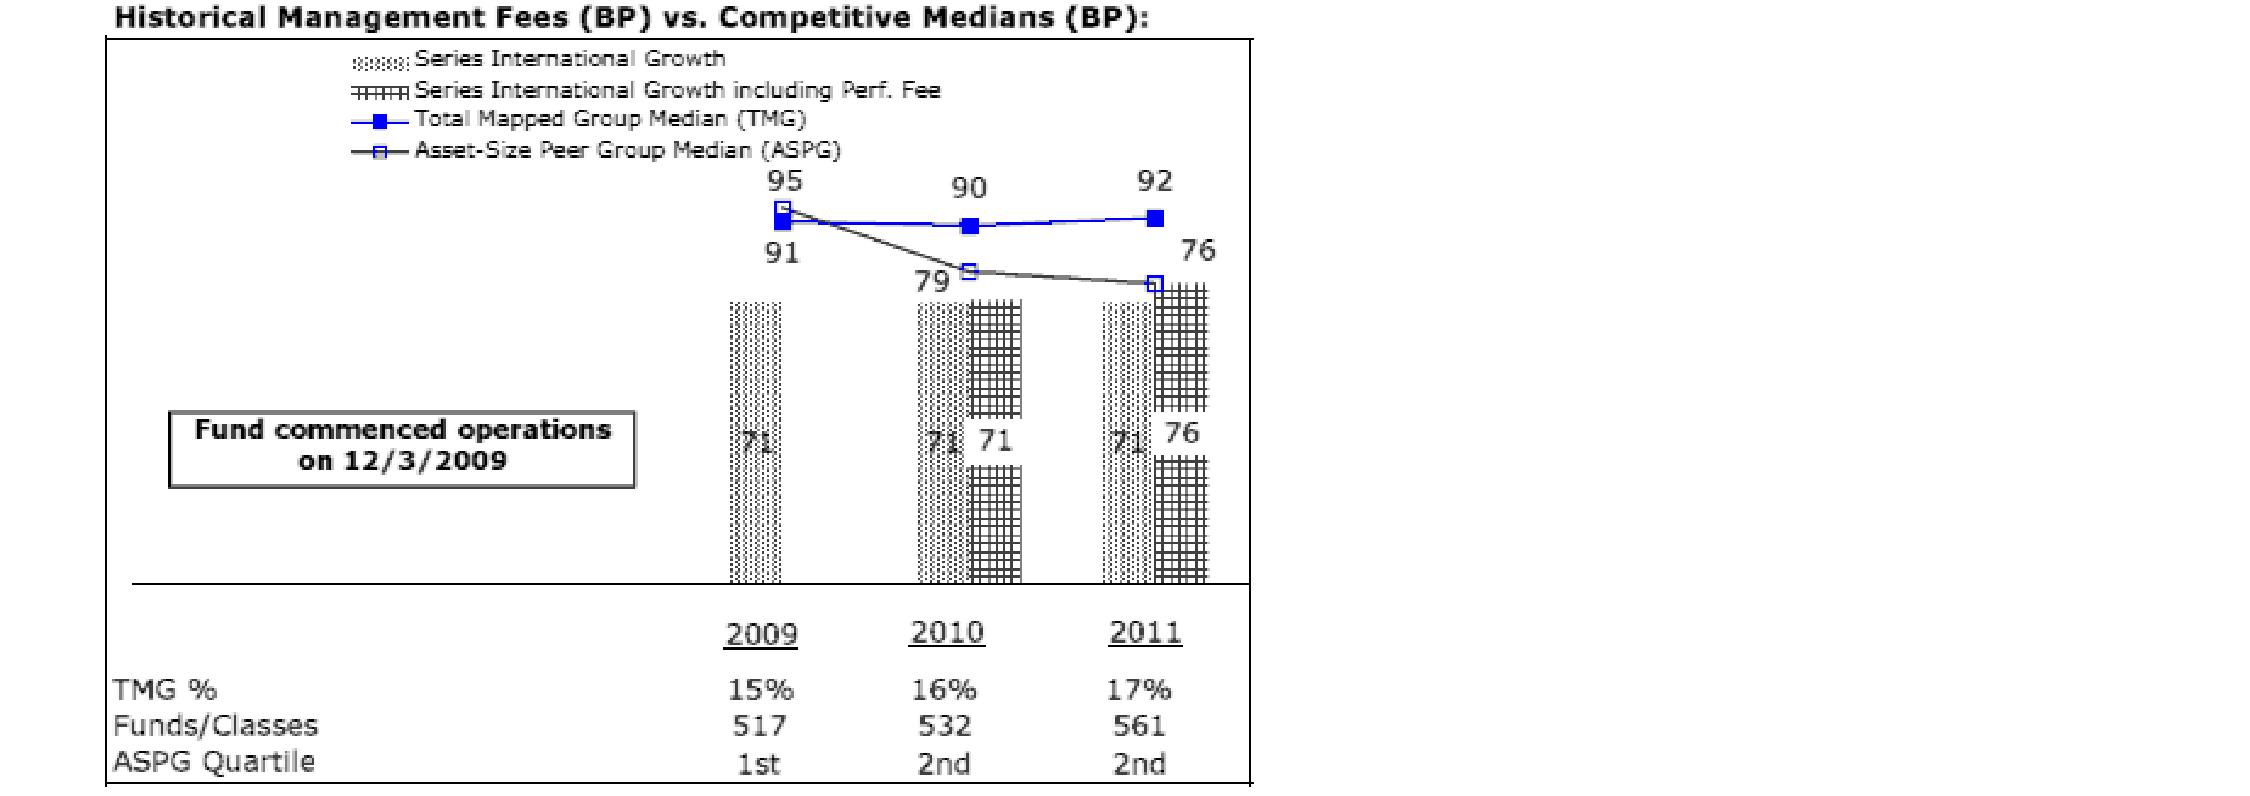
Annual Report
Fidelity Series International Small Cap Fund
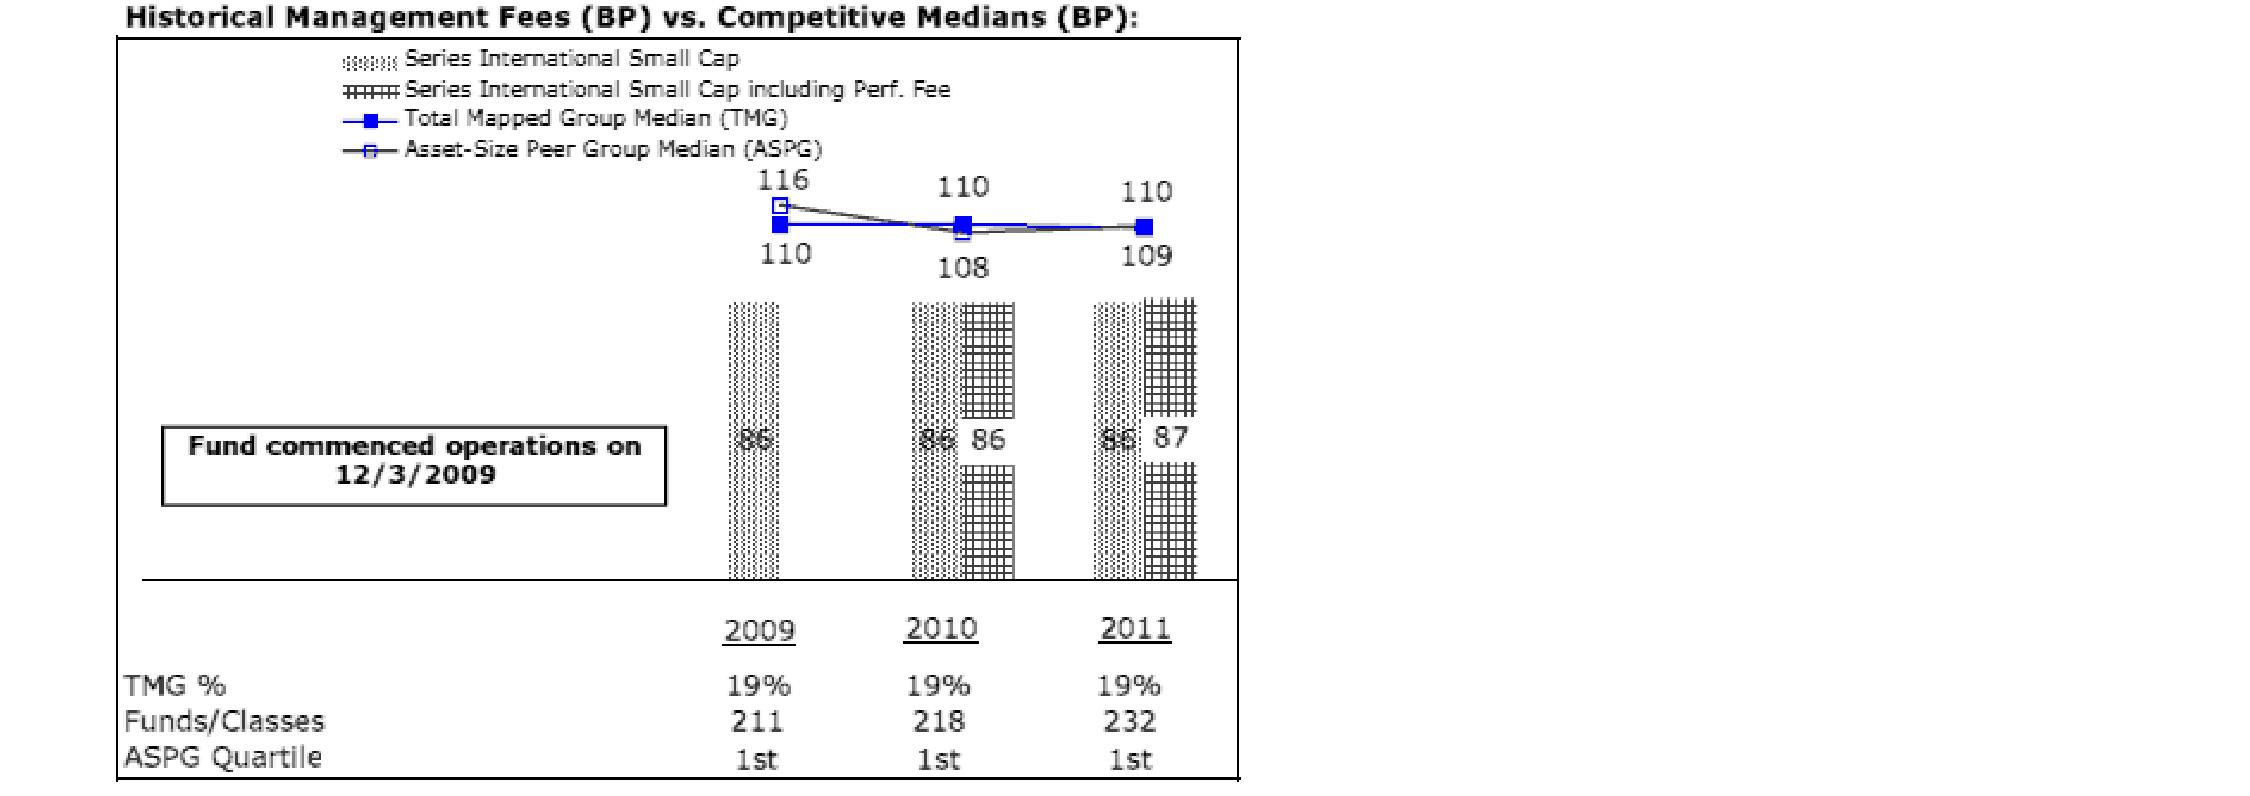
Fidelity Series International Value Fund
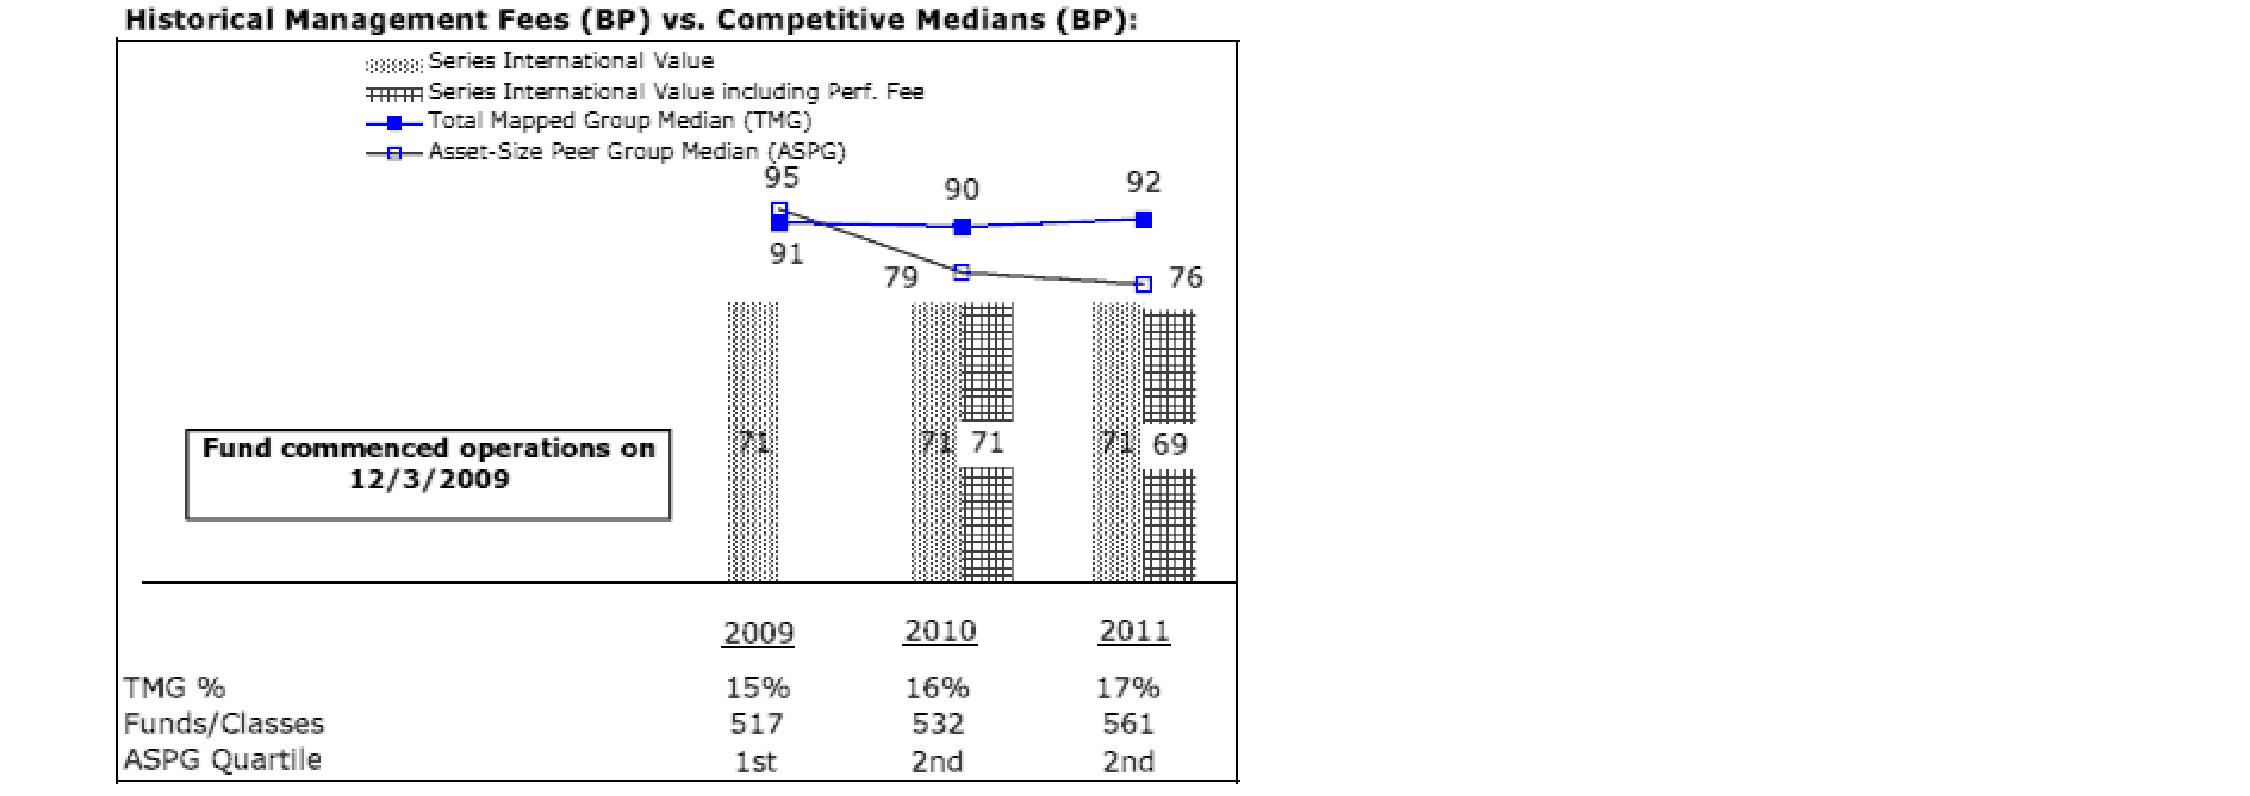
The Board noted that each fund's management fee ranked below the median of its Total Mapped Group and below the median of its ASPG for 2011. The Board also noted the effect of each of Fidelity Series International Growth Fund's and Fidelity Series International Small Cap Fund's positive performance adjustment and Fidelity Series International Value Fund's negative performance adjustment on the fund's management fee ranking. The Board noted that the performance adjustment for 2011 represents calculations for performance periods that differ from the period shown in the performance chart above.
Annual Report
Board Approval of Investment Advisory Contracts and
Management Fees - continued
Based on its review, the Board concluded that each fund's management fee is fair and reasonable in light of the services that the fund receives and the other factors considered.
Total Expense Ratio. In its review of the total expense ratio of each class of each fund, the Board considered the fund's management fee as well as other fund or class expenses, as applicable, such as transfer agent fees, pricing and bookkeeping fees, and custodial, legal, and audit fees. The Board also noted the effects of any waivers and reimbursements on fees and expenses, as well as the impact of each fund's performance adjustment. As part of its review, the Board also considered the current and historical total expense ratios of each class of each fund compared to competitive fund median expenses. Each class of each fund is compared to those funds and classes in the Total Mapped Group (used by the Board for management fee comparisons) that have a similar sales load structure.
The Board noted that the total expense ratio of each class of each fund ranked below its competitive median for 2011.
Fees Charged to Other Fidelity Clients. The Board also considered Fidelity fee structures and other information with respect to clients of FMR and its affiliates, such as other mutual funds advised or subadvised by FMR or its affiliates, pension plan clients, and other institutional clients. The Board noted the findings of the 2010 ad hoc joint committee (created with the board of other Fidelity funds), which reviewed and compared Fidelity's institutional investment advisory business with its business of providing services to the Fidelity funds, including the differences in services provided, fees charged, and costs incurred, as well as competition in their respective marketplaces.
Based on its review of total expense ratios and fees charged to other Fidelity clients, the Board concluded that the total expense ratio of each class of each fund was reasonable in light of the services that the fund and its shareholders receive and the other factors considered.
Costs of the Services and Profitability. The Board considered the revenues earned and the expenses incurred by Fidelity in conducting the business of developing, marketing, distributing, managing, administering and servicing each fund and its shareholders. The Board also considered the level of Fidelity's profits in respect of all the Fidelity funds.
On an annual basis, FMR presents to the Board Fidelity's profitability for each fund. Fidelity calculates the profitability for each fund, as well as aggregate profitability for groups of Fidelity funds and all Fidelity funds, using a series of detailed revenue and cost allocation methodologies which originate with the books and records of Fidelity on which Fidelity's audited financial statements are based. The Audit Committee of the Board reviews any significant changes from the prior year's methodologies.
Annual Report
PricewaterhouseCoopers LLP (PwC), independent registered public accounting firm and auditor to Fidelity and certain Fidelity funds, has been engaged annually by the Board as part of the Board's assessment of Fidelity's profitability analysis. PwC's engagement includes the review and assessment of Fidelity's methodologies used in determining the revenues and expenses attributable to Fidelity's mutual fund business, and completion of agreed-upon procedures surrounding the mathematical accuracy of fund profitability and its conformity to allocation methodologies. After considering PwC's reports issued under the engagement and information provided by Fidelity, the Board concluded that while other allocation methods may also be reasonable, Fidelity's profitability methodologies are reasonable in all material respects.
The Board also reviewed Fidelity's non-fund businesses and fall-out benefits related to the mutual fund business as well as cases where Fidelity's affiliates may benefit from or be related to the funds' business.
The Board considered the costs of the services provided by and the profits realized by Fidelity in connection with the operation of each fund and was satisfied that the profitability was not excessive in the circumstances.
Economies of Scale. The Board considered whether there have been economies of scale in respect of the management of the Fidelity funds, whether the Fidelity funds (including each fund) have appropriately benefited from any such economies of scale, and whether there is potential for realization of any further economies of scale. The Board considered the extent to which each fund will benefit from economies of scale through increased services to the fund, through waivers or reimbursements, or through fee or expense reductions. The Board also noted that in 2009, it and the board of other Fidelity funds created an ad hoc committee (the Economies of Scale Committee) to analyze whether FMR attains economies of scale in respect of the management and servicing of the Fidelity funds, whether the Fidelity funds have appropriately benefited from such economies of scale, and whether there is potential for realization of any further economies of scale.
The Board recognized that each fund's management contract incorporates a "group fee" structure, which provides for lower group fee rates as total fund assets under FMR's management increase, and for higher group fee rates as total fund assets under FMR's management decrease. FMR calculates the group fee rates based on a tiered asset "breakpoint" schedule that varies based on asset class. The Board considered that the group fee is designed to deliver the benefits of economies of scale to fund shareholders when total Fidelity fund assets increase, even if assets of any particular fund are unchanged or have declined, because some portion of Fidelity's costs are attributable to services provided to all Fidelity funds, and all funds benefit if those costs can be allocated among more assets. The Board also considered that although each fund is offered only to other funds advised by FMR or an affiliate, it continues to incur investment management expenses. The Board further noted that each fund may continue to realize benefits from the group fee structure, even though assets may not be expected to grow significantly at the fund level. The Board concluded that, given the group fee structure, fund shareholders will benefit from lower management fees as assets under FMR's management increase at the fund complex level, regardless of whether Fidelity achieves any such economies of scale.
Annual Report
Board Approval of Investment Advisory Contracts and
Management Fees - continued
The Board concluded, taking into account the analysis of the Economies of Scale Committee, that economies of scale, if any, are being appropriately shared between fund shareholders and Fidelity.
Additional Information Requested by the Board. In order to develop fully the factual basis for consideration of the Fidelity funds' Advisory Contracts, the Board requested and received additional information on certain topics, including (i) fund performance trends, actions to be taken by FMR to improve certain funds' overall performance, and Fidelity's long-term strategies for certain funds; (ii) the potential to further rationalize the Fidelity fund lineup with the possibility of achieving savings for the funds and Fidelity; (iii) Fidelity's compensation structure for portfolio managers and other key investment personnel; (iv) the amount of the investment that each portfolio manager has made in the Fidelity fund(s) that he or she manages; (v) the realization of fall-out benefits in certain Fidelity business units; (vi) Fidelity's group fee structures, the potential impact of regulatory changes on such structures, and the rationale for the individual fee rates of certain funds; (vii) fund profitability methodology, including Fidelity's cost allocation methodology, and the impact of certain factors on fund profitability results; (viii) trends regarding industry use of performance fee structures and the possibility of implementing performance fee structures for additional funds; and (ix) the impact of net redemptions from the Fidelity funds.
Based on its evaluation of all of the conclusions noted above, and after considering all factors it believed relevant, the Board ultimately concluded that the advisory fee structures are fair and reasonable, and that each fund's Advisory Contracts should be renewed.
Annual Report
Investment Adviser
Fidelity Management & Research Company
Boston, MA
Investment Sub-Advisers
FMR Co., Inc.
Fidelity Management & Research (U.K.) Inc.
Fidelity Management & Research (Hong Kong) Limited
Fidelity Management & Research (Japan) Inc.
FIL Investment Advisors
FIL Investments (Japan) Limited
FIL Investment Advisors (UK) Limited
General Distributor
Fidelity Distributors Corporation
Smithfield, RI
Transfer and Service Agents
Fidelity Investments Institutional Operations Company, Inc.
Boston, MA
Fidelity Service Company, Inc.
Boston, MA
Custodians
The Northern Trust Company
Chicago, IL
Fidelity Series Emerging Markets Fund
State Street Bank and Trust Company
Quincy, MA
Fidelity Series International Growth Fund, Fidelity Series International Small Cap Fund, Fidelity Series International Value Fund
(Fidelity Investment logo)(registered trademark)
Corporate Headquarters
82 Devonshire St., Boston, MA 02109
www.fidelity.com
GSV-S-ANN-1212
1.907943.102
(Fidelity Investment logo)(registered trademark)
Fidelity Advisor®
Emerging Markets Discovery
Fund - Institutional Class
Annual Report
October 31, 2012
(Fidelity Cover Art)
Institutional Class is
a class of Fidelity®
Emerging Markets
Discovery Fund
Contents
Performance | (Click Here) | How the fund has done over time. |
Management's Discussion of Fund Performance | (Click Here) | The Portfolio Manager's review of fund performance and strategy. |
Shareholder Expense Example | (Click Here) | An example of shareholder expenses. |
Investment Changes | (Click Here) | A summary of major shifts in the fund's investments over the past six months. |
Investments | (Click Here) | A complete list of the fund's investments with their market values. |
Financial Statements | (Click Here) | Statements of assets and liabilities, operations, and changes in net assets,
as well as financial highlights. |
Notes | (Click Here) | Notes to the financial statements. |
Report of Independent Registered Public Accounting Firm | (Click Here) | |
Trustees and Officers | (Click Here) | |
Distributions | (Click Here) | |
Board Approval of Investment Advisory Contracts and Management Fees | (Click Here) | |
To view a fund's proxy voting guidelines and proxy voting record for the 12-month period ended June 30, visit http://www.fidelity.com/proxyvotingresults or visit the Securities and Exchange Commission's (SEC) web site at http://www.sec.gov. You may also call 1-877-208-0098 to request a free copy of the proxy voting guidelines.
Standard & Poor's, S&P and S&P 500 are registered service marks of The McGraw-Hill Companies, Inc. and have been licensed for use by Fidelity Distributors Corporation.
Other third party marks appearing herein are the property of their respective owners.
All other marks appearing herein are registered or unregistered trademarks or service marks of FMR LLC or an affiliated company. © 2012 FMR LLC. All rights reserved.
Annual Report
This report and the financial statements contained herein are submitted for the general information of the shareholders of the fund. This report is not authorized for distribution to prospective investors in the fund unless preceded or accompanied by an effective prospectus.
A fund files its complete schedule of portfolio holdings with the SEC for the first and third quarters of each fiscal year on Form N-Q. Forms N-Q are available on the SEC's web site at http://www.sec.gov. A fund's Forms N-Q may be reviewed and copied at the SEC's Public Reference Room in Washington, DC. Information regarding the operation of the SEC's Public Reference Room may be obtained by calling 1-800-SEC-0330. For a complete list of a fund's portfolio holdings, view the most recent holdings listing, semiannual report, or annual report on Fidelity's web site at http://www.fidelity.com, http://www.advisor.fidelity.com, or http://www.401k.com, as applicable.
NOT FDIC INSURED • MAY LOSE VALUE • NO BANK GUARANTEE
Neither the fund nor Fidelity Distributors Corporation is a bank.
Annual Report
Average annual total return reflects the change in the value of an investment, assuming reinvestment of the class' distributions from dividend income and capital gains (the profits earned upon the sale of securities that have grown in value, if any) and assuming a constant rate of performance each year. The $10,000 table and the fund's returns do not reflect the deduction of taxes that a shareholder would pay on fund distributions or the redemption of fund shares. During periods of reimbursement by Fidelity, a fund's total return will be greater than it would be had the reimbursement not occurred. How a fund did yesterday is no guarantee of how it will do tomorrow.
Average annual total returns take Fidelity Advisor® Emerging Markets Discovery Fund - Institutional Class' cumulative total return and show you what would have happened if Institutional Class shares had performed at a constant rate each year. These numbers will be reported once the fund is a year old.
$10,000 Over Life of Fund
Let's say hypothetically that $10,000 was invested in Fidelity Advisor® Emerging Markets Discovery Fund - Institutional Class on November 1, 2011, when the fund started. The chart shows how the value of your investment would have changed, and also shows how the MSCI® Emerging Markets SMID Cap Index performed over the same period.
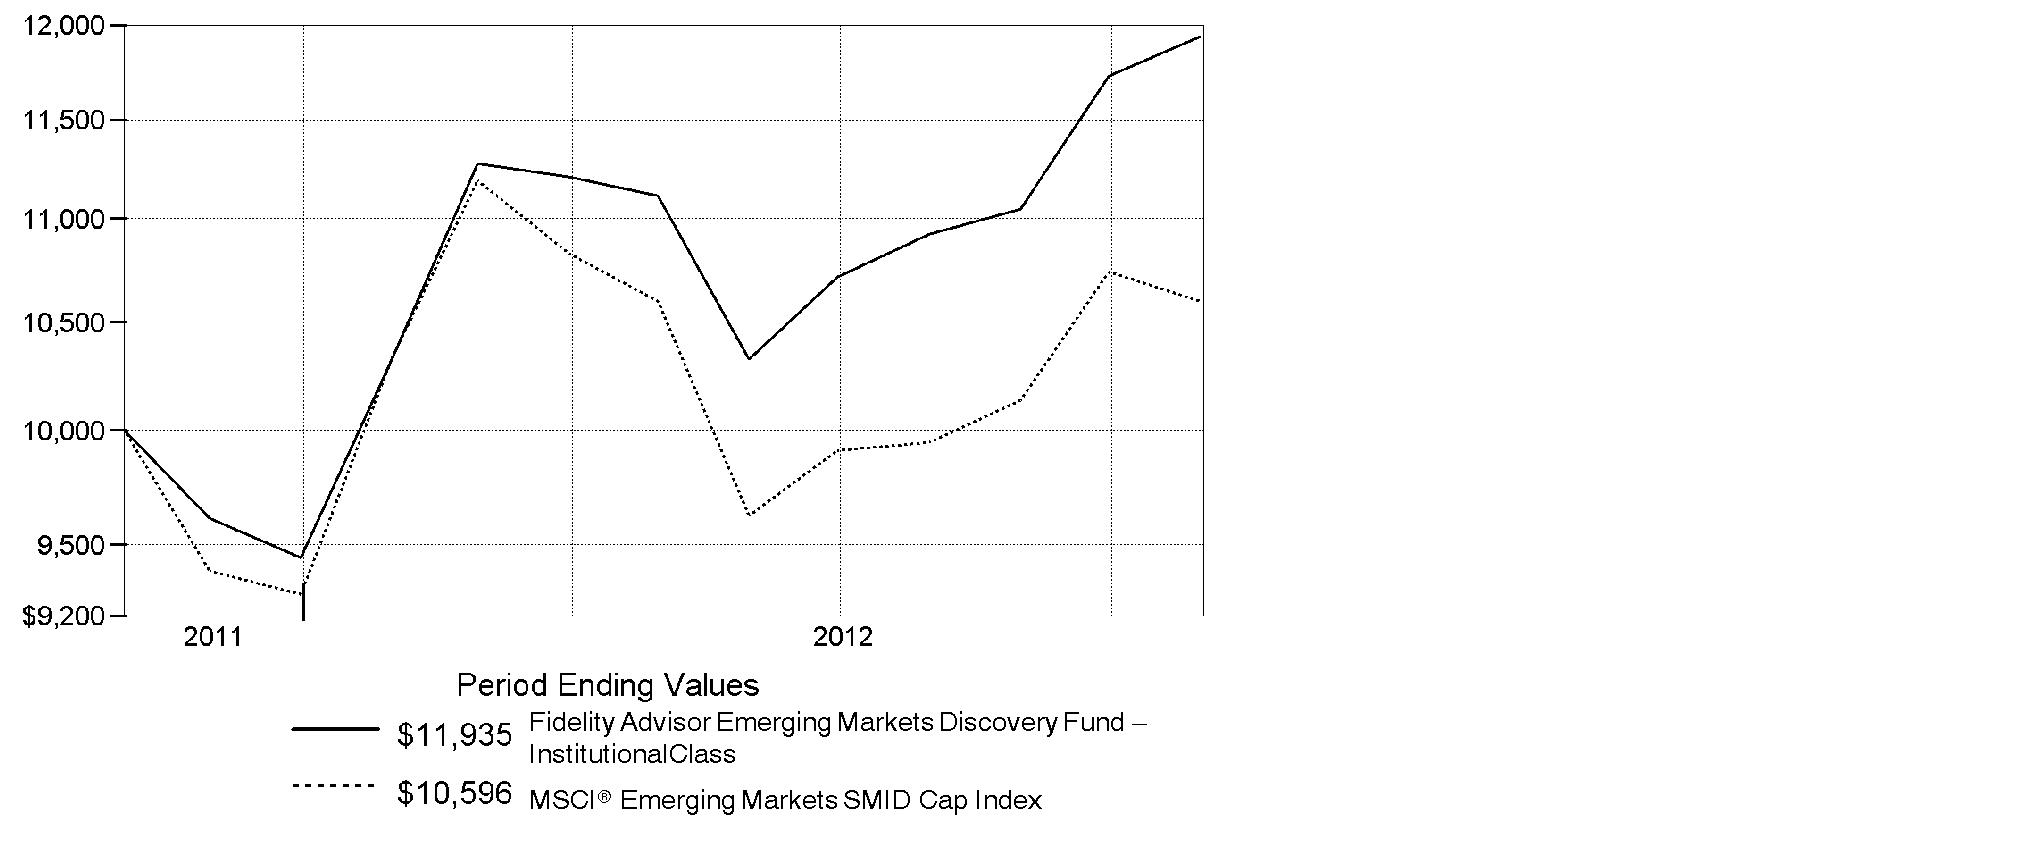
Annual Report
Market Recap: Emerging-markets stocks gained 2.98% for the year ending October 31, 2012, as measured by the MSCI® Emerging Markets Index. After some early choppiness, the index rallied strongly in the first two months of 2012 but retreated from March through May amid renewed concerns about Europe's sovereign debt crisis and continued economic sluggishness in key countries such as China and Brazil. A general uptrend in the final five months of the period lifted the index into positive territory for the full year, despite the head wind of a generally stronger U.S. dollar. Major benchmark component Brazil was a drag on performance, falling roughly 13%. The nation's inflation rate crept higher while economic growth ebbed, creating an unfavorable backdrop for stocks here. India's market retreated about 5%, while Russia gave up 4%. Conversely, Hong Kong advanced approximately 17%, aided by rebounding shares of property developers, while South Africa added 7%, China rose roughly 5% and South Korea and Taiwan gained about 4% and 1%, respectively. Sentiment about Chinese stocks improved following the government's September approval of massive outlays for infrastructure projects, in hopes of halting that nation's economic slowdown. However, China's ongoing transition to new Communist Party leadership created uncertainty that kept some investors on the sidelines.
Comments from Ashish Swarup, Portfolio Manager of Fidelity Advisor® Emerging Markets Discovery Fund: From its inception on November 1, 2011, through October 31, 2012, the fund's Institutional Class shares rose 19.35%, easily outpacing the 5.96% gain of the MSCI® Emerging Markets SMID Cap Index. My focus on high-quality, steady growers worked well during this volatile period, including a stake in Uni-President Enterprises, Taiwan's largest food and beverage producer with a stake in local convenience stores. The fund benefited from its large out-of-benchmark position in the stock, which rose steadily for much of the period. South Korea's Yuhan was a standout value play. By spring 2012, shares of the health care products manufacturer were trading at an extremely cheap valuation. Establishing a position in May turned out to be the right call, as investors began to believe in the strength of the company's franchise and drove up the stock through period end, leaving Yuhan as the fund's top contributor. Among major detractors was Lianhua Supermarket Holdings. The Chinese grocery chain faced a difficult macroeconomic environment in that country, as well as government-imposed restrictions on coupons and gift cards, which hurt the chain's profits and its stock price. Exposure to India through two exchange-traded funds (since sold) also hurt.
The views expressed above reflect those of the portfolio manager(s) only through the end of the period as stated on the cover of this report and do not necessarily represent the views of Fidelity or any other person in the Fidelity organization. Any such views are subject to change at any time based upon market or other conditions and Fidelity disclaims any responsibility to update such views. These views may not be relied on as investment advice and, because investment decisions for a Fidelity fund are based on numerous factors, may not be relied on as an indication of trading intent on behalf of any Fidelity fund.
Annual Report
Fidelity Emerging Markets Discovery Fund
Shareholder Expense Example
As a shareholder of the Fund, you incur two types of costs: (1) transaction costs, including sales charges (loads) on purchase payments or redemption proceeds, redemption fees and (2) ongoing costs, including management fees, distribution and/or service (12b-1) fees and other Fund expenses. This Example is intended to help you understand your ongoing costs (in dollars) of investing in the Fund and to compare these costs with the ongoing costs of investing in other mutual funds.
The Example is based on an investment of $1,000 invested at the beginning of the period and held for the entire period (May 1, 2012 to October 31, 2012).
Actual Expenses
The first line of the accompanying table for each class of the Fund provides information about actual account values and actual expenses. You may use the information in this line, together with the amount you invested, to estimate the expenses that you paid over the period. Simply divide your account value by $1,000.00 (for example, an $8,600 account value divided by $1,000.00 = 8.6), then multiply the result by the number in the first line for a class of the Fund under the heading entitled "Expenses Paid During Period" to estimate the expenses you paid on your account during this period. A small balance maintenance fee of $12.00 that is charged once a year may apply for certain accounts with a value of less than $2,000. This fee is not included in the table below. If it was, the estimate of expenses you paid during the period would be higher, and your ending account value lower, by this amount. In addition, the Fund, as a shareholder in the underlying Fidelity Central Funds, will indirectly bear its pro-rata share of the fees and expenses incurred by the underlying Fidelity Central Funds. These fees and expenses are not included in the Fund's annualized expense ratio used to calculate the expense estimate in the table below.
Hypothetical Example for Comparison Purposes
The second line of the accompanying table for each class of the Fund provides information about hypothetical account values and hypothetical expenses based on a Class' actual expense ratio and an assumed rate of return of 5% per year before expenses, which is not the Class' actual return. The hypothetical account values and expenses may not be used to estimate the actual ending account balance or expenses you paid for the period. You may use this information to compare the ongoing costs of investing in the Fund and other funds. To do so, compare this 5% hypothetical example with the 5% hypothetical examples that appear in the shareholder reports of the other funds. A small balance maintenance fee of $12.00 that is charged once a year may apply for certain accounts with a value of less than $2,000. This fee is not included in the table below. If it was, the estimate of expenses you paid during the period would be higher, and your ending account value lower, by this amount. In addition, the Fund, as a shareholder in the underlying Fidelity Central Funds, will indirectly bear its pro-rata share of the fees and expenses incurred by the underlying Fidelity Central Funds. These fees and expenses are not included in the Fund's annualized expense ratio used to calculate the expense estimate in the table below.
Please note that the expenses shown in the table are meant to highlight your ongoing costs only and do not reflect any transaction costs. Therefore, the second line of the table is useful in comparing ongoing costs only, and will not help you determine the relative total costs of owning different funds. In addition, if these transactional costs were included, your costs would have been higher.
Annual Report
Shareholder Expense Example - continued
| Annualized
Expense Ratio | Beginning
Account Value
May 1, 2012 | Ending
Account Value
October 31, 2012 | Expenses Paid
During Period*
May 1, 2012
to October 31, 2012 |
Class A | 1.70% | | | |
Actual | | $ 1,000.00 | $ 1,072.10 | $ 8.85 |
HypotheticalA | | $ 1,000.00 | $ 1,016.59 | $ 8.62 |
Class T | 1.95% | | | |
Actual | | $ 1,000.00 | $ 1,071.30 | $ 10.15 |
HypotheticalA | | $ 1,000.00 | $ 1,015.33 | $ 9.88 |
Class C | 2.45% | | | |
Actual | | $ 1,000.00 | $ 1,068.70 | $ 12.74 |
HypotheticalA | | $ 1,000.00 | $ 1,012.82 | $ 12.40 |
Emerging Markets Discovery | 1.45% | | | |
Actual | | $ 1,000.00 | $ 1,073.90 | $ 7.56 |
HypotheticalA | | $ 1,000.00 | $ 1,017.85 | $ 7.35 |
Institutional Class | 1.45% | | | |
Actual | | $ 1,000.00 | $ 1,073.90 | $ 7.56 |
HypotheticalA | | $ 1,000.00 | $ 1,017.85 | $ 7.35 |
A 5% return per year before expenses
* Expenses are equal to each Class' annualized expense ratio, multiplied by the average account value over the period, multiplied by 184/366 (to reflect the one-half year period).
Annual Report
Fidelity Emerging Markets Discovery Fund
Investment Changes (Unaudited)
Top Five Stocks as of October 31, 2012 |
| % of fund's
net assets | % of fund's net assets
6 months ago |
Unified-President Enterprises Corp. (Taiwan, Food Products) | 1.4 | 2.1 |
LG Corp. (Korea (South), Industrial Conglomerates) | 1.4 | 0.8 |
BS Financial Group, Inc. (Korea (South), Commercial Banks) | 1.3 | 0.9 |
China Insurance International Holdings Co. Ltd. (Hong Kong, Insurance) | 1.2 | 0.6 |
Samson Holding Ltd. (Cayman Islands, Household Durables) | 1.2 | 0.9 |
| 6.5 | |
Top Five Market Sectors as of October 31, 2012 |
| % of fund's
net assets | % of fund's net assets
6 months ago |
Financials | 21.2 | 18.1 |
Consumer Staples | 17.3 | 16.5 |
Industrials | 14.5 | 14.0 |
Consumer Discretionary | 12.7 | 11.1 |
Information Technology | 11.3 | 10.2 |
Top Five Countries as of October 31, 2012 |
(excluding cash equivalents) | % of fund's
net assets | % of fund's net assets
6 months ago |
Taiwan | 14.1 | 13.5 |
Korea (South) | 12.8 | 13.1 |
India | 9.2 | 0.9 |
South Africa | 8.9 | 8.5 |
Cayman Islands | 8.3 | 7.6 |
Percentages are adjusted for the effect of open futures contracts, if applicable. |
Asset Allocation (% of fund's net assets) |
As of October 31, 2012 | As of April 30, 2012 |
 | Stocks and
Investment
Companies 97.2% | | | Stocks and
Investment
Companies 96.0% | |
| Short-Term
Investments and
Net Other Assets
(Liabilities) 2.8% | | | Short-Term
Investments and
Net Other Assets
(Liabilities) 4.0% | |

Annual Report
Fidelity Emerging Markets Discovery Fund
Investments October 31, 2012
Showing Percentage of Net Assets
Common Stocks - 96.5% |
| Shares | | Value |
Bailiwick of Jersey - 0.9% |
Atrium European Real Estate Ltd. | 73,315 | | $ 414,414 |
Bermuda - 6.4% |
ARA Asset Management Ltd. (c) | 282,000 | | 366,429 |
GP Investments Ltd. (depositary receipt) (a) | 144,317 | | 333,250 |
Pacific Basin Shipping Ltd. | 848,000 | | 454,087 |
Texwinca Holdings Ltd. | 452,000 | | 359,848 |
Trinity Ltd. | 456,000 | | 319,492 |
Vtech Holdings Ltd. | 30,500 | | 362,259 |
Wilson Sons Ltd. unit | 25,655 | | 356,205 |
Yue Yuen Industrial (Holdings) Ltd. | 112,500 | | 388,304 |
TOTAL BERMUDA | | 2,939,874 |
Brazil - 3.0% |
Duratex SA | 53,339 | | 371,079 |
LPS Brasil Consultoria de Imoveis SA | 16,628 | | 285,723 |
Oi SA | 61,940 | | 292,765 |
Porto Seguro SA | 39,080 | | 415,612 |
TOTAL BRAZIL | | 1,365,179 |
Cayman Islands - 8.3% |
ASM Pacific Technology Ltd. | 30,400 | | 338,909 |
Boer Power Holdings Ltd. | 1,149,000 | | 415,120 |
Haitian International Holdings Ltd. | 235,000 | | 290,185 |
Kingboard Chemical Holdings Ltd. | 117,500 | | 349,465 |
Lee & Man Paper Manufacturing Ltd. | 781,000 | | 410,148 |
O-Net Communications Group Ltd. | 1,397,000 | | 369,527 |
Samson Holding Ltd. | 3,736,000 | | 535,088 |
Value Partners Group Ltd. | 725,000 | | 395,707 |
Yingde Gases Group Co. Ltd. | 406,000 | | 385,043 |
Yip's Chemical Holdings Ltd. | 450,105 | | 303,746 |
TOTAL CAYMAN ISLANDS | | 3,792,938 |
Chile - 5.1% |
Compania Cervecerias Unidas SA sponsored ADR | 6,256 | | 443,738 |
Embotelladora Andina SA sponsored ADR | 10,053 | | 380,808 |
Isapre CruzBlanca SA | 377,800 | | 494,520 |
Parque Arauco SA | 188,928 | | 431,533 |
Quinenco SA | 123,729 | | 352,299 |
Sociedad Matriz SAAM SA | 2,030,814 | | 237,417 |
TOTAL CHILE | | 2,340,315 |
Common Stocks - continued |
| Shares | | Value |
China - 4.1% |
China BlueChemical Ltd. (H Shares) | 726,000 | | $ 459,953 |
China Oilfield Services Ltd. (H Shares) | 178,000 | | 337,624 |
China Shipping Development Co. Ltd. (H Shares) | 776,000 | | 407,523 |
Dongfeng Motor Group Co. Ltd. (H Shares) | 286,000 | | 354,269 |
Lianhua Supermarket Holdings Ltd. (H Shares) | 416,000 | | 336,018 |
TOTAL CHINA | | 1,895,387 |
Colombia - 0.7% |
Bolsa de Valores de Colombia | 17,742,190 | | 311,884 |
Hong Kong - 4.2% |
China Insurance International Holdings Co. Ltd. (a) | 329,400 | | 564,439 |
China Resources Power Holdings Co. Ltd. | 172,000 | | 368,411 |
Dah Chong Hong Holdings Ltd. | 364,000 | | 343,332 |
Television Broadcasts Ltd. | 45,000 | | 335,320 |
Vitasoy International Holdings Ltd. | 346,000 | | 328,586 |
TOTAL HONG KONG | | 1,940,088 |
India - 9.2% |
Britannia Industries Ltd. (a) | 39,964 | | 359,234 |
Container Corp. of India Ltd. | 18,029 | | 336,437 |
DB Corp. Ltd. | 72,284 | | 281,519 |
Max India Ltd. (a) | 82,604 | | 371,683 |
Oberoi Realty Ltd. (a) | 74,721 | | 379,195 |
Pidilite Industries Ltd. (a) | 92,320 | | 329,953 |
Piramal Enterprises Ltd. | 39,631 | | 365,779 |
Punjab National Bank | 28,154 | | 399,512 |
Redington India Ltd. | 205,537 | | 309,614 |
Satyam Computer Services Ltd. (a) | 232,067 | | 470,992 |
Smithkline Beecham Consumer Healthcare Ltd. | 4,666 | | 263,370 |
Trent Ltd. | 17,012 | | 351,954 |
TOTAL INDIA | | 4,219,242 |
Indonesia - 2.2% |
PT Astra Graphia Tbk | 2,285,500 | | 333,127 |
PT Kalbe Farma Tbk | 3,550,500 | | 358,560 |
PT Ramayana Lestari Sentosa Tbk | 2,877,000 | | 332,479 |
TOTAL INDONESIA | | 1,024,166 |
Kenya - 0.8% |
Safaricom Ltd. | 6,662,734 | | 344,287 |
Korea (South) - 12.8% |
AMOREPACIFIC Corp. | 338 | | 384,401 |
Common Stocks - continued |
| Shares | | Value |
Korea (South) - continued |
BS Financial Group, Inc. | 52,000 | | $ 589,001 |
DuzonBizon Co. Ltd. (a) | 28,320 | | 285,714 |
E-Mart Co. Ltd. | 1,665 | | 361,153 |
Green Cross Holdings Corp. | 30,650 | | 477,887 |
Kiwoom Securities Co. Ltd. | 6,127 | | 310,194 |
LG Corp. | 10,280 | | 627,933 |
LG Fashion Corp. | 12,330 | | 343,782 |
LG Household & Health Care Ltd. | 841 | | 494,425 |
Nong Shim Co. Ltd. | 1,612 | | 381,444 |
S1 Corp. | 6,266 | | 378,148 |
Samsung Fire & Marine Insurance Co. Ltd. | 1,804 | | 394,613 |
Shinsegae Co. Ltd. | 1,944 | | 347,678 |
Yuhan Corp. | 2,705 | | 467,654 |
TOTAL KOREA (SOUTH) | | 5,844,027 |
Malaysia - 1.4% |
AEON Co. (M) Bhd | 96,100 | | 393,739 |
Top Glove Corp. Bhd | 147,900 | | 259,772 |
TOTAL MALAYSIA | | 653,511 |
Mexico - 2.6% |
Bolsa Mexicana de Valores SA de CV | 184,322 | | 408,087 |
Grupo Herdez SAB de CV | 154,817 | | 419,380 |
Urbi, Desarrollos Urbanos, SA de CV (a) | 556,186 | | 347,032 |
TOTAL MEXICO | | 1,174,499 |
Nigeria - 0.8% |
Nestle Foods Nigeria PLC | 81,461 | | 350,097 |
Philippines - 1.9% |
BDO Unibank, Inc. | 297,477 | | 463,225 |
Manila Water Co., Inc. | 595,400 | | 420,112 |
TOTAL PHILIPPINES | | 883,337 |
Poland - 0.9% |
Warsaw Stock Exchange | 36,105 | | 424,080 |
Singapore - 3.8% |
Ascendas India Trust | 494,000 | | 307,788 |
Bumitama Agri Ltd. | 435,000 | | 358,399 |
Ezra Holdings Ltd. | 359,000 | | 328,156 |
Global Logistic Properties Ltd. | 200,024 | | 421,431 |
Super Group Ltd. Singapore | 156,000 | | 312,051 |
TOTAL SINGAPORE | | 1,727,825 |
Common Stocks - continued |
| Shares | | Value |
South Africa - 8.9% |
Advtech Ltd. | 501,940 | | $ 329,392 |
African Oxygen Ltd. | 133,230 | | 301,166 |
AngloGold Ashanti Ltd. | 11,381 | | 384,511 |
Astral Foods Ltd. | 10,979 | | 121,178 |
Bidvest Group Ltd. | 14,700 | | 350,858 |
Coronation Fund Managers Ltd. | 86,000 | | 331,774 |
JSE Ltd. | 41,855 | | 339,497 |
Nampak Ltd. | 123,802 | | 412,642 |
Reunert Ltd. | 49,133 | | 432,814 |
SA Corporate Real Estate Fund | 883,400 | | 359,650 |
Tiger Brands Ltd. | 12,825 | | 407,648 |
Zeder Investments Ltd. | 899,061 | | 300,701 |
TOTAL SOUTH AFRICA | | 4,071,831 |
Sri Lanka - 0.9% |
John Keells Holdings Ltd. | 253,895 | | 399,994 |
Taiwan - 14.1% |
Chroma ATE, Inc. | 155,000 | | 295,036 |
Cleanaway Co. Ltd. | 50,000 | | 347,484 |
CTCI Corp. | 135,000 | | 268,521 |
Delta Electronics, Inc. | 100,000 | | 341,664 |
E Sun Financial Holdings Co. Ltd. | 680,050 | | 341,073 |
Formosa Optical Technology Co. Ltd. | 167,000 | | 428,791 |
Insyde Software Corp. | 82,000 | | 241,986 |
MJC Probe, Inc. | 130,000 | | 191,373 |
Motech Industries, Inc. (a) | 237,000 | | 182,557 |
Pacific Hospital Supply Co. Ltd. | 134,700 | | 392,433 |
Powertech Technology, Inc. | 200,000 | | 310,852 |
President Chain Store Corp. | 71,000 | | 351,232 |
SIMPLO Technology Co. Ltd. | 39,400 | | 194,235 |
Sinyi Realty, Inc. | 273,000 | | 364,498 |
St. Shine Optical Co. Ltd. | 25,000 | | 326,087 |
Taiwan Hon Chuan Enterprise Co. Ltd. | 144,000 | | 306,635 |
Unified-President Enterprises Corp. | 369,890 | | 653,419 |
Wah Lee Industrial Corp. | 250,000 | | 320,096 |
WPG Holding Co. Ltd. | 288,000 | | 348,045 |
Yungtay Engineering Co. Ltd. | 132,000 | | 263,006 |
TOTAL TAIWAN | | 6,469,023 |
Common Stocks - continued |
| Shares | | Value |
Turkey - 1.7% |
Anadolu Efes Biracilik Ve Malt Sanayii A/S | 30,749 | | $ 461,449 |
Enka Insaat ve Sanayi A/S | 121,800 | | 323,441 |
TOTAL TURKEY | | 784,890 |
United Arab Emirates - 0.9% |
First Gulf Bank PJSC | 145,141 | | 412,939 |
United Kingdom - 0.9% |
PZ Cussons PLC Class L | 78,416 | | 428,351 |
TOTAL COMMON STOCKS (Cost $41,546,037) |
44,212,178
|
Investment Companies - 0.7% |
| | | |
Thailand - 0.7% |
CPN Retail Growth Leasehold Property Fund
(Cost $281,433) | 596,600 | |
332,633
|
Money Market Funds - 2.2% |
| | | |
Fidelity Cash Central Fund, 0.19% (b)
(Cost $986,128) | 986,128 | |
986,128
|
TOTAL INVESTMENT PORTFOLIO - 99.4% (Cost $42,813,598) | | 45,530,939 |
NET OTHER ASSETS (LIABILITIES) - 0.6% | | 274,943 |
NET ASSETS - 100% | $ 45,805,882 |
Legend |
(a) Non-income producing |
(b) Affiliated fund that is available only to investment companies and other accounts managed by Fidelity Investments. The rate quoted is the annualized seven-day yield of the fund at period end. A complete unaudited listing of the fund's holdings as of its most recent quarter end is available upon request. In addition, each Fidelity Central Fund's financial statements, which are not covered by the Fund's Report of Independent Registered Public Accounting Firm, are available on the SEC's website or upon request. |
(c) Security exempt from registration under Rule 144A of the Securities Act of 1933. These securities may be resold in transactions exempt from registration, normally to qualified institutional buyers. At the end of the period, the value of these securities amounted to $366,429 or 0.8% of net assets. |
Affiliated Central Funds |
Information regarding fiscal year to date income earned by the Fund from investments in Fidelity Central Funds is as follows: |
Fund | Income earned |
Fidelity Cash Central Fund | $ 1,474 |
Other Information |
Categorizations in the Schedule of Investments are based on country or territory of incorporation. |
The following is a summary of the inputs used, as of October 31, 2012, involving the Fund's assets and liabilities carried at fair value. The inputs or methodology used for valuing securities may not be an indication of the risk associated with investing in those securities. For more information on valuation inputs, and their aggregation into the levels used in the table below, please refer to the Security Valuation section in the accompanying Notes to Financial Statements. |
Valuation Inputs at Reporting Date: |
Description | Total | Level 1 | Level 2 | Level 3 |
Investments in Securities: | | | | |
Equities: | | | | |
Consumer Discretionary | $ 5,792,019 | $ 5,792,019 | $ - | $ - |
Consumer Staples | 7,897,082 | 7,897,082 | - | - |
Energy | 665,780 | 665,780 | - | - |
Financials | 9,765,548 | 9,366,036 | 399,512 | - |
Health Care | 3,142,692 | 3,142,692 | - | - |
Industrials | 6,613,155 | 6,613,155 | - | - |
Information Technology | 5,245,451 | 5,245,451 | - | - |
Materials | 3,664,876 | 3,280,365 | 384,511 | - |
Telecommunication Services | 637,052 | 637,052 | - | - |
Utilities | 788,523 | 788,523 | - | - |
Investment Companies | 332,633 | 332,633 | - | - |
Money Market Funds | 986,128 | 986,128 | - | - |
Total Investments in Securities: | $ 45,530,939 | $ 44,746,916 | $ 784,023 | $ - |
See accompanying notes which are an integral part of the financial statements.
Annual Report
Fidelity Emerging Markets Discovery Fund
Statement of Assets and Liabilities
| October 31, 2012 |
| | |
Assets | | |
Investment in securities, at value - See accompanying schedule: Unaffiliated issuers (cost $41,827,470) | $ 44,544,811 | |
Fidelity Central Funds (cost $986,128) | 986,128 | |
Total Investments (cost $42,813,598) | | $ 45,530,939 |
Cash | | 8,906 |
Foreign currency held at value (cost $305,626) | | 305,686 |
Receivable for investments sold | | 253,106 |
Receivable for fund shares sold | | 399,571 |
Dividends receivable | | 40,734 |
Distributions receivable from Fidelity Central Funds | | 359 |
Receivable from investment adviser for expense reductions | | 67,146 |
Other affiliated receivables | | 73,436 |
Other receivables | | 8,980 |
Total assets | | 46,688,863 |
| | |
Liabilities | | |
Payable for investments purchased | $ 541,509 | |
Payable for fund shares redeemed | 179,125 | |
Accrued management fee | 30,100 | |
Distribution and service plan fees payable | 2,246 | |
Other affiliated payables | 8,926 | |
Other payables and accrued expenses | 121,075 | |
Total liabilities | | 882,981 |
| | |
Net Assets | | $ 45,805,882 |
Net Assets consist of: | | |
Paid in capital | | $ 42,091,833 |
Undistributed net investment income | | 251,826 |
Accumulated undistributed net realized gain (loss) on investments and foreign currency transactions | | 778,695 |
Net unrealized appreciation (depreciation) on investments and assets and liabilities in foreign currencies | | 2,683,528 |
Net Assets | | $ 45,805,882 |
See accompanying notes which are an integral part of the financial statements.
Annual Report
Fidelity Emerging Markets Discovery Fund
Financial Statements - continued
Statement of Assets and Liabilities - continued
| October 31, 2012 |
| | |
Calculation of Maximum Offering Price Class A:
Net Asset Value and redemption price per share ($1,670,981 ÷ 140,485 shares) | | $ 11.89 |
| | |
Maximum offering price per share (100/94.25 of $11.89) | | $ 12.62 |
Class T:
Net Asset Value and redemption price per share ($1,700,385 ÷ 143,256 shares) | | $ 11.87 |
| | |
Maximum offering price per share (100/96.50 of $11.87) | | $ 12.30 |
Class C:
Net Asset Value and offering price per share ($1,474,059 ÷ 124,755 shares)A | | $ 11.82 |
| | |
Emerging Markets Discovery:
Net Asset Value, offering price and redemption price per share ($39,135,461 ÷ 3,283,254 shares) | | $ 11.92 |
| | |
Institutional Class:
Net Asset Value, offering price and redemption price per share ($1,824,996 ÷ 153,109 shares) | | $ 11.92 |
A Redemption price per share is equal to net asset value less any applicable contingent deferred sales charge.
See accompanying notes which are an integral part of the financial statements.
Annual Report
Statement of Operations
| | For the period
November 1, 2011
(commencement of
operations) to
October 31, 2012 |
| | |
Investment Income | | |
Dividends | | $ 634,505 |
Income from Fidelity Central Funds | | 1,474 |
Income before foreign taxes withheld | | 635,979 |
Less foreign taxes withheld | | (58,290) |
Total income | | 577,689 |
| | |
Expenses | | |
Management fee | $ 176,730 | |
Transfer agent fees | 47,994 | |
Distribution and service plan fees | 15,564 | |
Accounting fees and expenses | 10,679 | |
Custodian fees and expenses | 215,734 | |
Independent trustees' compensation | 114 | |
Registration fees | 125,640 | |
Audit | 54,161 | |
Legal | 63 | |
Miscellaneous | 391 | |
Total expenses before reductions | 647,070 | |
Expense reductions | (344,473) | 302,597 |
Net investment income (loss) | | 275,092 |
Realized and Unrealized Gain (Loss) Net realized gain (loss) on: | | |
Investment securities: | | |
Unaffiliated issuers (net of foreign taxes of $4,717) | 832,255 | |
Foreign currency transactions | 2,291 | |
Total net realized gain (loss) | | 834,546 |
Change in net unrealized appreciation (depreciation) on: Investment securities (net of increase in deferred foreign taxes of $33,633) | 2,683,708 | |
Assets and liabilities in foreign currencies | (180) | |
Total change in net unrealized appreciation (depreciation) | | 2,683,528 |
Net gain (loss) | | 3,518,074 |
Net increase (decrease) in net assets resulting from operations | | $ 3,793,166 |
See accompanying notes which are an integral part of the financial statements.
Annual Report
Fidelity Emerging Markets Discovery Fund
Financial Statements - continued
Statement of Changes in Net Assets
| For the period
November 1, 2011
(commencement of
operations) to
October 31, 2012 |
Increase (Decrease) in Net Assets | |
Operations | |
Net investment income (loss) | $ 275,092 |
Net realized gain (loss) | 834,546 |
Change in net unrealized appreciation (depreciation) | 2,683,528 |
Net increase (decrease) in net assets resulting from operations | 3,793,166 |
Distributions to shareholders from net investment income | (7,760) |
Share transactions - net increase (decrease) | 41,986,470 |
Redemption fees | 34,006 |
Total increase (decrease) in net assets | 45,805,882 |
| |
Net Assets | |
Beginning of period | - |
End of period (including undistributed net investment income of $251,826) | $ 45,805,882 |
See accompanying notes which are an integral part of the financial statements.
Annual Report
Financial Highlights - Class A
Period ended October 31, | 2012 F |
Selected Per-Share Data | |
Net asset value, beginning of period | $ 10.00 |
Income from Investment Operations | |
Net investment income (loss) C | .12 |
Net realized and unrealized gain (loss) | 1.76 |
Total from investment operations | 1.88 |
Distributions from net investment income | (.01) |
Redemption fees added to paid in capital C | .02 |
Net asset value, end of period | $ 11.89 |
Total Return A, B | 19.00% |
Ratios to Average Net Assets D, G | |
Expenses before reductions | 3.49% |
Expenses net of fee waivers, if any | 1.70% |
Expenses net of all reductions | 1.64% |
Net investment income (loss) | 1.16% |
Supplemental Data | |
Net assets, end of period (000 omitted) | $ 1,671 |
Portfolio turnover rate E | 83% |
A Total returns would have been lower if certain expenses had not been reduced during the applicable periods shown.
B Total returns do not include the effect of the sales charges.
C Calculated based on average shares outstanding during the period.
D Fees and expenses of any underlying Fidelity Central Funds are not included in the Fund's expense ratio. The Fund indirectly bears its proportionate share of the expenses of any underlying Fidelity Central Funds.
E Amount does not include the portfolio activity of any underlying Fidelity Central Funds.
F For the period November 1, 2011 (commencement of operations) to October 31, 2012.
G Expense ratios reflect operating expenses of the class. Expenses before reductions do not reflect amounts reimbursed by the investment adviser or reductions from brokerage service arrangements or reductions from other expense offset arrangements and do not represent the amount paid by the class during periods when reimbursements or reductions occur. Expense ratios before reductions for start-up periods may not be representative of longer-term operating periods. Expenses net of fee waivers reflect expenses after reimbursement by the investment adviser but prior to reductions from brokerage service arrangements or other expense offset arrangements. Expenses net of all reductions represent the net expenses paid by the class.
See accompanying notes which are an integral part of the financial statements.
Annual Report
Financial Highlights - Class T
Period ended October 31, | 2012 F |
Selected Per-Share Data | |
Net asset value, beginning of period | $ 10.00 |
Income from Investment Operations | |
Net investment income (loss) C | .10 |
Net realized and unrealized gain (loss) | 1.75 |
Total from investment operations | 1.85 |
Distributions from net investment income | - H |
Redemption fees added to paid in capital C | .02 |
Net asset value, end of period | $ 11.87 |
Total Return A, B | 18.75% |
Ratios to Average Net Assets D, G | |
Expenses before reductions | 3.77% |
Expenses net of fee waivers, if any | 1.95% |
Expenses net of all reductions | 1.89% |
Net investment income (loss) | .91% |
Supplemental Data | |
Net assets, end of period (000 omitted) | $ 1,700 |
Portfolio turnover rate E | 83% |
A Total returns would have been lower if certain expenses had not been reduced during the applicable periods shown.
B Total returns do not include the effect of the sales charges.
C Calculated based on average shares outstanding during the period.
D Fees and expenses of any underlying Fidelity Central Funds are not included in the Fund's expense ratio. The Fund indirectly bears its proportionate share of the expenses of any underlying Fidelity Central Funds.
E Amount does not include the portfolio activity of any underlying Fidelity Central Funds.
F For the period November 1, 2011 (commencement of operations) to October 31, 2012.
G Expense ratios reflect operating expenses of the class. Expenses before reductions do not reflect amounts reimbursed by the investment adviser or reductions from brokerage service arrangements or reductions from other expense offset arrangements and do not represent the amount paid by the class during periods when reimbursements or reductions occur. Expense ratios before reductions for start-up periods may not be representative of longer-term operating periods. Expenses net of fee waivers reflect expenses after reimbursement by the investment adviser but prior to reductions from brokerage service arrangements or other expense offset arrangements. Expenses net of all reductions represent the net expenses paid by the class.
H Amount represents less than $.01 per share.
See accompanying notes which are an integral part of the financial statements.
Annual Report
Financial Highlights - Class C
Period ended October 31, | 2012 F |
Selected Per-Share Data | |
Net asset value, beginning of period | $ 10.00 |
Income from Investment Operations | |
Net investment income (loss) C | .04 |
Net realized and unrealized gain (loss) | 1.76 |
Total from investment operations | 1.80 |
Redemption fees added to paid in capital C | .02 |
Net asset value, end of period | $ 11.82 |
Total Return A, B | 18.20% |
Ratios to Average Net Assets D, G | |
Expenses before reductions | 4.32% |
Expenses net of fee waivers, if any | 2.45% |
Expenses net of all reductions | 2.39% |
Net investment income (loss) | .41% |
Supplemental Data | |
Net assets, end of period (000 omitted) | $ 1,474 |
Portfolio turnover rate E | 83% |
A Total returns would have been lower if certain expenses had not been reduced during the applicable periods shown.
B Total returns do not include the effect of the contingent deferred sales charge.
C Calculated based on average shares outstanding during the period.
D Fees and expenses of any underlying Fidelity Central Funds are not included in the Fund's expense ratio. The Fund indirectly bears its proportionate share of the expenses of any underlying Fidelity Central Funds.
E Amount does not include the portfolio activity of any underlying Fidelity Central Funds.
F For the period November 1, 2011 (commencement of operations) to October 31, 2012.
G Expense ratios reflect operating expenses of the class. Expenses before reductions do not reflect amounts reimbursed by the investment adviser or reductions from brokerage service arrangements or reductions from other expense offset arrangements and do not represent the amount paid by the class during periods when reimbursements or reductions occur. Expense ratios before reductions for start-up periods may not be representative of longer-term operating periods. Expenses net of fee waivers reflect expenses after reimbursement by the investment adviser but prior to reductions from brokerage service arrangements or other expense offset arrangements. Expenses net of all reductions represent the net expenses paid by the class.
See accompanying notes which are an integral part of the financial statements.
Annual Report
Financial Highlights - Emerging Markets Discovery
Period ended October 31, | 2012 E |
Selected Per-Share Data | |
Net asset value, beginning of period | $ 10.00 |
Income from Investment Operations | |
Net investment income (loss) B | .15 |
Net realized and unrealized gain (loss) | 1.76 |
Total from investment operations | 1.91 |
Distributions from net investment income | (.01) |
Redemption fees added to paid in capital B | .02 |
Net asset value, end of period | $ 11.92 |
Total Return A | 19.35% |
Ratios to Average Net Assets C, F | |
Expenses before reductions | 3.02% |
Expenses net of fee waivers, if any | 1.45% |
Expenses net of all reductions | 1.39% |
Net investment income (loss) | 1.41% |
Supplemental Data | |
Net assets, end of period (000 omitted) | $ 39,135 |
Portfolio turnover rate D | 83% |
A Total returns would have been lower if certain expenses had not been reduced during the applicable periods shown.
B Calculated based on average shares outstanding during the period.
C Fees and expenses of any underlying Fidelity Central Funds are not included in the Fund's expense ratio. The Fund indirectly bears its proportionate share of the expenses of any underlying Fidelity Central Funds.
D Amount does not include the portfolio activity of any underlying Fidelity Central Funds.
E For the period November 1, 2011 (commencement of operations) to October 31, 2012.
F Expense ratios reflect operating expenses of the class. Expenses before reductions do not reflect amounts reimbursed by the investment adviser or reductions from brokerage service arrangements or reductions from other expense offset arrangements and do not represent the amount paid by the class during periods when reimbursements or reductions occur. Expense ratios before reductions for start-up periods may not be representative of longer-term operating periods. Expenses net of fee waivers reflect expenses after reimbursement by the investment adviser but prior to reductions from brokerage service arrangements or other expense offset arrangements. Expenses net of all reductions represent the net expenses paid by the class.
See accompanying notes which are an integral part of the financial statements.
Annual Report
Financial Highlights - Institutional Class
Period ended October 31, | 2012 E |
Selected Per-Share Data | |
Net asset value, beginning of period | $ 10.00 |
Income from Investment Operations | |
Net investment income (loss) B | .15 |
Net realized and unrealized gain (loss) | 1.76 |
Total from investment operations | 1.91 |
Distributions from net investment income | (.01) |
Redemption fees added to paid in capital B | .02 |
Net asset value, end of period | $ 11.92 |
Total Return A | 19.35% |
Ratios to Average Net Assets C, F | |
Expenses before reductions | 3.21% |
Expenses net of fee waivers, if any | 1.45% |
Expenses net of all reductions | 1.39% |
Net investment income (loss) | 1.41% |
Supplemental Data | |
Net assets, end of period (000 omitted) | $ 1,825 |
Portfolio turnover rate D | 83% |
A Total returns would have been lower if certain expenses had not been reduced during the applicable periods shown.
B Calculated based on average shares outstanding during the period.
C Fees and expenses of any underlying Fidelity Central Funds are not included in the Fund's expense ratio. The Fund indirectly bears its proportionate share of the expenses of any underlying Fidelity Central Funds.
D Amount does not include the portfolio activity of any underlying Fidelity Central Funds.
E For the period November 1, 2011 (commencement of operations) to October 31, 2012.
F Expense ratios reflect operating expenses of the class. Expenses before reductions do not reflect amounts reimbursed by the investment adviser or reductions from brokerage service arrangements or reductions from other expense offset arrangements and do not represent the amount paid by the class during periods when reimbursements or reductions occur. Expense ratios before reductions for start-up periods may not be representative of longer-term operating periods. Expenses net of fee waivers reflect expenses after reimbursement by the investment adviser but prior to reductions from brokerage service arrangements or other expense offset arrangements. Expenses net of all reductions represent the net expenses paid by the class.
See accompanying notes which are an integral part of the financial statements.
Annual Report
Fidelity Emerging Markets Discovery Fund
Notes to Financial Statements
For the period ended October 31, 2012
1. Organization.
Fidelity Emerging Markets Discovery Fund (the Fund) is a non-diversified fund of Fidelity Investment Trust (the Trust) and is authorized to issue an unlimited number of shares. The Trust is registered under the Investment Company Act of 1940, as amended (the 1940 Act), as an open-end management investment company organized as a Massachusetts business trust. The Fund offers Class A, Class T, Class C, Emerging Markets Discovery and Institutional Class shares, each of which has equal rights as to assets and voting privileges. Each class has exclusive voting rights with respect to matters that affect that class. Investment income, realized and unrealized capital gains and losses, the common expenses of the Fund, and certain fund-level expense reductions, if any, are allocated on a pro-rata basis to each class based on the relative net assets of each class to the total net assets of the Fund. Each class differs with respect to transfer agent and distribution and service plan fees incurred. Certain expense reductions may also differ by class. The Fund's investments in emerging markets can be subject to social, economic, regulatory, and political uncertainties and can be extremely volatile.
2. Investments in Fidelity Central Funds.
The Fund invests in Fidelity Central Funds, which are open-end investment companies available only to other investment companies and accounts managed by Fidelity Management & Research Company (FMR) and its affiliates. The Fund's Schedule of Investments lists each of the Fidelity Central Funds held as of period end as an investment of the Fund, but does not include the underlying holdings of each Fidelity Central Fund. As an Investing Fund, the Fund indirectly bears its proportionate share of the expenses of the underlying Fidelity Central Funds.
The Money Market Central Funds seek preservation of capital and current income and are managed by Fidelity Investments Money Management, Inc. (FIMM), an affiliate of FMR.
A complete unaudited list of holdings for each Fidelity Central Fund is available upon request or at the Securities and Exchange Commission (the SEC) web site at www.sec.gov. In addition, the financial statements of the Fidelity Central Funds, which are not covered by the Fund's Report of Independent Registered Public Accounting Firm, are available on the SEC web site or upon request.
3. Significant Accounting Policies.
The financial statements have been prepared in conformity with accounting principles generally accepted in the United States of America (GAAP), which require management to make certain estimates and assumptions at the date of the financial statements. Actual results could differ from those estimates. Subsequent events, if any, through the date that the financial statements were issued have been evaluated in the preparation of
Annual Report
Fidelity Emerging Markets Discovery Fund
Notes to Financial Statements - continued
3. Significant Accounting Policies - continued
the financial statements. The following summarizes the significant accounting policies of the Fund:
Security Valuation. Investments are valued as of 4:00 p.m. Eastern time on the last calendar day of the period. In accordance with valuation policies and procedures approved by the Board of Trustees (the Board), the Fund attempts to obtain prices from one or more third party pricing vendors or brokers to value its investments. When current market prices, quotations or rates are not readily available or reliable, securities will be fair valued in good faith by the FMR Fair Value Committee (the Committee), in accordance with procedures adopted by the Fund's Board. Factors used in determining fair value vary by security type and may include market or security specific events. The frequency with which these procedures are used cannot be predicted and they may be utilized to a significant extent. The Committee oversees the Fund's valuation policies and procedures and is responsible for approving and reporting to the Board all fair value determinations.
The Fund categorizes the inputs to valuation techniques used to value its investments into a disclosure hierarchy consisting of three levels as shown below:
Level 1 - quoted prices in active markets for identical investments
Level 2 - other significant observable inputs (including quoted prices for similar investments, interest rates, prepayment speeds, etc.)
Level 3 - unobservable inputs (including the Fund's own assumptions based on the best information available)
Valuation techniques used to value the Fund's investments by major category are as follows:
Equity securities, including restricted securities, for which market quotations are readily available, are valued at the last reported sale price or official closing price as reported by a third party pricing vendor on the primary market or exchange on which they are traded and are categorized as Level 1 in the hierarchy. In the event there were no sales during the day or closing prices are not available, securities are valued at the last quoted bid price or may be valued using the last available price and are generally categorized as Level 2 in the hierarchy. For foreign equity securities, when significant market or security specific events arise, comparisons to the valuation of American Depositary Receipts (ADRs), futures contracts, Exchange-Traded Funds (ETFs) and certain indexes as well as quoted prices for similar securities are used and are categorized as Level 2 in the hierarchy. Utilizing these techniques may result in transfers between Level 1 and Level 2.
Annual Report
3. Significant Accounting Policies - continued
Security Valuation - continued
Investments in open-end mutual funds, including the Fidelity Central Funds, are valued at their closing net asset value (NAV) each business day and are categorized as Level 1 in the hierarchy.
Changes in valuation techniques may result in transfers in or out of an assigned level within the disclosure hierarchy. The aggregate value of investments by input level, as of October 31, 2012, is included at the end of the Fund's Schedule of Investments.
Foreign Currency Translation. The Fund may use foreign currency contracts to facilitate transactions in foreign-denominated securities. Gains and losses from these transactions may arise from changes in the value of the foreign currency or if the counterparties do not perform under the contracts' terms.
Foreign-denominated assets, including investment securities, and liabilities are translated into U.S. dollars at the exchange rates at period end. Purchases and sales of investment securities, income and dividends received and expenses denominated in foreign currencies are translated into U.S. dollars at the exchange rate in effect on the transaction date.
The effects of exchange rate fluctuations on investments are included with the net realized and unrealized gain (loss) on investment securities. Other foreign currency transactions resulting in realized and unrealized gain (loss) are disclosed separately.
Investment Transactions and Income. For financial reporting purposes, the Fund's investment holdings and NAV include trades executed through the end of the last business day of the period. The NAV per share for processing shareholder transactions is calculated as of the close of business of the New York Stock Exchange (NYSE), normally 4:00 p.m. Eastern time and includes trades executed through the end of the prior business day. Gains and losses on securities sold are determined on the basis of identified cost. Dividend income is recorded on the ex-dividend date, except for certain dividends from foreign securities where the ex-dividend date may have passed, which are recorded as soon as the Fund is informed of the ex-dividend date. Non-cash dividends included in dividend income, if any, are recorded at the fair market value of the securities received. Interest income and distributions from the Fidelity Central Funds are accrued as earned. Investment income is recorded net of foreign taxes withheld where recovery of such taxes is uncertain.
Expenses. Expenses directly attributable to a fund are charged to that fund. Expenses attributable to more than one fund are allocated among the respective funds on the basis of relative net assets or other appropriate methods. Expense estimates are accrued in the period to which they relate and adjustments are made when actual amounts are known.
Annual Report
Fidelity Emerging Markets Discovery Fund
Notes to Financial Statements - continued
3. Significant Accounting Policies - continued
Income Tax Information and Distributions to Shareholders. Each year, the Fund intends to qualify as a regulated investment company under Subchapter M of the Internal Revenue Code, including distributing substantially all of its taxable income and realized gains. As a result, no provision for income taxes is required. As of October 31, 2012, the Fund did not have any unrecognized tax benefits in the financial statements; nor is the Fund aware of any tax positions for which it is reasonably possible that the total amounts of unrecognized tax benefits will significantly change in the next twelve months. The Fund files a U.S. federal tax return, in addition to state and local tax returns as required. A fund's federal income tax returns are subject to examination by the Internal Revenue Service (IRS) for a period of three fiscal years after they are filed. State and local tax returns may be subject to examination for an additional fiscal year depending on the jurisdiction. Foreign taxes are provided for based on the Fund's understanding of the tax rules and rates that exist in the foreign markets in which it invests. The Fund is subject to a tax imposed on capital gains by certain countries in which it invests. An estimated deferred tax liability for net unrealized appreciation on the applicable securities is included in Other payables and accrued expenses on the Statement of Assets & Liabilities.
Distributions are declared and recorded on the ex-dividend date. Income dividends and capital gain distributions are declared separately for each class. Income and capital gain distributions are determined in accordance with income tax regulations, which may differ from GAAP. In addition, the Fund claimed a portion of the payment made to redeeming shareholders as a distribution for income tax purposes.
Capital accounts within the financial statements are adjusted for permanent book-tax differences. These adjustments have no impact on net assets or the results of operations. Temporary book-tax differences will reverse in a subsequent period.
Book-tax differences are primarily due to foreign currency transactions, certain foreign taxes, passive foreign investment companies (PFIC) and losses deferred due to wash sales.
The federal tax cost of investment securities and unrealized appreciation (depreciation) as of period end were as follows:
Gross unrealized appreciation | $ 4,167,582 |
Gross unrealized depreciation | (1,578,547) |
Net unrealized appreciation (depreciation) on securities and other investments | $ 2,589,035 |
| |
Tax Cost | $ 42,941,904 |
Annual Report
3. Significant Accounting Policies - continued
Income Tax Information and Distributions to Shareholders - continued
The tax-based components of distributable earnings as of period end were as follows:
Undistributed ordinary income | $ 1,158,827 |
Net unrealized appreciation (depreciation) | $ 2,588,855 |
The tax character of distributions paid was as follows:
| October 31, 2012 |
Ordinary Income | $ 7,760 |
Short-Term Trading (Redemption) Fees. Shares purchased by investors and held in the Fund less than 90 days are subject to a redemption fee equal to 2.00% of the net asset value of shares redeemed. All redemption fees, which reduce the proceeds of the shareholder redemption, are retained by the Fund and accounted for as an addition to paid in capital.
Restricted Securities. The Fund may invest in securities that are subject to legal or contractual restrictions on resale. These securities generally may be resold in transactions exempt from registration or to the public if the securities are registered. Disposal of these securities may involve time-consuming negotiations and expense, and prompt sale at an acceptable price may be difficult. Information regarding restricted securities is included at the end of the Fund's Schedule of Investments.
New Accounting Pronouncement. In December 2011, the Financial Accounting Standards Board issued Accounting Standard Update No. 2011-11, Disclosures about Offsetting Assets and Liabilities. The update creates new disclosure requirements requiring entities to disclose both gross and net information for derivatives and other financial instruments that are either offset in the Statement of Assets and Liabilities or subject to an enforceable master netting arrangement or similar agreement. The disclosure requirements are effective for annual reporting periods beginning on or after January 1, 2013, and interim periods within those annual periods. Management is currently evaluating the impact of the update's adoption on the Fund's financial statement disclosures.
4. Purchases and Sales of Investments.
Purchases and sales of securities, other than short-term securities, aggregated $57,435,457 and $16,372,315, respectively.
Annual Report
Fidelity Emerging Markets Discovery Fund
Notes to Financial Statements - continued
5. Fees and Other Transactions with Affiliates.
Management Fee. FMR and its affiliates provide the Fund with investment management related services for which the Fund pays a monthly management fee. The management fee is the sum of an individual fund fee rate that is based on an annual rate of .60% of the Fund's average net assets and an annualized group fee rate that averaged .26% during the period. The group fee rate is based upon the average net assets of all the mutual funds advised by FMR. The group fee rate decreases as assets under management increase and increases as assets under management decrease. For the period, the total annual management fee rate was .86% of the Fund's average net assets.
Distribution and Service Plan Fees. In accordance with Rule 12b-1 of the 1940 Act, the Fund has adopted separate Distribution and Service Plans for each class of shares. Certain classes pay Fidelity Distributors Corporation (FDC), an affiliate of FMR, separate Distribution and Service Fees, each of which is based on an annual percentage of each class' average net assets. In addition, FDC may pay financial intermediaries for selling shares of the Fund and providing shareholder support services. For the period, the Distribution and Service Fee rates, total fees and amounts retained by FDC were as follows:
| Distribution
Fee | Service
Fee | Total Fees | Retained
by FDC |
Class A | -% | .25% | $ 2,608 | $ 1,238 |
Class T | .25% | .25% | 4,572 | 2,445 |
Class C | .75% | .25% | 8,384 | 6,451 |
| | | $ 15,564 | $ 10,134 |
Sales Load. FDC may receive a front-end sales charge of up to 5.75% for selling Class A shares and 3.50% for selling Class T shares, some of which is paid to financial intermediaries for selling shares of the Fund. Depending on the holding period, FDC may receive contingent deferred sales charges levied on Class A, Class T and Class C redemptions. The deferred sales charges range from 1.00% for Class C shares, 1.00% for certain purchases of Class A shares and .25% for certain purchases of Class T shares.
For the period, sales charge amounts retained by FDC were as follows:
| Retained
by FDC |
Class A | $ 3,681 |
Class T | 810 |
Class C* | 15 |
| $ 4,506 |
* When Class C shares are initially sold, FDC pays commissions from its own resources to financial intermediaries through which the sales are made.
Annual Report
5. Fees and Other Transactions with Affiliates - continued
Transfer Agent Fees. Fidelity Investments Institutional Operations Company, Inc. (FIIOC), an affiliate of FMR, is the transfer, dividend disbursing and shareholder servicing agent for each class of the Fund. FIIOC receives account fees and asset-based fees that vary according to the account size and type of account of the shareholders of the respective classes of the Fund. FIIOC pays for typesetting, printing and mailing of shareholder reports, except proxy statements. For the period, transfer agent fees for each class were as follows:
| Amount | % of
Average
Net Assets |
Class A | $ 2,662 | .25 |
Class T | 2,086 | .23 |
Class C | 1,784 | .21 |
Emerging Markets Discovery | 39,429 | .23 |
Institutional Class | 2,033 | .22 |
| $ 47,994 | |
Accounting Fees. Fidelity Service Company, Inc. (FSC), an affiliate of FMR, maintains the Fund's accounting records. The accounting fee is based on the level of average net assets for each month.
Brokerage Commissions. The Fund placed a portion of its portfolio transactions with brokerage firms which are affiliates of the investment adviser. The commissions paid to these affiliated firms were $61 for the period.
6. Committed Line of Credit.
The Fund participates with other funds managed by FMR or an affiliate in a $4.25 billion credit facility (the "line of credit") to be utilized for temporary or emergency purposes to fund shareholder redemptions or for other short-term liquidity purposes. The Fund has agreed to pay commitment fees on its pro-rata portion of the line of credit, which amounted to $35 and is reflected in Miscellaneous expenses on the Statement of Operations. During the period, there were no borrowings on this line of credit.
7. Expense Reductions.
Effective November 1, 2011, FMR contractually agreed to reimburse each class to the extent annual operating expenses exceeded certain levels of average net assets as noted in the table below. This reimbursement will remain in place through December 31, 2013.
Annual Report
Fidelity Emerging Markets Discovery Fund
Notes to Financial Statements - continued
7. Expense Reductions - continued
Some expenses, for example interest expense, including commitment fees, are excluded from this reimbursement.
The following classes were in reimbursement during the period:
| Expense
Limitations | Reimbursement
from adviser |
Class A | 1.70% | $ 18,756 |
Class T | 1.95% | 16,693 |
Class C | 2.45% | 15,675 |
Emerging Markets Discovery | 1.45% | 264,852 |
Institutional Class | 1.45% | 16,159 |
| | $ 332,135 |
Many of the brokers with whom FMR places trades on behalf of the Fund provided services to the Fund in addition to trade execution. These services included payments of certain expenses on behalf of the Fund totaling $12,335 for the period. In addition, through arrangements with the Fund's custodian, credits realized as a result of uninvested cash balances were used to reduce the Fund's expenses. During the period, these credits reduced the Fund's custody expenses by $3.
8. Distributions to Shareholders.
Distributions to shareholders of each class were as follows:
| Period ended
October 31, 2012 A |
From net investment income | |
Class A | $ 435 |
Class T | 203 |
Emerging Markets Discovery | 6,522 |
Institutional Class | 600 |
Total | $ 7,760 |
A For the period November 1, 2011 (commencement of operations) to October 31, 2012.
Annual Report
9. Share Transactions.
Transactions for each class of shares were as follows:
| Shares | Dollars |
| Period ended
October 31,
2012 A | Period ended
October 31,
2012 A |
Class A | | |
Shares sold | 197,037 | $ 2,112,904 |
Reinvestment of distributions | 46 | 435 |
Shares redeemed | (56,598) | (637,589) |
Net increase (decrease) | 140,485 | $ 1,475,750 |
Class T | | |
Shares sold | 182,780 | $ 1,990,143 |
Reinvestment of distributions | 22 | 203 |
Shares redeemed | (39,546) | (451,707) |
Net increase (decrease) | 143,256 | $ 1,538,639 |
Class C | | |
Shares sold | 161,266 | $ 1,743,293 |
Shares redeemed | (36,511) | (415,821) |
Net increase (decrease) | 124,755 | $ 1,327,472 |
Emerging Markets Discovery | | |
Shares sold | 4,074,333 | $ 44,757,138 |
Reinvestment of distributions | 681 | 6,419 |
Shares redeemed | (791,760) | (8,744,517) |
Net increase (decrease) | 3,283,254 | $ 36,019,040 |
Institutional Class | | |
Shares sold | 199,001 | $ 2,149,513 |
Reinvestment of distributions | 64 | 600 |
Shares redeemed | (45,956) | (524,544) |
Net increase (decrease) | 153,109 | $ 1,625,569 |
A For the period November 1, 2011 (commencement of operations) to October 31, 2012.
10. Other.
The Fund's organizational documents provide former and current trustees and officers with a limited indemnification against liabilities arising in connection with the performance of their duties to the Fund. In the normal course of business, the Fund may also enter into contracts that provide general indemnifications. The Fund's maximum exposure under these arrangements is unknown as this would be dependent on future claims that may be made against the Fund. The risk of material loss from such claims is considered remote.
At the end of the period, FMR or its affiliates were the owners of record of 10% of the total outstanding shares of the Fund.
Annual Report
To the Trustees of Fidelity Investment Trust and the Shareholders of Fidelity Emerging Markets Discovery Fund:
In our opinion, the accompanying statement of assets and liabilities, including the schedule of investments, and the related statements of operations and of changes in net assets and the financial highlights present fairly, in all material respects, the financial position of Fidelity Emerging Markets Discovery Fund (a fund of Fidelity Investment Trust) at October 31, 2012, the results of its operations for the year then ended, the changes in its net assets for the period indicated and the financial highlights for each of the period indicated, in conformity with accounting principles generally accepted in the United States of America. These financial statements and financial highlights (hereafter referred to as "financial statements") are the responsibility of the Fidelity Emerging Markets Discovery Fund's management. Our responsibility is to express an opinion on these financial statements based on our audits. We conducted our audits of these financial statements in accordance with the standards of the Public Company Accounting Oversight Board (United States). Those standards require that we plan and perform the audit to obtain reasonable assurance about whether the financial statements are free of material misstatement. An audit includes examining, on a test basis, evidence supporting the amounts and disclosures in the financial statements, assessing the accounting principles used and significant estimates made by management, and evaluating the overall financial statement presentation. We believe that our audits, which included confirmation of securities at October 31, 2012 by correspondence with the custodian and brokers, provide a reasonable basis for our opinion.
PricewaterhouseCoopers LLP
Boston, Massachusetts
December 17, 2012
Annual Report
The Trustees, Members of the Advisory Board, and executive officers of the trust and fund, as applicable, are listed below. The Board of Trustees governs the fund and is responsible for protecting the interests of shareholders. The Trustees are experienced executives who meet periodically throughout the year to oversee the fund's activities, review contractual arrangements with companies that provide services to the fund, oversee management of the risks associated with such activities and contractual arrangements, and review the fund's performance. Except for James C. Curvey, each of the Trustees oversees 236 funds advised by FMR or an affiliate. Mr. Curvey oversees 443 funds advised by FMR or an affiliate.
The Trustees hold office without limit in time except that (a) any Trustee may resign; (b) any Trustee may be removed by written instrument, signed by at least two-thirds of the number of Trustees prior to such removal; (c) any Trustee who requests to be retired or who has become incapacitated by illness or injury may be retired by written instrument signed by a majority of the other Trustees; and (d) any Trustee may be removed at any special meeting of shareholders by a two-thirds vote of the outstanding voting securities of the trust. Each Trustee who is not an interested person (as defined in the 1940 Act) (Independent Trustee), shall retire not later than the last day of the calendar year in which his or her 75th birthday occurs. The Independent Trustees may waive this mandatory retirement age policy with respect to individual Trustees. The executive officers and Advisory Board Members hold office without limit in time, except that any officer and Advisory Board Member may resign or may be removed by a vote of a majority of the Trustees at any regular meeting or any special meeting of the Trustees. Except as indicated, each individual has held the office shown or other offices in the same company for the past five years.
Experience, Skills, Attributes, and Qualifications of the Fund's Trustees. The Governance and Nominating Committee has adopted a statement of policy that describes the experience, qualifications, attributes, and skills that are necessary and desirable for potential Independent Trustee candidates (Statement of Policy). The Board believes that each Trustee satisfied at the time he or she was initially elected or appointed a Trustee, and continues to satisfy, the standards contemplated by the Statement of Policy. The Governance and Nominating Committee also engages professional search firms to help identify potential Independent Trustee candidates who have the experience, qualifications, attributes, and skills consistent with the Statement of Policy. From time to time, additional criteria based on the composition and skills of the current Independent Trustees, as well as experience or skills that may be appropriate in light of future changes to board composition, business conditions, and regulatory or other developments, have also been considered by the professional search firms and the Governance and Nominating Committee. In addition, the Board takes into account the Trustees' commitment and participation in Board and committee meetings, as well as their leadership of standing and ad hoc committees throughout their tenure.
In determining that a particular Trustee was and continues to be qualified to serve as a Trustee, the Board has considered a variety of criteria, none of which, in isolation, was controlling. The Board believes that, collectively, the Trustees have balanced and diverse experience, qualifications, attributes, and skills, which allow the Board to operate effectively in governing the fund and protecting the interests of shareholders. Information about the specific experience, skills, attributes, and qualifications of each Trustee, which in each case led to the Board's conclusion that the Trustee should serve (or continue to serve) as a trustee of the fund, is provided below.
Annual Report
Board Structure and Oversight Function. James C. Curvey is an interested person (as defined in the 1940 Act) and currently serves as Chairman. The Trustees have determined that an interested Chairman is appropriate and benefits shareholders because an interested Chairman has a personal and professional stake in the quality and continuity of services provided to the fund. Independent Trustees exercise their informed business judgment to appoint an individual of their choosing to serve as Chairman, regardless of whether the Trustee happens to be independent or a member of management. The Independent Trustees have determined that they can act independently and effectively without having an Independent Trustee serve as Chairman and that a key structural component for assuring that they are in a position to do so is for the Independent Trustees to constitute a substantial majority for the Board. The Independent Trustees also regularly meet in executive session. Ned C. Lautenbach serves as Chairman of the Independent Trustees and as such (i) acts as a liaison between the Independent Trustees and management with respect to matters important to the Independent Trustees and (ii) with management prepares agendas for Board meetings.
Fidelity funds are overseen by different Boards of Trustees. The fund's Board oversees Fidelity's equity and high income funds and another Board oversees Fidelity's investment-grade bond, money market, and asset allocation funds. The asset allocation funds may invest in Fidelity funds overseen by the fund's Board. The use of separate Boards, each with its own committee structure, allows the Trustees of each group of Fidelity funds to focus on the unique issues of the funds they oversee, including common research, investment, and operational issues. On occasion, the separate Boards establish joint committees to address issues of overlapping consequences for the Fidelity funds overseen by each Board.
The Trustees operate using a system of committees to facilitate the timely and efficient consideration of all matters of importance to the Trustees, the fund, and fund shareholders and to facilitate compliance with legal and regulatory requirements and oversight of the fund's activities and associated risks. The Board, acting through its committees, has charged FMR and its affiliates with (i) identifying events or circumstances the occurrence of which could have demonstrably adverse effects on the fund's business and/or reputation; (ii) implementing processes and controls to lessen the possibility that such events or circumstances occur or to mitigate the effects of such events or circumstances if they do occur; and (iii) creating and maintaining a system designed to evaluate continuously business and market conditions in order to facilitate the identification and implementation processes described in (i) and (ii) above. Because the day-to-day operations and activities of the fund are carried out by or through FMR, its affiliates and other service providers, the fund's exposure to risks is mitigated but not eliminated by the processes overseen by the Trustees. While each of the Board's committees has responsibility for overseeing different aspects of the fund's activities, oversight is exercised primarily through the Operations, Audit, and Compliance Committees. In addition, the Independent Trustees have worked with FMR to enhance the Board's oversight of investment and financial risks, legal and regulatory risks, technology risks, and operational risks, including the development of additional risk reporting to the Board. For example, a working group comprised of Independent Trustees and FMR has worked and continues to work to review the Fidelity funds' valuation-related activities, reporting and risk management. Appropriate personnel, including but not limited to the fund's Chief Compliance Officer (CCO), FMR's internal auditor, the independent accountants, the fund's Treasurer and portfolio management personnel, make periodic reports to the Board's committees, as appropriate, including an annual review of FMR's risk management program for the Fidelity funds. The responsibilities of each standing committee, including their oversight responsibilities, are described further under "Standing Committees of the Fund's Trustees."
Annual Report
Trustees and Officers - continued
The fund's Statement of Additional Information (SAI) includes more information about the Trustees. To request a free copy, call Fidelity at 1-877-208-0098.
Interested Trustees*:
Correspondence intended for each Trustee who is an interested person may be sent to Fidelity Investments, 82 Devonshire Street, Boston, Massachusetts 02109.
Name, Age; Principal Occupations and Other Relevant Experience+ |
James C. Curvey (77) |
| Year of Election or Appointment: 2007 Mr. Curvey is Trustee and Chairman of the Board of Trustees of certain Trusts. Mr. Curvey also serves as Trustee (2007-present) of other investment companies advised by FMR. Mr. Curvey is a Director of Fidelity Investments Money Management, Inc. (2009-present), Director of Fidelity Research & Analysis Co. (2009-present) and Director of FMR and FMR Co., Inc. (2007-present). Mr. Curvey is also Vice Chairman (2007-present) and Director of FMR LLC. In addition, Mr. Curvey serves as an Overseer for the Boston Symphony Orchestra and a member of the Trustees of Villanova University. Previously, Mr. Curvey was the Vice Chairman (2006-2007) and Director (2000-2007) of FMR Corp. |
Ronald P. O'Hanley (55) |
| Year of Election or Appointment: 2011 Mr. O'Hanley is Director of FMR Co., Inc. (2010-present), Director of Fidelity Investments Money Management, Inc. (2010-present), Director of Fidelity Research & Analysis Company (2010-present), President of Fidelity Asset Management and Corporate Services and a member of Fidelity's Executive Committee (2010-present). Previously, Mr. O'Hanley served as President and Chief Executive Officer of BNY Mellon Asset Management (2007-2010). Mr. O'Hanley also served as Vice Chairman of Bank New York Mellon Corp. and a member of that firm's Executive Committee. Prior to the 2007 merger of The Bank of New York and Mellon Financial Corporation, he was Vice Chairman of Mellon Financial Corporation and President and Chief Executive Officer of Mellon Asset Management. He joined Mellon in February 1997. Mr. O'Hanley currently serves as Chairman of the Boston Public Library Foundation Board of Directors and sits on the Board of Directors of Beth Israel Deaconess Medical Center, the Board of Trustees of the Marine Biological Laboratory and the Advisory Board of the Maxwell School of Citizenship and Public Administration at Syracuse University. Mr. O'Hanley also chairs the Council on Asset Management for the Financial Services Roundtable and is a member of the Board of Directors of Institutional Investor's U.S. Institute. |
* Trustees have been determined to be "Interested Trustees" by virtue of, among other things, their affiliation with the trust or various entities under common control with FMR.
+ The information above includes each Trustee's principal occupation during the last five years and other information relating to the experience, attributes, and skills relevant to each Trustee's qualifications to serve as a Trustee, which led to the conclusion that each Trustee should serve as a Trustee for the fund.
Annual Report
Trustees and Officers - continued
Independent Trustees:
Correspondence intended for each Independent Trustee (that is, the Trustees other than the Interested Trustees) may be sent to Fidelity Investments, P.O. Box 55235, Boston, Massachusetts 02205-5235.
Name, Age; Principal Occupations and Other Relevant Experience+ |
Dennis J. Dirks (64) |
| Year of Election or Appointment: 2005 Prior to his retirement in May 2003, Mr. Dirks was Chief Operating Officer and a member of the Board of The Depository Trust & Clearing Corporation (DTCC). He also served as President, Chief Operating Officer, and Board member of The Depository Trust Company (DTC) and President and Board member of the National Securities Clearing Corporation (NSCC). In addition, Mr. Dirks served as Chief Executive Officer and Board member of the Government Securities Clearing Corporation, Chief Executive Officer and Board member of the Mortgage-Backed Securities Clearing Corporation, as a Trustee and a member of the Finance Committee of Manhattan College (2005-2008), and as a Trustee and a member of the Finance Committee of AHRC of Nassau County (2006-2008). Mr. Dirks is a member of the Independent Directors Council (IDC) Governing Council (2010-present) and Board of Directors for The Brookville Center for Children's Services, Inc. (2009-present). |
Alan J. Lacy (59) |
| Year of Election or Appointment: 2008 Mr. Lacy serves as Senior Adviser (2007-present) of Oak Hill Capital Partners, L.P. (private equity). Mr. Lacy also served as Chief Executive Officer (2000-2005) and Vice Chairman (2005-2006) of Sears Holdings Corporation and Sears, Roebuck and Co. (retail). In addition, Mr. Lacy serves as a member of the Board of Directors of Dave & Buster's Entertainment, Inc. (restaurant and entertainment complexes, 2010-present), Earth Fare, Inc. (retail grocery, 2012-present), The Hillman Companies, Inc. (hardware wholesalers, 2010-present), and Bristol-Myers Squibb Company (global pharmaceuticals, 2008-present). Mr. Lacy is a member of the Board of Trustees of The National Parks Conservation Association (2006-present). Previously, Mr. Lacy served as Chairman of the Board of Trustees of the National Parks Conservation Association (2008-2011) and as a member of the Board of Directors for the Western Union Company (global money transfer, 2006-2011). |
Ned C. Lautenbach (68) |
| Year of Election or Appointment: 2000 Mr. Lautenbach is Chairman of the Independent Trustees of the Equity and High Income Funds (2006-present). Mr. Lautenbach currently serves as the Lead Director of the Eaton Corporation Board of Directors (diversified industrial, 1997-present). Mr. Lautenbach is Chairman of the Board of Directors of the Philharmonic Center for the Arts in Naples, Florida (2012-present) and a member of the Council on Foreign Relations (1994-present). Previously, Mr. Lautenbach was a Partner/Advisory Partner at Clayton, Dubilier & Rice, LLC (private equity investment, 1998-2010), as well as a Director of Sony Corporation (2006-2007). |
Joseph Mauriello (68) |
| Year of Election or Appointment: 2008 Prior to his retirement in January 2006, Mr. Mauriello served in numerous senior management positions including Deputy Chairman and Chief Operating Officer (2004-2005), and Vice Chairman of Financial Services (2002-2004) of KPMG LLP US (professional services, 1965-2005). Mr. Mauriello currently serves as a member of the Board of Directors of XL Group plc. (global insurance and re-insurance, 2006-present). Previously, Mr. Mauriello served as a Director of the Hamilton Funds of the Bank of New York (2006-2007) and of Arcadia Resources Inc. (health care services and products, 2007-2012). |
Robert W. Selander (62) |
| Year of Election or Appointment: 2011 Previously, Mr. Selander served as a Member of the Advisory Board of Fidelity's Equity and High Income Funds (2011), Executive Vice Chairman (2010), Chief Executive Officer (2009-2010), and President and Chief Executive Officer (1997-2009) of Mastercard, Inc. |
Cornelia M. Small (68) |
| Year of Election or Appointment: 2005 Ms. Small is a member of the Board of Directors (2009-present) and Chair of the Investment Committee (2010-present) of the Teagle Foundation. Ms. Small also serves on the Investment Committee of the Berkshire Taconic Community Foundation (2008-present). Previously, Ms. Small served as Chairperson (2002-2008) and a member of the Investment Committee and Chairperson (2008-2012) and a member of the Board of Trustees of Smith College. In addition, Ms. Small served as Chief Investment Officer, Director of Global Equity Investments, and a member of the Board of Directors of Scudder, Stevens & Clark and Scudder Kemper Investments. |
William S. Stavropoulos (73) |
| Year of Election or Appointment: 2001 Mr. Stavropoulos is Vice Chairman of the Independent Trustees of the Equity and High Income Funds (2006-present). Mr. Stavropoulos serves as President and Founder of the Michigan Baseball Foundation, the Great Lakes Loons (2007-present). Mr. Stavropoulos is Chairman Emeritus of the Board of Directors of The Dow Chemical Company, where he previously served in numerous senior management positions, including President, CEO (1995-2000; 2002-2004), Chairman of the Executive Committee (2000-2006), and as a member of the Board of Directors (1990-2006). Currently, Mr. Stavropoulos is a Director of Univar Inc. (global distributor of commodity and specialty chemicals, Chairman from 2010-May 2012 and Lead Director from May 2012-present), Teradata Corporation (data warehousing and technology solutions, 2008-present), Maersk Inc. (industrial conglomerate), and Tyco International, Ltd. (multinational manufacturing and services, 2007-present), and a member of the Advisory Board for Metalmark Capital LLC (private equity investment, 2005-present). Mr. Stavropoulos is an operating advisor to Clayton, Dubilier & Rice, LLC (private equity investment). In addition, Mr. Stavropoulos is a member of the University of Notre Dame Advisory Council for the College of Science, a Trustee of the Rollin L. Gerstacker Foundation, and a Director of the Naples Philharmonic Center for the Arts. Previously, Mr. Stavropoulos served as a Director of Chemical Financial Corporation (bank holding company, 1993-2012). |
David M. Thomas (63) |
| Year of Election or Appointment: 2008 Previously, Mr. Thomas served as Executive Chairman (2005-2006) and Chairman and Chief Executive Officer (2000-2005) of IMS Health, Inc. (pharmaceutical and healthcare information solutions), and a Director of Fortune Brands, Inc. (consumer products, 2000-2011). In addition, Mr. Thomas serves as Non-Executive Chairman of the Board of Directors of Fortune Brands Home and Security (home and security products, 2011-present), and as a member of the Board of Directors of Interpublic Group of Companies, Inc. (marketing communication, 2004-present). |
Michael E. Wiley (62) |
| Year of Election or Appointment: 2008 Mr. Wiley also serves as a Director of Asia Pacific Exploration Consolidated (international oil and gas exploration and production, 2008-present). Mr. Wiley serves as a Director of Tesoro Corporation (independent oil refiner and marketer, 2005-present), and a Director of Bill Barrett Corporation (exploration and production, 2005-present). In addition, Mr. Wiley also serves as a Director of Post Oak Bank (privately-held bank, 2004-present). Previously, Mr. Wiley served as a member of the Board of Trustees of the University of Tulsa (2000-2006; 2007-2010), as a Senior Energy Advisor of Katzenbach Partners, LLC (consulting, 2006-2007), as an Advisory Director of Riverstone Holdings (private investment), Chairman, President, and CEO of Baker Hughes, Inc. (oilfield services, 2000-2004), and as Director of Spinnaker Exploration Company (exploration and production, 2001-2005). |
+ The information above includes each Trustee's principal occupation during the last five years and other information relating to the experience, attributes, and skills relevant to each Trustee's qualifications to serve as a Trustee, which led to the conclusion that each Trustee should serve as a Trustee for the fund.
Advisory Board Members and Executive Officers:
Correspondence intended for David A. Rosow and Garnett A. Smith may be sent to Fidelity Investments, P.O. Box 55235, Boston, Massachusetts 02205-5235. Correspondence intended for each executive officer, Edward C. Johnson 3d and Peter S. Lynch may be sent to Fidelity Investments, 82 Devonshire Street, Boston, Massachusetts 02109.
Name, Age; Principal Occupation |
Edward C. Johnson 3d (82) |
| Year of Election or Appointment: 2011 Member of the Advisory Board of Fidelity's Equity and High Income Funds. Mr. Johnson serves as Chief Executive Officer, Chairman, and a Director of FMR LLC, and also serves as Chairman and Director of FIL Limited. Previously, Mr. Johnson served as a Trustee and Chairman of the Board of certain Fidelity Trusts, Chairman and a Director of FMR, Chairman and a Director of FMR Co., Inc., and President of FMR LLC (2006-2007). |
Peter S. Lynch (68) |
| Year of Election or Appointment: 2003 Member of the Advisory Board of Fidelity's Equity and High Income Funds. Mr. Lynch is Vice Chairman and a Director of FMR and FMR Co., Inc. In addition, Mr. Lynch serves as a Trustee of Boston College and as the Chairman of the Inner-City Scholarship Fund. Previously, Mr. Lynch served on the Special Olympics International Board of Directors (1997-2006). |
David A. Rosow (70) |
| Year of Election or Appointment: 2012 Member of the Advisory Board of Fidelity's Equity and High Income Funds. Chairman and Chief Executive Officer of International Golf Group, Inc. (golf course development, 1989-present). Previously, Mr. Rosow served as Chairman and Chief Executive Officer of Rosow & Company, Inc. (private investment company, 1989-2011), a Lead Director of Hudson United Bancorp (2001-2006) and as a Director of TD Banknorth (1996-2006). In addition, Mr. Rosow is a member (2008-present) and President (2009-present) of the Town Council of Palm Beach, Florida. |
Garnett A. Smith (65) |
| Year of Election or Appointment: 2012 Member of the Advisory Board of Fidelity's Equity and High Income Funds. Prior to Mr. Smith's retirement, he served as Chairman and Chief Executive Officer of Inbrand Corp. (manufacturer of personal absorbent products, 1990-1997). He also served as President (1986-1990) of Inbrand Corp. Prior to his employment with Inbrand Corp., he was employed by a retail fabric chain and North Carolina National Bank. In addition, Mr. Smith is a board member of the Jackson Hole Land Trust (2009-present). |
Kenneth B. Robins (43) |
| Year of Election or Appointment: 2008 President and Treasurer of Fidelity's Equity and High Income Funds. Mr. Robins also serves as President and Treasurer (2010-present) and Assistant Treasurer (2009-present) of other Fidelity funds and is an employee of Fidelity Investments (2004-present). Previously, Mr. Robins served as Deputy Treasurer of the Fidelity funds (2005-2008) and Treasurer and Chief Financial Officer of The North Carolina Capital Management Trust: Cash and Term Portfolios (2006-2008). |
Bruce T. Herring (47) |
| Year of Election or Appointment: 2006 Vice President of certain Equity Funds. Mr. Herring also serves as President of Fidelity Research & Analysis Company (2010-present), Chief Investment Officer and Director of Fidelity Management & Research (U.K.) Inc. (2010-present) and Group Chief Investment Officer of FMR. Previously, Mr. Herring served as Vice President (2005-2006) and Senior Vice President (2006-2007) of Fidelity Management & Research Company, Vice President of FMR Co., Inc. (2001-2007) and as a portfolio manager for Fidelity U.S. Equity Funds. |
Brian B. Hogan (48) |
| Year of Election or Appointment: 2009 Vice President of Equity and High Income Funds. Mr. Hogan also serves as President of FMR's Equity Division (2009-present). Previously, Mr. Hogan served as Senior Vice President, Equity Research of FMR (2006-2009) and as a portfolio manager. |
Scott C. Goebel (44) |
| Year of Election or Appointment: 2008 Secretary and Chief Legal Officer (CLO) of the Fidelity funds. Mr. Goebel also serves as Secretary of Fidelity Investments Money Management, Inc. (FIMM) (2010-present) and Fidelity Research and Analysis Company (FRAC) (2010-present); Secretary and CLO of The North Carolina Capital Management Trust: Cash and Term Portfolios (2008-present); General Counsel, Secretary, and Senior Vice President of FMR (2008-present) and FMR Co., Inc. (2008-present); employed by FMR LLC or an affiliate (2001-present); Chief Legal Officer of Fidelity Management & Research (Hong Kong) Limited (2008-present) and Assistant Secretary of Fidelity Management & Research (Japan) Inc. (2008-present), and Fidelity Management & Research (U.K.) Inc. (2008-present). Previously, Mr. Goebel served as Assistant Secretary of FIMM (2008-2010), FRAC (2008-2010), and the Funds (2007-2008) and as Vice President and Secretary of Fidelity Distributors Corporation (FDC) (2005-2007). |
William C. Coffey (43) |
| Year of Election or Appointment: 2009 Assistant Secretary of Fidelity's Equity and High Income Funds. Mr. Coffey also serves as Senior Vice President and Deputy General Counsel of FMR LLC (2010-present), and is an employee of Fidelity Investments. Previously, Mr. Coffey served as Vice President and Associate General Counsel of FMR LLC (2005-2009). |
Elizabeth Paige Baumann (44) |
| Year of Election or Appointment: 2012 Anti-Money Laundering (AML) Officer of the Fidelity funds. Ms. Baumann also serves as AML Officer of The North Carolina Capital Management Trust: Cash and Term Portfolios (2012-present), Chief AML Officer of FMR LLC (2012-present), and is an employee of Fidelity Investments. Previously, Ms. Baumann served as Vice President and Deputy Anti-Money Laundering Officer (2007-2012). |
Christine Reynolds (54) |
| Year of Election or Appointment: 2008 Chief Financial Officer of the Fidelity funds. Ms. Reynolds became President of Fidelity Pricing and Cash Management Services (FPCMS) in August 2008. Ms. Reynolds served as Chief Operating Officer of FPCMS (2007-2008). Previously, Ms. Reynolds served as President, Treasurer, and Anti-Money Laundering officer of the Fidelity funds (2004-2007). |
Joseph A. Hanlon (44) |
| Year of Election or Appointment: 2012 Chief Compliance Officer of Fidelity's Equity and High Income Funds. Mr. Hanlon serves as Compliance Officer of FMR, FMR Co., Inc., Fidelity Investments Money Management, Inc. (FIMM), Fidelity Research and Analysis Company (FRAC), Fidelity Management & Research (Japan) Inc., Fidelity Management & Research (U.K.) Inc., Fidelity Management & Research (Hong Kong), and Strategic Advisers, Inc. (2009-present), as Senior Vice President of the Fidelity Asset Management Division (2009-present), and is an employee of Fidelity Investments. |
Joseph F. Zambello (55) |
| Year of Election or Appointment: 2011 Deputy Treasurer of the Fidelity funds. Mr. Zambello is an employee of Fidelity Investments. Previously, Mr. Zambello served as Vice Presidentof FMR's Program Management Group (2009-2011) and Vice President of the Transfer Agent Oversight Group (2005-2009). |
Adrien E. Deberghes (45) |
| Year of Election or Appointment: 2008 Deputy Treasurer of Fidelity's Equity and High Income Funds. Mr. Deberghes also serves as Vice President (2011-present) and Assistant Treasurer (2010-present) of other Fidelity funds, and is an employee of Fidelity Investments (2008-present). Previously, Mr. Deberghes served as Senior Vice President of Mutual Fund Administration at State Street Corporation (2007-2008), Senior Director of Mutual Fund Administration at Investors Bank & Trust (2005-2007), and Director of Finance for Dunkin' Brands (2000-2005). |
Stephen Sadoski (41) |
| Year of Election or Appointment: 2012 Deputy Treasurer of Fidelity's Equity and High Income Funds. Mr. Sadoski also serves as Assistant Treasurer of other Fidelity funds (2012-present) and is an employee of Fidelity Investments (2012-present). Previously, Mr. Sadoski served as an assistant chief accountant in the Division of Investment Management of the Securities and Exchange Commission (SEC) (2009-2012) and as a senior manager at Deloitte & Touche (1997-2009). |
Stephanie J. Dorsey (43) |
| Year of Election or Appointment: 2010 Assistant Treasurer of Fidelity's Equity and High Income Funds. Ms. Dorsey also serves as Deputy Treasurer of other Fidelity funds (2008-present) and is an employee of Fidelity Investments (2008-present). Previously, Ms. Dorsey served as Treasurer (2004-2008) of the JPMorgan Mutual Funds and Vice President (2004-2008) of JPMorgan Chase Bank. |
John R. Hebble (54) |
| Year of Election or Appointment: 2009 Assistant Treasurer of Fidelity's Equity and High Income Funds. Mr. Hebble also serves as President (2011-present), Treasurer, and Chief Financial Officer of The North Carolina Capital Management Trust: Cash and Term Portfolios (2008-present), President and Treasurer of other Fidelity funds (2008-present) and is an employee of Fidelity Investments. |
Gary W. Ryan (54) |
| Year of Election or Appointment: 2005 Assistant Treasurer of the Fidelity funds. Mr. Ryan is an employee of Fidelity Investments. Previously, Mr. Ryan served as Vice President of Fund Reporting in Fidelity Pricing and Cash Management Services (FPCMS) (1999-2005). |
Jonathan Davis (44) |
| Year of Election or Appointment: 2010 Assistant Treasurer of the Fidelity funds. Mr. Davis is also Assistant Treasurer of Fidelity Rutland Square Trust II and Fidelity Commonwealth Trust II. Mr. Davis is an employee of Fidelity Investments. Previously, Mr. Davis served as Vice President and Associate General Counsel of FMR LLC (2003-2010). |
Annual Report
The Board of Trustees of Fidelity Advisor Emerging Markets Discovery Fund voted to pay to shareholders of record at the opening of business on record date, the following distributions per share derived from capital gains realized from sales of portfolio securities, and dividends derived from net investment income:
| Pay Date | Record Date | Dividends | Capital Gains |
Institutional Class | 12/10/12 | 12/7/12 | $0.059 | $0.203 |
Institutional Class designates 100% of the dividend distributed during the fiscal year as amounts which may be taken into account as a dividend for purposes of the maximum rate under section 1(h)(11) of the Internal Revenue Code.
The amounts per share which represent income derived from sources within, and taxes paid to, foreign countries or possessions of the United States are as follows:
| Pay Date | Income | Taxes |
Institutional Class | 12/23/11 | $0.015 | $0.0033 |
The fund will notify shareholders in January 2013 of amounts for use in preparing 2012 income tax returns.
Annual Report
Board Approval of Investment Advisory Contracts and Management Fees
Fidelity Emerging Markets Discovery Fund
Each year, the Board of Trustees, including the Independent Trustees (together, the Board), votes on the renewal of the management contract and sub-advisory agreements (together, the Advisory Contracts) for the fund. The Board, assisted by the advice of fund counsel and Independent Trustees' counsel, requests and considers a broad range of information relevant to the renewal of the Advisory Contracts throughout the year.
The Board meets regularly and, at each of its meetings, considers factors that are relevant to its annual consideration of the renewal of the fund's Advisory Contracts, including the services and support provided to the fund and its shareholders. The Board has established various standing committees, each composed of and chaired by Independent Trustees with varying backgrounds, to which the Board has assigned specific subject matter responsibilities in order to enhance effective decision-making by the Board. The Board, acting directly and through its Committees, requests and receives information concerning the annual consideration of the renewal of the fund's Advisory Contracts. The Board also meets as needed to consider matters specifically related to the Board's annual consideration of the renewal of Advisory Contracts. Members of the Board may also meet with trustees of other Fidelity funds through ad hoc joint committees to discuss certain matters relevant to the Fidelity funds.
At its July 2012 meeting, the Board of Trustees, including the Independent Trustees, unanimously determined to renew the fund's Advisory Contracts. In reaching its determination, the Board considered all factors it believed relevant, including (i) the nature, extent, and quality of the services to be provided to the fund and its shareholders (including the investment performance of the fund); (ii) the competitiveness of the fund's management fee and total expense ratio relative to peer funds; (iii) the total costs of the services to be provided by and the profits to be realized by Fidelity from its relationship with the fund; (iv) the extent to which economies of scale exist and would be realized as the fund grows; and (v) whether fee levels reflect these economies of scale, if any, for the benefit of fund shareholders.
In considering whether to renew the Advisory Contracts for the fund, the Board reached a determination, with the assistance of fund counsel and Independent Trustees' counsel and through the exercise of its business judgment, that the renewal of the Advisory Contracts is in the best interests of the fund and its shareholders and that the compensation payable under the Advisory Contracts is fair and reasonable. The Board's decision to renew the Advisory Contracts was not based on any single factor, but rather was based on a comprehensive consideration of all the information provided to the Board at its meetings throughout the year. The Board, in reaching its determination to renew the Advisory Contracts, is aware that shareholders in the fund have a broad range of investment choices available to them, including a wide choice among mutual funds offered by Fidelity's competitors, and that the fund's shareholders, who have the opportunity to review and weigh the disclosure provided by the fund in its prospectus and other public disclosures, have chosen to invest in this fund, managed by Fidelity.
Annual Report
Board Approval of Investment Advisory Contracts and
Management Fees - continued
Nature, Extent, and Quality of Services Provided. The Board considered the staffing within the investment adviser, FMR, and the sub-advisers (together, the Investment Advisers), including the backgrounds of the fund's investment personnel, and also considered the fund's investment objective, strategies, and related investment philosophy. The Independent Trustees also had discussions with senior management of Fidelity's investment operations and investment groups. The Board considered the structure of the portfolio manager compensation program and whether this structure provides appropriate incentives to act in the best interests of the fund.
Resources Dedicated to Investment Management and Support Services. The Board and the Fund Oversight and Research Committees reviewed the general qualifications and capabilities of the Investment Advisers' investment staff, including its size, education, experience, and resources, as well as the Investment Advisers' approach to recruiting, training, managing, and compensating investment personnel. The Board also noted that FMR has continued to increase the resources devoted to non-U.S. offices, including expansion of Fidelity's global investment organization. The Board noted that Fidelity's analysts have extensive resources, tools and capabilities that allow them to conduct sophisticated quantitative and fundamental analysis, as well as credit analysis of issuers, counterparties and guarantors. The Board also believes that Fidelity's investment professionals have sufficient access to global information and data so as to provide competitive investment results over time, and that those professionals also have access to sophisticated tools that permit them to assess portfolio construction and risk and performance attribution characteristics continuously, as well as to transmit new information and research conclusions rapidly around the world. Additionally, in its deliberations, the Board considered the Investment Advisers' trading and risk management capabilities and resources, which are an integral part of the investment management process.
Shareholder and Administrative Services. The Board considered (i) the nature, extent, quality, and cost of advisory, administrative, and shareholder services performed by the Investment Advisers and their affiliates under the Advisory Contracts and under separate agreements covering transfer agency, pricing and bookkeeping, and securities lending services for the fund; (ii) the nature and extent of the supervision of third party service providers, principally custodians and subcustodians; and (iii) the resources devoted to, and the record of compliance with, the fund's compliance policies and procedures. The Board also reviewed the allocation of fund brokerage, including allocations to brokers affiliated with the Investment Advisers, the use of brokerage commissions to pay fund expenses, and the use of "soft" commission dollars to pay for research services.
Annual Report
The Board noted that the growth of fund assets over time across the complex allows Fidelity to reinvest in the development of services designed to enhance the value or convenience of the Fidelity funds as investment vehicles. These services include 24-hour access to account information and market information through telephone representatives and over the Internet, investor education materials and asset allocation tools, and the expanded availability of Fidelity Investor Centers.
Investment in a Large Fund Family. The Board considered the benefits to shareholders of investing in a Fidelity fund, including the benefits of investing in a fund that is part of a large family of funds offering a variety of investment disciplines and providing a large variety of mutual fund investor services. The Board noted that Fidelity had taken, or had made recommendations that resulted in the Fidelity funds taking, a number of actions over the previous year that benefited particular funds, including (i) continuing to dedicate additional resources to investment research and support of the senior management team that oversees asset management; (ii) persisting in efforts to enhance Fidelity's research capabilities, in particular, international research; (iii) launching new funds and making other enhancements to meet client needs for global and income-oriented solutions; (iv) continuing to launch dedicated lower cost underlying funds to meet investment management's portfolio construction needs related to expanding underlying fund options, specifically for the Freedom Fund product lines; (v) adopting a "Stock Selector" sector neutral investment approach and employing a team of portfolio managers who are sector specialists to manage certain funds; (vi) rationalizing product lines and gaining increased efficiencies through the mergers of several funds into other funds; (vii) strengthening the Spartan Index Fund product line by adding new funds and/or new low-cost institutional share classes, restructuring fund expenses to accommodate new classes, and reducing investment minimums for certain classes of shares; (viii) modifying the eligibility criteria for Institutional Class shares to increase their appeal to government entities and charitable investors; and (ix) reducing certain transfer agent fee rates.
Investment Performance. The Board considered whether the fund has operated in accordance with its investment objective, as well as its record of compliance with its investment restrictions. As the fund recently commenced operations the Board did not believe that it was appropriate to assign significant weight to its limited investment performance.
Based on its review, the Board concluded that the nature, extent, and quality of services provided to the fund under the Advisory Contracts should benefit the fund's shareholders.
Competitiveness of Management Fee and Total Expense Ratio. The Board considered the fund's management fee and total expense ratio compared to "mapped groups" of competitive funds and classes. Fidelity creates "mapped groups" by combining similar Lipper investment objective categories that have comparable management fee characteristics. Combining Lipper investment objective categories aids the Board's management fee and total expense ratio comparisons by broadening the competitive group used for comparison and by reducing the number of universes to which various Fidelity funds are compared.
Annual Report
Board Approval of Investment Advisory Contracts and
Management Fees - continued
Management Fee. The Board considered two proprietary management fee comparisons for the period of the fund's operation shown in the chart below. The group of Lipper funds used by the Board for management fee comparisons is referred to below as the "Total Mapped Group." The Total Mapped Group comparison focuses on a fund's standing relative to the total universe of comparable funds available to investors in terms of gross management fees before expense reimbursements or caps. "TMG %" represents the percentage of funds in the Total Mapped Group that had management fees that were lower than the fund's. For example, a TMG % of 19% means that 81% of the funds in the Total Mapped Group had higher management fees than the fund. The "Asset-Size Peer Group" (ASPG) comparison focuses on a fund's standing relative to non-Fidelity funds similar in size to the fund within the Total Mapped Group. The ASPG represents at least 15% of the funds in the Total Mapped Group with comparable asset size and management fee characteristics, subject to a minimum of 50 funds (or all funds in the Total Mapped Group if fewer than 50). Additional information, such as the ASPG quartile in which the fund's management fee ranked, is also included in the chart and considered by the Board.
Fidelity Emerging Markets Discovery Fund
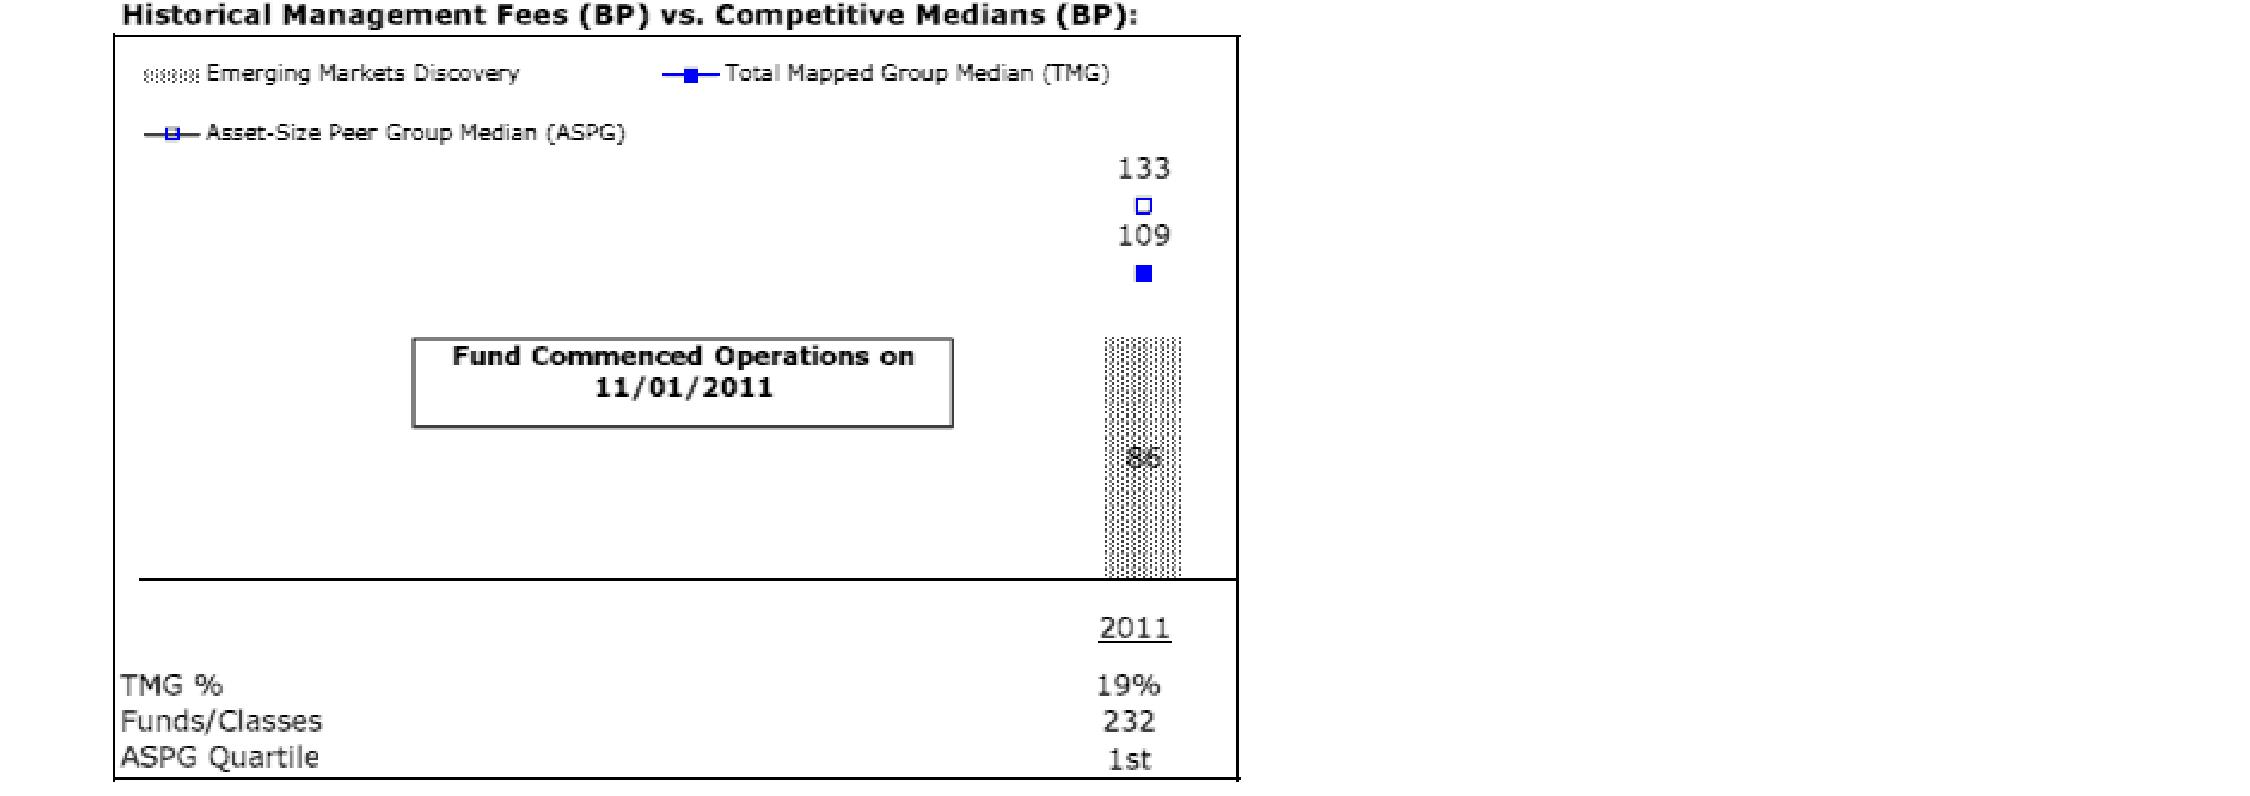
Annual Report
The Board noted that the fund's management fee ranked below the median of its Total Mapped Group and below the median of its ASPG for the period.
Based on its review, the Board concluded that the fund's management fee is fair and reasonable in light of the services that the fund receives and the other factors considered.
Total Expense Ratio. In its review of each class's total expense ratio, the Board considered the fund's management fee as well as other fund or class expenses, as applicable, such as transfer agent fees, pricing and bookkeeping fees, fund-paid 12b-1 fees, and custodial, legal, and audit fees. The Board also noted the effects of any waivers and reimbursements on fees and expenses. As part of its review, the Board also considered the current total expense ratios of each class of the fund compared to competitive fund median expenses. Each class of the fund is compared to those funds and classes in the Total Mapped Group (used by the Board for management fee comparisons) that have a similar sales load structure.
The Board noted that the fund offers multiple classes, each of which has a different sales load and 12b-1 fee structure, and that the multiple structures are intended to offer a range of pricing options for the intermediary market. The Board also noted that the total expense ratios of the classes of the fund vary primarily by the level of their 12b-1 fees, although differences in transfer agent fees may also cause expenses to vary from class to class.
The Board noted that the total expense ratio of each of Class A and the retail class of the fund ranked below its competitive median for the period and the total expense ratio of each of Class T, Class C, and Institutional Class ranked above its competitive median for the period. The Board considered that various factors, including 12b-1 fees, positive or negative performance adjustments, and relatively higher other expenses in the case of small fund size, can affect total expense ratios. The Board noted that the total expense ratio of Class T was above the competitive median primarily because of higher 12b-1 fees on Class T. Class T has a higher 12b-1 fee, but a lower front-end sales charge, than traditionally priced front-end sales charge classes. The Board considered that Class T is primarily sold load-waived in the retirement plan market where its 0.50% 12b-1 fee is comparable to competing no-load, higher 12b-1 fee classes designed specifically for retirement plans.
The Board further considered that FMR contractually agreed to reimburse Class A, Class T, Class C, Institutional Class and the retail class of the fund to the extent that total operating expenses (excluding interest, taxes, certain securities lending costs, brokerage commissions, extraordinary expenses, and acquired fund fees and expenses, if any), as a percentage of their respective average net assets, exceed 1.70%, 1.95%, 2.45%, 1.45%, and 1.45% through December 31, 2012.
Annual Report
Board Approval of Investment Advisory Contracts and
Management Fees - continued
Fees Charged to Other Fidelity Clients. The Board also considered Fidelity fee structures and other information with respect to clients of FMR and its affiliates, such as other mutual funds advised or subadvised by FMR or its affiliates, pension plan clients, and other institutional clients. The Board noted the findings of the 2010 ad hoc joint committee (created with the board of other Fidelity funds), which reviewed and compared Fidelity's institutional investment advisory business with its business of providing services to the Fidelity funds, including the differences in services provided, fees charged, and costs incurred, as well as competition in their respective marketplaces.
Based on its review of total expense ratios and fees charged to other Fidelity clients, the Board concluded that the total expense ratio of each class of the fund was reasonable, although in some cases above the median of the universe presented for comparison, in light of the services that the fund and its shareholders receive and the other factors considered.
Costs of the Services and Profitability. The Board considered the revenues earned and the expenses incurred by Fidelity in conducting the business of developing, marketing, distributing, managing, administering and servicing the fund and its shareholders. The Board also considered the level of Fidelity's profits in respect of all the Fidelity funds.
On an annual basis, FMR presents to the Board Fidelity's profitability for the fund. Fidelity calculates the profitability for each fund, as well as aggregate profitability for groups of Fidelity funds and all Fidelity funds, using a series of detailed revenue and cost allocation methodologies which originate with the books and records of Fidelity on which Fidelity's audited financial statements are based. The Audit Committee of the Board reviews any significant changes from the prior year's methodologies.
PricewaterhouseCoopers LLP (PwC), independent registered public accounting firm and auditor to Fidelity and certain Fidelity funds, has been engaged annually by the Board as part of the Board's assessment of Fidelity's profitability analysis. PwC's engagement includes the review and assessment of Fidelity's methodologies used in determining the revenues and expenses attributable to Fidelity's mutual fund business, and completion of agreed-upon procedures surrounding the mathematical accuracy of fund profitability and its conformity to allocation methodologies. After considering PwC's reports issued under the engagement and information provided by Fidelity, the Board concluded that while other allocation methods may also be reasonable, Fidelity's profitability methodologies are reasonable in all material respects.
The Board also reviewed Fidelity's non-fund businesses and fall-out benefits related to the mutual fund business as well as cases where Fidelity's affiliates may benefit from or be related to the fund's business.
Annual Report
The Board considered the costs of the services provided by and the profits realized by Fidelity in connection with the operation of the fund and was satisfied that the profitability was not excessive in the circumstances.
Economies of Scale. The Board considered whether there have been economies of scale in respect of the management of the Fidelity funds, whether the Fidelity funds (including the fund) have appropriately benefited from any such economies of scale, and whether there is potential for realization of any further economies of scale. The Board considered the extent to which the fund will benefit from economies of scale through increased services to the fund, through waivers or reimbursements, or through fee or expense reductions. The Board also noted that in 2009, it and the board of other Fidelity funds created an ad hoc committee (the Economies of Scale Committee) to analyze whether FMR attains economies of scale in respect of the management and servicing of the Fidelity funds, whether the Fidelity funds have appropriately benefited from such economies of scale, and whether there is potential for realization of any further economies of scale.
The Board recognized that the fund's management contract incorporates a "group fee" structure, which provides for lower group fee rates as total fund assets under FMR's management increase, and for higher group fee rates as total fund assets under FMR's management decrease. FMR calculates the group fee rates based on a tiered asset "breakpoint" schedule that varies based on asset class. The Board considered that the group fee is designed to deliver the benefits of economies of scale to fund shareholders when total Fidelity fund assets increase, even if assets of any particular fund are unchanged or have declined, because some portion of Fidelity's costs are attributable to services provided to all Fidelity funds, and all funds benefit if those costs can be allocated among more assets. The Board concluded that, given the group fee structure, fund shareholders will benefit from lower management fees as assets under FMR's management increase at the fund complex level, regardless of whether Fidelity achieves any such economies of scale.
The Board concluded, taking into account the analysis of the Economies of Scale Committee, that economies of scale, if any, are being appropriately shared between fund shareholders and Fidelity.
Additional Information Requested by the Board. In order to develop fully the factual basis for consideration of the Fidelity funds' Advisory Contracts, the Board requested and received additional information on certain topics, including (i) fund performance trends, actions to be taken by FMR to improve certain funds' overall performance, and Fidelity's long-term strategies for certain funds; (ii) the potential to further rationalize the Fidelity fund lineup with the possibility of achieving savings for the funds and Fidelity; (iii) Fidelity's compensation structure for portfolio managers and other key investment personnel; (iv) the amount of the investment that each portfolio manager has made in the Fidelity fund(s) that he or she manages; (v) the realization of fall-out benefits in certain Fidelity business units; (vi) Fidelity's group fee structures, the potential impact of regulatory changes on such structures, and the rationale for the individual fee rates of certain funds; (vii) fund profitability methodology, including Fidelity's cost allocation methodology, and the impact of certain factors on fund profitability results; (viii) trends regarding industry use of performance fee structures and the possibility of implementing performance fee structures for additional funds; and (ix) the impact of net redemptions from the Fidelity funds.
Annual Report
Board Approval of Investment Advisory Contracts and
Management Fees - continued
Based on its evaluation of all of the conclusions noted above, and after considering all factors it believed relevant, the Board ultimately concluded that the advisory fee structures are fair and reasonable, and that the fund's Advisory Contracts should be renewed.
Annual Report
Investment Adviser
Fidelity Management & Research Company
Boston, MA
Investment Sub-Advisers
FMR Co., Inc.
Fidelity Management & Research
(U.K.) Inc.
Fidelity Management & Research
(Hong Kong) Limited
FIL Investments (Japan) Limited
Fidelity Management & Research
(Japan) Inc.
FIL Investment Advisors (UK) Limited
FIL Investment Advisors
General Distributor
Fidelity Distributors Corporation
Smithfield, RI
Transfer and Service Agents
Fidelity Investments Institutional Operations Company, Inc.
Boston, MA
Fidelity Service Company, Inc.
Boston, MA
Custodian
The Northern Trust Company
Chicago, IL
(Fidelity Investment logo)(registered trademark)
AEMDI-UANN-1212
1.931242.100
(Fidelity Investment logo)(registered trademark)
Fidelity Advisor®
Total Emerging Markets
Fund - Class A, Class T,
and Class C
Annual Report
October 31, 2012
(Fidelity Cover Art)
Class A, Class T, and
Class C are classes of
Fidelity® Total Emerging
Markets Fund
Contents
Performance | (Click Here) | How the fund has done over time. |
Management's Discussion of Fund Performance | (Click Here) | The Portfolio Manager's review of fund performance and strategy. |
Shareholder Expense Example | (Click Here) | An example of shareholder expenses. |
Investment Changes | (Click Here) | A summary of major shifts in the fund's investments over the past six months. |
Investments | (Click Here) | A complete list of the fund's investments with their market values. |
Financial Statements | (Click Here) | Statements of assets and liabilities, operations, and changes in net assets, as well as financial highlights. |
Notes | (Click Here) | Notes to the financial statements. |
Report of Independent Registered Public Accounting Firm | (Click Here) | |
Trustees and Officers | (Click Here) | |
Distributions | (Click Here) | |
Board Approval of Investment Advisory Contracts and Management Fees | (Click Here) | |
To view a fund's proxy voting guidelines and proxy voting record for the 12-month period ended June 30, visit http://www.fidelity.com/proxyvotingresults or visit the Securities and Exchange Commission's (SEC) web site at http://www.sec.gov. You may also call 1-877-208-0098 to request a free copy of the proxy voting guidelines.
Standard & Poor's, S&P and S&P 500 are registered service marks of The McGraw-Hill Companies, Inc. and have been licensed for use by Fidelity Distributors Corporation.
Other third party marks appearing herein are the property of their respective owners.
All other marks appearing herein are registered or unregistered trademarks or service marks of FMR LLC or an affiliated company. © 2012 FMR LLC. All rights reserved.
Annual Report
This report and the financial statements contained herein are submitted for the general information of the shareholders of the fund. This report is not authorized for distribution to prospective investors in the fund unless preceded or accompanied by an effective prospectus.
A fund files its complete schedule of portfolio holdings with the SEC for the first and third quarters of each fiscal year on Form N-Q. Forms N-Q are available on the SEC's web site at http://www.sec.gov. A fund's Forms N-Q may be reviewed and copied at the SEC's Public Reference Room in Washington, DC. Information regarding the operation of the SEC's Public Reference Room may be obtained by calling 1-800-SEC-0330. For a complete list of a fund's portfolio holdings, view the most recent holdings listing, semiannual report, or annual report on Fidelity's web site at http://www.fidelity.com, http://advisor.fidelity.com, or http://www.401k.com, as applicable.
NOT FDIC INSURED • MAY LOSE VALUE • NO BANK GUARANTEE
Neither the fund nor Fidelity Distributors Corporation is a bank.
Annual Report
Average annual total return reflects the change in the value of an investment, assuming reinvestment of the class' distributions from dividend income and capital gains (the profits earned upon the sale of securities that have grown in value, if any) and assuming a constant rate of performance each year. The $10,000 table and the fund's returns do not reflect the deduction of taxes that a shareholder would pay on fund distributions or the redemption of fund shares. During periods of reimbursement by Fidelity, a fund's total return will be greater than it would be had the reimbursement not occurred. How a fund did yesterday is no guarantee of how it will do tomorrow.
Average annual total returns take Fidelity Advisor® Total Emerging Markets Fund - Class A's , Class T's, and Class C's cumulative total return and show you what would have happened if Class A, Class T, and Class C shares had performed at a constant rate each year. These numbers will be reported once the fund is a year old.
$10,000 Over Life of Fund
Let's say hypothetically that $10,000 was invested in Fidelity Advisor® Total Emerging Markets Fund - Class A on November 1, 2011, when the fund started, and the current 5.75% sales charge was paid. The chart shows how the value of your investment would have changed, and also shows how the MSCI® Emerging Markets Index performed over the same period.
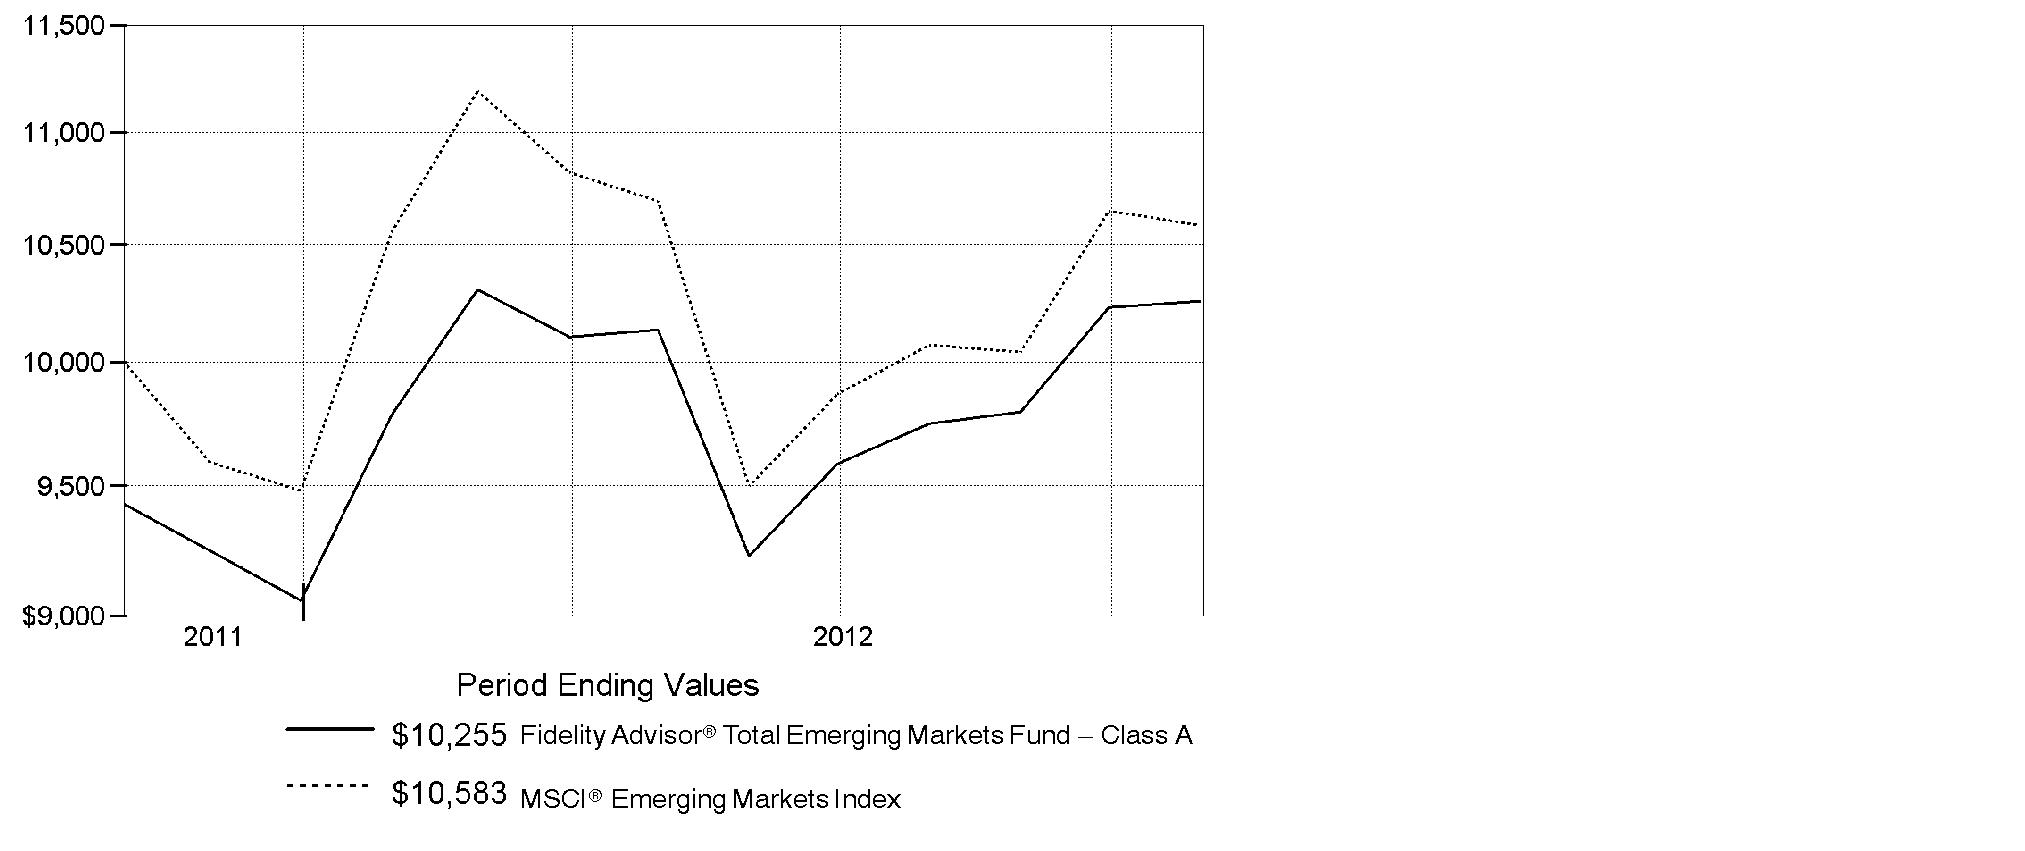
Annual Report
Market Recap: Global equities experienced turbulent swings during the 12 months ending October 31, 2012, but still managed a solid gain. Volatility peppered the past year, as a number of macroeconomic concerns weighed on investors, with the eurozone debt crisis, the strength and pace of the U.S. economic recovery, and a slowdown in China's growth all making headlines. But, stocks in the U.S. and overseas were generally resilient, gaining 8.96% for the 12 months, as measured by the MSCI® ACWI® (All Country World Index) Index, largely buttressed by accommodative monetary policy in the United States and Europe, as well as signs that the U.S. housing market was starting to recover. Within the index, U.S. stocks fared best, advancing 15%. Asia-Pacific ex Japan also performed well, gaining roughly 10% on strong returns in Hong Kong and Singapore. Several European markets, most notably Germany (+11%), Switzerland (+10%) and the U.K. (+9%), benefited from optimism about the eurozone's ability to resolve its debt woes. However, continued weakness in peripheral European markets caused the region to lag the index overall. Japan, emerging markets and Canada each underperformed, with Japan suffering the most, falling by about 3%. A stronger U.S. dollar dampened results for foreign stocks overall. Global bond markets delivered positive, albeit more-muted returns, with the Barclays® Global Aggregate GDP Weighted Index gaining 4.54%.
Comments from John Carlson, Lead Portfolio Manager of Fidelity Advisor® Total Emerging Markets Fund: From its inception on November 1, 2011, through October 31, 2012, the fund's Class A, Class T and Class C shares gained 8.80%, 8.56% and 8.07%, respectively (excluding sales charges). By comparison, the fund's primary benchmark, the MSCI® Emerging Markets Index, returned 5.83%, while the Fidelity Total Emerging Markets Composite IndexSM advanced 10.34%. Performance versus the Composite index was held back by our decision to overweight equities and underweight debt, the latter of which had much stronger performance during the period. Both subportfolios outperformed their respective benchmark, driven by security selection, which largely offset the negative impact of our overall allocation. At launch, the fund split its assets between equities and debt at roughly 67% and 33%, respectively. During the period, we decided to further increase our overweighting in equities, while reducing exposure to EM debt. We made this decision based, in part, on the massive sell-off in global equities as a result of the sovereign debt crisis in Greece and the debt overhang impacting other developed countries.
Note to shareholders: Gregory Lee was named Co-Portfolio Manager on May 2, 2012, and is responsible for the fund's industrials sector assets.
The views expressed above reflect those of the portfolio manager(s) only through the end of the period as stated on the cover of this report and do not necessarily represent the views of Fidelity or any other person in the Fidelity organization. Any such views are subject to change at any time based upon market or other conditions and Fidelity disclaims any responsibility to update such views. These views may not be relied on as investment advice and, because investment decisions for a Fidelity fund are based on numerous factors, may not be relied on as an indication of trading intent on behalf of any Fidelity fund.
Annual Report
Fidelity Total Emerging Markets Fund
Shareholder Expense Example
As a shareholder of the Fund, you incur two types of costs: (1) transaction costs, including sales charges (loads) on purchase payments or redemption proceeds, redemption fees and (2) ongoing costs, including management fees, distribution and/or service (12b-1) fees and other Fund expenses. This Example is intended to help you understand your ongoing costs (in dollars) of investing in the Fund and to compare these costs with the ongoing costs of investing in other mutual funds.
The Example is based on an investment of $1,000 invested at the beginning of the period and held for the entire period (May 1, 2012 to October 31, 2012).
Actual Expenses
The first line of the accompanying table for each class of the Fund provides information about actual account values and actual expenses. You may use the information in this line, together with the amount you invested, to estimate the expenses that you paid over the period. Simply divide your account value by $1,000.00 (for example, an $8,600 account value divided by $1,000.00 = 8.6), then multiply the result by the number in the first line for a class of the Fund under the heading entitled "Expenses Paid During Period" to estimate the expenses you paid on your account during this period. A small balance maintenance fee of $12.00 that is charged once a year may apply for certain accounts with a value of less than $2,000. This fee is not included in the table below. If it was, the estimate of expenses you paid during the period would be higher, and your ending account value lower, by this amount. In addition, the Fund, as a shareholder in the underlying Fidelity Central Funds, will indirectly bear its pro-rata share of the fees and expenses incurred by the underlying Fidelity Central Funds. These fees and expenses are not included in the Fund's annualized expense ratio used to calculate the expense estimate in the table below.
Hypothetical Example for Comparison Purposes
The second line of the accompanying table for each class of the Fund provides information about hypothetical account values and hypothetical expenses based on a Class' actual expense ratio and an assumed rate of return of 5% per year before expenses, which is not the Class' actual return. The hypothetical account values and expenses may not be used to estimate the actual ending account balance or expenses you paid for the period. You may use this information to compare the ongoing costs of investing in the Fund and other funds. To do so, compare this 5% hypothetical example with the 5% hypothetical examples that appear in the shareholder reports of the other funds. A small balance maintenance fee of $12.00 that is charged once a year may apply for certain accounts with a value of less than $2,000. This fee is not included in the table below. If it was, the estimate of expenses you paid during the period would be higher, and your ending account value lower, by this amount. In addition, the Fund, as a shareholder in the underlying Fidelity Central Funds, will indirectly bear its pro-rata share of the fees and expenses incurred by the underlying Fidelity Central Funds. These fees and expenses are not included in the Fund's annualized expense ratio used to calculate the expense estimate in the table below.
Please note that the expenses shown in the table are meant to highlight your ongoing costs only and do not reflect any transaction costs. Therefore, the second line of the table is useful in comparing ongoing costs only, and will not help you determine the relative total costs of owning different funds. In addition, if these transactional costs were included, your costs would have been higher.
Annual Report
Fidelity Total Emerging Markets Fund
Shareholder Expense Example - continued
| Annualized
Expense Ratio | Beginning
Account Value
May 1, 2012 | Ending
Account Value
October 31, 2012 | Expenses Paid
During Period*
May 1, 2012
to October 31, 2012 |
Class A | 1.65% | | | |
Actual | | $ 1,000.00 | $ 1,012.10 | $ 8.35 |
HypotheticalA | | $ 1,000.00 | $ 1,016.84 | $ 8.36 |
Class T | 1.90% | | | |
Actual | | $ 1,000.00 | $ 1,011.20 | $ 9.61 |
HypotheticalA | | $ 1,000.00 | $ 1,015.58 | $ 9.63 |
Class C | 2.40% | | | |
Actual | | $ 1,000.00 | $ 1,008.40 | $ 12.12 |
HypotheticalA | | $ 1,000.00 | $ 1,013.07 | $ 12.14 |
Total Emerging Markets | 1.40% | | | |
Actual | | $ 1,000.00 | $ 1,014.00 | $ 7.09 |
HypotheticalA | | $ 1,000.00 | $ 1,018.10 | $ 7.10 |
Institutional Class | 1.40% | | | |
Actual | | $ 1,000.00 | $ 1,014.00 | $ 7.09 |
HypotheticalA | | $ 1,000.00 | $ 1,018.10 | $ 7.10 |
A 5% return per year before expenses
* Expenses are equal to each Class' annualized expense ratio, multiplied by the average account value over the period, multiplied by 184/366 (to reflect the one-half year period).
Annual Report
Fidelity Total Emerging Markets Fund
Investment Changes (Unaudited)
Top Five Stocks as of October 31, 2012 |
| % of fund's
net assets | % of fund's net assets
6 months ago |
Samsung Electronics Co. Ltd. (Korea (South), Semiconductors & Semiconductor Equipment) | 3.4 | 3.2 |
Taiwan Semiconductor Manufacturing Co. Ltd. (Taiwan, Semiconductors & Semiconductor Equipment) | 1.9 | 1.9 |
Vale SA (PN-A) sponsored ADR (Brazil, Metals & Mining) | 1.6 | 1.4 |
China Construction Bank Corp. (H Shares) (China, Commercial Banks) | 1.3 | 1.3 |
Industrial & Commercial Bank of China Ltd. (H Shares) (China, Commercial Banks) | 1.3 | 1.5 |
| 9.5 | |
Top Five Market Sectors as of October 31, 2012 |
| % of fund's
net assets | % of fund's net assets
6 months ago |
Financials | 19.5 | 15.8 |
Energy | 13.9 | 15.8 |
Information Technology | 9.7 | 10.0 |
Materials | 9.1 | 8.4 |
Consumer Staples | 6.7 | 5.8 |
Top Five Countries as of October 31, 2012 |
(excluding cash equivalents) | % of fund's
net assets | % of fund's net assets
6 months ago |
Brazil | 11.2 | 11.0 |
Korea (South) | 10.7 | 9.9 |
Russia | 8.4 | 6.8 |
China | 6.6 | 5.9 |
Taiwan | 5.5 | 6.0 |
Percentages are adjusted for the effect of open futures contracts, if applicable. |
Asset Allocation (% of fund's net assets) |
As of October 31, 2012 | As of April 30, 2012 |
 | Stocks 72.4% | | | Stocks and 70.3%
Investment
Companies | |
 | Bonds 24.5% | | | Bonds 26.5% | |
| Short-Term
Investments and
Net Other Assets
(Liabilities) 3.1% | | | Short-Term
Investments and
Net Other Assets
(Liabilities) 3.2% | |

Annual Report
Fidelity Total Emerging Markets Fund
Investments October 31, 2012
Showing Percentage of Net Assets
Common Stocks - 70.5% |
| Shares | | Value |
Australia - 0.2% |
Paladin Energy Ltd. (Australia) (a) | 154,295 | | $ 181,788 |
Austria - 0.3% |
Erste Bank AG (a) | 12,390 | | 311,149 |
Bailiwick of Jersey - 0.2% |
Atrium European Real Estate Ltd. | 40,749 | | 230,334 |
Bermuda - 1.5% |
Aquarius Platinum Ltd. (Australia) | 125,044 | | 74,636 |
BW Offshore Ltd. | 420,089 | | 246,838 |
GP Investments Ltd. (depositary receipt) (a) | 121,322 | | 280,151 |
Kunlun Energy Co. Ltd. | 268,000 | | 497,958 |
Pacific Basin Shipping Ltd. | 290,000 | | 155,289 |
Seadrill Ltd. | 6,414 | | 259,652 |
TOTAL BERMUDA | | 1,514,524 |
Brazil - 9.9% |
Anhanguera Educacional Participacoes SA | 32,800 | | 574,914 |
Arezzo Industria e Comercio SA | 10,100 | | 180,264 |
Banco do Brasil SA | 28,200 | | 300,876 |
Banco do Estado Rio Grande do Sul SA | 33,650 | | 265,913 |
BM&F Bovespa SA | 84,100 | | 538,293 |
BR Properties SA | 46,500 | | 608,995 |
Braskem SA (PN-A) | 36,400 | | 240,510 |
CCR SA | 34,200 | | 300,737 |
Cia.Hering SA | 14,000 | | 321,627 |
Companhia de Bebidas das Americas (AmBev) (PN) sponsored ADR | 9,000 | | 367,110 |
Companhia de Saneamento de Minas Gerais | 7,260 | | 171,362 |
Companhia Paranaense de Energia-Copel: | | | |
(PN-B) | 1,195 | | 17,651 |
(PN-B) sponsored ADR | 14,970 | | 220,957 |
Estacio Participacoes SA | 13,600 | | 259,137 |
Fibria Celulose SA (a) | 20,500 | | 174,009 |
Gerdau SA sponsored ADR | 36,200 | | 318,198 |
Itau Unibanco Holdings SA sponsored ADR | 56,380 | | 822,020 |
Lojas Americanas SA (PN) | 55,833 | | 467,325 |
Mills Estruturas e Servicos de Engenharia SA | 18,300 | | 280,575 |
Multiplus SA | 5,700 | | 132,435 |
Petroleo Brasileiro SA - Petrobras: | | | |
(PN) sponsored ADR (non-vtg.) | 16,106 | | 330,656 |
sponsored ADR | 48,600 | | 1,030,806 |
Sul America SA unit | 8,900 | | 70,112 |
TIM Participacoes SA sponsored ADR | 3,353 | | 58,275 |
Common Stocks - continued |
| Shares | | Value |
Brazil - continued |
Ultrapar Participacoes SA | 24,500 | | $ 513,872 |
Vale SA (PN-A) sponsored ADR | 90,600 | | 1,611,774 |
TOTAL BRAZIL | | 10,178,403 |
Canada - 1.6% |
Banro Corp. (a) | 20,700 | | 95,754 |
Barrick Gold Corp. | 5,900 | | 238,599 |
First Quantum Minerals Ltd. | 13,400 | | 301,207 |
Goldcorp, Inc. | 7,300 | | 330,007 |
Pan American Silver Corp. | 4,000 | | 88,000 |
Torex Gold Resources, Inc. (a) | 49,700 | | 103,505 |
Uranium One, Inc. (a) | 66,900 | | 145,355 |
Yamana Gold, Inc. | 18,500 | | 373,612 |
TOTAL CANADA | | 1,676,039 |
Cayman Islands - 4.5% |
21Vianet Group, Inc. ADR (a) | 14,420 | | 159,774 |
Ajisen (China) Holdings Ltd. | 183,000 | | 126,564 |
Anta Sports Products Ltd. | 206,000 | | 175,431 |
Baidu.com, Inc. sponsored ADR (a) | 3,734 | | 398,119 |
Belle International Holdings Ltd. | 155,000 | | 288,798 |
China Liansu Group Holdings Ltd. | 280,000 | | 165,109 |
Eurasia Drilling Co. Ltd. GDR (Reg. S) | 13,217 | | 457,308 |
Geely Automobile Holdings Ltd. | 425,000 | | 182,612 |
Gourmet Master Co. Ltd. | 24,000 | | 170,079 |
Greatview Aseptic Pack Co. Ltd. | 579,000 | | 303,319 |
Haitian International Holdings Ltd. | 131,000 | | 161,763 |
Hengan International Group Co. Ltd. | 70,000 | | 637,673 |
SINA Corp. (a) | 1,300 | | 71,019 |
Spreadtrum Communications, Inc. ADR | 3,415 | | 78,716 |
Tencent Holdings Ltd. | 6,900 | | 243,947 |
Uni-President China Holdings Ltd. | 377,000 | | 474,287 |
Veripos (a) | 34,725 | | 100,497 |
Xueda Education Group sponsored ADR (a) | 33,300 | | 95,904 |
Yingde Gases Group Co. Ltd. | 327,500 | | 310,595 |
TOTAL CAYMAN ISLANDS | | 4,601,514 |
Chile - 0.9% |
Aguas Andinas SA | 281,427 | | 188,866 |
Embotelladora Andina SA Class A | 35,611 | | 179,110 |
Empresa Nacional de Telecomunicaciones SA (ENTEL) | 11,435 | | 232,907 |
Common Stocks - continued |
| Shares | | Value |
Chile - continued |
Enersis SA | 210,651 | | $ 72,107 |
Inversiones La Construccion SA | 13,305 | | 235,046 |
TOTAL CHILE | | 908,036 |
China - 6.6% |
BBMG Corp. (H Shares) | 196,500 | | 168,862 |
China Communications Construction Co. Ltd. (H Shares) | 329,000 | | 308,621 |
China Construction Bank Corp. (H Shares) | 1,811,000 | | 1,364,667 |
China Pacific Insurance Group Co. Ltd. (H Shares) | 205,300 | | 643,711 |
China Shenhua Energy Co. Ltd. (H Shares) | 234,500 | | 998,510 |
China Suntien Green Energy Corp. Ltd. (H Shares) | 1,494,600 | | 304,704 |
China Telecom Corp. Ltd. (H Shares) | 388,357 | | 229,771 |
Dongfeng Motor Group Co. Ltd. (H Shares) | 276,000 | | 341,882 |
Industrial & Commercial Bank of China Ltd. (H Shares) | 2,037,000 | | 1,348,354 |
Maanshan Iron & Steel Ltd. (H Shares) (a) | 810,000 | | 209,031 |
PICC Property & Casualty Co. Ltd. (H Shares) | 188,000 | | 250,342 |
Shanghai Electric Group Co. Ltd. (H Shares) | 846,000 | | 343,856 |
Weichai Power Co. Ltd. (H Shares) | 93,400 | | 330,815 |
TOTAL CHINA | | 6,843,126 |
Colombia - 0.7% |
Ecopetrol SA ADR | 11,842 | | 701,165 |
Cyprus - 0.2% |
Globaltrans Investment PLC: | | | |
GDR (e) | 6,900 | | 127,650 |
GDR (Reg. S) | 1,500 | | 27,750 |
TOTAL CYPRUS | | 155,400 |
Czech Republic - 0.2% |
Ceske Energeticke Zavody A/S | 6,068 | | 223,721 |
Egypt - 0.1% |
Orascom Telecom Holding SAE unit (a) | 46,100 | | 138,531 |
Hong Kong - 0.8% |
China Resources Power Holdings Co. Ltd. | 84,000 | | 179,921 |
Lenovo Group Ltd. | 532,000 | | 427,657 |
Sinotruk Hong Kong Ltd. | 345,500 | | 198,383 |
TOTAL HONG KONG | | 805,961 |
India - 3.2% |
Axis Bank Ltd. | 15,390 | | 338,263 |
Bharti Airtel Ltd. | 51,651 | | 258,855 |
Grasim Industries Ltd. | 2,348 | | 152,745 |
Common Stocks - continued |
| Shares | | Value |
India - continued |
Housing Development and Infrastructure Ltd. (a) | 37,732 | | $ 67,287 |
Indiabulls Real Estate Ltd. | 125,168 | | 133,299 |
ITC Ltd. | 138,460 | | 727,105 |
JK Cement Ltd. (a) | 14,380 | | 67,363 |
Larsen & Toubro Ltd. | 11,459 | | 346,475 |
Lupin Ltd. (a) | 16,696 | | 175,773 |
Maruti Suzuki India Ltd. | 12,229 | | 326,811 |
Phoenix Mills Ltd. (a) | 5,122 | | 19,106 |
Power Grid Corp. of India Ltd. | 70,024 | | 148,364 |
SREI Infrastructure Finance Ltd. | 485,175 | | 242,114 |
State Bank of India | 7,746 | | 303,801 |
TOTAL INDIA | | 3,307,361 |
Indonesia - 1.7% |
PT Bakrieland Development Tbk (a) | 15,113,500 | | 102,277 |
PT Bank Tabungan Negara Tbk | 1,521,500 | | 240,778 |
PT Indo Tambangraya Megah Tbk | 53,500 | | 226,420 |
PT Jasa Marga Tbk | 449,500 | | 271,430 |
PT Telkomunikasi Indonesia Tbk: | | | |
Series B | 58,500 | | 59,416 |
sponsored ADR | 21,864 | | 888,772 |
TOTAL INDONESIA | | 1,789,093 |
Israel - 0.4% |
Bezeq Israeli Telecommunication Corp. Ltd. | 140,100 | | 170,848 |
Check Point Software Technologies Ltd. (a) | 1,900 | | 84,607 |
NICE Systems Ltd. sponsored ADR (a) | 5,700 | | 189,810 |
TOTAL ISRAEL | | 445,265 |
Kazakhstan - 0.2% |
JSC Halyk Bank of Kazakhstan GDR unit (a) | 30,100 | | 214,011 |
Kenya - 0.5% |
Equity Bank Ltd. | 1,027,600 | | 292,652 |
Safaricom Ltd. | 3,989,903 | | 206,172 |
TOTAL KENYA | | 498,824 |
Korea (South) - 9.7% |
AMOREPACIFIC Group, Inc. | 973 | | 419,427 |
E-Mart Co. Ltd. | 2,387 | | 517,761 |
GS Engineering & Construction Corp. | 4,567 | | 257,185 |
Hana Financial Group, Inc. | 19,890 | | 579,195 |
Hyundai Heavy Industries Co. Ltd. | 1,411 | | 296,352 |
Common Stocks - continued |
| Shares | | Value |
Korea (South) - continued |
Hyundai Industrial Development & Construction Co. | 5,380 | | $ 96,713 |
KB Financial Group, Inc. | 22,190 | | 754,780 |
Kia Motors Corp. | 1,710 | | 95,042 |
Korea Electric Power Corp. (a) | 10,540 | | 273,457 |
Korean Reinsurance Co. | 16,820 | | 165,065 |
KT&G Corp. | 6,796 | | 517,965 |
LG Chemical Ltd. | 1,768 | | 496,192 |
LS Industrial Systems Ltd. | 5,350 | | 334,645 |
Orion Corp. | 334 | | 313,684 |
POSCO sponsored ADR | 4,400 | | 344,872 |
Samsung Electronics Co. Ltd. | 2,887 | | 3,468,666 |
Samsung Fire & Marine Insurance Co. Ltd. | 2,412 | | 527,608 |
Shinhan Financial Group Co. Ltd. | 11,860 | | 407,364 |
Shinhan Financial Group Co. Ltd. sponsored ADR | 4,828 | | 165,214 |
TOTAL KOREA (SOUTH) | | 10,031,187 |
Luxembourg - 0.3% |
Subsea 7 SA | 15,100 | | 331,330 |
Malaysia - 0.5% |
Axiata Group Bhd | 136,700 | | 293,057 |
Petronas Dagangan Bhd | 32,500 | | 235,588 |
TOTAL MALAYSIA | | 528,645 |
Mexico - 3.4% |
America Movil SAB de CV Series L sponsored ADR | 44,120 | | 1,115,795 |
CEMEX SA de CV sponsored ADR | 41,288 | | 373,244 |
Desarrolladora Homex SAB de CV sponsored ADR (a) | 7,350 | | 97,388 |
El Puerto de Liverpool SA Class C | 20,900 | | 187,308 |
Fibra Uno Administracion SA de CV | 95,000 | | 250,306 |
Fomento Economico Mexicano SAB de CV sponsored ADR | 5,200 | | 471,172 |
Grupo Comercial Chedraui de CV | 73,700 | | 198,518 |
Grupo Televisa SA de CV (CPO) sponsored ADR | 34,300 | | 775,180 |
TOTAL MEXICO | | 3,468,911 |
Netherlands - 0.1% |
ASML Holding NV (Netherlands) | 2,775 | | 152,548 |
Nigeria - 1.2% |
Guaranty Trust Bank PLC | 627,668 | | 79,128 |
Guaranty Trust Bank PLC GDR (Reg. S) | 69,900 | | 433,380 |
Zenith Bank PLC | 5,943,111 | | 681,872 |
TOTAL NIGERIA | | 1,194,380 |
Common Stocks - continued |
| Shares | | Value |
Norway - 0.9% |
ElectroMagnetic GeoServices ASA (a) | 102,680 | | $ 223,323 |
Petroleum Geo-Services ASA | 8,800 | | 151,727 |
TGS Nopec Geophysical Co. ASA | 16,928 | | 576,015 |
TOTAL NORWAY | | 951,065 |
Panama - 0.4% |
Copa Holdings SA Class A | 4,200 | | 389,844 |
Peru - 0.2% |
Compania de Minas Buenaventura SA sponsored ADR | 6,000 | | 214,560 |
Philippines - 1.1% |
Metro Pacific Investments Corp. | 2,899,000 | | 292,016 |
Metropolitan Bank & Trust Co. | 138,200 | | 319,440 |
Robinsons Land Corp. | 1,121,000 | | 518,224 |
TOTAL PHILIPPINES | | 1,129,680 |
Poland - 0.8% |
Eurocash SA | 14,100 | | 172,195 |
Powszechny Zaklad Ubezpieczen SA | 5,375 | | 627,966 |
TOTAL POLAND | | 800,161 |
Russia - 5.8% |
Bank St. Petersburg OJSC | 41,600 | | 76,567 |
DIXY Group OJSC (a) | 17,805 | | 188,095 |
Gazprom OAO sponsored ADR | 70,532 | | 644,662 |
LSR Group OJSC GDR (Reg. S) | 24,100 | | 116,042 |
Lukoil Oil Co. (a) | 3,200 | | 194,292 |
Magnit OJSC | 1,822 | | 259,555 |
Magnit OJSC GDR (Reg. S) | 4,900 | | 173,950 |
Magnitogorsk Iron & Steel Works OJSC unit (a) | 30,900 | | 133,241 |
Mobile TeleSystems OJSC (a) | 80,060 | | 589,037 |
Mobile TeleSystems OJSC sponsored ADR | 28,390 | | 486,605 |
NOVATEK OAO GDR (Reg. S) | 5,200 | | 592,800 |
OGK-4 OJSC (a) | 6,094,400 | | 500,679 |
Raspadskaya OAO (a) | 38,412 | | 75,745 |
Rosneft Oil Co. OJSC | 14,500 | | 107,608 |
RusHydro JSC sponsored ADR | 67,240 | | 159,628 |
Sberbank (Savings Bank of the Russian Federation) | 379,050 | | 1,109,639 |
Sistema JSFC (a) | 156,700 | | 117,879 |
TNK-BP Holding | 49,360 | | 100,764 |
Uralkali OJSC GDR (Reg. S) | 9,100 | | 356,538 |
TOTAL RUSSIA | | 5,983,326 |
Common Stocks - continued |
| Shares | | Value |
Singapore - 0.9% |
First Resources Ltd. | 277,000 | | $ 465,527 |
Global Logistic Properties Ltd. | 201,000 | | 423,487 |
TOTAL SINGAPORE | | 889,014 |
South Africa - 2.9% |
AngloGold Ashanti Ltd. | 9,100 | | 307,447 |
Aspen Pharmacare Holdings Ltd. | 17,500 | | 318,892 |
Blue Label Telecoms Ltd. | 171,800 | | 133,546 |
Impala Platinum Holdings Ltd. | 29,100 | | 523,559 |
JSE Ltd. | 54,670 | | 443,443 |
Life Healthcare Group Holdings Ltd. | 72,400 | | 273,797 |
Naspers Ltd. Class N | 11,500 | | 746,595 |
Reunert Ltd. | 18,500 | | 162,967 |
Wilson Bayly Holmes-Ovcon Ltd. | 3,600 | | 58,999 |
TOTAL SOUTH AFRICA | | 2,969,245 |
Taiwan - 5.5% |
Asia Cement Corp. | 186,430 | | 232,319 |
Cheng Uei Precision Industries Co. Ltd. | 135,339 | | 299,775 |
Chinatrust Financial Holding Co. Ltd. | 640,042 | | 352,779 |
Chroma ATE, Inc. | 74,000 | | 140,856 |
Hon Hai Precision Industry Co. Ltd. (Foxconn) | 209,500 | | 636,174 |
MediaTek, Inc. | 37,000 | | 411,041 |
Synnex Technology International Corp. | 155,000 | | 327,936 |
Taiwan Fertilizer Co. Ltd. | 99,000 | | 235,892 |
Taiwan Mobile Co. Ltd. | 95,000 | | 331,736 |
Taiwan Semiconductor Manufacturing Co. Ltd. | 408,000 | | 1,243,307 |
Taiwan Semiconductor Manufacturing Co. Ltd. sponsored ADR | 45,700 | | 726,630 |
Unified-President Enterprises Corp. | 279,660 | | 494,025 |
Yuanta Financial Holding Co. Ltd. | 576,000 | | 260,294 |
TOTAL TAIWAN | | 5,692,764 |
Thailand - 0.8% |
Bangkok Bank Public Co. Ltd. (For. Reg.) | 92,900 | | 548,252 |
PTT Global Chemical PCL (For. Reg.) | 124,400 | | 247,421 |
TOTAL THAILAND | | 795,673 |
Turkey - 0.8% |
Aygaz A/S | 52,000 | | 239,621 |
TAV Havalimanlari Holding A/S | 62,000 | | 307,838 |
Turkiye Is Bankasi A/S Series C | 84,900 | | 288,921 |
TOTAL TURKEY | | 836,380 |
Common Stocks - continued |
| Shares | | Value |
United Kingdom - 0.6% |
Evraz PLC | 32,100 | | $ 122,355 |
Hikma Pharmaceuticals PLC | 15,011 | | 179,137 |
Kazakhmys PLC | 26,800 | | 306,632 |
TOTAL UNITED KINGDOM | | 608,124 |
United States of America - 0.9% |
Cognizant Technology Solutions Corp. Class A (a) | 6,300 | | 419,895 |
CTC Media, Inc. | 20,050 | | 168,220 |
Universal Display Corp. (a) | 9,027 | | 295,905 |
TOTAL UNITED STATES OF AMERICA | | 884,020 |
TOTAL COMMON STOCKS (Cost $67,155,590) |
72,575,102
|
Nonconvertible Preferred Stocks - 1.9% |
| | | |
Korea (South) - 1.0% |
Hyundai Motor Co. Series 2 | 9,913 | | 650,066 |
Samsung Electronics Co. Ltd. | 467 | | 339,225 |
TOTAL KOREA (SOUTH) | | 989,291 |
Russia - 0.9% |
Sberbank (Savings Bank of the Russian Federation) (a) | 209,600 | | 441,379 |
Surgutneftegaz JSC | 833,750 | | 516,404 |
TOTAL RUSSIA | | 957,783 |
TOTAL NONCONVERTIBLE PREFERRED STOCKS (Cost $1,906,405) |
1,947,074
|
Nonconvertible Bonds - 7.3% |
| Principal
Amount | | |
Bermuda - 0.2% |
Qtel International Finance Ltd. 5% 10/19/25 (e) | | $ 200,000 | | 226,260 |
Canada - 0.2% |
Pacific Rubiales Energy Corp. 7.25% 12/12/21 (e) | | 200,000 | | 238,500 |
Cayman Islands - 0.1% |
Odebrecht Finance Ltd. 7.5% (e)(f) | | 100,000 | | 107,000 |
Chile - 0.1% |
Corporacion Nacional del Cobre de Chile (Codelco) 6.15% 10/24/36 (e) | | 100,000 | | 130,477 |
Nonconvertible Bonds - continued |
| Principal
Amount | | Value |
Costa Rica - 0.2% |
Instituto Costarricense de Electricidad 6.95% 11/10/21 (e) | | $ 200,000 | | $ 222,500 |
Croatia - 0.2% |
Agrokor d.d. 8.875% 2/1/20 (e) | | 200,000 | | 208,000 |
Georgia - 0.2% |
JSC Georgian Railway 7.75% 7/11/22 (e) | | 200,000 | | 224,000 |
Guatemala - 0.1% |
Industrial Senior Trust 5.5% 11/1/22 (e) | | 100,000 | | 101,000 |
Indonesia - 0.8% |
PT Pertamina Persero: | | | | |
5.25% 5/23/21 (e) | | 550,000 | | 611,875 |
6.5% 5/27/41 (e) | | 200,000 | | 237,000 |
TOTAL INDONESIA | | 848,875 |
Ireland - 0.2% |
Vnesheconombank Via VEB Finance PLC 5.375% 2/13/17 (e) | | 200,000 | | 219,250 |
Israel - 0.2% |
Israel Electric Corp. Ltd. 6.7% 2/10/17 (e) | | 200,000 | | 218,500 |
Kazakhstan - 0.2% |
Zhaikmunai Finance BV 10.5% 10/19/15 (e) | | 150,000 | | 164,625 |
Mexico - 0.4% |
Petroleos Mexicanos: | | | | |
5.5% 1/21/21 | | 250,000 | | 294,000 |
6.625% (e)(f) | | 100,000 | | 107,250 |
TOTAL MEXICO | | 401,250 |
Netherlands - 0.8% |
Access Finance BV 7.25% 7/25/17 (e) | | 200,000 | | 209,500 |
KazMunaiGaz Finance Sub BV: | | | | |
6.375% 4/9/21 (e) | | 100,000 | | 118,750 |
9.125% 7/2/18 (e) | | 150,000 | | 195,000 |
11.75% 1/23/15 (e) | | 100,000 | | 119,880 |
Majapahit Holding BV 8% 8/7/19 (e) | | 100,000 | | 127,000 |
TOTAL NETHERLANDS | | 770,130 |
Philippines - 0.2% |
Power Sector Assets and Liabilities Management Corp. 7.39% 12/2/24 (e) | | 125,000 | | 174,850 |
Nonconvertible Bonds - continued |
| Principal
Amount | | Value |
Sweden - 0.2% |
PKO Finance AB 4.63% 9/26/22 (e) | | $ 200,000 | | $ 206,500 |
Trinidad & Tobago - 0.1% |
Petroleum Co. of Trinidad & Tobago Ltd. 9.75% 8/14/19 (e) | | 100,000 | | 132,000 |
Turkey - 0.1% |
Akbank T.A.S. 3.875% 10/24/17 (e) | | 150,000 | | 148,500 |
United States of America - 0.5% |
Pemex Project Funding Master Trust: | | | | |
6.625% 6/15/35 | | 200,000 | | 251,000 |
8.625% 2/1/22 | | 175,000 | | 221,375 |
TOTAL UNITED STATES OF AMERICA | | 472,375 |
Venezuela - 2.3% |
Petroleos de Venezuela SA: | | | | |
4.9% 10/28/14 | | 1,100,000 | | 1,014,750 |
5.375% 4/12/27 | | 400,000 | | 251,000 |
5.5% 4/12/37 | | 600,000 | | 363,000 |
8.5% 11/2/17 (e) | | 450,000 | | 402,750 |
12.75% 2/17/22 (e) | | 300,000 | | 306,750 |
TOTAL VENEZUELA | | 2,338,250 |
TOTAL NONCONVERTIBLE BONDS (Cost $6,911,731) |
7,552,842
|
Government Obligations - 17.2% |
|
Aruba - 0.2% |
Aruba Government 4.625% 9/14/23 (e) | | 200,000 | | 199,500 |
Barbados - 0.1% |
Barbados Government 7% 8/4/22 (e) | | 100,000 | | 101,500 |
Belarus - 0.3% |
Belarus Republic: | | | | |
8.75% 8/3/15 (Reg. S) | | 225,000 | | 222,188 |
8.95% 1/26/18 | | 100,000 | | 98,750 |
TOTAL BELARUS | | 320,938 |
Belize - 0.1% |
Belize Government 8.5% 2/20/29 (c)(e) | | 150,000 | | 60,000 |
Bermuda - 0.1% |
Bermuda Government 5.603% 7/20/20 (e) | | 100,000 | | 116,500 |
Government Obligations - continued |
| Principal
Amount | | Value |
Bolivia - 0.2% |
Plurinational State of Bolivia 4.875% 10/29/22 (e) | | $ 200,000 | | $ 200,500 |
Brazil - 1.3% |
Brazilian Federative Republic: | | | | |
7.125% 1/20/37 | | 200,000 | | 300,500 |
10.125% 5/15/27 | | 150,000 | | 271,500 |
12.25% 3/6/30 | | 350,000 | | 721,000 |
TOTAL BRAZIL | | 1,293,000 |
Cayman Islands - 0.1% |
Cayman Island Government 5.95% 11/24/19 (e) | | 100,000 | | 116,500 |
Colombia - 0.2% |
Colombian Republic 10.375% 1/28/33 | | 90,000 | | 165,150 |
Congo - 0.1% |
Congo Republic 3% 6/30/29 (d) | | 95,000 | | 79,800 |
Croatia - 0.5% |
Croatia Republic: | | | | |
6.25% 4/27/17 (e) | | 200,000 | | 219,500 |
6.375% 3/24/21 (e) | | 200,000 | | 227,000 |
6.625% 7/14/20 (e) | | 100,000 | | 115,130 |
TOTAL CROATIA | | 561,630 |
Ecuador - 0.2% |
Ecuador Republic 9.375% 12/15/15 (e) | | 236,000 | | 238,360 |
El Salvador - 0.2% |
El Salvador Republic 7.375% 12/1/19 (e) | | 175,000 | | 203,875 |
Ghana - 0.1% |
Ghana Republic 8.5% 10/4/17 (e) | | 100,000 | | 116,000 |
Guatemala - 0.2% |
Guatemalan Republic 5.75% 6/6/22 (e) | | 200,000 | | 228,500 |
Hungary - 0.5% |
Hungarian Republic: | | | | |
4.75% 2/3/15 | | 365,000 | | 373,687 |
7.625% 3/29/41 | | 100,000 | | 118,000 |
TOTAL HUNGARY | | 491,687 |
Government Obligations - continued |
| Principal
Amount | | Value |
Iceland - 0.2% |
Republic of Iceland: | | | | |
4.875% 6/16/16 (e) | | $ 100,000 | | $ 104,625 |
5.875% 5/11/22 (e) | | 100,000 | | 109,750 |
TOTAL ICELAND | | 214,375 |
Indonesia - 0.4% |
Indonesian Republic: | | | | |
7.75% 1/17/38 (e) | | 175,000 | | 264,915 |
8.5% 10/12/35 (e) | | 100,000 | | 160,250 |
TOTAL INDONESIA | | 425,165 |
Iraq - 0.5% |
Republic of Iraq 5.8% 1/15/28 (Reg. S) | | 550,000 | | 514,250 |
Ivory Coast - 0.5% |
Ivory Coast 3.75% 12/31/32 (c)(d) | | 575,000 | | 516,063 |
Latvia - 0.2% |
Latvian Republic 5.25% 2/22/17 (e) | | 200,000 | | 220,500 |
Lebanon - 0.5% |
Lebanese Republic: | | | | |
6.1% 10/4/22 | | 190,000 | | 192,613 |
11.625% 5/11/16 (Reg. S) | | 250,000 | | 305,000 |
TOTAL LEBANON | | 497,613 |
Lithuania - 0.5% |
Lithuanian Republic: | | | | |
6.125% 3/9/21 (e) | | 100,000 | | 119,750 |
6.625% 2/1/22 (e) | | 200,000 | | 247,000 |
7.375% 2/11/20 (e) | | 100,000 | | 127,125 |
TOTAL LITHUANIA | | 493,875 |
Mexico - 0.7% |
United Mexican States: | | | | |
5.75% 10/12/10 | | 124,000 | | 146,320 |
6.05% 1/11/40 | | 200,000 | | 266,000 |
6.75% 9/27/34 | | 200,000 | | 282,000 |
TOTAL MEXICO | | 694,320 |
Namibia - 0.2% |
Republic of Namibia 5.5% 11/3/21 (e) | | 200,000 | | 223,320 |
Government Obligations - continued |
| Principal
Amount | | Value |
Netherlands - 0.3% |
Republic of Angola 7% 8/16/19 (Issued by Northern Lights III BV for Republic of Angola) (Reg. S) | | $ 250,000 | | $ 279,375 |
Nigeria - 0.6% |
Republic of Nigeria 6.75% 1/28/21 (e) | | 550,000 | | 631,125 |
Panama - 0.3% |
Panamanian Republic: | | | | |
8.875% 9/30/27 | | 55,000 | | 89,238 |
9.375% 4/1/29 | | 150,000 | | 257,250 |
TOTAL PANAMA | | 346,488 |
Peru - 0.6% |
Peruvian Republic 8.75% 11/21/33 | | 345,000 | | 600,300 |
Philippines - 1.1% |
Philippine Republic: | | | | |
6.375% 10/23/34 | | 150,000 | | 208,500 |
7.75% 1/14/31 | | 125,000 | | 193,125 |
10.625% 3/16/25 | | 425,000 | | 746,938 |
TOTAL PHILIPPINES | | 1,148,563 |
Poland - 0.2% |
Polish Government: | | | | |
5% 3/23/22 | | 35,000 | | 40,819 |
6.375% 7/15/19 | | 135,000 | | 168,075 |
TOTAL POLAND | | 208,894 |
Qatar - 0.3% |
State of Qatar 5.75% 1/20/42 (e) | | 200,000 | | 257,000 |
Romania - 0.2% |
Romanian Republic 6.75% 2/7/22 (e) | | 190,000 | | 219,450 |
Russia - 1.7% |
Russian Federation: | | | | |
5.625% 4/4/42 (e) | | 200,000 | | 241,000 |
7.5% 3/31/30 (Reg. S) | | 697,500 | | 882,338 |
11% 7/24/18 (Reg. S) | | 200,000 | | 293,000 |
12.75% 6/24/28 (Reg. S) | | 175,000 | | 345,188 |
TOTAL RUSSIA | | 1,761,526 |
Senegal - 0.2% |
Republic of Senegal 8.75% 5/13/21 (e) | | 200,000 | | 242,000 |
Serbia - 0.0% |
Republic of Serbia 6.75% 11/1/24 (e) | | 41,667 | | 41,250 |
Government Obligations - continued |
| Principal
Amount | | Value |
Slovakia - 0.2% |
Slovakia Republic 4.375% 5/21/22 (e) | | $ 200,000 | | $ 214,000 |
Slovenia - 0.2% |
Republic of Slovenia 5.5% 10/26/22 (e) | | 200,000 | | 199,500 |
South Africa - 0.1% |
South African Republic 4.665% 1/17/24 | | 100,000 | | 110,250 |
Sri Lanka - 0.3% |
Democratic Socialist Republic of Sri Lanka: | | | | |
5.875% 7/25/22 (e) | | 200,000 | | 221,000 |
6.25% 10/4/20 (e) | | 100,000 | | 112,500 |
TOTAL SRI LANKA | | 333,500 |
Turkey - 1.3% |
Turkish Republic: | | | | |
7% 6/5/20 | | 300,000 | | 375,000 |
7.5% 7/14/17 | | 100,000 | | 121,000 |
11.875% 1/15/30 | | 450,000 | | 855,000 |
TOTAL TURKEY | | 1,351,000 |
Ukraine - 0.3% |
Ukraine Government: | | | | |
7.75% 9/23/20 (e) | | 100,000 | | 104,370 |
9.25% 7/24/17 (e) | | 200,000 | | 217,760 |
TOTAL UKRAINE | | 322,130 |
Uruguay - 0.1% |
Uruguay Republic 7.625% 3/21/36 | | 75,000 | | 116,250 |
Venezuela - 0.9% |
Venezuelan Republic: | | | | |
7.75% 10/13/19 (Reg. S) | | 85,000 | | 73,738 |
11.75% 10/21/26 (Reg. S) | | 300,000 | | 300,750 |
11.95% 8/5/31 (Reg. S) | | 350,000 | | 354,375 |
12.75% 8/23/22 | | 135,000 | | 144,113 |
TOTAL VENEZUELA | | 872,976 |
Zambia - 0.2% |
Republic of Zambia 5.375% 9/20/22 (e) | | 200,000 | | 201,400 |
TOTAL GOVERNMENT OBLIGATIONS (Cost $15,928,776) |
17,749,898
|
Money Market Funds - 3.0% |
| Shares | | Value |
Fidelity Cash Central Fund, 0.19% (b)
(Cost $3,099,243) | 3,099,243 | | $ 3,099,243 |
TOTAL INVESTMENT PORTFOLIO - 99.9% (Cost $95,001,745) | | 102,924,159 |
NET OTHER ASSETS (LIABILITIES) - 0.1% | | 102,208 |
NET ASSETS - 100% | $ 103,026,367 |
Legend |
(a) Non-income producing |
(b) Affiliated fund that is available only to investment companies and other accounts managed by Fidelity Investments. The rate quoted is the annualized seven-day yield of the fund at period end. A complete unaudited listing of the fund's holdings as of its most recent quarter end is available upon request. In addition, each Fidelity Central Fund's financial statements, which are not covered by the Fund's Report of Independent Registered Public Accounting Firm, are available on the SEC's website or upon request. |
(c) Non-income producing - Security is in default. |
(d) Security initially issued at one coupon which converts to a higher coupon at a specified date. The rate shown is the rate at period end. |
(e) Security exempt from registration under Rule 144A of the Securities Act of 1933. These securities may be resold in transactions exempt from registration, normally to qualified institutional buyers. At the end of the period, the value of these securities amounted to $11,907,822 or 11.6% of net assets. |
(f) Security is perpetual in nature with no stated maturity date. |
Affiliated Central Funds |
Information regarding fiscal year to date income earned by the Fund from investments in Fidelity Central Funds is as follows: |
Fund | Income earned |
Fidelity Cash Central Fund | $ 3,818 |
Fidelity Securities Lending Cash Central Fund | 315 |
Total | $ 4,133 |
Other Information |
Categorizations in the Schedule of Investments are based on country or territory of incorporation. |
The following is a summary of the inputs used, as of October 31, 2012, involving the Fund's assets and liabilities carried at fair value. The inputs or methodology used for valuing securities may not be an indication of the risk associated with investing in those securities. For more information on valuation inputs, and their aggregation into the levels used in the table below, please refer to the Security Valuation section in the accompanying Notes to Financial Statements. |
Valuation Inputs at Reporting Date: |
Description | Total | Level 1 | Level 2 | Level 3 |
Investments in Securities: | | | | |
Equities: | | | | |
Consumer Discretionary | $ 6,231,147 | $ 6,231,147 | $ - | $ - |
Consumer Staples | 6,577,159 | 6,577,159 | - | - |
Energy | 9,569,545 | 9,569,545 | - | - |
Financials | 19,085,912 | 18,331,132 | 754,780 | - |
Health Care | 947,599 | 947,599 | - | - |
Industrials | 5,289,474 | 5,289,474 | - | - |
Information Technology | 10,115,607 | 8,719,752 | 1,395,855 | - |
Materials | 9,131,743 | 8,671,551 | 460,192 | - |
Telecommunication Services | 5,177,656 | 4,888,469 | 289,187 | - |
Utilities | 2,396,334 | 2,122,877 | 273,457 | - |
Corporate Bonds | 7,552,842 | - | 7,552,842 | - |
Government Obligations | 17,749,898 | - | 17,749,898 | - |
Money Market Funds | 3,099,243 | 3,099,243 | - | - |
Total Investments in Securities: | $ 102,924,159 | $ 74,447,948 | $ 28,476,211 | $ - |
The composition of credit quality ratings as a percentage of net assets is as follows (Unaudited): |
AAA,AA,A | 1.6% |
BBB | 10.7% |
BB | 4.5% |
B | 5.0% |
CCC,CC,C | 0.3% |
Not Rated | 2.4% |
Equities | 72.4% |
Short-Term Investments and
Net Other Assets | 3.1% |
| 100.0% |
We have used ratings from Moody's Investors Service, Inc. Where Moody's® ratings are not available, we have used S&P® ratings. All ratings are as of the date indicated and do not reflect subsequent changes. |
See accompanying notes which are an integral part of the financial statements.
Annual Report
Fidelity Total Emerging Markets Fund
Statement of Assets and Liabilities
| October 31, 2012 |
| | |
Assets | | |
Investment in securities, at value - See accompanying schedule: Unaffiliated issuers (cost $91,902,502) | $ 99,824,916 | |
Fidelity Central Funds (cost $3,099,243) | 3,099,243 | |
Total Investments (cost $95,001,745) | | $ 102,924,159 |
Cash | | 705,020 |
Foreign currency held at value (cost $27,710) | | 27,720 |
Receivable for investments sold | | 768,066 |
Receivable for fund shares sold | | 90,619 |
Dividends receivable | | 92,479 |
Interest receivable | | 361,664 |
Distributions receivable from Fidelity Central Funds | | 312 |
Receivable from investment adviser for expense reductions | | 32,905 |
Other receivables | | 7,009 |
Total assets | | 105,009,953 |
| | |
Liabilities | | |
Payable for investments purchased | $ 1,645,445 | |
Payable for fund shares redeemed | 67,594 | |
Accrued management fee | 69,068 | |
Distribution and service plan fees payable | 8,928 | |
Other affiliated payables | 20,243 | |
Other payables and accrued expenses | 172,308 | |
Total liabilities | | 1,983,586 |
| | |
Net Assets | | $ 103,026,367 |
Net Assets consist of: | | |
Paid in capital | | $ 95,354,127 |
Undistributed net investment income | | 1,406,377 |
Accumulated undistributed net realized gain (loss) on investments and foreign currency transactions | | (1,593,639) |
Net unrealized appreciation (depreciation) on investments and assets and liabilities in foreign currencies | | 7,859,502 |
Net Assets | | $ 103,026,367 |
See accompanying notes which are an integral part of the financial statements.
Annual Report
Fidelity Total Emerging Markets Fund
Financial Statements - continued
Statement of Assets and Liabilities - continued
| October 31, 2012 |
| | |
Calculation of Maximum Offering Price Class A:
Net Asset Value and redemption price per share ($7,675,347 ÷ 706,507 shares) | | $ 10.86 |
| | |
Maximum offering price per share (100/94.25 of $10.86) | | $ 11.52 |
Class T:
Net Asset Value and redemption price per share ($5,822,909 ÷ 537,125 shares) | | $ 10.84 |
| | |
Maximum offering price per share (100/96.50 of $10.84) | | $ 11.23 |
Class C:
Net Asset Value and offering price per share ($5,824,450 ÷ 539,492 shares)A | | $ 10.80 |
| | |
Total Emerging Markets:
Net Asset Value, offering price and redemption price per share ($81,416,417 ÷ 7,478,534 shares) | | $ 10.89 |
| | |
Institutional Class:
Net Asset Value, offering price and redemption price per share ($2,287,244 ÷ 210,097 shares) | | $ 10.89 |
A Redemption price per share is equal to net asset value less any applicable contingent deferred sales charge.
See accompanying notes which are an integral part of the financial statements.
Annual Report
Statement of Operations
| | For the period
November 1, 2011
(commencement of
operations) to
October 31, 2012 |
| | |
Investment Income | | |
Dividends | | $ 1,585,174 |
Interest | | 1,369,434 |
Income from Fidelity Central Funds | | 4,133 |
Income before foreign taxes withheld | | 2,958,741 |
Less foreign taxes withheld | | (172,929) |
Total income | | 2,785,812 |
| | |
Expenses | | |
Management fee | $ 633,456 | |
Transfer agent fees | 147,018 | |
Distribution and service plan fees | 91,027 | |
Accounting and security lending fees | 40,641 | |
Custodian fees and expenses | 250,107 | |
Independent trustees' compensation | 459 | |
Registration fees | 129,540 | |
Audit | 59,305 | |
Legal | 288 | |
Miscellaneous | 484 | |
Total expenses before reductions | 1,352,325 | |
Expense reductions | (179,390) | 1,172,935 |
Net investment income (loss) | | 1,612,877 |
Realized and Unrealized Gain (Loss) Net realized gain (loss) on: | | |
Investment securities: | | |
Unaffiliated issuers (net of foreign taxes of $2,465) | (1,514,743) | |
Foreign currency transactions | (71,319) | |
Total net realized gain (loss) | | (1,586,062) |
Change in net unrealized appreciation (depreciation) on: Investment securities (net of increase in deferred foreign taxes of $61,936) | 7,860,478 | |
Assets and liabilities in foreign currencies | (976) | |
Total change in net unrealized appreciation (depreciation) | | 7,859,502 |
Net gain (loss) | | 6,273,440 |
Net increase (decrease) in net assets resulting from operations | | $ 7,886,317 |
See accompanying notes which are an integral part of the financial statements.
Annual Report
Fidelity Total Emerging Markets Fund
Financial Statements - continued
Statement of Changes in Net Assets
| For the period
November 1, 2011
(commencement of
operations) to
October 31, 2012 |
Increase (Decrease) in Net Assets | |
Operations | |
Net investment income (loss) | $ 1,612,877 |
Net realized gain (loss) | (1,586,062) |
Change in net unrealized appreciation (depreciation) | 7,859,502 |
Net increase (decrease) in net assets resulting from operations | 7,886,317 |
Distributions to shareholders from net investment income | (96,645) |
Share transactions - net increase (decrease) | 95,209,478 |
Redemption fees | 27,217 |
Total increase (decrease) in net assets | 103,026,367 |
| |
Net Assets | |
Beginning of period | - |
End of period (including undistributed net investment income of $1,406,377) | $ 103,026,367 |
See accompanying notes which are an integral part of the financial statements.
Annual Report
Financial Highlights - Class A
Period ended October 31, | 2012 F |
Selected Per-Share Data | |
Net asset value, beginning of period | $ 10.00 |
Income from Investment Operations | |
Net investment income (loss) C | .20 |
Net realized and unrealized gain (loss) | .68 |
Total from investment operations | .88 |
Distributions from net investment income | (.02) |
Redemption fees added to paid in capital C, H | - |
Net asset value, end of period | $ 10.86 |
Total Return A, B | 8.80% |
Ratios to Average Net Assets D, G | |
Expenses before reductions | 1.87% |
Expenses net of fee waivers, if any | 1.65% |
Expenses net of all reductions | 1.62% |
Net investment income (loss) | 1.92% |
Supplemental Data | |
Net assets, end of period (000 omitted) | $ 7,675 |
Portfolio turnover rate E | 70% |
A Total returns would have been lower if certain expenses had not been reduced during the applicable periods shown.
B Total returns do not include the effect of the sales charges.
C Calculated based on average shares outstanding during the period.
D Fees and expenses of any underlying Fidelity Central Funds are not included in the Fund's expense ratio. The Fund indirectly bears its proportionate share of the expenses of any underlying Fidelity Central Funds.
E Amount does not include the portfolio activity of any underlying Fidelity Central Funds.
F For the period November 1, 2011 (commencement of operations) to October 31, 2012.
G Expense ratios reflect operating expenses of the class. Expenses before reductions do not reflect amounts reimbursed by the investment adviser or reductions from brokerage service arrangements or reductions from other expense offset arrangements and do not represent the amount paid by the class during periods when reimbursements or reductions occur. Expense ratios before reductions for start-up periods may not be representative of longer-term operating periods. Expenses net of fee waivers reflect expenses after reimbursement by the investment adviser but prior to reductions from brokerage service arrangements or other expense offset arrangements. Expenses net of all reductions represent the net expenses paid by the class.
H Amount represents less than $.01 per share.
See accompanying notes which are an integral part of the financial statements.
Annual Report
Financial Highlights - Class T
Period ended October 31, | 2012 F |
Selected Per-Share Data | |
Net asset value, beginning of period | $ 10.00 |
Income from Investment Operations | |
Net investment income (loss) C | .17 |
Net realized and unrealized gain (loss) | .68 |
Total from investment operations | .85 |
Distributions from net investment income | (.01) |
Redemption fees added to paid in capital C, H | - |
Net asset value, end of period | $ 10.84 |
Total Return A, B | 8.56% |
Ratios to Average Net Assets D, G | |
Expenses before reductions | 2.10% |
Expenses net of fee waivers, if any | 1.90% |
Expenses net of all reductions | 1.87% |
Net investment income (loss) | 1.67% |
Supplemental Data | |
Net assets, end of period (000 omitted) | $ 5,823 |
Portfolio turnover rate E | 70% |
A Total returns would have been lower if certain expenses had not been reduced during the applicable periods shown.
B Total returns do not include the effect of the sales charges.
C Calculated based on average shares outstanding during the period.
D Fees and expenses of any underlying Fidelity Central Funds are not included in the Fund's expense ratio. The Fund indirectly bears its proportionate share of the expenses of any underlying Fidelity Central Funds.
E Amount does not include the portfolio activity of any underlying Fidelity Central Funds.
F For the period November 1, 2011 (commencement of operations) to October 31, 2012.
G Expense ratios reflect operating expenses of the class. Expenses before reductions do not reflect amounts reimbursed by the investment adviser or reductions from brokerage service arrangements or reductions from other expense offset arrangements and do not represent the amount paid by the class during periods when reimbursements or reductions occur. Expense ratios before reductions for start-up periods may not be representative of longer-term operating periods. Expenses net of fee waivers reflect expenses after reimbursement by the investment adviser but prior to reductions from brokerage service arrangements or other expense offset arrangements. Expenses net of all reductions represent the net expenses paid by the class.
H Amount represents less than $.01 per share.
See accompanying notes which are an integral part of the financial statements.
Annual Report
Financial Highlights - Class C
Period ended October 31, | 2012 F |
Selected Per-Share Data | |
Net asset value, beginning of period | $ 10.00 |
Income from Investment Operations | |
Net investment income (loss) C | .12 |
Net realized and unrealized gain (loss) | .69 |
Total from investment operations | .81 |
Distributions from net investment income | (.01) |
Redemption fees added to paid in capital C, H | - |
Net asset value, end of period | $ 10.80 |
Total Return A, B | 8.07% |
Ratios to Average Net Assets D, G | |
Expenses before reductions | 2.63% |
Expenses net of fee waivers, if any | 2.40% |
Expenses net of all reductions | 2.37% |
Net investment income (loss) | 1.17% |
Supplemental Data | |
Net assets, end of period (000 omitted) | $ 5,824 |
Portfolio turnover rate E | 70% |
A Total returns would have been lower if certain expenses had not been reduced during the applicable periods shown.
B Total returns do not include the effect of the contingent deferred sales charge.
C Calculated based on average shares outstanding during the period.
D Fees and expenses of any underlying Fidelity Central Funds are not included in the Fund's expense ratio. The Fund indirectly bears its proportionate share of the expenses of any underlying Fidelity Central Funds.
E Amount does not include the portfolio activity of any underlying Fidelity Central Funds.
F For the period November 1, 2011 (commencement of operations) to October 31, 2012.
G Expense ratios reflect operating expenses of the class. Expenses before reductions do not reflect amounts reimbursed by the investment adviser or reductions from brokerage service arrangements or reductions from other expense offset arrangements and do not represent the amount paid by the class during periods when reimbursements or reductions occur. Expense ratios before reductions for start-up periods may not be representative of longer-term operating periods. Expenses net of fee waivers reflect expenses after reimbursement by the investment adviser but prior to reductions from brokerage service arrangements or other expense offset arrangements. Expenses net of all reductions represent the net expenses paid by the class.
H Amount represents less than $.01 per share.
See accompanying notes which are an integral part of the financial statements.
Annual Report
Financial Highlights - Total Emerging Markets
Period ended October 31, | 2012 E |
Selected Per-Share Data | |
Net asset value, beginning of period | $ 10.00 |
Income from Investment Operations | |
Net investment income (loss) B | .22 |
Net realized and unrealized gain (loss) | .69 |
Total from investment operations | .91 |
Distributions from net investment income | (.02) |
Redemption fees added to paid in capital B, G | - |
Net asset value, end of period | $ 10.89 |
Total Return A | 9.15% |
Ratios to Average Net Assets C, F | |
Expenses before reductions | 1.60% |
Expenses net of fee waivers, if any | 1.40% |
Expenses net of all reductions | 1.38% |
Net investment income (loss) | 2.16% |
Supplemental Data | |
Net assets, end of period (000 omitted) | $ 81,416 |
Portfolio turnover rate D | 70% |
A Total returns would have been lower if certain expenses had not been reduced during the applicable periods shown.
B Calculated based on average shares outstanding during the period.
C Fees and expenses of any underlying Fidelity Central Funds are not included in the Fund's expense ratio. The Fund indirectly bears its proportionate share of the expenses of any underlying Fidelity Central Funds.
D Amount does not include the portfolio activity of any underlying Fidelity Central Funds.
E For the period November 1, 2011 (commencement of operations) to October 31, 2012.
F Expense ratios reflect operating expenses of the class. Expenses before reductions do not reflect amounts reimbursed by the investment adviser or reductions from brokerage service arrangements or reductions from other expense offset arrangements and do not represent the amount paid by the class during periods when reimbursements or reductions occur. Expense ratios before reductions for start-up periods may not be representative of longer-term operating periods. Expenses net of fee waivers reflect expenses after reimbursement by the investment adviser but prior to reductions from brokerage service arrangements or other expense offset arrangements. Expenses net of all reductions represent the net expenses paid by the class.
G Amount represents less than $.01 per share.
See accompanying notes which are an integral part of the financial statements.
Annual Report
Financial Highlights - Institutional Class
Period ended October 31, | 2012 E |
Selected Per-Share Data | |
Net asset value, beginning of period | $ 10.00 |
Income from Investment Operations | |
Net investment income (loss) B | .22 |
Net realized and unrealized gain (loss) | .69 |
Total from investment operations | .91 |
Distributions from net investment income | (.02) |
Redemption fees added to paid in capital B, G | - |
Net asset value, end of period | $ 10.89 |
Total Return A | 9.15% |
Ratios to Average Net Assets C, F | |
Expenses before reductions | 1.62% |
Expenses net of fee waivers, if any | 1.40% |
Expenses net of all reductions | 1.37% |
Net investment income (loss) | 2.17% |
Supplemental Data | |
Net assets, end of period (000 omitted) | $ 2,287 |
Portfolio turnover rate D | 70% |
A Total returns would have been lower if certain expenses had not been reduced during the applicable periods shown.
B Calculated based on average shares outstanding during the period.
C Fees and expenses of any underlying Fidelity Central Funds are not included in the Fund's expense ratio. The Fund indirectly bears its proportionate share of the expenses of any underlying Fidelity Central Funds.
D Amount does not include the portfolio activity of any underlying Fidelity Central Funds.
E For the period November 1, 2011 (commencement of operations) to October 31, 2012.
F Expense ratios reflect operating expenses of the class. Expenses before reductions do not reflect amounts reimbursed by the investment adviser or reductions from brokerage service arrangements or reductions from other expense offset arrangements and do not represent the amount paid by the class during periods when reimbursements or reductions occur. Expense ratios before reductions for start-up periods may not be representative of longer-term operating periods. Expenses net of fee waivers reflect expenses after reimbursement by the investment adviser but prior to reductions from brokerage service arrangements or other expense offset arrangements. Expenses net of all reductions represent the net expenses paid by the class.
G Amount represents less than $.01 per share.
See accompanying notes which are an integral part of the financial statements.
Annual Report
Fidelity Total Emerging Markets Fund
Notes to Financial Statements
For the period ended October 31, 2012
1. Organization.
Fidelity Total Emerging Markets Fund (the Fund) is a fund of Fidelity Investment Trust (the Trust) and is authorized to issue an unlimited number of shares. The Trust is registered under the Investment Company Act of 1940, as amended (the 1940 Act), as an open-end management investment company organized as a Massachusetts business trust. The Fund offers Class A, Class T, Class C, Total Emerging Markets and Institutional Class shares, each of which has equal rights as to assets and voting privileges. Each class has exclusive voting rights with respect to matters that affect that class. Investment income, realized and unrealized capital gains and losses, the common expenses of the Fund, and certain fund-level expense reductions, if any, are allocated on a pro-rata basis to each class based on the relative net assets of each class to the total net assets of the Fund. Each class differs with respect to transfer agent and distribution and service plan fees incurred. Certain expense reductions may also differ by class. The Fund's investments in emerging markets can be subject to social, economic, regulatory, and political uncertainties and can be extremely volatile.
2. Investments in Fidelity Central Funds.
The Fund invests in Fidelity Central Funds, which are open-end investment companies available only to other investment companies and accounts managed by Fidelity Management & Research Company (FMR) and its affiliates. The Fund's Schedule of Investments lists each of the Fidelity Central Funds held as of period end, as an investment of the Fund, but does not include the underlying holdings of each Fidelity Central Fund. As an Investing Fund, the Fund indirectly bears its proportionate share of the expenses of the underlying Fidelity Central Funds.
The Money Market Central Funds seek preservation of capital and current income and are managed by Fidelity Investments Money Management, Inc. (FIMM), an affiliate of FMR.
A complete unaudited list of holdings for each Fidelity Central Fund is available upon request or at the Securities and Exchange Commission (the SEC) web site at www.sec.gov. In addition, the financial statements of the Fidelity Central Funds, which are not covered by the Fund's Report of Independent Registered Public Accounting Firm, are available on the SEC web site or upon request.
3. Significant Accounting Policies.
The financial statements have been prepared in conformity with accounting principles generally accepted in the United States of America (GAAP), which require management to make certain estimates and assumptions at the date of the financial statements. Actual results could differ from those estimates. Subsequent events, if any, through the date that the financial statements were issued have been evaluated in the preparation of
Annual Report
Fidelity Total Emerging Markets Fund
Notes to Financial Statements - continued
3. Significant Accounting Policies - continued
the financial statements. The following summarizes the significant accounting policies of the Fund:
Security Valuation. Investments are valued as of 4:00 p.m. Eastern time on the last calendar day of the period. In accordance with valuation policies and procedures approved by the Board of Trustees (the Board), the Fund attempts to obtain prices from one or more third party pricing vendors or brokers to value its investments. When current market prices, quotations or rates are not readily available or reliable, securities will be fair valued in good faith by the FMR Fair Value Committee (the Committee), in accordance with procedures adopted by the Fund's Board. Factors used in determining fair value vary by security type and may include market or security specific events, changes in interest rates and credit quality. The frequency with which these procedures are used cannot be predicted and they may be utilized to a significant extent. The Committee oversees the Fund's valuation policies and procedures and is responsible for approving and reporting to the Board all fair value determinations.
The Fund categorizes the inputs to valuation techniques used to value its investments into a disclosure hierarchy consisting of three levels as shown below:
Level 1 - quoted prices in active markets for identical investments
Level 2 - other significant observable inputs (including quoted prices for similar investments, interest rates, prepayment speeds, etc.)
Level 3 - unobservable inputs (including the Fund's own assumptions based on the best information available)
Valuation techniques used to value the Fund's investments by major category are as follows:
Equity securities, including restricted securities, for which market quotations are readily available, are valued at the last reported sale price or official closing price as reported by a third party pricing vendor on the primary market or exchange on which they are traded and are categorized as Level 1 in the hierarchy. In the event there were no sales during the day or closing prices are not available, securities are valued at the last quoted bid price or may be valued using the last available price and are generally categorized as Level 2 in the hierarchy. For foreign equity securities, when significant market or security specific events arise, comparisons to the valuation of American Depositary Receipts (ADRs), futures contracts, Exchange-Traded Funds (ETFs) and certain indexes as well as quoted prices for similar securities are used and are categorized as Level 2 in the hierarchy. Utilizing these techniques may result in transfers between Level 1 and Level 2.
Debt securities, including restricted securities, are valued based on evaluated prices received from third party pricing vendors or from brokers who make markets in such
Annual Report
3. Significant Accounting Policies - continued
Security Valuation - continued
securities. For corporate bonds and foreign government and government agency obligations, pricing vendors utilize matrix pricing which considers yield or price of bonds of comparable quality, coupon, maturity and type as well as broker-supplied prices and are generally categorized as Level 2 in the hierarchy. When independent prices are unavailable or unreliable, debt securities may be valued utilizing pricing methodologies which consider similar factors that would be used by third party pricing vendors. These are generally categorized as Level 2 in the hierarchy but may be Level 3 depending on the circumstances.
Investments in open-end mutual funds, including the Fidelity Central Funds, are valued at their closing net asset value (NAV) each business day and are categorized as Level 1 in the hierarchy.
Changes in valuation techniques may result in transfers in or out of an assigned level within the disclosure hierarchy. The aggregate value of investments by input level, as of October 31, 2012, is included at the end of the Fund's Schedule of Investments.
Foreign Currency Translation. The Fund may use foreign currency contracts to facilitate transactions in foreign-denominated securities. Gains and losses from these transactions may arise from changes in the value of the foreign currency or if the counterparties do not perform under the contracts' terms.
Foreign-denominated assets, including investment securities, and liabilities are translated into U.S. dollars at the exchange rates at period end. Purchases and sales of investment securities, income and dividends received and expenses denominated in foreign currencies are translated into U.S. dollars at the exchange rate in effect on the transaction date.
The effects of exchange rate fluctuations on investments are included with the net realized and unrealized gain (loss) on investment securities. Other foreign currency transactions resulting in realized and unrealized gain (loss) are disclosed separately.
Investment Transactions and Income. For financial reporting purposes, the Fund's investment holdings and NAV include trades executed through the end of the last business day of the period. The NAV per share for processing shareholder transactions is calculated as of the close of business of the New York Stock Exchange (NYSE), normally 4:00 p.m. Eastern time and includes trades executed through the end of the prior business day. Gains and losses on securities sold are determined on the basis of identified cost. Dividend income is recorded on the ex-dividend date, except for certain dividends from foreign securities where the ex-dividend date may have passed, which are recorded as soon as the Fund is informed of the ex-dividend date. Non-cash dividends included in
Annual Report
Fidelity Total Emerging Markets Fund
Notes to Financial Statements - continued
3. Significant Accounting Policies - continued
Investment Transactions and Income - continued
dividend income, if any, are recorded at the fair market value of the securities received. Interest income and distributions from the Fidelity Central Funds are accrued as earned. Interest income includes coupon interest and amortization of premium and accretion of discount on debt securities. Investment income is recorded net of foreign taxes withheld where recovery of such taxes is uncertain. Debt obligations may be placed on non-accrual status and related interest income may be reduced by ceasing current accruals and writing off interest receivables when the collection of all or a portion of interest has become doubtful based on consistently applied procedures. A debt obligation is removed from non-accrual status when the issuer resumes interest payments or when collectability of interest is reasonably assured.
Expenses. Expenses directly attributable to a fund are charged to that fund. Expenses attributable to more than one fund are allocated among the respective funds on the basis of relative net assets or other appropriate methods. Expense estimates are accrued in the period to which they relate and adjustments are made when actual amounts are known.
Income Tax Information and Distributions to Shareholders. Each year, the Fund intends to qualify as a regulated investment company under Subchapter M of the Internal Revenue Code, including distributing substantially all of its taxable income and realized gains. As a result, no provision for income taxes is required. As of October 31, 2012, the Fund did not have any unrecognized tax benefits in the financial statements; nor is the Fund aware of any tax positions for which it is reasonably possible that the total amounts of unrecognized tax benefits will significantly change in the next twelve months. The Fund files a U.S. federal tax return, in addition to state and local tax returns as required. A fund's federal income tax returns are subject to examination by the Internal Revenue Service (IRS) for a period of three fiscal years after they are filed. State and local tax returns may be subject to examination for an additional fiscal year depending on the jurisdiction. Foreign taxes are provided for based on the Fund's understanding of the tax rules and rates that exist in the foreign markets in which it invests. The Fund is subject to a tax imposed on capital gains by certain countries in which it invests. An estimated deferred tax liability for net unrealized appreciation on the applicable securities is included in Other payables and accrued expenses on the Statement of Assets & Liabilities.
Distributions are declared and recorded on the ex-dividend date. Income dividends and capital gain distributions are declared separately for each class. Income and capital gain distributions are determined in accordance with income tax regulations, which may differ from GAAP. In addition, the Fund claimed a portion of the payment made to redeeming shareholders as a distribution for income tax purposes.
Annual Report
3. Significant Accounting Policies - continued
Income Tax Information and Distributions to Shareholders - continued
Capital accounts within the financial statements are adjusted for permanent book-tax differences. These adjustments have no impact on net assets or the results of operations. Temporary book-tax differences will reverse in a subsequent period.
Book-tax differences are primarily due to foreign currency transactions, certain foreign taxes, passive foreign investment companies (PFIC), market discount, capital loss carryforwards and losses deferred due to wash sales.
The federal tax cost of investment securities and unrealized appreciation (depreciation) as of period end were as follows:
Gross unrealized appreciation | $ 10,983,917 |
Gross unrealized depreciation | (3,416,206) |
Net unrealized appreciation (depreciation) on securities and other investments | $ 7,567,711 |
| |
Tax Cost | $ 95,356,448 |
The tax-based components of distributable earnings as of period end were as follows:
Undistributed ordinary income | $ 1,401,667 |
Capital loss carryforward | $ (1,234,216) |
Net unrealized appreciation (depreciation) | $ 7,566,725 |
Capital loss carryforwards are only available to offset future capital gains of the Fund to the extent provided by regulations and may be limited. Under the Regulated Investment Company Modernization Act of 2010 (the Act), the Fund is permitted to carry forward capital losses incurred in taxable years beginning after December 22, 2010 for an unlimited period and such capital losses are required to be used prior to any losses that expire. Capital loss carryforwards were as follows:
No expiration | |
Short-term | $ (1,234,216) |
The tax character of distributions paid was as follows:
| October 31, 2012 |
Ordinary Income | $ 96,645 |
Annual Report
Fidelity Total Emerging Markets Fund
Notes to Financial Statements - continued
3. Significant Accounting Policies - continued
Short-Term Trading (Redemption) Fees. Shares purchased by investors and held in the Fund less than 90 days are subject to a redemption fee equal to 1.50% of the net asset value of shares redeemed. All redemption fees, which reduce the proceeds of the shareholder redemption, are retained by the Fund and accounted for as an addition to paid in capital.
Restricted Securities. The Fund may invest in securities that are subject to legal or contractual restrictions on resale. These securities generally may be resold in transactions exempt from registration or to the public if the securities are registered. Disposal of these securities may involve time-consuming negotiations and expense, and prompt sale at an acceptable price may be difficult. Information regarding restricted securities is included at the end of the Fund's Schedule of Investments.
New Accounting Pronouncement. In December 2011, the Financial Accounting Standards Board issued Accounting Standard Update No. 2011-11, Disclosures about Offsetting Assets and Liabilities. The update creates new disclosure requirements requiring entities to disclose both gross and net information for derivatives and other financial instruments that are either offset in the Statement of Assets and Liabilities or subject to an enforceable master netting arrangement or similar agreement. The disclosure requirements are effective for annual reporting periods beginning on or after January 1, 2013, and interim periods within those annual periods. Management is currently evaluating the impact of the update's adoption on the Fund's financial statement disclosures.
4. Purchases and Sales of Investments.
Purchases and sales of securities, other than short-term securities, aggregated $144,030,449 and $50,601,679, respectively.
5. Fees and Other Transactions with Affiliates.
Management Fee. FMR and its affiliates provide the Fund with investment management related services for which the Fund pays a monthly management fee. The management fee is the sum of an individual fund fee rate that is based on an annual rate of .55% of the Fund's average net assets and an annualized group fee rate that averaged .26% during the period. The group fee rate is based upon the average net assets of all the mutual funds advised by FMR. The group fee rate decreases as assets under management increase and increases as assets under management decrease. For the period, the total annual management fee rate was .80% of the Fund's average net assets.
Annual Report
5. Fees and Other Transactions with Affiliates - continued
Distribution and Service Plan Fees. In accordance with Rule 12b-1 of the 1940 Act, the Fund has adopted separate Distribution and Service Plans for each class of shares. Certain classes pay Fidelity Distributors Corporation (FDC), an affiliate of FMR, separate Distribution and Service Fees, each of which is based on an annual percentage of each class' average net assets. In addition, FDC may pay financial intermediaries for selling shares of the Fund and providing shareholder support services. For the period, the Distribution and Service Fee rates, total fees and amounts retained by FDC were as follows:
| Distribution
Fee | Service
Fee | Total Fees | Retained
by FDC |
Class A | -% | .25% | $ 15,320 | $ 13,743 |
Class T | .25% | .25% | 22,574 | 15,459 |
Class C | .75% | .25% | 53,133 | 52,688 |
| | | $ 91,027 | $ 81,890 |
Sales Load. FDC may receive a front-end sales charge of up to 5.75% for selling Class A shares and 3.50% for selling Class T shares, some of which is paid to financial intermediaries for selling shares of the Fund. Depending on the holding period, FDC may receive contingent deferred sales charges levied on Class A, Class T, and Class C redemptions. The deferred sales charges range from 1.00% for Class C shares, 1.00% for certain purchases of Class A shares and .25% for certain purchases of Class T shares.
For the period, sales charge amounts retained by FDC were as follows:
| Retained
by FDC |
Class A | $ 2,010 |
Class T | 842 |
Class C* | 51 |
| $ 2,903 |
* When Class C shares are initially sold, FDC pays commissions from its own resources to financial intermediaries through which the sales are made.
Transfer Agent Fees. Fidelity Investments Institutional Operations Company, Inc. (FIIOC), an affiliate of FMR, is the transfer, dividend disbursing and shareholder servicing agent for each class of the Fund. FIIOC receives account fees and asset-based fees that vary according to the account size and type of account of the shareholders of the respective classes of the Fund. FIIOC pays for typesetting, printing and mailing of
Annual Report
Fidelity Total Emerging Markets Fund
Notes to Financial Statements - continued
5. Fees and Other Transactions with Affiliates - continued
Transfer Agent Fees - continued
shareholder reports, except proxy statements. For the period, transfer agent fees for each class were as follows:
| Amount | % of
Average
Net Assets |
Class A | $ 11,782 | .19 |
Class T | 8,511 | .19 |
Class C | 10,121 | .19 |
Total Emerging Markets | 112,796 | .19 |
Institutional Class | 3,808 | .18 |
| $ 147,018 | |
Accounting and Security Lending Fees. Fidelity Service Company, Inc. (FSC), an affiliate of FMR, maintains the Fund's accounting records. The accounting fee is based on the level of average net assets for each month. Under a separate contract, FSC administers the security lending program. The security lending fee is based on the number and duration of lending transactions.
Brokerage Commissions. The Fund placed a portion of its portfolio transactions with brokerage firms which are affiliates of the investment adviser. The commissions paid to these affiliated firms were $435 for the period.
6. Committed Line of Credit.
The Fund participates with other funds managed by FMR or an affiliate in a $4.25 billion credit facility (the "line of credit") to be utilized for temporary or emergency purposes to fund shareholder redemptions or for other short-term liquidity purposes. The Fund has agreed to pay commitment fees on its pro-rata portion of the line of credit, which amounted to $127 and is reflected in Miscellaneous expenses on the Statement of Operations. During the period, there were no borrowings on this line of credit.
7. Security Lending.
The Fund lends portfolio securities through a lending agent from time to time in order to earn additional income. For equity securities, a lending agent is used and may loan securities to certain qualified borrowers, including Fidelity Capital Markets (FCM), a broker-dealer affiliated with the Fund. On the settlement date of the loan, the Fund receives collateral (in the form of U.S. Treasury obligations, letters of credit and/or cash) against the loaned securities and maintains collateral in an amount not less than 100% of the market value of the loaned securities during the period of the loan. The market value of the loaned securities is determined at the close of business of the Fund and any
Annual Report
7. Security Lending - continued
additional required collateral is delivered to the Fund on the next business day. If the borrower defaults on its obligation to return the securities loaned because of insolvency or other reasons, a fund could experience delays and costs in recovering the securities loaned or in gaining access to the collateral. Any cash collateral received is invested in the Fidelity Securities Lending Cash Central Fund. At period end, there were no security loans outstanding. Security lending income represents the income earned on investing cash collateral, less rebates paid to borrowers and any lending agent fees associated with the loan, plus any premium payments received for lending certain types of securities. Security lending income is presented in the Statement of Operations as a component of income from Fidelity Central Funds. Total security lending income during the period amounted to $315. During the period, there were no securities loaned to FCM.
8. Expense Reductions.
Effective November 1, 2011, FMR contractually agreed to reimburse each class to the extent annual operating expenses exceeded certain levels of average net assets as noted in the table below. This reimbursement will remain in place through December 31, 2013. Some expenses, for example interest expense, including commitment fees, are excluded from this reimbursement.
The following classes were in reimbursement during the period:
| Expense
Limitations | Reimbursement
from adviser |
Class A | 1.65% | $ 13,791 |
Class T | 1.90% | 9,129 |
Class C | 2.40% | 12,487 |
Total Emerging Markets | 1.40% | 120,371 |
Institutional Class | 1.40% | 4,771 |
| | $ 160,549 |
Many of the brokers with whom FMR places trades on behalf of the Fund provided services to the Fund in addition to trade execution. These services included payments of certain expenses on behalf of the Fund totaling $18,638 for the period. In addition, through arrangements with the Fund's custodian, credits realized as a result of uninvested cash balances were used to reduce the Fund's expenses. During the period, these credits reduced the Fund's custody expenses by $203.
Annual Report
Fidelity Total Emerging Markets Fund
Notes to Financial Statements - continued
9. Distributions to Shareholders.
Distributions to shareholders of each class were as follows:
| Period ended
October 31,
2012 A |
From net investment income | |
Class A | $ 9,099 |
Class T | 4,204 |
Class C | 3,000 |
Total Emerging Markets | 75,940 |
Institutional Class | 4,402 |
Total | $ 96,645 |
A For the period November 1, 2011 (commencement of operations) to October 31, 2012.
10. Share Transactions.
Transactions for each class of shares were as follows:
| Shares | Dollars |
| Period ended
October 31,
2012 A | Period ended
October 31,
2012 A |
Class A | | |
Shares sold | 723,537 | $ 7,311,002 |
Reinvestment of distributions | 949 | 9,099 |
Shares redeemed | (17,979) | (179,387) |
Net increase (decrease) | 706,507 | $ 7,140,714 |
Class T | | |
Shares sold | 597,107 | $ 6,082,522 |
Reinvestment of distributions | 439 | 4,204 |
Shares redeemed | (60,421) | (637,924) |
Net increase (decrease) | 537,125 | $ 5,448,802 |
Class C | | |
Shares sold | 540,321 | $ 5,429,037 |
Reinvestment of distributions | 314 | 3,000 |
Shares redeemed | (1,143) | (12,081) |
Net increase (decrease) | 539,492 | $ 5,419,956 |
Total Emerging Markets | | |
Shares sold | 8,901,615 | $ 89,854,661 |
Reinvestment of distributions | 7,686 | 73,759 |
Shares redeemed | (1,430,767) | (14,834,512) |
Net increase (decrease) | 7,478,534 | $ 75,093,908 |
Institutional Class | | |
Shares sold | 209,638 | $ 2,101,696 |
Reinvestment of distributions | 459 | 4,402 |
Net increase (decrease) | 210,097 | $ 2,106,098 |
A For the period November 1, 2011 (commencement of operations) to October 31, 2012.
Annual Report
11. Other.
The Fund's organizational documents provide former and current trustees and officers with a limited indemnification against liabilities arising in connection with the performance of their duties to the Fund. In the normal course of business, the Fund may also enter into contracts that provide general indemnifications. The Fund's maximum exposure under these arrangements is unknown as this would be dependent on future claims that may be made against the Fund. The risk of material loss from such claims is considered remote.
At the end of the period, FMR or its affiliates were the owners of record of 32% of the total outstanding shares of the Fund.
Annual Report
To the Trustees of Fidelity Investment Trust and the Shareholders of Fidelity Total Emerging Markets Fund:
In our opinion, the accompanying statement of assets and liabilities, including the schedule of investments, and the related statements of operations and of changes in net assets and the financial highlights present fairly, in all material respects, the financial position of Fidelity Total Emerging Markets Fund (a fund of Fidelity Investment Trust) at October 31, 2012, the results of its operations for the year then ended, the changes in its net assets for the period indicated and the financial highlights for each of the period indicated, in conformity with accounting principles generally accepted in the United States of America. These financial statements and financial highlights (hereafter referred to as "financial statements") are the responsibility of the Fidelity Total Emerging Markets Fund's management. Our responsibility is to express an opinion on these financial statements based on our audits. We conducted our audits of these financial statements in accordance with the standards of the Public Company Accounting Oversight Board (United States). Those standards require that we plan and perform the audit to obtain reasonable assurance about whether the financial statements are free of material misstatement. An audit includes examining, on a test basis, evidence supporting the amounts and disclosures in the financial statements, assessing the accounting principles used and significant estimates made by management, and evaluating the overall financial statement presentation. We believe that our audits, which included confirmation of securities at October 31, 2012 by correspondence with the custodian and brokers, provide a reasonable basis for our opinion.
PricewaterhouseCoopers LLP
Boston, Massachusetts
December 17, 2012
Annual Report
The Trustees, Members of the Advisory Board, and executive officers of the trust and fund, as applicable, are listed below. The Board of Trustees governs the fund and is responsible for protecting the interests of shareholders. The Trustees are experienced executives who meet periodically throughout the year to oversee the fund's activities, review contractual arrangements with companies that provide services to the fund, oversee management of the risks associated with such activities and contractual arrangements, and review the fund's performance. Except for James C. Curvey, each of the Trustees oversees 236 funds advised by FMR or an affiliate. Mr. Curvey oversees 443 funds advised by FMR or an affiliate.
The Trustees hold office without limit in time except that (a) any Trustee may resign; (b) any Trustee may be removed by written instrument, signed by at least two-thirds of the number of Trustees prior to such removal; (c) any Trustee who requests to be retired or who has become incapacitated by illness or injury may be retired by written instrument signed by a majority of the other Trustees; and (d) any Trustee may be removed at any special meeting of shareholders by a two-thirds vote of the outstanding voting securities of the trust. Each Trustee who is not an interested person (as defined in the 1940 Act) (Independent Trustee), shall retire not later than the last day of the calendar year in which his or her 75th birthday occurs. The Independent Trustees may waive this mandatory retirement age policy with respect to individual Trustees. The executive officers and Advisory Board Members hold office without limit in time, except that any officer and Advisory Board Member may resign or may be removed by a vote of a majority of the Trustees at any regular meeting or any special meeting of the Trustees. Except as indicated, each individual has held the office shown or other offices in the same company for the past five years.
Experience, Skills, Attributes, and Qualifications of the Fund's Trustees. The Governance and Nominating Committee has adopted a statement of policy that describes the experience, qualifications, attributes, and skills that are necessary and desirable for potential Independent Trustee candidates (Statement of Policy). The Board believes that each Trustee satisfied at the time he or she was initially elected or appointed a Trustee, and continues to satisfy, the standards contemplated by the Statement of Policy. The Governance and Nominating Committee also engages professional search firms to help identify potential Independent Trustee candidates who have the experience, qualifications, attributes, and skills consistent with the Statement of Policy. From time to time, additional criteria based on the composition and skills of the current Independent Trustees, as well as experience or skills that may be appropriate in light of future changes to board composition, business conditions, and regulatory or other developments, have also been considered by the professional search firms and the Governance and Nominating Committee. In addition, the Board takes into account the Trustees' commitment and participation in Board and committee meetings, as well as their leadership of standing and ad hoc committees throughout their tenure.
In determining that a particular Trustee was and continues to be qualified to serve as a Trustee, the Board has considered a variety of criteria, none of which, in isolation, was controlling. The Board believes that, collectively, the Trustees have balanced and diverse experience, qualifications, attributes, and skills, which allow the Board to operate effectively in governing the fund and protecting the interests of shareholders. Information about the specific experience, skills, attributes, and qualifications of each Trustee, which in each case led to the Board's conclusion that the Trustee should serve (or continue to serve) as a trustee of the fund, is provided below.
Annual Report
Trustees and Officers - continued
Board Structure and Oversight Function. James C. Curvey is an interested person (as defined in the 1940 Act) and currently serves as Chairman. The Trustees have determined that an interested Chairman is appropriate and benefits shareholders because an interested Chairman has a personal and professional stake in the quality and continuity of services provided to the fund. Independent Trustees exercise their informed business judgment to appoint an individual of their choosing to serve as Chairman, regardless of whether the Trustee happens to be independent or a member of management. The Independent Trustees have determined that they can act independently and effectively without having an Independent Trustee serve as Chairman and that a key structural component for assuring that they are in a position to do so is for the Independent Trustees to constitute a substantial majority for the Board. The Independent Trustees also regularly meet in executive session. Ned C. Lautenbach serves as Chairman of the Independent Trustees and as such (i) acts as a liaison between the Independent Trustees and management with respect to matters important to the Independent Trustees and (ii) with management prepares agendas for Board meetings.
Fidelity funds are overseen by different Boards of Trustees. The fund's Board oversees Fidelity's equity and high income funds and another Board oversees Fidelity's investment-grade bond, money market, and asset allocation funds. The asset allocation funds may invest in Fidelity funds overseen by the fund's Board. The use of separate Boards, each with its own committee structure, allows the Trustees of each group of Fidelity funds to focus on the unique issues of the funds they oversee, including common research, investment, and operational issues. On occasion, the separate Boards establish joint committees to address issues of overlapping consequences for the Fidelity funds overseen by each Board.
The Trustees operate using a system of committees to facilitate the timely and efficient consideration of all matters of importance to the Trustees, the fund, and fund shareholders and to facilitate compliance with legal and regulatory requirements and oversight of the fund's activities and associated risks. The Board, acting through its committees, has charged FMR and its affiliates with (i) identifying events or circumstances the occurrence of which could have demonstrably adverse effects on the fund's business and/or reputation; (ii) implementing processes and controls to lessen the possibility that such events or circumstances occur or to mitigate the effects of such events or circumstances if they do occur; and (iii) creating and maintaining a system designed to evaluate continuously business and market conditions in order to facilitate the identification and implementation processes described in (i) and (ii) above. Because the day-to-day operations and activities of the fund are carried out by or through FMR, its affiliates and other service providers, the fund's exposure to risks is mitigated but not eliminated by the processes overseen by the Trustees. While each of the Board's committees has responsibility for overseeing different aspects of the fund's activities, oversight is exercised primarily through the Operations, Audit, and Compliance Committees. In addition, the Independent Trustees have worked with FMR to enhance the Board's oversight of investment and financial risks, legal and regulatory risks, technology risks, and operational risks, including the development of additional risk reporting to the Board. For example, a working group comprised of Independent Trustees and FMR has worked and continues to work to review the Fidelity funds' valuation-related activities, reporting and risk management. Appropriate personnel, including but not limited to the fund's Chief Compliance Officer (CCO), FMR's internal auditor, the independent accountants, the fund's Treasurer and portfolio management personnel, make periodic reports to the Board's committees, as appropriate, including an annual review of FMR's risk management program for the Fidelity funds. The responsibilities of each standing committee, including their oversight responsibilities, are described further under "Standing Committees of the Fund's Trustees."
Annual Report
The fund's Statement of Additional Information (SAI) includes more information about the Trustees. To request a free copy, call Fidelity at 1-877-208-0098.
Interested Trustees*:
Correspondence intended for each Trustee who is an interested person may be sent to Fidelity Investments, 82 Devonshire Street, Boston, Massachusetts 02109.
Name, Age; Principal Occupations and Other Relevant Experience+ |
James C. Curvey (77) |
| Year of Election or Appointment: 2007 Mr. Curvey is Trustee and Chairman of the Board of Trustees of certain Trusts. Mr. Curvey also serves as Trustee (2007-present) of other investment companies advised by FMR. Mr. Curvey is a Director of Fidelity Investments Money Management, Inc. (2009-present), Director of Fidelity Research & Analysis Co. (2009-present) and Director of FMR and FMR Co., Inc. (2007-present). Mr. Curvey is also Vice Chairman (2007-present) and Director of FMR LLC. In addition, Mr. Curvey serves as an Overseer for the Boston Symphony Orchestra and a member of the Trustees of Villanova University. Previously, Mr. Curvey was the Vice Chairman (2006-2007) and Director (2000-2007) of FMR Corp. |
Ronald P. O'Hanley (55) |
| Year of Election or Appointment: 2011 Mr. O'Hanley is Director of FMR Co., Inc. (2010-present), Director of Fidelity Investments Money Management, Inc. (2010-present), Director of Fidelity Research & Analysis Company (2010-present), President of Fidelity Asset Management and Corporate Services and a member of Fidelity's Executive Committee (2010-present). Previously, Mr. O'Hanley served as President and Chief Executive Officer of BNY Mellon Asset Management (2007-2010). Mr. O'Hanley also served as Vice Chairman of Bank New York Mellon Corp. and a member of that firm's Executive Committee. Prior to the 2007 merger of The Bank of New York and Mellon Financial Corporation, he was Vice Chairman of Mellon Financial Corporation and President and Chief Executive Officer of Mellon Asset Management. He joined Mellon in February 1997. Mr. O'Hanley currently serves as Chairman of the Boston Public Library Foundation Board of Directors and sits on the Board of Directors of Beth Israel Deaconess Medical Center, the Board of Trustees of the Marine Biological Laboratory and the Advisory Board of the Maxwell School of Citizenship and Public Administration at Syracuse University. Mr. O'Hanley also chairs the Council on Asset Management for the Financial Services Roundtable and is a member of the Board of Directors of Institutional Investor's U.S. Institute. |
* Trustees have been determined to be "Interested Trustees" by virtue of, among other things, their affiliation with the trust or various entities under common control with FMR.
+ The information above includes each Trustee's principal occupation during the last five years and other information relating to the experience, attributes, and skills relevant to each Trustee's qualifications to serve as a Trustee, which led to the conclusion that each Trustee should serve as a Trustee for the fund.
Annual Report
Independent Trustees:
Correspondence intended for each Independent Trustee (that is, the Trustees other than the Interested Trustees) may be sent to Fidelity Investments, P.O. Box 55235, Boston, Massachusetts 02205-5235.
Name, Age; Principal Occupations and Other Relevant Experience+ |
Dennis J. Dirks (64) |
| Year of Election or Appointment: 2005 Prior to his retirement in May 2003, Mr. Dirks was Chief Operating Officer and a member of the Board of The Depository Trust & Clearing Corporation (DTCC). He also served as President, Chief Operating Officer, and Board member of The Depository Trust Company (DTC) and President and Board member of the National Securities Clearing Corporation (NSCC). In addition, Mr. Dirks served as Chief Executive Officer and Board member of the Government Securities Clearing Corporation, Chief Executive Officer and Board member of the Mortgage-Backed Securities Clearing Corporation, as a Trustee and a member of the Finance Committee of Manhattan College (2005-2008), and as a Trustee and a member of the Finance Committee of AHRC of Nassau County (2006-2008). Mr. Dirks is a member of the Independent Directors Council (IDC) Governing Council (2010-present) and Board of Directors for The Brookville Center for Children's Services, Inc. (2009-present). |
Alan J. Lacy (59) |
| Year of Election or Appointment: 2008 Mr. Lacy serves as Senior Adviser (2007-present) of Oak Hill Capital Partners, L.P. (private equity). Mr. Lacy also served as Chief Executive Officer (2000-2005) and Vice Chairman (2005-2006) of Sears Holdings Corporation and Sears, Roebuck and Co. (retail). In addition, Mr. Lacy serves as a member of the Board of Directors of Dave & Buster's Entertainment, Inc. (restaurant and entertainment complexes, 2010-present), Earth Fare, Inc. (retail grocery, 2012-present), The Hillman Companies, Inc. (hardware wholesalers, 2010-present), and Bristol-Myers Squibb Company (global pharmaceuticals, 2008-present). Mr. Lacy is a member of the Board of Trustees of The National Parks Conservation Association (2006-present). Previously, Mr. Lacy served as Chairman of the Board of Trustees of the National Parks Conservation Association (2008-2011) and as a member of the Board of Directors for the Western Union Company (global money transfer, 2006-2011). |
Ned C. Lautenbach (68) |
| Year of Election or Appointment: 2000 Mr. Lautenbach is Chairman of the Independent Trustees of the Equity and High Income Funds (2006-present). Mr. Lautenbach currently serves as the Lead Director of the Eaton Corporation Board of Directors (diversified industrial, 1997-present). Mr. Lautenbach is Chairman of the Board of Directors of the Philharmonic Center for the Arts in Naples, Florida (2012-present) and a member of the Council on Foreign Relations (1994-present). Previously, Mr. Lautenbach was a Partner/Advisory Partner at Clayton, Dubilier & Rice, LLC (private equity investment, 1998-2010), as well as a Director of Sony Corporation (2006-2007). |
Joseph Mauriello (68) |
| Year of Election or Appointment: 2008 Prior to his retirement in January 2006, Mr. Mauriello served in numerous senior management positions including Deputy Chairman and Chief Operating Officer (2004-2005), and Vice Chairman of Financial Services (2002-2004) of KPMG LLP US (professional services, 1965-2005). Mr. Mauriello currently serves as a member of the Board of Directors of XL Group plc. (global insurance and re-insurance, 2006-present). Previously, Mr. Mauriello served as a Director of the Hamilton Funds of the Bank of New York (2006-2007) and of Arcadia Resources Inc. (health care services and products, 2007-2012). |
Robert W. Selander (62) |
| Year of Election or Appointment: 2011 Previously, Mr. Selander served as a Member of the Advisory Board of Fidelity's Equity and High Income Funds (2011), Executive Vice Chairman (2010), Chief Executive Officer (2009-2010), and President and Chief Executive Officer (1997-2009) of Mastercard, Inc. |
Cornelia M. Small (68) |
| Year of Election or Appointment: 2005 Ms. Small is a member of the Board of Directors (2009-present) and Chair of the Investment Committee (2010-present) of the Teagle Foundation. Ms. Small also serves on the Investment Committee of the Berkshire Taconic Community Foundation (2008-present). Previously, Ms. Small served as Chairperson (2002-2008) and a member of the Investment Committee and Chairperson (2008-2012) and a member of the Board of Trustees of Smith College. In addition, Ms. Small served as Chief Investment Officer, Director of Global Equity Investments, and a member of the Board of Directors of Scudder, Stevens & Clark and Scudder Kemper Investments. |
William S. Stavropoulos (73) |
| Year of Election or Appointment: 2001 Mr. Stavropoulos is Vice Chairman of the Independent Trustees of the Equity and High Income Funds (2006-present). Mr. Stavropoulos serves as President and Founder of the Michigan Baseball Foundation, the Great Lakes Loons (2007-present). Mr. Stavropoulos is Chairman Emeritus of the Board of Directors of The Dow Chemical Company, where he previously served in numerous senior management positions, including President, CEO (1995-2000; 2002-2004), Chairman of the Executive Committee (2000-2006), and as a member of the Board of Directors (1990-2006). Currently, Mr. Stavropoulos is a Director of Univar Inc. (global distributor of commodity and specialty chemicals, Chairman from 2010-May 2012 and Lead Director from May 2012-present), Teradata Corporation (data warehousing and technology solutions, 2008-present), Maersk Inc. (industrial conglomerate), and Tyco International, Ltd. (multinational manufacturing and services, 2007-present), and a member of the Advisory Board for Metalmark Capital LLC (private equity investment, 2005-present). Mr. Stavropoulos is an operating advisor to Clayton, Dubilier & Rice, LLC (private equity investment). In addition, Mr. Stavropoulos is a member of the University of Notre Dame Advisory Council for the College of Science, a Trustee of the Rollin L. Gerstacker Foundation, and a Director of the Naples Philharmonic Center for the Arts. Previously, Mr. Stavropoulos served as a Director of Chemical Financial Corporation (bank holding company, 1993-2012). |
David M. Thomas (63) |
| Year of Election or Appointment: 2008 Previously, Mr. Thomas served as Executive Chairman (2005-2006) and Chairman and Chief Executive Officer (2000-2005) of IMS Health, Inc. (pharmaceutical and healthcare information solutions), and a Director of Fortune Brands, Inc. (consumer products, 2000-2011). In addition, Mr. Thomas serves as Non-Executive Chairman of the Board of Directors of Fortune Brands Home and Security (home and security products, 2011-present), and as a member of the Board of Directors of Interpublic Group of Companies, Inc. (marketing communication, 2004-present). |
Michael E. Wiley (62) |
| Year of Election or Appointment: 2008 Mr. Wiley also serves as a Director of Asia Pacific Exploration Consolidated (international oil and gas exploration and production, 2008-present). Mr. Wiley serves as a Director of Tesoro Corporation (independent oil refiner and marketer, 2005-present), and a Director of Bill Barrett Corporation (exploration and production, 2005-present). In addition, Mr. Wiley also serves as a Director of Post Oak Bank (privately-held bank, 2004-present). Previously, Mr. Wiley served as a member of the Board of Trustees of the University of Tulsa (2000-2006; 2007-2010), as a Senior Energy Advisor of Katzenbach Partners, LLC (consulting, 2006-2007), as an Advisory Director of Riverstone Holdings (private investment), Chairman, President, and CEO of Baker Hughes, Inc. (oilfield services, 2000-2004), and as Director of Spinnaker Exploration Company (exploration and production, 2001-2005). |
+ The information above includes each Trustee's principal occupation during the last five years and other information relating to the experience, attributes, and skills relevant to each Trustee's qualifications to serve as a Trustee, which led to the conclusion that each Trustee should serve as a Trustee for the fund.
Advisory Board Members and Executive Officers:
Correspondence intended for David A. Rosow and Garnett A. Smith may be sent to Fidelity Investments, P.O. Box 55235, Boston, Massachusetts 02205-5235. Correspondence intended for each executive officer, Edward C. Johnson 3d, and Peter S. Lynch may be sent to Fidelity Investments, 82 Devonshire Street, Boston, Massachusetts 02109.
Name, Age; Principal Occupation |
Edward C. Johnson 3d (82) |
| Year of Election or Appointment: 2011 Member of the Advisory Board of Fidelity's Equity and High Income Funds. Mr. Johnson serves as Chief Executive Officer, Chairman, and a Director of FMR LLC, and also serves as Chairman and Director of FIL Limited. Previously, Mr. Johnson served as a Trustee and Chairman of the Board of certain Fidelity Trusts, Chairman and a Director of FMR, Chairman and a Director of FMR Co., Inc., and President of FMR LLC (2006-2007). |
Peter S. Lynch (68) |
| Year of Election or Appointment: 2003 Member of the Advisory Board of Fidelity's Equity and High Income Funds. Mr. Lynch is Vice Chairman and a Director of FMR and FMR Co., Inc. In addition, Mr. Lynch serves as a Trustee of Boston College and as the Chairman of the Inner-City Scholarship Fund. Previously, Mr. Lynch served on the Special Olympics International Board of Directors (1997-2006). |
David A. Rosow (70) |
| Year of Election or Appointment: 2012 Member of the Advisory Board of Fidelity's Equity and High Income Funds. Chairman and Chief Executive Officer of International Golf Group, Inc. (golf course development, 1989-present). Previously, Mr. Rosow served as Chairman and Chief Executive Officer of Rosow & Company, Inc. (private investment company, 1989-2011), a Lead Director of Hudson United Bancorp (2001-2006) and as a Director of TD Banknorth (1996-2006). In addition, Mr. Rosow is a member (2008-present) and President (2009-present) of the Town Council of Palm Beach, Florida. |
Garnett A. Smith (65) |
| Year of Election or Appointment: 2012 Member of the Advisory Board of Fidelity's Equity and High Income Funds. Prior to Mr. Smith's retirement, he served as Chairman and Chief Executive Officer of Inbrand Corp. (manufacturer of personal absorbent products, 1990-1997). He also served as President (1986-1990) of Inbrand Corp. Prior to his employment with Inbrand Corp., he was employed by a retail fabric chain and North Carolina National Bank. In addition, Mr. Smith is a board member of the Jackson Hole Land Trust (2009-present). |
Kenneth B. Robins (43) |
| Year of Election or Appointment: 2008 President and Treasurer of Fidelity's Equity and High Income Funds. Mr. Robins also serves as President and Treasurer (2010-present) and Assistant Treasurer (2009-present) of other Fidelity funds and is an employee of Fidelity Investments (2004-present). Previously, Mr. Robins served as Deputy Treasurer of the Fidelity funds (2005-2008) and Treasurer and Chief Financial Officer of The North Carolina Capital Management Trust: Cash and Term Portfolios (2006-2008). |
Bruce T. Herring (47) |
| Year of Election or Appointment: 2006 Vice President of certain Equity Funds. Mr. Herring also serves as President of Fidelity Research & Analysis Company (2010-present), Chief Investment Officer and Director of Fidelity Management & Research (U.K.) Inc. (2010-present) and Group Chief Investment Officer of FMR. Previously, Mr. Herring served as Vice President (2005-2006) and Senior Vice President (2006-2007) of Fidelity Management & Research Company, Vice President of FMR Co., Inc. (2001-2007) and as a portfolio manager for Fidelity U.S. Equity Funds. |
Brian B. Hogan (48) |
| Year of Election or Appointment: 2009 Vice President of Equity and High Income Funds. Mr. Hogan also serves as President of FMR's Equity Division (2009-present). Previously, Mr. Hogan served as Senior Vice President, Equity Research of FMR (2006-2009) and as a portfolio manager. |
Scott C. Goebel (44) |
| Year of Election or Appointment: 2008 Secretary and Chief Legal Officer (CLO) of the Fidelity funds. Mr. Goebel also serves as Secretary of Fidelity Investments Money Management, Inc. (FIMM) (2010-present) and Fidelity Research and Analysis Company (FRAC) (2010-present); Secretary and CLO of The North Carolina Capital Management Trust: Cash and Term Portfolios (2008-present); General Counsel, Secretary, and Senior Vice President of FMR (2008-present) and FMR Co., Inc. (2008-present); employed by FMR LLC or an affiliate (2001-present); Chief Legal Officer of Fidelity Management & Research (Hong Kong) Limited (2008-present) and Assistant Secretary of Fidelity Management & Research (Japan) Inc. (2008-present), and Fidelity Management & Research (U.K.) Inc. (2008-present). Previously, Mr. Goebel served as Assistant Secretary of FIMM (2008-2010), FRAC (2008-2010), and the Funds (2007-2008) and as Vice President and Secretary of Fidelity Distributors Corporation (FDC) (2005-2007). |
William C. Coffey (43) |
| Year of Election or Appointment: 2009 Assistant Secretary of Fidelity's Equity and High Income Funds. Mr. Coffey also serves as Senior Vice President and Deputy General Counsel of FMR LLC (2010-present), and is an employee of Fidelity Investments. Previously, Mr. Coffey served as Vice President and Associate General Counsel of FMR LLC (2005-2009). |
Elizabeth Paige Baumann (44) |
| Year of Election or Appointment: 2012 Anti-Money Laundering (AML) Officer of the Fidelity funds. Ms. Baumann also serves as AML Officer of The North Carolina Capital Management Trust: Cash and Term Portfolios (2012-present), Chief AML Officer of FMR LLC (2012-present), and is an employee of Fidelity Investments. Previously, Ms. Baumann served as Vice President and Deputy Anti-Money Laundering Officer (2007-2012). |
Christine Reynolds (54) |
| Year of Election or Appointment: 2008 Chief Financial Officer of the Fidelity funds. Ms. Reynolds became President of Fidelity Pricing and Cash Management Services (FPCMS) in August 2008. Ms. Reynolds served as Chief Operating Officer of FPCMS (2007-2008). Previously, Ms. Reynolds served as President, Treasurer, and Anti-Money Laundering officer of the Fidelity funds (2004-2007). |
Joseph A. Hanlon (44) |
| Year of Election or Appointment: 2012 Chief Compliance Officer of Fidelity's Equity and High Income Funds. Mr. Hanlon serves as Compliance Officer of FMR, FMR Co., Inc., Fidelity Investments Money Management, Inc. (FIMM), Fidelity Research and Analysis Company (FRAC), Fidelity Management & Research (Japan) Inc., Fidelity Management & Research (U.K.) Inc., Fidelity Management & Research (Hong Kong), and Strategic Advisers, Inc. (2009-present), as Senior Vice President of the Fidelity Asset Management Division (2009-present), and is an employee of Fidelity Investments. |
Joseph F. Zambello (55) |
| Year of Election or Appointment: 2011 Deputy Treasurer of the Fidelity funds. Mr. Zambello is an employee of Fidelity Investments. Previously, Mr. Zambello served as Vice President of FMR's Program Management Group (2009-2011) and Vice President of the Transfer Agent Oversight Group (2005-2009). |
Adrien E. Deberghes (45) |
| Year of Election or Appointment: 2008 Deputy Treasurer of Fidelity's Equity and High Income Funds. Mr. Deberghes also serves as Vice President (2011-present) and Assistant Treasurer (2010-present) of other Fidelity funds, and is an employee of Fidelity Investments (2008-present). Previously, Mr. Deberghes served as Senior Vice President of Mutual Fund Administration at State Street Corporation (2007-2008), Senior Director of Mutual Fund Administration at Investors Bank & Trust (2005-2007), and Director of Finance for Dunkin' Brands (2000-2005). |
Stephen Sadoski (41) |
| Year of Election or Appointment: 2012 Deputy Treasurer of Fidelity's Equity and High Income Funds. Mr. Sadoski also serves as Assistant Treasurer of other Fidelity funds (2012-present) and is an employee of Fidelity Investments (2012-present). Previously, Mr. Sadoski served as an assistant chief accountant in the Division of Investment Management of the Securities and Exchange Commission (SEC) (2009-2012) and as a senior manager at Deloitte & Touche (1997-2009). |
Stephanie J. Dorsey (43) |
| Year of Election or Appointment: 2010 Assistant Treasurer of Fidelity's Equity and High Income Funds. Ms. Dorsey also serves as Deputy Treasurer of other Fidelity funds (2008-present) and is an employee of Fidelity Investments (2008-present). Previously, Ms. Dorsey served as Treasurer (2004-2008) of the JPMorgan Mutual Funds and Vice President (2004-2008) of JPMorgan Chase Bank. |
John R. Hebble (54) |
| Year of Election or Appointment: 2009 Assistant Treasurer of Fidelity's Equity and High Income Funds. Mr. Hebble also serves as President (2011-present), Treasurer, and Chief Financial Officer of The North Carolina Capital Management Trust: Cash and Term Portfolios (2008-present), President and Treasurer of other Fidelity funds (2008-present) and is an employee of Fidelity Investments. |
Gary W. Ryan (54) |
| Year of Election or Appointment: 2005 Assistant Treasurer of the Fidelity funds. Mr. Ryan is an employee of Fidelity Investments. Previously, Mr. Ryan served as Vice President of Fund Reporting in Fidelity Pricing and Cash Management Services (FPCMS) (1999-2005). |
Jonathan Davis (44) |
| Year of Election or Appointment: 2010 Assistant Treasurer of the Fidelity funds. Mr. Davis is also Assistant Treasurer of Fidelity Rutland Square Trust II and Fidelity Commonwealth Trust II. Mr. Davis is an employee of Fidelity Investments. Previously, Mr. Davis served as Vice President and Associate General Counsel of FMR LLC (2003-2010). |
Annual Report
The Board of Trustees of Fidelity Total Emerging Markets Fund voted to pay to shareholders of record at the opening of business on record date, the following distributions per share derived from capital gains realized from sales of portfolio securities, and dividends derived from net investment income:
| Pay Date | Record Date | Dividends | Capital Gains |
Class A | 12/10/12 | 12/7/12 | $0.146 | $0.014 |
Class T | 12/10/12 | 12/7/12 | $0.124 | $0.014 |
Class C | 12/10/12 | 12/7/12 | $0.067 | $0.014 |
The amounts per share which represent income derived from sources within, and taxes paid to, foreign countries or possessions of the United States are as follows:
December 23, 2011 | Income | Taxes |
Class A | $0.011 | $0.0009 |
Class T | $0.007 | $0.0009 |
Class C | $0.000 | $0.0000 |
December 29, 2011 | | |
Class A | $0.008 | $0.0000 |
Class T | $0.008 | $0.0000 |
Class C | $0.006 | $0.0000 |
A percentage of the dividends distributed during the fiscal year for the following funds may be taken into account as a dividend for purposes of the maximum rate under section 1(h)(11) of the Internal Revenue Code:
December 23, 2011 | |
Class A | 65% |
Class T | 100% |
Class C | 0% |
December 29, 2011 | |
Class A | 50% |
Class T | 50% |
Class C | 67% |
The fund will notify shareholders in January 2013 of amounts for use in preparing 2012 income tax returns.
Annual Report
Board Approval of Investment Advisory Contracts and Management Fees
Fidelity Total Emerging Markets Fund
Each year, the Board of Trustees, including the Independent Trustees (together, the Board), votes on the renewal of the management contract and sub-advisory agreements (together, the Advisory Contracts) for the fund. The Board, assisted by the advice of fund counsel and Independent Trustees' counsel, requests and considers a broad range of information relevant to the renewal of the Advisory Contracts throughout the year.
The Board meets regularly and, at each of its meetings, considers factors that are relevant to its annual consideration of the renewal of the fund's Advisory Contracts, including the services and support provided to the fund and its shareholders. The Board has established various standing committees, each composed of and chaired by Independent Trustees with varying backgrounds, to which the Board has assigned specific subject matter responsibilities in order to enhance effective decision-making by the Board. The Board, acting directly and through its Committees, requests and receives information concerning the annual consideration of the renewal of the fund's Advisory Contracts. The Board also meets as needed to consider matters specifically related to the Board's annual consideration of the renewal of Advisory Contracts. Members of the Board may also meet with trustees of other Fidelity funds through ad hoc joint committees to discuss certain matters relevant to the Fidelity funds.
At its July 2012 meeting, the Board of Trustees, including the Independent Trustees, unanimously determined to renew the fund's Advisory Contracts. In reaching its determination, the Board considered all factors it believed relevant, including (i) the nature, extent, and quality of the services to be provided to the fund and its shareholders (including the investment performance of the fund); (ii) the competitiveness of the fund's management fee and total expense ratio relative to peer funds; (iii) the total costs of the services to be provided by and the profits to be realized by Fidelity from its relationship with the fund; (iv) the extent to which economies of scale exist and would be realized as the fund grows; and (v) whether fee levels reflect these economies of scale, if any, for the benefit of fund shareholders.
In considering whether to renew the Advisory Contracts for the fund, the Board reached a determination, with the assistance of fund counsel and Independent Trustees' counsel and through the exercise of its business judgment, that the renewal of the Advisory Contracts is in the best interests of the fund and its shareholders and that the compensation payable under the Advisory Contracts is fair and reasonable. The Board's decision to renew the Advisory Contracts was not based on any single factor, but rather was based on a comprehensive consideration of all the information provided to the Board at its meetings throughout the year. The Board, in reaching its determination to renew the Advisory Contracts, is aware that shareholders in the fund have a broad range of investment choices available to them, including a wide choice among mutual funds offered by Fidelity's competitors, and that the fund's shareholders, who have the opportunity to review and weigh the disclosure provided by the fund in its prospectus and other public disclosures, have chosen to invest in this fund, managed by Fidelity.
Annual Report
Nature, Extent, and Quality of Services Provided. The Board considered the staffing within the investment adviser, FMR, and the sub-advisers (together, the Investment Advisers), including the backgrounds of the fund's investment personnel, and also considered the fund's investment objective, strategies, and related investment philosophy. The Independent Trustees also had discussions with senior management of Fidelity's investment operations and investment groups. The Board considered the structure of the portfolio manager compensation program and whether this structure provides appropriate incentives to act in the best interests of the fund.
Resources Dedicated to Investment Management and Support Services. The Board and the Fund Oversight and Research Committees reviewed the general qualifications and capabilities of the Investment Advisers' investment staff, including its size, education, experience, and resources, as well as the Investment Advisers' approach to recruiting, training, managing, and compensating investment personnel. The Board also noted that FMR has continued to increase the resources devoted to non-U.S. offices, including expansion of Fidelity's global investment organization. The Board noted that Fidelity's analysts have extensive resources, tools and capabilities that allow them to conduct sophisticated quantitative and fundamental analysis, as well as credit analysis of issuers, counterparties and guarantors. The Board also believes that Fidelity's investment professionals have sufficient access to global information and data so as to provide competitive investment results over time, and that those professionals also have access to sophisticated tools that permit them to assess portfolio construction and risk and performance attribution characteristics continuously, as well as to transmit new information and research conclusions rapidly around the world. Additionally, in its deliberations, the Board considered the Investment Advisers' trading and risk management capabilities and resources, which are an integral part of the investment management process.
Shareholder and Administrative Services. The Board considered (i) the nature, extent, quality, and cost of advisory, administrative, and shareholder services performed by the Investment Advisers and their affiliates under the Advisory Contracts and under separate agreements covering transfer agency, pricing and bookkeeping, and securities lending services for the fund; (ii) the nature and extent of the supervision of third party service providers, principally custodians and subcustodians; and (iii) the resources devoted to, and the record of compliance with, the fund's compliance policies and procedures. The Board also reviewed the allocation of fund brokerage, including allocations to brokers affiliated with the Investment Advisers, the use of brokerage commissions to pay fund expenses, and the use of "soft" commission dollars to pay for research services.
Annual Report
Board Approval of Investment Advisory Contracts and
Management Fees - continued
The Board noted that the growth of fund assets over time across the complex allows Fidelity to reinvest in the development of services designed to enhance the value or convenience of the Fidelity funds as investment vehicles. These services include 24-hour access to account information and market information through telephone representatives and over the Internet, investor education materials and asset allocation tools, and the expanded availability of Fidelity Investor Centers.
Investment in a Large Fund Family. The Board considered the benefits to shareholders of investing in a Fidelity fund, including the benefits of investing in a fund that is part of a large family of funds offering a variety of investment disciplines and providing a large variety of mutual fund investor services. The Board noted that Fidelity had taken, or had made recommendations that resulted in the Fidelity funds taking, a number of actions over the previous year that benefited particular funds, including (i) continuing to dedicate additional resources to investment research and support of the senior management team that oversees asset management; (ii) persisting in efforts to enhance Fidelity's research capabilities, in particular, international research; (iii) launching new funds and making other enhancements to meet client needs for global and income-oriented solutions; (iv) continuing to launch dedicated lower cost underlying funds to meet investment management's portfolio construction needs related to expanding underlying fund options, specifically for the Freedom Fund product lines; (v) adopting a "Stock Selector" sector neutral investment approach and employing a team of portfolio managers who are sector specialists to manage certain funds; (vi) rationalizing product lines and gaining increased efficiencies through the mergers of several funds into other funds; (vii) strengthening the Spartan Index Fund product line by adding new funds and/or new low-cost institutional share classes, restructuring fund expenses to accommodate new classes, and reducing investment minimums for certain classes of shares; (viii) modifying the eligibility criteria for Institutional Class shares to increase their appeal to government entities and charitable investors; and (ix) reducing certain transfer agent fee rates.
Investment Performance. The Board considered whether the fund has operated in accordance with its investment objective, as well as its record of compliance with its investment restrictions. As the fund recently commenced operations the Board did not believe that it was appropriate to assign significant weight to its limited investment performance.
Based on its review, the Board concluded that the nature, extent, and quality of services provided to the fund under the Advisory Contracts should benefit the fund's shareholders.
Competitiveness of Management Fee and Total Expense Ratio. The Board considered the fund's management fee and total expense ratio compared to "mapped groups" of competitive funds and classes. Fidelity creates "mapped groups" by combining similar Lipper investment objective categories that have comparable management fee characteristics. Combining Lipper investment objective categories aids the Board's management fee and total expense ratio comparisons by broadening the competitive group used for comparison and by reducing the number of universes to which various Fidelity funds are compared.
Annual Report
Management Fee. The Board considered two proprietary management fee comparisons for the period of the fund's operation shown in the chart below. The group of Lipper funds used by the Board for management fee comparisons is referred to below as the "Total Mapped Group." The Total Mapped Group comparison focuses on a fund's standing relative to the total universe of comparable funds available to investors in terms of gross management fees before expense reimbursements or caps. "TMG %" represents the percentage of funds in the Total Mapped Group that had management fees that were lower than the fund's. For example, a TMG % of 13% means that 87% of the funds in the Total Mapped Group had higher management fees than the fund. The "Asset-Size Peer Group" (ASPG) comparison focuses on a fund's standing relative to non-Fidelity funds similar in size to the fund within the Total Mapped Group. The ASPG represents at least 15% of the funds in the Total Mapped Group with comparable asset size and management fee characteristics, subject to a minimum of 50 funds (or all funds in the Total Mapped Group if fewer than 50). Additional information, such as the ASPG quartile in which the fund's management fee ranked, is also included in the chart and considered by the Board.
Fidelity Total Emerging Markets Fund
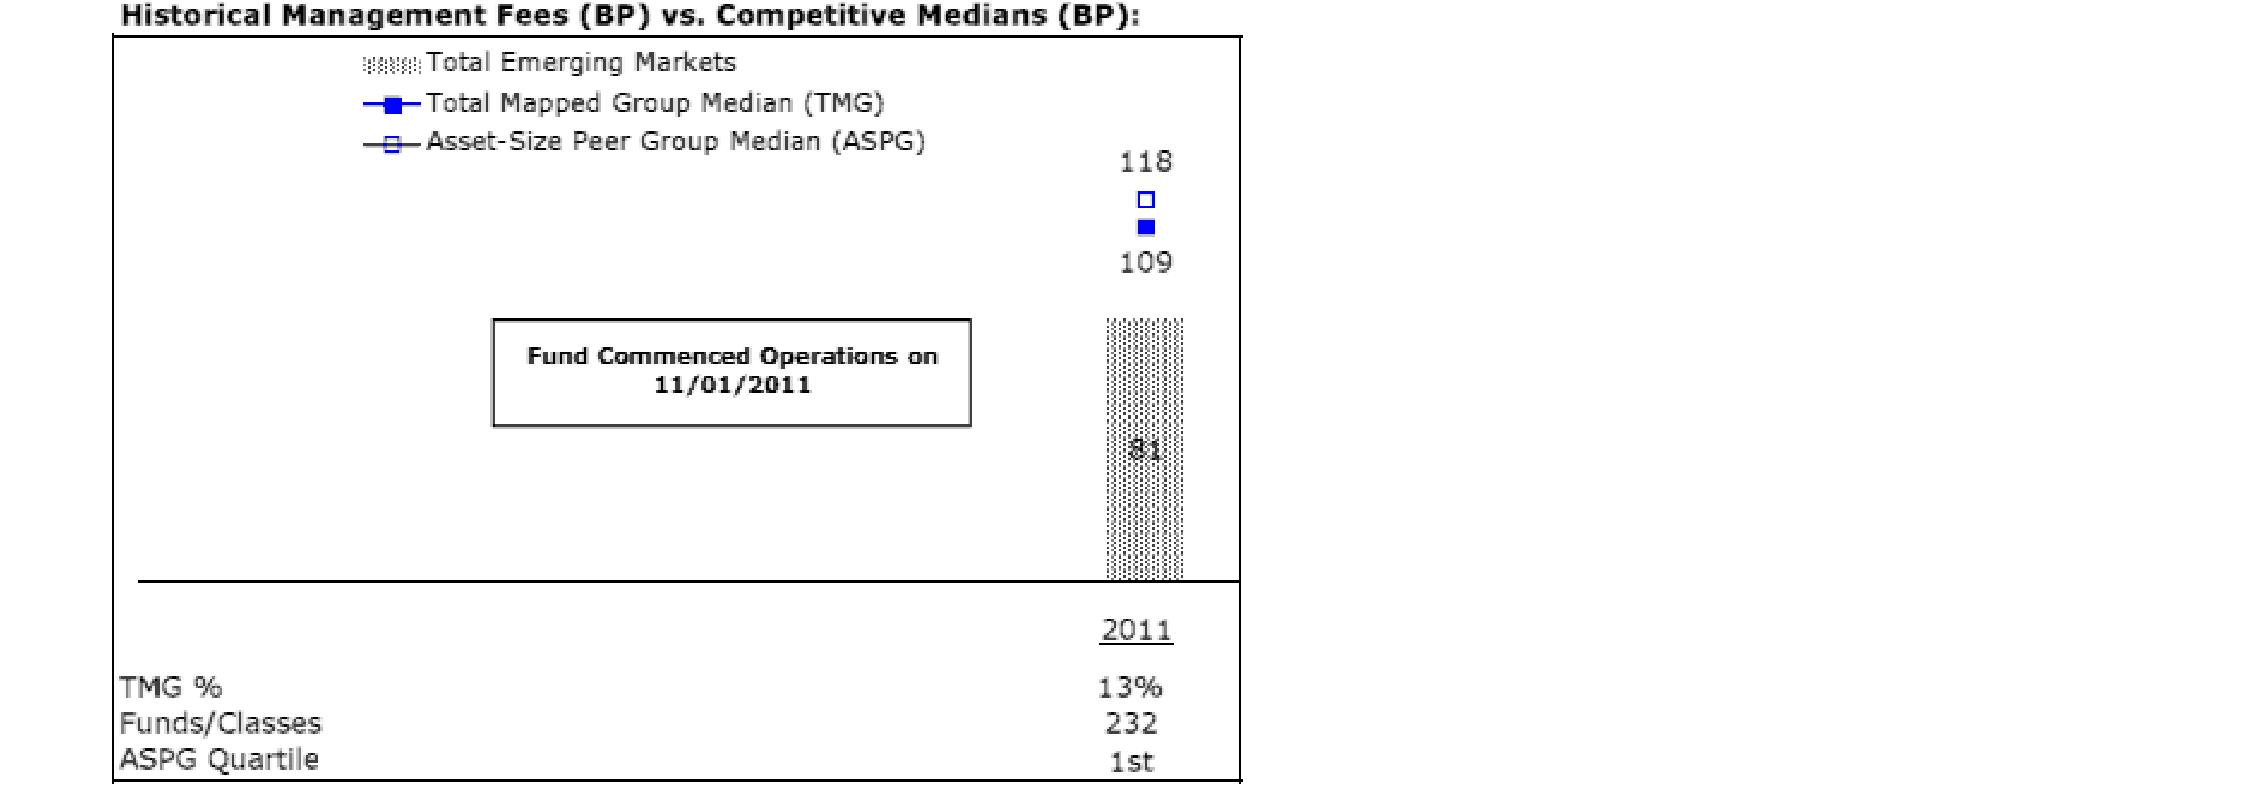
Annual Report
Board Approval of Investment Advisory Contracts and
Management Fees - continued
The Board noted that the fund's management fee ranked below the median of its Total Mapped Group and below the median of its ASPG for the period.
Based on its review, the Board concluded that the fund's management fee is fair and reasonable in light of the services that the fund receives and the other factors considered.
Total Expense Ratio. In its review of each class's total expense ratio, the Board considered the fund's management fee as well as other fund or class expenses, as applicable, such as transfer agent fees, pricing and bookkeeping fees, fund-paid 12b-1 fees, and custodial, legal, and audit fees. The Board also noted the effects of any waivers and reimbursements on fees and expenses. As part of its review, the Board also considered the current total expense ratios of each class of the fund compared to competitive fund median expenses. Each class of the fund is compared to those funds and classes in the Total Mapped Group (used by the Board for management fee comparisons) that have a similar sales load structure.
The Board noted that the fund offers multiple classes, each of which has a different sales load and 12b-1 fee structure, and that the multiple structures are intended to offer a range of pricing options for the intermediary market. The Board also noted that the total expense ratios of the classes of the fund vary primarily by the level of their 12b-1 fees, although differences in transfer agent fees may also cause expenses to vary from class to class.
The Board noted that the total expense ratio of each of Class A and the retail class of the fund ranked below its competitive median for the period, the total expense ratio of Class C ranked equal to its competitive median for the period, and the total expense ratio of each of Class T and Institutional Class ranked above its competitive median for the period. The Board considered that various factors, including 12b-1 fees, positive or negative performance adjustments, and relatively higher other expenses in the case of small fund size, can affect total expense ratios. The Board noted that the total expense ratio of Class T was above the competitive median primarily because of higher 12b-1 fees on Class T. Class T has a higher 12b-1 fee, but a lower front-end sales charge, than traditionally priced front-end sales charge classes. The Board considered that Class T is primarily sold load-waived in the retirement plan market where its 0.50% 12b-1 fee is comparable to competing no-load, higher 12b-1 fee classes designed specifically for retirement plans.
The Board further considered that FMR contractually agreed to reimburse Class A, Class T, Class C, Institutional Class, and the retail class of the fund to the extent that total operating expenses (excluding interest, taxes, certain securities lending costs, brokerage commissions, extraordinary expenses, and acquired fund fees and expenses, if any), as a percentage of their respective average net assets, exceed 1.65%, 1.90%, 2.40%, 1.40%, and 1.40% through December 31, 2012.
Annual Report
Fees Charged to Other Fidelity Clients. The Board also considered Fidelity fee structures and other information with respect to clients of FMR and its affiliates, such as other mutual funds advised or subadvised by FMR or its affiliates, pension plan clients, and other institutional clients. The Board noted the findings of the 2010 ad hoc joint committee (created with the board of other Fidelity funds), which reviewed and compared Fidelity's institutional investment advisory business with its business of providing services to the Fidelity funds, including the differences in services provided, fees charged, and costs incurred, as well as competition in their respective marketplaces.
Based on its review of total expense ratios and fees charged to other Fidelity clients, the Board concluded that the total expense ratio of each class of the fund was reasonable, although in some cases above the median of the universe presented for comparison, in light of the services that the fund and its shareholders receive and the other factors considered.
Costs of the Services and Profitability. The Board considered the revenues earned and the expenses incurred by Fidelity in conducting the business of developing, marketing, distributing, managing, administering and servicing the fund and its shareholders. The Board also considered the level of Fidelity's profits in respect of all the Fidelity funds.
On an annual basis, FMR presents to the Board Fidelity's profitability for the fund. Fidelity calculates the profitability for each fund, as well as aggregate profitability for groups of Fidelity funds and all Fidelity funds, using a series of detailed revenue and cost allocation methodologies which originate with the books and records of Fidelity on which Fidelity's audited financial statements are based. The Audit Committee of the Board reviews any significant changes from the prior year's methodologies.
PricewaterhouseCoopers LLP (PwC), independent registered public accounting firm and auditor to Fidelity and certain Fidelity funds, has been engaged annually by the Board as part of the Board's assessment of Fidelity's profitability analysis. PwC's engagement includes the review and assessment of Fidelity's methodologies used in determining the revenues and expenses attributable to Fidelity's mutual fund business, and completion of agreed-upon procedures surrounding the mathematical accuracy of fund profitability and its conformity to allocation methodologies. After considering PwC's reports issued under the engagement and information provided by Fidelity, the Board concluded that while other allocation methods may also be reasonable, Fidelity's profitability methodologies are reasonable in all material respects.
The Board also reviewed Fidelity's non-fund businesses and fall-out benefits related to the mutual fund business as well as cases where Fidelity's affiliates may benefit from or be related to the fund's business.
Annual Report
Board Approval of Investment Advisory Contracts and
Management Fees - continued
The Board considered the costs of the services provided by and the profits realized by Fidelity in connection with the operation of the fund and was satisfied that the profitability was not excessive in the circumstances.
Economies of Scale. The Board considered whether there have been economies of scale in respect of the management of the Fidelity funds, whether the Fidelity funds (including the fund) have appropriately benefited from any such economies of scale, and whether there is potential for realization of any further economies of scale. The Board considered the extent to which the fund will benefit from economies of scale through increased services to the fund, through waivers or reimbursements, or through fee or expense reductions. The Board also noted that in 2009, it and the board of other Fidelity funds created an ad hoc committee (the Economies of Scale Committee) to analyze whether FMR attains economies of scale in respect of the management and servicing of the Fidelity funds, whether the Fidelity funds have appropriately benefited from such economies of scale, and whether there is potential for realization of any further economies of scale.
The Board recognized that the fund's management contract incorporates a "group fee" structure, which provides for lower group fee rates as total fund assets under FMR's management increase, and for higher group fee rates as total fund assets under FMR's management decrease. FMR calculates the group fee rates based on a tiered asset "breakpoint" schedule that varies based on asset class. The Board considered that the group fee is designed to deliver the benefits of economies of scale to fund shareholders when total Fidelity fund assets increase, even if assets of any particular fund are unchanged or have declined, because some portion of Fidelity's costs are attributable to services provided to all Fidelity funds, and all funds benefit if those costs can be allocated among more assets. The Board concluded that, given the group fee structure, fund shareholders will benefit from lower management fees as assets under FMR's management increase at the fund complex level, regardless of whether Fidelity achieves any such economies of scale.
The Board concluded, taking into account the analysis of the Economies of Scale Committee, that economies of scale, if any, are being appropriately shared between fund shareholders and Fidelity.
Additional Information Requested by the Board. In order to develop fully the factual basis for consideration of the Fidelity funds' Advisory Contracts, the Board requested and received additional information on certain topics, including (i) fund performance trends, actions to be taken by FMR to improve certain funds' overall performance, and Fidelity's long-term strategies for certain funds; (ii) the potential to further rationalize the Fidelity fund lineup with the possibility of achieving savings for the funds and Fidelity; (iii) Fidelity's compensation structure for portfolio managers and other key investment personnel; (iv) the amount of the investment that each portfolio manager has made in the Fidelity fund(s) that he or she manages; (v) the realization of fall-out benefits in certain Fidelity business units; (vi) Fidelity's group fee structures, the potential impact of regulatory changes on such structures, and the rationale for the individual fee rates of certain funds; (vii) fund profitability methodology, including Fidelity's cost allocation methodology, and the impact of certain factors on fund profitability results; (viii) trends regarding industry use of performance fee structures and the possibility of implementing performance fee structures for additional funds; and (ix) the impact of net redemptions from the Fidelity funds.
Annual Report
Based on its evaluation of all of the conclusions noted above, and after considering all factors it believed relevant, the Board ultimately concluded that the advisory fee structures are fair and reasonable, and that the fund's Advisory Contracts should be renewed.
Annual Report
Investment Adviser
Fidelity Management & Research Company
Boston, MA
Investment Sub-Advisers
FMR Co., Inc.
Fidelity Management & Research
(U.K.) Inc.
Fidelity Management & Research
(Hong Kong) Limited
Fidelity Management & Research
(Japan) Inc.
FIL Investments (Japan) Limited
FIL Investment Advisors (UK) Limited
FIL Investment Advisors
General Distributor
Fidelity Distributors Corporation
Smithfield, RI
Transfer and Service Agents
Fidelity Investments Institutional Operations Company, Inc.
Boston, MA
Fidelity Service Company, Inc.
Boston, MA
Custodian
The Northern Trust Company
Chicago, IL
(Fidelity Investment logo)(registered trademark)
ATEK-UANN-1212
1.931267.100
(Fidelity Investment logo)(registered trademark)
Fidelity Advisor®
Total Emerging Markets
Fund - Institutional Class
Annual Report
October 31, 2012
(Fidelity Cover Art)
Institutional Class is a
class of Fidelity® Total
Emerging Markets Fund
Contents
Performance | (Click Here) | How the fund has done over time. |
Management's Discussion of Fund Performance | (Click Here) | The Portfolio Manager's review of fund performance and strategy. |
Shareholder Expense Example | (Click Here) | An example of shareholder expenses. |
Investment Changes | (Click Here) | A summary of major shifts in the fund's investments over the past six months. |
Investments | (Click Here) | A complete list of the fund's investments with their market values. |
Financial Statements | (Click Here) | Statements of assets and liabilities, operations, and changes in net assets,
as well as financial highlights. |
Notes | (Click Here) | Notes to the financial statements. |
Report of Independent Registered Public Accounting Firm | (Click Here) | |
Trustees and Officers | (Click Here) | |
Distributions | (Click Here) | |
Board Approval of Investment Advisory Contracts and Management Fees | (Click Here) | |
To view a fund's proxy voting guidelines and proxy voting record for the 12-month period ended June 30, visit http://www.fidelity.com/proxyvotingresults or visit the Securities and Exchange Commission's (SEC) web site at http://www.sec.gov. You may also call 1-877-208-0098 to request a free copy of the proxy voting guidelines.
Standard & Poor's, S&P and S&P 500 are registered service marks of The McGraw-Hill Companies, Inc. and have been licensed for use by Fidelity Distributors Corporation.
Other third party marks appearing herein are the property of their respective owners.
All other marks appearing herein are registered or unregistered trademarks or service marks of FMR LLC or an affiliated company. © 2012 FMR LLC. All rights reserved.
Annual Report
This report and the financial statements contained herein are submitted for the general information of the shareholders of the fund. This report is not authorized for distribution to prospective investors in the fund unless preceded or accompanied by an effective prospectus.
A fund files its complete schedule of portfolio holdings with the SEC for the first and third quarters of each fiscal year on Form N-Q. Forms N-Q are available on the SEC's web site at http://www.sec.gov. A fund's Forms N-Q may be reviewed and copied at the SEC's Public Reference Room in Washington, DC. Information regarding the operation of the SEC's Public Reference Room may be obtained by calling 1-800-SEC-0330. For a complete list of a fund's portfolio holdings, view the most recent holdings listing, semiannual report, or annual report on Fidelity's web site at http://www.fidelity.com, http://www.advisor.fidelity.com, or http://www.401k.com, as applicable.
NOT FDIC INSURED • MAY LOSE VALUE • NO BANK GUARANTEE
Neither the fund nor Fidelity Distributors Corporation is a bank.
Annual Report
Average annual total return reflects the change in the value of an investment, assuming reinvestment of the class' distributions from dividend income and capital gains (the profits earned upon the sale of securities that have grown in value, if any) and assuming a constant rate of performance each year. The $10,000 table and the fund's returns do not reflect the deduction of taxes that a shareholder would pay on fund distributions or the redemption of fund shares. During periods of reimbursement by Fidelity, a fund's total return will be greater than it would be had the reimbursement not occurred. How a fund did yesterday is no guarantee of how it will do tomorrow.
Average annual total returns take Fidelity Advisor® Total Emerging Markets Fund - Institutional Class' cumulative total return and show you what would have happened if Institutional Class shares had performed at a constant rate each year. These numbers will be reported once the fund is a year old.
$10,000 Over Life of Fund
Let's say hypothetically that $10,000 was invested in Fidelity Advisor® Total Emerging Markets Fund - Institutional Class on November 1, 2011, when the fund started. The chart shows how the value of your investment would have changed, and also shows how the MSCI® Emerging Markets Index performed over the same period.
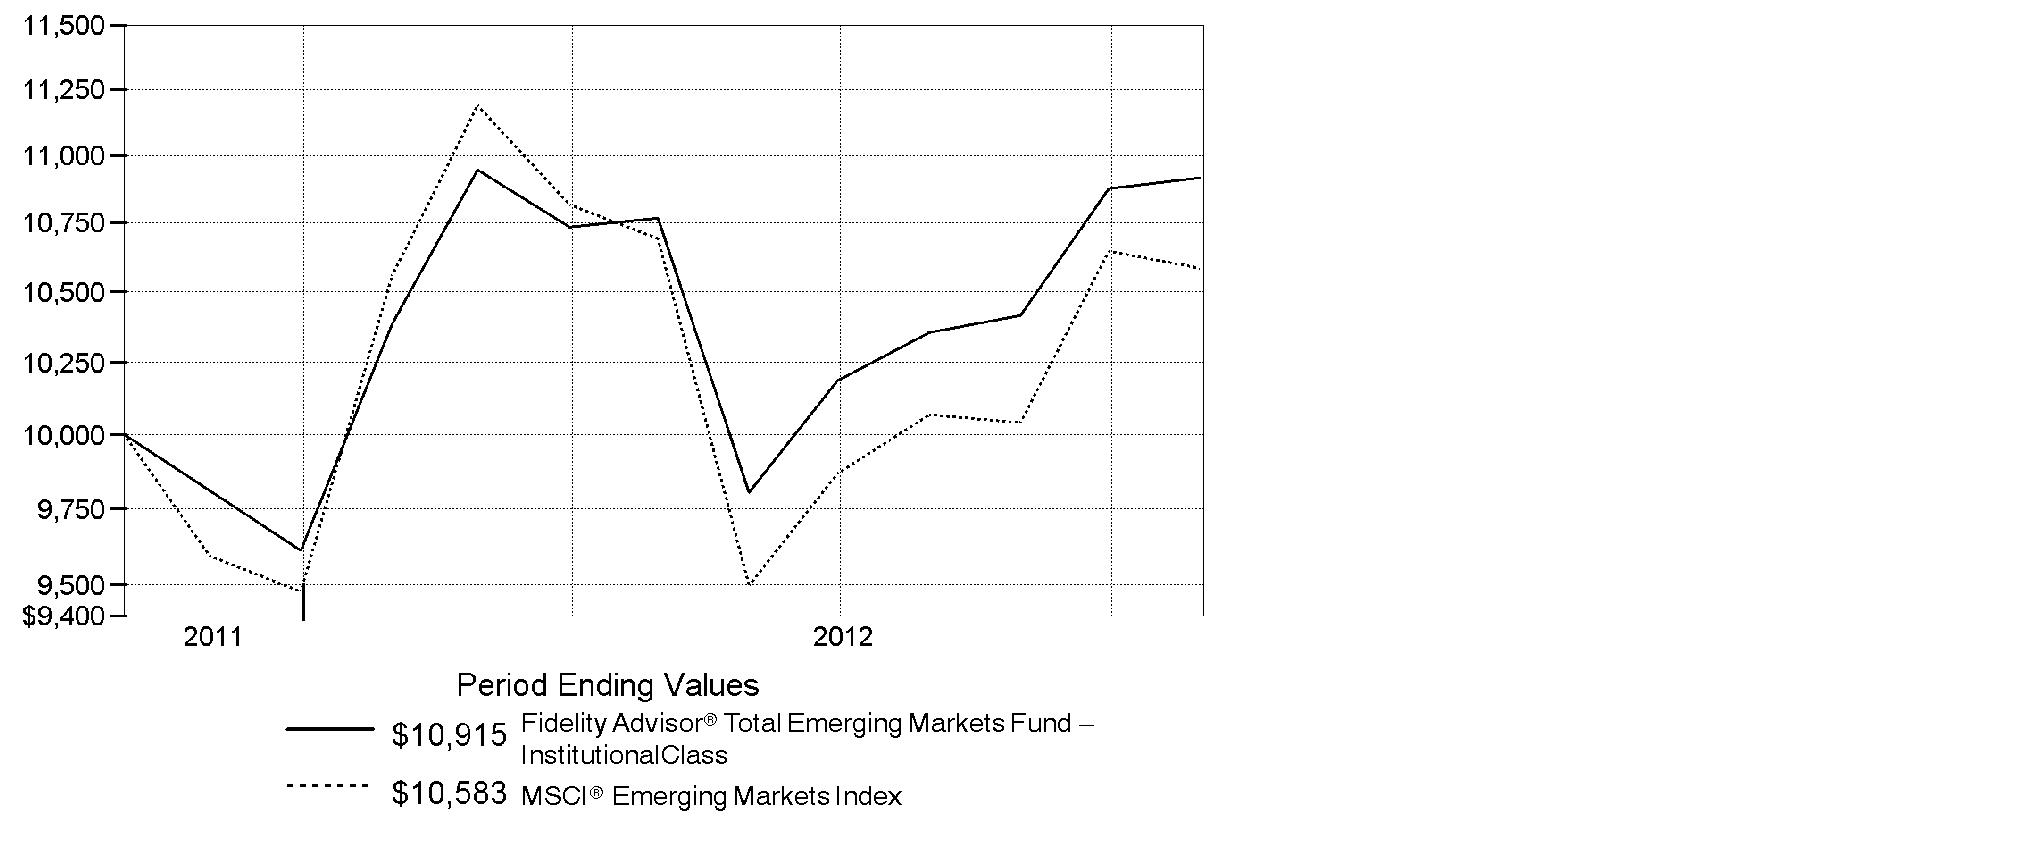
Annual Report
Market Recap: Global equities experienced turbulent swings during the 12 months ending October 31, 2012, but still managed a solid gain. Volatility peppered the past year, as a number of macroeconomic concerns weighed on investors, with the eurozone debt crisis, the strength and pace of the U.S. economic recovery, and a slowdown in China's growth all making headlines. But, stocks in the U.S. and overseas were generally resilient, gaining 8.96% for the 12 months, as measured by the MSCI® ACWI® (All Country World Index) Index, largely buttressed by accommodative monetary policy in the United States and Europe, as well as signs that the U.S. housing market was starting to recover. Within the index, U.S. stocks fared best, advancing 15%. Asia-Pacific ex Japan also performed well, gaining roughly 10% on strong returns in Hong Kong and Singapore. Several European markets, most notably Germany (+11%), Switzerland (+10%) and the U.K. (+9%), benefited from optimism about the eurozone's ability to resolve its debt woes. However, continued weakness in peripheral European markets caused the region to lag the index overall. Japan, emerging markets and Canada each underperformed, with Japan suffering the most, falling by about 3%. A stronger U.S. dollar dampened results for foreign stocks overall. Global bond markets delivered positive, albeit more-muted returns, with the Barclays® Global Aggregate GDP Weighted Index gaining 4.54%.
Comments from John Carlson, Lead Portfolio Manager of Fidelity Advisor® Total Emerging Markets Fund: From its inception on November 1, 2011, through October 31, 2012, the fund's Institutional Class shares gained 9.15%. By comparison, the fund's primary benchmark, the MSCI® Emerging Markets Index, returned 5.83%, while the Fidelity Total Emerging Markets Composite IndexSM advanced 10.34%. Performance versus the Composite index was held back by our decision to overweight equities and underweight debt, the latter of which had much stronger performance during the period. Both subportfolios outperformed their respective benchmark, driven by security selection, which largely offset the negative impact of our overall allocation. At launch, the fund split its assets between equities and debt at roughly 67% and 33%, respectively. During the period, we decided to further increase our overweighting in equities, while reducing exposure to EM debt. We made this decision based, in part, on the massive sell-off in global equities as a result of the sovereign debt crisis in Greece and the debt overhang impacting other developed countries.
Note to shareholders: Gregory Lee was named Co-Portfolio Manager on May 2, 2012, and is responsible for the fund's industrials sector assets.
The views expressed above reflect those of the portfolio manager(s) only through the end of the period as stated on the cover of this report and do not necessarily represent the views of Fidelity or any other person in the Fidelity organization. Any such views are subject to change at any time based upon market or other conditions and Fidelity disclaims any responsibility to update such views. These views may not be relied on as investment advice and, because investment decisions for a Fidelity fund are based on numerous factors, may not be relied on as an indication of trading intent on behalf of any Fidelity fund.
Annual Report
Fidelity Total Emerging Markets Fund
Shareholder Expense Example
As a shareholder of the Fund, you incur two types of costs: (1) transaction costs, including sales charges (loads) on purchase payments or redemption proceeds, redemption fees and (2) ongoing costs, including management fees, distribution and/or service (12b-1) fees and other Fund expenses. This Example is intended to help you understand your ongoing costs (in dollars) of investing in the Fund and to compare these costs with the ongoing costs of investing in other mutual funds.
The Example is based on an investment of $1,000 invested at the beginning of the period and held for the entire period (May 1, 2012 to October 31, 2012).
Actual Expenses
The first line of the accompanying table for each class of the Fund provides information about actual account values and actual expenses. You may use the information in this line, together with the amount you invested, to estimate the expenses that you paid over the period. Simply divide your account value by $1,000.00 (for example, an $8,600 account value divided by $1,000.00 = 8.6), then multiply the result by the number in the first line for a class of the Fund under the heading entitled "Expenses Paid During Period" to estimate the expenses you paid on your account during this period. A small balance maintenance fee of $12.00 that is charged once a year may apply for certain accounts with a value of less than $2,000. This fee is not included in the table below. If it was, the estimate of expenses you paid during the period would be higher, and your ending account value lower, by this amount. In addition, the Fund, as a shareholder in the underlying Fidelity Central Funds, will indirectly bear its pro-rata share of the fees and expenses incurred by the underlying Fidelity Central Funds. These fees and expenses are not included in the Fund's annualized expense ratio used to calculate the expense estimate in the table below.
Hypothetical Example for Comparison Purposes
The second line of the accompanying table for each class of the Fund provides information about hypothetical account values and hypothetical expenses based on a Class' actual expense ratio and an assumed rate of return of 5% per year before expenses, which is not the Class' actual return. The hypothetical account values and expenses may not be used to estimate the actual ending account balance or expenses you paid for the period. You may use this information to compare the ongoing costs of investing in the Fund and other funds. To do so, compare this 5% hypothetical example with the 5% hypothetical examples that appear in the shareholder reports of the other funds. A small balance maintenance fee of $12.00 that is charged once a year may apply for certain accounts with a value of less than $2,000. This fee is not included in the table below. If it was, the estimate of expenses you paid during the period would be higher, and your ending account value lower, by this amount. In addition, the Fund, as a shareholder in the underlying Fidelity Central Funds, will indirectly bear its pro-rata share of the fees and expenses incurred by the underlying Fidelity Central Funds. These fees and expenses are not included in the Fund's annualized expense ratio used to calculate the expense estimate in the table below.
Please note that the expenses shown in the table are meant to highlight your ongoing costs only and do not reflect any transaction costs. Therefore, the second line of the table is useful in comparing ongoing costs only, and will not help you determine the relative total costs of owning different funds. In addition, if these transactional costs were included, your costs would have been higher.
Annual Report
Fidelity Total Emerging Markets Fund
Shareholder Expense Example - continued
| Annualized
Expense Ratio | Beginning
Account Value
May 1, 2012 | Ending
Account Value
October 31, 2012 | Expenses Paid
During Period*
May 1, 2012
to October 31, 2012 |
Class A | 1.65% | | | |
Actual | | $ 1,000.00 | $ 1,012.10 | $ 8.35 |
HypotheticalA | | $ 1,000.00 | $ 1,016.84 | $ 8.36 |
Class T | 1.90% | | | |
Actual | | $ 1,000.00 | $ 1,011.20 | $ 9.61 |
HypotheticalA | | $ 1,000.00 | $ 1,015.58 | $ 9.63 |
Class C | 2.40% | | | |
Actual | | $ 1,000.00 | $ 1,008.40 | $ 12.12 |
HypotheticalA | | $ 1,000.00 | $ 1,013.07 | $ 12.14 |
Total Emerging Markets | 1.40% | | | |
Actual | | $ 1,000.00 | $ 1,014.00 | $ 7.09 |
HypotheticalA | | $ 1,000.00 | $ 1,018.10 | $ 7.10 |
Institutional Class | 1.40% | | | |
Actual | | $ 1,000.00 | $ 1,014.00 | $ 7.09 |
HypotheticalA | | $ 1,000.00 | $ 1,018.10 | $ 7.10 |
A 5% return per year before expenses
* Expenses are equal to each Class' annualized expense ratio, multiplied by the average account value over the period, multiplied by 184/366 (to reflect the one-half year period).
Annual Report
Fidelity Total Emerging Markets Fund
Investment Changes (Unaudited)
Top Five Stocks as of October 31, 2012 |
| % of fund's
net assets | % of fund's net assets
6 months ago |
Samsung Electronics Co. Ltd. (Korea (South), Semiconductors & Semiconductor Equipment) | 3.4 | 3.2 |
Taiwan Semiconductor Manufacturing Co. Ltd. (Taiwan, Semiconductors & Semiconductor Equipment) | 1.9 | 1.9 |
Vale SA (PN-A) sponsored ADR (Brazil, Metals & Mining) | 1.6 | 1.4 |
China Construction Bank Corp. (H Shares) (China, Commercial Banks) | 1.3 | 1.3 |
Industrial & Commercial Bank of China Ltd. (H Shares) (China, Commercial Banks) | 1.3 | 1.5 |
| 9.5 | |
Top Five Market Sectors as of October 31, 2012 |
| % of fund's
net assets | % of fund's net assets
6 months ago |
Financials | 19.5 | 15.8 |
Energy | 13.9 | 15.8 |
Information Technology | 9.7 | 10.0 |
Materials | 9.1 | 8.4 |
Consumer Staples | 6.7 | 5.8 |
Top Five Countries as of October 31, 2012 |
(excluding cash equivalents) | % of fund's
net assets | % of fund's net assets
6 months ago |
Brazil | 11.2 | 11.0 |
Korea (South) | 10.7 | 9.9 |
Russia | 8.4 | 6.8 |
China | 6.6 | 5.9 |
Taiwan | 5.5 | 6.0 |
Percentages are adjusted for the effect of open futures contracts, if applicable. |
Asset Allocation (% of fund's net assets) |
As of October 31, 2012 | As of April 30, 2012 |
 | Stocks 72.4% | | | Stocks and 70.3%
Investment
Companies | |
 | Bonds 24.5% | | | Bonds 26.5% | |
| Short-Term
Investments and
Net Other Assets
(Liabilities) 3.1% | | | Short-Term
Investments and
Net Other Assets
(Liabilities) 3.2% | |

Annual Report
Fidelity Total Emerging Markets Fund
Investments October 31, 2012
Showing Percentage of Net Assets
Common Stocks - 70.5% |
| Shares | | Value |
Australia - 0.2% |
Paladin Energy Ltd. (Australia) (a) | 154,295 | | $ 181,788 |
Austria - 0.3% |
Erste Bank AG (a) | 12,390 | | 311,149 |
Bailiwick of Jersey - 0.2% |
Atrium European Real Estate Ltd. | 40,749 | | 230,334 |
Bermuda - 1.5% |
Aquarius Platinum Ltd. (Australia) | 125,044 | | 74,636 |
BW Offshore Ltd. | 420,089 | | 246,838 |
GP Investments Ltd. (depositary receipt) (a) | 121,322 | | 280,151 |
Kunlun Energy Co. Ltd. | 268,000 | | 497,958 |
Pacific Basin Shipping Ltd. | 290,000 | | 155,289 |
Seadrill Ltd. | 6,414 | | 259,652 |
TOTAL BERMUDA | | 1,514,524 |
Brazil - 9.9% |
Anhanguera Educacional Participacoes SA | 32,800 | | 574,914 |
Arezzo Industria e Comercio SA | 10,100 | | 180,264 |
Banco do Brasil SA | 28,200 | | 300,876 |
Banco do Estado Rio Grande do Sul SA | 33,650 | | 265,913 |
BM&F Bovespa SA | 84,100 | | 538,293 |
BR Properties SA | 46,500 | | 608,995 |
Braskem SA (PN-A) | 36,400 | | 240,510 |
CCR SA | 34,200 | | 300,737 |
Cia.Hering SA | 14,000 | | 321,627 |
Companhia de Bebidas das Americas (AmBev) (PN) sponsored ADR | 9,000 | | 367,110 |
Companhia de Saneamento de Minas Gerais | 7,260 | | 171,362 |
Companhia Paranaense de Energia-Copel: | | | |
(PN-B) | 1,195 | | 17,651 |
(PN-B) sponsored ADR | 14,970 | | 220,957 |
Estacio Participacoes SA | 13,600 | | 259,137 |
Fibria Celulose SA (a) | 20,500 | | 174,009 |
Gerdau SA sponsored ADR | 36,200 | | 318,198 |
Itau Unibanco Holdings SA sponsored ADR | 56,380 | | 822,020 |
Lojas Americanas SA (PN) | 55,833 | | 467,325 |
Mills Estruturas e Servicos de Engenharia SA | 18,300 | | 280,575 |
Multiplus SA | 5,700 | | 132,435 |
Petroleo Brasileiro SA - Petrobras: | | | |
(PN) sponsored ADR (non-vtg.) | 16,106 | | 330,656 |
sponsored ADR | 48,600 | | 1,030,806 |
Sul America SA unit | 8,900 | | 70,112 |
TIM Participacoes SA sponsored ADR | 3,353 | | 58,275 |
Common Stocks - continued |
| Shares | | Value |
Brazil - continued |
Ultrapar Participacoes SA | 24,500 | | $ 513,872 |
Vale SA (PN-A) sponsored ADR | 90,600 | | 1,611,774 |
TOTAL BRAZIL | | 10,178,403 |
Canada - 1.6% |
Banro Corp. (a) | 20,700 | | 95,754 |
Barrick Gold Corp. | 5,900 | | 238,599 |
First Quantum Minerals Ltd. | 13,400 | | 301,207 |
Goldcorp, Inc. | 7,300 | | 330,007 |
Pan American Silver Corp. | 4,000 | | 88,000 |
Torex Gold Resources, Inc. (a) | 49,700 | | 103,505 |
Uranium One, Inc. (a) | 66,900 | | 145,355 |
Yamana Gold, Inc. | 18,500 | | 373,612 |
TOTAL CANADA | | 1,676,039 |
Cayman Islands - 4.5% |
21Vianet Group, Inc. ADR (a) | 14,420 | | 159,774 |
Ajisen (China) Holdings Ltd. | 183,000 | | 126,564 |
Anta Sports Products Ltd. | 206,000 | | 175,431 |
Baidu.com, Inc. sponsored ADR (a) | 3,734 | | 398,119 |
Belle International Holdings Ltd. | 155,000 | | 288,798 |
China Liansu Group Holdings Ltd. | 280,000 | | 165,109 |
Eurasia Drilling Co. Ltd. GDR (Reg. S) | 13,217 | | 457,308 |
Geely Automobile Holdings Ltd. | 425,000 | | 182,612 |
Gourmet Master Co. Ltd. | 24,000 | | 170,079 |
Greatview Aseptic Pack Co. Ltd. | 579,000 | | 303,319 |
Haitian International Holdings Ltd. | 131,000 | | 161,763 |
Hengan International Group Co. Ltd. | 70,000 | | 637,673 |
SINA Corp. (a) | 1,300 | | 71,019 |
Spreadtrum Communications, Inc. ADR | 3,415 | | 78,716 |
Tencent Holdings Ltd. | 6,900 | | 243,947 |
Uni-President China Holdings Ltd. | 377,000 | | 474,287 |
Veripos (a) | 34,725 | | 100,497 |
Xueda Education Group sponsored ADR (a) | 33,300 | | 95,904 |
Yingde Gases Group Co. Ltd. | 327,500 | | 310,595 |
TOTAL CAYMAN ISLANDS | | 4,601,514 |
Chile - 0.9% |
Aguas Andinas SA | 281,427 | | 188,866 |
Embotelladora Andina SA Class A | 35,611 | | 179,110 |
Empresa Nacional de Telecomunicaciones SA (ENTEL) | 11,435 | | 232,907 |
Common Stocks - continued |
| Shares | | Value |
Chile - continued |
Enersis SA | 210,651 | | $ 72,107 |
Inversiones La Construccion SA | 13,305 | | 235,046 |
TOTAL CHILE | | 908,036 |
China - 6.6% |
BBMG Corp. (H Shares) | 196,500 | | 168,862 |
China Communications Construction Co. Ltd. (H Shares) | 329,000 | | 308,621 |
China Construction Bank Corp. (H Shares) | 1,811,000 | | 1,364,667 |
China Pacific Insurance Group Co. Ltd. (H Shares) | 205,300 | | 643,711 |
China Shenhua Energy Co. Ltd. (H Shares) | 234,500 | | 998,510 |
China Suntien Green Energy Corp. Ltd. (H Shares) | 1,494,600 | | 304,704 |
China Telecom Corp. Ltd. (H Shares) | 388,357 | | 229,771 |
Dongfeng Motor Group Co. Ltd. (H Shares) | 276,000 | | 341,882 |
Industrial & Commercial Bank of China Ltd. (H Shares) | 2,037,000 | | 1,348,354 |
Maanshan Iron & Steel Ltd. (H Shares) (a) | 810,000 | | 209,031 |
PICC Property & Casualty Co. Ltd. (H Shares) | 188,000 | | 250,342 |
Shanghai Electric Group Co. Ltd. (H Shares) | 846,000 | | 343,856 |
Weichai Power Co. Ltd. (H Shares) | 93,400 | | 330,815 |
TOTAL CHINA | | 6,843,126 |
Colombia - 0.7% |
Ecopetrol SA ADR | 11,842 | | 701,165 |
Cyprus - 0.2% |
Globaltrans Investment PLC: | | | |
GDR (e) | 6,900 | | 127,650 |
GDR (Reg. S) | 1,500 | | 27,750 |
TOTAL CYPRUS | | 155,400 |
Czech Republic - 0.2% |
Ceske Energeticke Zavody A/S | 6,068 | | 223,721 |
Egypt - 0.1% |
Orascom Telecom Holding SAE unit (a) | 46,100 | | 138,531 |
Hong Kong - 0.8% |
China Resources Power Holdings Co. Ltd. | 84,000 | | 179,921 |
Lenovo Group Ltd. | 532,000 | | 427,657 |
Sinotruk Hong Kong Ltd. | 345,500 | | 198,383 |
TOTAL HONG KONG | | 805,961 |
India - 3.2% |
Axis Bank Ltd. | 15,390 | | 338,263 |
Bharti Airtel Ltd. | 51,651 | | 258,855 |
Grasim Industries Ltd. | 2,348 | | 152,745 |
Common Stocks - continued |
| Shares | | Value |
India - continued |
Housing Development and Infrastructure Ltd. (a) | 37,732 | | $ 67,287 |
Indiabulls Real Estate Ltd. | 125,168 | | 133,299 |
ITC Ltd. | 138,460 | | 727,105 |
JK Cement Ltd. (a) | 14,380 | | 67,363 |
Larsen & Toubro Ltd. | 11,459 | | 346,475 |
Lupin Ltd. (a) | 16,696 | | 175,773 |
Maruti Suzuki India Ltd. | 12,229 | | 326,811 |
Phoenix Mills Ltd. (a) | 5,122 | | 19,106 |
Power Grid Corp. of India Ltd. | 70,024 | | 148,364 |
SREI Infrastructure Finance Ltd. | 485,175 | | 242,114 |
State Bank of India | 7,746 | | 303,801 |
TOTAL INDIA | | 3,307,361 |
Indonesia - 1.7% |
PT Bakrieland Development Tbk (a) | 15,113,500 | | 102,277 |
PT Bank Tabungan Negara Tbk | 1,521,500 | | 240,778 |
PT Indo Tambangraya Megah Tbk | 53,500 | | 226,420 |
PT Jasa Marga Tbk | 449,500 | | 271,430 |
PT Telkomunikasi Indonesia Tbk: | | | |
Series B | 58,500 | | 59,416 |
sponsored ADR | 21,864 | | 888,772 |
TOTAL INDONESIA | | 1,789,093 |
Israel - 0.4% |
Bezeq Israeli Telecommunication Corp. Ltd. | 140,100 | | 170,848 |
Check Point Software Technologies Ltd. (a) | 1,900 | | 84,607 |
NICE Systems Ltd. sponsored ADR (a) | 5,700 | | 189,810 |
TOTAL ISRAEL | | 445,265 |
Kazakhstan - 0.2% |
JSC Halyk Bank of Kazakhstan GDR unit (a) | 30,100 | | 214,011 |
Kenya - 0.5% |
Equity Bank Ltd. | 1,027,600 | | 292,652 |
Safaricom Ltd. | 3,989,903 | | 206,172 |
TOTAL KENYA | | 498,824 |
Korea (South) - 9.7% |
AMOREPACIFIC Group, Inc. | 973 | | 419,427 |
E-Mart Co. Ltd. | 2,387 | | 517,761 |
GS Engineering & Construction Corp. | 4,567 | | 257,185 |
Hana Financial Group, Inc. | 19,890 | | 579,195 |
Hyundai Heavy Industries Co. Ltd. | 1,411 | | 296,352 |
Common Stocks - continued |
| Shares | | Value |
Korea (South) - continued |
Hyundai Industrial Development & Construction Co. | 5,380 | | $ 96,713 |
KB Financial Group, Inc. | 22,190 | | 754,780 |
Kia Motors Corp. | 1,710 | | 95,042 |
Korea Electric Power Corp. (a) | 10,540 | | 273,457 |
Korean Reinsurance Co. | 16,820 | | 165,065 |
KT&G Corp. | 6,796 | | 517,965 |
LG Chemical Ltd. | 1,768 | | 496,192 |
LS Industrial Systems Ltd. | 5,350 | | 334,645 |
Orion Corp. | 334 | | 313,684 |
POSCO sponsored ADR | 4,400 | | 344,872 |
Samsung Electronics Co. Ltd. | 2,887 | | 3,468,666 |
Samsung Fire & Marine Insurance Co. Ltd. | 2,412 | | 527,608 |
Shinhan Financial Group Co. Ltd. | 11,860 | | 407,364 |
Shinhan Financial Group Co. Ltd. sponsored ADR | 4,828 | | 165,214 |
TOTAL KOREA (SOUTH) | | 10,031,187 |
Luxembourg - 0.3% |
Subsea 7 SA | 15,100 | | 331,330 |
Malaysia - 0.5% |
Axiata Group Bhd | 136,700 | | 293,057 |
Petronas Dagangan Bhd | 32,500 | | 235,588 |
TOTAL MALAYSIA | | 528,645 |
Mexico - 3.4% |
America Movil SAB de CV Series L sponsored ADR | 44,120 | | 1,115,795 |
CEMEX SA de CV sponsored ADR | 41,288 | | 373,244 |
Desarrolladora Homex SAB de CV sponsored ADR (a) | 7,350 | | 97,388 |
El Puerto de Liverpool SA Class C | 20,900 | | 187,308 |
Fibra Uno Administracion SA de CV | 95,000 | | 250,306 |
Fomento Economico Mexicano SAB de CV sponsored ADR | 5,200 | | 471,172 |
Grupo Comercial Chedraui de CV | 73,700 | | 198,518 |
Grupo Televisa SA de CV (CPO) sponsored ADR | 34,300 | | 775,180 |
TOTAL MEXICO | | 3,468,911 |
Netherlands - 0.1% |
ASML Holding NV (Netherlands) | 2,775 | | 152,548 |
Nigeria - 1.2% |
Guaranty Trust Bank PLC | 627,668 | | 79,128 |
Guaranty Trust Bank PLC GDR (Reg. S) | 69,900 | | 433,380 |
Zenith Bank PLC | 5,943,111 | | 681,872 |
TOTAL NIGERIA | | 1,194,380 |
Common Stocks - continued |
| Shares | | Value |
Norway - 0.9% |
ElectroMagnetic GeoServices ASA (a) | 102,680 | | $ 223,323 |
Petroleum Geo-Services ASA | 8,800 | | 151,727 |
TGS Nopec Geophysical Co. ASA | 16,928 | | 576,015 |
TOTAL NORWAY | | 951,065 |
Panama - 0.4% |
Copa Holdings SA Class A | 4,200 | | 389,844 |
Peru - 0.2% |
Compania de Minas Buenaventura SA sponsored ADR | 6,000 | | 214,560 |
Philippines - 1.1% |
Metro Pacific Investments Corp. | 2,899,000 | | 292,016 |
Metropolitan Bank & Trust Co. | 138,200 | | 319,440 |
Robinsons Land Corp. | 1,121,000 | | 518,224 |
TOTAL PHILIPPINES | | 1,129,680 |
Poland - 0.8% |
Eurocash SA | 14,100 | | 172,195 |
Powszechny Zaklad Ubezpieczen SA | 5,375 | | 627,966 |
TOTAL POLAND | | 800,161 |
Russia - 5.8% |
Bank St. Petersburg OJSC | 41,600 | | 76,567 |
DIXY Group OJSC (a) | 17,805 | | 188,095 |
Gazprom OAO sponsored ADR | 70,532 | | 644,662 |
LSR Group OJSC GDR (Reg. S) | 24,100 | | 116,042 |
Lukoil Oil Co. (a) | 3,200 | | 194,292 |
Magnit OJSC | 1,822 | | 259,555 |
Magnit OJSC GDR (Reg. S) | 4,900 | | 173,950 |
Magnitogorsk Iron & Steel Works OJSC unit (a) | 30,900 | | 133,241 |
Mobile TeleSystems OJSC (a) | 80,060 | | 589,037 |
Mobile TeleSystems OJSC sponsored ADR | 28,390 | | 486,605 |
NOVATEK OAO GDR (Reg. S) | 5,200 | | 592,800 |
OGK-4 OJSC (a) | 6,094,400 | | 500,679 |
Raspadskaya OAO (a) | 38,412 | | 75,745 |
Rosneft Oil Co. OJSC | 14,500 | | 107,608 |
RusHydro JSC sponsored ADR | 67,240 | | 159,628 |
Sberbank (Savings Bank of the Russian Federation) | 379,050 | | 1,109,639 |
Sistema JSFC (a) | 156,700 | | 117,879 |
TNK-BP Holding | 49,360 | | 100,764 |
Uralkali OJSC GDR (Reg. S) | 9,100 | | 356,538 |
TOTAL RUSSIA | | 5,983,326 |
Common Stocks - continued |
| Shares | | Value |
Singapore - 0.9% |
First Resources Ltd. | 277,000 | | $ 465,527 |
Global Logistic Properties Ltd. | 201,000 | | 423,487 |
TOTAL SINGAPORE | | 889,014 |
South Africa - 2.9% |
AngloGold Ashanti Ltd. | 9,100 | | 307,447 |
Aspen Pharmacare Holdings Ltd. | 17,500 | | 318,892 |
Blue Label Telecoms Ltd. | 171,800 | | 133,546 |
Impala Platinum Holdings Ltd. | 29,100 | | 523,559 |
JSE Ltd. | 54,670 | | 443,443 |
Life Healthcare Group Holdings Ltd. | 72,400 | | 273,797 |
Naspers Ltd. Class N | 11,500 | | 746,595 |
Reunert Ltd. | 18,500 | | 162,967 |
Wilson Bayly Holmes-Ovcon Ltd. | 3,600 | | 58,999 |
TOTAL SOUTH AFRICA | | 2,969,245 |
Taiwan - 5.5% |
Asia Cement Corp. | 186,430 | | 232,319 |
Cheng Uei Precision Industries Co. Ltd. | 135,339 | | 299,775 |
Chinatrust Financial Holding Co. Ltd. | 640,042 | | 352,779 |
Chroma ATE, Inc. | 74,000 | | 140,856 |
Hon Hai Precision Industry Co. Ltd. (Foxconn) | 209,500 | | 636,174 |
MediaTek, Inc. | 37,000 | | 411,041 |
Synnex Technology International Corp. | 155,000 | | 327,936 |
Taiwan Fertilizer Co. Ltd. | 99,000 | | 235,892 |
Taiwan Mobile Co. Ltd. | 95,000 | | 331,736 |
Taiwan Semiconductor Manufacturing Co. Ltd. | 408,000 | | 1,243,307 |
Taiwan Semiconductor Manufacturing Co. Ltd. sponsored ADR | 45,700 | | 726,630 |
Unified-President Enterprises Corp. | 279,660 | | 494,025 |
Yuanta Financial Holding Co. Ltd. | 576,000 | | 260,294 |
TOTAL TAIWAN | | 5,692,764 |
Thailand - 0.8% |
Bangkok Bank Public Co. Ltd. (For. Reg.) | 92,900 | | 548,252 |
PTT Global Chemical PCL (For. Reg.) | 124,400 | | 247,421 |
TOTAL THAILAND | | 795,673 |
Turkey - 0.8% |
Aygaz A/S | 52,000 | | 239,621 |
TAV Havalimanlari Holding A/S | 62,000 | | 307,838 |
Turkiye Is Bankasi A/S Series C | 84,900 | | 288,921 |
TOTAL TURKEY | | 836,380 |
Common Stocks - continued |
| Shares | | Value |
United Kingdom - 0.6% |
Evraz PLC | 32,100 | | $ 122,355 |
Hikma Pharmaceuticals PLC | 15,011 | | 179,137 |
Kazakhmys PLC | 26,800 | | 306,632 |
TOTAL UNITED KINGDOM | | 608,124 |
United States of America - 0.9% |
Cognizant Technology Solutions Corp. Class A (a) | 6,300 | | 419,895 |
CTC Media, Inc. | 20,050 | | 168,220 |
Universal Display Corp. (a) | 9,027 | | 295,905 |
TOTAL UNITED STATES OF AMERICA | | 884,020 |
TOTAL COMMON STOCKS (Cost $67,155,590) |
72,575,102
|
Nonconvertible Preferred Stocks - 1.9% |
| | | |
Korea (South) - 1.0% |
Hyundai Motor Co. Series 2 | 9,913 | | 650,066 |
Samsung Electronics Co. Ltd. | 467 | | 339,225 |
TOTAL KOREA (SOUTH) | | 989,291 |
Russia - 0.9% |
Sberbank (Savings Bank of the Russian Federation) (a) | 209,600 | | 441,379 |
Surgutneftegaz JSC | 833,750 | | 516,404 |
TOTAL RUSSIA | | 957,783 |
TOTAL NONCONVERTIBLE PREFERRED STOCKS (Cost $1,906,405) |
1,947,074
|
Nonconvertible Bonds - 7.3% |
| Principal
Amount | | |
Bermuda - 0.2% |
Qtel International Finance Ltd. 5% 10/19/25 (e) | | $ 200,000 | | 226,260 |
Canada - 0.2% |
Pacific Rubiales Energy Corp. 7.25% 12/12/21 (e) | | 200,000 | | 238,500 |
Cayman Islands - 0.1% |
Odebrecht Finance Ltd. 7.5% (e)(f) | | 100,000 | | 107,000 |
Chile - 0.1% |
Corporacion Nacional del Cobre de Chile (Codelco) 6.15% 10/24/36 (e) | | 100,000 | | 130,477 |
Nonconvertible Bonds - continued |
| Principal
Amount | | Value |
Costa Rica - 0.2% |
Instituto Costarricense de Electricidad 6.95% 11/10/21 (e) | | $ 200,000 | | $ 222,500 |
Croatia - 0.2% |
Agrokor d.d. 8.875% 2/1/20 (e) | | 200,000 | | 208,000 |
Georgia - 0.2% |
JSC Georgian Railway 7.75% 7/11/22 (e) | | 200,000 | | 224,000 |
Guatemala - 0.1% |
Industrial Senior Trust 5.5% 11/1/22 (e) | | 100,000 | | 101,000 |
Indonesia - 0.8% |
PT Pertamina Persero: | | | | |
5.25% 5/23/21 (e) | | 550,000 | | 611,875 |
6.5% 5/27/41 (e) | | 200,000 | | 237,000 |
TOTAL INDONESIA | | 848,875 |
Ireland - 0.2% |
Vnesheconombank Via VEB Finance PLC 5.375% 2/13/17 (e) | | 200,000 | | 219,250 |
Israel - 0.2% |
Israel Electric Corp. Ltd. 6.7% 2/10/17 (e) | | 200,000 | | 218,500 |
Kazakhstan - 0.2% |
Zhaikmunai Finance BV 10.5% 10/19/15 (e) | | 150,000 | | 164,625 |
Mexico - 0.4% |
Petroleos Mexicanos: | | | | |
5.5% 1/21/21 | | 250,000 | | 294,000 |
6.625% (e)(f) | | 100,000 | | 107,250 |
TOTAL MEXICO | | 401,250 |
Netherlands - 0.8% |
Access Finance BV 7.25% 7/25/17 (e) | | 200,000 | | 209,500 |
KazMunaiGaz Finance Sub BV: | | | | |
6.375% 4/9/21 (e) | | 100,000 | | 118,750 |
9.125% 7/2/18 (e) | | 150,000 | | 195,000 |
11.75% 1/23/15 (e) | | 100,000 | | 119,880 |
Majapahit Holding BV 8% 8/7/19 (e) | | 100,000 | | 127,000 |
TOTAL NETHERLANDS | | 770,130 |
Philippines - 0.2% |
Power Sector Assets and Liabilities Management Corp. 7.39% 12/2/24 (e) | | 125,000 | | 174,850 |
Nonconvertible Bonds - continued |
| Principal
Amount | | Value |
Sweden - 0.2% |
PKO Finance AB 4.63% 9/26/22 (e) | | $ 200,000 | | $ 206,500 |
Trinidad & Tobago - 0.1% |
Petroleum Co. of Trinidad & Tobago Ltd. 9.75% 8/14/19 (e) | | 100,000 | | 132,000 |
Turkey - 0.1% |
Akbank T.A.S. 3.875% 10/24/17 (e) | | 150,000 | | 148,500 |
United States of America - 0.5% |
Pemex Project Funding Master Trust: | | | | |
6.625% 6/15/35 | | 200,000 | | 251,000 |
8.625% 2/1/22 | | 175,000 | | 221,375 |
TOTAL UNITED STATES OF AMERICA | | 472,375 |
Venezuela - 2.3% |
Petroleos de Venezuela SA: | | | | |
4.9% 10/28/14 | | 1,100,000 | | 1,014,750 |
5.375% 4/12/27 | | 400,000 | | 251,000 |
5.5% 4/12/37 | | 600,000 | | 363,000 |
8.5% 11/2/17 (e) | | 450,000 | | 402,750 |
12.75% 2/17/22 (e) | | 300,000 | | 306,750 |
TOTAL VENEZUELA | | 2,338,250 |
TOTAL NONCONVERTIBLE BONDS (Cost $6,911,731) |
7,552,842
|
Government Obligations - 17.2% |
|
Aruba - 0.2% |
Aruba Government 4.625% 9/14/23 (e) | | 200,000 | | 199,500 |
Barbados - 0.1% |
Barbados Government 7% 8/4/22 (e) | | 100,000 | | 101,500 |
Belarus - 0.3% |
Belarus Republic: | | | | |
8.75% 8/3/15 (Reg. S) | | 225,000 | | 222,188 |
8.95% 1/26/18 | | 100,000 | | 98,750 |
TOTAL BELARUS | | 320,938 |
Belize - 0.1% |
Belize Government 8.5% 2/20/29 (c)(e) | | 150,000 | | 60,000 |
Bermuda - 0.1% |
Bermuda Government 5.603% 7/20/20 (e) | | 100,000 | | 116,500 |
Government Obligations - continued |
| Principal
Amount | | Value |
Bolivia - 0.2% |
Plurinational State of Bolivia 4.875% 10/29/22 (e) | | $ 200,000 | | $ 200,500 |
Brazil - 1.3% |
Brazilian Federative Republic: | | | | |
7.125% 1/20/37 | | 200,000 | | 300,500 |
10.125% 5/15/27 | | 150,000 | | 271,500 |
12.25% 3/6/30 | | 350,000 | | 721,000 |
TOTAL BRAZIL | | 1,293,000 |
Cayman Islands - 0.1% |
Cayman Island Government 5.95% 11/24/19 (e) | | 100,000 | | 116,500 |
Colombia - 0.2% |
Colombian Republic 10.375% 1/28/33 | | 90,000 | | 165,150 |
Congo - 0.1% |
Congo Republic 3% 6/30/29 (d) | | 95,000 | | 79,800 |
Croatia - 0.5% |
Croatia Republic: | | | | |
6.25% 4/27/17 (e) | | 200,000 | | 219,500 |
6.375% 3/24/21 (e) | | 200,000 | | 227,000 |
6.625% 7/14/20 (e) | | 100,000 | | 115,130 |
TOTAL CROATIA | | 561,630 |
Ecuador - 0.2% |
Ecuador Republic 9.375% 12/15/15 (e) | | 236,000 | | 238,360 |
El Salvador - 0.2% |
El Salvador Republic 7.375% 12/1/19 (e) | | 175,000 | | 203,875 |
Ghana - 0.1% |
Ghana Republic 8.5% 10/4/17 (e) | | 100,000 | | 116,000 |
Guatemala - 0.2% |
Guatemalan Republic 5.75% 6/6/22 (e) | | 200,000 | | 228,500 |
Hungary - 0.5% |
Hungarian Republic: | | | | |
4.75% 2/3/15 | | 365,000 | | 373,687 |
7.625% 3/29/41 | | 100,000 | | 118,000 |
TOTAL HUNGARY | | 491,687 |
Government Obligations - continued |
| Principal
Amount | | Value |
Iceland - 0.2% |
Republic of Iceland: | | | | |
4.875% 6/16/16 (e) | | $ 100,000 | | $ 104,625 |
5.875% 5/11/22 (e) | | 100,000 | | 109,750 |
TOTAL ICELAND | | 214,375 |
Indonesia - 0.4% |
Indonesian Republic: | | | | |
7.75% 1/17/38 (e) | | 175,000 | | 264,915 |
8.5% 10/12/35 (e) | | 100,000 | | 160,250 |
TOTAL INDONESIA | | 425,165 |
Iraq - 0.5% |
Republic of Iraq 5.8% 1/15/28 (Reg. S) | | 550,000 | | 514,250 |
Ivory Coast - 0.5% |
Ivory Coast 3.75% 12/31/32 (c)(d) | | 575,000 | | 516,063 |
Latvia - 0.2% |
Latvian Republic 5.25% 2/22/17 (e) | | 200,000 | | 220,500 |
Lebanon - 0.5% |
Lebanese Republic: | | | | |
6.1% 10/4/22 | | 190,000 | | 192,613 |
11.625% 5/11/16 (Reg. S) | | 250,000 | | 305,000 |
TOTAL LEBANON | | 497,613 |
Lithuania - 0.5% |
Lithuanian Republic: | | | | |
6.125% 3/9/21 (e) | | 100,000 | | 119,750 |
6.625% 2/1/22 (e) | | 200,000 | | 247,000 |
7.375% 2/11/20 (e) | | 100,000 | | 127,125 |
TOTAL LITHUANIA | | 493,875 |
Mexico - 0.7% |
United Mexican States: | | | | |
5.75% 10/12/10 | | 124,000 | | 146,320 |
6.05% 1/11/40 | | 200,000 | | 266,000 |
6.75% 9/27/34 | | 200,000 | | 282,000 |
TOTAL MEXICO | | 694,320 |
Namibia - 0.2% |
Republic of Namibia 5.5% 11/3/21 (e) | | 200,000 | | 223,320 |
Government Obligations - continued |
| Principal
Amount | | Value |
Netherlands - 0.3% |
Republic of Angola 7% 8/16/19 (Issued by Northern Lights III BV for Republic of Angola) (Reg. S) | | $ 250,000 | | $ 279,375 |
Nigeria - 0.6% |
Republic of Nigeria 6.75% 1/28/21 (e) | | 550,000 | | 631,125 |
Panama - 0.3% |
Panamanian Republic: | | | | |
8.875% 9/30/27 | | 55,000 | | 89,238 |
9.375% 4/1/29 | | 150,000 | | 257,250 |
TOTAL PANAMA | | 346,488 |
Peru - 0.6% |
Peruvian Republic 8.75% 11/21/33 | | 345,000 | | 600,300 |
Philippines - 1.1% |
Philippine Republic: | | | | |
6.375% 10/23/34 | | 150,000 | | 208,500 |
7.75% 1/14/31 | | 125,000 | | 193,125 |
10.625% 3/16/25 | | 425,000 | | 746,938 |
TOTAL PHILIPPINES | | 1,148,563 |
Poland - 0.2% |
Polish Government: | | | | |
5% 3/23/22 | | 35,000 | | 40,819 |
6.375% 7/15/19 | | 135,000 | | 168,075 |
TOTAL POLAND | | 208,894 |
Qatar - 0.3% |
State of Qatar 5.75% 1/20/42 (e) | | 200,000 | | 257,000 |
Romania - 0.2% |
Romanian Republic 6.75% 2/7/22 (e) | | 190,000 | | 219,450 |
Russia - 1.7% |
Russian Federation: | | | | |
5.625% 4/4/42 (e) | | 200,000 | | 241,000 |
7.5% 3/31/30 (Reg. S) | | 697,500 | | 882,338 |
11% 7/24/18 (Reg. S) | | 200,000 | | 293,000 |
12.75% 6/24/28 (Reg. S) | | 175,000 | | 345,188 |
TOTAL RUSSIA | | 1,761,526 |
Senegal - 0.2% |
Republic of Senegal 8.75% 5/13/21 (e) | | 200,000 | | 242,000 |
Serbia - 0.0% |
Republic of Serbia 6.75% 11/1/24 (e) | | 41,667 | | 41,250 |
Government Obligations - continued |
| Principal
Amount | | Value |
Slovakia - 0.2% |
Slovakia Republic 4.375% 5/21/22 (e) | | $ 200,000 | | $ 214,000 |
Slovenia - 0.2% |
Republic of Slovenia 5.5% 10/26/22 (e) | | 200,000 | | 199,500 |
South Africa - 0.1% |
South African Republic 4.665% 1/17/24 | | 100,000 | | 110,250 |
Sri Lanka - 0.3% |
Democratic Socialist Republic of Sri Lanka: | | | | |
5.875% 7/25/22 (e) | | 200,000 | | 221,000 |
6.25% 10/4/20 (e) | | 100,000 | | 112,500 |
TOTAL SRI LANKA | | 333,500 |
Turkey - 1.3% |
Turkish Republic: | | | | |
7% 6/5/20 | | 300,000 | | 375,000 |
7.5% 7/14/17 | | 100,000 | | 121,000 |
11.875% 1/15/30 | | 450,000 | | 855,000 |
TOTAL TURKEY | | 1,351,000 |
Ukraine - 0.3% |
Ukraine Government: | | | | |
7.75% 9/23/20 (e) | | 100,000 | | 104,370 |
9.25% 7/24/17 (e) | | 200,000 | | 217,760 |
TOTAL UKRAINE | | 322,130 |
Uruguay - 0.1% |
Uruguay Republic 7.625% 3/21/36 | | 75,000 | | 116,250 |
Venezuela - 0.9% |
Venezuelan Republic: | | | | |
7.75% 10/13/19 (Reg. S) | | 85,000 | | 73,738 |
11.75% 10/21/26 (Reg. S) | | 300,000 | | 300,750 |
11.95% 8/5/31 (Reg. S) | | 350,000 | | 354,375 |
12.75% 8/23/22 | | 135,000 | | 144,113 |
TOTAL VENEZUELA | | 872,976 |
Zambia - 0.2% |
Republic of Zambia 5.375% 9/20/22 (e) | | 200,000 | | 201,400 |
TOTAL GOVERNMENT OBLIGATIONS (Cost $15,928,776) |
17,749,898
|
Money Market Funds - 3.0% |
| Shares | | Value |
Fidelity Cash Central Fund, 0.19% (b)
(Cost $3,099,243) | 3,099,243 | | $ 3,099,243 |
TOTAL INVESTMENT PORTFOLIO - 99.9% (Cost $95,001,745) | | 102,924,159 |
NET OTHER ASSETS (LIABILITIES) - 0.1% | | 102,208 |
NET ASSETS - 100% | $ 103,026,367 |
Legend |
(a) Non-income producing |
(b) Affiliated fund that is available only to investment companies and other accounts managed by Fidelity Investments. The rate quoted is the annualized seven-day yield of the fund at period end. A complete unaudited listing of the fund's holdings as of its most recent quarter end is available upon request. In addition, each Fidelity Central Fund's financial statements, which are not covered by the Fund's Report of Independent Registered Public Accounting Firm, are available on the SEC's website or upon request. |
(c) Non-income producing - Security is in default. |
(d) Security initially issued at one coupon which converts to a higher coupon at a specified date. The rate shown is the rate at period end. |
(e) Security exempt from registration under Rule 144A of the Securities Act of 1933. These securities may be resold in transactions exempt from registration, normally to qualified institutional buyers. At the end of the period, the value of these securities amounted to $11,907,822 or 11.6% of net assets. |
(f) Security is perpetual in nature with no stated maturity date. |
Affiliated Central Funds |
Information regarding fiscal year to date income earned by the Fund from investments in Fidelity Central Funds is as follows: |
Fund | Income earned |
Fidelity Cash Central Fund | $ 3,818 |
Fidelity Securities Lending Cash Central Fund | 315 |
Total | $ 4,133 |
Other Information |
Categorizations in the Schedule of Investments are based on country or territory of incorporation. |
The following is a summary of the inputs used, as of October 31, 2012, involving the Fund's assets and liabilities carried at fair value. The inputs or methodology used for valuing securities may not be an indication of the risk associated with investing in those securities. For more information on valuation inputs, and their aggregation into the levels used in the table below, please refer to the Security Valuation section in the accompanying Notes to Financial Statements. |
Valuation Inputs at Reporting Date: |
Description | Total | Level 1 | Level 2 | Level 3 |
Investments in Securities: | | | | |
Equities: | | | | |
Consumer Discretionary | $ 6,231,147 | $ 6,231,147 | $ - | $ - |
Consumer Staples | 6,577,159 | 6,577,159 | - | - |
Energy | 9,569,545 | 9,569,545 | - | - |
Financials | 19,085,912 | 18,331,132 | 754,780 | - |
Health Care | 947,599 | 947,599 | - | - |
Industrials | 5,289,474 | 5,289,474 | - | - |
Information Technology | 10,115,607 | 8,719,752 | 1,395,855 | - |
Materials | 9,131,743 | 8,671,551 | 460,192 | - |
Telecommunication Services | 5,177,656 | 4,888,469 | 289,187 | - |
Utilities | 2,396,334 | 2,122,877 | 273,457 | - |
Corporate Bonds | 7,552,842 | - | 7,552,842 | - |
Government Obligations | 17,749,898 | - | 17,749,898 | - |
Money Market Funds | 3,099,243 | 3,099,243 | - | - |
Total Investments in Securities: | $ 102,924,159 | $ 74,447,948 | $ 28,476,211 | $ - |
The composition of credit quality ratings as a percentage of net assets is as follows (Unaudited): |
AAA,AA,A | 1.6% |
BBB | 10.7% |
BB | 4.5% |
B | 5.0% |
CCC,CC,C | 0.3% |
Not Rated | 2.4% |
Equities | 72.4% |
Short-Term Investments and
Net Other Assets | 3.1% |
| 100.0% |
We have used ratings from Moody's Investors Service, Inc. Where Moody's® ratings are not available, we have used S&P® ratings. All ratings are as of the date indicated and do not reflect subsequent changes. |
See accompanying notes which are an integral part of the financial statements.
Annual Report
Fidelity Total Emerging Markets Fund
Statement of Assets and Liabilities
| October 31, 2012 |
| | |
Assets | | |
Investment in securities, at value - See accompanying schedule: Unaffiliated issuers (cost $91,902,502) | $ 99,824,916 | |
Fidelity Central Funds (cost $3,099,243) | 3,099,243 | |
Total Investments (cost $95,001,745) | | $ 102,924,159 |
Cash | | 705,020 |
Foreign currency held at value (cost $27,710) | | 27,720 |
Receivable for investments sold | | 768,066 |
Receivable for fund shares sold | | 90,619 |
Dividends receivable | | 92,479 |
Interest receivable | | 361,664 |
Distributions receivable from Fidelity Central Funds | | 312 |
Receivable from investment adviser for expense reductions | | 32,905 |
Other receivables | | 7,009 |
Total assets | | 105,009,953 |
| | |
Liabilities | | |
Payable for investments purchased | $ 1,645,445 | |
Payable for fund shares redeemed | 67,594 | |
Accrued management fee | 69,068 | |
Distribution and service plan fees payable | 8,928 | |
Other affiliated payables | 20,243 | |
Other payables and accrued expenses | 172,308 | |
Total liabilities | | 1,983,586 |
| | |
Net Assets | | $ 103,026,367 |
Net Assets consist of: | | |
Paid in capital | | $ 95,354,127 |
Undistributed net investment income | | 1,406,377 |
Accumulated undistributed net realized gain (loss) on investments and foreign currency transactions | | (1,593,639) |
Net unrealized appreciation (depreciation) on investments and assets and liabilities in foreign currencies | | 7,859,502 |
Net Assets | | $ 103,026,367 |
See accompanying notes which are an integral part of the financial statements.
Annual Report
Fidelity Total Emerging Markets Fund
Financial Statements - continued
Statement of Assets and Liabilities - continued
| October 31, 2012 |
| | |
Calculation of Maximum Offering Price Class A:
Net Asset Value and redemption price per share ($7,675,347 ÷ 706,507 shares) | | $ 10.86 |
| | |
Maximum offering price per share (100/94.25 of $10.86) | | $ 11.52 |
Class T:
Net Asset Value and redemption price per share ($5,822,909 ÷ 537,125 shares) | | $ 10.84 |
| | |
Maximum offering price per share (100/96.50 of $10.84) | | $ 11.23 |
Class C:
Net Asset Value and offering price per share ($5,824,450 ÷ 539,492 shares)A | | $ 10.80 |
| | |
Total Emerging Markets:
Net Asset Value, offering price and redemption price per share ($81,416,417 ÷ 7,478,534 shares) | | $ 10.89 |
| | |
Institutional Class:
Net Asset Value, offering price and redemption price per share ($2,287,244 ÷ 210,097 shares) | | $ 10.89 |
A Redemption price per share is equal to net asset value less any applicable contingent deferred sales charge.
See accompanying notes which are an integral part of the financial statements.
Annual Report
Statement of Operations
| | For the period
November 1, 2011
(commencement of
operations) to
October 31, 2012 |
| | |
Investment Income | | |
Dividends | | $ 1,585,174 |
Interest | | 1,369,434 |
Income from Fidelity Central Funds | | 4,133 |
Income before foreign taxes withheld | | 2,958,741 |
Less foreign taxes withheld | | (172,929) |
Total income | | 2,785,812 |
| | |
Expenses | | |
Management fee | $ 633,456 | |
Transfer agent fees | 147,018 | |
Distribution and service plan fees | 91,027 | |
Accounting and security lending fees | 40,641 | |
Custodian fees and expenses | 250,107 | |
Independent trustees' compensation | 459 | |
Registration fees | 129,540 | |
Audit | 59,305 | |
Legal | 288 | |
Miscellaneous | 484 | |
Total expenses before reductions | 1,352,325 | |
Expense reductions | (179,390) | 1,172,935 |
Net investment income (loss) | | 1,612,877 |
Realized and Unrealized Gain (Loss) Net realized gain (loss) on: | | |
Investment securities: | | |
Unaffiliated issuers (net of foreign taxes of $2,465) | (1,514,743) | |
Foreign currency transactions | (71,319) | |
Total net realized gain (loss) | | (1,586,062) |
Change in net unrealized appreciation (depreciation) on: Investment securities (net of increase in deferred foreign taxes of $61,936) | 7,860,478 | |
Assets and liabilities in foreign currencies | (976) | |
Total change in net unrealized appreciation (depreciation) | | 7,859,502 |
Net gain (loss) | | 6,273,440 |
Net increase (decrease) in net assets resulting from operations | | $ 7,886,317 |
See accompanying notes which are an integral part of the financial statements.
Annual Report
Fidelity Total Emerging Markets Fund
Financial Statements - continued
Statement of Changes in Net Assets
| For the period
November 1, 2011
(commencement of
operations) to
October 31, 2012 |
Increase (Decrease) in Net Assets | |
Operations | |
Net investment income (loss) | $ 1,612,877 |
Net realized gain (loss) | (1,586,062) |
Change in net unrealized appreciation (depreciation) | 7,859,502 |
Net increase (decrease) in net assets resulting from operations | 7,886,317 |
Distributions to shareholders from net investment income | (96,645) |
Share transactions - net increase (decrease) | 95,209,478 |
Redemption fees | 27,217 |
Total increase (decrease) in net assets | 103,026,367 |
| |
Net Assets | |
Beginning of period | - |
End of period (including undistributed net investment income of $1,406,377) | $ 103,026,367 |
See accompanying notes which are an integral part of the financial statements.
Annual Report
Financial Highlights - Class A
Period ended October 31, | 2012 F |
Selected Per-Share Data | |
Net asset value, beginning of period | $ 10.00 |
Income from Investment Operations | |
Net investment income (loss) C | .20 |
Net realized and unrealized gain (loss) | .68 |
Total from investment operations | .88 |
Distributions from net investment income | (.02) |
Redemption fees added to paid in capital C, H | - |
Net asset value, end of period | $ 10.86 |
Total Return A, B | 8.80% |
Ratios to Average Net Assets D, G | |
Expenses before reductions | 1.87% |
Expenses net of fee waivers, if any | 1.65% |
Expenses net of all reductions | 1.62% |
Net investment income (loss) | 1.92% |
Supplemental Data | |
Net assets, end of period (000 omitted) | $ 7,675 |
Portfolio turnover rate E | 70% |
A Total returns would have been lower if certain expenses had not been reduced during the applicable periods shown.
B Total returns do not include the effect of the sales charges.
C Calculated based on average shares outstanding during the period.
D Fees and expenses of any underlying Fidelity Central Funds are not included in the Fund's expense ratio. The Fund indirectly bears its proportionate share of the expenses of any underlying Fidelity Central Funds.
E Amount does not include the portfolio activity of any underlying Fidelity Central Funds.
F For the period November 1, 2011 (commencement of operations) to October 31, 2012.
G Expense ratios reflect operating expenses of the class. Expenses before reductions do not reflect amounts reimbursed by the investment adviser or reductions from brokerage service arrangements or reductions from other expense offset arrangements and do not represent the amount paid by the class during periods when reimbursements or reductions occur. Expense ratios before reductions for start-up periods may not be representative of longer-term operating periods. Expenses net of fee waivers reflect expenses after reimbursement by the investment adviser but prior to reductions from brokerage service arrangements or other expense offset arrangements. Expenses net of all reductions represent the net expenses paid by the class.
H Amount represents less than $.01 per share.
See accompanying notes which are an integral part of the financial statements.
Annual Report
Financial Highlights - Class T
Period ended October 31, | 2012 F |
Selected Per-Share Data | |
Net asset value, beginning of period | $ 10.00 |
Income from Investment Operations | |
Net investment income (loss) C | .17 |
Net realized and unrealized gain (loss) | .68 |
Total from investment operations | .85 |
Distributions from net investment income | (.01) |
Redemption fees added to paid in capital C, H | - |
Net asset value, end of period | $ 10.84 |
Total Return A, B | 8.56% |
Ratios to Average Net Assets D, G | |
Expenses before reductions | 2.10% |
Expenses net of fee waivers, if any | 1.90% |
Expenses net of all reductions | 1.87% |
Net investment income (loss) | 1.67% |
Supplemental Data | |
Net assets, end of period (000 omitted) | $ 5,823 |
Portfolio turnover rate E | 70% |
A Total returns would have been lower if certain expenses had not been reduced during the applicable periods shown.
B Total returns do not include the effect of the sales charges.
C Calculated based on average shares outstanding during the period.
D Fees and expenses of any underlying Fidelity Central Funds are not included in the Fund's expense ratio. The Fund indirectly bears its proportionate share of the expenses of any underlying Fidelity Central Funds.
E Amount does not include the portfolio activity of any underlying Fidelity Central Funds.
F For the period November 1, 2011 (commencement of operations) to October 31, 2012.
G Expense ratios reflect operating expenses of the class. Expenses before reductions do not reflect amounts reimbursed by the investment adviser or reductions from brokerage service arrangements or reductions from other expense offset arrangements and do not represent the amount paid by the class during periods when reimbursements or reductions occur. Expense ratios before reductions for start-up periods may not be representative of longer-term operating periods. Expenses net of fee waivers reflect expenses after reimbursement by the investment adviser but prior to reductions from brokerage service arrangements or other expense offset arrangements. Expenses net of all reductions represent the net expenses paid by the class.
H Amount represents less than $.01 per share.
See accompanying notes which are an integral part of the financial statements.
Annual Report
Financial Highlights - Class C
Period ended October 31, | 2012 F |
Selected Per-Share Data | |
Net asset value, beginning of period | $ 10.00 |
Income from Investment Operations | |
Net investment income (loss) C | .12 |
Net realized and unrealized gain (loss) | .69 |
Total from investment operations | .81 |
Distributions from net investment income | (.01) |
Redemption fees added to paid in capital C, H | - |
Net asset value, end of period | $ 10.80 |
Total Return A, B | 8.07% |
Ratios to Average Net Assets D, G | |
Expenses before reductions | 2.63% |
Expenses net of fee waivers, if any | 2.40% |
Expenses net of all reductions | 2.37% |
Net investment income (loss) | 1.17% |
Supplemental Data | |
Net assets, end of period (000 omitted) | $ 5,824 |
Portfolio turnover rate E | 70% |
A Total returns would have been lower if certain expenses had not been reduced during the applicable periods shown.
B Total returns do not include the effect of the contingent deferred sales charge.
C Calculated based on average shares outstanding during the period.
D Fees and expenses of any underlying Fidelity Central Funds are not included in the Fund's expense ratio. The Fund indirectly bears its proportionate share of the expenses of any underlying Fidelity Central Funds.
E Amount does not include the portfolio activity of any underlying Fidelity Central Funds.
F For the period November 1, 2011 (commencement of operations) to October 31, 2012.
G Expense ratios reflect operating expenses of the class. Expenses before reductions do not reflect amounts reimbursed by the investment adviser or reductions from brokerage service arrangements or reductions from other expense offset arrangements and do not represent the amount paid by the class during periods when reimbursements or reductions occur. Expense ratios before reductions for start-up periods may not be representative of longer-term operating periods. Expenses net of fee waivers reflect expenses after reimbursement by the investment adviser but prior to reductions from brokerage service arrangements or other expense offset arrangements. Expenses net of all reductions represent the net expenses paid by the class.
H Amount represents less than $.01 per share.
See accompanying notes which are an integral part of the financial statements.
Annual Report
Financial Highlights - Total Emerging Markets
Period ended October 31, | 2012 E |
Selected Per-Share Data | |
Net asset value, beginning of period | $ 10.00 |
Income from Investment Operations | |
Net investment income (loss) B | .22 |
Net realized and unrealized gain (loss) | .69 |
Total from investment operations | .91 |
Distributions from net investment income | (.02) |
Redemption fees added to paid in capital B, G | - |
Net asset value, end of period | $ 10.89 |
Total Return A | 9.15% |
Ratios to Average Net Assets C, F | |
Expenses before reductions | 1.60% |
Expenses net of fee waivers, if any | 1.40% |
Expenses net of all reductions | 1.38% |
Net investment income (loss) | 2.16% |
Supplemental Data | |
Net assets, end of period (000 omitted) | $ 81,416 |
Portfolio turnover rate D | 70% |
A Total returns would have been lower if certain expenses had not been reduced during the applicable periods shown.
B Calculated based on average shares outstanding during the period.
C Fees and expenses of any underlying Fidelity Central Funds are not included in the Fund's expense ratio. The Fund indirectly bears its proportionate share of the expenses of any underlying Fidelity Central Funds.
D Amount does not include the portfolio activity of any underlying Fidelity Central Funds.
E For the period November 1, 2011 (commencement of operations) to October 31, 2012.
F Expense ratios reflect operating expenses of the class. Expenses before reductions do not reflect amounts reimbursed by the investment adviser or reductions from brokerage service arrangements or reductions from other expense offset arrangements and do not represent the amount paid by the class during periods when reimbursements or reductions occur. Expense ratios before reductions for start-up periods may not be representative of longer-term operating periods. Expenses net of fee waivers reflect expenses after reimbursement by the investment adviser but prior to reductions from brokerage service arrangements or other expense offset arrangements. Expenses net of all reductions represent the net expenses paid by the class.
G Amount represents less than $.01 per share.
See accompanying notes which are an integral part of the financial statements.
Annual Report
Financial Highlights - Institutional Class
Period ended October 31, | 2012 E |
Selected Per-Share Data | |
Net asset value, beginning of period | $ 10.00 |
Income from Investment Operations | |
Net investment income (loss) B | .22 |
Net realized and unrealized gain (loss) | .69 |
Total from investment operations | .91 |
Distributions from net investment income | (.02) |
Redemption fees added to paid in capital B, G | - |
Net asset value, end of period | $ 10.89 |
Total Return A | 9.15% |
Ratios to Average Net Assets C, F | |
Expenses before reductions | 1.62% |
Expenses net of fee waivers, if any | 1.40% |
Expenses net of all reductions | 1.37% |
Net investment income (loss) | 2.17% |
Supplemental Data | |
Net assets, end of period (000 omitted) | $ 2,287 |
Portfolio turnover rate D | 70% |
A Total returns would have been lower if certain expenses had not been reduced during the applicable periods shown.
B Calculated based on average shares outstanding during the period.
C Fees and expenses of any underlying Fidelity Central Funds are not included in the Fund's expense ratio. The Fund indirectly bears its proportionate share of the expenses of any underlying Fidelity Central Funds.
D Amount does not include the portfolio activity of any underlying Fidelity Central Funds.
E For the period November 1, 2011 (commencement of operations) to October 31, 2012.
F Expense ratios reflect operating expenses of the class. Expenses before reductions do not reflect amounts reimbursed by the investment adviser or reductions from brokerage service arrangements or reductions from other expense offset arrangements and do not represent the amount paid by the class during periods when reimbursements or reductions occur. Expense ratios before reductions for start-up periods may not be representative of longer-term operating periods. Expenses net of fee waivers reflect expenses after reimbursement by the investment adviser but prior to reductions from brokerage service arrangements or other expense offset arrangements. Expenses net of all reductions represent the net expenses paid by the class.
G Amount represents less than $.01 per share.
See accompanying notes which are an integral part of the financial statements.
Annual Report
Fidelity Total Emerging Markets Fund
Notes to Financial Statements
For the period ended October 31, 2012
1. Organization.
Fidelity Total Emerging Markets Fund (the Fund) is a fund of Fidelity Investment Trust (the Trust) and is authorized to issue an unlimited number of shares. The Trust is registered under the Investment Company Act of 1940, as amended (the 1940 Act), as an open-end management investment company organized as a Massachusetts business trust. The Fund offers Class A, Class T, Class C, Total Emerging Markets and Institutional Class shares, each of which has equal rights as to assets and voting privileges. Each class has exclusive voting rights with respect to matters that affect that class. Investment income, realized and unrealized capital gains and losses, the common expenses of the Fund, and certain fund-level expense reductions, if any, are allocated on a pro-rata basis to each class based on the relative net assets of each class to the total net assets of the Fund. Each class differs with respect to transfer agent and distribution and service plan fees incurred. Certain expense reductions may also differ by class. The Fund's investments in emerging markets can be subject to social, economic, regulatory, and political uncertainties and can be extremely volatile.
2. Investments in Fidelity Central Funds.
The Fund invests in Fidelity Central Funds, which are open-end investment companies available only to other investment companies and accounts managed by Fidelity Management & Research Company (FMR) and its affiliates. The Fund's Schedule of Investments lists each of the Fidelity Central Funds held as of period end, as an investment of the Fund, but does not include the underlying holdings of each Fidelity Central Fund. As an Investing Fund, the Fund indirectly bears its proportionate share of the expenses of the underlying Fidelity Central Funds.
The Money Market Central Funds seek preservation of capital and current income and are managed by Fidelity Investments Money Management, Inc. (FIMM), an affiliate of FMR.
A complete unaudited list of holdings for each Fidelity Central Fund is available upon request or at the Securities and Exchange Commission (the SEC) web site at www.sec.gov. In addition, the financial statements of the Fidelity Central Funds, which are not covered by the Fund's Report of Independent Registered Public Accounting Firm, are available on the SEC web site or upon request.
3. Significant Accounting Policies.
The financial statements have been prepared in conformity with accounting principles generally accepted in the United States of America (GAAP), which require management to make certain estimates and assumptions at the date of the financial statements. Actual results could differ from those estimates. Subsequent events, if any, through the date that the financial statements were issued have been evaluated in the preparation of
Annual Report
Fidelity Total Emerging Markets Fund
Notes to Financial Statements - continued
3. Significant Accounting Policies - continued
the financial statements. The following summarizes the significant accounting policies of the Fund:
Security Valuation. Investments are valued as of 4:00 p.m. Eastern time on the last calendar day of the period. In accordance with valuation policies and procedures approved by the Board of Trustees (the Board), the Fund attempts to obtain prices from one or more third party pricing vendors or brokers to value its investments. When current market prices, quotations or rates are not readily available or reliable, securities will be fair valued in good faith by the FMR Fair Value Committee (the Committee), in accordance with procedures adopted by the Fund's Board. Factors used in determining fair value vary by security type and may include market or security specific events, changes in interest rates and credit quality. The frequency with which these procedures are used cannot be predicted and they may be utilized to a significant extent. The Committee oversees the Fund's valuation policies and procedures and is responsible for approving and reporting to the Board all fair value determinations.
The Fund categorizes the inputs to valuation techniques used to value its investments into a disclosure hierarchy consisting of three levels as shown below:
Level 1 - quoted prices in active markets for identical investments
Level 2 - other significant observable inputs (including quoted prices for similar investments, interest rates, prepayment speeds, etc.)
Level 3 - unobservable inputs (including the Fund's own assumptions based on the best information available)
Valuation techniques used to value the Fund's investments by major category are as follows:
Equity securities, including restricted securities, for which market quotations are readily available, are valued at the last reported sale price or official closing price as reported by a third party pricing vendor on the primary market or exchange on which they are traded and are categorized as Level 1 in the hierarchy. In the event there were no sales during the day or closing prices are not available, securities are valued at the last quoted bid price or may be valued using the last available price and are generally categorized as Level 2 in the hierarchy. For foreign equity securities, when significant market or security specific events arise, comparisons to the valuation of American Depositary Receipts (ADRs), futures contracts, Exchange-Traded Funds (ETFs) and certain indexes as well as quoted prices for similar securities are used and are categorized as Level 2 in the hierarchy. Utilizing these techniques may result in transfers between Level 1 and Level 2.
Debt securities, including restricted securities, are valued based on evaluated prices received from third party pricing vendors or from brokers who make markets in such
Annual Report
3. Significant Accounting Policies - continued
Security Valuation - continued
securities. For corporate bonds and foreign government and government agency obligations, pricing vendors utilize matrix pricing which considers yield or price of bonds of comparable quality, coupon, maturity and type as well as broker-supplied prices and are generally categorized as Level 2 in the hierarchy. When independent prices are unavailable or unreliable, debt securities may be valued utilizing pricing methodologies which consider similar factors that would be used by third party pricing vendors. These are generally categorized as Level 2 in the hierarchy but may be Level 3 depending on the circumstances.
Investments in open-end mutual funds, including the Fidelity Central Funds, are valued at their closing net asset value (NAV) each business day and are categorized as Level 1 in the hierarchy.
Changes in valuation techniques may result in transfers in or out of an assigned level within the disclosure hierarchy. The aggregate value of investments by input level, as of October 31, 2012, is included at the end of the Fund's Schedule of Investments.
Foreign Currency Translation. The Fund may use foreign currency contracts to facilitate transactions in foreign-denominated securities. Gains and losses from these transactions may arise from changes in the value of the foreign currency or if the counterparties do not perform under the contracts' terms.
Foreign-denominated assets, including investment securities, and liabilities are translated into U.S. dollars at the exchange rates at period end. Purchases and sales of investment securities, income and dividends received and expenses denominated in foreign currencies are translated into U.S. dollars at the exchange rate in effect on the transaction date.
The effects of exchange rate fluctuations on investments are included with the net realized and unrealized gain (loss) on investment securities. Other foreign currency transactions resulting in realized and unrealized gain (loss) are disclosed separately.
Investment Transactions and Income. For financial reporting purposes, the Fund's investment holdings and NAV include trades executed through the end of the last business day of the period. The NAV per share for processing shareholder transactions is calculated as of the close of business of the New York Stock Exchange (NYSE), normally 4:00 p.m. Eastern time and includes trades executed through the end of the prior business day. Gains and losses on securities sold are determined on the basis of identified cost. Dividend income is recorded on the ex-dividend date, except for certain dividends from foreign securities where the ex-dividend date may have passed, which are recorded as soon as the Fund is informed of the ex-dividend date. Non-cash dividends included in
Annual Report
Fidelity Total Emerging Markets Fund
Notes to Financial Statements - continued
3. Significant Accounting Policies - continued
Investment Transactions and Income - continued
dividend income, if any, are recorded at the fair market value of the securities received. Interest income and distributions from the Fidelity Central Funds are accrued as earned. Interest income includes coupon interest and amortization of premium and accretion of discount on debt securities. Investment income is recorded net of foreign taxes withheld where recovery of such taxes is uncertain. Debt obligations may be placed on non-accrual status and related interest income may be reduced by ceasing current accruals and writing off interest receivables when the collection of all or a portion of interest has become doubtful based on consistently applied procedures. A debt obligation is removed from non-accrual status when the issuer resumes interest payments or when collectability of interest is reasonably assured.
Expenses. Expenses directly attributable to a fund are charged to that fund. Expenses attributable to more than one fund are allocated among the respective funds on the basis of relative net assets or other appropriate methods. Expense estimates are accrued in the period to which they relate and adjustments are made when actual amounts are known.
Income Tax Information and Distributions to Shareholders. Each year, the Fund intends to qualify as a regulated investment company under Subchapter M of the Internal Revenue Code, including distributing substantially all of its taxable income and realized gains. As a result, no provision for income taxes is required. As of October 31, 2012, the Fund did not have any unrecognized tax benefits in the financial statements; nor is the Fund aware of any tax positions for which it is reasonably possible that the total amounts of unrecognized tax benefits will significantly change in the next twelve months. The Fund files a U.S. federal tax return, in addition to state and local tax returns as required. A fund's federal income tax returns are subject to examination by the Internal Revenue Service (IRS) for a period of three fiscal years after they are filed. State and local tax returns may be subject to examination for an additional fiscal year depending on the jurisdiction. Foreign taxes are provided for based on the Fund's understanding of the tax rules and rates that exist in the foreign markets in which it invests. The Fund is subject to a tax imposed on capital gains by certain countries in which it invests. An estimated deferred tax liability for net unrealized appreciation on the applicable securities is included in Other payables and accrued expenses on the Statement of Assets & Liabilities.
Distributions are declared and recorded on the ex-dividend date. Income dividends and capital gain distributions are declared separately for each class. Income and capital gain distributions are determined in accordance with income tax regulations, which may differ from GAAP. In addition, the Fund claimed a portion of the payment made to redeeming shareholders as a distribution for income tax purposes.
Annual Report
3. Significant Accounting Policies - continued
Income Tax Information and Distributions to Shareholders - continued
Capital accounts within the financial statements are adjusted for permanent book-tax differences. These adjustments have no impact on net assets or the results of operations. Temporary book-tax differences will reverse in a subsequent period.
Book-tax differences are primarily due to foreign currency transactions, certain foreign taxes, passive foreign investment companies (PFIC), market discount, capital loss carryforwards and losses deferred due to wash sales.
The federal tax cost of investment securities and unrealized appreciation (depreciation) as of period end were as follows:
Gross unrealized appreciation | $ 10,983,917 |
Gross unrealized depreciation | (3,416,206) |
Net unrealized appreciation (depreciation) on securities and other investments | $ 7,567,711 |
| |
Tax Cost | $ 95,356,448 |
The tax-based components of distributable earnings as of period end were as follows:
Undistributed ordinary income | $ 1,401,667 |
Capital loss carryforward | $ (1,234,216) |
Net unrealized appreciation (depreciation) | $ 7,566,725 |
Capital loss carryforwards are only available to offset future capital gains of the Fund to the extent provided by regulations and may be limited. Under the Regulated Investment Company Modernization Act of 2010 (the Act), the Fund is permitted to carry forward capital losses incurred in taxable years beginning after December 22, 2010 for an unlimited period and such capital losses are required to be used prior to any losses that expire. Capital loss carryforwards were as follows:
No expiration | |
Short-term | $ (1,234,216) |
The tax character of distributions paid was as follows:
| October 31, 2012 |
Ordinary Income | $ 96,645 |
Annual Report
Fidelity Total Emerging Markets Fund
Notes to Financial Statements - continued
3. Significant Accounting Policies - continued
Short-Term Trading (Redemption) Fees. Shares purchased by investors and held in the Fund less than 90 days are subject to a redemption fee equal to 1.50% of the net asset value of shares redeemed. All redemption fees, which reduce the proceeds of the shareholder redemption, are retained by the Fund and accounted for as an addition to paid in capital.
Restricted Securities. The Fund may invest in securities that are subject to legal or contractual restrictions on resale. These securities generally may be resold in transactions exempt from registration or to the public if the securities are registered. Disposal of these securities may involve time-consuming negotiations and expense, and prompt sale at an acceptable price may be difficult. Information regarding restricted securities is included at the end of the Fund's Schedule of Investments.
New Accounting Pronouncement. In December 2011, the Financial Accounting Standards Board issued Accounting Standard Update No. 2011-11, Disclosures about Offsetting Assets and Liabilities. The update creates new disclosure requirements requiring entities to disclose both gross and net information for derivatives and other financial instruments that are either offset in the Statement of Assets and Liabilities or subject to an enforceable master netting arrangement or similar agreement. The disclosure requirements are effective for annual reporting periods beginning on or after January 1, 2013, and interim periods within those annual periods. Management is currently evaluating the impact of the update's adoption on the Fund's financial statement disclosures.
4. Purchases and Sales of Investments.
Purchases and sales of securities, other than short-term securities, aggregated $144,030,449 and $50,601,679, respectively.
5. Fees and Other Transactions with Affiliates.
Management Fee. FMR and its affiliates provide the Fund with investment management related services for which the Fund pays a monthly management fee. The management fee is the sum of an individual fund fee rate that is based on an annual rate of .55% of the Fund's average net assets and an annualized group fee rate that averaged .26% during the period. The group fee rate is based upon the average net assets of all the mutual funds advised by FMR. The group fee rate decreases as assets under management increase and increases as assets under management decrease. For the period, the total annual management fee rate was .80% of the Fund's average net assets.
Annual Report
5. Fees and Other Transactions with Affiliates - continued
Distribution and Service Plan Fees. In accordance with Rule 12b-1 of the 1940 Act, the Fund has adopted separate Distribution and Service Plans for each class of shares. Certain classes pay Fidelity Distributors Corporation (FDC), an affiliate of FMR, separate Distribution and Service Fees, each of which is based on an annual percentage of each class' average net assets. In addition, FDC may pay financial intermediaries for selling shares of the Fund and providing shareholder support services. For the period, the Distribution and Service Fee rates, total fees and amounts retained by FDC were as follows:
| Distribution
Fee | Service
Fee | Total Fees | Retained
by FDC |
Class A | -% | .25% | $ 15,320 | $ 13,743 |
Class T | .25% | .25% | 22,574 | 15,459 |
Class C | .75% | .25% | 53,133 | 52,688 |
| | | $ 91,027 | $ 81,890 |
Sales Load. FDC may receive a front-end sales charge of up to 5.75% for selling Class A shares and 3.50% for selling Class T shares, some of which is paid to financial intermediaries for selling shares of the Fund. Depending on the holding period, FDC may receive contingent deferred sales charges levied on Class A, Class T, and Class C redemptions. The deferred sales charges range from 1.00% for Class C shares, 1.00% for certain purchases of Class A shares and .25% for certain purchases of Class T shares.
For the period, sales charge amounts retained by FDC were as follows:
| Retained
by FDC |
Class A | $ 2,010 |
Class T | 842 |
Class C* | 51 |
| $ 2,903 |
* When Class C shares are initially sold, FDC pays commissions from its own resources to financial intermediaries through which the sales are made.
Transfer Agent Fees. Fidelity Investments Institutional Operations Company, Inc. (FIIOC), an affiliate of FMR, is the transfer, dividend disbursing and shareholder servicing agent for each class of the Fund. FIIOC receives account fees and asset-based fees that vary according to the account size and type of account of the shareholders of the respective classes of the Fund. FIIOC pays for typesetting, printing and mailing of
Annual Report
Fidelity Total Emerging Markets Fund
Notes to Financial Statements - continued
5. Fees and Other Transactions with Affiliates - continued
Transfer Agent Fees - continued
shareholder reports, except proxy statements. For the period, transfer agent fees for each class were as follows:
| Amount | % of
Average
Net Assets |
Class A | $ 11,782 | .19 |
Class T | 8,511 | .19 |
Class C | 10,121 | .19 |
Total Emerging Markets | 112,796 | .19 |
Institutional Class | 3,808 | .18 |
| $ 147,018 | |
Accounting and Security Lending Fees. Fidelity Service Company, Inc. (FSC), an affiliate of FMR, maintains the Fund's accounting records. The accounting fee is based on the level of average net assets for each month. Under a separate contract, FSC administers the security lending program. The security lending fee is based on the number and duration of lending transactions.
Brokerage Commissions. The Fund placed a portion of its portfolio transactions with brokerage firms which are affiliates of the investment adviser. The commissions paid to these affiliated firms were $435 for the period.
6. Committed Line of Credit.
The Fund participates with other funds managed by FMR or an affiliate in a $4.25 billion credit facility (the "line of credit") to be utilized for temporary or emergency purposes to fund shareholder redemptions or for other short-term liquidity purposes. The Fund has agreed to pay commitment fees on its pro-rata portion of the line of credit, which amounted to $127 and is reflected in Miscellaneous expenses on the Statement of Operations. During the period, there were no borrowings on this line of credit.
7. Security Lending.
The Fund lends portfolio securities through a lending agent from time to time in order to earn additional income. For equity securities, a lending agent is used and may loan securities to certain qualified borrowers, including Fidelity Capital Markets (FCM), a broker-dealer affiliated with the Fund. On the settlement date of the loan, the Fund receives collateral (in the form of U.S. Treasury obligations, letters of credit and/or cash) against the loaned securities and maintains collateral in an amount not less than 100% of the market value of the loaned securities during the period of the loan. The market value of the loaned securities is determined at the close of business of the Fund and any
Annual Report
7. Security Lending - continued
additional required collateral is delivered to the Fund on the next business day. If the borrower defaults on its obligation to return the securities loaned because of insolvency or other reasons, a fund could experience delays and costs in recovering the securities loaned or in gaining access to the collateral. Any cash collateral received is invested in the Fidelity Securities Lending Cash Central Fund. At period end, there were no security loans outstanding. Security lending income represents the income earned on investing cash collateral, less rebates paid to borrowers and any lending agent fees associated with the loan, plus any premium payments received for lending certain types of securities. Security lending income is presented in the Statement of Operations as a component of income from Fidelity Central Funds. Total security lending income during the period amounted to $315. During the period, there were no securities loaned to FCM.
8. Expense Reductions.
Effective November 1, 2011, FMR contractually agreed to reimburse each class to the extent annual operating expenses exceeded certain levels of average net assets as noted in the table below. This reimbursement will remain in place through December 31, 2013. Some expenses, for example interest expense, including commitment fees, are excluded from this reimbursement.
The following classes were in reimbursement during the period:
| Expense
Limitations | Reimbursement
from adviser |
Class A | 1.65% | $ 13,791 |
Class T | 1.90% | 9,129 |
Class C | 2.40% | 12,487 |
Total Emerging Markets | 1.40% | 120,371 |
Institutional Class | 1.40% | 4,771 |
| | $ 160,549 |
Many of the brokers with whom FMR places trades on behalf of the Fund provided services to the Fund in addition to trade execution. These services included payments of certain expenses on behalf of the Fund totaling $18,638 for the period. In addition, through arrangements with the Fund's custodian, credits realized as a result of uninvested cash balances were used to reduce the Fund's expenses. During the period, these credits reduced the Fund's custody expenses by $203.
Annual Report
Fidelity Total Emerging Markets Fund
Notes to Financial Statements - continued
9. Distributions to Shareholders.
Distributions to shareholders of each class were as follows:
| Period ended
October 31,
2012 A |
From net investment income | |
Class A | $ 9,099 |
Class T | 4,204 |
Class C | 3,000 |
Total Emerging Markets | 75,940 |
Institutional Class | 4,402 |
Total | $ 96,645 |
A For the period November 1, 2011 (commencement of operations) to October 31, 2012.
10. Share Transactions.
Transactions for each class of shares were as follows:
| Shares | Dollars |
| Period ended
October 31,
2012 A | Period ended
October 31,
2012 A |
Class A | | |
Shares sold | 723,537 | $ 7,311,002 |
Reinvestment of distributions | 949 | 9,099 |
Shares redeemed | (17,979) | (179,387) |
Net increase (decrease) | 706,507 | $ 7,140,714 |
Class T | | |
Shares sold | 597,107 | $ 6,082,522 |
Reinvestment of distributions | 439 | 4,204 |
Shares redeemed | (60,421) | (637,924) |
Net increase (decrease) | 537,125 | $ 5,448,802 |
Class C | | |
Shares sold | 540,321 | $ 5,429,037 |
Reinvestment of distributions | 314 | 3,000 |
Shares redeemed | (1,143) | (12,081) |
Net increase (decrease) | 539,492 | $ 5,419,956 |
Total Emerging Markets | | |
Shares sold | 8,901,615 | $ 89,854,661 |
Reinvestment of distributions | 7,686 | 73,759 |
Shares redeemed | (1,430,767) | (14,834,512) |
Net increase (decrease) | 7,478,534 | $ 75,093,908 |
Institutional Class | | |
Shares sold | 209,638 | $ 2,101,696 |
Reinvestment of distributions | 459 | 4,402 |
Net increase (decrease) | 210,097 | $ 2,106,098 |
A For the period November 1, 2011 (commencement of operations) to October 31, 2012.
Annual Report
11. Other.
The Fund's organizational documents provide former and current trustees and officers with a limited indemnification against liabilities arising in connection with the performance of their duties to the Fund. In the normal course of business, the Fund may also enter into contracts that provide general indemnifications. The Fund's maximum exposure under these arrangements is unknown as this would be dependent on future claims that may be made against the Fund. The risk of material loss from such claims is considered remote.
At the end of the period, FMR or its affiliates were the owners of record of 32% of the total outstanding shares of the Fund.
Annual Report
To the Trustees of Fidelity Investment Trust and the Shareholders of Fidelity Total Emerging Markets Fund:
In our opinion, the accompanying statement of assets and liabilities, including the schedule of investments, and the related statements of operations and of changes in net assets and the financial highlights present fairly, in all material respects, the financial position of Fidelity Total Emerging Markets Fund (a fund of Fidelity Investment Trust) at October 31, 2012, the results of its operations for the year then ended, the changes in its net assets for the period indicated and the financial highlights for each of the period indicated, in conformity with accounting principles generally accepted in the United States of America. These financial statements and financial highlights (hereafter referred to as "financial statements") are the responsibility of the Fidelity Total Emerging Markets Fund's management. Our responsibility is to express an opinion on these financial statements based on our audits. We conducted our audits of these financial statements in accordance with the standards of the Public Company Accounting Oversight Board (United States). Those standards require that we plan and perform the audit to obtain reasonable assurance about whether the financial statements are free of material misstatement. An audit includes examining, on a test basis, evidence supporting the amounts and disclosures in the financial statements, assessing the accounting principles used and significant estimates made by management, and evaluating the overall financial statement presentation. We believe that our audits, which included confirmation of securities at October 31, 2012 by correspondence with the custodian and brokers, provide a reasonable basis for our opinion.
PricewaterhouseCoopers LLP
Boston, Massachusetts
December 17, 2012
Annual Report
The Trustees, Members of the Advisory Board, and executive officers of the trust and fund, as applicable, are listed below. The Board of Trustees governs the fund and is responsible for protecting the interests of shareholders. The Trustees are experienced executives who meet periodically throughout the year to oversee the fund's activities, review contractual arrangements with companies that provide services to the fund, oversee management of the risks associated with such activities and contractual arrangements, and review the fund's performance. Except for James C. Curvey, each of the Trustees oversees 236 funds advised by FMR or an affiliate. Mr. Curvey oversees 443 funds advised by FMR or an affiliate.
The Trustees hold office without limit in time except that (a) any Trustee may resign; (b) any Trustee may be removed by written instrument, signed by at least two-thirds of the number of Trustees prior to such removal; (c) any Trustee who requests to be retired or who has become incapacitated by illness or injury may be retired by written instrument signed by a majority of the other Trustees; and (d) any Trustee may be removed at any special meeting of shareholders by a two-thirds vote of the outstanding voting securities of the trust. Each Trustee who is not an interested person (as defined in the 1940 Act) (Independent Trustee), shall retire not later than the last day of the calendar year in which his or her 75th birthday occurs. The Independent Trustees may waive this mandatory retirement age policy with respect to individual Trustees. The executive officers and Advisory Board Members hold office without limit in time, except that any officer and Advisory Board Member may resign or may be removed by a vote of a majority of the Trustees at any regular meeting or any special meeting of the Trustees. Except as indicated, each individual has held the office shown or other offices in the same company for the past five years.
Experience, Skills, Attributes, and Qualifications of the Fund's Trustees. The Governance and Nominating Committee has adopted a statement of policy that describes the experience, qualifications, attributes, and skills that are necessary and desirable for potential Independent Trustee candidates (Statement of Policy). The Board believes that each Trustee satisfied at the time he or she was initially elected or appointed a Trustee, and continues to satisfy, the standards contemplated by the Statement of Policy. The Governance and Nominating Committee also engages professional search firms to help identify potential Independent Trustee candidates who have the experience, qualifications, attributes, and skills consistent with the Statement of Policy. From time to time, additional criteria based on the composition and skills of the current Independent Trustees, as well as experience or skills that may be appropriate in light of future changes to board composition, business conditions, and regulatory or other developments, have also been considered by the professional search firms and the Governance and Nominating Committee. In addition, the Board takes into account the Trustees' commitment and participation in Board and committee meetings, as well as their leadership of standing and ad hoc committees throughout their tenure.
In determining that a particular Trustee was and continues to be qualified to serve as a Trustee, the Board has considered a variety of criteria, none of which, in isolation, was controlling. The Board believes that, collectively, the Trustees have balanced and diverse experience, qualifications, attributes, and skills, which allow the Board to operate effectively in governing the fund and protecting the interests of shareholders. Information about the specific experience, skills, attributes, and qualifications of each Trustee, which in each case led to the Board's conclusion that the Trustee should serve (or continue to serve) as a trustee of the fund, is provided below.
Annual Report
Trustees and Officers - continued
Board Structure and Oversight Function. James C. Curvey is an interested person (as defined in the 1940 Act) and currently serves as Chairman. The Trustees have determined that an interested Chairman is appropriate and benefits shareholders because an interested Chairman has a personal and professional stake in the quality and continuity of services provided to the fund. Independent Trustees exercise their informed business judgment to appoint an individual of their choosing to serve as Chairman, regardless of whether the Trustee happens to be independent or a member of management. The Independent Trustees have determined that they can act independently and effectively without having an Independent Trustee serve as Chairman and that a key structural component for assuring that they are in a position to do so is for the Independent Trustees to constitute a substantial majority for the Board. The Independent Trustees also regularly meet in executive session. Ned C. Lautenbach serves as Chairman of the Independent Trustees and as such (i) acts as a liaison between the Independent Trustees and management with respect to matters important to the Independent Trustees and (ii) with management prepares agendas for Board meetings.
Fidelity funds are overseen by different Boards of Trustees. The fund's Board oversees Fidelity's equity and high income funds and another Board oversees Fidelity's investment-grade bond, money market, and asset allocation funds. The asset allocation funds may invest in Fidelity funds overseen by the fund's Board. The use of separate Boards, each with its own committee structure, allows the Trustees of each group of Fidelity funds to focus on the unique issues of the funds they oversee, including common research, investment, and operational issues. On occasion, the separate Boards establish joint committees to address issues of overlapping consequences for the Fidelity funds overseen by each Board.
The Trustees operate using a system of committees to facilitate the timely and efficient consideration of all matters of importance to the Trustees, the fund, and fund shareholders and to facilitate compliance with legal and regulatory requirements and oversight of the fund's activities and associated risks. The Board, acting through its committees, has charged FMR and its affiliates with (i) identifying events or circumstances the occurrence of which could have demonstrably adverse effects on the fund's business and/or reputation; (ii) implementing processes and controls to lessen the possibility that such events or circumstances occur or to mitigate the effects of such events or circumstances if they do occur; and (iii) creating and maintaining a system designed to evaluate continuously business and market conditions in order to facilitate the identification and implementation processes described in (i) and (ii) above. Because the day-to-day operations and activities of the fund are carried out by or through FMR, its affiliates and other service providers, the fund's exposure to risks is mitigated but not eliminated by the processes overseen by the Trustees. While each of the Board's committees has responsibility for overseeing different aspects of the fund's activities, oversight is exercised primarily through the Operations, Audit, and Compliance Committees. In addition, the Independent Trustees have worked with FMR to enhance the Board's oversight of investment and financial risks, legal and regulatory risks, technology risks, and operational risks, including the development of additional risk reporting to the Board. For example, a working group comprised of Independent Trustees and FMR has worked and continues to work to review the Fidelity funds' valuation-related activities, reporting and risk management. Appropriate personnel, including but not limited to the fund's Chief Compliance Officer (CCO), FMR's internal auditor, the independent accountants, the fund's Treasurer and portfolio management personnel, make periodic reports to the Board's committees, as appropriate, including an annual review of FMR's risk management program for the Fidelity funds. The responsibilities of each standing committee, including their oversight responsibilities, are described further under "Standing Committees of the Fund's Trustees."
Annual Report
The fund's Statement of Additional Information (SAI) includes more information about the Trustees. To request a free copy, call Fidelity at 1-877-208-0098.
Interested Trustees*:
Correspondence intended for each Trustee who is an interested person may be sent to Fidelity Investments, 82 Devonshire Street, Boston, Massachusetts 02109.
Name, Age; Principal Occupations and Other Relevant Experience+ |
James C. Curvey (77) |
| Year of Election or Appointment: 2007 Mr. Curvey is Trustee and Chairman of the Board of Trustees of certain Trusts. Mr. Curvey also serves as Trustee (2007-present) of other investment companies advised by FMR. Mr. Curvey is a Director of Fidelity Investments Money Management, Inc. (2009-present), Director of Fidelity Research & Analysis Co. (2009-present) and Director of FMR and FMR Co., Inc. (2007-present). Mr. Curvey is also Vice Chairman (2007-present) and Director of FMR LLC. In addition, Mr. Curvey serves as an Overseer for the Boston Symphony Orchestra and a member of the Trustees of Villanova University. Previously, Mr. Curvey was the Vice Chairman (2006-2007) and Director (2000-2007) of FMR Corp. |
Ronald P. O'Hanley (55) |
| Year of Election or Appointment: 2011 Mr. O'Hanley is Director of FMR Co., Inc. (2010-present), Director of Fidelity Investments Money Management, Inc. (2010-present), Director of Fidelity Research & Analysis Company (2010-present), President of Fidelity Asset Management and Corporate Services and a member of Fidelity's Executive Committee (2010-present). Previously, Mr. O'Hanley served as President and Chief Executive Officer of BNY Mellon Asset Management (2007-2010). Mr. O'Hanley also served as Vice Chairman of Bank New York Mellon Corp. and a member of that firm's Executive Committee. Prior to the 2007 merger of The Bank of New York and Mellon Financial Corporation, he was Vice Chairman of Mellon Financial Corporation and President and Chief Executive Officer of Mellon Asset Management. He joined Mellon in February 1997. Mr. O'Hanley currently serves as Chairman of the Boston Public Library Foundation Board of Directors and sits on the Board of Directors of Beth Israel Deaconess Medical Center, the Board of Trustees of the Marine Biological Laboratory and the Advisory Board of the Maxwell School of Citizenship and Public Administration at Syracuse University. Mr. O'Hanley also chairs the Council on Asset Management for the Financial Services Roundtable and is a member of the Board of Directors of Institutional Investor's U.S. Institute. |
* Trustees have been determined to be "Interested Trustees" by virtue of, among other things, their affiliation with the trust or various entities under common control with FMR.
+ The information above includes each Trustee's principal occupation during the last five years and other information relating to the experience, attributes, and skills relevant to each Trustee's qualifications to serve as a Trustee, which led to the conclusion that each Trustee should serve as a Trustee for the fund.
Annual Report
Independent Trustees:
Correspondence intended for each Independent Trustee (that is, the Trustees other than the Interested Trustees) may be sent to Fidelity Investments, P.O. Box 55235, Boston, Massachusetts 02205-5235.
Name, Age; Principal Occupations and Other Relevant Experience+ |
Dennis J. Dirks (64) |
| Year of Election or Appointment: 2005 Prior to his retirement in May 2003, Mr. Dirks was Chief Operating Officer and a member of the Board of The Depository Trust & Clearing Corporation (DTCC). He also served as President, Chief Operating Officer, and Board member of The Depository Trust Company (DTC) and President and Board member of the National Securities Clearing Corporation (NSCC). In addition, Mr. Dirks served as Chief Executive Officer and Board member of the Government Securities Clearing Corporation, Chief Executive Officer and Board member of the Mortgage-Backed Securities Clearing Corporation, as a Trustee and a member of the Finance Committee of Manhattan College (2005-2008), and as a Trustee and a member of the Finance Committee of AHRC of Nassau County (2006-2008). Mr. Dirks is a member of the Independent Directors Council (IDC) Governing Council (2010-present) and Board of Directors for The Brookville Center for Children's Services, Inc. (2009-present). |
Alan J. Lacy (59) |
| Year of Election or Appointment: 2008 Mr. Lacy serves as Senior Adviser (2007-present) of Oak Hill Capital Partners, L.P. (private equity). Mr. Lacy also served as Chief Executive Officer (2000-2005) and Vice Chairman (2005-2006) of Sears Holdings Corporation and Sears, Roebuck and Co. (retail). In addition, Mr. Lacy serves as a member of the Board of Directors of Dave & Buster's Entertainment, Inc. (restaurant and entertainment complexes, 2010-present), Earth Fare, Inc. (retail grocery, 2012-present), The Hillman Companies, Inc. (hardware wholesalers, 2010-present), and Bristol-Myers Squibb Company (global pharmaceuticals, 2008-present). Mr. Lacy is a member of the Board of Trustees of The National Parks Conservation Association (2006-present). Previously, Mr. Lacy served as Chairman of the Board of Trustees of the National Parks Conservation Association (2008-2011) and as a member of the Board of Directors for the Western Union Company (global money transfer, 2006-2011). |
Ned C. Lautenbach (68) |
| Year of Election or Appointment: 2000 Mr. Lautenbach is Chairman of the Independent Trustees of the Equity and High Income Funds (2006-present). Mr. Lautenbach currently serves as the Lead Director of the Eaton Corporation Board of Directors (diversified industrial, 1997-present). Mr. Lautenbach is Chairman of the Board of Directors of the Philharmonic Center for the Arts in Naples, Florida (2012-present) and a member of the Council on Foreign Relations (1994-present). Previously, Mr. Lautenbach was a Partner/Advisory Partner at Clayton, Dubilier & Rice, LLC (private equity investment, 1998-2010), as well as a Director of Sony Corporation (2006-2007). |
Joseph Mauriello (68) |
| Year of Election or Appointment: 2008 Prior to his retirement in January 2006, Mr. Mauriello served in numerous senior management positions including Deputy Chairman and Chief Operating Officer (2004-2005), and Vice Chairman of Financial Services (2002-2004) of KPMG LLP US (professional services, 1965-2005). Mr. Mauriello currently serves as a member of the Board of Directors of XL Group plc. (global insurance and re-insurance, 2006-present). Previously, Mr. Mauriello served as a Director of the Hamilton Funds of the Bank of New York (2006-2007) and of Arcadia Resources Inc. (health care services and products, 2007-2012). |
Robert W. Selander (62) |
| Year of Election or Appointment: 2011 Previously, Mr. Selander served as a Member of the Advisory Board of Fidelity's Equity and High Income Funds (2011), Executive Vice Chairman (2010), Chief Executive Officer (2009-2010), and President and Chief Executive Officer (1997-2009) of Mastercard, Inc. |
Cornelia M. Small (68) |
| Year of Election or Appointment: 2005 Ms. Small is a member of the Board of Directors (2009-present) and Chair of the Investment Committee (2010-present) of the Teagle Foundation. Ms. Small also serves on the Investment Committee of the Berkshire Taconic Community Foundation (2008-present). Previously, Ms. Small served as Chairperson (2002-2008) and a member of the Investment Committee and Chairperson (2008-2012) and a member of the Board of Trustees of Smith College. In addition, Ms. Small served as Chief Investment Officer, Director of Global Equity Investments, and a member of the Board of Directors of Scudder, Stevens & Clark and Scudder Kemper Investments. |
William S. Stavropoulos (73) |
| Year of Election or Appointment: 2001 Mr. Stavropoulos is Vice Chairman of the Independent Trustees of the Equity and High Income Funds (2006-present). Mr. Stavropoulos serves as President and Founder of the Michigan Baseball Foundation, the Great Lakes Loons (2007-present). Mr. Stavropoulos is Chairman Emeritus of the Board of Directors of The Dow Chemical Company, where he previously served in numerous senior management positions, including President, CEO (1995-2000; 2002-2004), Chairman of the Executive Committee (2000-2006), and as a member of the Board of Directors (1990-2006). Currently, Mr. Stavropoulos is a Director of Univar Inc. (global distributor of commodity and specialty chemicals, Chairman from 2010-May 2012 and Lead Director from May 2012-present), Teradata Corporation (data warehousing and technology solutions, 2008-present), Maersk Inc. (industrial conglomerate), and Tyco International, Ltd. (multinational manufacturing and services, 2007-present), and a member of the Advisory Board for Metalmark Capital LLC (private equity investment, 2005-present). Mr. Stavropoulos is an operating advisor to Clayton, Dubilier & Rice, LLC (private equity investment). In addition, Mr. Stavropoulos is a member of the University of Notre Dame Advisory Council for the College of Science, a Trustee of the Rollin L. Gerstacker Foundation, and a Director of the Naples Philharmonic Center for the Arts. Previously, Mr. Stavropoulos served as a Director of Chemical Financial Corporation (bank holding company, 1993-2012). |
David M. Thomas (63) |
| Year of Election or Appointment: 2008 Previously, Mr. Thomas served as Executive Chairman (2005-2006) and Chairman and Chief Executive Officer (2000-2005) of IMS Health, Inc. (pharmaceutical and healthcare information solutions), and a Director of Fortune Brands, Inc. (consumer products, 2000-2011). In addition, Mr. Thomas serves as Non-Executive Chairman of the Board of Directors of Fortune Brands Home and Security (home and security products, 2011-present), and as a member of the Board of Directors of Interpublic Group of Companies, Inc. (marketing communication, 2004-present). |
Michael E. Wiley (62) |
| Year of Election or Appointment: 2008 Mr. Wiley also serves as a Director of Asia Pacific Exploration Consolidated (international oil and gas exploration and production, 2008-present). Mr. Wiley serves as a Director of Tesoro Corporation (independent oil refiner and marketer, 2005-present), and a Director of Bill Barrett Corporation (exploration and production, 2005-present). In addition, Mr. Wiley also serves as a Director of Post Oak Bank (privately-held bank, 2004-present). Previously, Mr. Wiley served as a member of the Board of Trustees of the University of Tulsa (2000-2006; 2007-2010), as a Senior Energy Advisor of Katzenbach Partners, LLC (consulting, 2006-2007), as an Advisory Director of Riverstone Holdings (private investment), Chairman, President, and CEO of Baker Hughes, Inc. (oilfield services, 2000-2004), and as Director of Spinnaker Exploration Company (exploration and production, 2001-2005). |
+ The information above includes each Trustee's principal occupation during the last five years and other information relating to the experience, attributes, and skills relevant to each Trustee's qualifications to serve as a Trustee, which led to the conclusion that each Trustee should serve as a Trustee for the fund.
Advisory Board Members and Executive Officers:
Correspondence intended for David A. Rosow and Garnett A. Smith may be sent to Fidelity Investments, P.O. Box 55235, Boston, Massachusetts 02205-5235. Correspondence intended for each executive officer, Edward C. Johnson 3d, and Peter S. Lynch may be sent to Fidelity Investments, 82 Devonshire Street, Boston, Massachusetts 02109.
Name, Age; Principal Occupation |
Edward C. Johnson 3d (82) |
| Year of Election or Appointment: 2011 Member of the Advisory Board of Fidelity's Equity and High Income Funds. Mr. Johnson serves as Chief Executive Officer, Chairman, and a Director of FMR LLC, and also serves as Chairman and Director of FIL Limited. Previously, Mr. Johnson served as a Trustee and Chairman of the Board of certain Fidelity Trusts, Chairman and a Director of FMR, Chairman and a Director of FMR Co., Inc., and President of FMR LLC (2006-2007). |
Peter S. Lynch (68) |
| Year of Election or Appointment: 2003 Member of the Advisory Board of Fidelity's Equity and High Income Funds. Mr. Lynch is Vice Chairman and a Director of FMR and FMR Co., Inc. In addition, Mr. Lynch serves as a Trustee of Boston College and as the Chairman of the Inner-City Scholarship Fund. Previously, Mr. Lynch served on the Special Olympics International Board of Directors (1997-2006). |
David A. Rosow (70) |
| Year of Election or Appointment: 2012 Member of the Advisory Board of Fidelity's Equity and High Income Funds. Chairman and Chief Executive Officer of International Golf Group, Inc. (golf course development, 1989-present). Previously, Mr. Rosow served as Chairman and Chief Executive Officer of Rosow & Company, Inc. (private investment company, 1989-2011), a Lead Director of Hudson United Bancorp (2001-2006) and as a Director of TD Banknorth (1996-2006). In addition, Mr. Rosow is a member (2008-present) and President (2009-present) of the Town Council of Palm Beach, Florida. |
Garnett A. Smith (65) |
| Year of Election or Appointment: 2012 Member of the Advisory Board of Fidelity's Equity and High Income Funds. Prior to Mr. Smith's retirement, he served as Chairman and Chief Executive Officer of Inbrand Corp. (manufacturer of personal absorbent products, 1990-1997). He also served as President (1986-1990) of Inbrand Corp. Prior to his employment with Inbrand Corp., he was employed by a retail fabric chain and North Carolina National Bank. In addition, Mr. Smith is a board member of the Jackson Hole Land Trust (2009-present). |
Kenneth B. Robins (43) |
| Year of Election or Appointment: 2008 President and Treasurer of Fidelity's Equity and High Income Funds. Mr. Robins also serves as President and Treasurer (2010-present) and Assistant Treasurer (2009-present) of other Fidelity funds and is an employee of Fidelity Investments (2004-present). Previously, Mr. Robins served as Deputy Treasurer of the Fidelity funds (2005-2008) and Treasurer and Chief Financial Officer of The North Carolina Capital Management Trust: Cash and Term Portfolios (2006-2008). |
Bruce T. Herring (47) |
| Year of Election or Appointment: 2006 Vice President of certain Equity Funds. Mr. Herring also serves as President of Fidelity Research & Analysis Company (2010-present), Chief Investment Officer and Director of Fidelity Management & Research (U.K.) Inc. (2010-present) and Group Chief Investment Officer of FMR. Previously, Mr. Herring served as Vice President (2005-2006) and Senior Vice President (2006-2007) of Fidelity Management & Research Company, Vice President of FMR Co., Inc. (2001-2007) and as a portfolio manager for Fidelity U.S. Equity Funds. |
Brian B. Hogan (48) |
| Year of Election or Appointment: 2009 Vice President of Equity and High Income Funds. Mr. Hogan also serves as President of FMR's Equity Division (2009-present). Previously, Mr. Hogan served as Senior Vice President, Equity Research of FMR (2006-2009) and as a portfolio manager. |
Scott C. Goebel (44) |
| Year of Election or Appointment: 2008 Secretary and Chief Legal Officer (CLO) of the Fidelity funds. Mr. Goebel also serves as Secretary of Fidelity Investments Money Management, Inc. (FIMM) (2010-present) and Fidelity Research and Analysis Company (FRAC) (2010-present); Secretary and CLO of The North Carolina Capital Management Trust: Cash and Term Portfolios (2008-present); General Counsel, Secretary, and Senior Vice President of FMR (2008-present) and FMR Co., Inc. (2008-present); employed by FMR LLC or an affiliate (2001-present); Chief Legal Officer of Fidelity Management & Research (Hong Kong) Limited (2008-present) and Assistant Secretary of Fidelity Management & Research (Japan) Inc. (2008-present), and Fidelity Management & Research (U.K.) Inc. (2008-present). Previously, Mr. Goebel served as Assistant Secretary of FIMM (2008-2010), FRAC (2008-2010), and the Funds (2007-2008) and as Vice President and Secretary of Fidelity Distributors Corporation (FDC) (2005-2007). |
William C. Coffey (43) |
| Year of Election or Appointment: 2009 Assistant Secretary of Fidelity's Equity and High Income Funds. Mr. Coffey also serves as Senior Vice President and Deputy General Counsel of FMR LLC (2010-present), and is an employee of Fidelity Investments. Previously, Mr. Coffey served as Vice President and Associate General Counsel of FMR LLC (2005-2009). |
Elizabeth Paige Baumann (44) |
| Year of Election or Appointment: 2012 Anti-Money Laundering (AML) Officer of the Fidelity funds. Ms. Baumann also serves as AML Officer of The North Carolina Capital Management Trust: Cash and Term Portfolios (2012-present), Chief AML Officer of FMR LLC (2012-present), and is an employee of Fidelity Investments. Previously, Ms. Baumann served as Vice President and Deputy Anti-Money Laundering Officer (2007-2012). |
Christine Reynolds (54) |
| Year of Election or Appointment: 2008 Chief Financial Officer of the Fidelity funds. Ms. Reynolds became President of Fidelity Pricing and Cash Management Services (FPCMS) in August 2008. Ms. Reynolds served as Chief Operating Officer of FPCMS (2007-2008). Previously, Ms. Reynolds served as President, Treasurer, and Anti-Money Laundering officer of the Fidelity funds (2004-2007). |
Joseph A. Hanlon (44) |
| Year of Election or Appointment: 2012 Chief Compliance Officer of Fidelity's Equity and High Income Funds. Mr. Hanlon serves as Compliance Officer of FMR, FMR Co., Inc., Fidelity Investments Money Management, Inc. (FIMM), Fidelity Research and Analysis Company (FRAC), Fidelity Management & Research (Japan) Inc., Fidelity Management & Research (U.K.) Inc., Fidelity Management & Research (Hong Kong), and Strategic Advisers, Inc. (2009-present), as Senior Vice President of the Fidelity Asset Management Division (2009-present), and is an employee of Fidelity Investments. |
Joseph F. Zambello (55) |
| Year of Election or Appointment: 2011 Deputy Treasurer of the Fidelity funds. Mr. Zambello is an employee of Fidelity Investments. Previously, Mr. Zambello served as Vice President of FMR's Program Management Group (2009-2011) and Vice President of the Transfer Agent Oversight Group (2005-2009). |
Adrien E. Deberghes (45) |
| Year of Election or Appointment: 2008 Deputy Treasurer of Fidelity's Equity and High Income Funds. Mr. Deberghes also serves as Vice President (2011-present) and Assistant Treasurer (2010-present) of other Fidelity funds, and is an employee of Fidelity Investments (2008-present). Previously, Mr. Deberghes served as Senior Vice President of Mutual Fund Administration at State Street Corporation (2007-2008), Senior Director of Mutual Fund Administration at Investors Bank & Trust (2005-2007), and Director of Finance for Dunkin' Brands (2000-2005). |
Stephen Sadoski (41) |
| Year of Election or Appointment: 2012 Deputy Treasurer of Fidelity's Equity and High Income Funds. Mr. Sadoski also serves as Assistant Treasurer of other Fidelity funds (2012-present) and is an employee of Fidelity Investments (2012-present). Previously, Mr. Sadoski served as an assistant chief accountant in the Division of Investment Management of the Securities and Exchange Commission (SEC) (2009-2012) and as a senior manager at Deloitte & Touche (1997-2009). |
Stephanie J. Dorsey (43) |
| Year of Election or Appointment: 2010 Assistant Treasurer of Fidelity's Equity and High Income Funds. Ms. Dorsey also serves as Deputy Treasurer of other Fidelity funds (2008-present) and is an employee of Fidelity Investments (2008-present). Previously, Ms. Dorsey served as Treasurer (2004-2008) of the JPMorgan Mutual Funds and Vice President (2004-2008) of JPMorgan Chase Bank. |
John R. Hebble (54) |
| Year of Election or Appointment: 2009 Assistant Treasurer of Fidelity's Equity and High Income Funds. Mr. Hebble also serves as President (2011-present), Treasurer, and Chief Financial Officer of The North Carolina Capital Management Trust: Cash and Term Portfolios (2008-present), President and Treasurer of other Fidelity funds (2008-present) and is an employee of Fidelity Investments. |
Gary W. Ryan (54) |
| Year of Election or Appointment: 2005 Assistant Treasurer of the Fidelity funds. Mr. Ryan is an employee of Fidelity Investments. Previously, Mr. Ryan served as Vice President of Fund Reporting in Fidelity Pricing and Cash Management Services (FPCMS) (1999-2005). |
Jonathan Davis (44) |
| Year of Election or Appointment: 2010 Assistant Treasurer of the Fidelity funds. Mr. Davis is also Assistant Treasurer of Fidelity Rutland Square Trust II and Fidelity Commonwealth Trust II. Mr. Davis is an employee of Fidelity Investments. Previously, Mr. Davis served as Vice President and Associate General Counsel of FMR LLC (2003-2010). |
Annual Report
The Board of Trustees of Fidelity Total Emerging Markets Fund voted to pay to shareholders of record at the opening of business on record date, the following distributions per share derived from capital gains realized from sales of portfolio securities, and dividends derived from net investment income:
| Pay Date | Record Date | Dividends | Capital Gains |
Institutional Class | 12/10/12 | 12/7/12 | $0.169 | $0.014 |
The amounts per share which represent income derived from sources within, and taxes paid to, foreign countries or possessions of the United States are as follows:
December 23, 2011 | Income | Taxes |
Institutional Class | $0.014 | $0.0009 |
December 29, 2011 | | |
Institutional Class | $0.008 | $0.0000 |
The fund will notify shareholders in January 2013 of amounts for use in preparing 2012 income tax returns.
A percentage of the dividends distributed during the fiscal year for the following funds may be taken into account as a dividend for purposes of the maximum rate under section 1(h)(11) of the Internal Revenue Code:
December 23, 2011 | |
Institutional Class | 48% |
December 29, 2011 | |
Institutional Class | 50% |
Annual Report
Board Approval of Investment Advisory Contracts and Management Fees
Fidelity Total Emerging Markets Fund
Each year, the Board of Trustees, including the Independent Trustees (together, the Board), votes on the renewal of the management contract and sub-advisory agreements (together, the Advisory Contracts) for the fund. The Board, assisted by the advice of fund counsel and Independent Trustees' counsel, requests and considers a broad range of information relevant to the renewal of the Advisory Contracts throughout the year.
The Board meets regularly and, at each of its meetings, considers factors that are relevant to its annual consideration of the renewal of the fund's Advisory Contracts, including the services and support provided to the fund and its shareholders. The Board has established various standing committees, each composed of and chaired by Independent Trustees with varying backgrounds, to which the Board has assigned specific subject matter responsibilities in order to enhance effective decision-making by the Board. The Board, acting directly and through its Committees, requests and receives information concerning the annual consideration of the renewal of the fund's Advisory Contracts. The Board also meets as needed to consider matters specifically related to the Board's annual consideration of the renewal of Advisory Contracts. Members of the Board may also meet with trustees of other Fidelity funds through ad hoc joint committees to discuss certain matters relevant to the Fidelity funds.
At its July 2012 meeting, the Board of Trustees, including the Independent Trustees, unanimously determined to renew the fund's Advisory Contracts. In reaching its determination, the Board considered all factors it believed relevant, including (i) the nature, extent, and quality of the services to be provided to the fund and its shareholders (including the investment performance of the fund); (ii) the competitiveness of the fund's management fee and total expense ratio relative to peer funds; (iii) the total costs of the services to be provided by and the profits to be realized by Fidelity from its relationship with the fund; (iv) the extent to which economies of scale exist and would be realized as the fund grows; and (v) whether fee levels reflect these economies of scale, if any, for the benefit of fund shareholders.
In considering whether to renew the Advisory Contracts for the fund, the Board reached a determination, with the assistance of fund counsel and Independent Trustees' counsel and through the exercise of its business judgment, that the renewal of the Advisory Contracts is in the best interests of the fund and its shareholders and that the compensation payable under the Advisory Contracts is fair and reasonable. The Board's decision to renew the Advisory Contracts was not based on any single factor, but rather was based on a comprehensive consideration of all the information provided to the Board at its meetings throughout the year. The Board, in reaching its determination to renew the Advisory Contracts, is aware that shareholders in the fund have a broad range of investment choices available to them, including a wide choice among mutual funds offered by Fidelity's competitors, and that the fund's shareholders, who have the opportunity to review and weigh the disclosure provided by the fund in its prospectus and other public disclosures, have chosen to invest in this fund, managed by Fidelity.
Annual Report
Nature, Extent, and Quality of Services Provided. The Board considered the staffing within the investment adviser, FMR, and the sub-advisers (together, the Investment Advisers), including the backgrounds of the fund's investment personnel, and also considered the fund's investment objective, strategies, and related investment philosophy. The Independent Trustees also had discussions with senior management of Fidelity's investment operations and investment groups. The Board considered the structure of the portfolio manager compensation program and whether this structure provides appropriate incentives to act in the best interests of the fund.
Resources Dedicated to Investment Management and Support Services. The Board and the Fund Oversight and Research Committees reviewed the general qualifications and capabilities of the Investment Advisers' investment staff, including its size, education, experience, and resources, as well as the Investment Advisers' approach to recruiting, training, managing, and compensating investment personnel. The Board also noted that FMR has continued to increase the resources devoted to non-U.S. offices, including expansion of Fidelity's global investment organization. The Board noted that Fidelity's analysts have extensive resources, tools and capabilities that allow them to conduct sophisticated quantitative and fundamental analysis, as well as credit analysis of issuers, counterparties and guarantors. The Board also believes that Fidelity's investment professionals have sufficient access to global information and data so as to provide competitive investment results over time, and that those professionals also have access to sophisticated tools that permit them to assess portfolio construction and risk and performance attribution characteristics continuously, as well as to transmit new information and research conclusions rapidly around the world. Additionally, in its deliberations, the Board considered the Investment Advisers' trading and risk management capabilities and resources, which are an integral part of the investment management process.
Shareholder and Administrative Services. The Board considered (i) the nature, extent, quality, and cost of advisory, administrative, and shareholder services performed by the Investment Advisers and their affiliates under the Advisory Contracts and under separate agreements covering transfer agency, pricing and bookkeeping, and securities lending services for the fund; (ii) the nature and extent of the supervision of third party service providers, principally custodians and subcustodians; and (iii) the resources devoted to, and the record of compliance with, the fund's compliance policies and procedures. The Board also reviewed the allocation of fund brokerage, including allocations to brokers affiliated with the Investment Advisers, the use of brokerage commissions to pay fund expenses, and the use of "soft" commission dollars to pay for research services.
Annual Report
Board Approval of Investment Advisory Contracts and
Management Fees - continued
The Board noted that the growth of fund assets over time across the complex allows Fidelity to reinvest in the development of services designed to enhance the value or convenience of the Fidelity funds as investment vehicles. These services include 24-hour access to account information and market information through telephone representatives and over the Internet, investor education materials and asset allocation tools, and the expanded availability of Fidelity Investor Centers.
Investment in a Large Fund Family. The Board considered the benefits to shareholders of investing in a Fidelity fund, including the benefits of investing in a fund that is part of a large family of funds offering a variety of investment disciplines and providing a large variety of mutual fund investor services. The Board noted that Fidelity had taken, or had made recommendations that resulted in the Fidelity funds taking, a number of actions over the previous year that benefited particular funds, including (i) continuing to dedicate additional resources to investment research and support of the senior management team that oversees asset management; (ii) persisting in efforts to enhance Fidelity's research capabilities, in particular, international research; (iii) launching new funds and making other enhancements to meet client needs for global and income-oriented solutions; (iv) continuing to launch dedicated lower cost underlying funds to meet investment management's portfolio construction needs related to expanding underlying fund options, specifically for the Freedom Fund product lines; (v) adopting a "Stock Selector" sector neutral investment approach and employing a team of portfolio managers who are sector specialists to manage certain funds; (vi) rationalizing product lines and gaining increased efficiencies through the mergers of several funds into other funds; (vii) strengthening the Spartan Index Fund product line by adding new funds and/or new low-cost institutional share classes, restructuring fund expenses to accommodate new classes, and reducing investment minimums for certain classes of shares; (viii) modifying the eligibility criteria for Institutional Class shares to increase their appeal to government entities and charitable investors; and (ix) reducing certain transfer agent fee rates.
Investment Performance. The Board considered whether the fund has operated in accordance with its investment objective, as well as its record of compliance with its investment restrictions. As the fund recently commenced operations the Board did not believe that it was appropriate to assign significant weight to its limited investment performance.
Based on its review, the Board concluded that the nature, extent, and quality of services provided to the fund under the Advisory Contracts should benefit the fund's shareholders.
Competitiveness of Management Fee and Total Expense Ratio. The Board considered the fund's management fee and total expense ratio compared to "mapped groups" of competitive funds and classes. Fidelity creates "mapped groups" by combining similar Lipper investment objective categories that have comparable management fee characteristics. Combining Lipper investment objective categories aids the Board's management fee and total expense ratio comparisons by broadening the competitive group used for comparison and by reducing the number of universes to which various Fidelity funds are compared.
Annual Report
Management Fee. The Board considered two proprietary management fee comparisons for the period of the fund's operation shown in the chart below. The group of Lipper funds used by the Board for management fee comparisons is referred to below as the "Total Mapped Group." The Total Mapped Group comparison focuses on a fund's standing relative to the total universe of comparable funds available to investors in terms of gross management fees before expense reimbursements or caps. "TMG %" represents the percentage of funds in the Total Mapped Group that had management fees that were lower than the fund's. For example, a TMG % of 13% means that 87% of the funds in the Total Mapped Group had higher management fees than the fund. The "Asset-Size Peer Group" (ASPG) comparison focuses on a fund's standing relative to non-Fidelity funds similar in size to the fund within the Total Mapped Group. The ASPG represents at least 15% of the funds in the Total Mapped Group with comparable asset size and management fee characteristics, subject to a minimum of 50 funds (or all funds in the Total Mapped Group if fewer than 50). Additional information, such as the ASPG quartile in which the fund's management fee ranked, is also included in the chart and considered by the Board.
Fidelity Total Emerging Markets Fund

Annual Report
Board Approval of Investment Advisory Contracts and
Management Fees - continued
The Board noted that the fund's management fee ranked below the median of its Total Mapped Group and below the median of its ASPG for the period.
Based on its review, the Board concluded that the fund's management fee is fair and reasonable in light of the services that the fund receives and the other factors considered.
Total Expense Ratio. In its review of each class's total expense ratio, the Board considered the fund's management fee as well as other fund or class expenses, as applicable, such as transfer agent fees, pricing and bookkeeping fees, fund-paid 12b-1 fees, and custodial, legal, and audit fees. The Board also noted the effects of any waivers and reimbursements on fees and expenses. As part of its review, the Board also considered the current total expense ratios of each class of the fund compared to competitive fund median expenses. Each class of the fund is compared to those funds and classes in the Total Mapped Group (used by the Board for management fee comparisons) that have a similar sales load structure.
The Board noted that the fund offers multiple classes, each of which has a different sales load and 12b-1 fee structure, and that the multiple structures are intended to offer a range of pricing options for the intermediary market. The Board also noted that the total expense ratios of the classes of the fund vary primarily by the level of their 12b-1 fees, although differences in transfer agent fees may also cause expenses to vary from class to class.
The Board noted that the total expense ratio of each of Class A and the retail class of the fund ranked below its competitive median for the period, the total expense ratio of Class C ranked equal to its competitive median for the period, and the total expense ratio of each of Class T and Institutional Class ranked above its competitive median for the period. The Board considered that various factors, including 12b-1 fees, positive or negative performance adjustments, and relatively higher other expenses in the case of small fund size, can affect total expense ratios. The Board noted that the total expense ratio of Class T was above the competitive median primarily because of higher 12b-1 fees on Class T. Class T has a higher 12b-1 fee, but a lower front-end sales charge, than traditionally priced front-end sales charge classes. The Board considered that Class T is primarily sold load-waived in the retirement plan market where its 0.50% 12b-1 fee is comparable to competing no-load, higher 12b-1 fee classes designed specifically for retirement plans.
The Board further considered that FMR contractually agreed to reimburse Class A, Class T, Class C, Institutional Class, and the retail class of the fund to the extent that total operating expenses (excluding interest, taxes, certain securities lending costs, brokerage commissions, extraordinary expenses, and acquired fund fees and expenses, if any), as a percentage of their respective average net assets, exceed 1.65%, 1.90%, 2.40%, 1.40%, and 1.40% through December 31, 2012.
Annual Report
Fees Charged to Other Fidelity Clients. The Board also considered Fidelity fee structures and other information with respect to clients of FMR and its affiliates, such as other mutual funds advised or subadvised by FMR or its affiliates, pension plan clients, and other institutional clients. The Board noted the findings of the 2010 ad hoc joint committee (created with the board of other Fidelity funds), which reviewed and compared Fidelity's institutional investment advisory business with its business of providing services to the Fidelity funds, including the differences in services provided, fees charged, and costs incurred, as well as competition in their respective marketplaces.
Based on its review of total expense ratios and fees charged to other Fidelity clients, the Board concluded that the total expense ratio of each class of the fund was reasonable, although in some cases above the median of the universe presented for comparison, in light of the services that the fund and its shareholders receive and the other factors considered.
Costs of the Services and Profitability. The Board considered the revenues earned and the expenses incurred by Fidelity in conducting the business of developing, marketing, distributing, managing, administering and servicing the fund and its shareholders. The Board also considered the level of Fidelity's profits in respect of all the Fidelity funds.
On an annual basis, FMR presents to the Board Fidelity's profitability for the fund. Fidelity calculates the profitability for each fund, as well as aggregate profitability for groups of Fidelity funds and all Fidelity funds, using a series of detailed revenue and cost allocation methodologies which originate with the books and records of Fidelity on which Fidelity's audited financial statements are based. The Audit Committee of the Board reviews any significant changes from the prior year's methodologies.
PricewaterhouseCoopers LLP (PwC), independent registered public accounting firm and auditor to Fidelity and certain Fidelity funds, has been engaged annually by the Board as part of the Board's assessment of Fidelity's profitability analysis. PwC's engagement includes the review and assessment of Fidelity's methodologies used in determining the revenues and expenses attributable to Fidelity's mutual fund business, and completion of agreed-upon procedures surrounding the mathematical accuracy of fund profitability and its conformity to allocation methodologies. After considering PwC's reports issued under the engagement and information provided by Fidelity, the Board concluded that while other allocation methods may also be reasonable, Fidelity's profitability methodologies are reasonable in all material respects.
The Board also reviewed Fidelity's non-fund businesses and fall-out benefits related to the mutual fund business as well as cases where Fidelity's affiliates may benefit from or be related to the fund's business.
Annual Report
Board Approval of Investment Advisory Contracts and
Management Fees - continued
The Board considered the costs of the services provided by and the profits realized by Fidelity in connection with the operation of the fund and was satisfied that the profitability was not excessive in the circumstances.
Economies of Scale. The Board considered whether there have been economies of scale in respect of the management of the Fidelity funds, whether the Fidelity funds (including the fund) have appropriately benefited from any such economies of scale, and whether there is potential for realization of any further economies of scale. The Board considered the extent to which the fund will benefit from economies of scale through increased services to the fund, through waivers or reimbursements, or through fee or expense reductions. The Board also noted that in 2009, it and the board of other Fidelity funds created an ad hoc committee (the Economies of Scale Committee) to analyze whether FMR attains economies of scale in respect of the management and servicing of the Fidelity funds, whether the Fidelity funds have appropriately benefited from such economies of scale, and whether there is potential for realization of any further economies of scale.
The Board recognized that the fund's management contract incorporates a "group fee" structure, which provides for lower group fee rates as total fund assets under FMR's management increase, and for higher group fee rates as total fund assets under FMR's management decrease. FMR calculates the group fee rates based on a tiered asset "breakpoint" schedule that varies based on asset class. The Board considered that the group fee is designed to deliver the benefits of economies of scale to fund shareholders when total Fidelity fund assets increase, even if assets of any particular fund are unchanged or have declined, because some portion of Fidelity's costs are attributable to services provided to all Fidelity funds, and all funds benefit if those costs can be allocated among more assets. The Board concluded that, given the group fee structure, fund shareholders will benefit from lower management fees as assets under FMR's management increase at the fund complex level, regardless of whether Fidelity achieves any such economies of scale.
The Board concluded, taking into account the analysis of the Economies of Scale Committee, that economies of scale, if any, are being appropriately shared between fund shareholders and Fidelity.
Additional Information Requested by the Board. In order to develop fully the factual basis for consideration of the Fidelity funds' Advisory Contracts, the Board requested and received additional information on certain topics, including (i) fund performance trends, actions to be taken by FMR to improve certain funds' overall performance, and Fidelity's long-term strategies for certain funds; (ii) the potential to further rationalize the Fidelity fund lineup with the possibility of achieving savings for the funds and Fidelity; (iii) Fidelity's compensation structure for portfolio managers and other key investment personnel; (iv) the amount of the investment that each portfolio manager has made in the Fidelity fund(s) that he or she manages; (v) the realization of fall-out benefits in certain Fidelity business units; (vi) Fidelity's group fee structures, the potential impact of regulatory changes on such structures, and the rationale for the individual fee rates of certain funds; (vii) fund profitability methodology, including Fidelity's cost allocation methodology, and the impact of certain factors on fund profitability results; (viii) trends regarding industry use of performance fee structures and the possibility of implementing performance fee structures for additional funds; and (ix) the impact of net redemptions from the Fidelity funds.
Annual Report
Based on its evaluation of all of the conclusions noted above, and after considering all factors it believed relevant, the Board ultimately concluded that the advisory fee structures are fair and reasonable, and that the fund's Advisory Contracts should be renewed.
Annual Report
Investment Adviser
Fidelity Management & Research Company
Boston, MA
Investment Sub-Advisers
FMR Co., Inc.
Fidelity Management & Research
(U.K.) Inc.
Fidelity Management & Research
(Hong Kong) Limited
Fidelity Management & Research
(Japan) Inc.
FIL Investments (Japan) Limited
FIL Investment Advisors (UK) Limited
FIL Investment Advisors
General Distributor
Fidelity Distributors Corporation
Smithfield, RI
Transfer and Service Agents
Fidelity Investments Institutional Operations Company, Inc.
Boston, MA
Fidelity Service Company, Inc.
Boston, MA
Custodian
The Northern Trust Company
Chicago, IL
(Fidelity Investment logo)(registered trademark)
ATEKI-UANN-1212
1.931260.100
Fidelity®
Emerging Markets Discovery
Fund
and Fidelity®
Total Emerging Markets
Fund
Annual Report
October 31, 2012
(Fidelity Cover Art)
Contents
Fidelity® Emerging Markets Discovery Fund |
Performance | (Click Here) | How the fund has done over time. |
Management's Discussion of Fund Performance | (Click Here) | The Portfolio Manager's review of fund performance and strategy. |
Shareholder Expense Example | (Click Here) | An example of shareholder expenses. |
Investment Changes | (Click Here) | A summary of major shifts in the fund's investments over the past six months. |
Investments | (Click Here) | A complete list of the fund's investments with their market values. |
Financial Statements | (Click Here) | Statements of assets and liabilities, operations, and changes in net assets, as well as financial highlights. |
Notes | (Click Here) | Notes to the Financial Statements. |
Fidelity Total Emerging Markets Fund |
Performance | (Click Here) | How the fund has done over time. |
Management's Discussion of Fund Performance | (Click Here) | The Portfolio Manager's review of fund performance and strategy. |
Shareholder Expense Example | (Click Here) | An example of shareholder expenses. |
Investment Changes | (Click Here) | A summary of major shifts in the fund's investments over the past six months.. |
Investments | (Click Here) | A complete list of the fund's investments with their market values. |
Financial Statements | (Click Here) | Statements of assets and liabilities, operations, and changes in net assets, as well as financial highlights. |
Notes | (Click Here) | Notes to the Financial Statements. |
Report of Independent Registered Public Accounting Firm | (Click Here) | |
Trustees and Officers | (Click Here) | |
Distributions | (Click Here) | |
Board Approval of Investment Advisory Contracts and Management Fees | (Click Here) | |
To view a fund's proxy voting guidelines and proxy voting record for the 12-month period ended June 30, visit http://www.fidelity.com/proxyvotingresults or visit the Securities and Exchange Commission's (SEC) web site at http://www.sec.gov. You may also call 1-800-544-8544 to request a free copy of the proxy voting guidelines.
Standard & Poor's, S&P and S&P 500 are registered service marks of The McGraw-Hill Companies, Inc. and have been licensed for use by Fidelity Distributors Corporation.
Other third party marks appearing herein are the property of their respective owners.
All other marks appearing herein are registered or unregistered trademarks or service marks of FMR LLC or an affiliated company. © 2012 FMR LLC. All rights reserved.
This report and the financial statements contained herein are submitted for the general information of the shareholders of the funds. This report is not authorized for distribution to prospective investors in the funds unless preceded or accompanied by an effective prospectus.
A fund files its complete schedule of portfolio holdings with the SEC for the first and third quarters of each fiscal year on Form N-Q. Forms N-Q are available on the SEC's web site at http://www.sec.gov. A fund's Forms N-Q may be reviewed and copied at the SEC's Public Reference Room in Washington, DC. Information regarding the operation of the SEC's Public Reference Room may be obtained by calling 1-800-SEC-0330. For a complete list of a fund's portfolio holdings, view the most recent holdings listing, semiannual report, or annual report on Fidelity's web site at http://www.fidelity.com, http://www.advisor.fidelity.com, or http://www.401k.com, as applicable.
NOT FDIC INSURED • MAY LOSE VALUE • NO BANK GUARANTEE
Neither the funds nor Fidelity Distributors Corporation is a bank.
Annual Report
Fidelity Emerging Markets Discovery Fund
Average annual total return reflects the change in the value of an investment, assuming reinvestment of the fund's distributions from dividend income and capital gains (the profits earned upon the sale of securities that have grown in value, if any) and assuming a constant rate of performance each year. The $10,000 table and the fund's returns do not reflect the deduction of taxes that a shareholder would pay on fund distributions or the redemption of fund shares. During periods of reimbursement by Fidelity, a fund's total return will be greater than it would be had the reimbursement not occurred. How a fund did yesterday is no guarantee of how it will do tomorrow.
Average annual total returns take Fidelity® Emerging Markets Discovery Fund's cumulative total return and show you what would have happened if Fidelity® Emerging Markets Discovery Fund shares had performed at a constant rate each year. These numbers will be reported once the fund is a year old.
$10,000 Over Life of Fund
Let's say hypothetically that $10,000 was invested in Fidelity Emerging Markets Discovery Fund, a class of the fund, on November 1, 2011, when the fund started. The chart shows how the value of your investment would have changed, and also shows how the MSCI® Emerging Markets SMID Cap Index performed over the same period.
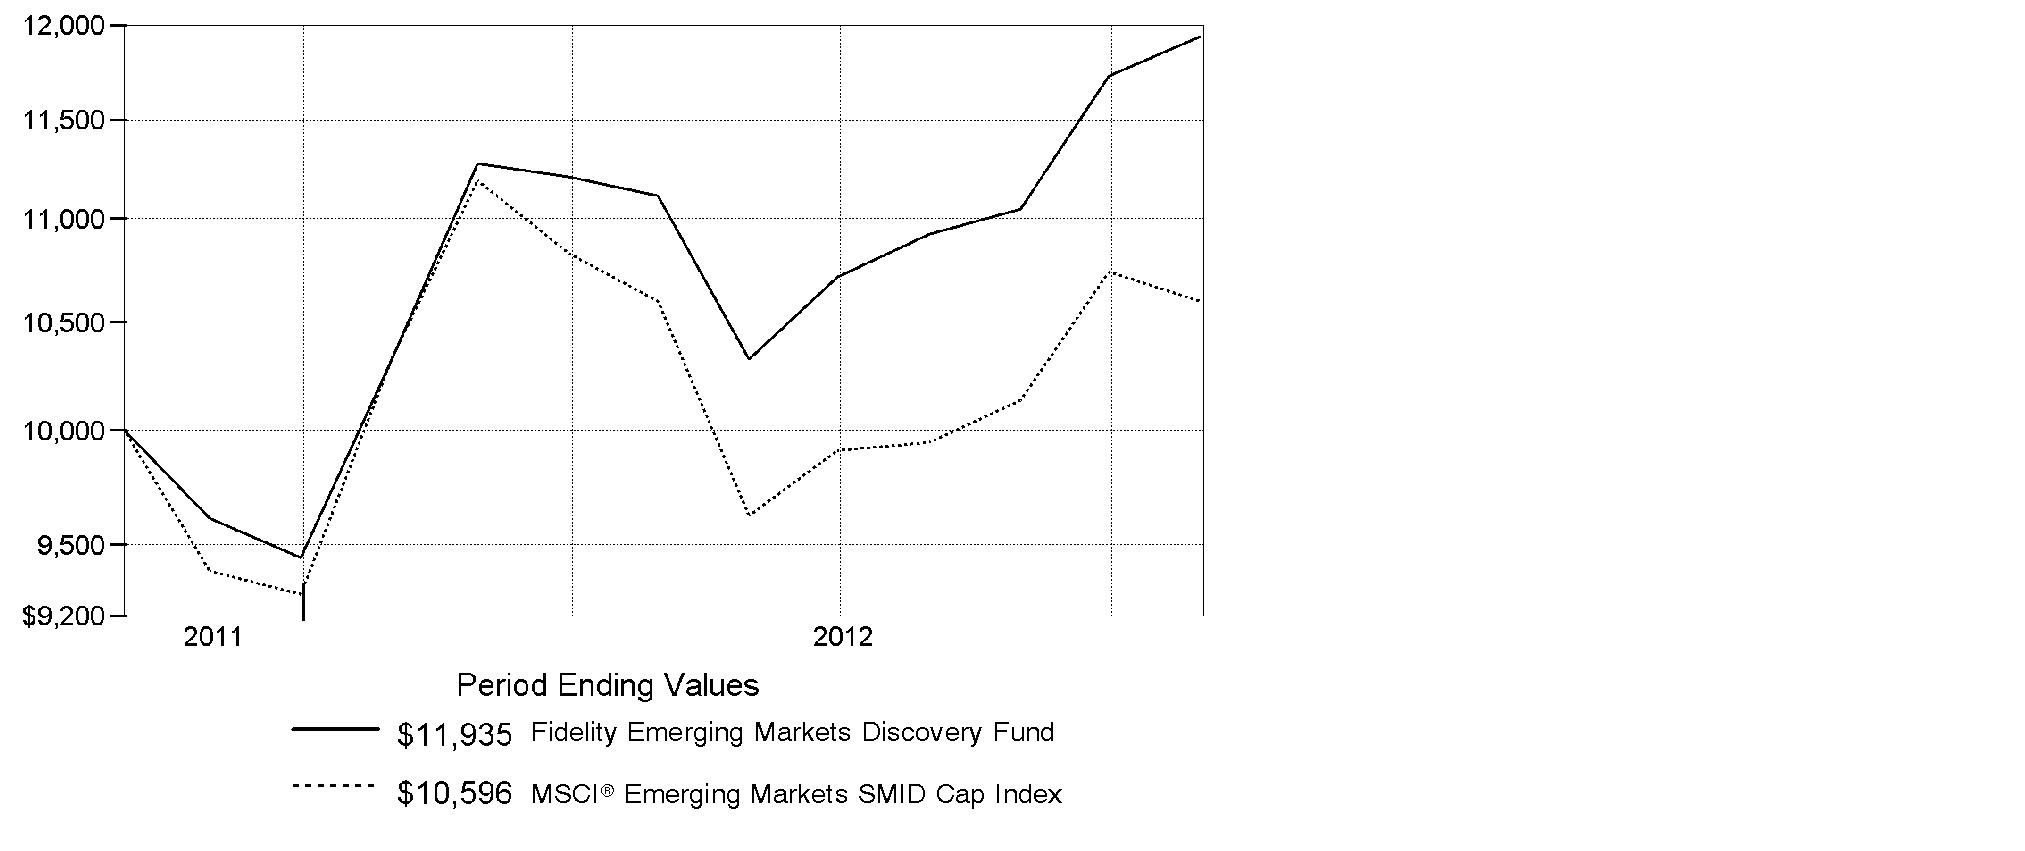
Annual Report
Fidelity Emerging Markets Discovery Fund
Market Recap: Emerging-markets stocks gained 2.98% for the year ending October 31, 2012, as measured by the MSCI® Emerging Markets Index. After some early choppiness, the index rallied strongly in the first two months of 2012 but retreated from March through May amid renewed concerns about Europe's sovereign debt crisis and continued economic sluggishness in key countries such as China and Brazil. A general uptrend in the final five months of the period lifted the index into positive territory for the full year, despite the head wind of a generally stronger U.S. dollar. Major benchmark component Brazil was a drag on performance, falling roughly 13%. The nation's inflation rate crept higher while economic growth ebbed, creating an unfavorable backdrop for stocks here. India's market retreated about 5%, while Russia gave up 4%. Conversely, Hong Kong advanced approximately 17%, aided by rebounding shares of property developers, while South Africa added 7%, China rose roughly 5% and South Korea and Taiwan gained about 4% and 1%, respectively. Sentiment about Chinese stocks improved following the government's September approval of massive outlays for infrastructure projects, in hopes of halting that nation's economic slowdown. However, China's ongoing transition to new Communist Party leadership created uncertainty that kept some investors on the sidelines.
Comments from Ashish Swarup, Portfolio Manager of Fidelity® Emerging Markets Discovery Fund: From its inception on November 1, 2011, through October 31, 2012, the fund's Retail Class shares rose 19.35%, easily outpacing the 5.96% gain of the MSCI® Emerging Markets SMID Cap Index. My focus on high-quality, steady growers worked well during this volatile period, including a stake in Uni-President Enterprises, Taiwan's largest food and beverage producer with a stake in local convenience stores. The fund benefited from its large out-of-benchmark position in the stock, which rose steadily for much of the period. South Korea's Yuhan was a standout value play. By spring 2012, shares of the health care products manufacturer were trading at an extremely cheap valuation. Establishing a position in May turned out to be the right call, as investors began to believe in the strength of the company's franchise and drove up the stock through period end, leaving Yuhan as the fund's top contributor. Among major detractors was Lianhua Supermarket Holdings. The Chinese grocery chain faced a difficult macroeconomic environment in that country, as well as government-imposed restrictions on coupons and gift cards, which hurt the chain's profits and its stock price. Exposure to India through two exchange-traded funds (since sold) also hurt.
The views expressed above reflect those of the portfolio manager(s) only through the end of the period as stated on the cover of this report and do not necessarily represent the views of Fidelity or any other person in the Fidelity organization. Any such views are subject to change at any time based upon market or other conditions and Fidelity disclaims any responsibility to update such views. These views may not be relied on as investment advice and, because investment decisions for a Fidelity fund are based on numerous factors, may not be relied on as an indication of trading intent on behalf of any Fidelity fund.
Annual Report
Fidelity Emerging Markets Discovery Fund
Shareholder Expense Example
As a shareholder of the Fund, you incur two types of costs: (1) transaction costs, including sales charges (loads) on purchase payments or redemption proceeds, redemption fees and (2) ongoing costs, including management fees, distribution and/or service (12b-1) fees and other Fund expenses. This Example is intended to help you understand your ongoing costs (in dollars) of investing in the Fund and to compare these costs with the ongoing costs of investing in other mutual funds.
The Example is based on an investment of $1,000 invested at the beginning of the period and held for the entire period (May 1, 2012 to October 31, 2012).
Actual Expenses
The first line of the accompanying table for each class of the Fund provides information about actual account values and actual expenses. You may use the information in this line, together with the amount you invested, to estimate the expenses that you paid over the period. Simply divide your account value by $1,000.00 (for example, an $8,600 account value divided by $1,000.00 = 8.6), then multiply the result by the number in the first line for a class of the Fund under the heading entitled "Expenses Paid During Period" to estimate the expenses you paid on your account during this period. A small balance maintenance fee of $12.00 that is charged once a year may apply for certain accounts with a value of less than $2,000. This fee is not included in the table below. If it was, the estimate of expenses you paid during the period would be higher, and your ending account value lower, by this amount. In addition, the Fund, as a shareholder in the underlying Fidelity Central Funds, will indirectly bear its pro-rata share of the fees and expenses incurred by the underlying Fidelity Central Funds. These fees and expenses are not included in the Fund's annualized expense ratio used to calculate the expense estimate in the table below.
Hypothetical Example for Comparison Purposes
The second line of the accompanying table for each class of the Fund provides information about hypothetical account values and hypothetical expenses based on a Class' actual expense ratio and an assumed rate of return of 5% per year before expenses, which is not the Class' actual return. The hypothetical account values and expenses may not be used to estimate the actual ending account balance or expenses you paid for the period. You may use this information to compare the ongoing costs of investing in the Fund and other funds. To do so, compare this 5% hypothetical example with the 5% hypothetical examples that appear in the shareholder reports of the other funds. A small balance maintenance fee of $12.00 that is charged once a year may apply for certain accounts with a value of less than $2,000. This fee is not included in the table below. If it was, the estimate of expenses you paid during the period would be higher, and your ending account value lower, by this amount. In addition, the Fund, as a shareholder in the underlying Fidelity Central Funds, will indirectly bear its pro-rata share of the fees and expenses incurred by the underlying Fidelity Central Funds. These fees and expenses are not included in the Fund's annualized expense ratio used to calculate the expense estimate in the table below.
Please note that the expenses shown in the table are meant to highlight your ongoing costs only and do not reflect any transaction costs. Therefore, the second line of the table is useful in comparing ongoing costs only, and will not help you determine the relative total costs of owning different funds. In addition, if these transactional costs were included, your costs would have been higher.
Annual Report
| Annualized
Expense Ratio | Beginning
Account Value
May 1, 2012 | Ending
Account Value
October 31, 2012 | Expenses Paid
During Period*
May 1, 2012
to October 31, 2012 |
Class A | 1.70% | | | |
Actual | | $ 1,000.00 | $ 1,072.10 | $ 8.85 |
HypotheticalA | | $ 1,000.00 | $ 1,016.59 | $ 8.62 |
Class T | 1.95% | | | |
Actual | | $ 1,000.00 | $ 1,071.30 | $ 10.15 |
HypotheticalA | | $ 1,000.00 | $ 1,015.33 | $ 9.88 |
Class C | 2.45% | | | |
Actual | | $ 1,000.00 | $ 1,068.70 | $ 12.74 |
HypotheticalA | | $ 1,000.00 | $ 1,012.82 | $ 12.40 |
Emerging Markets Discovery | 1.45% | | | |
Actual | | $ 1,000.00 | $ 1,073.90 | $ 7.56 |
HypotheticalA | | $ 1,000.00 | $ 1,017.85 | $ 7.35 |
Institutional Class | 1.45% | | | |
Actual | | $ 1,000.00 | $ 1,073.90 | $ 7.56 |
HypotheticalA | | $ 1,000.00 | $ 1,017.85 | $ 7.35 |
A 5% return per year before expenses
* Expenses are equal to each Class' annualized expense ratio, multiplied by the average account value over the period, multiplied by 184/366 (to reflect the one-half year period).
Annual Report
Fidelity Emerging Markets Discovery Fund
Investment Changes (Unaudited)
Top Five Stocks as of October 31, 2012 |
| % of fund's
net assets | % of fund's net assets
6 months ago |
Unified-President Enterprises Corp. (Taiwan, Food Products) | 1.4 | 2.1 |
LG Corp. (Korea (South), Industrial Conglomerates) | 1.4 | 0.8 |
BS Financial Group, Inc. (Korea (South), Commercial Banks) | 1.3 | 0.9 |
China Insurance International Holdings Co. Ltd. (Hong Kong, Insurance) | 1.2 | 0.6 |
Samson Holding Ltd. (Cayman Islands, Household Durables) | 1.2 | 0.9 |
| 6.5 | |
Top Five Market Sectors as of October 31, 2012 |
| % of fund's
net assets | % of fund's net assets
6 months ago |
Financials | 21.2 | 18.1 |
Consumer Staples | 17.3 | 16.5 |
Industrials | 14.5 | 14.0 |
Consumer Discretionary | 12.7 | 11.1 |
Information Technology | 11.3 | 10.2 |
Top Five Countries as of October 31, 2012 |
(excluding cash equivalents) | % of fund's
net assets | % of fund's net assets
6 months ago |
Taiwan | 14.1 | 13.5 |
Korea (South) | 12.8 | 13.1 |
India | 9.2 | 0.9 |
South Africa | 8.9 | 8.5 |
Cayman Islands | 8.3 | 7.6 |
Percentages are adjusted for the effect of open futures contracts, if applicable. |
Asset Allocation (% of fund's net assets) |
As of October 31, 2012 | As of April 30, 2012 |
 | Stocks and
Investment
Companies 97.2% | | | Stocks and
Investment
Companies 96.0% | |
| Short-Term
Investments and
Net Other Assets
(Liabilities) 2.8% | | | Short-Term
Investments and
Net Other Assets
(Liabilities) 4.0% | |

Annual Report
Fidelity Emerging Markets Discovery Fund
Investments October 31, 2012
Showing Percentage of Net Assets
Common Stocks - 96.5% |
| Shares | | Value |
Bailiwick of Jersey - 0.9% |
Atrium European Real Estate Ltd. | 73,315 | | $ 414,414 |
Bermuda - 6.4% |
ARA Asset Management Ltd. (c) | 282,000 | | 366,429 |
GP Investments Ltd. (depositary receipt) (a) | 144,317 | | 333,250 |
Pacific Basin Shipping Ltd. | 848,000 | | 454,087 |
Texwinca Holdings Ltd. | 452,000 | | 359,848 |
Trinity Ltd. | 456,000 | | 319,492 |
Vtech Holdings Ltd. | 30,500 | | 362,259 |
Wilson Sons Ltd. unit | 25,655 | | 356,205 |
Yue Yuen Industrial (Holdings) Ltd. | 112,500 | | 388,304 |
TOTAL BERMUDA | | 2,939,874 |
Brazil - 3.0% |
Duratex SA | 53,339 | | 371,079 |
LPS Brasil Consultoria de Imoveis SA | 16,628 | | 285,723 |
Oi SA | 61,940 | | 292,765 |
Porto Seguro SA | 39,080 | | 415,612 |
TOTAL BRAZIL | | 1,365,179 |
Cayman Islands - 8.3% |
ASM Pacific Technology Ltd. | 30,400 | | 338,909 |
Boer Power Holdings Ltd. | 1,149,000 | | 415,120 |
Haitian International Holdings Ltd. | 235,000 | | 290,185 |
Kingboard Chemical Holdings Ltd. | 117,500 | | 349,465 |
Lee & Man Paper Manufacturing Ltd. | 781,000 | | 410,148 |
O-Net Communications Group Ltd. | 1,397,000 | | 369,527 |
Samson Holding Ltd. | 3,736,000 | | 535,088 |
Value Partners Group Ltd. | 725,000 | | 395,707 |
Yingde Gases Group Co. Ltd. | 406,000 | | 385,043 |
Yip's Chemical Holdings Ltd. | 450,105 | | 303,746 |
TOTAL CAYMAN ISLANDS | | 3,792,938 |
Chile - 5.1% |
Compania Cervecerias Unidas SA sponsored ADR | 6,256 | | 443,738 |
Embotelladora Andina SA sponsored ADR | 10,053 | | 380,808 |
Isapre CruzBlanca SA | 377,800 | | 494,520 |
Parque Arauco SA | 188,928 | | 431,533 |
Quinenco SA | 123,729 | | 352,299 |
Sociedad Matriz SAAM SA | 2,030,814 | | 237,417 |
TOTAL CHILE | | 2,340,315 |
Common Stocks - continued |
| Shares | | Value |
China - 4.1% |
China BlueChemical Ltd. (H Shares) | 726,000 | | $ 459,953 |
China Oilfield Services Ltd. (H Shares) | 178,000 | | 337,624 |
China Shipping Development Co. Ltd. (H Shares) | 776,000 | | 407,523 |
Dongfeng Motor Group Co. Ltd. (H Shares) | 286,000 | | 354,269 |
Lianhua Supermarket Holdings Ltd. (H Shares) | 416,000 | | 336,018 |
TOTAL CHINA | | 1,895,387 |
Colombia - 0.7% |
Bolsa de Valores de Colombia | 17,742,190 | | 311,884 |
Hong Kong - 4.2% |
China Insurance International Holdings Co. Ltd. (a) | 329,400 | | 564,439 |
China Resources Power Holdings Co. Ltd. | 172,000 | | 368,411 |
Dah Chong Hong Holdings Ltd. | 364,000 | | 343,332 |
Television Broadcasts Ltd. | 45,000 | | 335,320 |
Vitasoy International Holdings Ltd. | 346,000 | | 328,586 |
TOTAL HONG KONG | | 1,940,088 |
India - 9.2% |
Britannia Industries Ltd. (a) | 39,964 | | 359,234 |
Container Corp. of India Ltd. | 18,029 | | 336,437 |
DB Corp. Ltd. | 72,284 | | 281,519 |
Max India Ltd. (a) | 82,604 | | 371,683 |
Oberoi Realty Ltd. (a) | 74,721 | | 379,195 |
Pidilite Industries Ltd. (a) | 92,320 | | 329,953 |
Piramal Enterprises Ltd. | 39,631 | | 365,779 |
Punjab National Bank | 28,154 | | 399,512 |
Redington India Ltd. | 205,537 | | 309,614 |
Satyam Computer Services Ltd. (a) | 232,067 | | 470,992 |
Smithkline Beecham Consumer Healthcare Ltd. | 4,666 | | 263,370 |
Trent Ltd. | 17,012 | | 351,954 |
TOTAL INDIA | | 4,219,242 |
Indonesia - 2.2% |
PT Astra Graphia Tbk | 2,285,500 | | 333,127 |
PT Kalbe Farma Tbk | 3,550,500 | | 358,560 |
PT Ramayana Lestari Sentosa Tbk | 2,877,000 | | 332,479 |
TOTAL INDONESIA | | 1,024,166 |
Kenya - 0.8% |
Safaricom Ltd. | 6,662,734 | | 344,287 |
Korea (South) - 12.8% |
AMOREPACIFIC Corp. | 338 | | 384,401 |
Common Stocks - continued |
| Shares | | Value |
Korea (South) - continued |
BS Financial Group, Inc. | 52,000 | | $ 589,001 |
DuzonBizon Co. Ltd. (a) | 28,320 | | 285,714 |
E-Mart Co. Ltd. | 1,665 | | 361,153 |
Green Cross Holdings Corp. | 30,650 | | 477,887 |
Kiwoom Securities Co. Ltd. | 6,127 | | 310,194 |
LG Corp. | 10,280 | | 627,933 |
LG Fashion Corp. | 12,330 | | 343,782 |
LG Household & Health Care Ltd. | 841 | | 494,425 |
Nong Shim Co. Ltd. | 1,612 | | 381,444 |
S1 Corp. | 6,266 | | 378,148 |
Samsung Fire & Marine Insurance Co. Ltd. | 1,804 | | 394,613 |
Shinsegae Co. Ltd. | 1,944 | | 347,678 |
Yuhan Corp. | 2,705 | | 467,654 |
TOTAL KOREA (SOUTH) | | 5,844,027 |
Malaysia - 1.4% |
AEON Co. (M) Bhd | 96,100 | | 393,739 |
Top Glove Corp. Bhd | 147,900 | | 259,772 |
TOTAL MALAYSIA | | 653,511 |
Mexico - 2.6% |
Bolsa Mexicana de Valores SA de CV | 184,322 | | 408,087 |
Grupo Herdez SAB de CV | 154,817 | | 419,380 |
Urbi, Desarrollos Urbanos, SA de CV (a) | 556,186 | | 347,032 |
TOTAL MEXICO | | 1,174,499 |
Nigeria - 0.8% |
Nestle Foods Nigeria PLC | 81,461 | | 350,097 |
Philippines - 1.9% |
BDO Unibank, Inc. | 297,477 | | 463,225 |
Manila Water Co., Inc. | 595,400 | | 420,112 |
TOTAL PHILIPPINES | | 883,337 |
Poland - 0.9% |
Warsaw Stock Exchange | 36,105 | | 424,080 |
Singapore - 3.8% |
Ascendas India Trust | 494,000 | | 307,788 |
Bumitama Agri Ltd. | 435,000 | | 358,399 |
Ezra Holdings Ltd. | 359,000 | | 328,156 |
Global Logistic Properties Ltd. | 200,024 | | 421,431 |
Super Group Ltd. Singapore | 156,000 | | 312,051 |
TOTAL SINGAPORE | | 1,727,825 |
Common Stocks - continued |
| Shares | | Value |
South Africa - 8.9% |
Advtech Ltd. | 501,940 | | $ 329,392 |
African Oxygen Ltd. | 133,230 | | 301,166 |
AngloGold Ashanti Ltd. | 11,381 | | 384,511 |
Astral Foods Ltd. | 10,979 | | 121,178 |
Bidvest Group Ltd. | 14,700 | | 350,858 |
Coronation Fund Managers Ltd. | 86,000 | | 331,774 |
JSE Ltd. | 41,855 | | 339,497 |
Nampak Ltd. | 123,802 | | 412,642 |
Reunert Ltd. | 49,133 | | 432,814 |
SA Corporate Real Estate Fund | 883,400 | | 359,650 |
Tiger Brands Ltd. | 12,825 | | 407,648 |
Zeder Investments Ltd. | 899,061 | | 300,701 |
TOTAL SOUTH AFRICA | | 4,071,831 |
Sri Lanka - 0.9% |
John Keells Holdings Ltd. | 253,895 | | 399,994 |
Taiwan - 14.1% |
Chroma ATE, Inc. | 155,000 | | 295,036 |
Cleanaway Co. Ltd. | 50,000 | | 347,484 |
CTCI Corp. | 135,000 | | 268,521 |
Delta Electronics, Inc. | 100,000 | | 341,664 |
E Sun Financial Holdings Co. Ltd. | 680,050 | | 341,073 |
Formosa Optical Technology Co. Ltd. | 167,000 | | 428,791 |
Insyde Software Corp. | 82,000 | | 241,986 |
MJC Probe, Inc. | 130,000 | | 191,373 |
Motech Industries, Inc. (a) | 237,000 | | 182,557 |
Pacific Hospital Supply Co. Ltd. | 134,700 | | 392,433 |
Powertech Technology, Inc. | 200,000 | | 310,852 |
President Chain Store Corp. | 71,000 | | 351,232 |
SIMPLO Technology Co. Ltd. | 39,400 | | 194,235 |
Sinyi Realty, Inc. | 273,000 | | 364,498 |
St. Shine Optical Co. Ltd. | 25,000 | | 326,087 |
Taiwan Hon Chuan Enterprise Co. Ltd. | 144,000 | | 306,635 |
Unified-President Enterprises Corp. | 369,890 | | 653,419 |
Wah Lee Industrial Corp. | 250,000 | | 320,096 |
WPG Holding Co. Ltd. | 288,000 | | 348,045 |
Yungtay Engineering Co. Ltd. | 132,000 | | 263,006 |
TOTAL TAIWAN | | 6,469,023 |
Common Stocks - continued |
| Shares | | Value |
Turkey - 1.7% |
Anadolu Efes Biracilik Ve Malt Sanayii A/S | 30,749 | | $ 461,449 |
Enka Insaat ve Sanayi A/S | 121,800 | | 323,441 |
TOTAL TURKEY | | 784,890 |
United Arab Emirates - 0.9% |
First Gulf Bank PJSC | 145,141 | | 412,939 |
United Kingdom - 0.9% |
PZ Cussons PLC Class L | 78,416 | | 428,351 |
TOTAL COMMON STOCKS (Cost $41,546,037) |
44,212,178
|
Investment Companies - 0.7% |
| | | |
Thailand - 0.7% |
CPN Retail Growth Leasehold Property Fund
(Cost $281,433) | 596,600 | |
332,633
|
Money Market Funds - 2.2% |
| | | |
Fidelity Cash Central Fund, 0.19% (b)
(Cost $986,128) | 986,128 | |
986,128
|
TOTAL INVESTMENT PORTFOLIO - 99.4% (Cost $42,813,598) | | 45,530,939 |
NET OTHER ASSETS (LIABILITIES) - 0.6% | | 274,943 |
NET ASSETS - 100% | $ 45,805,882 |
Legend |
(a) Non-income producing |
(b) Affiliated fund that is available only to investment companies and other accounts managed by Fidelity Investments. The rate quoted is the annualized seven-day yield of the fund at period end. A complete unaudited listing of the fund's holdings as of its most recent quarter end is available upon request. In addition, each Fidelity Central Fund's financial statements, which are not covered by the Fund's Report of Independent Registered Public Accounting Firm, are available on the SEC's website or upon request. |
(c) Security exempt from registration under Rule 144A of the Securities Act of 1933. These securities may be resold in transactions exempt from registration, normally to qualified institutional buyers. At the end of the period, the value of these securities amounted to $366,429 or 0.8% of net assets. |
Affiliated Central Funds |
Information regarding fiscal year to date income earned by the Fund from investments in Fidelity Central Funds is as follows: |
Fund | Income earned |
Fidelity Cash Central Fund | $ 1,474 |
Other Information |
Categorizations in the Schedule of Investments are based on country or territory of incorporation. |
The following is a summary of the inputs used, as of October 31, 2012, involving the Fund's assets and liabilities carried at fair value. The inputs or methodology used for valuing securities may not be an indication of the risk associated with investing in those securities. For more information on valuation inputs, and their aggregation into the levels used in the table below, please refer to the Security Valuation section in the accompanying Notes to Financial Statements. |
Valuation Inputs at Reporting Date: |
Description | Total | Level 1 | Level 2 | Level 3 |
Investments in Securities: | | | | |
Equities: | | | | |
Consumer Discretionary | $ 5,792,019 | $ 5,792,019 | $ - | $ - |
Consumer Staples | 7,897,082 | 7,897,082 | - | - |
Energy | 665,780 | 665,780 | - | - |
Financials | 9,765,548 | 9,366,036 | 399,512 | - |
Health Care | 3,142,692 | 3,142,692 | - | - |
Industrials | 6,613,155 | 6,613,155 | - | - |
Information Technology | 5,245,451 | 5,245,451 | - | - |
Materials | 3,664,876 | 3,280,365 | 384,511 | - |
Telecommunication Services | 637,052 | 637,052 | - | - |
Utilities | 788,523 | 788,523 | - | - |
Investment Companies | 332,633 | 332,633 | - | - |
Money Market Funds | 986,128 | 986,128 | - | - |
Total Investments in Securities: | $ 45,530,939 | $ 44,746,916 | $ 784,023 | $ - |
See accompanying notes which are an integral part of the financial statements.
Annual Report
Fidelity Emerging Markets Discovery Fund
Statement of Assets and Liabilities
| October 31, 2012 |
| | |
Assets | | |
Investment in securities, at value - See accompanying schedule: Unaffiliated issuers (cost $41,827,470) | $ 44,544,811 | |
Fidelity Central Funds (cost $986,128) | 986,128 | |
Total Investments (cost $42,813,598) | | $ 45,530,939 |
Cash | | 8,906 |
Foreign currency held at value (cost $305,626) | | 305,686 |
Receivable for investments sold | | 253,106 |
Receivable for fund shares sold | | 399,571 |
Dividends receivable | | 40,734 |
Distributions receivable from Fidelity Central Funds | | 359 |
Receivable from investment adviser for expense reductions | | 67,146 |
Other affiliated receivables | | 73,436 |
Other receivables | | 8,980 |
Total assets | | 46,688,863 |
| | |
Liabilities | | |
Payable for investments purchased | $ 541,509 | |
Payable for fund shares redeemed | 179,125 | |
Accrued management fee | 30,100 | |
Distribution and service plan fees payable | 2,246 | |
Other affiliated payables | 8,926 | |
Other payables and accrued expenses | 121,075 | |
Total liabilities | | 882,981 |
| | |
Net Assets | | $ 45,805,882 |
Net Assets consist of: | | |
Paid in capital | | $ 42,091,833 |
Undistributed net investment income | | 251,826 |
Accumulated undistributed net realized gain (loss) on investments and foreign currency transactions | | 778,695 |
Net unrealized appreciation (depreciation) on investments and assets and liabilities in foreign currencies | | 2,683,528 |
Net Assets | | $ 45,805,882 |
See accompanying notes which are an integral part of the financial statements.
Annual Report
Statement of Assets and Liabilities - continued
| October 31, 2012 |
| | |
Calculation of Maximum Offering Price Class A:
Net Asset Value and redemption price per share ($1,670,981 ÷ 140,485 shares) | | $ 11.89 |
| | |
Maximum offering price per share (100/94.25 of $11.89) | | $ 12.62 |
Class T:
Net Asset Value and redemption price per share ($1,700,385 ÷ 143,256 shares) | | $ 11.87 |
| | |
Maximum offering price per share (100/96.50 of $11.87) | | $ 12.30 |
Class C:
Net Asset Value and offering price per share ($1,474,059 ÷ 124,755 shares)A | | $ 11.82 |
| | |
Emerging Markets Discovery:
Net Asset Value, offering price and redemption price per share ($39,135,461 ÷ 3,283,254 shares) | | $ 11.92 |
| | |
Institutional Class:
Net Asset Value, offering price and redemption price per share ($1,824,996 ÷ 153,109 shares) | | $ 11.92 |
A Redemption price per share is equal to net asset value less any applicable contingent deferred sales charge.
See accompanying notes which are an integral part of the financial statements.
Annual Report
Fidelity Emerging Markets Discovery Fund
Financial Statements - continued
Statement of Operations
| | For the period
November 1, 2011
(commencement of
operations) to
October 31, 2012 |
| | |
Investment Income | | |
Dividends | | $ 634,505 |
Income from Fidelity Central Funds | | 1,474 |
Income before foreign taxes withheld | | 635,979 |
Less foreign taxes withheld | | (58,290) |
Total income | | 577,689 |
| | |
Expenses | | |
Management fee | $ 176,730 | |
Transfer agent fees | 47,994 | |
Distribution and service plan fees | 15,564 | |
Accounting fees and expenses | 10,679 | |
Custodian fees and expenses | 215,734 | |
Independent trustees' compensation | 114 | |
Registration fees | 125,640 | |
Audit | 54,161 | |
Legal | 63 | |
Miscellaneous | 391 | |
Total expenses before reductions | 647,070 | |
Expense reductions | (344,473) | 302,597 |
Net investment income (loss) | | 275,092 |
Realized and Unrealized Gain (Loss) Net realized gain (loss) on: | | |
Investment securities: | | |
Unaffiliated issuers (net of foreign taxes of $4,717) | 832,255 | |
Foreign currency transactions | 2,291 | |
Total net realized gain (loss) | | 834,546 |
Change in net unrealized appreciation (depreciation) on: Investment securities (net of increase in deferred foreign taxes of $33,633) | 2,683,708 | |
Assets and liabilities in foreign currencies | (180) | |
Total change in net unrealized appreciation (depreciation) | | 2,683,528 |
Net gain (loss) | | 3,518,074 |
Net increase (decrease) in net assets resulting from operations | | $ 3,793,166 |
See accompanying notes which are an integral part of the financial statements.
Annual Report
Statement of Changes in Net Assets
| For the period
November 1, 2011
(commencement of
operations) to
October 31, 2012 |
Increase (Decrease) in Net Assets | |
Operations | |
Net investment income (loss) | $ 275,092 |
Net realized gain (loss) | 834,546 |
Change in net unrealized appreciation (depreciation) | 2,683,528 |
Net increase (decrease) in net assets resulting from operations | 3,793,166 |
Distributions to shareholders from net investment income | (7,760) |
Share transactions - net increase (decrease) | 41,986,470 |
Redemption fees | 34,006 |
Total increase (decrease) in net assets | 45,805,882 |
| |
Net Assets | |
Beginning of period | - |
End of period (including undistributed net investment income of $251,826) | $ 45,805,882 |
See accompanying notes which are an integral part of the financial statements.
Annual Report
Financial Highlights - Class A
Period ended October 31, | 2012 F |
Selected Per-Share Data | |
Net asset value, beginning of period | $ 10.00 |
Income from Investment Operations | |
Net investment income (loss) C | .12 |
Net realized and unrealized gain (loss) | 1.76 |
Total from investment operations | 1.88 |
Distributions from net investment income | (.01) |
Redemption fees added to paid in capital C | .02 |
Net asset value, end of period | $ 11.89 |
Total Return A, B | 19.00% |
Ratios to Average Net Assets D, G | |
Expenses before reductions | 3.49% |
Expenses net of fee waivers, if any | 1.70% |
Expenses net of all reductions | 1.64% |
Net investment income (loss) | 1.16% |
Supplemental Data | |
Net assets, end of period (000 omitted) | $ 1,671 |
Portfolio turnover rate E | 83% |
A Total returns would have been lower if certain expenses had not been reduced during the applicable periods shown.
B Total returns do not include the effect of the sales charges.
C Calculated based on average shares outstanding during the period.
D Fees and expenses of any underlying Fidelity Central Funds are not included in the Fund's expense ratio. The Fund indirectly bears its proportionate share of the expenses of any underlying Fidelity Central Funds.
E Amount does not include the portfolio activity of any underlying Fidelity Central Funds.
F For the period November 1, 2011 (commencement of operations) to October 31, 2012.
G Expense ratios reflect operating expenses of the class. Expenses before reductions do not reflect amounts reimbursed by the investment adviser or reductions from brokerage service arrangements or reductions from other expense offset arrangements and do not represent the amount paid by the class during periods when reimbursements or reductions occur. Expense ratios before reductions for start-up periods may not be representative of longer-term operating periods. Expenses net of fee waivers reflect expenses after reimbursement by the investment adviser but prior to reductions from brokerage service arrangements or other expense offset arrangements. Expenses net of all reductions represent the net expenses paid by the class.
See accompanying notes which are an integral part of the financial statements.
Annual Report
Financial Highlights - Class T
Period ended October 31, | 2012 F |
Selected Per-Share Data | |
Net asset value, beginning of period | $ 10.00 |
Income from Investment Operations | |
Net investment income (loss) C | .10 |
Net realized and unrealized gain (loss) | 1.75 |
Total from investment operations | 1.85 |
Distributions from net investment income | - H |
Redemption fees added to paid in capital C | .02 |
Net asset value, end of period | $ 11.87 |
Total Return A, B | 18.75% |
Ratios to Average Net Assets D, G | |
Expenses before reductions | 3.77% |
Expenses net of fee waivers, if any | 1.95% |
Expenses net of all reductions | 1.89% |
Net investment income (loss) | .91% |
Supplemental Data | |
Net assets, end of period (000 omitted) | $ 1,700 |
Portfolio turnover rate E | 83% |
A Total returns would have been lower if certain expenses had not been reduced during the applicable periods shown.
B Total returns do not include the effect of the sales charges.
C Calculated based on average shares outstanding during the period.
D Fees and expenses of any underlying Fidelity Central Funds are not included in the Fund's expense ratio. The Fund indirectly bears its proportionate share of the expenses of any underlying Fidelity Central Funds.
E Amount does not include the portfolio activity of any underlying Fidelity Central Funds.
F For the period November 1, 2011 (commencement of operations) to October 31, 2012.
G Expense ratios reflect operating expenses of the class. Expenses before reductions do not reflect amounts reimbursed by the investment adviser or reductions from brokerage service arrangements or reductions from other expense offset arrangements and do not represent the amount paid by the class during periods when reimbursements or reductions occur. Expense ratios before reductions for start-up periods may not be representative of longer-term operating periods. Expenses net of fee waivers reflect expenses after reimbursement by the investment adviser but prior to reductions from brokerage service arrangements or other expense offset arrangements. Expenses net of all reductions represent the net expenses paid by the class.
H Amount represents less than $.01 per share.
See accompanying notes which are an integral part of the financial statements.
Annual Report
Financial Highlights - Class C
Period ended October 31, | 2012 F |
Selected Per-Share Data | |
Net asset value, beginning of period | $ 10.00 |
Income from Investment Operations | |
Net investment income (loss) C | .04 |
Net realized and unrealized gain (loss) | 1.76 |
Total from investment operations | 1.80 |
Redemption fees added to paid in capital C | .02 |
Net asset value, end of period | $ 11.82 |
Total Return A, B | 18.20% |
Ratios to Average Net Assets D, G | |
Expenses before reductions | 4.32% |
Expenses net of fee waivers, if any | 2.45% |
Expenses net of all reductions | 2.39% |
Net investment income (loss) | .41% |
Supplemental Data | |
Net assets, end of period (000 omitted) | $ 1,474 |
Portfolio turnover rate E | 83% |
A Total returns would have been lower if certain expenses had not been reduced during the applicable periods shown.
B Total returns do not include the effect of the contingent deferred sales charge.
C Calculated based on average shares outstanding during the period.
D Fees and expenses of any underlying Fidelity Central Funds are not included in the Fund's expense ratio. The Fund indirectly bears its proportionate share of the expenses of any underlying Fidelity Central Funds.
E Amount does not include the portfolio activity of any underlying Fidelity Central Funds.
F For the period November 1, 2011 (commencement of operations) to October 31, 2012.
G Expense ratios reflect operating expenses of the class. Expenses before reductions do not reflect amounts reimbursed by the investment adviser or reductions from brokerage service arrangements or reductions from other expense offset arrangements and do not represent the amount paid by the class during periods when reimbursements or reductions occur. Expense ratios before reductions for start-up periods may not be representative of longer-term operating periods. Expenses net of fee waivers reflect expenses after reimbursement by the investment adviser but prior to reductions from brokerage service arrangements or other expense offset arrangements. Expenses net of all reductions represent the net expenses paid by the class.
See accompanying notes which are an integral part of the financial statements.
Annual Report
Financial Highlights - Emerging Markets Discovery
Period ended October 31, | 2012 E |
Selected Per-Share Data | |
Net asset value, beginning of period | $ 10.00 |
Income from Investment Operations | |
Net investment income (loss) B | .15 |
Net realized and unrealized gain (loss) | 1.76 |
Total from investment operations | 1.91 |
Distributions from net investment income | (.01) |
Redemption fees added to paid in capital B | .02 |
Net asset value, end of period | $ 11.92 |
Total Return A | 19.35% |
Ratios to Average Net Assets C, F | |
Expenses before reductions | 3.02% |
Expenses net of fee waivers, if any | 1.45% |
Expenses net of all reductions | 1.39% |
Net investment income (loss) | 1.41% |
Supplemental Data | |
Net assets, end of period (000 omitted) | $ 39,135 |
Portfolio turnover rate D | 83% |
A Total returns would have been lower if certain expenses had not been reduced during the applicable periods shown.
B Calculated based on average shares outstanding during the period.
C Fees and expenses of any underlying Fidelity Central Funds are not included in the Fund's expense ratio. The Fund indirectly bears its proportionate share of the expenses of any underlying Fidelity Central Funds.
D Amount does not include the portfolio activity of any underlying Fidelity Central Funds.
E For the period November 1, 2011 (commencement of operations) to October 31, 2012.
F Expense ratios reflect operating expenses of the class. Expenses before reductions do not reflect amounts reimbursed by the investment adviser or reductions from brokerage service arrangements or reductions from other expense offset arrangements and do not represent the amount paid by the class during periods when reimbursements or reductions occur. Expense ratios before reductions for start-up periods may not be representative of longer-term operating periods. Expenses net of fee waivers reflect expenses after reimbursement by the investment adviser but prior to reductions from brokerage service arrangements or other expense offset arrangements. Expenses net of all reductions represent the net expenses paid by the class.
See accompanying notes which are an integral part of the financial statements.
Annual Report
Financial Highlights - Institutional Class
Period ended October 31, | 2012 E |
Selected Per-Share Data | |
Net asset value, beginning of period | $ 10.00 |
Income from Investment Operations | |
Net investment income (loss) B | .15 |
Net realized and unrealized gain (loss) | 1.76 |
Total from investment operations | 1.91 |
Distributions from net investment income | (.01) |
Redemption fees added to paid in capital B | .02 |
Net asset value, end of period | $ 11.92 |
Total Return A | 19.35% |
Ratios to Average Net Assets C, F | |
Expenses before reductions | 3.21% |
Expenses net of fee waivers, if any | 1.45% |
Expenses net of all reductions | 1.39% |
Net investment income (loss) | 1.41% |
Supplemental Data | |
Net assets, end of period (000 omitted) | $ 1,825 |
Portfolio turnover rate D | 83% |
A Total returns would have been lower if certain expenses had not been reduced during the applicable periods shown.
B Calculated based on average shares outstanding during the period.
C Fees and expenses of any underlying Fidelity Central Funds are not included in the Fund's expense ratio. The Fund indirectly bears its proportionate share of the expenses of any underlying Fidelity Central Funds.
D Amount does not include the portfolio activity of any underlying Fidelity Central Funds.
E For the period November 1, 2011 (commencement of operations) to October 31, 2012.
F Expense ratios reflect operating expenses of the class. Expenses before reductions do not reflect amounts reimbursed by the investment adviser or reductions from brokerage service arrangements or reductions from other expense offset arrangements and do not represent the amount paid by the class during periods when reimbursements or reductions occur. Expense ratios before reductions for start-up periods may not be representative of longer-term operating periods. Expenses net of fee waivers reflect expenses after reimbursement by the investment adviser but prior to reductions from brokerage service arrangements or other expense offset arrangements. Expenses net of all reductions represent the net expenses paid by the class.
See accompanying notes which are an integral part of the financial statements.
Annual Report
Fidelity Emerging Markets Discovery Fund
Notes to Financial Statements
For the period ended October 31, 2012
1. Organization.
Fidelity Emerging Markets Discovery Fund (the Fund) is a non-diversified fund of Fidelity Investment Trust (the Trust) and is authorized to issue an unlimited number of shares. The Trust is registered under the Investment Company Act of 1940, as amended (the 1940 Act), as an open-end management investment company organized as a Massachusetts business trust. The Fund offers Class A, Class T, Class C, Emerging Markets Discovery and Institutional Class shares, each of which has equal rights as to assets and voting privileges. Each class has exclusive voting rights with respect to matters that affect that class. Investment income, realized and unrealized capital gains and losses, the common expenses of the Fund, and certain fund-level expense reductions, if any, are allocated on a pro-rata basis to each class based on the relative net assets of each class to the total net assets of the Fund. Each class differs with respect to transfer agent and distribution and service plan fees incurred. Certain expense reductions may also differ by class. The Fund's investments in emerging markets can be subject to social, economic, regulatory, and political uncertainties and can be extremely volatile.
2. Investments in Fidelity Central Funds.
The Fund invests in Fidelity Central Funds, which are open-end investment companies available only to other investment companies and accounts managed by Fidelity Management & Research Company (FMR) and its affiliates. The Fund's Schedule of Investments lists each of the Fidelity Central Funds held as of period end as an investment of the Fund, but does not include the underlying holdings of each Fidelity Central Fund. As an Investing Fund, the Fund indirectly bears its proportionate share of the expenses of the underlying Fidelity Central Funds.
The Money Market Central Funds seek preservation of capital and current income and are managed by Fidelity Investments Money Management, Inc. (FIMM), an affiliate of FMR.
A complete unaudited list of holdings for each Fidelity Central Fund is available upon request or at the Securities and Exchange Commission (the SEC) web site at www.sec.gov. In addition, the financial statements of the Fidelity Central Funds, which are not covered by the Fund's Report of Independent Registered Public Accounting Firm, are available on the SEC web site or upon request.
3. Significant Accounting Policies.
The financial statements have been prepared in conformity with accounting principles generally accepted in the United States of America (GAAP), which require management to make certain estimates and assumptions at the date of the financial statements. Actual results could differ from those estimates. Subsequent events, if any, through the date that the financial statements were issued have been evaluated in the preparation of
Annual Report
Fidelity Emerging Markets Discovery Fund
Notes to Financial Statements - continued
3. Significant Accounting Policies - continued
the financial statements. The following summarizes the significant accounting policies of the Fund:
Security Valuation. Investments are valued as of 4:00 p.m. Eastern time on the last calendar day of the period. In accordance with valuation policies and procedures approved by the Board of Trustees (the Board), the Fund attempts to obtain prices from one or more third party pricing vendors or brokers to value its investments. When current market prices, quotations or rates are not readily available or reliable, securities will be fair valued in good faith by the FMR Fair Value Committee (the Committee), in accordance with procedures adopted by the Fund's Board. Factors used in determining fair value vary by security type and may include market or security specific events. The frequency with which these procedures are used cannot be predicted and they may be utilized to a significant extent. The Committee oversees the Fund's valuation policies and procedures and is responsible for approving and reporting to the Board all fair value determinations.
The Fund categorizes the inputs to valuation techniques used to value its investments into a disclosure hierarchy consisting of three levels as shown below:
Level 1 - quoted prices in active markets for identical investments
Level 2 - other significant observable inputs (including quoted prices for similar investments, interest rates, prepayment speeds, etc.)
Level 3 - unobservable inputs (including the Fund's own assumptions based on the best information available)
Valuation techniques used to value the Fund's investments by major category are as follows:
Equity securities, including restricted securities, for which market quotations are readily available, are valued at the last reported sale price or official closing price as reported by a third party pricing vendor on the primary market or exchange on which they are traded and are categorized as Level 1 in the hierarchy. In the event there were no sales during the day or closing prices are not available, securities are valued at the last quoted bid price or may be valued using the last available price and are generally categorized as Level 2 in the hierarchy. For foreign equity securities, when significant market or security specific events arise, comparisons to the valuation of American Depositary Receipts (ADRs), futures contracts, Exchange-Traded Funds (ETFs) and certain indexes as well as quoted prices for similar securities are used and are categorized as Level 2 in the hierarchy. Utilizing these techniques may result in transfers between Level 1 and Level 2.
Annual Report
3. Significant Accounting Policies - continued
Security Valuation - continued
Investments in open-end mutual funds, including the Fidelity Central Funds, are valued at their closing net asset value (NAV) each business day and are categorized as Level 1 in the hierarchy.
Changes in valuation techniques may result in transfers in or out of an assigned level within the disclosure hierarchy. The aggregate value of investments by input level, as of October 31, 2012, is included at the end of the Fund's Schedule of Investments.
Foreign Currency Translation. The Fund may use foreign currency contracts to facilitate transactions in foreign-denominated securities. Gains and losses from these transactions may arise from changes in the value of the foreign currency or if the counterparties do not perform under the contracts' terms.
Foreign-denominated assets, including investment securities, and liabilities are translated into U.S. dollars at the exchange rates at period end. Purchases and sales of investment securities, income and dividends received and expenses denominated in foreign currencies are translated into U.S. dollars at the exchange rate in effect on the transaction date.
The effects of exchange rate fluctuations on investments are included with the net realized and unrealized gain (loss) on investment securities. Other foreign currency transactions resulting in realized and unrealized gain (loss) are disclosed separately.
Investment Transactions and Income. For financial reporting purposes, the Fund's investment holdings and NAV include trades executed through the end of the last business day of the period. The NAV per share for processing shareholder transactions is calculated as of the close of business of the New York Stock Exchange (NYSE), normally 4:00 p.m. Eastern time and includes trades executed through the end of the prior business day. Gains and losses on securities sold are determined on the basis of identified cost. Dividend income is recorded on the ex-dividend date, except for certain dividends from foreign securities where the ex-dividend date may have passed, which are recorded as soon as the Fund is informed of the ex-dividend date. Non-cash dividends included in dividend income, if any, are recorded at the fair market value of the securities received. Interest income and distributions from the Fidelity Central Funds are accrued as earned. Investment income is recorded net of foreign taxes withheld where recovery of such taxes is uncertain.
Expenses. Expenses directly attributable to a fund are charged to that fund. Expenses attributable to more than one fund are allocated among the respective funds on the basis of relative net assets or other appropriate methods. Expense estimates are accrued in the period to which they relate and adjustments are made when actual amounts are known.
Annual Report
Fidelity Emerging Markets Discovery Fund
Notes to Financial Statements - continued
3. Significant Accounting Policies - continued
Income Tax Information and Distributions to Shareholders. Each year, the Fund intends to qualify as a regulated investment company under Subchapter M of the Internal Revenue Code, including distributing substantially all of its taxable income and realized gains. As a result, no provision for income taxes is required. As of October 31, 2012, the Fund did not have any unrecognized tax benefits in the financial statements; nor is the Fund aware of any tax positions for which it is reasonably possible that the total amounts of unrecognized tax benefits will significantly change in the next twelve months. The Fund files a U.S. federal tax return, in addition to state and local tax returns as required. A fund's federal income tax returns are subject to examination by the Internal Revenue Service (IRS) for a period of three fiscal years after they are filed. State and local tax returns may be subject to examination for an additional fiscal year depending on the jurisdiction. Foreign taxes are provided for based on the Fund's understanding of the tax rules and rates that exist in the foreign markets in which it invests. The Fund is subject to a tax imposed on capital gains by certain countries in which it invests. An estimated deferred tax liability for net unrealized appreciation on the applicable securities is included in Other payables and accrued expenses on the Statement of Assets & Liabilities.
Distributions are declared and recorded on the ex-dividend date. Income dividends and capital gain distributions are declared separately for each class. Income and capital gain distributions are determined in accordance with income tax regulations, which may differ from GAAP. In addition, the Fund claimed a portion of the payment made to redeeming shareholders as a distribution for income tax purposes.
Capital accounts within the financial statements are adjusted for permanent book-tax differences. These adjustments have no impact on net assets or the results of operations. Temporary book-tax differences will reverse in a subsequent period.
Book-tax differences are primarily due to foreign currency transactions, certain foreign taxes, passive foreign investment companies (PFIC) and losses deferred due to wash sales.
The federal tax cost of investment securities and unrealized appreciation (depreciation) as of period end were as follows:
Gross unrealized appreciation | $ 4,167,582 |
Gross unrealized depreciation | (1,578,547) |
Net unrealized appreciation (depreciation) on securities and other investments | $ 2,589,035 |
| |
Tax Cost | $ 42,941,904 |
Annual Report
3. Significant Accounting Policies - continued
Income Tax Information and Distributions to Shareholders - continued
The tax-based components of distributable earnings as of period end were as follows:
Undistributed ordinary income | $ 1,158,827 |
Net unrealized appreciation (depreciation) | $ 2,588,855 |
The tax character of distributions paid was as follows:
| October 31, 2012 |
Ordinary Income | $ 7,760 |
Short-Term Trading (Redemption) Fees. Shares purchased by investors and held in the Fund less than 90 days are subject to a redemption fee equal to 2.00% of the net asset value of shares redeemed. All redemption fees, which reduce the proceeds of the shareholder redemption, are retained by the Fund and accounted for as an addition to paid in capital.
Restricted Securities. The Fund may invest in securities that are subject to legal or contractual restrictions on resale. These securities generally may be resold in transactions exempt from registration or to the public if the securities are registered. Disposal of these securities may involve time-consuming negotiations and expense, and prompt sale at an acceptable price may be difficult. Information regarding restricted securities is included at the end of the Fund's Schedule of Investments.
New Accounting Pronouncement. In December 2011, the Financial Accounting Standards Board issued Accounting Standard Update No. 2011-11, Disclosures about Offsetting Assets and Liabilities. The update creates new disclosure requirements requiring entities to disclose both gross and net information for derivatives and other financial instruments that are either offset in the Statement of Assets and Liabilities or subject to an enforceable master netting arrangement or similar agreement. The disclosure requirements are effective for annual reporting periods beginning on or after January 1, 2013, and interim periods within those annual periods. Management is currently evaluating the impact of the update's adoption on the Fund's financial statement disclosures.
4. Purchases and Sales of Investments.
Purchases and sales of securities, other than short-term securities, aggregated $57,435,457 and $16,372,315, respectively.
Annual Report
Fidelity Emerging Markets Discovery Fund
Notes to Financial Statements - continued
5. Fees and Other Transactions with Affiliates.
Management Fee. FMR and its affiliates provide the Fund with investment management related services for which the Fund pays a monthly management fee. The management fee is the sum of an individual fund fee rate that is based on an annual rate of .60% of the Fund's average net assets and an annualized group fee rate that averaged .26% during the period. The group fee rate is based upon the average net assets of all the mutual funds advised by FMR. The group fee rate decreases as assets under management increase and increases as assets under management decrease. For the period, the total annual management fee rate was .86% of the Fund's average net assets.
Distribution and Service Plan Fees. In accordance with Rule 12b-1 of the 1940 Act, the Fund has adopted separate Distribution and Service Plans for each class of shares. Certain classes pay Fidelity Distributors Corporation (FDC), an affiliate of FMR, separate Distribution and Service Fees, each of which is based on an annual percentage of each class' average net assets. In addition, FDC may pay financial intermediaries for selling shares of the Fund and providing shareholder support services. For the period, the Distribution and Service Fee rates, total fees and amounts retained by FDC were as follows:
| Distribution
Fee | Service
Fee | Total Fees | Retained
by FDC |
Class A | -% | .25% | $ 2,608 | $ 1,238 |
Class T | .25% | .25% | 4,572 | 2,445 |
Class C | .75% | .25% | 8,384 | 6,451 |
| | | $ 15,564 | $ 10,134 |
Sales Load. FDC may receive a front-end sales charge of up to 5.75% for selling Class A shares and 3.50% for selling Class T shares, some of which is paid to financial intermediaries for selling shares of the Fund. Depending on the holding period, FDC may receive contingent deferred sales charges levied on Class A, Class T and Class C redemptions. The deferred sales charges range from 1.00% for Class C shares, 1.00% for certain purchases of Class A shares and .25% for certain purchases of Class T shares.
For the period, sales charge amounts retained by FDC were as follows:
| Retained
by FDC |
Class A | $ 3,681 |
Class T | 810 |
Class C* | 15 |
| $ 4,506 |
* When Class C shares are initially sold, FDC pays commissions from its own resources to financial intermediaries through which the sales are made.
Annual Report
5. Fees and Other Transactions with Affiliates - continued
Transfer Agent Fees. Fidelity Investments Institutional Operations Company, Inc. (FIIOC), an affiliate of FMR, is the transfer, dividend disbursing and shareholder servicing agent for each class of the Fund. FIIOC receives account fees and asset-based fees that vary according to the account size and type of account of the shareholders of the respective classes of the Fund. FIIOC pays for typesetting, printing and mailing of shareholder reports, except proxy statements. For the period, transfer agent fees for each class were as follows:
| Amount | % of
Average
Net Assets |
Class A | $ 2,662 | .25 |
Class T | 2,086 | .23 |
Class C | 1,784 | .21 |
Emerging Markets Discovery | 39,429 | .23 |
Institutional Class | 2,033 | .22 |
| $ 47,994 | |
Accounting Fees. Fidelity Service Company, Inc. (FSC), an affiliate of FMR, maintains the Fund's accounting records. The accounting fee is based on the level of average net assets for each month.
Brokerage Commissions. The Fund placed a portion of its portfolio transactions with brokerage firms which are affiliates of the investment adviser. The commissions paid to these affiliated firms were $61 for the period.
6. Committed Line of Credit.
The Fund participates with other funds managed by FMR or an affiliate in a $4.25 billion credit facility (the "line of credit") to be utilized for temporary or emergency purposes to fund shareholder redemptions or for other short-term liquidity purposes. The Fund has agreed to pay commitment fees on its pro-rata portion of the line of credit, which amounted to $35 and is reflected in Miscellaneous expenses on the Statement of Operations. During the period, there were no borrowings on this line of credit.
7. Expense Reductions.
Effective November 1, 2011, FMR contractually agreed to reimburse each class to the extent annual operating expenses exceeded certain levels of average net assets as noted in the table below. This reimbursement will remain in place through December 31, 2013.
Annual Report
Fidelity Emerging Markets Discovery Fund
Notes to Financial Statements - continued
7. Expense Reductions - continued
Some expenses, for example interest expense, including commitment fees, are excluded from this reimbursement.
The following classes were in reimbursement during the period:
| Expense
Limitations | Reimbursement
from adviser |
Class A | 1.70% | $ 18,756 |
Class T | 1.95% | 16,693 |
Class C | 2.45% | 15,675 |
Emerging Markets Discovery | 1.45% | 264,852 |
Institutional Class | 1.45% | 16,159 |
| | $ 332,135 |
Many of the brokers with whom FMR places trades on behalf of the Fund provided services to the Fund in addition to trade execution. These services included payments of certain expenses on behalf of the Fund totaling $12,335 for the period. In addition, through arrangements with the Fund's custodian, credits realized as a result of uninvested cash balances were used to reduce the Fund's expenses. During the period, these credits reduced the Fund's custody expenses by $3.
8. Distributions to Shareholders.
Distributions to shareholders of each class were as follows:
| Period ended
October 31, 2012 A |
From net investment income | |
Class A | $ 435 |
Class T | 203 |
Emerging Markets Discovery | 6,522 |
Institutional Class | 600 |
Total | $ 7,760 |
A For the period November 1, 2011 (commencement of operations) to October 31, 2012.
Annual Report
9. Share Transactions.
Transactions for each class of shares were as follows:
| Shares | Dollars |
| Period ended
October 31,
2012 A | Period ended
October 31,
2012 A |
Class A | | |
Shares sold | 197,037 | $ 2,112,904 |
Reinvestment of distributions | 46 | 435 |
Shares redeemed | (56,598) | (637,589) |
Net increase (decrease) | 140,485 | $ 1,475,750 |
Class T | | |
Shares sold | 182,780 | $ 1,990,143 |
Reinvestment of distributions | 22 | 203 |
Shares redeemed | (39,546) | (451,707) |
Net increase (decrease) | 143,256 | $ 1,538,639 |
Class C | | |
Shares sold | 161,266 | $ 1,743,293 |
Shares redeemed | (36,511) | (415,821) |
Net increase (decrease) | 124,755 | $ 1,327,472 |
Emerging Markets Discovery | | |
Shares sold | 4,074,333 | $ 44,757,138 |
Reinvestment of distributions | 681 | 6,419 |
Shares redeemed | (791,760) | (8,744,517) |
Net increase (decrease) | 3,283,254 | $ 36,019,040 |
Institutional Class | | |
Shares sold | 199,001 | $ 2,149,513 |
Reinvestment of distributions | 64 | 600 |
Shares redeemed | (45,956) | (524,544) |
Net increase (decrease) | 153,109 | $ 1,625,569 |
A For the period November 1, 2011 (commencement of operations) to October 31, 2012.
10. Other.
The Fund's organizational documents provide former and current trustees and officers with a limited indemnification against liabilities arising in connection with the performance of their duties to the Fund. In the normal course of business, the Fund may also enter into contracts that provide general indemnifications. The Fund's maximum exposure under these arrangements is unknown as this would be dependent on future claims that may be made against the Fund. The risk of material loss from such claims is considered remote.
At the end of the period, FMR or its affiliates were the owners of record of 10% of the total outstanding shares of the Fund.
Annual Report
Fidelity Total Emerging Markets Fund
Average annual total return reflects the change in the value of an investment, assuming reinvestment of the fund's distributions from dividend income and capital gains (the profits earned upon the sale of securities that have grown in value, if any) and assuming a constant rate of performance each year. The $10,000 table and the fund's returns do not reflect the deduction of taxes that a shareholder would pay on fund distributions or the redemption of fund shares. During periods of reimbursement by Fidelity, a fund's total return will be greater than it would be had the reimbursement not occurred. How a fund did yesterday is no guarantee of how it will do tomorrow.
Average annual total returns take Fidelity® Total Emerging Markets Fund cumulative total return and show you what would have happened if Fidelity® Total Emerging Markets Fund had performed at a constant rate each year. These numbers will be reported once the fund is a year old.
$10,000 Over Life of Fund
Let's say hypothetically that $10,000 was invested in Fidelity Total Emerging Markets Fund, a class of the fund, on November 1, 2011, when the fund started. The chart shows how the value of your investment would have changed, and also shows how the MSCI® Emerging Markets Index performed over the same period.
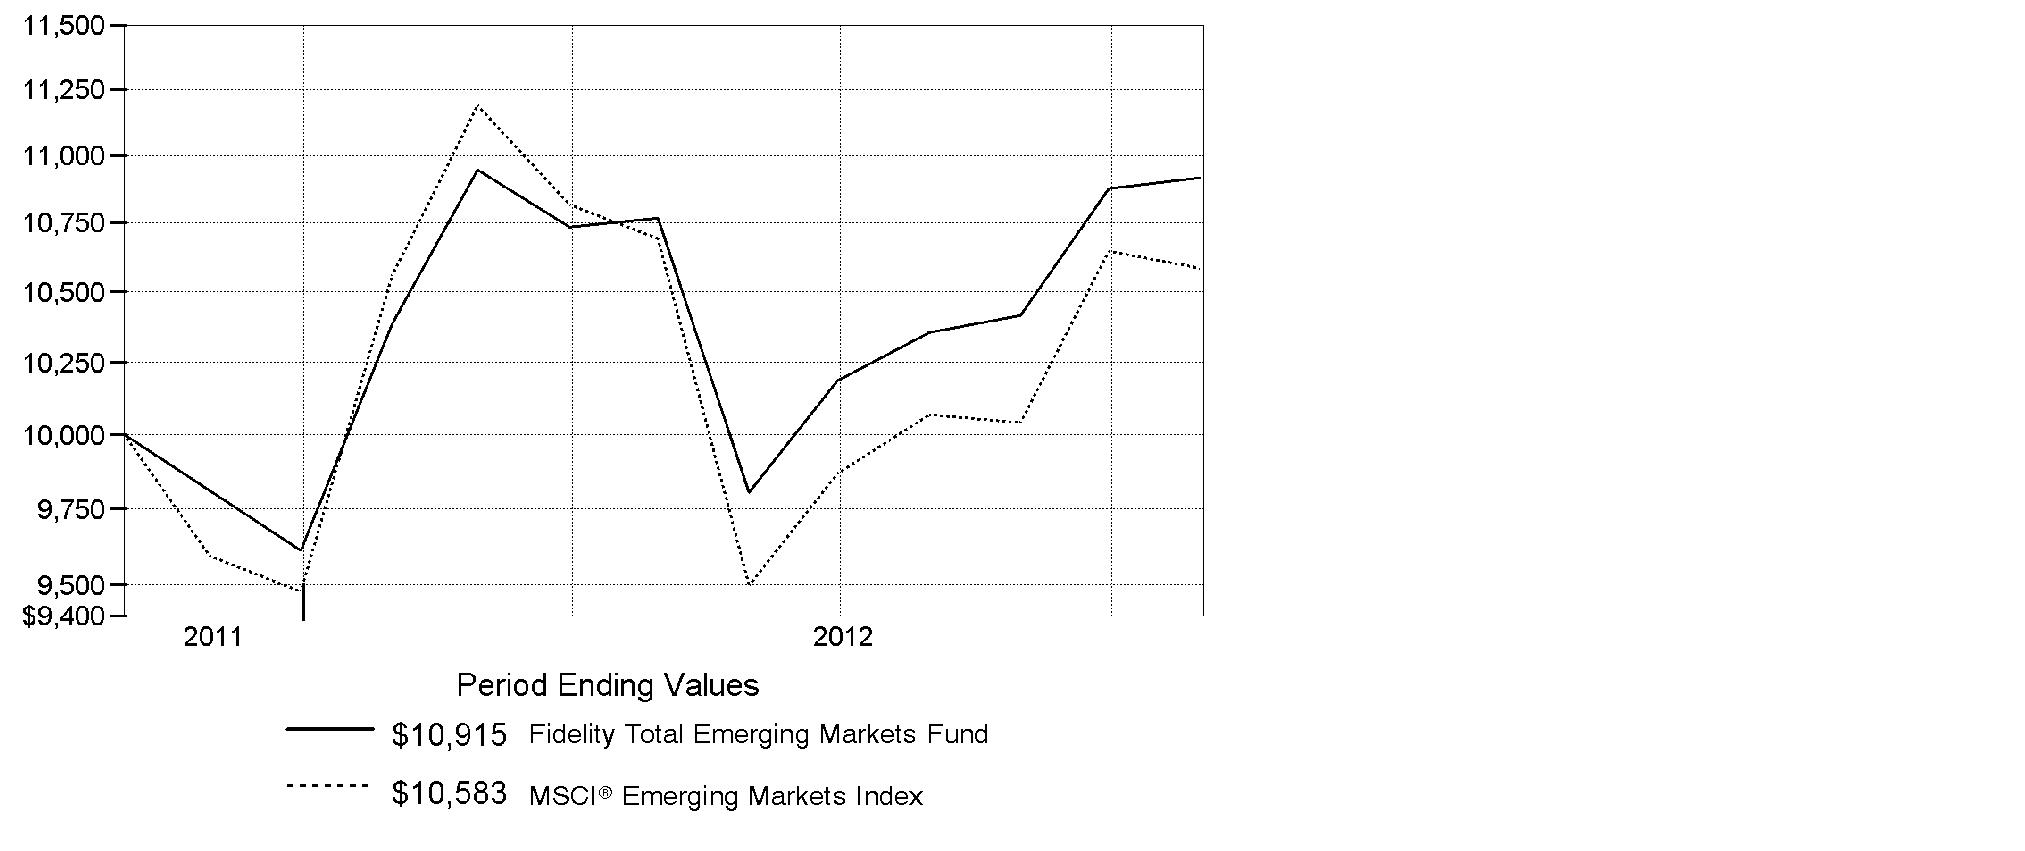
Annual Report
Fidelity Total Emerging Markets Fund
Market Recap: Global equities experienced turbulent swings during the 12 months ending October 31, 2012, but still managed a solid gain. Volatility peppered the past year, as a number of macroeconomic concerns weighed on investors, with the eurozone debt crisis, the strength and pace of the U.S. economic recovery, and a slowdown in China's growth all making headlines. But, stocks in the U.S. and overseas were generally resilient, gaining 8.96% for the 12 months, as measured by the MSCI® ACWI® (All Country World Index) Index, largely buttressed by accommodative monetary policy in the United States and Europe, as well as signs that the U.S. housing market was starting to recover. Within the index, U.S. stocks fared best, advancing 15%. Asia-Pacific ex Japan also performed well, gaining roughly 10% on strong returns in Hong Kong and Singapore. Several European markets, most notably Germany (+11%), Switzerland (+10%) and the U.K. (+9%), benefited from optimism about the eurozone's ability to resolve its debt woes. However, continued weakness in peripheral European markets caused the region to lag the index overall. Japan, emerging markets and Canada each underperformed, with Japan suffering the most, falling by about 3%. A stronger U.S. dollar dampened results for foreign stocks overall. Global bond markets delivered positive, albeit more-muted returns, with the Barclays® Global Aggregate GDP Weighted Index gaining 4.54%.
Comments from John Carlson, Lead Portfolio Manager of Fidelity® Total Emerging Markets Fund: From its inception on November 1, 2011, through October 31, 2012, the fund's Retail Class shares gained 9.15%. By comparison, the fund's primary benchmark, the MSCI® Emerging Markets Index, returned 5.83%, while the Fidelity Total Emerging Markets Composite IndexSM advanced 10.34%. Performance versus the Composite index was held back by our decision to overweight equities and underweight debt, the latter of which had much stronger performance during the period. Both subportfolios outperformed their respective benchmark, driven by security selection, which largely offset the negative impact of our overall allocation. At launch, the fund split its assets between equities and debt at roughly 67% and 33%, respectively. During the period, we decided to further increase our overweighting in equities, while reducing exposure to EM debt. We made this decision based, in part, on the massive sell-off in global equities as a result of the sovereign debt crisis in Greece and the debt overhang impacting other developed countries.
Note to shareholders: Gregory Lee was named Co-Portfolio Manager on May 2, 2012, and is responsible for the fund's industrials sector assets.
The views expressed above reflect those of the portfolio manager(s) only through the end of the period as stated on the cover of this report and do not necessarily represent the views of Fidelity or any other person in the Fidelity organization. Any such views are subject to change at any time based upon market or other conditions and Fidelity disclaims any responsibility to update such views. These views may not be relied on as investment advice and, because investment decisions for a Fidelity fund are based on numerous factors, may not be relied on as an indication of trading intent on behalf of any Fidelity fund.
Annual Report
Fidelity Total Emerging Markets Fund
Shareholder Expense Example
As a shareholder of the Fund, you incur two types of costs: (1) transaction costs, including sales charges (loads) on purchase payments or redemption proceeds, redemption fees and (2) ongoing costs, including management fees, distribution and/or service (12b-1) fees and other Fund expenses. This Example is intended to help you understand your ongoing costs (in dollars) of investing in the Fund and to compare these costs with the ongoing costs of investing in other mutual funds.
The Example is based on an investment of $1,000 invested at the beginning of the period and held for the entire period (May 1, 2012 to October 31, 2012).
Actual Expenses
The first line of the accompanying table for each class of the Fund provides information about actual account values and actual expenses. You may use the information in this line, together with the amount you invested, to estimate the expenses that you paid over the period. Simply divide your account value by $1,000.00 (for example, an $8,600 account value divided by $1,000.00 = 8.6), then multiply the result by the number in the first line for a class of the Fund under the heading entitled "Expenses Paid During Period" to estimate the expenses you paid on your account during this period. A small balance maintenance fee of $12.00 that is charged once a year may apply for certain accounts with a value of less than $2,000. This fee is not included in the table below. If it was, the estimate of expenses you paid during the period would be higher, and your ending account value lower, by this amount. In addition, the Fund, as a shareholder in the underlying Fidelity Central Funds, will indirectly bear its pro-rata share of the fees and expenses incurred by the underlying Fidelity Central Funds. These fees and expenses are not included in the Fund's annualized expense ratio used to calculate the expense estimate in the table below.
Hypothetical Example for Comparison Purposes
The second line of the accompanying table for each class of the Fund provides information about hypothetical account values and hypothetical expenses based on a Class' actual expense ratio and an assumed rate of return of 5% per year before expenses, which is not the Class' actual return. The hypothetical account values and expenses may not be used to estimate the actual ending account balance or expenses you paid for the period. You may use this information to compare the ongoing costs of investing in the Fund and other funds. To do so, compare this 5% hypothetical example with the 5% hypothetical examples that appear in the shareholder reports of the other funds. A small balance maintenance fee of $12.00 that is charged once a year may apply for certain accounts with a value of less than $2,000. This fee is not included in the table below. If it was, the estimate of expenses you paid during the period would be higher, and your ending account value lower, by this amount. In addition, the Fund, as a shareholder in the underlying Fidelity Central Funds, will indirectly bear its pro-rata share of the fees and expenses incurred by the underlying Fidelity Central Funds. These fees and expenses are not included in the Fund's annualized expense ratio used to calculate the expense estimate in the table below.
Please note that the expenses shown in the table are meant to highlight your ongoing costs only and do not reflect any transaction costs. Therefore, the second line of the table is useful in comparing ongoing costs only, and will not help you determine the relative total costs of owning different funds. In addition, if these transactional costs were included, your costs would have been higher.
Annual Report
Fidelity Total Emerging Markets Fund
Shareholder Expense Example - continued
| Annualized
Expense Ratio | Beginning
Account Value
May 1, 2012 | Ending
Account Value
October 31, 2012 | Expenses Paid
During Period*
May 1, 2012
to October 31, 2012 |
Class A | 1.65% | | | |
Actual | | $ 1,000.00 | $ 1,012.10 | $ 8.35 |
HypotheticalA | | $ 1,000.00 | $ 1,016.84 | $ 8.36 |
Class T | 1.90% | | | |
Actual | | $ 1,000.00 | $ 1,011.20 | $ 9.61 |
HypotheticalA | | $ 1,000.00 | $ 1,015.58 | $ 9.63 |
Class C | 2.40% | | | |
Actual | | $ 1,000.00 | $ 1,008.40 | $ 12.12 |
HypotheticalA | | $ 1,000.00 | $ 1,013.07 | $ 12.14 |
Total Emerging Markets | 1.40% | | | |
Actual | | $ 1,000.00 | $ 1,014.00 | $ 7.09 |
HypotheticalA | | $ 1,000.00 | $ 1,018.10 | $ 7.10 |
Institutional Class | 1.40% | | | |
Actual | | $ 1,000.00 | $ 1,014.00 | $ 7.09 |
HypotheticalA | | $ 1,000.00 | $ 1,018.10 | $ 7.10 |
A 5% return per year before expenses
* Expenses are equal to each Class' annualized expense ratio, multiplied by the average account value over the period, multiplied by 184/366 (to reflect the one-half year period).
Annual Report
Fidelity Total Emerging Markets Fund
Investment Changes (Unaudited)
Top Five Stocks as of October 31, 2012 |
| % of fund's
net assets | % of fund's net assets
6 months ago |
Samsung Electronics Co. Ltd. (Korea (South), Semiconductors & Semiconductor Equipment) | 3.4 | 3.2 |
Taiwan Semiconductor Manufacturing Co. Ltd. (Taiwan, Semiconductors & Semiconductor Equipment) | 1.9 | 1.9 |
Vale SA (PN-A) sponsored ADR (Brazil, Metals & Mining) | 1.6 | 1.4 |
China Construction Bank Corp. (H Shares) (China, Commercial Banks) | 1.3 | 1.3 |
Industrial & Commercial Bank of China Ltd. (H Shares) (China, Commercial Banks) | 1.3 | 1.5 |
| 9.5 | |
Top Five Market Sectors as of October 31, 2012 |
| % of fund's
net assets | % of fund's net assets
6 months ago |
Financials | 19.5 | 15.8 |
Energy | 13.9 | 15.8 |
Information Technology | 9.7 | 10.0 |
Materials | 9.1 | 8.4 |
Consumer Staples | 6.7 | 5.8 |
Top Five Countries as of October 31, 2012 |
(excluding cash equivalents) | % of fund's
net assets | % of fund's net assets
6 months ago |
Brazil | 11.2 | 11.0 |
Korea (South) | 10.7 | 9.9 |
Russia | 8.4 | 6.8 |
China | 6.6 | 5.9 |
Taiwan | 5.5 | 6.0 |
Percentages are adjusted for the effect of open futures contracts, if applicable. |
Asset Allocation (% of fund's net assets) |
As of October 31, 2012 | As of April 30, 2012 |
| Stocks 72.4% | | | Stocks and 70.3%
Investment
Companies | |
 | Bonds 24.5% | | | Bonds 26.5% | |
| Short-Term
Investments and
Net Other Assets
(Liabilities) 3.1% | | | Short-Term
Investments and
Net Other Assets
(Liabilities) 3.2% | |

Annual Report
Fidelity Total Emerging Markets Fund
Investments October 31, 2012
Showing Percentage of Net Assets
Common Stocks - 70.5% |
| Shares | | Value |
Australia - 0.2% |
Paladin Energy Ltd. (Australia) (a) | 154,295 | | $ 181,788 |
Austria - 0.3% |
Erste Bank AG (a) | 12,390 | | 311,149 |
Bailiwick of Jersey - 0.2% |
Atrium European Real Estate Ltd. | 40,749 | | 230,334 |
Bermuda - 1.5% |
Aquarius Platinum Ltd. (Australia) | 125,044 | | 74,636 |
BW Offshore Ltd. | 420,089 | | 246,838 |
GP Investments Ltd. (depositary receipt) (a) | 121,322 | | 280,151 |
Kunlun Energy Co. Ltd. | 268,000 | | 497,958 |
Pacific Basin Shipping Ltd. | 290,000 | | 155,289 |
Seadrill Ltd. | 6,414 | | 259,652 |
TOTAL BERMUDA | | 1,514,524 |
Brazil - 9.9% |
Anhanguera Educacional Participacoes SA | 32,800 | | 574,914 |
Arezzo Industria e Comercio SA | 10,100 | | 180,264 |
Banco do Brasil SA | 28,200 | | 300,876 |
Banco do Estado Rio Grande do Sul SA | 33,650 | | 265,913 |
BM&F Bovespa SA | 84,100 | | 538,293 |
BR Properties SA | 46,500 | | 608,995 |
Braskem SA (PN-A) | 36,400 | | 240,510 |
CCR SA | 34,200 | | 300,737 |
Cia.Hering SA | 14,000 | | 321,627 |
Companhia de Bebidas das Americas (AmBev) (PN) sponsored ADR | 9,000 | | 367,110 |
Companhia de Saneamento de Minas Gerais | 7,260 | | 171,362 |
Companhia Paranaense de Energia-Copel: | | | |
(PN-B) | 1,195 | | 17,651 |
(PN-B) sponsored ADR | 14,970 | | 220,957 |
Estacio Participacoes SA | 13,600 | | 259,137 |
Fibria Celulose SA (a) | 20,500 | | 174,009 |
Gerdau SA sponsored ADR | 36,200 | | 318,198 |
Itau Unibanco Holdings SA sponsored ADR | 56,380 | | 822,020 |
Lojas Americanas SA (PN) | 55,833 | | 467,325 |
Mills Estruturas e Servicos de Engenharia SA | 18,300 | | 280,575 |
Multiplus SA | 5,700 | | 132,435 |
Petroleo Brasileiro SA - Petrobras: | | | |
(PN) sponsored ADR (non-vtg.) | 16,106 | | 330,656 |
sponsored ADR | 48,600 | | 1,030,806 |
Sul America SA unit | 8,900 | | 70,112 |
TIM Participacoes SA sponsored ADR | 3,353 | | 58,275 |
Common Stocks - continued |
| Shares | | Value |
Brazil - continued |
Ultrapar Participacoes SA | 24,500 | | $ 513,872 |
Vale SA (PN-A) sponsored ADR | 90,600 | | 1,611,774 |
TOTAL BRAZIL | | 10,178,403 |
Canada - 1.6% |
Banro Corp. (a) | 20,700 | | 95,754 |
Barrick Gold Corp. | 5,900 | | 238,599 |
First Quantum Minerals Ltd. | 13,400 | | 301,207 |
Goldcorp, Inc. | 7,300 | | 330,007 |
Pan American Silver Corp. | 4,000 | | 88,000 |
Torex Gold Resources, Inc. (a) | 49,700 | | 103,505 |
Uranium One, Inc. (a) | 66,900 | | 145,355 |
Yamana Gold, Inc. | 18,500 | | 373,612 |
TOTAL CANADA | | 1,676,039 |
Cayman Islands - 4.5% |
21Vianet Group, Inc. ADR (a) | 14,420 | | 159,774 |
Ajisen (China) Holdings Ltd. | 183,000 | | 126,564 |
Anta Sports Products Ltd. | 206,000 | | 175,431 |
Baidu.com, Inc. sponsored ADR (a) | 3,734 | | 398,119 |
Belle International Holdings Ltd. | 155,000 | | 288,798 |
China Liansu Group Holdings Ltd. | 280,000 | | 165,109 |
Eurasia Drilling Co. Ltd. GDR (Reg. S) | 13,217 | | 457,308 |
Geely Automobile Holdings Ltd. | 425,000 | | 182,612 |
Gourmet Master Co. Ltd. | 24,000 | | 170,079 |
Greatview Aseptic Pack Co. Ltd. | 579,000 | | 303,319 |
Haitian International Holdings Ltd. | 131,000 | | 161,763 |
Hengan International Group Co. Ltd. | 70,000 | | 637,673 |
SINA Corp. (a) | 1,300 | | 71,019 |
Spreadtrum Communications, Inc. ADR | 3,415 | | 78,716 |
Tencent Holdings Ltd. | 6,900 | | 243,947 |
Uni-President China Holdings Ltd. | 377,000 | | 474,287 |
Veripos (a) | 34,725 | | 100,497 |
Xueda Education Group sponsored ADR (a) | 33,300 | | 95,904 |
Yingde Gases Group Co. Ltd. | 327,500 | | 310,595 |
TOTAL CAYMAN ISLANDS | | 4,601,514 |
Chile - 0.9% |
Aguas Andinas SA | 281,427 | | 188,866 |
Embotelladora Andina SA Class A | 35,611 | | 179,110 |
Empresa Nacional de Telecomunicaciones SA (ENTEL) | 11,435 | | 232,907 |
Common Stocks - continued |
| Shares | | Value |
Chile - continued |
Enersis SA | 210,651 | | $ 72,107 |
Inversiones La Construccion SA | 13,305 | | 235,046 |
TOTAL CHILE | | 908,036 |
China - 6.6% |
BBMG Corp. (H Shares) | 196,500 | | 168,862 |
China Communications Construction Co. Ltd. (H Shares) | 329,000 | | 308,621 |
China Construction Bank Corp. (H Shares) | 1,811,000 | | 1,364,667 |
China Pacific Insurance Group Co. Ltd. (H Shares) | 205,300 | | 643,711 |
China Shenhua Energy Co. Ltd. (H Shares) | 234,500 | | 998,510 |
China Suntien Green Energy Corp. Ltd. (H Shares) | 1,494,600 | | 304,704 |
China Telecom Corp. Ltd. (H Shares) | 388,357 | | 229,771 |
Dongfeng Motor Group Co. Ltd. (H Shares) | 276,000 | | 341,882 |
Industrial & Commercial Bank of China Ltd. (H Shares) | 2,037,000 | | 1,348,354 |
Maanshan Iron & Steel Ltd. (H Shares) (a) | 810,000 | | 209,031 |
PICC Property & Casualty Co. Ltd. (H Shares) | 188,000 | | 250,342 |
Shanghai Electric Group Co. Ltd. (H Shares) | 846,000 | | 343,856 |
Weichai Power Co. Ltd. (H Shares) | 93,400 | | 330,815 |
TOTAL CHINA | | 6,843,126 |
Colombia - 0.7% |
Ecopetrol SA ADR | 11,842 | | 701,165 |
Cyprus - 0.2% |
Globaltrans Investment PLC: | | | |
GDR (e) | 6,900 | | 127,650 |
GDR (Reg. S) | 1,500 | | 27,750 |
TOTAL CYPRUS | | 155,400 |
Czech Republic - 0.2% |
Ceske Energeticke Zavody A/S | 6,068 | | 223,721 |
Egypt - 0.1% |
Orascom Telecom Holding SAE unit (a) | 46,100 | | 138,531 |
Hong Kong - 0.8% |
China Resources Power Holdings Co. Ltd. | 84,000 | | 179,921 |
Lenovo Group Ltd. | 532,000 | | 427,657 |
Sinotruk Hong Kong Ltd. | 345,500 | | 198,383 |
TOTAL HONG KONG | | 805,961 |
India - 3.2% |
Axis Bank Ltd. | 15,390 | | 338,263 |
Bharti Airtel Ltd. | 51,651 | | 258,855 |
Grasim Industries Ltd. | 2,348 | | 152,745 |
Common Stocks - continued |
| Shares | | Value |
India - continued |
Housing Development and Infrastructure Ltd. (a) | 37,732 | | $ 67,287 |
Indiabulls Real Estate Ltd. | 125,168 | | 133,299 |
ITC Ltd. | 138,460 | | 727,105 |
JK Cement Ltd. (a) | 14,380 | | 67,363 |
Larsen & Toubro Ltd. | 11,459 | | 346,475 |
Lupin Ltd. (a) | 16,696 | | 175,773 |
Maruti Suzuki India Ltd. | 12,229 | | 326,811 |
Phoenix Mills Ltd. (a) | 5,122 | | 19,106 |
Power Grid Corp. of India Ltd. | 70,024 | | 148,364 |
SREI Infrastructure Finance Ltd. | 485,175 | | 242,114 |
State Bank of India | 7,746 | | 303,801 |
TOTAL INDIA | | 3,307,361 |
Indonesia - 1.7% |
PT Bakrieland Development Tbk (a) | 15,113,500 | | 102,277 |
PT Bank Tabungan Negara Tbk | 1,521,500 | | 240,778 |
PT Indo Tambangraya Megah Tbk | 53,500 | | 226,420 |
PT Jasa Marga Tbk | 449,500 | | 271,430 |
PT Telkomunikasi Indonesia Tbk: | | | |
Series B | 58,500 | | 59,416 |
sponsored ADR | 21,864 | | 888,772 |
TOTAL INDONESIA | | 1,789,093 |
Israel - 0.4% |
Bezeq Israeli Telecommunication Corp. Ltd. | 140,100 | | 170,848 |
Check Point Software Technologies Ltd. (a) | 1,900 | | 84,607 |
NICE Systems Ltd. sponsored ADR (a) | 5,700 | | 189,810 |
TOTAL ISRAEL | | 445,265 |
Kazakhstan - 0.2% |
JSC Halyk Bank of Kazakhstan GDR unit (a) | 30,100 | | 214,011 |
Kenya - 0.5% |
Equity Bank Ltd. | 1,027,600 | | 292,652 |
Safaricom Ltd. | 3,989,903 | | 206,172 |
TOTAL KENYA | | 498,824 |
Korea (South) - 9.7% |
AMOREPACIFIC Group, Inc. | 973 | | 419,427 |
E-Mart Co. Ltd. | 2,387 | | 517,761 |
GS Engineering & Construction Corp. | 4,567 | | 257,185 |
Hana Financial Group, Inc. | 19,890 | | 579,195 |
Hyundai Heavy Industries Co. Ltd. | 1,411 | | 296,352 |
Common Stocks - continued |
| Shares | | Value |
Korea (South) - continued |
Hyundai Industrial Development & Construction Co. | 5,380 | | $ 96,713 |
KB Financial Group, Inc. | 22,190 | | 754,780 |
Kia Motors Corp. | 1,710 | | 95,042 |
Korea Electric Power Corp. (a) | 10,540 | | 273,457 |
Korean Reinsurance Co. | 16,820 | | 165,065 |
KT&G Corp. | 6,796 | | 517,965 |
LG Chemical Ltd. | 1,768 | | 496,192 |
LS Industrial Systems Ltd. | 5,350 | | 334,645 |
Orion Corp. | 334 | | 313,684 |
POSCO sponsored ADR | 4,400 | | 344,872 |
Samsung Electronics Co. Ltd. | 2,887 | | 3,468,666 |
Samsung Fire & Marine Insurance Co. Ltd. | 2,412 | | 527,608 |
Shinhan Financial Group Co. Ltd. | 11,860 | | 407,364 |
Shinhan Financial Group Co. Ltd. sponsored ADR | 4,828 | | 165,214 |
TOTAL KOREA (SOUTH) | | 10,031,187 |
Luxembourg - 0.3% |
Subsea 7 SA | 15,100 | | 331,330 |
Malaysia - 0.5% |
Axiata Group Bhd | 136,700 | | 293,057 |
Petronas Dagangan Bhd | 32,500 | | 235,588 |
TOTAL MALAYSIA | | 528,645 |
Mexico - 3.4% |
America Movil SAB de CV Series L sponsored ADR | 44,120 | | 1,115,795 |
CEMEX SA de CV sponsored ADR | 41,288 | | 373,244 |
Desarrolladora Homex SAB de CV sponsored ADR (a) | 7,350 | | 97,388 |
El Puerto de Liverpool SA Class C | 20,900 | | 187,308 |
Fibra Uno Administracion SA de CV | 95,000 | | 250,306 |
Fomento Economico Mexicano SAB de CV sponsored ADR | 5,200 | | 471,172 |
Grupo Comercial Chedraui de CV | 73,700 | | 198,518 |
Grupo Televisa SA de CV (CPO) sponsored ADR | 34,300 | | 775,180 |
TOTAL MEXICO | | 3,468,911 |
Netherlands - 0.1% |
ASML Holding NV (Netherlands) | 2,775 | | 152,548 |
Nigeria - 1.2% |
Guaranty Trust Bank PLC | 627,668 | | 79,128 |
Guaranty Trust Bank PLC GDR (Reg. S) | 69,900 | | 433,380 |
Zenith Bank PLC | 5,943,111 | | 681,872 |
TOTAL NIGERIA | | 1,194,380 |
Common Stocks - continued |
| Shares | | Value |
Norway - 0.9% |
ElectroMagnetic GeoServices ASA (a) | 102,680 | | $ 223,323 |
Petroleum Geo-Services ASA | 8,800 | | 151,727 |
TGS Nopec Geophysical Co. ASA | 16,928 | | 576,015 |
TOTAL NORWAY | | 951,065 |
Panama - 0.4% |
Copa Holdings SA Class A | 4,200 | | 389,844 |
Peru - 0.2% |
Compania de Minas Buenaventura SA sponsored ADR | 6,000 | | 214,560 |
Philippines - 1.1% |
Metro Pacific Investments Corp. | 2,899,000 | | 292,016 |
Metropolitan Bank & Trust Co. | 138,200 | | 319,440 |
Robinsons Land Corp. | 1,121,000 | | 518,224 |
TOTAL PHILIPPINES | | 1,129,680 |
Poland - 0.8% |
Eurocash SA | 14,100 | | 172,195 |
Powszechny Zaklad Ubezpieczen SA | 5,375 | | 627,966 |
TOTAL POLAND | | 800,161 |
Russia - 5.8% |
Bank St. Petersburg OJSC | 41,600 | | 76,567 |
DIXY Group OJSC (a) | 17,805 | | 188,095 |
Gazprom OAO sponsored ADR | 70,532 | | 644,662 |
LSR Group OJSC GDR (Reg. S) | 24,100 | | 116,042 |
Lukoil Oil Co. (a) | 3,200 | | 194,292 |
Magnit OJSC | 1,822 | | 259,555 |
Magnit OJSC GDR (Reg. S) | 4,900 | | 173,950 |
Magnitogorsk Iron & Steel Works OJSC unit (a) | 30,900 | | 133,241 |
Mobile TeleSystems OJSC (a) | 80,060 | | 589,037 |
Mobile TeleSystems OJSC sponsored ADR | 28,390 | | 486,605 |
NOVATEK OAO GDR (Reg. S) | 5,200 | | 592,800 |
OGK-4 OJSC (a) | 6,094,400 | | 500,679 |
Raspadskaya OAO (a) | 38,412 | | 75,745 |
Rosneft Oil Co. OJSC | 14,500 | | 107,608 |
RusHydro JSC sponsored ADR | 67,240 | | 159,628 |
Sberbank (Savings Bank of the Russian Federation) | 379,050 | | 1,109,639 |
Sistema JSFC (a) | 156,700 | | 117,879 |
TNK-BP Holding | 49,360 | | 100,764 |
Uralkali OJSC GDR (Reg. S) | 9,100 | | 356,538 |
TOTAL RUSSIA | | 5,983,326 |
Common Stocks - continued |
| Shares | | Value |
Singapore - 0.9% |
First Resources Ltd. | 277,000 | | $ 465,527 |
Global Logistic Properties Ltd. | 201,000 | | 423,487 |
TOTAL SINGAPORE | | 889,014 |
South Africa - 2.9% |
AngloGold Ashanti Ltd. | 9,100 | | 307,447 |
Aspen Pharmacare Holdings Ltd. | 17,500 | | 318,892 |
Blue Label Telecoms Ltd. | 171,800 | | 133,546 |
Impala Platinum Holdings Ltd. | 29,100 | | 523,559 |
JSE Ltd. | 54,670 | | 443,443 |
Life Healthcare Group Holdings Ltd. | 72,400 | | 273,797 |
Naspers Ltd. Class N | 11,500 | | 746,595 |
Reunert Ltd. | 18,500 | | 162,967 |
Wilson Bayly Holmes-Ovcon Ltd. | 3,600 | | 58,999 |
TOTAL SOUTH AFRICA | | 2,969,245 |
Taiwan - 5.5% |
Asia Cement Corp. | 186,430 | | 232,319 |
Cheng Uei Precision Industries Co. Ltd. | 135,339 | | 299,775 |
Chinatrust Financial Holding Co. Ltd. | 640,042 | | 352,779 |
Chroma ATE, Inc. | 74,000 | | 140,856 |
Hon Hai Precision Industry Co. Ltd. (Foxconn) | 209,500 | | 636,174 |
MediaTek, Inc. | 37,000 | | 411,041 |
Synnex Technology International Corp. | 155,000 | | 327,936 |
Taiwan Fertilizer Co. Ltd. | 99,000 | | 235,892 |
Taiwan Mobile Co. Ltd. | 95,000 | | 331,736 |
Taiwan Semiconductor Manufacturing Co. Ltd. | 408,000 | | 1,243,307 |
Taiwan Semiconductor Manufacturing Co. Ltd. sponsored ADR | 45,700 | | 726,630 |
Unified-President Enterprises Corp. | 279,660 | | 494,025 |
Yuanta Financial Holding Co. Ltd. | 576,000 | | 260,294 |
TOTAL TAIWAN | | 5,692,764 |
Thailand - 0.8% |
Bangkok Bank Public Co. Ltd. (For. Reg.) | 92,900 | | 548,252 |
PTT Global Chemical PCL (For. Reg.) | 124,400 | | 247,421 |
TOTAL THAILAND | | 795,673 |
Turkey - 0.8% |
Aygaz A/S | 52,000 | | 239,621 |
TAV Havalimanlari Holding A/S | 62,000 | | 307,838 |
Turkiye Is Bankasi A/S Series C | 84,900 | | 288,921 |
TOTAL TURKEY | | 836,380 |
Common Stocks - continued |
| Shares | | Value |
United Kingdom - 0.6% |
Evraz PLC | 32,100 | | $ 122,355 |
Hikma Pharmaceuticals PLC | 15,011 | | 179,137 |
Kazakhmys PLC | 26,800 | | 306,632 |
TOTAL UNITED KINGDOM | | 608,124 |
United States of America - 0.9% |
Cognizant Technology Solutions Corp. Class A (a) | 6,300 | | 419,895 |
CTC Media, Inc. | 20,050 | | 168,220 |
Universal Display Corp. (a) | 9,027 | | 295,905 |
TOTAL UNITED STATES OF AMERICA | | 884,020 |
TOTAL COMMON STOCKS (Cost $67,155,590) |
72,575,102
|
Nonconvertible Preferred Stocks - 1.9% |
| | | |
Korea (South) - 1.0% |
Hyundai Motor Co. Series 2 | 9,913 | | 650,066 |
Samsung Electronics Co. Ltd. | 467 | | 339,225 |
TOTAL KOREA (SOUTH) | | 989,291 |
Russia - 0.9% |
Sberbank (Savings Bank of the Russian Federation) (a) | 209,600 | | 441,379 |
Surgutneftegaz JSC | 833,750 | | 516,404 |
TOTAL RUSSIA | | 957,783 |
TOTAL NONCONVERTIBLE PREFERRED STOCKS (Cost $1,906,405) |
1,947,074
|
Nonconvertible Bonds - 7.3% |
| Principal
Amount | | |
Bermuda - 0.2% |
Qtel International Finance Ltd. 5% 10/19/25 (e) | | $ 200,000 | | 226,260 |
Canada - 0.2% |
Pacific Rubiales Energy Corp. 7.25% 12/12/21 (e) | | 200,000 | | 238,500 |
Cayman Islands - 0.1% |
Odebrecht Finance Ltd. 7.5% (e)(f) | | 100,000 | | 107,000 |
Chile - 0.1% |
Corporacion Nacional del Cobre de Chile (Codelco) 6.15% 10/24/36 (e) | | 100,000 | | 130,477 |
Nonconvertible Bonds - continued |
| Principal
Amount | | Value |
Costa Rica - 0.2% |
Instituto Costarricense de Electricidad 6.95% 11/10/21 (e) | | $ 200,000 | | $ 222,500 |
Croatia - 0.2% |
Agrokor d.d. 8.875% 2/1/20 (e) | | 200,000 | | 208,000 |
Georgia - 0.2% |
JSC Georgian Railway 7.75% 7/11/22 (e) | | 200,000 | | 224,000 |
Guatemala - 0.1% |
Industrial Senior Trust 5.5% 11/1/22 (e) | | 100,000 | | 101,000 |
Indonesia - 0.8% |
PT Pertamina Persero: | | | | |
5.25% 5/23/21 (e) | | 550,000 | | 611,875 |
6.5% 5/27/41 (e) | | 200,000 | | 237,000 |
TOTAL INDONESIA | | 848,875 |
Ireland - 0.2% |
Vnesheconombank Via VEB Finance PLC 5.375% 2/13/17 (e) | | 200,000 | | 219,250 |
Israel - 0.2% |
Israel Electric Corp. Ltd. 6.7% 2/10/17 (e) | | 200,000 | | 218,500 |
Kazakhstan - 0.2% |
Zhaikmunai Finance BV 10.5% 10/19/15 (e) | | 150,000 | | 164,625 |
Mexico - 0.4% |
Petroleos Mexicanos: | | | | |
5.5% 1/21/21 | | 250,000 | | 294,000 |
6.625% (e)(f) | | 100,000 | | 107,250 |
TOTAL MEXICO | | 401,250 |
Netherlands - 0.8% |
Access Finance BV 7.25% 7/25/17 (e) | | 200,000 | | 209,500 |
KazMunaiGaz Finance Sub BV: | | | | |
6.375% 4/9/21 (e) | | 100,000 | | 118,750 |
9.125% 7/2/18 (e) | | 150,000 | | 195,000 |
11.75% 1/23/15 (e) | | 100,000 | | 119,880 |
Majapahit Holding BV 8% 8/7/19 (e) | | 100,000 | | 127,000 |
TOTAL NETHERLANDS | | 770,130 |
Philippines - 0.2% |
Power Sector Assets and Liabilities Management Corp. 7.39% 12/2/24 (e) | | 125,000 | | 174,850 |
Nonconvertible Bonds - continued |
| Principal
Amount | | Value |
Sweden - 0.2% |
PKO Finance AB 4.63% 9/26/22 (e) | | $ 200,000 | | $ 206,500 |
Trinidad & Tobago - 0.1% |
Petroleum Co. of Trinidad & Tobago Ltd. 9.75% 8/14/19 (e) | | 100,000 | | 132,000 |
Turkey - 0.1% |
Akbank T.A.S. 3.875% 10/24/17 (e) | | 150,000 | | 148,500 |
United States of America - 0.5% |
Pemex Project Funding Master Trust: | | | | |
6.625% 6/15/35 | | 200,000 | | 251,000 |
8.625% 2/1/22 | | 175,000 | | 221,375 |
TOTAL UNITED STATES OF AMERICA | | 472,375 |
Venezuela - 2.3% |
Petroleos de Venezuela SA: | | | | |
4.9% 10/28/14 | | 1,100,000 | | 1,014,750 |
5.375% 4/12/27 | | 400,000 | | 251,000 |
5.5% 4/12/37 | | 600,000 | | 363,000 |
8.5% 11/2/17 (e) | | 450,000 | | 402,750 |
12.75% 2/17/22 (e) | | 300,000 | | 306,750 |
TOTAL VENEZUELA | | 2,338,250 |
TOTAL NONCONVERTIBLE BONDS (Cost $6,911,731) |
7,552,842
|
Government Obligations - 17.2% |
|
Aruba - 0.2% |
Aruba Government 4.625% 9/14/23 (e) | | 200,000 | | 199,500 |
Barbados - 0.1% |
Barbados Government 7% 8/4/22 (e) | | 100,000 | | 101,500 |
Belarus - 0.3% |
Belarus Republic: | | | | |
8.75% 8/3/15 (Reg. S) | | 225,000 | | 222,188 |
8.95% 1/26/18 | | 100,000 | | 98,750 |
TOTAL BELARUS | | 320,938 |
Belize - 0.1% |
Belize Government 8.5% 2/20/29 (c)(e) | | 150,000 | | 60,000 |
Bermuda - 0.1% |
Bermuda Government 5.603% 7/20/20 (e) | | 100,000 | | 116,500 |
Government Obligations - continued |
| Principal
Amount | | Value |
Bolivia - 0.2% |
Plurinational State of Bolivia 4.875% 10/29/22 (e) | | $ 200,000 | | $ 200,500 |
Brazil - 1.3% |
Brazilian Federative Republic: | | | | |
7.125% 1/20/37 | | 200,000 | | 300,500 |
10.125% 5/15/27 | | 150,000 | | 271,500 |
12.25% 3/6/30 | | 350,000 | | 721,000 |
TOTAL BRAZIL | | 1,293,000 |
Cayman Islands - 0.1% |
Cayman Island Government 5.95% 11/24/19 (e) | | 100,000 | | 116,500 |
Colombia - 0.2% |
Colombian Republic 10.375% 1/28/33 | | 90,000 | | 165,150 |
Congo - 0.1% |
Congo Republic 3% 6/30/29 (d) | | 95,000 | | 79,800 |
Croatia - 0.5% |
Croatia Republic: | | | | |
6.25% 4/27/17 (e) | | 200,000 | | 219,500 |
6.375% 3/24/21 (e) | | 200,000 | | 227,000 |
6.625% 7/14/20 (e) | | 100,000 | | 115,130 |
TOTAL CROATIA | | 561,630 |
Ecuador - 0.2% |
Ecuador Republic 9.375% 12/15/15 (e) | | 236,000 | | 238,360 |
El Salvador - 0.2% |
El Salvador Republic 7.375% 12/1/19 (e) | | 175,000 | | 203,875 |
Ghana - 0.1% |
Ghana Republic 8.5% 10/4/17 (e) | | 100,000 | | 116,000 |
Guatemala - 0.2% |
Guatemalan Republic 5.75% 6/6/22 (e) | | 200,000 | | 228,500 |
Hungary - 0.5% |
Hungarian Republic: | | | | |
4.75% 2/3/15 | | 365,000 | | 373,687 |
7.625% 3/29/41 | | 100,000 | | 118,000 |
TOTAL HUNGARY | | 491,687 |
Government Obligations - continued |
| Principal
Amount | | Value |
Iceland - 0.2% |
Republic of Iceland: | | | | |
4.875% 6/16/16 (e) | | $ 100,000 | | $ 104,625 |
5.875% 5/11/22 (e) | | 100,000 | | 109,750 |
TOTAL ICELAND | | 214,375 |
Indonesia - 0.4% |
Indonesian Republic: | | | | |
7.75% 1/17/38 (e) | | 175,000 | | 264,915 |
8.5% 10/12/35 (e) | | 100,000 | | 160,250 |
TOTAL INDONESIA | | 425,165 |
Iraq - 0.5% |
Republic of Iraq 5.8% 1/15/28 (Reg. S) | | 550,000 | | 514,250 |
Ivory Coast - 0.5% |
Ivory Coast 3.75% 12/31/32 (c)(d) | | 575,000 | | 516,063 |
Latvia - 0.2% |
Latvian Republic 5.25% 2/22/17 (e) | | 200,000 | | 220,500 |
Lebanon - 0.5% |
Lebanese Republic: | | | | |
6.1% 10/4/22 | | 190,000 | | 192,613 |
11.625% 5/11/16 (Reg. S) | | 250,000 | | 305,000 |
TOTAL LEBANON | | 497,613 |
Lithuania - 0.5% |
Lithuanian Republic: | | | | |
6.125% 3/9/21 (e) | | 100,000 | | 119,750 |
6.625% 2/1/22 (e) | | 200,000 | | 247,000 |
7.375% 2/11/20 (e) | | 100,000 | | 127,125 |
TOTAL LITHUANIA | | 493,875 |
Mexico - 0.7% |
United Mexican States: | | | | |
5.75% 10/12/10 | | 124,000 | | 146,320 |
6.05% 1/11/40 | | 200,000 | | 266,000 |
6.75% 9/27/34 | | 200,000 | | 282,000 |
TOTAL MEXICO | | 694,320 |
Namibia - 0.2% |
Republic of Namibia 5.5% 11/3/21 (e) | | 200,000 | | 223,320 |
Government Obligations - continued |
| Principal
Amount | | Value |
Netherlands - 0.3% |
Republic of Angola 7% 8/16/19 (Issued by Northern Lights III BV for Republic of Angola) (Reg. S) | | $ 250,000 | | $ 279,375 |
Nigeria - 0.6% |
Republic of Nigeria 6.75% 1/28/21 (e) | | 550,000 | | 631,125 |
Panama - 0.3% |
Panamanian Republic: | | | | |
8.875% 9/30/27 | | 55,000 | | 89,238 |
9.375% 4/1/29 | | 150,000 | | 257,250 |
TOTAL PANAMA | | 346,488 |
Peru - 0.6% |
Peruvian Republic 8.75% 11/21/33 | | 345,000 | | 600,300 |
Philippines - 1.1% |
Philippine Republic: | | | | |
6.375% 10/23/34 | | 150,000 | | 208,500 |
7.75% 1/14/31 | | 125,000 | | 193,125 |
10.625% 3/16/25 | | 425,000 | | 746,938 |
TOTAL PHILIPPINES | | 1,148,563 |
Poland - 0.2% |
Polish Government: | | | | |
5% 3/23/22 | | 35,000 | | 40,819 |
6.375% 7/15/19 | | 135,000 | | 168,075 |
TOTAL POLAND | | 208,894 |
Qatar - 0.3% |
State of Qatar 5.75% 1/20/42 (e) | | 200,000 | | 257,000 |
Romania - 0.2% |
Romanian Republic 6.75% 2/7/22 (e) | | 190,000 | | 219,450 |
Russia - 1.7% |
Russian Federation: | | | | |
5.625% 4/4/42 (e) | | 200,000 | | 241,000 |
7.5% 3/31/30 (Reg. S) | | 697,500 | | 882,338 |
11% 7/24/18 (Reg. S) | | 200,000 | | 293,000 |
12.75% 6/24/28 (Reg. S) | | 175,000 | | 345,188 |
TOTAL RUSSIA | | 1,761,526 |
Senegal - 0.2% |
Republic of Senegal 8.75% 5/13/21 (e) | | 200,000 | | 242,000 |
Serbia - 0.0% |
Republic of Serbia 6.75% 11/1/24 (e) | | 41,667 | | 41,250 |
Government Obligations - continued |
| Principal
Amount | | Value |
Slovakia - 0.2% |
Slovakia Republic 4.375% 5/21/22 (e) | | $ 200,000 | | $ 214,000 |
Slovenia - 0.2% |
Republic of Slovenia 5.5% 10/26/22 (e) | | 200,000 | | 199,500 |
South Africa - 0.1% |
South African Republic 4.665% 1/17/24 | | 100,000 | | 110,250 |
Sri Lanka - 0.3% |
Democratic Socialist Republic of Sri Lanka: | | | | |
5.875% 7/25/22 (e) | | 200,000 | | 221,000 |
6.25% 10/4/20 (e) | | 100,000 | | 112,500 |
TOTAL SRI LANKA | | 333,500 |
Turkey - 1.3% |
Turkish Republic: | | | | |
7% 6/5/20 | | 300,000 | | 375,000 |
7.5% 7/14/17 | | 100,000 | | 121,000 |
11.875% 1/15/30 | | 450,000 | | 855,000 |
TOTAL TURKEY | | 1,351,000 |
Ukraine - 0.3% |
Ukraine Government: | | | | |
7.75% 9/23/20 (e) | | 100,000 | | 104,370 |
9.25% 7/24/17 (e) | | 200,000 | | 217,760 |
TOTAL UKRAINE | | 322,130 |
Uruguay - 0.1% |
Uruguay Republic 7.625% 3/21/36 | | 75,000 | | 116,250 |
Venezuela - 0.9% |
Venezuelan Republic: | | | | |
7.75% 10/13/19 (Reg. S) | | 85,000 | | 73,738 |
11.75% 10/21/26 (Reg. S) | | 300,000 | | 300,750 |
11.95% 8/5/31 (Reg. S) | | 350,000 | | 354,375 |
12.75% 8/23/22 | | 135,000 | | 144,113 |
TOTAL VENEZUELA | | 872,976 |
Zambia - 0.2% |
Republic of Zambia 5.375% 9/20/22 (e) | | 200,000 | | 201,400 |
TOTAL GOVERNMENT OBLIGATIONS (Cost $15,928,776) |
17,749,898
|
Money Market Funds - 3.0% |
| Shares | | Value |
Fidelity Cash Central Fund, 0.19% (b)
(Cost $3,099,243) | 3,099,243 | | $ 3,099,243 |
TOTAL INVESTMENT PORTFOLIO - 99.9% (Cost $95,001,745) | | 102,924,159 |
NET OTHER ASSETS (LIABILITIES) - 0.1% | | 102,208 |
NET ASSETS - 100% | $ 103,026,367 |
Legend |
(a) Non-income producing |
(b) Affiliated fund that is available only to investment companies and other accounts managed by Fidelity Investments. The rate quoted is the annualized seven-day yield of the fund at period end. A complete unaudited listing of the fund's holdings as of its most recent quarter end is available upon request. In addition, each Fidelity Central Fund's financial statements, which are not covered by the Fund's Report of Independent Registered Public Accounting Firm, are available on the SEC's website or upon request. |
(c) Non-income producing - Security is in default. |
(d) Security initially issued at one coupon which converts to a higher coupon at a specified date. The rate shown is the rate at period end. |
(e) Security exempt from registration under Rule 144A of the Securities Act of 1933. These securities may be resold in transactions exempt from registration, normally to qualified institutional buyers. At the end of the period, the value of these securities amounted to $11,907,822 or 11.6% of net assets. |
(f) Security is perpetual in nature with no stated maturity date. |
Affiliated Central Funds |
Information regarding fiscal year to date income earned by the Fund from investments in Fidelity Central Funds is as follows: |
Fund | Income earned |
Fidelity Cash Central Fund | $ 3,818 |
Fidelity Securities Lending Cash Central Fund | 315 |
Total | $ 4,133 |
Other Information |
Categorizations in the Schedule of Investments are based on country or territory of incorporation. |
The following is a summary of the inputs used, as of October 31, 2012, involving the Fund's assets and liabilities carried at fair value. The inputs or methodology used for valuing securities may not be an indication of the risk associated with investing in those securities. For more information on valuation inputs, and their aggregation into the levels used in the table below, please refer to the Security Valuation section in the accompanying Notes to Financial Statements. |
Valuation Inputs at Reporting Date: |
Description | Total | Level 1 | Level 2 | Level 3 |
Investments in Securities: | | | | |
Equities: | | | | |
Consumer Discretionary | $ 6,231,147 | $ 6,231,147 | $ - | $ - |
Consumer Staples | 6,577,159 | 6,577,159 | - | - |
Energy | 9,569,545 | 9,569,545 | - | - |
Financials | 19,085,912 | 18,331,132 | 754,780 | - |
Health Care | 947,599 | 947,599 | - | - |
Industrials | 5,289,474 | 5,289,474 | - | - |
Information Technology | 10,115,607 | 8,719,752 | 1,395,855 | - |
Materials | 9,131,743 | 8,671,551 | 460,192 | - |
Telecommunication Services | 5,177,656 | 4,888,469 | 289,187 | - |
Utilities | 2,396,334 | 2,122,877 | 273,457 | - |
Corporate Bonds | 7,552,842 | - | 7,552,842 | - |
Government Obligations | 17,749,898 | - | 17,749,898 | - |
Money Market Funds | 3,099,243 | 3,099,243 | - | - |
Total Investments in Securities: | $ 102,924,159 | $ 74,447,948 | $ 28,476,211 | $ - |
The composition of credit quality ratings as a percentage of net assets is as follows (Unaudited): |
AAA,AA,A | 1.6% |
BBB | 10.7% |
BB | 4.5% |
B | 5.0% |
CCC,CC,C | 0.3% |
Not Rated | 2.4% |
Equities | 72.4% |
Short-Term Investments and
Net Other Assets | 3.1% |
| 100.0% |
We have used ratings from Moody's Investors Service, Inc. Where Moody's® ratings are not available, we have used S&P® ratings. All ratings are as of the date indicated and do not reflect subsequent changes. |
See accompanying notes which are an integral part of the financial statements.
Annual Report
Fidelity Total Emerging Markets Fund
Statement of Assets and Liabilities
| October 31, 2012 |
| | |
Assets | | |
Investment in securities, at value - See accompanying schedule: Unaffiliated issuers (cost $91,902,502) | $ 99,824,916 | |
Fidelity Central Funds (cost $3,099,243) | 3,099,243 | |
Total Investments (cost $95,001,745) | | $ 102,924,159 |
Cash | | 705,020 |
Foreign currency held at value (cost $27,710) | | 27,720 |
Receivable for investments sold | | 768,066 |
Receivable for fund shares sold | | 90,619 |
Dividends receivable | | 92,479 |
Interest receivable | | 361,664 |
Distributions receivable from Fidelity Central Funds | | 312 |
Receivable from investment adviser for expense reductions | | 32,905 |
Other receivables | | 7,009 |
Total assets | | 105,009,953 |
| | |
Liabilities | | |
Payable for investments purchased | $ 1,645,445 | |
Payable for fund shares redeemed | 67,594 | |
Accrued management fee | 69,068 | |
Distribution and service plan fees payable | 8,928 | |
Other affiliated payables | 20,243 | |
Other payables and accrued expenses | 172,308 | |
Total liabilities | | 1,983,586 |
| | |
Net Assets | | $ 103,026,367 |
Net Assets consist of: | | |
Paid in capital | | $ 95,354,127 |
Undistributed net investment income | | 1,406,377 |
Accumulated undistributed net realized gain (loss) on investments and foreign currency transactions | | (1,593,639) |
Net unrealized appreciation (depreciation) on investments and assets and liabilities in foreign currencies | | 7,859,502 |
Net Assets | | $ 103,026,367 |
See accompanying notes which are an integral part of the financial statements.
Annual Report
Fidelity Total Emerging Markets Fund
Financial Statements - continued
Statement of Assets and Liabilities - continued
| October 31, 2012 |
| | |
Calculation of Maximum Offering Price Class A:
Net Asset Value and redemption price per share ($7,675,347 ÷ 706,507 shares) | | $ 10.86 |
| | |
Maximum offering price per share (100/94.25 of $10.86) | | $ 11.52 |
Class T:
Net Asset Value and redemption price per share ($5,822,909 ÷ 537,125 shares) | | $ 10.84 |
| | |
Maximum offering price per share (100/96.50 of $10.84) | | $ 11.23 |
Class C:
Net Asset Value and offering price per share ($5,824,450 ÷ 539,492 shares)A | | $ 10.80 |
| | |
Total Emerging Markets:
Net Asset Value, offering price and redemption price per share ($81,416,417 ÷ 7,478,534 shares) | | $ 10.89 |
| | |
Institutional Class:
Net Asset Value, offering price and redemption price per share ($2,287,244 ÷ 210,097 shares) | | $ 10.89 |
A Redemption price per share is equal to net asset value less any applicable contingent deferred sales charge.
See accompanying notes which are an integral part of the financial statements.
Annual Report
Statement of Operations
| | For the period
November 1, 2011
(commencement of
operations) to
October 31, 2012 |
| | |
Investment Income | | |
Dividends | | $ 1,585,174 |
Interest | | 1,369,434 |
Income from Fidelity Central Funds | | 4,133 |
Income before foreign taxes withheld | | 2,958,741 |
Less foreign taxes withheld | | (172,929) |
Total income | | 2,785,812 |
| | |
Expenses | | |
Management fee | $ 633,456 | |
Transfer agent fees | 147,018 | |
Distribution and service plan fees | 91,027 | |
Accounting and security lending fees | 40,641 | |
Custodian fees and expenses | 250,107 | |
Independent trustees' compensation | 459 | |
Registration fees | 129,540 | |
Audit | 59,305 | |
Legal | 288 | |
Miscellaneous | 484 | |
Total expenses before reductions | 1,352,325 | |
Expense reductions | (179,390) | 1,172,935 |
Net investment income (loss) | | 1,612,877 |
Realized and Unrealized Gain (Loss) Net realized gain (loss) on: | | |
Investment securities: | | |
Unaffiliated issuers (net of foreign taxes of $2,465) | (1,514,743) | |
Foreign currency transactions | (71,319) | |
Total net realized gain (loss) | | (1,586,062) |
Change in net unrealized appreciation (depreciation) on: Investment securities (net of increase in deferred foreign taxes of $61,936) | 7,860,478 | |
Assets and liabilities in foreign currencies | (976) | |
Total change in net unrealized appreciation (depreciation) | | 7,859,502 |
Net gain (loss) | | 6,273,440 |
Net increase (decrease) in net assets resulting from operations | | $ 7,886,317 |
See accompanying notes which are an integral part of the financial statements.
Annual Report
Fidelity Total Emerging Markets Fund
Financial Statements - continued
Statement of Changes in Net Assets
| For the period
November 1, 2011
(commencement of
operations) to
October 31, 2012 |
Increase (Decrease) in Net Assets | |
Operations | |
Net investment income (loss) | $ 1,612,877 |
Net realized gain (loss) | (1,586,062) |
Change in net unrealized appreciation (depreciation) | 7,859,502 |
Net increase (decrease) in net assets resulting from operations | 7,886,317 |
Distributions to shareholders from net investment income | (96,645) |
Share transactions - net increase (decrease) | 95,209,478 |
Redemption fees | 27,217 |
Total increase (decrease) in net assets | 103,026,367 |
| |
Net Assets | |
Beginning of period | - |
End of period (including undistributed net investment income of $1,406,377) | $ 103,026,367 |
See accompanying notes which are an integral part of the financial statements.
Annual Report
Financial Highlights - Class A
Period ended October 31, | 2012 F |
Selected Per-Share Data | |
Net asset value, beginning of period | $ 10.00 |
Income from Investment Operations | |
Net investment income (loss) C | .20 |
Net realized and unrealized gain (loss) | .68 |
Total from investment operations | .88 |
Distributions from net investment income | (.02) |
Redemption fees added to paid in capital C, H | - |
Net asset value, end of period | $ 10.86 |
Total Return A, B | 8.80% |
Ratios to Average Net Assets D, G | |
Expenses before reductions | 1.87% |
Expenses net of fee waivers, if any | 1.65% |
Expenses net of all reductions | 1.62% |
Net investment income (loss) | 1.92% |
Supplemental Data | |
Net assets, end of period (000 omitted) | $ 7,675 |
Portfolio turnover rate E | 70% |
A Total returns would have been lower if certain expenses had not been reduced during the applicable periods shown.
B Total returns do not include the effect of the sales charges.
C Calculated based on average shares outstanding during the period.
D Fees and expenses of any underlying Fidelity Central Funds are not included in the Fund's expense ratio. The Fund indirectly bears its proportionate share of the expenses of any underlying Fidelity Central Funds.
E Amount does not include the portfolio activity of any underlying Fidelity Central Funds.
F For the period November 1, 2011 (commencement of operations) to October 31, 2012.
G Expense ratios reflect operating expenses of the class. Expenses before reductions do not reflect amounts reimbursed by the investment adviser or reductions from brokerage service arrangements or reductions from other expense offset arrangements and do not represent the amount paid by the class during periods when reimbursements or reductions occur. Expense ratios before reductions for start-up periods may not be representative of longer-term operating periods. Expenses net of fee waivers reflect expenses after reimbursement by the investment adviser but prior to reductions from brokerage service arrangements or other expense offset arrangements. Expenses net of all reductions represent the net expenses paid by the class.
H Amount represents less than $.01 per share.
See accompanying notes which are an integral part of the financial statements.
Annual Report
Financial Highlights - Class T
Period ended October 31, | 2012 F |
Selected Per-Share Data | |
Net asset value, beginning of period | $ 10.00 |
Income from Investment Operations | |
Net investment income (loss) C | .17 |
Net realized and unrealized gain (loss) | .68 |
Total from investment operations | .85 |
Distributions from net investment income | (.01) |
Redemption fees added to paid in capital C, H | - |
Net asset value, end of period | $ 10.84 |
Total Return A, B | 8.56% |
Ratios to Average Net Assets D, G | |
Expenses before reductions | 2.10% |
Expenses net of fee waivers, if any | 1.90% |
Expenses net of all reductions | 1.87% |
Net investment income (loss) | 1.67% |
Supplemental Data | |
Net assets, end of period (000 omitted) | $ 5,823 |
Portfolio turnover rate E | 70% |
A Total returns would have been lower if certain expenses had not been reduced during the applicable periods shown.
B Total returns do not include the effect of the sales charges.
C Calculated based on average shares outstanding during the period.
D Fees and expenses of any underlying Fidelity Central Funds are not included in the Fund's expense ratio. The Fund indirectly bears its proportionate share of the expenses of any underlying Fidelity Central Funds.
E Amount does not include the portfolio activity of any underlying Fidelity Central Funds.
F For the period November 1, 2011 (commencement of operations) to October 31, 2012.
G Expense ratios reflect operating expenses of the class. Expenses before reductions do not reflect amounts reimbursed by the investment adviser or reductions from brokerage service arrangements or reductions from other expense offset arrangements and do not represent the amount paid by the class during periods when reimbursements or reductions occur. Expense ratios before reductions for start-up periods may not be representative of longer-term operating periods. Expenses net of fee waivers reflect expenses after reimbursement by the investment adviser but prior to reductions from brokerage service arrangements or other expense offset arrangements. Expenses net of all reductions represent the net expenses paid by the class.
H Amount represents less than $.01 per share.
See accompanying notes which are an integral part of the financial statements.
Annual Report
Financial Highlights - Class C
Period ended October 31, | 2012 F |
Selected Per-Share Data | |
Net asset value, beginning of period | $ 10.00 |
Income from Investment Operations | |
Net investment income (loss) C | .12 |
Net realized and unrealized gain (loss) | .69 |
Total from investment operations | .81 |
Distributions from net investment income | (.01) |
Redemption fees added to paid in capital C, H | - |
Net asset value, end of period | $ 10.80 |
Total Return A, B | 8.07% |
Ratios to Average Net Assets D, G | |
Expenses before reductions | 2.63% |
Expenses net of fee waivers, if any | 2.40% |
Expenses net of all reductions | 2.37% |
Net investment income (loss) | 1.17% |
Supplemental Data | |
Net assets, end of period (000 omitted) | $ 5,824 |
Portfolio turnover rate E | 70% |
A Total returns would have been lower if certain expenses had not been reduced during the applicable periods shown.
B Total returns do not include the effect of the contingent deferred sales charge.
C Calculated based on average shares outstanding during the period.
D Fees and expenses of any underlying Fidelity Central Funds are not included in the Fund's expense ratio. The Fund indirectly bears its proportionate share of the expenses of any underlying Fidelity Central Funds.
E Amount does not include the portfolio activity of any underlying Fidelity Central Funds.
F For the period November 1, 2011 (commencement of operations) to October 31, 2012.
G Expense ratios reflect operating expenses of the class. Expenses before reductions do not reflect amounts reimbursed by the investment adviser or reductions from brokerage service arrangements or reductions from other expense offset arrangements and do not represent the amount paid by the class during periods when reimbursements or reductions occur. Expense ratios before reductions for start-up periods may not be representative of longer-term operating periods. Expenses net of fee waivers reflect expenses after reimbursement by the investment adviser but prior to reductions from brokerage service arrangements or other expense offset arrangements. Expenses net of all reductions represent the net expenses paid by the class.
H Amount represents less than $.01 per share.
See accompanying notes which are an integral part of the financial statements.
Annual Report
Financial Highlights - Total Emerging Markets
Period ended October 31, | 2012 E |
Selected Per-Share Data | |
Net asset value, beginning of period | $ 10.00 |
Income from Investment Operations | |
Net investment income (loss) B | .22 |
Net realized and unrealized gain (loss) | .69 |
Total from investment operations | .91 |
Distributions from net investment income | (.02) |
Redemption fees added to paid in capital B, G | - |
Net asset value, end of period | $ 10.89 |
Total Return A | 9.15% |
Ratios to Average Net Assets C, F | |
Expenses before reductions | 1.60% |
Expenses net of fee waivers, if any | 1.40% |
Expenses net of all reductions | 1.38% |
Net investment income (loss) | 2.16% |
Supplemental Data | |
Net assets, end of period (000 omitted) | $ 81,416 |
Portfolio turnover rate D | 70% |
A Total returns would have been lower if certain expenses had not been reduced during the applicable periods shown.
B Calculated based on average shares outstanding during the period.
C Fees and expenses of any underlying Fidelity Central Funds are not included in the Fund's expense ratio. The Fund indirectly bears its proportionate share of the expenses of any underlying Fidelity Central Funds.
D Amount does not include the portfolio activity of any underlying Fidelity Central Funds.
E For the period November 1, 2011 (commencement of operations) to October 31, 2012.
F Expense ratios reflect operating expenses of the class. Expenses before reductions do not reflect amounts reimbursed by the investment adviser or reductions from brokerage service arrangements or reductions from other expense offset arrangements and do not represent the amount paid by the class during periods when reimbursements or reductions occur. Expense ratios before reductions for start-up periods may not be representative of longer-term operating periods. Expenses net of fee waivers reflect expenses after reimbursement by the investment adviser but prior to reductions from brokerage service arrangements or other expense offset arrangements. Expenses net of all reductions represent the net expenses paid by the class.
G Amount represents less than $.01 per share.
See accompanying notes which are an integral part of the financial statements.
Annual Report
Financial Highlights - Institutional Class
Period ended October 31, | 2012 E |
Selected Per-Share Data | |
Net asset value, beginning of period | $ 10.00 |
Income from Investment Operations | |
Net investment income (loss) B | .22 |
Net realized and unrealized gain (loss) | .69 |
Total from investment operations | .91 |
Distributions from net investment income | (.02) |
Redemption fees added to paid in capital B, G | - |
Net asset value, end of period | $ 10.89 |
Total Return A | 9.15% |
Ratios to Average Net Assets C, F | |
Expenses before reductions | 1.62% |
Expenses net of fee waivers, if any | 1.40% |
Expenses net of all reductions | 1.37% |
Net investment income (loss) | 2.17% |
Supplemental Data | |
Net assets, end of period (000 omitted) | $ 2,287 |
Portfolio turnover rate D | 70% |
A Total returns would have been lower if certain expenses had not been reduced during the applicable periods shown.
B Calculated based on average shares outstanding during the period.
C Fees and expenses of any underlying Fidelity Central Funds are not included in the Fund's expense ratio. The Fund indirectly bears its proportionate share of the expenses of any underlying Fidelity Central Funds.
D Amount does not include the portfolio activity of any underlying Fidelity Central Funds.
E For the period November 1, 2011 (commencement of operations) to October 31, 2012.
F Expense ratios reflect operating expenses of the class. Expenses before reductions do not reflect amounts reimbursed by the investment adviser or reductions from brokerage service arrangements or reductions from other expense offset arrangements and do not represent the amount paid by the class during periods when reimbursements or reductions occur. Expense ratios before reductions for start-up periods may not be representative of longer-term operating periods. Expenses net of fee waivers reflect expenses after reimbursement by the investment adviser but prior to reductions from brokerage service arrangements or other expense offset arrangements. Expenses net of all reductions represent the net expenses paid by the class.
G Amount represents less than $.01 per share.
See accompanying notes which are an integral part of the financial statements.
Annual Report
Fidelity Total Emerging Markets Fund
Notes to Financial Statements
For the period ended October 31, 2012
1. Organization.
Fidelity Total Emerging Markets Fund (the Fund) is a fund of Fidelity Investment Trust (the Trust) and is authorized to issue an unlimited number of shares. The Trust is registered under the Investment Company Act of 1940, as amended (the 1940 Act), as an open-end management investment company organized as a Massachusetts business trust. The Fund offers Class A, Class T, Class C, Total Emerging Markets and Institutional Class shares, each of which has equal rights as to assets and voting privileges. Each class has exclusive voting rights with respect to matters that affect that class. Investment income, realized and unrealized capital gains and losses, the common expenses of the Fund, and certain fund-level expense reductions, if any, are allocated on a pro-rata basis to each class based on the relative net assets of each class to the total net assets of the Fund. Each class differs with respect to transfer agent and distribution and service plan fees incurred. Certain expense reductions may also differ by class. The Fund's investments in emerging markets can be subject to social, economic, regulatory, and political uncertainties and can be extremely volatile.
2. Investments in Fidelity Central Funds.
The Fund invests in Fidelity Central Funds, which are open-end investment companies available only to other investment companies and accounts managed by Fidelity Management & Research Company (FMR) and its affiliates. The Fund's Schedule of Investments lists each of the Fidelity Central Funds held as of period end, as an investment of the Fund, but does not include the underlying holdings of each Fidelity Central Fund. As an Investing Fund, the Fund indirectly bears its proportionate share of the expenses of the underlying Fidelity Central Funds.
The Money Market Central Funds seek preservation of capital and current income and are managed by Fidelity Investments Money Management, Inc. (FIMM), an affiliate of FMR.
A complete unaudited list of holdings for each Fidelity Central Fund is available upon request or at the Securities and Exchange Commission (the SEC) web site at www.sec.gov. In addition, the financial statements of the Fidelity Central Funds, which are not covered by the Fund's Report of Independent Registered Public Accounting Firm, are available on the SEC web site or upon request.
3. Significant Accounting Policies.
The financial statements have been prepared in conformity with accounting principles generally accepted in the United States of America (GAAP), which require management to make certain estimates and assumptions at the date of the financial statements. Actual results could differ from those estimates. Subsequent events, if any, through the date that the financial statements were issued have been evaluated in the preparation of
Annual Report
Fidelity Total Emerging Markets Fund
Notes to Financial Statements - continued
3. Significant Accounting Policies - continued
the financial statements. The following summarizes the significant accounting policies of the Fund:
Security Valuation. Investments are valued as of 4:00 p.m. Eastern time on the last calendar day of the period. In accordance with valuation policies and procedures approved by the Board of Trustees (the Board), the Fund attempts to obtain prices from one or more third party pricing vendors or brokers to value its investments. When current market prices, quotations or rates are not readily available or reliable, securities will be fair valued in good faith by the FMR Fair Value Committee (the Committee), in accordance with procedures adopted by the Fund's Board. Factors used in determining fair value vary by security type and may include market or security specific events, changes in interest rates and credit quality. The frequency with which these procedures are used cannot be predicted and they may be utilized to a significant extent. The Committee oversees the Fund's valuation policies and procedures and is responsible for approving and reporting to the Board all fair value determinations.
The Fund categorizes the inputs to valuation techniques used to value its investments into a disclosure hierarchy consisting of three levels as shown below:
Level 1 - quoted prices in active markets for identical investments
Level 2 - other significant observable inputs (including quoted prices for similar investments, interest rates, prepayment speeds, etc.)
Level 3 - unobservable inputs (including the Fund's own assumptions based on the best information available)
Valuation techniques used to value the Fund's investments by major category are as follows:
Equity securities, including restricted securities, for which market quotations are readily available, are valued at the last reported sale price or official closing price as reported by a third party pricing vendor on the primary market or exchange on which they are traded and are categorized as Level 1 in the hierarchy. In the event there were no sales during the day or closing prices are not available, securities are valued at the last quoted bid price or may be valued using the last available price and are generally categorized as Level 2 in the hierarchy. For foreign equity securities, when significant market or security specific events arise, comparisons to the valuation of American Depositary Receipts (ADRs), futures contracts, Exchange-Traded Funds (ETFs) and certain indexes as well as quoted prices for similar securities are used and are categorized as Level 2 in the hierarchy. Utilizing these techniques may result in transfers between Level 1 and Level 2.
Debt securities, including restricted securities, are valued based on evaluated prices received from third party pricing vendors or from brokers who make markets in such
Annual Report
3. Significant Accounting Policies - continued
Security Valuation - continued
securities. For corporate bonds and foreign government and government agency obligations, pricing vendors utilize matrix pricing which considers yield or price of bonds of comparable quality, coupon, maturity and type as well as broker-supplied prices and are generally categorized as Level 2 in the hierarchy. When independent prices are unavailable or unreliable, debt securities may be valued utilizing pricing methodologies which consider similar factors that would be used by third party pricing vendors. These are generally categorized as Level 2 in the hierarchy but may be Level 3 depending on the circumstances.
Investments in open-end mutual funds, including the Fidelity Central Funds, are valued at their closing net asset value (NAV) each business day and are categorized as Level 1 in the hierarchy.
Changes in valuation techniques may result in transfers in or out of an assigned level within the disclosure hierarchy. The aggregate value of investments by input level, as of October 31, 2012, is included at the end of the Fund's Schedule of Investments.
Foreign Currency Translation. The Fund may use foreign currency contracts to facilitate transactions in foreign-denominated securities. Gains and losses from these transactions may arise from changes in the value of the foreign currency or if the counterparties do not perform under the contracts' terms.
Foreign-denominated assets, including investment securities, and liabilities are translated into U.S. dollars at the exchange rates at period end. Purchases and sales of investment securities, income and dividends received and expenses denominated in foreign currencies are translated into U.S. dollars at the exchange rate in effect on the transaction date.
The effects of exchange rate fluctuations on investments are included with the net realized and unrealized gain (loss) on investment securities. Other foreign currency transactions resulting in realized and unrealized gain (loss) are disclosed separately.
Investment Transactions and Income. For financial reporting purposes, the Fund's investment holdings and NAV include trades executed through the end of the last business day of the period. The NAV per share for processing shareholder transactions is calculated as of the close of business of the New York Stock Exchange (NYSE), normally 4:00 p.m. Eastern time and includes trades executed through the end of the prior business day. Gains and losses on securities sold are determined on the basis of identified cost. Dividend income is recorded on the ex-dividend date, except for certain dividends from foreign securities where the ex-dividend date may have passed, which are recorded as soon as the Fund is informed of the ex-dividend date. Non-cash dividends included in
Annual Report
Fidelity Total Emerging Markets Fund
Notes to Financial Statements - continued
3. Significant Accounting Policies - continued
Investment Transactions and Income - continued
dividend income, if any, are recorded at the fair market value of the securities received. Interest income and distributions from the Fidelity Central Funds are accrued as earned. Interest income includes coupon interest and amortization of premium and accretion of discount on debt securities. Investment income is recorded net of foreign taxes withheld where recovery of such taxes is uncertain. Debt obligations may be placed on non-accrual status and related interest income may be reduced by ceasing current accruals and writing off interest receivables when the collection of all or a portion of interest has become doubtful based on consistently applied procedures. A debt obligation is removed from non-accrual status when the issuer resumes interest payments or when collectability of interest is reasonably assured.
Expenses. Expenses directly attributable to a fund are charged to that fund. Expenses attributable to more than one fund are allocated among the respective funds on the basis of relative net assets or other appropriate methods. Expense estimates are accrued in the period to which they relate and adjustments are made when actual amounts are known.
Income Tax Information and Distributions to Shareholders. Each year, the Fund intends to qualify as a regulated investment company under Subchapter M of the Internal Revenue Code, including distributing substantially all of its taxable income and realized gains. As a result, no provision for income taxes is required. As of October 31, 2012, the Fund did not have any unrecognized tax benefits in the financial statements; nor is the Fund aware of any tax positions for which it is reasonably possible that the total amounts of unrecognized tax benefits will significantly change in the next twelve months. The Fund files a U.S. federal tax return, in addition to state and local tax returns as required. A fund's federal income tax returns are subject to examination by the Internal Revenue Service (IRS) for a period of three fiscal years after they are filed. State and local tax returns may be subject to examination for an additional fiscal year depending on the jurisdiction. Foreign taxes are provided for based on the Fund's understanding of the tax rules and rates that exist in the foreign markets in which it invests. The Fund is subject to a tax imposed on capital gains by certain countries in which it invests. An estimated deferred tax liability for net unrealized appreciation on the applicable securities is included in Other payables and accrued expenses on the Statement of Assets & Liabilities.
Distributions are declared and recorded on the ex-dividend date. Income dividends and capital gain distributions are declared separately for each class. Income and capital gain distributions are determined in accordance with income tax regulations, which may differ from GAAP. In addition, the Fund claimed a portion of the payment made to redeeming shareholders as a distribution for income tax purposes.
Annual Report
3. Significant Accounting Policies - continued
Income Tax Information and Distributions to Shareholders - continued
Capital accounts within the financial statements are adjusted for permanent book-tax differences. These adjustments have no impact on net assets or the results of operations. Temporary book-tax differences will reverse in a subsequent period.
Book-tax differences are primarily due to foreign currency transactions, certain foreign taxes, passive foreign investment companies (PFIC), market discount, capital loss carryforwards and losses deferred due to wash sales.
The federal tax cost of investment securities and unrealized appreciation (depreciation) as of period end were as follows:
Gross unrealized appreciation | $ 10,983,917 |
Gross unrealized depreciation | (3,416,206) |
Net unrealized appreciation (depreciation) on securities and other investments | $ 7,567,711 |
| |
Tax Cost | $ 95,356,448 |
The tax-based components of distributable earnings as of period end were as follows:
Undistributed ordinary income | $ 1,401,667 |
Capital loss carryforward | $ (1,234,216) |
Net unrealized appreciation (depreciation) | $ 7,566,725 |
Capital loss carryforwards are only available to offset future capital gains of the Fund to the extent provided by regulations and may be limited. Under the Regulated Investment Company Modernization Act of 2010 (the Act), the Fund is permitted to carry forward capital losses incurred in taxable years beginning after December 22, 2010 for an unlimited period and such capital losses are required to be used prior to any losses that expire. Capital loss carryforwards were as follows:
No expiration | |
Short-term | $ (1,234,216) |
The tax character of distributions paid was as follows:
| October 31, 2012 |
Ordinary Income | $ 96,645 |
Annual Report
Fidelity Total Emerging Markets Fund
Notes to Financial Statements - continued
3. Significant Accounting Policies - continued
Short-Term Trading (Redemption) Fees. Shares purchased by investors and held in the Fund less than 90 days are subject to a redemption fee equal to 1.50% of the net asset value of shares redeemed. All redemption fees, which reduce the proceeds of the shareholder redemption, are retained by the Fund and accounted for as an addition to paid in capital.
Restricted Securities. The Fund may invest in securities that are subject to legal or contractual restrictions on resale. These securities generally may be resold in transactions exempt from registration or to the public if the securities are registered. Disposal of these securities may involve time-consuming negotiations and expense, and prompt sale at an acceptable price may be difficult. Information regarding restricted securities is included at the end of the Fund's Schedule of Investments.
New Accounting Pronouncement. In December 2011, the Financial Accounting Standards Board issued Accounting Standard Update No. 2011-11, Disclosures about Offsetting Assets and Liabilities. The update creates new disclosure requirements requiring entities to disclose both gross and net information for derivatives and other financial instruments that are either offset in the Statement of Assets and Liabilities or subject to an enforceable master netting arrangement or similar agreement. The disclosure requirements are effective for annual reporting periods beginning on or after January 1, 2013, and interim periods within those annual periods. Management is currently evaluating the impact of the update's adoption on the Fund's financial statement disclosures.
4. Purchases and Sales of Investments.
Purchases and sales of securities, other than short-term securities, aggregated $144,030,449 and $50,601,679, respectively.
5. Fees and Other Transactions with Affiliates.
Management Fee. FMR and its affiliates provide the Fund with investment management related services for which the Fund pays a monthly management fee. The management fee is the sum of an individual fund fee rate that is based on an annual rate of .55% of the Fund's average net assets and an annualized group fee rate that averaged .26% during the period. The group fee rate is based upon the average net assets of all the mutual funds advised by FMR. The group fee rate decreases as assets under management increase and increases as assets under management decrease. For the period, the total annual management fee rate was .80% of the Fund's average net assets.
Annual Report
5. Fees and Other Transactions with Affiliates - continued
Distribution and Service Plan Fees. In accordance with Rule 12b-1 of the 1940 Act, the Fund has adopted separate Distribution and Service Plans for each class of shares. Certain classes pay Fidelity Distributors Corporation (FDC), an affiliate of FMR, separate Distribution and Service Fees, each of which is based on an annual percentage of each class' average net assets. In addition, FDC may pay financial intermediaries for selling shares of the Fund and providing shareholder support services. For the period, the Distribution and Service Fee rates, total fees and amounts retained by FDC were as follows:
| Distribution
Fee | Service
Fee | Total Fees | Retained
by FDC |
Class A | -% | .25% | $ 15,320 | $ 13,743 |
Class T | .25% | .25% | 22,574 | 15,459 |
Class C | .75% | .25% | 53,133 | 52,688 |
| | | $ 91,027 | $ 81,890 |
Sales Load. FDC may receive a front-end sales charge of up to 5.75% for selling Class A shares and 3.50% for selling Class T shares, some of which is paid to financial intermediaries for selling shares of the Fund. Depending on the holding period, FDC may receive contingent deferred sales charges levied on Class A, Class T, and Class C redemptions. The deferred sales charges range from 1.00% for Class C shares, 1.00% for certain purchases of Class A shares and .25% for certain purchases of Class T shares.
For the period, sales charge amounts retained by FDC were as follows:
| Retained
by FDC |
Class A | $ 2,010 |
Class T | 842 |
Class C* | 51 |
| $ 2,903 |
* When Class C shares are initially sold, FDC pays commissions from its own resources to financial intermediaries through which the sales are made.
Transfer Agent Fees. Fidelity Investments Institutional Operations Company, Inc. (FIIOC), an affiliate of FMR, is the transfer, dividend disbursing and shareholder servicing agent for each class of the Fund. FIIOC receives account fees and asset-based fees that vary according to the account size and type of account of the shareholders of the respective classes of the Fund. FIIOC pays for typesetting, printing and mailing of
Annual Report
Fidelity Total Emerging Markets Fund
Notes to Financial Statements - continued
5. Fees and Other Transactions with Affiliates - continued
Transfer Agent Fees - continued
shareholder reports, except proxy statements. For the period, transfer agent fees for each class were as follows:
| Amount | % of
Average
Net Assets |
Class A | $ 11,782 | .19 |
Class T | 8,511 | .19 |
Class C | 10,121 | .19 |
Total Emerging Markets | 112,796 | .19 |
Institutional Class | 3,808 | .18 |
| $ 147,018 | |
Accounting and Security Lending Fees. Fidelity Service Company, Inc. (FSC), an affiliate of FMR, maintains the Fund's accounting records. The accounting fee is based on the level of average net assets for each month. Under a separate contract, FSC administers the security lending program. The security lending fee is based on the number and duration of lending transactions.
Brokerage Commissions. The Fund placed a portion of its portfolio transactions with brokerage firms which are affiliates of the investment adviser. The commissions paid to these affiliated firms were $435 for the period.
6. Committed Line of Credit.
The Fund participates with other funds managed by FMR or an affiliate in a $4.25 billion credit facility (the "line of credit") to be utilized for temporary or emergency purposes to fund shareholder redemptions or for other short-term liquidity purposes. The Fund has agreed to pay commitment fees on its pro-rata portion of the line of credit, which amounted to $127 and is reflected in Miscellaneous expenses on the Statement of Operations. During the period, there were no borrowings on this line of credit.
7. Security Lending.
The Fund lends portfolio securities through a lending agent from time to time in order to earn additional income. For equity securities, a lending agent is used and may loan securities to certain qualified borrowers, including Fidelity Capital Markets (FCM), a broker-dealer affiliated with the Fund. On the settlement date of the loan, the Fund receives collateral (in the form of U.S. Treasury obligations, letters of credit and/or cash) against the loaned securities and maintains collateral in an amount not less than 100% of the market value of the loaned securities during the period of the loan. The market value of the loaned securities is determined at the close of business of the Fund and any
Annual Report
7. Security Lending - continued
additional required collateral is delivered to the Fund on the next business day. If the borrower defaults on its obligation to return the securities loaned because of insolvency or other reasons, a fund could experience delays and costs in recovering the securities loaned or in gaining access to the collateral. Any cash collateral received is invested in the Fidelity Securities Lending Cash Central Fund. At period end, there were no security loans outstanding. Security lending income represents the income earned on investing cash collateral, less rebates paid to borrowers and any lending agent fees associated with the loan, plus any premium payments received for lending certain types of securities. Security lending income is presented in the Statement of Operations as a component of income from Fidelity Central Funds. Total security lending income during the period amounted to $315. During the period, there were no securities loaned to FCM.
8. Expense Reductions.
Effective November 1, 2011, FMR contractually agreed to reimburse each class to the extent annual operating expenses exceeded certain levels of average net assets as noted in the table below. This reimbursement will remain in place through December 31, 2013. Some expenses, for example interest expense, including commitment fees, are excluded from this reimbursement.
The following classes were in reimbursement during the period:
| Expense
Limitations | Reimbursement
from adviser |
Class A | 1.65% | $ 13,791 |
Class T | 1.90% | 9,129 |
Class C | 2.40% | 12,487 |
Total Emerging Markets | 1.40% | 120,371 |
Institutional Class | 1.40% | 4,771 |
| | $ 160,549 |
Many of the brokers with whom FMR places trades on behalf of the Fund provided services to the Fund in addition to trade execution. These services included payments of certain expenses on behalf of the Fund totaling $18,638 for the period. In addition, through arrangements with the Fund's custodian, credits realized as a result of uninvested cash balances were used to reduce the Fund's expenses. During the period, these credits reduced the Fund's custody expenses by $203.
Annual Report
Fidelity Total Emerging Markets Fund
Notes to Financial Statements - continued
9. Distributions to Shareholders.
Distributions to shareholders of each class were as follows:
| Period ended
October 31,
2012 A |
From net investment income | |
Class A | $ 9,099 |
Class T | 4,204 |
Class C | 3,000 |
Total Emerging Markets | 75,940 |
Institutional Class | 4,402 |
Total | $ 96,645 |
A For the period November 1, 2011 (commencement of operations) to October 31, 2012.
10. Share Transactions.
Transactions for each class of shares were as follows:
| Shares | Dollars |
| Period ended
October 31,
2012 A | Period ended
October 31,
2012 A |
Class A | | |
Shares sold | 723,537 | $ 7,311,002 |
Reinvestment of distributions | 949 | 9,099 |
Shares redeemed | (17,979) | (179,387) |
Net increase (decrease) | 706,507 | $ 7,140,714 |
Class T | | |
Shares sold | 597,107 | $ 6,082,522 |
Reinvestment of distributions | 439 | 4,204 |
Shares redeemed | (60,421) | (637,924) |
Net increase (decrease) | 537,125 | $ 5,448,802 |
Class C | | |
Shares sold | 540,321 | $ 5,429,037 |
Reinvestment of distributions | 314 | 3,000 |
Shares redeemed | (1,143) | (12,081) |
Net increase (decrease) | 539,492 | $ 5,419,956 |
Total Emerging Markets | | |
Shares sold | 8,901,615 | $ 89,854,661 |
Reinvestment of distributions | 7,686 | 73,759 |
Shares redeemed | (1,430,767) | (14,834,512) |
Net increase (decrease) | 7,478,534 | $ 75,093,908 |
Institutional Class | | |
Shares sold | 209,638 | $ 2,101,696 |
Reinvestment of distributions | 459 | 4,402 |
Net increase (decrease) | 210,097 | $ 2,106,098 |
A For the period November 1, 2011 (commencement of operations) to October 31, 2012.
Annual Report
11. Other.
The Fund's organizational documents provide former and current trustees and officers with a limited indemnification against liabilities arising in connection with the performance of their duties to the Fund. In the normal course of business, the Fund may also enter into contracts that provide general indemnifications. The Fund's maximum exposure under these arrangements is unknown as this would be dependent on future claims that may be made against the Fund. The risk of material loss from such claims is considered remote.
At the end of the period, FMR or its affiliates were the owners of record of 32% of the total outstanding shares of the Fund.
Annual Report
To the Trustees of Fidelity Investment Trust and Shareholders of Fidelity Emerging Markets Discovery Fund and Fidelity Total Emerging Markets Fund:
In our opinion, the accompanying statements of assets and liabilities, including the schedules of investments, and the related statements of operations and of changes in net assets and the financial highlights present fairly, in all material respects, the financial positions of Fidelity Emerging Markets Discovery Fund and Fidelity Total Emerging Markets Fund at October 31, 2012, the results of each of their operations for the year then ended, the changes in each of their net assets for the period indicated and the financial highlights for the period indicated, in conformity with accounting principles generally accepted in the United States of America. These financial statements and financial highlights (hereafter referred to as "financial statements") are the responsibility of the Fidelity Emerging Markets Discovery Fund's and Fidelity Total Emerging Markets Fund's management. Our responsibility is to express an opinion on these financial statements based on our audits. We conducted our audits of these financial statements in accordance with the standards of the Public Company Accounting Oversight Board (United States). Those standards require that we plan and perform the audit to obtain reasonable assurance about whether the financial statements are free of material misstatement. An audit includes examining, on a test basis, evidence supporting the amounts and disclosures in the financial statements, assessing the accounting principles used and significant estimates made by management, and evaluating the overall financial statement presentation. We believe that our audits, which included confirmation of securities at October 31, 2012 by correspondence with the custodian and brokers, provide a reasonable basis for our opinion.
PricewaterhouseCoopers LLP
Boston, Massachusetts
December 17, 2012
Annual Report
The Trustees, Members of the Advisory Board, and executive officers of the trust and funds, as applicable, are listed below. The Board of Trustees governs each fund and is responsible for protecting the interests of shareholders. The Trustees are experienced executives who meet periodically throughout the year to oversee each fund's activities, review contractual arrangements with companies that provide services to each fund, oversee management of the risks associated with such activities and contractual arrangements, and review each fund's performance. Except for James C. Curvey, each of the Trustees oversees 236 funds advised by FMR or an affiliate. Mr. Curvey oversees 443 funds advised by FMR or an affiliate.
The Trustees hold office without limit in time except that (a) any Trustee may resign; (b) any Trustee may be removed by written instrument, signed by at least two-thirds of the number of Trustees prior to such removal; (c) any Trustee who requests to be retired or who has become incapacitated by illness or injury may be retired by written instrument signed by a majority of the other Trustees; and (d) any Trustee may be removed at any special meeting of shareholders by a two-thirds vote of the outstanding voting securities of the trust. Each Trustee who is not an interested person (as defined in the 1940 Act) (Independent Trustee), shall retire not later than the last day of the calendar year in which his or her 75th birthday occurs. The Independent Trustees may waive this mandatory retirement age policy with respect to individual Trustees. The executive officers and Advisory Board Members hold office without limit in time, except that any officer and Advisory Board Member may resign or may be removed by a vote of a majority of the Trustees at any regular meeting or any special meeting of the Trustees. Except as indicated, each individual has held the office shown or other offices in the same company for the past five years.
Experience, Skills, Attributes, and Qualifications of the Funds' Trustees. The Governance and Nominating Committee has adopted a statement of policy that describes the experience, qualifications, attributes, and skills that are necessary and desirable for potential Independent Trustee candidates (Statement of Policy). The Board believes that each Trustee satisfied at the time he or she was initially elected or appointed a Trustee, and continues to satisfy, the standards contemplated by the Statement of Policy. The Governance and Nominating Committee also engages professional search firms to help identify potential Independent Trustee candidates who have the experience, qualifications, attributes, and skills consistent with the Statement of Policy. From time to time, additional criteria based on the composition and skills of the current Independent Trustees, as well as experience or skills that may be appropriate in light of future changes to board composition, business conditions, and regulatory or other developments, have also been considered by the professional search firms and the Governance and Nominating Committee. In addition, the Board takes into account the Trustees' commitment and participation in Board and committee meetings, as well as their leadership of standing and ad hoc committees throughout their tenure.
In determining that a particular Trustee was and continues to be qualified to serve as a Trustee, the Board has considered a variety of criteria, none of which, in isolation, was controlling. The Board believes that, collectively, the Trustees have balanced and diverse experience, qualifications, attributes, and skills, which allow the Board to operate effectively in governing each fund and protecting the interests of shareholders. Information about the specific experience, skills, attributes, and qualifications of each Trustee, which in each case led to the Board's conclusion that the Trustee should serve (or continue to serve) as a trustee of the funds, is provided below.
Annual Report
Trustees and Officers - continued
Board Structure and Oversight Function. James C. Curvey is an interested person (as defined in the 1940 Act) and currently serves as Chairman. The Trustees have determined that an interested Chairman is appropriate and benefits shareholders because an interested Chairman has a personal and professional stake in the quality and continuity of services provided to the funds. Independent Trustees exercise their informed business judgment to appoint an individual of their choosing to serve as Chairman, regardless of whether the Trustee happens to be independent or a member of management. The Independent Trustees have determined that they can act independently and effectively without having an Independent Trustee serve as Chairman and that a key structural component for assuring that they are in a position to do so is for the Independent Trustees to constitute a substantial majority for the Board. The Independent Trustees also regularly meet in executive session. Ned C. Lautenbach serves as Chairman of the Independent Trustees and as such (i) acts as a liaison between the Independent Trustees and management with respect to matters important to the Independent Trustees and (ii) with management prepares agendas for Board meetings.
Fidelity funds are overseen by different Boards of Trustees. The funds' Board oversees Fidelity's equity and high income funds and another Board oversees Fidelity's investment-grade bond, money market, and asset allocation funds. The asset allocation funds may invest in Fidelity funds overseen by the funds' Board. The use of separate Boards, each with its own committee structure, allows the Trustees of each group of Fidelity funds to focus on the unique issues of the funds they oversee, including common research, investment, and operational issues. On occasion, the separate Boards establish joint committees to address issues of overlapping consequences for the Fidelity funds overseen by each Board.
The Trustees operate using a system of committees to facilitate the timely and efficient consideration of all matters of importance to the Trustees, each fund, and fund shareholders and to facilitate compliance with legal and regulatory requirements and oversight of the funds' activities and associated risks. The Board, acting through its committees, has charged FMR and its affiliates with (i) identifying events or circumstances the occurrence of which could have demonstrably adverse effects on the funds' business and/or reputation; (ii) implementing processes and controls to lessen the possibility that such events or circumstances occur or to mitigate the effects of such events or circumstances if they do occur; and (iii) creating and maintaining a system designed to evaluate continuously business and market conditions in order to facilitate the identification and implementation processes described in (i) and (ii) above. Because the day-to-day operations and activities of the funds are carried out by or through FMR, its affiliates and other service providers, the funds' exposure to risks is mitigated but not eliminated by the processes overseen by the Trustees. While each of the Board's committees has responsibility for overseeing different aspects of the funds' activities, oversight is exercised primarily through the Operations, Audit, and Compliance Committees. In addition, the Independent Trustees have worked with FMR to enhance the Board's oversight of investment and financial risks, legal and regulatory risks, technology risks, and operational risks, including the development of additional risk reporting to the Board. For example, a working group comprised of Independent Trustees and FMR has worked and continues to work to review the Fidelity funds' valuation-related activities, reporting and risk management. Appropriate personnel, including but not limited to the funds' Chief Compliance Officer (CCO), FMR's internal auditor, the independent accountants, the funds' Treasurer and portfolio management personnel, make periodic reports to the Board's committees, as appropriate, including an annual review of FMR's risk management program for the Fidelity funds. The responsibilities of each standing committee, including their oversight responsibilities, are described further under "Standing Committees of the Funds' Trustees."
Annual Report
The funds' Statement of Additional Information (SAI) includes more information about the Trustees. To request a free copy, call Fidelity at 1-800-544-8544.
Interested Trustees*:
Correspondence intended for each Trustee who is an interested person may be sent to Fidelity Investments, 82 Devonshire Street, Boston, Massachusetts 02109.
Name, Age; Principal Occupations and Other Relevant Experience+ |
James C. Curvey (77) |
| Year of Election or Appointment: 2007 Mr. Curvey is Trustee and Chairman of the Board of Trustees of certain Trusts. Mr. Curvey also serves as Trustee (2007-present) of other investment companies advised by FMR. Mr. Curvey is a Director of Fidelity Investments Money Management, Inc. (2009-present), Director of Fidelity Research & Analysis Co. (2009-present) and Director of FMR and FMR Co., Inc. (2007-present). Mr. Curvey is also Vice Chairman (2007-present) and Director of FMR LLC. In addition, Mr. Curvey serves as an Overseer for the Boston Symphony Orchestra and a member of the Trustees of Villanova University. Previously, Mr. Curvey was the Vice Chairman (2006-2007) and Director (2000-2007) of FMR Corp. |
Ronald P. O'Hanley (55) |
| Year of Election or Appointment: 2011 Mr. O'Hanley is Director of FMR Co., Inc. (2010-present), Director of Fidelity Investments Money Management, Inc. (2010-present), Director of Fidelity Research & Analysis Company (2010-present), President of Fidelity Asset Management and Corporate Services and a member of Fidelity's Executive Committee (2010-present). Previously, Mr. O'Hanley served as President and Chief Executive Officer of BNY Mellon Asset Management (2007-2010). Mr. O'Hanley also served as Vice Chairman of Bank New York Mellon Corp. and a member of that firm's Executive Committee. Prior to the 2007 merger of The Bank of New York and Mellon Financial Corporation, he was Vice Chairman of Mellon Financial Corporation and President and Chief Executive Officer of Mellon Asset Management. He joined Mellon in February 1997. Mr. O'Hanley currently serves as Chairman of the Boston Public Library Foundation Board of Directors and sits on the Board of Directors of Beth Israel Deaconess Medical Center, the Board of Trustees of the Marine Biological Laboratory and the Advisory Board of the Maxwell School of Citizenship and Public Administration at Syracuse University. Mr. O'Hanley also chairs the Council on Asset Management for the Financial Services Roundtable and is a member of the Board of Directors of Institutional Investor's U.S. Institute. |
* Trustees have been determined to be "Interested Trustees" by virtue of, among other things, their affiliation with the trust or various entities under common control with FMR.
+ The information above includes each Trustee's principal occupation during the last five years and other information relating to the experience, attributes, and skills relevant to each Trustee's qualifications to serve as a Trustee, which led to the conclusion that each Trustee should serve as a Trustee for each fund.
Annual Report
Independent Trustees:
Correspondence intended for each Independent Trustee (that is, the Trustees other than the Interested Trustees) may be sent to Fidelity Investments, P.O. Box 55235, Boston, Massachusetts 02205-5235.
Name, Age; Principal Occupations and Other Relevant Experience+ |
Dennis J. Dirks (64) |
| Year of Election or Appointment: 2005 Prior to his retirement in May 2003, Mr. Dirks was Chief Operating Officer and a member of the Board of The Depository Trust & Clearing Corporation (DTCC). He also served as President, Chief Operating Officer, and Board member of The Depository Trust Company (DTC) and President and Board member of the National Securities Clearing Corporation (NSCC). In addition, Mr. Dirks served as Chief Executive Officer and Board member of the Government Securities Clearing Corporation, Chief Executive Officer and Board member of the Mortgage-Backed Securities Clearing Corporation, as a Trustee and a member of the Finance Committee of Manhattan College (2005-2008), and as a Trustee and a member of the Finance Committee of AHRC of Nassau County (2006-2008). Mr. Dirks is a member of the Independent Directors Council (IDC) Governing Council (2010-present) and Board of Directors for The Brookville Center for Children's Services, Inc. (2009-present). |
Alan J. Lacy (59) |
| Year of Election or Appointment: 2008 Mr. Lacy serves as Senior Adviser (2007-present) of Oak Hill Capital Partners, L.P. (private equity). Mr. Lacy also served as Chief Executive Officer (2000-2005) and Vice Chairman (2005-2006) of Sears Holdings Corporation and Sears, Roebuck and Co. (retail). In addition, Mr. Lacy serves as a member of the Board of Directors of Dave & Buster's Entertainment, Inc. (restaurant and entertainment complexes, 2010-present), Earth Fare, Inc. (retail grocery, 2012-present), The Hillman Companies, Inc. (hardware wholesalers, 2010-present), and Bristol-Myers Squibb Company (global pharmaceuticals, 2008-present). Mr. Lacy is a member of the Board of Trustees of The National Parks Conservation Association (2006-present). Previously, Mr. Lacy served as Chairman of the Board of Trustees of the National Parks Conservation Association (2008-2011) and as a member of the Board of Directors for the Western Union Company (global money transfer, 2006-2011). |
Ned C. Lautenbach (68) |
| Year of Election or Appointment: 2000 Mr. Lautenbach is Chairman of the Independent Trustees of the Equity and High Income Funds (2006-present). Mr. Lautenbach currently serves as the Lead Director of the Eaton Corporation Board of Directors (diversified industrial, 1997-present). Mr. Lautenbach is Chairman of the Board of Directors of the Philharmonic Center for the Arts in Naples, Florida (2012-present) and a member of the Council on Foreign Relations (1994-present). Previously, Mr. Lautenbach was a Partner/Advisory Partner at Clayton, Dubilier & Rice, LLC (private equity investment, 1998-2010), as well as a Director of Sony Corporation (2006-2007). |
Joseph Mauriello (68) |
| Year of Election or Appointment: 2008 Prior to his retirement in January 2006, Mr. Mauriello served in numerous senior management positions including Deputy Chairman and Chief Operating Officer (2004-2005), and Vice Chairman of Financial Services (2002-2004) of KPMG LLP US (professional services, 1965-2005). Mr. Mauriello currently serves as a member of the Board of Directors of XL Group plc. (global insurance and re-insurance, 2006-present). Previously, Mr. Mauriello served as a Director of the Hamilton Funds of the Bank of New York (2006-2007) and of Arcadia Resources Inc. (health care services and products, 2007-2012). |
Robert W. Selander (62) |
| Year of Election or Appointment: 2011 Previously, Mr. Selander served as a Member of the Advisory Board of Fidelity's Equity and High Income Funds (2011), Executive Vice Chairman (2010), Chief Executive Officer (2009-2010), and President and Chief Executive Officer (1997-2009) of Mastercard, Inc. |
Cornelia M. Small (68) |
| Year of Election or Appointment: 2005 Ms. Small is a member of the Board of Directors (2009-present) and Chair of the Investment Committee (2010-present) of the Teagle Foundation. Ms. Small also serves on the Investment Committee of the Berkshire Taconic Community Foundation (2008-present). Previously, Ms. Small served as Chairperson (2002-2008) and a member of the Investment Committee and Chairperson (2008-2012) and a member of the Board of Trustees of Smith College. In addition, Ms. Small served as Chief Investment Officer, Director of Global Equity Investments, and a member of the Board of Directors of Scudder, Stevens & Clark and Scudder Kemper Investments. |
William S. Stavropoulos (73) |
| Year of Election or Appointment: 2001 Mr. Stavropoulos is Vice Chairman of the Independent Trustees of the Equity and High Income Funds (2006-present). Mr. Stavropoulos serves as President and Founder of the Michigan Baseball Foundation, the Great Lakes Loons (2007-present). Mr. Stavropoulos is Chairman Emeritus of the Board of Directors of The Dow Chemical Company, where he previously served in numerous senior management positions, including President, CEO (1995-2000; 2002-2004), Chairman of the Executive Committee (2000-2006), and as a member of the Board of Directors (1990-2006). Currently, Mr. Stavropoulos is a Director of Univar Inc. (global distributor of commodity and specialty chemicals, Chairman from 2010-May 2012 and Lead Director from May 2012-present), Teradata Corporation (data warehousing and technology solutions, 2008-present), Maersk Inc. (industrial conglomerate), and Tyco International, Ltd. (multinational manufacturing and services, 2007-present), and a member of the Advisory Board for Metalmark Capital LLC (private equity investment, 2005-present). Mr. Stavropoulos is an operating advisor to Clayton, Dubilier & Rice, LLC (private equity investment). In addition, Mr. Stavropoulos is a member of the University of Notre Dame Advisory Council for the College of Science, a Trustee of the Rollin L. Gerstacker Foundation, and a Director of the Naples Philharmonic Center for the Arts. Previously, Mr. Stavropoulos served as a Director of Chemical Financial Corporation (bank holding company, 1993-2012). |
David M. Thomas (63) |
| Year of Election or Appointment: 2008 Previously, Mr. Thomas served as Executive Chairman (2005-2006) and Chairman and Chief Executive Officer (2000-2005) of IMS Health, Inc. (pharmaceutical and healthcare information solutions), and a Director of Fortune Brands, Inc. (consumer products, 2000-2011). In addition, Mr. Thomas serves as Non-Executive Chairman of the Board of Directors of Fortune Brands Home and Security (home and security products, 2011-present), and as a member of the Board of Directors of Interpublic Group of Companies, Inc. (marketing communication, 2004-present). |
Michael E. Wiley (62) |
| Year of Election or Appointment: 2008 Mr. Wiley also serves as a Director of Asia Pacific Exploration Consolidated (international oil and gas exploration and production, 2008-present). Mr. Wiley serves as a Director of Tesoro Corporation (independent oil refiner and marketer, 2005-present), and a Director of Bill Barrett Corporation (exploration and production, 2005-present). In addition, Mr. Wiley also serves as a Director of Post Oak Bank (privately-held bank, 2004-present). Previously, Mr. Wiley served as a member of the Board of Trustees of the University of Tulsa (2000-2006; 2007-2010), as a Senior Energy Advisor of Katzenbach Partners, LLC (consulting, 2006-2007), as an Advisory Director of Riverstone Holdings (private investment), Chairman, President, and CEO of Baker Hughes, Inc. (oilfield services, 2000-2004), and as Director of Spinnaker Exploration Company (exploration and production, 2001-2005). |
+ The information above includes each Trustee's principal occupation during the last five years and other information relating to the experience, attributes, and skills relevant to each Trustee's qualifications to serve as a Trustee, which led to the conclusion that each Trustee should serve as a Trustee for each fund.
Advisory Board Members and Executive Officers:
Correspondence intended for David A. Rosow and Garnett A. Smith may be sent to Fidelity Investments, P.O. Box 55235, Boston, Massachusetts 02205-5235. Correspondence intended for each executive officer, Edward C. Johnson 3d, and Peter S. Lynch may be sent to Fidelity Investments, 82 Devonshire Street, Boston, Massachusetts 02109.
Name, Age; Principal Occupation |
Edward C. Johnson 3d (82) |
| Year of Election or Appointment: 2011 Member of the Advisory Board of Fidelity's Equity and High Income Funds. Mr. Johnson serves as Chief Executive Officer, Chairman, and a Director of FMR LLC, and also serves as Chairman and Director of FIL Limited. Previously, Mr. Johnson served as a Trustee and Chairman of the Board of certain Fidelity Trusts, Chairman and a Director of FMR, Chairman and a Director of FMR Co., Inc., and President of FMR LLC (2006-2007). |
Peter S. Lynch (68) |
| Year of Election or Appointment: 2003 Member of the Advisory Board of Fidelity's Equity and High Income Funds. Mr. Lynch is Vice Chairman and a Director of FMR and FMR Co., Inc. In addition, Mr. Lynch serves as a Trustee of Boston College and as the Chairman of the Inner-City Scholarship Fund. Previously, Mr. Lynch served on the Special Olympics International Board of Directors (1997-2006). |
David A. Rosow (70) |
| Year of Election or Appointment: 2012 Member of the Advisory Board of Fidelity's Equity and High Income Funds. Chairman and Chief Executive Officer of International Golf Group, Inc. (golf course development, 1989-present). Previously, Mr. Rosow served as Chairman and Chief Executive Officer of Rosow & Company, Inc. (private investment company, 1989-2011), a Lead Director of Hudson United Bancorp (2001-2006) and as a Director of TD Banknorth (1996-2006). In addition, Mr. Rosow is a member (2008-present) and President (2009-present) of the Town Council of Palm Beach, Florida. |
Garnett A. Smith (65) |
| Year of Election or Appointment: 2012 Member of the Advisory Board of Fidelity's Equity and High Income Funds. Prior to Mr. Smith's retirement, he served as Chairman and Chief Executive Officer of Inbrand Corp. (manufacturer of personal absorbent products, 1990-1997). He also served as President (1986-1990) of Inbrand Corp. Prior to his employment with Inbrand Corp., he was employed by a retail fabric chain and North Carolina National Bank. In addition, Mr. Smith is a board member of the Jackson Hole Land Trust (2009-present). |
Kenneth B. Robins (43) |
| Year of Election or Appointment: 2008 President and Treasurer of Fidelity's Equity and High Income Funds. Mr. Robins also serves as President and Treasurer (2010-present) and Assistant Treasurer (2009-present) of other Fidelity funds and is an employee of Fidelity Investments (2004-present). Previously, Mr. Robins served as Deputy Treasurer of the Fidelity funds (2005-2008) and Treasurer and Chief Financial Officer of The North Carolina Capital Management Trust: Cash and Term Portfolios (2006-2008). |
Bruce T. Herring (47) |
| Year of Election or Appointment: 2006 Vice President of certain Equity Funds. Mr. Herring also serves as President of Fidelity Research & Analysis Company (2010-present), Chief Investment Officer and Director of Fidelity Management & Research (U.K.) Inc. (2010-present) and Group Chief Investment Officer of FMR. Previously, Mr. Herring served as Vice President (2005-2006) and Senior Vice President (2006-2007) of Fidelity Management & Research Company, Vice President of FMR Co., Inc. (2001-2007) and as a portfolio manager for Fidelity U.S. Equity Funds. |
Brian B. Hogan (48) |
| Year of Election or Appointment: 2009 Vice President of Equity and High Income Funds. Mr. Hogan also serves as President of FMR's Equity Division (2009-present). Previously, Mr. Hogan served as Senior Vice President, Equity Research of FMR (2006-2009) and as a portfolio manager. |
Scott C. Goebel (44) |
| Year of Election or Appointment: 2008 Secretary and Chief Legal Officer (CLO) of the Fidelity funds. Mr. Goebel also serves as Secretary of Fidelity Investments Money Management, Inc. (FIMM) (2010-present) and Fidelity Research and Analysis Company (FRAC) (2010-present); Secretary and CLO of The North Carolina Capital Management Trust: Cash and Term Portfolios (2008-present); General Counsel, Secretary, and Senior Vice President of FMR (2008-present) and FMR Co., Inc. (2008-present); employed by FMR LLC or an affiliate (2001-present); Chief Legal Officer of Fidelity Management & Research (Hong Kong) Limited (2008-present) and Assistant Secretary of Fidelity Management & Research (Japan) Inc. (2008-present), and Fidelity Management & Research (U.K.) Inc. (2008-present). Previously, Mr. Goebel served as Assistant Secretary of FIMM (2008-2010), FRAC (2008-2010), and the Funds (2007-2008) and as Vice President and Secretary of Fidelity Distributors Corporation (FDC) (2005-2007). |
William C. Coffey (43) |
| Year of Election or Appointment: 2009 Assistant Secretary of Fidelity's Equity and High Income Funds. Mr. Coffey also serves as Senior Vice President and Deputy General Counsel of FMR LLC (2010-present), and is an employee of Fidelity Investments. Previously, Mr. Coffey served as Vice President and Associate General Counsel of FMR LLC (2005-2009). |
Elizabeth Paige Baumann (44) |
| Year of Election or Appointment: 2012 Anti-Money Laundering (AML) Officer of the Fidelity funds. Ms. Baumann also serves as AML Officer of The North Carolina Capital Management Trust: Cash and Term Portfolios (2012-present), Chief AML Officer of FMR LLC (2012-present), and is an employee of Fidelity Investments. Previously, Ms. Baumann served as Vice President and Deputy Anti-Money Laundering Officer (2007-2012). |
Christine Reynolds (54) |
| Year of Election or Appointment: 2008 Chief Financial Officer of the Fidelity funds. Ms. Reynolds became President of Fidelity Pricing and Cash Management Services (FPCMS) in August 2008. Ms. Reynolds served as Chief Operating Officer of FPCMS (2007-2008). Previously, Ms. Reynolds served as President, Treasurer, and Anti-Money Laundering officer of the Fidelity funds (2004-2007). |
Joseph A. Hanlon (44) |
| Year of Election or Appointment: 2012 Chief Compliance Officer of Fidelity's Equity and High Income Funds. Mr. Hanlon serves as Compliance Officer of FMR, FMR Co., Inc., Fidelity Investments Money Management, Inc. (FIMM), Fidelity Research and Analysis Company (FRAC), Fidelity Management & Research (Japan) Inc., Fidelity Management & Research (U.K.) Inc., Fidelity Management & Research (Hong Kong), and Strategic Advisers, Inc. (2009-present), as Senior Vice President of the Fidelity Asset Management Division (2009-present), and is an employee of Fidelity Investments. |
Joseph F. Zambello (55) |
| Year of Election or Appointment: 2011 Deputy Treasurer of the Fidelity funds. Mr. Zambello is an employee of Fidelity Investments. Previously, Mr. Zambello served as Vice President of FMR's Program Management Group (2009-2011) and Vice President of the Transfer Agent Oversight Group (2005-2009). |
Adrien E. Deberghes (45) |
| Year of Election or Appointment: 2008 Deputy Treasurer of Fidelity's Equity and High Income Funds. Mr. Deberghes also serves as Vice President (2011-present) and Assistant Treasurer (2010-present) of other Fidelity funds, and is an employee of Fidelity Investments (2008-present). Previously, Mr. Deberghes served as Senior Vice President of Mutual Fund Administration at State Street Corporation (2007-2008), Senior Director of Mutual Fund Administration at Investors Bank & Trust (2005-2007), and Director of Finance for Dunkin' Brands (2000-2005). |
Stephen Sadoski (41) |
| Year of Election or Appointment: 2012 Deputy Treasurer of Fidelity's Equity and High Income Funds. Mr. Sadoski also serves as Assistant Treasurer of other Fidelity funds (2012-present) and is an employee of Fidelity Investments (2012-present). Previously, Mr. Sadoski served as an assistant chief accountant in the Division of Investment Management of the Securities and Exchange Commission (SEC) (2009-2012) and as a senior manager at Deloitte & Touche (1997-2009). |
Stephanie J. Dorsey (43) |
| Year of Election or Appointment: 2010 Assistant Treasurer of Fidelity's Equity and High Income Funds. Ms. Dorsey also serves as Deputy Treasurer of other Fidelity funds (2008-present) and is an employee of Fidelity Investments (2008-present). Previously, Ms. Dorsey served as Treasurer (2004-2008) of the JPMorgan Mutual Funds and Vice President (2004-2008) of JPMorgan Chase Bank. |
John R. Hebble (54) |
| Year of Election or Appointment: 2009 Assistant Treasurer of Fidelity's Equity and High Income Funds. Mr. Hebble also serves as President (2011-present), Treasurer, and Chief Financial Officer of The North Carolina Capital Management Trust: Cash and Term Portfolios (2008-present), President and Treasurer of other Fidelity funds (2008-present) and is an employee of Fidelity Investments. |
Gary W. Ryan (54) |
| Year of Election or Appointment: 2005 Assistant Treasurer of the Fidelity funds. Mr. Ryan is an employee of Fidelity Investments. Previously, Mr. Ryan served as Vice President of Fund Reporting in Fidelity Pricing and Cash Management Services (FPCMS) (1999-2005). |
Jonathan Davis (44) |
| Year of Election or Appointment: 2010 Assistant Treasurer of the Fidelity funds. Mr. Davis is also Assistant Treasurer of Fidelity Rutland Square Trust II and Fidelity Commonwealth Trust II. Mr. Davis is an employee of Fidelity Investments. Previously, Mr. Davis served as Vice President and Associate General Counsel of FMR LLC (2003-2010). |
Annual Report
The Board of Trustees of each fund voted to pay to shareholders of record at the opening of business on record date, the following distributions per share derived from capital gains realized from sales of portfolio securities and dividends derived from net investment income:
| Pay Date | Record Date | Dividends | Capital Gains |
Emerging Markets Discovery | 12/10/12 | 12/07/12 | $0.059 | $0.203 |
Total Emerging Markets | 12/10/12 | 12/07/12 | $0.169 | $0.014 |
A percentage of the dividends distributed during the fiscal year for the following funds may be taken into account as a dividend for purposes of the maximum rate under section 1(h)(11) of the Internal Revenue Code:
Emerging Markets Discovery | |
December 23, 2011 | 100% |
Total Emerging Markets | |
December 23, 2011 | 48% |
December 29, 2011 | 50% |
The amounts per share which represent income derived from sources within, and taxes paid to, foreign countries or possessions of the United States are as follows:
| Pay Date | Income | Taxes |
Emerging Markets Discovery | 12/23/11 | $0.015 | $0.0033 |
| Pay Date | Income | Taxes |
Total Emerging Markets | 12/23/11
12/29/11 | $0.014
$0.008 | $0.0009
$0.0000 |
The funds will notify shareholders in January 2013 of amounts for use in preparing 2012 income tax returns.
Annual Report
Board Approval of Investment Advisory Contracts and Management Fees
Fidelity Emerging Markets Discovery Fund
Fidelity Total Emerging Markets Fund
Each year, the Board of Trustees, including the Independent Trustees (together, the Board), votes on the renewal of the management contract and sub-advisory agreements (together, the Advisory Contracts) for each fund. The Board, assisted by the advice of fund counsel and Independent Trustees' counsel, requests and considers a broad range of information relevant to the renewal of the Advisory Contracts throughout the year.
The Board meets regularly and, at each of its meetings, considers factors that are relevant to its annual consideration of the renewal of each fund's Advisory Contracts, including the services and support provided to each fund and its shareholders. The Board has established various standing committees, each composed of and chaired by Independent Trustees with varying backgrounds, to which the Board has assigned specific subject matter responsibilities in order to enhance effective decision-making by the Board. The Board, acting directly and through its Committees, requests and receives information concerning the annual consideration of the renewal of each fund's Advisory Contracts. The Board also meets as needed to consider matters specifically related to the Board's annual consideration of the renewal of Advisory Contracts. Members of the Board may also meet with trustees of other Fidelity funds through ad hoc joint committees to discuss certain matters relevant to the Fidelity funds.
At its July 2012 meeting, the Board of Trustees, including the Independent Trustees, unanimously determined to renew each fund's Advisory Contracts. In reaching its determination, the Board considered all factors it believed relevant, including (i) the nature, extent, and quality of the services to be provided to each fund and its shareholders (including the investment performance of each fund); (ii) the competitiveness of each fund's management fee and total expense ratio relative to peer funds; (iii) the total costs of the services to be provided by and the profits to be realized by Fidelity from its relationship with each fund; (iv) the extent to which economies of scale exist and would be realized as each fund grows; and (v) whether fee levels reflect these economies of scale, if any, for the benefit of fund shareholders.
In considering whether to renew the Advisory Contracts for each fund, the Board reached a determination, with the assistance of fund counsel and Independent Trustees' counsel and through the exercise of its business judgment, that the renewal of the Advisory Contracts is in the best interests of each fund and its shareholders and that the compensation payable under the Advisory Contracts is fair and reasonable. The Board's decision to renew the Advisory Contracts was not based on any single factor, but rather was based on a comprehensive consideration of all the information provided to the Board at its meetings throughout the year. The Board, in reaching its determination to renew the Advisory Contracts, is aware that shareholders in each fund have a broad range of investment choices available to them, including a wide choice among mutual funds offered by Fidelity's competitors, and that each fund's shareholders, who have the opportunity to review and weigh the disclosure provided by the fund in its prospectus and other public disclosures, have chosen to invest in that fund, managed by Fidelity.
Annual Report
Nature, Extent, and Quality of Services Provided. The Board considered the staffing within the investment adviser, FMR, and the sub-advisers (together, the Investment Advisers), including the backgrounds of the funds' investment personnel, and also considered the funds' investment objectives, strategies, and related investment philosophies. The Independent Trustees also had discussions with senior management of Fidelity's investment operations and investment groups. The Board considered the structure of the portfolio manager compensation program and whether this structure provides appropriate incentives to act in the best interests of each fund.
Resources Dedicated to Investment Management and Support Services. The Board and the Fund Oversight and Research Committees reviewed the general qualifications and capabilities of the Investment Advisers' investment staff, including its size, education, experience, and resources, as well as the Investment Advisers' approach to recruiting, training, managing, and compensating investment personnel. The Board also noted that FMR has continued to increase the resources devoted to non-U.S. offices, including expansion of Fidelity's global investment organization. The Board noted that Fidelity's analysts have extensive resources, tools and capabilities that allow them to conduct sophisticated quantitative and fundamental analysis, as well as credit analysis of issuers, counterparties and guarantors. The Board also believes that Fidelity's investment professionals have sufficient access to global information and data so as to provide competitive investment results over time, and that those professionals also have access to sophisticated tools that permit them to assess portfolio construction and risk and performance attribution characteristics continuously, as well as to transmit new information and research conclusions rapidly around the world. Additionally, in its deliberations, the Board considered the Investment Advisers' trading and risk management capabilities and resources, which are an integral part of the investment management process.
Shareholder and Administrative Services. The Board considered (i) the nature, extent, quality, and cost of advisory, administrative, and shareholder services performed by the Investment Advisers and their affiliates under the Advisory Contracts and under separate agreements covering transfer agency, pricing and bookkeeping, and securities lending services for each fund; (ii) the nature and extent of the supervision of third party service providers, principally custodians and subcustodians; and (iii) the resources devoted to, and the record of compliance with, each fund's compliance policies and procedures. The Board also reviewed the allocation of fund brokerage, including allocations to brokers affiliated with the Investment Advisers, the use of brokerage commissions to pay fund expenses, and the use of "soft" commission dollars to pay for research services.
Annual Report
Board Approval of Investment Advisory Contracts and
Management Fees - continued
The Board noted that the growth of fund assets over time across the complex allows Fidelity to reinvest in the development of services designed to enhance the value or convenience of the Fidelity funds as investment vehicles. These services include 24-hour access to account information and market information through telephone representatives and over the Internet, investor education materials and asset allocation tools, and the expanded availability of Fidelity Investor Centers.
Investment in a Large Fund Family. The Board considered the benefits to shareholders of investing in a Fidelity fund, including the benefits of investing in a fund that is part of a large family of funds offering a variety of investment disciplines and providing a large variety of mutual fund investor services. The Board noted that Fidelity had taken, or had made recommendations that resulted in the Fidelity funds taking, a number of actions over the previous year that benefited particular funds, including (i) continuing to dedicate additional resources to investment research and support of the senior management team that oversees asset management; (ii) persisting in efforts to enhance Fidelity's research capabilities, in particular, international research; (iii) launching new funds and making other enhancements to meet client needs for global and income-oriented solutions; (iv) continuing to launch dedicated lower cost underlying funds to meet investment management's portfolio construction needs related to expanding underlying fund options, specifically for the Freedom Fund product lines; (v) adopting a "Stock Selector" sector neutral investment approach and employing a team of portfolio managers who are sector specialists to manage certain funds; (vi) rationalizing product lines and gaining increased efficiencies through the mergers of several funds into other funds; (vii) strengthening the Spartan Index Fund product line by adding new funds and/or new low-cost institutional share classes, restructuring fund expenses to accommodate new classes, and reducing investment minimums for certain classes of shares; (viii) modifying the eligibility criteria for Institutional Class shares to increase their appeal to government entities and charitable investors; and (ix) reducing certain transfer agent fee rates.
Investment Performance. The Board considered whether each fund has operated in accordance with its investment objective, as well as its record of compliance with its investment restrictions. As each fund recently commenced operations the Board did not believe that it was appropriate to assign significant weight to its limited investment performance.
Based on its review, the Board concluded that the nature, extent, and quality of services provided to each fund under the Advisory Contracts should benefit each fund's shareholders.
Competitiveness of Management Fee and Total Expense Ratio. The Board considered each fund's management fee and total expense ratio compared to "mapped groups" of competitive funds and classes. Fidelity creates "mapped groups" by combining similar Lipper investment objective categories that have comparable management fee characteristics. Combining Lipper investment objective categories aids the Board's management fee and total expense ratio comparisons by broadening the competitive group used for comparison and by reducing the number of universes to which various Fidelity funds are compared.
Annual Report
Management Fee. The Board considered two proprietary management fee comparisons for the period of each fund's operation shown in the charts below. The group of Lipper funds used by the Board for management fee comparisons is referred to below as the "Total Mapped Group." The Total Mapped Group comparison focuses on a fund's standing relative to the total universe of comparable funds available to investors in terms of gross management fees before expense reimbursements or caps. "TMG %" represents the percentage of funds in the Total Mapped Group that had management fees that were lower than a fund's. For example, a TMG % of 19% would mean that 81% of the funds in the Total Mapped Group had higher management fees than a fund. The "Asset-Size Peer Group" (ASPG) comparison focuses on a fund's standing relative to non-Fidelity funds similar in size to the fund within the Total Mapped Group. The ASPG represents at least 15% of the funds in the Total Mapped Group with comparable asset size and management fee characteristics, subject to a minimum of 50 funds (or all funds in the Total Mapped Group if fewer than 50). Additional information, such as the ASPG quartile in which a fund's management fee ranked, is also included in the charts and considered by the Board.
Fidelity Emerging Markets Discovery Fund

Annual Report
Board Approval of Investment Advisory Contracts and
Management Fees - continued
Fidelity Total Emerging Markets Fund

The Board noted that each fund's management fee ranked below the median of its Total Mapped Group and below the median of its ASPG for the period.
Based on its review, the Board concluded that each fund's management fee is fair and reasonable in light of the services that the fund receives and the other factors considered.
Total Expense Ratio. In its review of the total expense ratio of each class of each fund, the Board considered the fund's management fee as well as other fund or class expenses, as applicable, such as transfer agent fees, pricing and bookkeeping fees, fund-paid 12b-1 fees, and custodial, legal, and audit fees. The Board also noted the effects of any waivers and reimbursements on fees and expenses. As part of its review, the Board also considered the current total expense ratios of each class of each fund compared to competitive fund median expenses. Each class of each fund is compared to those funds and classes in the Total Mapped Group (used by the Board for management fee comparisons) that have a similar sales load structure.
The Board noted that each fund offers multiple classes, each of which has a different sales load and 12b-1 fee structure, and that the multiple structures are intended to offer a range of pricing options for the intermediary market. The Board also noted that the total expense ratios of the classes of each fund vary primarily by the level of their 12b-1 fees, although differences in transfer agent fees may also cause expenses to vary from class to class.
Annual Report
The Board noted that the total expense ratio of each of Class A and the retail class of Fidelity Emerging Markets Discovery Fund ranked below its competitive median for the period and the total expense ratio of each of Class T, Class C, and Institutional Class ranked above its competitive median for the period. The Board considered that various factors, including 12b-1 fees, positive or negative performance adjustments, and relatively higher other expenses in the case of small fund size, can affect total expense ratios. The Board noted that the total expense ratio of Class T was above the competitive median primarily because of higher 12b-1 fees on Class T. Class T has a higher 12b-1 fee, but a lower front-end sales charge, than traditionally priced front-end sales charge classes. The Board considered that Class T is primarily sold load-waived in the retirement plan market where its 0.50% 12b-1 fee is comparable to competing no-load, higher 12b-1 fee classes designed specifically for retirement plans.
The Board further considered that FMR contractually agreed to reimburse Class A, Class T, Class C, Institutional Class and the retail class of Fidelity Emerging Markets Discovery Fund to the extent that total operating expenses (excluding interest, taxes, certain securities lending costs, brokerage commissions, extraordinary expenses, and acquired fund fees and expenses, if any), as a percentage of their respective average net assets, exceed 1.70%, 1.95%, 2.45%, 1.45%, and 1.45% through December 31, 2012.
The Board noted that the total expense ratio of each of Class A and the retail class of Fidelity Total Emerging Markets Fund ranked below its competitive median for the period, the total expense ratio of Class C ranked equal to its competitive median for the period, and the total expense ratio of each of Class T and Institutional Class ranked above its competitive median for the period. The Board considered that various factors, including 12b-1 fees, positive or negative performance adjustments, and relatively higher other expenses in the case of small fund size, can affect total expense ratios. The Board noted that the total expense ratio of Class T was above the competitive median primarily because of higher 12b-1 fees on Class T. Class T has a higher 12b-1 fee, but a lower front-end sales charge, than traditionally priced front-end sales charge classes. The Board considered that Class T is primarily sold load-waived in the retirement plan market where its 0.50% 12b-1 fee is comparable to competing no-load, higher 12b-1 fee classes designed specifically for retirement plans.
The Board further considered that FMR contractually agreed to reimburse Class A, Class T, Class C, Institutional Class, and the retail class of Fidelity Total Emerging Markets Fund to the extent that total operating expenses (excluding interest, taxes, certain securities lending costs, brokerage commissions, extraordinary expenses, and acquired fund fees and expenses, if any), as a percentage of their respective average net assets, exceed 1.65%, 1.90%, 2.40%, 1.40%, and 1.40% through December 31, 2012.
Fees Charged to Other Fidelity Clients. The Board also considered Fidelity fee structures and other information with respect to clients of FMR and its affiliates, such as other mutual funds advised or subadvised by FMR or its affiliates, pension plan clients, and other institutional clients. The Board noted the findings of the 2010 ad hoc joint committee (created with the board of other Fidelity funds), which reviewed and compared Fidelity's institutional investment advisory business with its business of providing services to the Fidelity funds, including the differences in services provided, fees charged, and costs incurred, as well as competition in their respective marketplaces.
Annual Report
Board Approval of Investment Advisory Contracts and
Management Fees - continued
Based on its review of total expense ratios and fees charged to other Fidelity clients, the Board concluded that the total expense ratio of each class of each fund was reasonable, although in some cases above the median of the universe presented for comparison, in light of the services that the fund and its shareholders receive and the other factors considered.
Costs of the Services and Profitability. The Board considered the revenues earned and the expenses incurred by Fidelity in conducting the business of developing, marketing, distributing, managing, administering and servicing each fund and its shareholders. The Board also considered the level of Fidelity's profits in respect of all the Fidelity funds.
On an annual basis, FMR presents to the Board Fidelity's profitability for each fund. Fidelity calculates the profitability for each fund, as well as aggregate profitability for groups of Fidelity funds and all Fidelity funds, using a series of detailed revenue and cost allocation methodologies which originate with the books and records of Fidelity on which Fidelity's audited financial statements are based. The Audit Committee of the Board reviews any significant changes from the prior year's methodologies.
PricewaterhouseCoopers LLP (PwC), independent registered public accounting firm and auditor to Fidelity and certain Fidelity funds, has been engaged annually by the Board as part of the Board's assessment of Fidelity's profitability analysis. PwC's engagement includes the review and assessment of Fidelity's methodologies used in determining the revenues and expenses attributable to Fidelity's mutual fund business, and completion of agreed-upon procedures surrounding the mathematical accuracy of fund profitability and its conformity to allocation methodologies. After considering PwC's reports issued under the engagement and information provided by Fidelity, the Board concluded that while other allocation methods may also be reasonable, Fidelity's profitability methodologies are reasonable in all material respects.
The Board also reviewed Fidelity's non-fund businesses and fall-out benefits related to the mutual fund business as well as cases where Fidelity's affiliates may benefit from or be related to the funds' business.
The Board considered the costs of the services provided by and the profits realized by Fidelity in connection with the operation of each fund and was satisfied that the profitability was not excessive in the circumstances.
Annual Report
Economies of Scale. The Board considered whether there have been economies of scale in respect of the management of the Fidelity funds, whether the Fidelity funds (including each fund) have appropriately benefited from any such economies of scale, and whether there is potential for realization of any further economies of scale. The Board considered the extent to which each fund will benefit from economies of scale through increased services to the fund, through waivers or reimbursements, or through fee or expense reductions. The Board also noted that in 2009, it and the board of other Fidelity funds created an ad hoc committee (the Economies of Scale Committee) to analyze whether FMR attains economies of scale in respect of the management and servicing of the Fidelity funds, whether the Fidelity funds have appropriately benefited from such economies of scale, and whether there is potential for realization of any further economies of scale.
The Board recognized that each fund's management contract incorporates a "group fee" structure, which provides for lower group fee rates as total fund assets under FMR's management increase, and for higher group fee rates as total fund assets under FMR's management decrease. FMR calculates the group fee rates based on a tiered asset "breakpoint" schedule that varies based on asset class. The Board considered that the group fee is designed to deliver the benefits of economies of scale to fund shareholders when total Fidelity fund assets increase, even if assets of any particular fund are unchanged or have declined, because some portion of Fidelity's costs are attributable to services provided to all Fidelity funds, and all funds benefit if those costs can be allocated among more assets. The Board concluded that, given the group fee structure, fund shareholders will benefit from lower management fees as assets under FMR's management increase at the fund complex level, regardless of whether Fidelity achieves any such economies of scale.
The Board concluded, taking into account the analysis of the Economies of Scale Committee, that economies of scale, if any, are being appropriately shared between fund shareholders and Fidelity.
Additional Information Requested by the Board. In order to develop fully the factual basis for consideration of the Fidelity funds' Advisory Contracts, the Board requested and received additional information on certain topics, including (i) fund performance trends, actions to be taken by FMR to improve certain funds' overall performance, and Fidelity's long-term strategies for certain funds; (ii) the potential to further rationalize the Fidelity fund lineup with the possibility of achieving savings for the funds and Fidelity; (iii) Fidelity's compensation structure for portfolio managers and other key investment personnel; (iv) the amount of the investment that each portfolio manager has made in the Fidelity fund(s) that he or she manages; (v) the realization of fall-out benefits in certain Fidelity business units; (vi) Fidelity's group fee structures, the potential impact of regulatory changes on such structures, and the rationale for the individual fee rates of certain funds; (vii) fund profitability methodology, including Fidelity's cost allocation methodology, and the impact of certain factors on fund profitability results; (viii) trends regarding industry use of performance fee structures and the possibility of implementing performance fee structures for additional funds; and (ix) the impact of net redemptions from the Fidelity funds.
Annual Report
Board Approval of Investment Advisory Contracts and
Management Fees - continued
Based on its evaluation of all of the conclusions noted above, and after considering all factors it believed relevant, the Board ultimately concluded that the advisory fee structures are fair and reasonable, and that each fund's Advisory Contracts should be renewed.
Annual Report
Investment Adviser
Fidelity Management &
Research Company
Boston, MA
Investment Sub-Advisers
FMR Co., Inc.
Fidelity Management & Research
(U.K.) Inc.
FIL Investments (Japan) Limited
FIL Investment Advisors
FIL Investment Advisors
(U.K.) Limited
Fidelity Management & Research
(Hong Kong) Limited
Fidelity Management & Research
(Japan) Inc.
General Distributor
Fidelity Distributors Corporation
Smithfield, RI
Transfer and Service Agents
Fidelity Investments Institutional
Operations Company, Inc.
Boston, MA
Fidelity Service Company, Inc.
Boston, MA
Custodian
The Northern Trust Company
Chicago, IL
The Fidelity Telephone Connection
Mutual Fund 24-Hour Service
Exchanges/Redemptions
and Account Assistance 1-800-544-6666
Product Information 1-800-544-6666
Retirement Accounts 1-800-544-4774
(8 a.m. - 9 p.m.)
TDD Service 1-800-544-0118
for the deaf and hearing impaired
(9 a.m. - 9 p.m. Eastern time)
Fidelity Automated Service
Telephone (FAST®) (automated graphic)
1-800-544-5555
(automated graphic)
Automated line for quickest service
(Fidelity Investment logo)(registered trademark)
Corporate Headquarters
82 Devonshire St., Boston, MA 02109
www.fidelity.com
EMD-TEK-UANN-1212
1.931236.100
Fidelity®
Global Equity Income
Fund
Annual Report
October 31, 2012
(Fidelity Cover Art)
Contents
Management's Discussion of Fund Performance | (Click Here) | The Portfolio Manager's review of fund performance and strategy. |
Shareholder Expense Example | (Click Here) | An example of shareholder expenses. |
Investment Summary | (Click Here) | A summary of the fund's holdings. |
Investments | (Click Here) | A complete list of the fund's investments with their market values. |
Financial Statements | (Click Here) | Statements of assets and liabilities, operations, and changes in net assets, as well as financial highlights. |
Notes | (Click Here) | Notes to the financial statements. |
Report of Independent Registered Public Accounting Firm | (Click Here) | |
Trustees and Officers | (Click Here) | |
Distributions | (Click Here) | |
Board Approval of Investment Advisory Contracts and Management Fees | (Click Here) | |
To view a fund's proxy voting guidelines and proxy voting record for the 12-month period ended June 30, visit http://www.fidelity.com/proxyvotingresults or visit the Securities and Exchange Commission's (SEC) web site at http://www.sec.gov. You may also call 1-800-544-8544 to request a free copy of the proxy voting guidelines.
Standard & Poor's, S&P and S&P 500 are registered service marks of The McGraw-Hill Companies, Inc. and have been licensed for use by Fidelity Distributors Corporation.
Other third party marks appearing herein are the property of their respective owners.
All other marks appearing herein are registered or unregistered trademarks or service marks of FMR LLC or an affiliated company. © 2012 FMR LLC. All rights reserved.
Annual Report
This report and the financial statements contained herein are submitted for the general information of the shareholders of the fund. This report is not authorized for distribution to prospective investors in the fund unless preceded or accompanied by an effective prospectus.
A fund files its complete schedule of portfolio holdings with the SEC for the first and third quarters of each fiscal year on Form N-Q. Forms N-Q are available on the SEC's web site at http://www.sec.gov. A fund's Forms N-Q may be reviewed and copied at the SEC's Public Reference Room in Washington, DC. Information regarding the operation of the SEC's Public Reference Room may be obtained by calling 1-800-SEC-0330. For a complete list of a fund's portfolio holdings, view the most recent holdings listing, semiannual report, or annual report on Fidelity's web site at http://www.fidelity.com, http://www.advisor.fidelity.com, or http://www.401k.com, as applicable.
NOT FDIC INSURED • MAY LOSE VALUE • NO BANK GUARANTEE
Neither the fund nor Fidelity Distributors Corporation is a bank.
Annual Report
Market Recap: Global stocks experienced pendulum-like swings during the 12 months ending October 31, 2012, finishing the period with a solid advance. The market faced periodic bouts of volatility this past year, as a number of macroeconomic concerns - including the eurozone debt crisis, the strength and pace of the U.S. economic recovery, and a slowdown in China's once-blistering growth - dominated headlines and weighed on investors. While a stronger U.S. dollar provided an additional head wind for foreign investments, stocks worldwide rose 8.96% for the 12 months, as measured by the MSCI® ACWI® (All Country World Index) Index, largely buttressed in the summer by pledges of accommodative monetary action from eurozone officials, as well as signs that the U.S. housing market was on the mend. Within the index, the U.S. showed the most impressive gain among major markets, advancing 15%, closely followed by Asia-Pacific ex Japan (+10%). A number of core European components, most notably Germany (+11%), Switzerland (+10%) and the U.K. (+9%), benefited from optimism about the eurozone's ability to resolve its debt woes. However, continued weakness in peripheral European markets caused the region to lag the index overall. Elsewhere, results from Canada (+3%) and the generally more volatile emerging markets (+2%) each fell short of the MSCI index, while Japan was among the few benchmark constituents to finish in the red, returning about -3%.
Comments from Ramona Persaud, Portfolio Manager of Fidelity® Global Equity Income Fund: Since its inception on May 2, 2012, through October 31, 2012, the fund returned 2.25%, outperforming the 1.67% gain of the MSCI® ACWI®. Stock selection and sector positioning were equally additive for the period, with the biggest boosts coming from positioning in health care and materials. At the stock level, large-cap pharmaceuticals firm Merck was our top contributor. Merck was trading at what I believed to be a reasonable valuation, but was also benefiting from an improving product pipeline and its continued focus on shareholder friendliness. French pharma firm Sanofi also helped bolster our results within health care, as the stock rebounded off a very cheap valuation. In materials, shares of chemicals company LyondellBassell Industries contributed when cyclical names gained favor later in the period. Conversely, the food/beverage/tobacco industry fell out of favor when the market took a "risk-on" tilt, and our positions here struggled, mainly tobacco stocks Swedish Match, Lorillard and U.K.-based British American Tobacco.
The views expressed above reflect those of the portfolio manager(s) only through the end of the period as stated on the cover of this report and do not necessarily represent the views of Fidelity or any other person in the Fidelity organization. Any such views are subject to change at any time based upon market or other conditions and Fidelity disclaims any responsibility to update such views. These views may not be relied on as investment advice and, because investment decisions for a Fidelity fund are based on numerous factors, may not be relied on as an indication of trading intent on behalf of any Fidelity fund.
Annual Report
Shareholder Expense Example
As a shareholder of the Fund, you incur two types of costs: (1) transaction costs, including redemption fees and (2) ongoing costs, including management fees and other Fund expenses. This Example is intended to help you understand your ongoing costs (in dollars) of investing in the Fund and to compare these costs with the ongoing costs of investing in other mutual funds.
The actual expense Example is based on an investment of $1,000 invested at the beginning of the period and held for the entire period (May 2, 2012 to October 31, 2012). The hypothetical expense Example is based on an investment of $1,000 invested for the one-half year period (May 1, 2012 to October 31, 2012).
Actual Expenses
The first line of the accompanying table provides information about actual account values and actual expenses. You may use the information in this line, together with the amount you invested, to estimate the expenses that you paid over the period. Simply divide your account value by $1,000.00 (for example, an $8,600 account value divided by $1,000.00 = 8.6), then multiply the result by the number in the first line under the heading entitled "Expenses Paid During Period" to estimate the expenses you paid on your account during this period. A small balance maintenance fee of $12.00 that is charged once a year may apply for certain accounts with a value of less than $2,000. This fee is not included in the table below. If it was, the estimate of expenses you paid during the period would be higher, and your ending account value lower, by this amount. In addition, the Fund, as a shareholder in the underlying Fidelity Central Funds, will indirectly bear its pro-rata share of the fees and expenses incurred by the underlying Fidelity Central Funds. These fees and expenses are not included in the Fund's annualized expense ratio used to calculate the expense estimate in the table below.
Hypothetical Example for Comparison Purposes
The second line of the accompanying table provides information about hypothetical account values and hypothetical expenses based on the Fund's actual expense ratio and an assumed rate of return of 5% per year before expenses, which is not the Fund's actual return. The hypothetical account values and expenses may not be used to estimate the actual ending account balance or expenses you paid for the period. You may use this information to compare the ongoing costs of investing in the Fund and other funds. To do so, compare this 5% hypothetical example with the 5% hypothetical examples that appear in the shareholder reports of the other funds. A small balance maintenance fee of $12.00 that is charged once a year may apply for certain accounts with a value of less than $2,000. This fee is not included in the table below. If it was, the estimate of expenses you paid during the period would be higher, and your ending account value lower, by this amount. In addition, the Fund, as a shareholder in the underlying Fidelity Central Funds, will indirectly bear its pro-rata share of the fees and expenses incurred by the underlying Fidelity Central Funds. These fees and expenses are not included in the Fund's annualized expense ratio used to calculate the expense estimate in the table below.
Please note that the expenses shown in the table are meant to highlight your ongoing costs only and do not reflect any transaction costs. Therefore, the second line of the table is useful in comparing ongoing costs only, and will not help you determine the relative total costs of owning different funds. In addition, if these transactional costs were included, your costs would have been higher.
Annual Report
| Annualized
Expense Ratio | Beginning
Account Value | Ending
Account Value
October 31, 2012 | Expenses Paid
During Period |
Actual | 1.20% | $ 1,000.00 | $ 1,022.50 | $ 6.07 A |
Hypothetical (5% return per year before expenses) | | $ 1,000.00 | $ 1,019.10 | $ 6.09 B |
A Actual expenses are equal to the Fund's annualized expense ratio, multiplied by the average account value over the period, multiplied by 183/366 (to reflect the period May 2, 2012 to October 31, 2012).
B Hypothetical expenses are equal to the Fund's annualized expense ratio, multiplied by the average account value over the period, multiplied by 184/366 (to reflect the one-half year period).
Annual Report
Investment Summary (Unaudited)
Geographic Diversification (% of fund's net assets) |
As of October 31, 2012 |
 | United States of America 48.2% | |
 | United Kingdom 14.5% | |
 | Japan 5.5% | |
 | Sweden 3.4% | |
 | Switzerland 3.4% | |
 | France 3.0% | |
 | Brazil 2.2% | |
 | Ireland 2.1% | |
 | Korea (South) 1.9% | |
| Other 15.8% | |

Percentages are based on country or territory of incorporation and are adjusted for the effect of futures contracts, if applicable. |
Asset Allocation |
| % of fund's
net assets |
Stocks | 95.5 |
Short-Term Investments and Net Other Assets (Liabilities) | 4.5 |
Top Ten Stocks as of October 31, 2012 |
| % of fund's
net assets |
Johnson & Johnson (United States of America, Pharmaceuticals) | 2.8 |
Apple, Inc. (United States of America, Computers & Peripherals) | 2.7 |
Merck & Co., Inc. (United States of America, Pharmaceuticals) | 2.4 |
Chevron Corp. (United States of America, Oil, Gas & Consumable Fuels) | 2.4 |
IBM Corp. (United States of America, IT Services) | 2.2 |
Wells Fargo & Co. (United States of America, Commercial Banks) | 2.1 |
Roche Holding AG (participation certificate) (Switzerland, Pharmaceuticals) | 2.0 |
U.S. Bancorp (United States of America, Commercial Banks) | 1.9 |
Vodafone Group PLC (United Kingdom, Wireless Telecommunication Services) | 1.9 |
General Electric Co. (United States of America, Industrial Conglomerates) | 1.8 |
| 22.2 |
Market Sectors as of October 31, 2012 |
| % of fund's
net assets |
Financials | 17.0 |
Consumer Staples | 13.9 |
Health Care | 13.7 |
Energy | 10.0 |
Information Technology | 10.0 |
Consumer Discretionary | 9.3 |
Industrials | 9.2 |
Telecommunication Services | 6.6 |
Utilities | 2.9 |
Materials | 2.7 |
Annual Report
Investments October 31, 2012
Showing Percentage of Net Assets
Common Stocks - 94.7% |
| Shares | | Value |
Australia - 1.2% |
SP AusNet unit | 91,108 | | $ 100,249 |
Spark Infrastructure Group unit | 58,784 | | 103,125 |
Telstra Corp. Ltd. | 28,716 | | 123,408 |
TOTAL AUSTRALIA | | 326,782 |
Bailiwick of Jersey - 1.1% |
Informa PLC | 28,510 | | 184,124 |
Wolseley PLC | 2,700 | | 118,035 |
TOTAL BAILIWICK OF JERSEY | | 302,159 |
Brazil - 2.2% |
Companhia de Bebidas das Americas (AmBev) (PN) sponsored ADR | 2,342 | | 95,530 |
Companhia de Saneamento Basico do Estado de Sao Paulo (SABESP) sponsored ADR | 1,650 | | 138,617 |
Itau Unibanco Holdings SA sponsored ADR | 11,420 | | 166,504 |
Multiplus SA | 8,000 | | 185,874 |
TOTAL BRAZIL | | 586,525 |
Canada - 0.4% |
Fairfax Financial Holdings Ltd. (sub. vtg.) | 302 | | 112,034 |
Cayman Islands - 0.2% |
Pico Far East Holdings Ltd. | 258,000 | | 63,251 |
Chile - 0.5% |
Inversiones La Construccion SA | 7,480 | | 132,142 |
France - 3.0% |
Arkema SA | 1,400 | | 127,640 |
Euler Hermes SA | 1,250 | | 86,162 |
Ipsos SA | 4,100 | | 144,068 |
Sanofi SA | 5,103 | | 448,184 |
TOTAL FRANCE | | 806,054 |
Germany - 0.6% |
Hugo Boss AG | 830 | | 83,084 |
Muehlbauer Holding AG & Co. | 2,941 | | 74,829 |
TOTAL GERMANY | | 157,913 |
Hong Kong - 1.3% |
HKT Trust / HKT Ltd. unit | 377,000 | | 349,757 |
Indonesia - 0.4% |
PT Media Nusantara Citra Tbk | 373,500 | | 109,852 |
Common Stocks - continued |
| Shares | | Value |
Ireland - 2.1% |
Accenture PLC Class A | 5,760 | | $ 388,282 |
CRH PLC | 73 | | 1,359 |
FBD Holdings PLC | 5,820 | | 72,796 |
Irish Continental Group PLC unit | 4,400 | | 107,218 |
TOTAL IRELAND | | 569,655 |
Israel - 1.0% |
Israel Chemicals Ltd. | 13,000 | | 162,682 |
Rami Levi Chain Stores Hashikma Marketing 2006 Ltd. | 3,296 | | 98,193 |
TOTAL ISRAEL | | 260,875 |
Italy - 1.3% |
ENI SpA | 15,300 | | 352,067 |
Japan - 5.5% |
Aozora Bank Ltd. | 24,000 | | 67,644 |
Autobacs Seven Co. Ltd. | 1,600 | | 65,640 |
Canon, Inc. | 3,800 | | 123,499 |
Daito Trust Construction Co. Ltd. | 1,600 | | 161,543 |
Japan Retail Fund Investment Corp. | 76 | | 138,519 |
Japan Tobacco, Inc. | 12,100 | | 334,368 |
Nippon Telegraph & Telephone Corp. | 3,200 | | 146,330 |
Relo Holdings Corp. | 5,500 | | 182,851 |
Seven Bank Ltd. | 60,100 | | 171,650 |
USS Co. Ltd. | 810 | | 85,130 |
TOTAL JAPAN | | 1,477,174 |
Korea (South) - 1.9% |
DGB Financial Group Co. Ltd. | 6,350 | | 80,371 |
KT&G Corp. | 3,188 | | 242,977 |
LG Telecom Ltd. | 17,140 | | 109,569 |
YESCO Co. Ltd. | 2,760 | | 76,068 |
TOTAL KOREA (SOUTH) | | 508,985 |
Netherlands - 1.8% |
Koninklijke Philips Electronics NV | 8,800 | | 220,405 |
LyondellBasell Industries NV Class A | 5,030 | | 268,552 |
TOTAL NETHERLANDS | | 488,957 |
Nigeria - 0.5% |
Guaranty Trust Bank PLC | 500,000 | | 63,033 |
Nestle Foods Nigeria PLC | 14,700 | | 63,177 |
TOTAL NIGERIA | | 126,210 |
Common Stocks - continued |
| Shares | | Value |
Norway - 0.8% |
Telenor ASA | 10,600 | | $ 208,419 |
Panama - 1.0% |
Copa Holdings SA Class A | 2,950 | | 273,819 |
South Africa - 1.0% |
Clicks Group Ltd. | 29,886 | | 206,050 |
Foschini Ltd. | 3,500 | | 50,817 |
TOTAL SOUTH AFRICA | | 256,867 |
Spain - 0.5% |
Grifols SA ADR | 5,230 | | 131,587 |
Sweden - 3.4% |
Intrum Justitia AB | 12,810 | | 185,403 |
Svenska Handelsbanken AB (A Shares) | 10,230 | | 350,413 |
Swedish Match Co. AB | 11,350 | | 386,724 |
TOTAL SWEDEN | | 922,540 |
Switzerland - 3.4% |
Clariant AG (Reg.) | 15,870 | | 169,896 |
Roche Holding AG (participation certificate) | 2,748 | | 528,473 |
UBS AG | 14,370 | | 215,602 |
TOTAL SWITZERLAND | | 913,971 |
Taiwan - 1.5% |
Far EasTone Telecommunications Co. Ltd. | 67,000 | | 154,598 |
Taiwan Semiconductor Manufacturing Co. Ltd. | 79,000 | | 240,738 |
TOTAL TAIWAN | | 395,336 |
United Kingdom - 14.5% |
Barclays PLC | 56,854 | | 210,231 |
BP PLC | 45,489 | | 324,864 |
British American Tobacco PLC (United Kingdom) | 9,700 | | 481,116 |
Dunelm Group PLC | 9,100 | | 98,390 |
Ensco PLC Class A | 2,153 | | 124,486 |
GlaxoSmithKline PLC | 20,900 | | 468,316 |
Hilton Food Group PLC | 40,500 | | 181,529 |
ICAP PLC | 24,100 | | 126,436 |
London Stock Exchange Group PLC | 12,500 | | 196,777 |
Reckitt Benckiser Group PLC | 7,458 | | 451,326 |
Royal Dutch Shell PLC Class A (United Kingdom) | 13,292 | | 456,085 |
Common Stocks - continued |
| Shares | | Value |
United Kingdom - continued |
Vodafone Group PLC | 186,110 | | $ 505,407 |
WH Smith PLC | 26,152 | | 262,079 |
TOTAL UNITED KINGDOM | | 3,887,042 |
United States of America - 43.6% |
Altria Group, Inc. | 9,150 | | 290,970 |
American Tower Corp. | 2,190 | | 164,885 |
Analog Devices, Inc. | 8,060 | | 315,227 |
Apple, Inc. | 1,200 | | 714,120 |
Cardinal Health, Inc. | 1,900 | | 78,147 |
Cedar Fair LP (depository unit) | 8,040 | | 288,234 |
CenturyLink, Inc. | 4,770 | | 183,073 |
Chevron Corp. | 5,880 | | 648,035 |
CME Group, Inc. | 1,342 | | 75,058 |
Colgate-Palmolive Co. | 2,550 | | 267,648 |
Comcast Corp. Class A | 8,540 | | 320,335 |
Corrections Corp. of America | 1,860 | | 62,589 |
Dr Pepper Snapple Group, Inc. | 9,199 | | 394,177 |
Eli Lilly & Co. | 4,260 | | 207,164 |
Emerson Electric Co. | 4,280 | | 207,280 |
Exxon Mobil Corp. | 3,170 | | 289,009 |
General Electric Co. | 23,280 | | 490,277 |
Hubbell, Inc. Class B | 3,246 | | 271,755 |
IBM Corp. | 3,060 | | 595,262 |
Johnson & Johnson | 10,409 | | 737,161 |
JPMorgan Chase & Co. | 8,460 | | 352,613 |
Limited Brands, Inc. | 2,860 | | 136,965 |
Lorillard, Inc. | 2,066 | | 239,677 |
M&T Bank Corp. | 2,418 | | 251,714 |
McDonald's Corp. | 1,670 | | 144,956 |
Merck & Co., Inc. | 14,310 | | 652,965 |
Microsoft Corp. | 10,400 | | 296,764 |
Pfizer, Inc. | 12,610 | | 313,611 |
PG&E Corp. | 4,250 | | 180,710 |
PNC Financial Services Group, Inc. | 2,460 | | 143,147 |
Psychemedics Corp. | 7,730 | | 88,431 |
Sempra Energy | 2,380 | | 166,005 |
The Williams Companies, Inc. | 11,490 | | 402,035 |
U.S. Bancorp | 15,220 | | 505,456 |
United Technologies Corp. | 3,420 | | 267,307 |
VF Corp. | 1,900 | | 297,312 |
Common Stocks - continued |
| Shares | | Value |
United States of America - continued |
Wells Fargo & Co. | 17,100 | | $ 576,099 |
Western Gas Partners LP | 1,820 | | 92,784 |
TOTAL UNITED STATES OF AMERICA | | 11,708,957 |
TOTAL COMMON STOCKS (Cost $24,390,647) |
25,428,930
|
Preferred Stocks - 0.8% |
| | | |
Convertible Preferred Stocks - 0.1% |
United States of America - 0.1% |
United Technologies Corp. 7.50% | 460 | | 25,015 |
Nonconvertible Preferred Stocks - 0.7% |
Germany - 0.7% |
Volkswagen AG | 960 | | 198,591 |
TOTAL PREFERRED STOCKS (Cost $187,943) |
223,606
|
Money Market Funds - 6.7% |
| | | |
Fidelity Cash Central Fund, 0.19% (a)
(Cost $1,789,040) | 1,789,040 | |
1,789,040
|
TOTAL INVESTMENT PORTFOLIO - 102.2% (Cost $26,367,630) | 27,441,576 |
NET OTHER ASSETS (LIABILITIES) - (2.2)% | (603,371) |
NET ASSETS - 100% | $ 26,838,205 |
Legend |
(a) Affiliated fund that is available only to investment companies and other accounts managed by Fidelity Investments. The rate quoted is the annualized seven-day yield of the fund at period end. A complete unaudited listing of the fund's holdings as of its most recent quarter end is available upon request. In addition, each Fidelity Central Fund's financial statements, which are not covered by the Fund's Report of Independent Registered Public Accounting Firm, are available on the SEC's website or upon request. |
Affiliated Central Funds |
Information regarding fiscal year to date income earned by the Fund from investments in Fidelity Central Funds is as follows: |
Fund | Income earned |
Fidelity Cash Central Fund | $ 1,290 |
Other Information |
Categorizations in the Schedule of Investments are based on country or territory of incorporation. |
The following is a summary of the inputs used, as of October 31, 2012, involving the Fund's assets and liabilities carried at fair value. The inputs or methodology used for valuing securities may not be an indication of the risk associated with investing in those securities. For more information on valuation inputs, and their aggregation into the levels used in the table below, please refer to the Security Valuation section in the accompanying Notes to Financial Statements. |
Valuation Inputs at Reporting Date: |
Description | Total | Level 1 | Level 2 | Level 3 |
Investments in Securities: | | | | |
Equities: | | | | |
Consumer Discretionary | $ 2,532,828 | $ 2,532,828 | $ - | $ - |
Consumer Staples | 3,733,462 | 3,252,346 | 481,116 | - |
Energy | 2,689,365 | 1,556,349 | 1,133,016 | - |
Financials | 4,603,680 | 4,177,847 | 425,833 | - |
Health Care | 3,654,039 | 2,737,539 | 916,500 | - |
Industrials | 2,489,806 | 2,269,401 | 220,405 | - |
Information Technology | 2,673,892 | 2,309,655 | 364,237 | - |
Materials | 730,129 | 728,770 | 1,359 | - |
Telecommunication Services | 1,780,561 | 1,128,824 | 651,737 | - |
Utilities | 764,774 | 764,774 | - | - |
Money Market Funds | 1,789,040 | 1,789,040 | - | - |
Total Investments in Securities: | $ 27,441,576 | $ 23,247,373 | $ 4,194,203 | $ - |
See accompanying notes which are an integral part of the financial statements.
Annual Report
Statement of Assets and Liabilities
| October 31, 2012 |
| | |
Assets | | |
Investment in securities, at value - See accompanying schedule: Unaffiliated issuers (cost $24,578,590) | $ 25,652,536 | |
Fidelity Central Funds (cost $1,789,040) | 1,789,040 | |
Total Investments (cost $26,367,630) | | $ 27,441,576 |
Foreign currency held at value (cost $9,457) | | 9,457 |
Receivable for investments sold | | 261,300 |
Receivable for fund shares sold | | 81,323 |
Dividends receivable | | 35,177 |
Distributions receivable from Fidelity Central Funds | | 296 |
Prepaid expenses | | 11,681 |
Receivable from investment adviser for expense reductions | | 4,460 |
Other receivables | | 1,474 |
Total assets | | 27,846,744 |
| | |
Liabilities | | |
Payable to custodian bank | $ 1,649 | |
Payable for investments purchased | 913,519 | |
Payable for fund shares redeemed | 24,204 | |
Accrued management fee | 15,265 | |
Custodian fees payable | 8,970 | |
Audit fees payable | 39,471 | |
Other affiliated payables | 5,461 | |
Total liabilities | | 1,008,539 |
| | |
Net Assets | | $ 26,838,205 |
Net Assets consist of: | | |
Paid in capital | | $ 25,756,602 |
Distributions in excess of net investment income | | (9) |
Accumulated undistributed net realized gain (loss) on investments and foreign currency transactions | | 8,315 |
Net unrealized appreciation (depreciation) on investments and assets and liabilities in foreign currencies | | 1,073,297 |
Net Assets, for 2,642,099 shares outstanding | | $ 26,838,205 |
Net Asset Value, offering price and redemption price per share ($26,838,205 ÷ 2,642,099 shares) | | $ 10.16 |
See accompanying notes which are an integral part of the financial statements.
Annual Report
Financial Statements - continued
Statement of Operations
| | For the period
May 2, 2012
(commencement of
operations) to
October 31, 2012 |
| | |
Investment Income | | |
Dividends | | $ 238,310 |
Interest | | 32 |
Income from Fidelity Central Funds | | 1,290 |
Income before foreign taxes withheld | | 239,632 |
Less foreign taxes withheld | | (9,079) |
Total income | | 230,553 |
| | |
Expenses | | |
Management fee | $ 58,225 | |
Transfer agent fees | 19,394 | |
Accounting fees and expenses | 4,266 | |
Custodian fees and expenses | 35,143 | |
Independent trustees' compensation | 41 | |
Registration fees | 14,990 | |
Audit | 47,701 | |
Legal | 9 | |
Total expenses before reductions | 179,769 | |
Expense reductions | (82,980) | 96,789 |
Net investment income (loss) | | 133,764 |
Realized and Unrealized Gain (Loss) Net realized gain (loss) on: | | |
Investment securities: | | |
Unaffiliated issuers | 17,106 | |
Foreign currency transactions | (185) | |
Total net realized gain (loss) | | 16,921 |
Change in net unrealized appreciation (depreciation) on: Investment securities | 1,073,946 | |
Assets and liabilities in foreign currencies | (649) | |
Total change in net unrealized appreciation (depreciation) | | 1,073,297 |
Net gain (loss) | | 1,090,218 |
Net increase (decrease) in net assets resulting from operations | | $ 1,223,982 |
See accompanying notes which are an integral part of the financial statements.
Annual Report
Statement of Changes in Net Assets
| For the period
May 2, 2012
(commencement of
operations) to
October 31, 2012 |
Increase (Decrease) in Net Assets | |
Operations | |
Net investment income (loss) | $ 133,764 |
Net realized gain (loss) | 16,921 |
Change in net unrealized appreciation (depreciation) | 1,073,297 |
Net increase (decrease) in net assets resulting
from operations | 1,223,982 |
Distributions to shareholders from net investment income | (140,159) |
Share transactions
Proceeds from sales of shares | 27,834,579 |
Reinvestment of distributions | 131,259 |
Cost of shares redeemed | (2,214,390) |
Net increase (decrease) in net assets resulting from share transactions | 25,751,448 |
Redemption fees | 2,934 |
Total increase (decrease) in net assets | 26,838,205 |
| |
Net Assets | |
Beginning of period | - |
End of period (including distributions in excess of net investment
income of $9) | $ 26,838,205 |
Other Information Shares | |
Sold | 2,850,222 |
Issued in reinvestment of distributions | 12,874 |
Redeemed | (220,997) |
Net increase (decrease) | 2,642,099 |
See accompanying notes which are an integral part of the financial statements.
Annual Report
Financial Highlights
Period ended October 31, | 2012 G |
Selected Per-Share Data | |
Net asset value, beginning of period | $ 10.00 |
Income from Investment Operations | |
Net investment income (loss) D | .08 |
Net realized and unrealized gain (loss) | .15 |
Total from investment operations | .23 |
Distributions from net investment income | (.07) |
Redemption fees added to paid in capital D, J | - |
Net asset value, end of period | $ 10.16 |
Total Return B, C | 2.25% |
Ratios to Average Net Assets E, H | |
Expenses before reductions | 2.18% A |
Expenses net of fee waivers, if any | 1.20% A |
Expenses net of all reductions | 1.17% A |
Net investment income (loss) | 1.62% A |
Supplemental Data | |
Net assets, end of period (000 omitted) | $ 26,838 |
Portfolio turnover rate F | 33% I |
A Annualized
B Total returns for periods of less than one year are not annualized.
C Total returns would have been lower if certain expenses had not been reduced during the applicable periods shown.
D Calculated based on average shares outstanding during the period.
E Fees and expenses of any underlying Fidelity Central Funds are not included in the Fund's expense ratio. The Fund indirectly bears its proportionate share of the expenses of any underlying Fidelity Central Funds.
F Amount does not include the portfolio activity of any underlying Fidelity Central Funds.
G For the period May 2, 2012 (commencement of operations) to October 31, 2012.
H Expense ratios reflect operating expenses of the Fund. Expenses before reductions do not reflect amounts reimbursed by the investment adviser or reductions from brokerage service arrangements or reductions from other expense offset arrangements and do not represent the amount paid by the Fund during periods when reimbursements or reductions occur. Expense ratios before reductions for start-up periods may not be representative of longer term operating periods. Expenses net of fee waivers reflect expenses after reimbursement by the investment adviser but prior to reductions from brokerage service arrangements or other expense offset arrangements. Expenses net of all reductions represent the net expenses paid by the Fund.
I Amount not annualized.
J Amount represents less than $.01 per share.
See accompanying notes which are an integral part of the financial statements.
Annual Report
Notes to Financial Statements
For the period ended October 31, 2012
1. Organization.
Fidelity Global Equity Income Fund (the Fund) is a fund of Fidelity Investment Trust (the Trust) and is authorized to issue an unlimited number of shares. The Trust is registered under the Investment Company Act of 1940, as amended (the 1940 Act), as an open-end management investment company organized as a Massachusetts business trust. The Fund's investments in emerging markets can be subject to social, economic, regulatory, and political uncertainties and can be extremely volatile.
2. Investments in Fidelity Central Funds.
The Fund invests in Fidelity Central Funds, which are open-end investment companies available only to other investment companies and accounts managed by Fidelity Management & Research Company (FMR) and its affiliates. The Fund's Schedule of Investments lists each of the Fidelity Central Funds held as of period end, if any, as an investment of the Fund, but does not include the underlying holdings of each Fidelity Central Fund. As an Investing Fund, the Fund indirectly bears its proportionate share of the expenses of the underlying Fidelity Central Funds.
The Money Market Central Funds seek preservation of capital and current income and are managed by Fidelity Investments Money Management, Inc. (FIMM), an affiliate of FMR.
A complete unaudited list of holdings for each Fidelity Central Fund is available upon request or at the Securities and Exchange Commission (the SEC) web site at www.sec.gov. In addition, the financial statements of the Fidelity Central Funds, which are not covered by the Fund's Report of Independent Registered Public Accounting Firm, are available on the SEC web site or upon request.
3. Significant Accounting Policies.
The financial statements have been prepared in conformity with accounting principles generally accepted in the United States of America (GAAP), which require management to make certain estimates and assumptions at the date of the financial statements. Actual results could differ from those estimates. Subsequent events, if any, through the date that the financial statements were issued have been evaluated in the preparation of the financial statements. The following summarizes the significant accounting policies of the Fund:
Security Valuation. Investments are valued as of 4:00 p.m. Eastern time on the last calendar day of the period. In accordance with valuation policies and procedures approved by the Board of Trustees (the Board), the Fund attempts to obtain prices from one or more third party pricing vendors or brokers to value its investments. When current market prices, quotations or rates are not readily available or reliable, securities will be fair valued in good faith by the FMR Fair Value Committee (the Committee), in accordance with procedures adopted by the Fund's Board. Factors used in determining
Annual Report
Notes to Financial Statements - continued
3. Significant Accounting Policies - continued
Security Valuation - continued
fair value vary by security type and may include market or security specific events. The frequency with which these procedures are used cannot be predicted and they may be utilized to a significant extent. The Committee oversees the Fund's valuation policies and procedures and is responsible for approving and reporting to the Board all fair value determinations.
The Fund categorizes the inputs to valuation techniques used to value its investments into a disclosure hierarchy consisting of three levels as shown below:
Level 1 - quoted prices in active markets for identical investments
Level 2 - other significant observable inputs (including quoted prices for similar investments, interest rates, prepayment speeds, etc.)
Level 3 - unobservable inputs (including the Fund's own assumptions based on the best information available)
Valuation techniques used to value the Fund's investments by major category are as follows:
Equity securities, including restricted securities, for which market quotations are readily available, are valued at the last reported sale price or official closing price as reported by a third party pricing vendor on the primary market or exchange on which they are traded and are categorized as Level 1 in the hierarchy. In the event there were no sales during the day or closing prices are not available, securities are valued at the last quoted bid price or may be valued using the last available price and are generally categorized as Level 2 in the hierarchy. For foreign equity securities, when significant market or security specific events arise, comparisons to the valuation of American Depositary Receipts (ADRs), futures contracts, Exchange-Traded Funds (ETFs) and certain indexes as well as quoted prices for similar securities are used and are categorized as Level 2 in the hierarchy. Utilizing these techniques may result in transfers between Level 1 and Level 2.
Investments in open-end mutual funds, including the Fidelity Central Funds, are valued at their closing net asset value (NAV) each business day and are categorized as Level 1 in the hierarchy.
Changes in valuation techniques may result in transfers in or out of an assigned level within the disclosure hierarchy. The aggregate value of investments by input level, as of October 31, 2012, is included at the end of the Fund's Schedule of Investments.
Annual Report
3. Significant Accounting Policies - continued
Foreign Currency Translation. The Fund may use foreign currency contracts to facilitate transactions in foreign-denominated securities. Gains and losses from these transactions may arise from changes in the value of the foreign currency or if the counterparties do not perform under the contracts' terms.
Foreign-denominated assets, including investment securities, and liabilities are translated into U.S. dollars at the exchange rates at period end. Purchases and sales of investment securities, income and dividends received and expenses denominated in foreign currencies are translated into U.S. dollars at the exchange rate in effect on the transaction date.
The effects of exchange rate fluctuations on investments are included with the net realized and unrealized gain (loss) on investment securities. Other foreign currency transactions resulting in realized and unrealized gain (loss) are disclosed separately.
Investment Transactions and Income. For financial reporting purposes, the Fund's investment holdings and NAV include trades executed through the end of the last business day of the period. The NAV per share for processing shareholder transactions is calculated as of the close of business of the New York Stock Exchange (NYSE), normally 4:00 p.m. Eastern time and includes trades executed through the end of the prior business day. Gains and losses on securities sold are determined on the basis of identified cost. Dividend income is recorded on the ex-dividend date, except for certain dividends from foreign securities where the ex-dividend date may have passed, which are recorded as soon as the Fund is informed of the ex-dividend date. Non-cash dividends included in dividend income, if any, are recorded at the fair market value of the securities received. Distributions received on securities that represent a return of capital or capital gain are recorded as a reduction of cost of investments and/or as a realized gain. The Fund estimates the components of distributions received that may be considered return of capital distributions or capital gain distributions. Interest income and distributions from the Fidelity Central Funds are accrued as earned. Interest income includes coupon interest and amortization of premium and accretion of discount on debt securities. Investment income is recorded net of foreign taxes withheld where recovery of such taxes is uncertain.
Expenses. Expenses directly attributable to a fund are charged to that fund. Expenses attributable to more than one fund are allocated among the respective funds on the basis of relative net assets or other appropriate methods. Expense estimates are accrued in the period to which they relate and adjustments are made when actual amounts are known.
Income Tax Information and Distributions to Shareholders. Each year, the Fund intends to qualify as a regulated investment company under Subchapter M of the Internal Revenue Code, including distributing substantially all of its taxable income and
Annual Report
Notes to Financial Statements - continued
3. Significant Accounting Policies - continued
Income Tax Information and Distributions to Shareholders - continued
realized gains. As a result, no provision for income taxes is required. As of October 31, 2012, the Fund did not have any unrecognized tax benefits in the financial statements; nor is the Fund aware of any tax positions for which it is reasonably possible that the total amounts of unrecognized tax benefits will significantly change in the next twelve months. The Fund files a U.S. federal tax return, in addition to state and local tax returns as required. A fund's federal income tax returns are subject to examination by the Internal Revenue Service (IRS) for a period of three fiscal years after they are filed. State and local tax returns may be subject to examination for an additional fiscal year depending on the jurisdiction. Foreign taxes are provided for based on the Fund's understanding of the tax rules and rates that exist in the foreign markets in which it invests.
Distributions are declared and recorded on the ex-dividend date. Income and capital gain distributions are determined in accordance with income tax regulations, which may differ from GAAP. In addition, the Fund claimed a portion of the payment made to redeeming shareholders as a distribution for income tax purposes.
Capital accounts within the financial statements are adjusted for permanent book-tax differences. These adjustments have no impact on net assets or the results of operations. Temporary book-tax differences will reverse in a subsequent period.
Book-tax differences are primarily due to foreign currency transactions, passive foreign investment companies (PFIC), partnerships, equity-debt classifications and losses deferred due to wash sales.
The federal tax cost of investment securities and unrealized appreciation (depreciation) as of period end were as follows:
Gross unrealized appreciation | $ 1,494,423 |
Gross unrealized depreciation | (488,303) |
Net unrealized appreciation (depreciation) on securities and other investments | $ 1,006,120 |
| |
Tax Cost | $ 26,435,456 |
The tax-based components of distributable earnings as of period end were as follows:
Undistributed ordinary income | $ 76,142 |
Net unrealized appreciation (depreciation) | $ 1,005,471 |
The tax character of distributions paid was as follows:
| October 31, 2012 |
Ordinary Income | $ 140,159 |
Annual Report
3. Significant Accounting Policies - continued
Short-Term Trading (Redemption) Fees. Shares purchased by investors and held in the Fund less than 30 days are subject to a redemption fee equal to 1.00% of the net asset value of shares redeemed. All redemption fees, which reduce the proceeds of the shareholder redemption, are retained by the Fund and accounted for as an addition to paid in capital.
New Accounting Pronouncement. In December 2011, the Financial Accounting Standards Board issued Accounting Standard Update No. 2011-11, Disclosures about Offsetting Assets and Liabilities. The update creates new disclosure requirements requiring entities to disclose both gross and net information for derivatives and other financial instruments that are either offset in the Statement of Assets and Liabilities or subject to an enforceable master netting arrangement or similar agreement. The disclosure requirements are effective for annual reporting periods beginning on or after January 1, 2013, and interim periods within those annual periods. Management is currently evaluating the impact of the update's adoption on the Fund's financial statement disclosures.
4. Purchases and Sales of Investments.
Purchases and sales of securities, other than short-term securities, aggregated $30,201,969 and $5,639,719, respectively.
5. Fees and Other Transactions with Affiliates.
Management Fee. FMR and its affiliates provide the Fund with investment management related services for which the Fund pays a monthly management fee. The management fee is the sum of an individual fund fee rate that is based on an annual rate of .45% of the Fund's average net assets and an annualized group fee rate that averaged .26% during the period. The group fee rate is based upon the average net assets of all the mutual funds advised by FMR. The group fee rate decreases as assets under management increase and increases as assets under management decrease. For the period, the total annualized management fee rate was .71% of the Fund's average net assets.
Transfer Agent Fees. Fidelity Investments Institutional Operations Company, Inc. (FIIOC), an affiliate of FMR, is the Fund's transfer, dividend disbursing and shareholder servicing agent. FIIOC receives account fees and asset-based fees that vary according to account size and type of account. FIIOC pays for typesetting, printing and mailing of shareholder reports, except proxy statements. For the period, the transfer agent fees were equivalent to an annualized rate of .24% of average net assets.
Annual Report
Notes to Financial Statements - continued
5. Fees and Other Transactions with Affiliates - continued
Accounting Fees. Fidelity Service Company, Inc.(FSC), an affiliate of FMR, maintains the Fund's accounting records. The fee is based on the level of average net assets for each month.
Brokerage Commissions. The Fund placed a portion of its portfolio transactions with brokerage firms which are affiliates of the investment adviser. The commissions paid to these affiliated firms were $81 for the period.
6. Expense Reductions.
FMR contractually agreed to reimburse the Fund to the extent annual operating expenses exceeded 1.20% of average net assets. This reimbursement will remain in place through December 31, 2013. Some expenses, for example interest expense, are excluded from this reimbursement. During the period this reimbursement reduced the Fund's expenses by $80,725.
Many of the brokers with whom FMR places trades on behalf of the Fund provided services to the Fund in addition to trade execution. These services included payments of certain expenses on behalf of the Fund totaling $2,247 for the period. In addition, through arrangements with the Fund's custodian, credits realized as a result of uninvested cash balances were used to reduce the Fund's expenses. During the period, these credits reduced the Fund's custody expenses by $8.
7. Other.
The Fund's organizational documents provide former and current trustees and officers with a limited indemnification against liabilities arising in connection with the performance of their duties to the Fund. In the normal course of business, the Fund may also enter into contracts that provide general indemnifications. The Fund's maximum exposure under these arrangements is unknown as this would be dependent on future claims that may be made against the Fund. The risk of material loss from such claims is considered remote.
Annual Report
To the Trustees of Fidelity Investment Trust and Shareholders of Fidelity Global Equity Income Fund:
We have audited the accompanying statement of assets and liabilities of Fidelity Global Equity Income Fund (the Fund), a fund of Fidelity Investment Trust, including the schedule of investments, as of October 31, 2012, and the related statement of operations, the statement of changes in net assets and the financial highlights for the period from May 2, 2012 (commencement of operations) to October 31, 2012. These financial statements and financial highlights are the responsibility of the Fund's management. Our responsibility is to express an opinion on these financial statements and financial highlights based on our audit.
We conducted our audit in accordance with the standards of the Public Company Accounting Oversight Board (United States). Those standards require that we plan and perform the audit to obtain reasonable assurance about whether the financial statements and financial highlights are free of material misstatement. The Fund is not required to have, nor were we engaged to perform, an audit of its internal control over financial reporting. Our audit included consideration of internal control over financial reporting as a basis for designing audit procedures that are appropriate in the circumstances, but not for the purpose of expressing an opinion on the effectiveness of the Fund's internal control over financial reporting. Accordingly, we express no such opinion. An audit also includes examining, on a test basis, evidence supporting the amounts and disclosures in the financial statements, assessing the accounting principles used and significant estimates made by management, as well as evaluating the overall financial statement presentation. Our procedures included confirmation of securities owned as of October 31, 2012, by correspondence with the custodians and brokers; where replies were not received from brokers, we performed other auditing procedures. We believe that our audit provide a reasonable basis for our opinion.
In our opinion, the financial statements and financial highlights referred to above present fairly, in all material respects, the financial position of Fidelity Global Equity Income Fund as of October 31, 2012, the results of its operations, the changes in its net assets and the financial highlights for the period from May 2, 2012 (commencement of operations) to October 31, 2012, in conformity with accounting principles generally accepted in the United States of America.
DELOITTE & TOUCHE LLP
Boston, Massachusetts
December 17, 2012
Annual Report
The Trustees, Members of the Advisory Board, and executive officers of the trust and fund, as applicable, are listed below. The Board of Trustees governs the fund and is responsible for protecting the interests of shareholders. The Trustees are experienced executives who meet periodically throughout the year to oversee the fund's activities, review contractual arrangements with companies that provide services to the fund, oversee management of the risks associated with such activities and contractual arrangements, and review the fund's performance. Except for James C. Curvey, each of the Trustees oversees 236 funds advised by FMR or an affiliate. Mr. Curvey oversees 443 funds advised by FMR or an affiliate.
The Trustees hold office without limit in time except that (a) any Trustee may resign; (b) any Trustee may be removed by written instrument, signed by at least two-thirds of the number of Trustees prior to such removal; (c) any Trustee who requests to be retired or who has become incapacitated by illness or injury may be retired by written instrument signed by a majority of the other Trustees; and (d) any Trustee may be removed at any special meeting of shareholders by a two-thirds vote of the outstanding voting securities of the trust. Each Trustee who is not an interested person (as defined in the 1940 Act) (Independent Trustee), shall retire not later than the last day of the calendar year in which his or her 75th birthday occurs. The Independent Trustees may waive this mandatory retirement age policy with respect to individual Trustees. The executive officers and Advisory Board Members hold office without limit in time, except that any officer and Advisory Board Member may resign or may be removed by a vote of a majority of the Trustees at any regular meeting or any special meeting of the Trustees. Except as indicated, each individual has held the office shown or other offices in the same company for the past five years.
Experience, Skills, Attributes, and Qualifications of the Fund's Trustees. The Governance and Nominating Committee has adopted a statement of policy that describes the experience, qualifications, attributes, and skills that are necessary and desirable for potential Independent Trustee candidates (Statement of Policy). The Board believes that each Trustee satisfied at the time he or she was initially elected or appointed a Trustee, and continues to satisfy, the standards contemplated by the Statement of Policy. The Governance and Nominating Committee also engages professional search firms to help identify potential Independent Trustee candidates who have the experience, qualifications, attributes, and skills consistent with the Statement of Policy. From time to time, additional criteria based on the composition and skills of the current Independent Trustees, as well as experience or skills that may be appropriate in light of future changes to board composition, business conditions, and regulatory or other developments, have also been considered by the professional search firms and the Governance and Nominating Committee. In addition, the Board takes into account the Trustees' commitment and participation in Board and committee meetings, as well as their leadership of standing and ad hoc committees throughout their tenure.
In determining that a particular Trustee was and continues to be qualified to serve as a Trustee, the Board has considered a variety of criteria, none of which, in isolation, was controlling. The Board believes that, collectively, the Trustees have balanced and diverse experience, qualifications, attributes, and skills, which allow the Board to operate effectively in governing the fund and protecting the interests of shareholders. Information about the specific experience, skills, attributes, and qualifications of each Trustee, which in each case led to the Board's conclusion that the Trustee should serve (or continue to serve) as a trustee of the fund, is provided below.
Annual Report
Trustees and Officers - continued
Board Structure and Oversight Function. James C. Curvey is an interested person (as defined in the 1940 Act) and currently serves as Chairman. The Trustees have determined that an interested Chairman is appropriate and benefits shareholders because an interested Chairman has a personal and professional stake in the quality and continuity of services provided to the fund. Independent Trustees exercise their informed business judgment to appoint an individual of their choosing to serve as Chairman, regardless of whether the Trustee happens to be independent or a member of management. The Independent Trustees have determined that they can act independently and effectively without having an Independent Trustee serve as Chairman and that a key structural component for assuring that they are in a position to do so is for the Independent Trustees to constitute a substantial majority for the Board. The Independent Trustees also regularly meet in executive session. Ned C. Lautenbach serves as Chairman of the Independent Trustees and as such (i) acts as a liaison between the Independent Trustees and management with respect to matters important to the Independent Trustees and (ii) with management prepares agendas for Board meetings.
Fidelity funds are overseen by different Boards of Trustees. The fund's Board oversees Fidelity's equity and high income funds and another Board oversees Fidelity's investment-grade bond, money market, and asset allocation funds. The asset allocation funds may invest in Fidelity funds overseen by the fund's Board. The use of separate Boards, each with its own committee structure, allows the Trustees of each group of Fidelity funds to focus on the unique issues of the funds they oversee, including common research, investment, and operational issues. On occasion, the separate Boards establish joint committees to address issues of overlapping consequences for the Fidelity funds overseen by each Board.
The Trustees operate using a system of committees to facilitate the timely and efficient consideration of all matters of importance to the Trustees, the fund, and fund shareholders and to facilitate compliance with legal and regulatory requirements and oversight of the fund's activities and associated risks. The Board, acting through its committees, has charged FMR and its affiliates with (i) identifying events or circumstances the occurrence of which could have demonstrably adverse effects on the fund's business and/or reputation; (ii) implementing processes and controls to lessen the possibility that such events or circumstances occur or to mitigate the effects of such events or circumstances if they do occur; and (iii) creating and maintaining a system designed to evaluate continuously business and market conditions in order to facilitate the identification and implementation processes described in (i) and (ii) above. Because the day-to-day operations and activities of the fund are carried out by or through FMR, its affiliates and other service providers, the fund's exposure to risks is mitigated but not eliminated by the processes overseen by the Trustees. While each of the Board's committees has responsibility for overseeing different aspects of the fund's activities, oversight is exercised primarily through the Operations, Audit, and Compliance Committees. In addition, the Independent Trustees have worked with FMR to enhance the Board's oversight of investment and financial risks, legal and regulatory risks, technology risks, and operational risks, including the development of additional risk reporting to the Board. For example, a working group comprised of Independent Trustees and FMR has worked and continues to work to review the Fidelity funds' valuation-related activities, reporting and risk management. Appropriate personnel, including but not limited to the fund's Chief Compliance Officer (CCO), FMR's internal auditor, the independent accountants, the fund's Treasurer and portfolio management personnel, make periodic reports to the Board's committees, as appropriate, including an annual review of FMR's risk management program for the Fidelity funds. The responsibilities of each standing committee, including their oversight responsibilities, are described further under "Standing Committees of the Fund's Trustees."
Annual Report
The fund's Statement of Additional Information (SAI) includes more information about the Trustees. To request a free copy, call Fidelity at 1-800-544-8544.
Interested Trustees*:
Correspondence intended for each Trustee who is an interested person may be sent to Fidelity Investments, 82 Devonshire Street, Boston, Massachusetts 02109.
Name, Age; Principal Occupations and Other Relevant Experience+ |
James C. Curvey (77) |
| Year of Election or Appointment: 2007 Mr. Curvey is Trustee and Chairman of the Board of Trustees of certain Trusts. Mr. Curvey also serves as Trustee (2007-present) of other investment companies advised by FMR. Mr. Curvey is a Director of Fidelity Investments Money Management, Inc. (2009-present), Director of Fidelity Research & Analysis Co. (2009-present) and Director of FMR and FMR Co., Inc. (2007-present). Mr. Curvey is also Vice Chairman (2007-present) and Director of FMR LLC. In addition, Mr. Curvey serves as an Overseer for the Boston Symphony Orchestra and a member of the Trustees of Villanova University. Previously, Mr. Curvey was the Vice Chairman (2006-2007) and Director (2000-2007) of FMR Corp. |
Ronald P. O'Hanley (55) |
| Year of Election or Appointment: 2011 Mr. O'Hanley is Director of FMR Co., Inc. (2010-present), Director of Fidelity Investments Money Management, Inc. (2010-present), Director of Fidelity Research & Analysis Company (2010-present), President of Fidelity Asset Management and Corporate Services and a member of Fidelity's Executive Committee (2010-present). Previously, Mr. O'Hanley served as President and Chief Executive Officer of BNY Mellon Asset Management (2007-2010). Mr. O'Hanley also served as Vice Chairman of Bank New York Mellon Corp. and a member of that firm's Executive Committee. Prior to the 2007 merger of The Bank of New York and Mellon Financial Corporation, he was Vice Chairman of Mellon Financial Corporation and President and Chief Executive Officer of Mellon Asset Management. He joined Mellon in February 1997. Mr. O'Hanley currently serves as Chairman of the Boston Public Library Foundation Board of Directors and sits on the Board of Directors of Beth Israel Deaconess Medical Center, the Board of Trustees of the Marine Biological Laboratory and the Advisory Board of the Maxwell School of Citizenship and Public Administration at Syracuse University. Mr. O'Hanley also chairs the Council on Asset Management for the Financial Services Roundtable and is a member of the Board of Directors of Institutional Investor's U.S. Institute. |
* Trustees have been determined to be "Interested Trustees" by virtue of, among other things, their affiliation with the trust or various entities under common control with FMR.
+ The information above includes each Trustee's principal occupation during the last five years and other information relating to the experience, attributes, and skills relevant to each Trustee's qualifications to serve as a Trustee, which led to the conclusion that each Trustee should serve as a Trustee for the fund.
Annual Report
Independent Trustees:
Correspondence intended for each Independent Trustee (that is, the Trustees other than the Interested Trustees) may be sent to Fidelity Investments, P.O. Box 55235, Boston, Massachusetts 02205-5235.
Name, Age; Principal Occupations and Other Relevant Experience+ |
Dennis J. Dirks (64) |
| Year of Election or Appointment: 2005
Prior to his retirement in May 2003, Mr. Dirks was Chief Operating Officer and a member of the Board of The Depository Trust & Clearing Corporation (DTCC). He also served as President, Chief Operating Officer, and Board member of The Depository Trust Company (DTC) and President and Board member of the National Securities Clearing Corporation (NSCC). In addition, Mr. Dirks served as Chief Executive Officer and Board member of the Government Securities Clearing Corporation, Chief Executive Officer and Board member of the Mortgage-Backed Securities Clearing Corporation, as a Trustee and a member of the Finance Committee of Manhattan College (2005-2008), and as a Trustee and a member of the Finance Committee of AHRC of Nassau County (2006-2008). Mr. Dirks is a member of the Independent Directors Council (IDC) Governing Council (2010-present) and Board of Directors for The Brookville Center for Children's Services, Inc (2009-present). |
Alan J. Lacy (59) |
| Year of Election or Appointment: 2008 Mr. Lacy serves as Senior Adviser (2007-present) of Oak Hill Capital Partners, L.P. (private equity). Mr. Lacy also served as Chief Executive Officer (2000-2005) and Vice Chairman (2005-2006) of Sears Holdings Corporation and Sears, Roebuck and Co. (retail). In addition, Mr. Lacy serves as a member of the Board of Directors of Dave & Buster's Entertainment, Inc. (restaurant and entertainment complexes, 2010-present), Earth Fare, Inc. (retail grocery, 2012-present), The Hillman Companies, Inc. (hardware wholesalers, 2010-present), and Bristol-Myers Squibb Company (global pharmaceuticals, 2008-present). Mr. Lacy is a member of the Board of Trustees of The National Parks Conservation Association (2006-present). Previously, Mr. Lacy served as Chairman of the Board of Trustees of the National Parks Conservation Association (2008-2011) and as a member of the Board of Directors for the Western Union Company (global money transfer, 2006-2011). |
Ned C. Lautenbach (68) |
| Year of Election or Appointment: 2000 Mr. Lautenbach is Chairman of the Independent Trustees of the Equity and High Income Funds (2006-present). Mr. Lautenbach currently serves as the Lead Director of the Eaton Corporation Board of Directors (diversified industrial, 1997-present). Mr. Lautenbach is Chairman of the Board of Directors of the Philharmonic Center for the Arts in Naples, Florida (2012-present) and a member of the Council on Foreign Relations (1994-present). Previously, Mr. Lautenbach was a Partner/Advisory Partner at Clayton, Dubilier & Rice, LLC (private equity investment, 1998-2010), as well as a Director of Sony Corporation (2006-2007). |
Joseph Mauriello (68) |
| Year of Election or Appointment: 2008 Prior to his retirement in January 2006, Mr. Mauriello served in numerous senior management positions including Deputy Chairman and Chief Operating Officer (2004-2005), and Vice Chairman of Financial Services (2002-2004) of KPMG LLP US (professional services, 1965-2005). Mr. Mauriello currently serves as a member of the Board of Directors of XL Group plc. (global insurance and re-insurance, 2006-present). Previously, Mr. Mauriello served as a Director of the Hamilton Funds of the Bank of New York (2006-2007) and of Arcadia Resources Inc. (health care services and products, 2007-2012). |
Robert W. Selander (62) |
| Year of Election or Appointment: 2011 Previously, Mr. Selander served as a Member of the Advisory Board of Fidelity's Equity and High Income Funds (2011), Executive Vice Chairman (2010), Chief Executive Officer (2009-2010), and President and Chief Executive Officer (1997-2009) of Mastercard, Inc. |
Cornelia M. Small (68) |
| Year of Election or Appointment: 2005 Ms. Small is a member of the Board of Directors (2009-present) and Chair of the Investment Committee (2010-present) of the Teagle Foundation. Ms. Small also serves on the Investment Committee of the Berkshire Taconic Community Foundation (2008-present). Previously, Ms. Small served as Chairperson (2002-2008) and a member of the Investment Committee and Chairperson (2008-2012) and a member of the Board of Trustees of Smith College. In addition, Ms. Small served as Chief Investment Officer, Director of Global Equity Investments, and a member of the Board of Directors of Scudder, Stevens & Clark and Scudder Kemper Investments. |
William S. Stavropoulos (73) |
| Year of Election or Appointment: 2001 Mr. Stavropoulos is Vice Chairman of the Independent Trustees of the Equity and High Income Funds (2006-present). Mr. Stavropoulos serves as President and Founder of the Michigan Baseball Foundation, the Great Lakes Loons (2007-present). Mr. Stavropoulos is Chairman Emeritus of the Board of Directors of The Dow Chemical Company, where he previously served in numerous senior management positions, including President, CEO (1995-2000; 2002-2004), Chairman of the Executive Committee (2000-2006), and as a member of the Board of Directors (1990-2006). Currently, Mr. Stavropoulos is a Director of Univar Inc. (global distributor of commodity and specialty chemicals, Chairman from 2010-May 2012 and Lead Director from May 2012-present), Teradata Corporation (data warehousing and technology solutions, 2008-present), Maersk Inc. (industrial conglomerate), and Tyco International, Ltd. (multinational manufacturing and services, 2007-present), and a member of the Advisory Board for Metalmark Capital LLC (private equity investment, 2005-present). Mr. Stavropoulos is an operating advisor to Clayton, Dubilier & Rice, LLC (private equity investment). In addition, Mr. Stavropoulos is a member of the University of Notre Dame Advisory Council for the College of Science, a Trustee of the Rollin L. Gerstacker Foundation, and a Director of the Naples Philharmonic Center for the Arts. Previously, Mr. Stavropoulos served as a Director of Chemical Financial Corporation (bank holding company, 1993-2012). |
David M. Thomas (63) |
| Year of Election or Appointment: 2008 Previously, Mr. Thomas served as Executive Chairman (2005-2006) and Chairman and Chief Executive Officer (2000-2005) of IMS Health, Inc. (pharmaceutical and healthcare information solutions), and a Director of Fortune Brands, Inc. (consumer products, 2000-2011). In addition, Mr. Thomas serves as Non-Executive Chairman of the Board of Directors of Fortune Brands Home and Security (home and security products, 2011-present), and as a member of the Board of Directors of Interpublic Group of Companies, Inc. (marketing communication, 2004-present). |
Michael E. Wiley (62) |
| Year of Election or Appointment: 2008 Mr. Wiley also serves as a Director of Asia Pacific Exploration Consolidated (international oil and gas exploration and production, 2008-present). Mr. Wiley serves as a Director of Tesoro Corporation (independent oil refiner and marketer, 2005-present), and a Director of Bill Barrett Corporation (exploration and production, 2005-present). In addition, Mr. Wiley also serves as a Director of Post Oak Bank (privately-held bank, 2004-present). Previously, Mr. Wiley served as a member of the Board of Trustees of the University of Tulsa (2000-2006; 2007-2010), as a Senior Energy Advisor of Katzenbach Partners, LLC (consulting, 2006-2007), as an Advisory Director of Riverstone Holdings (private investment), Chairman, President, and CEO of Baker Hughes, Inc. (oilfield services, 2000-2004), and as Director of Spinnaker Exploration Company (exploration and production, 2001-2005). |
+ The information above includes each Trustee's principal occupation during the last five years and other information relating to the experience, attributes, and skills relevant to each Trustee's qualifications to serve as a Trustee, which led to the conclusion that each Trustee should serve as a Trustee for the fund.
Advisory Board Members and Executive Officers:
Correspondence intended for David A. Rosow and Garnett A. Smith may be sent to Fidelity Investments, P.O. Box 55235, Boston, Massachusetts 02205-5235. Correspondence intended for each executive officer, Edward C. Johnson 3d, and Peter S. Lynch may be sent to Fidelity Investments, 82 Devonshire Street, Boston, Massachusetts 02109.
Name, Age; Principal Occupation |
Edward C. Johnson 3d (82) |
| Year of Election or Appointment: 2011 Member of the Advisory Board of Fidelity's Equity and High Income Funds. Mr. Johnson serves as Chief Executive Officer, Chairman, and a Director of FMR LLC, and also serves as Chairman and Director of FIL Limited. Previously, Mr. Johnson served as a Trustee and Chairman of the Board of certain Fidelity Trusts, Chairman and a Director of FMR, Chairman and a Director of FMR Co., Inc., and President of FMR LLC (2006-2007). |
Peter S. Lynch (68) |
| Year of Election or Appointment: 2003 Member of the Advisory Board of Fidelity's Equity and High Income Funds. Mr. Lynch is Vice Chairman and a Director of FMR and FMR Co., Inc. In addition, Mr. Lynch serves as a Trustee of Boston College and as the Chairman of the Inner-City Scholarship Fund. Previously, Mr. Lynch served on the Special Olympics International Board of Directors (1997-2006). |
David A. Rosow (70) |
| Year of Election or Appointment: 2012 Member of the Advisory Board of Fidelity's Equity and High Income Funds. Chairman and Chief Executive Officer of International Golf Group, Inc. (golf course development, 1989-present). Previously, Mr. Rosow served as Chairman and Chief Executive Officer of Rosow & Company, Inc. (private investment company, 1989-2011), a Lead Director of Hudson United Bancorp (2001-2006) and as a Director of TD Banknorth (1996-2006). In addition, Mr. Rosow is a member (2008-present) and President (2009-present) of the Town Council of Palm Beach, Florida. |
Garnett A. Smith (65) |
| Year of Election or Appointment: 2012 Member of the Advisory Board of Fidelity's Equity and High Income Funds. Prior to Mr. Smith's retirement, he served as Chairman and Chief Executive Officer of Inbrand Corp. (manufacturer of personal absorbent products, 1990-1997). He also served as President (1986-1990) of Inbrand Corp. Prior to his employment with Inbrand Corp., he was employed by a retail fabric chain and North Carolina National Bank. In addition, Mr. Smith is a board member of the Jackson Hole Land Trust (2009-present). |
Kenneth B. Robins (43) |
| Year of Election or Appointment: 2008 President and Treasurer of Fidelity's Equity and High Income Funds. Mr. Robins also serves as President and Treasurer (2010-present) and Assistant Treasurer (2009-present) of other Fidelity funds and is an employee of Fidelity Investments (2004-present). Previously, Mr. Robins served as Deputy Treasurer of the Fidelity funds (2005-2008) and Treasurer and Chief Financial Officer of The North Carolina Capital Management Trust: Cash and Term Portfolios (2006-2008). |
Bruce T. Herring (47) |
| Year of Election or Appointment: 2006 Vice President of certain Equity Funds. Mr. Herring also serves as President of Fidelity Research & Analysis Company (2010-present), Chief Investment Officer and Director of Fidelity Management & Research (U.K.) Inc. (2010-present) and Group Chief Investment Officer of FMR. Previously, Mr. Herring served as Vice President (2005-2006) and Senior Vice President (2006-2007) of Fidelity Management & Research Company, Vice President of FMR Co., Inc. (2001-2007) and as a portfolio manager for Fidelity U.S. Equity Funds. |
Brian B. Hogan (48) |
| Year of Election or Appointment: 2009 Vice President of Equity and High Income Funds. Mr. Hogan also serves as President of FMR's Equity Division (2009-present). Previously, Mr. Hogan served as Senior Vice President, Equity Research of FMR (2006-2009) and as a portfolio manager. |
Scott C. Goebel (44) |
| Year of Election or Appointment: 2008 Secretary and Chief Legal Officer (CLO) of the Fidelity funds. Mr. Goebel also serves as Secretary of Fidelity Investments Money Management, Inc. (FIMM) (2010-present) and Fidelity Research and Analysis Company (FRAC) (2010-present); Secretary and CLO of The North Carolina Capital Management Trust: Cash and Term Portfolios (2008-present); General Counsel, Secretary, and Senior Vice President of FMR (2008-present) and FMR Co., Inc. (2008-present); employed by FMR LLC or an affiliate (2001-present); Chief Legal Officer of Fidelity Management & Research (Hong Kong) Limited (2008-present) and Assistant Secretary of Fidelity Management & Research (Japan) Inc. (2008-present), and Fidelity Management & Research (U.K.) Inc. (2008-present). Previously, Mr. Goebel served as Assistant Secretary of FIMM (2008-2010), FRAC (2008-2010), and the Funds (2007-2008) and as Vice President and Secretary of Fidelity Distributors Corporation (FDC) (2005-2007). |
William C. Coffey (43) |
| Year of Election or Appointment: 2009 Assistant Secretary of Fidelity's Equity and High Income Funds. Mr. Coffey also serves as Senior Vice President and Deputy General Counsel of FMR LLC (2010-present), and is an employee of Fidelity Investments. Previously, Mr. Coffey served as Vice President and Associate General Counsel of FMR LLC (2005-2009). |
Elizabeth Paige Baumann (44) |
| Year of Election or Appointment: 2012 Anti-Money Laundering (AML) Officer of the Fidelity funds. Ms. Baumann also serves as AML Officer of The North Carolina Capital Management Trust: Cash and Term Portfolios (2012-present), Chief AML Officer of FMR LLC (2012-present), and is an employee of Fidelity Investments. Previously, Ms. Baumann served as Vice President and Deputy Anti-Money Laundering Officer (2007-2012). |
Christine Reynolds (54) |
| Year of Election or Appointment: 2008 Chief Financial Officer of the Fidelity funds. Ms. Reynolds became President of Fidelity Pricing and Cash Management Services (FPCMS) in August 2008. Ms. Reynolds served as Chief Operating Officer of FPCMS (2007-2008). Previously, Ms. Reynolds served as President, Treasurer, and Anti-Money Laundering officer of the Fidelity funds (2004-2007). |
Joseph A. Hanlon (44) |
| Year of Election or Appointment: 2012 Chief Compliance Officer of Fidelity's Equity and High Income Funds. Mr. Hanlon serves as Compliance Officer of FMR, FMR Co., Inc., Fidelity Investments Money Management, Inc. (FIMM), Fidelity Research and Analysis Company (FRAC), Fidelity Management & Research (Japan) Inc., Fidelity Management & Research (U.K.) Inc., Fidelity Management & Research (Hong Kong), and Strategic Advisers, Inc. (2009-present), as Senior Vice President of the Fidelity Asset Management Division (2009-present), and is an employee of Fidelity Investments. |
Joseph F. Zambello (55) |
| Year of Election or Appointment: 2011 Deputy Treasurer of the Fidelity funds. Mr. Zambello is an employee of Fidelity Investments. Previously, Mr. Zambello served as Vice President of FMR's Program Management Group (2009-2011) and Vice President of the Transfer Agent Oversight Group (2005-2009). |
Adrien E. Deberghes (45) |
| Year of Election or Appointment: 2008 Deputy Treasurer of Fidelity's Equity and High Income Funds. Mr. Deberghes also serves as Vice President (2011-present) and Assistant Treasurer (2010-present) of other Fidelity funds, and is an employee of Fidelity Investments (2008-present). Previously, Mr. Deberghes served as Senior Vice President of Mutual Fund Administration at State Street Corporation (2007-2008), Senior Director of Mutual Fund Administration at Investors Bank & Trust (2005-2007), and Director of Finance for Dunkin' Brands (2000-2005). |
Name, Age; Principal Occupation |
Stephen Sadoski (41) |
| Year of Election or Appointment: 2012 Deputy Treasurer of Fidelity's Equity and High Income Funds. Mr. Sadoski also serves as Assistant Treasurer of other Fidelity funds (2012-present) and is an employee of Fidelity Investments (2012-present). Previously, Mr. Sadoski served as an assistant chief accountant in the Division of Investment Management of the Securities and Exchange Commission (SEC) (2009-2012) and as a senior manager at Deloitte & Touche (1997-2009). |
Stephanie J. Dorsey (43) |
| Year of Election or Appointment: 2010 Assistant Treasurer of Fidelity's Equity and High Income Funds. Ms. Dorsey also serves as Deputy Treasurer of other Fidelity funds (2008-present) and is an employee of Fidelity Investments (2008-present). Previously, Ms. Dorsey served as Treasurer (2004-2008) of the JPMorgan Mutual Funds and Vice President (2004-2008) of JPMorgan Chase Bank. |
John R. Hebble (54) |
| Year of Election or Appointment: 2009 Assistant Treasurer of Fidelity's Equity and High Income Funds. Mr. Hebble also serves as President (2011-present), Treasurer, and Chief Financial Officer of The North Carolina Capital Management Trust: Cash and Term Portfolios (2008-present), President and Treasurer of other Fidelity funds (2008-present) and is an employee of Fidelity Investments. |
Gary W. Ryan (54) |
| Year of Election or Appointment: 2005 Assistant Treasurer of the Fidelity funds. Mr. Ryan is an employee of Fidelity Investments. Previously, Mr. Ryan served as Vice President of Fund Reporting in Fidelity Pricing and Cash Management Services (FPCMS) (1999-2005). |
Jonathan Davis (44) |
| Year of Election or Appointment: 2010 Assistant Treasurer of the Fidelity funds. Mr. Davis is also Assistant Treasurer of Fidelity Rutland Square Trust II and Fidelity Commonwealth Trust II. Mr. Davis is an employee of Fidelity Investments. Previously, Mr. Davis served as Vice President and Associate General Counsel of FMR LLC (2003-2010). |
Annual Report
The Board of Trustees of Fidelity Global Equity Income Fund voted to pay on December 10, 2012, to shareholders of record at the opening of business on December 07, 2012, a distribution of $0.028 per share derived from capital gains realized from sales of portfolio securities, and a dividend of $0.041 per share derived from net investment income.
The fund designates 58% of the dividends distributed during the fiscal year as qualifying for the dividends-received deduction for corporate shareholders.
The fund designates 100% of the dividends distributed in during the fiscal year as amounts which may be taken into account as a dividend for the purposes of the maximum rate under section 1(h)(11) of the Internal Revenue Code.
The amounts per share which represent income derived from sources within, and taxes paid to, foreign countries or possessions of the United States are as follows:
Pay Date | Income | Taxes |
07/09/12 | $0.008 | $0.0013 |
10/08/12 | $0.018 | $0.0029 |
The fund will notify shareholders in January 2013 of amounts for use in preparing 2012 income tax returns.
Annual Report
Board Approval of Investment Advisory Contracts and Management Fees
Fidelity Global Equity Income Fund
On March 14, 2012, the Board of Trustees, including the Independent Trustees (together, the Board), voted to approve the management contract and sub-advisory agreements (together, the Advisory Contracts) for the fund. The Board, assisted by the advice of fund counsel and Independent Trustees' counsel, considered a broad range of information.
Nature, Extent, and Quality of Services Provided. The Board considered the staffing within the investment adviser, FMR, and the sub-advisers (together, the Investment Advisers), including the backgrounds of the fund's investment personnel and the fund's investment objective and discipline. The Board considered the structure of the portfolio manager compensation program and whether this structure provides appropriate incentives to act in the best interests of the fund.
Resources Dedicated to Investment Management and Support Services. The Board and the Fund Oversight and Research Committees reviewed the general qualifications and capabilities of the Investment Advisers' investment staff, including its size, education, experience, and resources, as well as the Investment Advisers' approach to recruiting, training, managing, and compensating investment personnel. The Board also noted that FMR has devoted increased resources to non-U.S. offices. The Board noted that Fidelity's analysts have extensive resources, tools and capabilities which allow them to conduct sophisticated quantitative and fundamental analysis, as well as credit analysis of issuers, counterparties and enhancers. The Board also believes that Fidelity's investment professionals have sufficient access to global information and data so as to provide competitive investment results over time, and that those professionals also have access to sophisticated tools which permit them to assess portfolio construction and risk and performance attribution characteristics continuously, as well as to transmit new information and research conclusions rapidly around the world. Additionally, in their deliberations, the Board considered the Investment Advisers' trading capabilities and resources which are an integral part of the investment management process.
Shareholder and Administrative Services. The Board considered the nature, extent, quality, and cost of advisory, administrative, and shareholder services to be performed by the Investment Advisers and their affiliates under the Advisory Contracts and under separate agreements covering transfer agency, pricing and bookkeeping, and securities lending services for the fund. The Board also considered the nature and extent of the investment adviser's supervision of third party service providers, principally custodians and subcustodians.
The Board noted that the growth of fund assets over time across the complex allows Fidelity to reinvest in the development of services designed to enhance the value or convenience of the Fidelity funds as investment vehicles. These services include 24-hour access to account information and market information through telephone representatives and over the Internet, investor education materials and asset allocation tools, and the expanded availability of Fidelity Investor Centers, with 35 new branches opening since 2010.
Annual Report
Investment Performance. The fund is a new fund and therefore had no historical performance for the Board to review at the time it approved the fund's Advisory Contracts. The Board considered the Investment Advisers' strength in fundamental, research-driven global and equity income securities selection, which the Board is familiar with through its supervision of other Fidelity funds that invest in such securities.
Based on its review, the Board concluded that the nature, extent, and quality of services to be provided to the fund under the Advisory Contracts should benefit the fund's shareholders.
Competitiveness of Management Fee and Total Expense Ratio. The Board considered the fund's proposed management fee and the projected total expense ratio of the fund in reviewing the Advisory Contracts. The Board noted that the fund's proposed management fee rate is lower than the median fee rate of funds with similar Lipper investment objective categories and comparable management fee characteristics.
The Board also noted that FMR had contractually agreed to reimburse the fund to the extent that total operating expenses (excluding interest, taxes, securities lending costs, brokerage commissions, extraordinary expenses, and acquired fund fees and expenses, if any), as a percentage of its average net assets exceed a certain limit.
Based on its review, the Board concluded that the fund's management fee and projected total expense ratio were reasonable in light of the services that the fund and its shareholders will receive and the other factors considered.
Costs of the Services and Profitability. The fund is a new fund and therefore no revenue, cost, or profitability data was available for the Board to review in respect of the fund at the time it approved the Advisory Contracts. In connection with its future renewal of the fund's Advisory Contracts, the Board will consider the revenues earned and the expenses incurred by Fidelity in conducting the business of developing, marketing, distributing, managing, administering and servicing the fund and its shareholders.
Economies of Scale. The Board will consider economies of scale when there is operating experience to permit assessment thereof. It noted that, notwithstanding the entrepreneurial risk associated with a new fund, the management fee was at a level normally associated, by comparison with competitors, with very high fund net assets, and Fidelity asserted to the Board that the level of the fee anticipated economies of scale at lower asset levels even before, if ever, economies of scale are achieved. The Board also noted that the fund and its shareholders would have access to the very considerable number and variety of services available through Fidelity and its affiliates.
Based on its evaluation of all of the conclusions noted above, and after considering all factors it believed relevant, the Board ultimately concluded that the advisory fee structures are fair and reasonable, and that the fund's Advisory Contracts should be approved.
Annual Report
Investment Adviser
Fidelity Management & Research Company
Boston, MA
Investment Sub-Advisers
FMR Co., Inc.
Fidelity Management & Research
(U.K.) Inc.
Fidelity Management & Research
(Japan) Inc.
Fidelity Management & Research
(Hong Kong) Limited
FIL Investment Advisors (FIA)
FIL Investment Advisors (UK) Limited
(FIA(UK))
FIL Investments (Japan) Limited (FIJ)
General Distributor
Fidelity Distributors Corporation
Smithfield, RI
Transfer and Service Agents
Fidelity Investments Institutional
Operations Company, Inc.
Boston, MA
Fidelity Service Company, Inc.
Boston, MA
Custodian
Citibank, N.A.
New York, NY
The Fidelity Telephone Connection
Mutual Fund 24-Hour Service
Exchanges/Redemptions
and Account Assistance 1-800-544-6666
Product Information 1-800-544-6666
Retirement Accounts 1-800-544-4774
(8 a.m. - 9 p.m.)
TDD Service 1-800-544-0118
for the deaf and hearing impaired
(9 a.m. - 9 p.m. Eastern time)
Fidelity Automated Service
Telephone (FAST®) (automated graphic)
1-800-544-5555
(automated graphic)
Automated line for quickest service
(Fidelity Investment logo)(registered trademark)
Corporate Headquarters
82 Devonshire St., Boston, MA 02109
www.fidelity.com
GED-UANN-1212
1.938161.100
Item 2. Code of Ethics
As of the end of the period, October 31, 2012, Fidelity Investment Trust (the trust) has adopted a code of ethics, as defined in Item 2 of Form N-CSR, that applies to its President and Treasurer and its Chief Financial Officer. A copy of the code of ethics is filed as an exhibit to this Form N-CSR.
Item 3. Audit Committee Financial Expert
The Board of Trustees of the trust has determined that Joseph Mauriello is an audit committee financial expert, as defined in Item 3 of Form N-CSR. Mr. Mauriello is independent for purposes of Item 3 of Form N-CSR.
Item 4. Principal Accountant Fees and Services
Fees and Services
The following table presents fees billed by Deloitte & Touche LLP, the member firms of Deloitte Touche Tohmatsu, and their respective affiliates (collectively, "Deloitte Entities") in each of the last two fiscal years for services rendered to Fidelity Diversified International Fund, Fidelity Emerging Europe, Middle East, Africa (EMEA) Fund, Fidelity Global Equity Income Fund, Fidelity International Capital Appreciation Fund, Fidelity International Small Cap Fund, Fidelity International Small Cap Opportunities Fund, Fidelity International Value Fund, Fidelity Series Emerging Markets Fund, Fidelity Series International Small Cap Fund, Fidelity Series International Value Fund, Fidelity Total International Equity Fund, and Fidelity Worldwide Fund (the "Funds"):
Services Billed by Deloitte Entities
October 31, 2012 FeesA, B
| Audit Fees | Audit-Related Fees | Tax Fees | All Other Fees |
Fidelity Diversified International Fund | $94,000 | $- | $6,800 | $3,600 |
Fidelity Emerging Europe, Middle East, Africa (EMEA) Fund | $50,000 | $- | $5,900 | $400 |
Fidelity Global Equity Income Fund | $34,000 | $- | $5,700 | $200 |
Fidelity International Capital Appreciation Fund | $49,000 | $- | $6,800 | $400 |
Fidelity International Small Cap Fund | $119,000 | $- | $6,800 | $500 |
Fidelity International Small Cap Opportunities Fund | $49,000 | $- | $5,700 | $400 |
Fidelity International Value Fund | $47,000 | $- | $5,700 | $400 |
Fidelity Series Emerging Markets Fund | $39,000 | $- | $6,800 | $1,000 |
Fidelity Series International Small Cap Fund | $43,000 | $- | $5,700 | $600 |
Fidelity Series International Value Fund | $43,000 | $- | $5,700 | $1,400 |
Fidelity Total International Equity Fund | $59,000 | $- | $6,600 | $400 |
Fidelity Worldwide Fund | $50,000 | $- | $5,700 | $500 |
October 31, 2011 FeesA, B
| Audit Fees | Audit-Related Fees | Tax Fees | All Other Fees |
Fidelity Diversified International Fund | $90,000 | $- | $6,800 | $3,100 |
Fidelity Emerging Europe, Middle East, Africa (EMEA) Fund | $50,000 | $- | $5,900 | $300 |
Fidelity Global Equity Income Fund | $- | $- | $- | $- |
Fidelity International Capital Appreciation Fund | $49,000 | $- | $6,800 | $300 |
Fidelity International Small Cap Fund | $120,000 | $- | $6,800 | $300 |
Fidelity International Small Cap Opportunities Fund | $49,000 | $- | $5,700 | $300 |
Fidelity International Value Fund | $47,000 | $- | $5,700 | $300 |
Fidelity Series Emerging Markets Fund | $39,000 | $- | $6,800 | $600 |
Fidelity Series International Small Cap Fund | $43,000 | $- | $5,700 | $400 |
Fidelity Series International Value Fund | $43,000 | $- | $5,700 | $800 |
Fidelity Total International Equity Fund | $59,000 | $- | $6,600 | $300 |
Fidelity Worldwide Fund | $50,000 | $- | $5,700 | $400 |
A Amounts may reflect rounding.
B Fidelity Global Equity Income Fund commenced operations on May 2, 2012.
The following table presents fees billed by PricewaterhouseCoopers LLP ("PwC") in each of the last two fiscal years for services rendered to Fidelity Emerging Markets Discovery Fund, Fidelity Global Commodity Stock Fund, Fidelity International Discovery Fund, Fidelity International Growth Fund, Fidelity Overseas Fund, Fidelity Series International Growth Fund, and Fidelity Total Emerging Markets Fund (the "Funds"):
Services Billed by PwC
October 31, 2012 FeesA,B
| Audit Fees | Audit-Related Fees | Tax Fees | All Other Fees |
Fidelity Emerging Markets Discovery Fund | $40,000 | $- | $5,100 | $1,400 |
Fidelity Global Commodity Stock Fund | $41,000 | $- | $2,900 | $1,800 |
Fidelity International Discovery Fund | $78,000 | $- | $9,600 | $4,900 |
Fidelity International Growth Fund | $54,000 | $- | $5,100 | $1,600 |
Fidelity Overseas Fund | $65,000 | $- | $11,400 | $2,400 |
Fidelity Series International Growth Fund | $54,000 | $- | $5,100 | $4,900 |
Fidelity Total Emerging Markets Fund | $46,000 | $- | $4,300 | $1,400 |
October 31, 2011 FeesA,B
| Audit Fees | Audit-Related Fees | Tax Fees | All Other Fees |
Fidelity Emerging Markets Discovery Fund | $- | $- | $- | $- |
Fidelity Global Commodity Stock Fund | $41,000 | $- | $2,700 | $2,000 |
Fidelity International Discovery Fund | $80,000 | $- | $11,500 | $6,300 |
Fidelity International Growth Fund | $54,000 | $- | $5,100 | $1,700 |
Fidelity Overseas Fund | $68,000 | $- | $18,800 | $4,100 |
Fidelity Series International Growth Fund | $46,000 | $- | $5,100 | $4,300 |
Fidelity Total Emerging Markets Fund | $- | $- | $- | $- |
A Amounts may reflect rounding.
B Fidelity Emerging Markets Discovery Fund and Fidelity Total Emerging Markets Fund commenced operations on November 1, 2011.
The following table presents fees billed by PwC and Deloitte Entities that were required to be approved by the Audit Committee for services that relate directly to the operations and financial reporting of the Funds and that are rendered on behalf of Fidelity Management & Research Company ("FMR") and entities controlling, controlled by, or under common control with FMR (not including any sub-adviser whose role is primarily portfolio management and is subcontracted with or overseen by another investment adviser) that provide ongoing services to the Funds ("Fund Service Providers"):
Services Billed by Deloitte Entities
| October 31, 2012A, B | October 31, 2011A, B |
Audit-Related Fees | $720,000 | $440,000 |
Tax Fees | $- | $- |
All Other Fees | $1,305,000 | $430,000 |
A Amounts may reflect rounding.
B May include amounts billed prior to the Fidelity Global Equity Income Fund's commencement of operations.
Services Billed by PwC
| October 31, 2012A, B | October 31, 2011A, B |
Audit-Related Fees | $3,640,000 | $3,835,000 |
Tax Fees | $- | $- |
All Other Fees | $- | $- |
A Amounts may reflect rounding.
B May include amounts billed prior to the Fidelity Emerging Markets Discovery Fund's and Fidelity Total Emerging Markets Fund's commencement of operations.
"Audit-Related Fees" represent fees billed for assurance and related services that are reasonably related to the performance of the fund audit or the review of the fund's financial statements and that are not reported under Audit Fees.
"Tax Fees" represent fees billed for tax compliance, tax advice or tax planning that relate directly to the operations and financial reporting of the fund.
"All Other Fees" represent fees billed for services provided to the fund or Fund Service Provider, a significant portion of which are assurance related, that relate directly to the operations and financial reporting of the fund, excluding those services that are reported under Audit Fees, Audit-Related Fees or Tax Fees.
Assurance services must be performed by an independent public accountant.
* * *
The aggregate non-audit fees billed by PwC and Deloitte Entities for services rendered to the Funds, FMR (not including any sub-adviser whose role is primarily portfolio management and is subcontracted with or overseen by another investment adviser), and any Fund Service Provider for each of the last two fiscal years of the Funds are as follows:
Billed By | October 31, 2012 A,B,C | October 31, 2011 A,B,C |
PwC | $4,230,000 | $5,895,000 |
Deloitte Entities | $2,150,000 | $1,035,000 |
A Amounts may reflect rounding.
B May include amounts billed prior to the Fidelity Global Equity Income Fund's commencement of operations.
C May include amounts billed prior to the Fidelity Emerging Markets Discovery Fund's and Fidelity Total Emerging Markets Fund's commencement of operations.
The trust's Audit Committee has considered non-audit services that were not pre-approved that were provided by PwC and Deloitte Entities to Fund Service Providers to be compatible with maintaining the independence of PwC and Deloitte Entities in their audits of the Funds, taking into account representations from PwC and Deloitte Entities, in accordance with Public Company Accounting Oversight Board rules, regarding their independence from the Funds and their related entities and FMR's review of the appropriateness and permissibility under applicable law of such non-audit services prior to their provision to the Fund Service Providers.
Audit Committee Pre-Approval Policies and Procedures
The trust's Audit Committee must pre-approve all audit and non-audit services provided by a fund's independent registered public accounting firm relating to the operations or financial reporting of the fund. Prior to the commencement of any audit or non-audit services to a fund, the Audit Committee reviews the services to determine whether they are appropriate and permissible under applicable law.
The Audit Committee has adopted policies and procedures to, among other purposes, provide a framework for the Committee's consideration of non-audit services by the audit firms that audit the Fidelity funds. The policies and procedures require that any non-audit service provided by a fund audit firm to a Fidelity fund and any non-audit service provided by a fund auditor to a Fund Service Provider that relates directly to the operations and financial reporting of a Fidelity fund ("Covered Service") are subject to approval by the Audit Committee before such service is provided.
All Covered Services must be approved in advance of provision of the service either: (i) by formal resolution of the Audit Committee, or (ii) by oral or written approval of the service by the Chair of the Audit Committee (or if the Chair is unavailable, such other member of the Audit Committee as may be designated by the Chair to act in the Chair's absence). The approval contemplated by (ii) above is permitted where the Treasurer determines that action on such an engagement is necessary before the next meeting of the Audit Committee.
Non-audit services provided by a fund audit firm to a Fund Service Provider that do not relate directly to the operations and financial reporting of a Fidelity fund are reported to the Audit Committee on a periodic basis.
Non-Audit Services Approved Pursuant to Rule 2-01(c)(7)(i)(C) and (ii) of Regulation S-X ("De Minimis Exception")
There were no non-audit services approved or required to be approved by the Audit Committee pursuant to the De Minimis Exception during the Funds' last two fiscal years relating to services provided to (i) the Funds or (ii) any Fund Service Provider that relate directly to the operations and financial reporting of the Funds.
Item 5. Audit Committee of Listed Registrants
Not applicable.
Item 6. Investments
(a) Not applicable.
(b) Not applicable
Item 7. Disclosure of Proxy Voting Policies and Procedures for Closed-End Management Investment Companies
Not applicable.
Item 8. Portfolio Managers of Closed-End Management Investment Companies
Not applicable.
Item 9. Purchase of Equity Securities by Closed-End Management Investment Company and Affiliated Purchasers
Not applicable.
Item 10. Submission of Matters to a Vote of Security Holders
There were no material changes to the procedures by which shareholders may recommend nominees to the trust's Board of Trustees.
Item 11. Controls and Procedures
(a)(i) The President and Treasurer and the Chief Financial Officer have concluded that the trust's disclosure controls and procedures (as defined in Rule 30a-3(c) under the Investment Company Act) provide reasonable assurances that material information relating to the trust is made known to them by the appropriate persons, based on their evaluation of these controls and procedures as of a date within 90 days of the filing date of this report.
(a)(ii) There was no change in the trust's internal control over financial reporting (as defined in Rule 30a-3(d) under the Investment Company Act) that occurred during the second fiscal quarter of the period covered by this report that has materially affected, or is reasonably likely to materially affect, the trust's internal control over financial reporting.
Item 12. Exhibits
(a) | (1) | Code of Ethics pursuant to Item 2 of Form N-CSR is filed and attached hereto as EX-99.CODE ETH. |
(a) | (2) | Certification pursuant to Rule 30a-2(a) under the Investment Company Act of 1940 (17 CFR 270.30a-2(a)) is filed and attached hereto as Exhibit 99.CERT. |
(a) | (3) | Not applicable. |
(b) | | Certification pursuant to Rule 30a-2(b) under the Investment Company Act of 1940 (17 CFR 270.30a-2(b)) is furnished and attached hereto as Exhibit 99.906CERT. |
SIGNATURES
Pursuant to the requirements of the Securities Exchange Act of 1934 and the Investment Company Act of 1940, the registrant has duly caused this report to be signed on its behalf by the undersigned, thereunto duly authorized.
Fidelity Investment Trust
By: | /s/Kenneth B. Robins |
| Kenneth B. Robins |
| President and Treasurer |
| |
Date: | December 26, 2012 |
Pursuant to the requirements of the Securities Exchange Act of 1934 and the Investment Company Act of 1940, this report has been signed below by the following persons on behalf of the registrant and in the capacities and on the dates indicated.
By: | /s/Kenneth B. Robins |
| Kenneth B. Robins |
| President and Treasurer |
| |
Date: | December 26, 2012 |
By: | /s/Christine Reynolds |
| Christine Reynolds |
| Chief Financial Officer |
| |
Date: | December 26, 2012 |